


Languages
Pages
Legal

HUD PD&R Housing Market Profiles Shreveport-Bossier City, Louisiana
Quick Facts About Shreveport-Bossier City
Current sales market conditions: soft.
Current apartment market conditions: balanced.
Module X Solutions, which specializes in mod-ular building systems, announced a $7.4 million capital investment in the city of Shreveport that will create 357 new direct jobs by the end of 2015.
By Elizabeth Oduor | As of January 1, 2015
OverviewThe Shreveport-Bossier City metropolitan area, in northwest Loui-siana, consists of Bossier, Caddo, DeSoto, and Webster Parishes. The city of Shreveport is the third largest city in Louisiana, the seat of Caddo Parish, and the commercial and cultural center of the Ark-La-Tex Region, where Arkansas, Louisiana, and Texas intersect. The metropolitan area is home to Louisiana State University (LSU) in Shreveport and LSU Health Sciences Center. These two institu-tions combined employ approximately 2,400 full-time employees and have an annual economic impact of $536 million on the local economy (LSU Research Communications).
• From 2006 to 2009, the population of the metropolitan area increased by an estimated 2,950, or 0.8 percent, annually, in-cluding average annual net in-migration of about 2,575 people, primarily people displaced by Hurricane Katrina who moved to the metropolitan area from the New Orleans metropolitan area.
• Population growth moderated during the past 4 years. As of January 1, 2015, the estimated population of the metropolitan area was 403,800, representing an increase of 1,100, or 0.3 percent, annually since April 2010.
• The city of Shreveport, with a population of approximately 200,300, accounted for 50 percent of the population of the metropolitan area as of January 1, 2015.
U.S. Department of Housing and Urban Development | Office of Policy Development and Research
Shreveport-Bossier City, LAHUD PD&R Housing Market Profiles 2
U.S. Department of Housing and Urban Development | Office of Policy Development and Research
As of January 1, 2015
Overall job growth occurred in the Shreveport area despite losses in the wholesale and retail trade, information, and government sectors.
3 Months Ending Year-Over-Year Change
December 2013 (thousands)
December 2014 (thousands)
Absolute(thousands) Percent
Total nonfarm payrolls 172.0 174.2 2.2 1.3Goods-producing sectors 21.6 22.3 0.7 3.2
Mining, logging, and construction 12.9 13.5 0.6 4.7Manufacturing 8.7 8.8 0.1 1.1
Service-providing sectors 150.4 151.9 1.5 1.0Wholesale and retail trade 29.3 29.0 – 0.3 – 1.0Transportation and utilities 6.0 6.0 0.0 0.0Information 2.4 2.2 – 0.2 – 8.3Financial activities 7.1 7.1 0.0 0.0Professional and business services 16.6 17.4 0.8 4.8Education and health services 26.7 27.3 0.6 2.2Leisure and hospitality 23.2 24.0 0.8 3.4Other services 6.0 6.0 0.0 0.0Government 33.0 32.9 – 0.1 – 0.3
(percent) (percent)
Unemployment rate 5.7 6.6
Note: Numbers may not add to totals because of rounding.Source: U.S. Bureau of Labor Statistics
Economic ConditionsDuring the fourth quarter of 2014, economic conditions in the Shreveport-Bossier City metropolitan area improved for the second consecutive quarter, with 4 of the 11 payroll sectors increasing by 600 or more jobs each from the fourth quarter of 2013. By contrast, nonfarm payrolls declined by an average of 2,950 jobs, or 3.4 per-cent, annually from 2011 through 2013 in the metropolitan area. Barksdale Air Force Base (BAFB) serves as the headquarters for the Air Force Global Strike Command, Eighth Air Force, and 307th Bomb Wing. As the largest employer in the metropolitan area, with approximately 5,600 active duty military and 4,700 civilian person-nel, BAFB has an estimated $808 million annual economic impact on the metropolitan area (U.S. Air Force).
During the fourth quarter of 2014—
• Nonfarm payrolls averaged 174,200 jobs, an increase of 2,200 jobs, or 1.3 percent, compared with a decrease of 2,100 jobs, or 1.2 percent, during the 3 months ending December 2013.
• Job growth was strongest in the professional and business services and the leisure and hospitality sectors, which increased by 800 jobs each, or 4.8 and 3.4 percent, to 17,400 and 24,000 jobs, respec-tively, compared with the number of jobs recorded a year earlier.
• The unemployment rate for the metropolitan area averaged 6.6 percent, up from 5.7 percent during the 3 months ending December 2013.
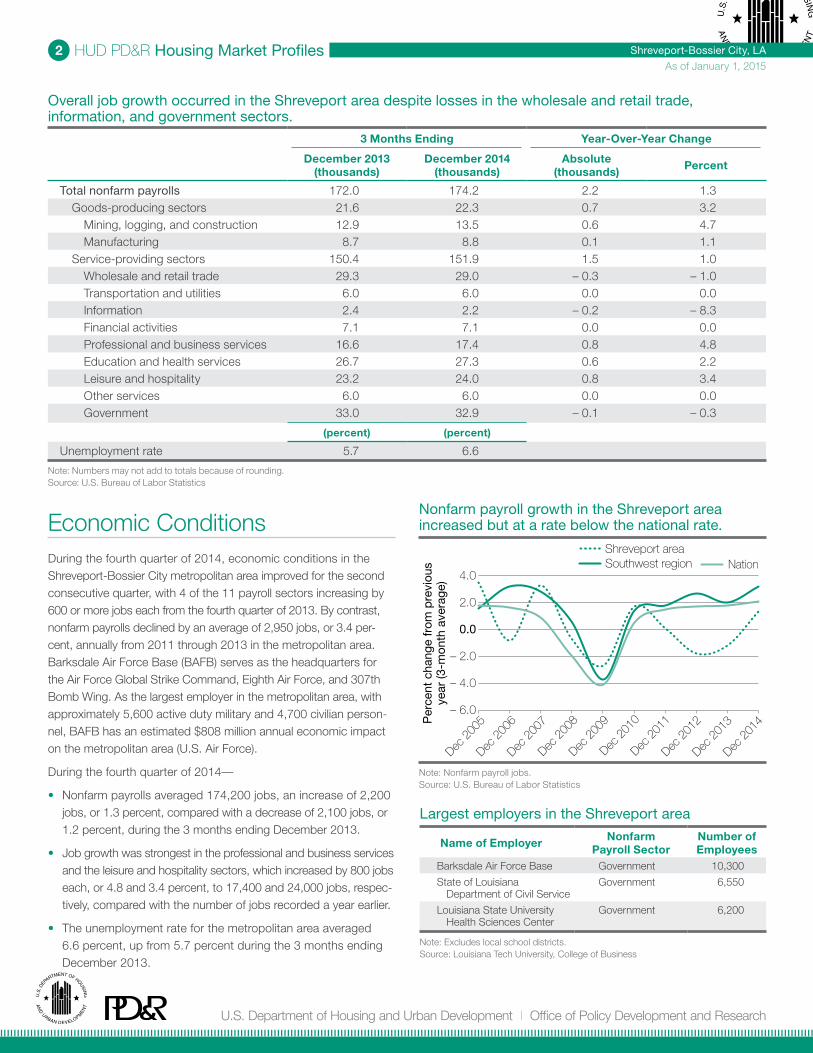
Nonfarm payroll growth in the Shreveport area increased but at a rate below the national rate.
Note: Nonfarm payroll jobs.Source: U.S. Bureau of Labor Statistics
Largest employers in the Shreveport area
Name of Employer Nonfarm Payroll Sector
Number of Employees
Barksdale Air Force Base Government 10,300
State of Louisiana Department of Civil Service
Government 6,550
Louisiana State University Health Sciences Center
Government 6,200
Note: Excludes local school districts. Source: Louisiana Tech University, College of Business
4.0
2.0
0.0
– 2.0
– 4.0
– 6.0
Per
cent
cha
nge
from
pre
viou
sye
ar (3
-mon
th a
vera
ge)
Shreveport areaSouthwest region Nation
Dec 2
005
Dec 2
006
Dec 2
007
Dec 2
008
Dec 2
009
Dec 2
010
Dec 2
011
Dec 2
012
Dec 2
014
Dec 2
013
Shreveport-Bossier City, LAHUD PD&R Housing Market Profiles 3
U.S. Department of Housing and Urban Development | Office of Policy Development and Research
As of January 1, 2015
Sales Market ConditionsThe sales housing market in the Shreveport-Bossier City metropol-itan area is currently soft, with an estimated sales vacancy rate of 1.7 percent, down slightly from 1.8 percent in 2010. During 2014, 5,400 new and existing homes (including single-family homes, townhomes, and condominiums) sold, a decrease of 475 homes, or 8 percent, and the average sales price of new and existing homes increased $5,400, or 3 percent, to $171,100 compared with the corresponding figures a year earlier. By comparison, an average of 12,300 new and existing homes sold annually from 2006 through 2009, when the average sales price was $142,300.
During 2014—
• Existing home sales decreased by 425, or 8 percent, to 5,025 sales, and the average sales price of an existing home was $164,700, an increase of $5,700, or 4 percent, from a year earlier.
• New home sales decreased by 50, or 7 percent, to 380 homes sold compared with the decrease of 85 homes, or 17 percent, recorded during 2013.
• The average sales price for a new home in the metropolitan area was $253,400, a decrease of $1,500, or 1 percent.
• As of December 2014, 6.3 percent of mortgage loans were 90 or more days delinquent, were in foreclosure, or transitioned into real estate owned (REO) status, down from 6.8 percent in 2013 (Black Knight Financial Services, Inc.). By comparison, the rates for Louisiana and the United States in December 2014 were 5.5 and 4.6 percent, respectively.
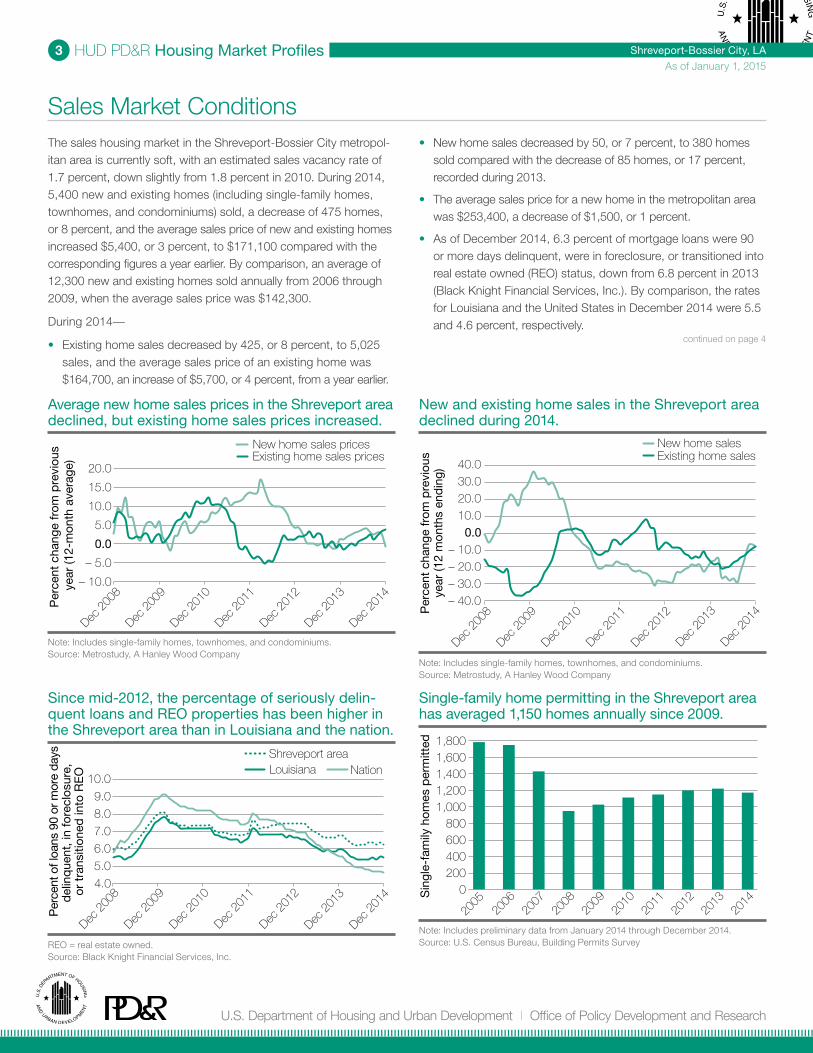
Average new home sales prices in the Shreveport area declined, but existing home sales prices increased.
Note: Includes single-family homes, townhomes, and condominiums.Source: Metrostudy, A Hanley Wood Company
New and existing home sales in the Shreveport area declined during 2014.
Note: Includes single-family homes, townhomes, and condominiums.Source: Metrostudy, A Hanley Wood Company
Since mid-2012, the percentage of seriously delin-quent loans and REO properties has been higher in the Shreveport area than in Louisiana and the nation.
REO = real estate owned.Source: Black Knight Financial Services, Inc.
Single-family home permitting in the Shreveport area has averaged 1,150 homes annually since 2009.
Note: Includes preliminary data from January 2014 through December 2014.Source: U.S. Census Bureau, Building Permits Survey
20.0
10.0
15.0
5.0
0.0
– 10.0
– 5.0
Per
cent
cha
nge
from
pre
viou
s ye
ar (1
2-m
onth
ave
rage
)
New home sales prices
Dec 2
008
Dec 2
009
Dec 2
010
Dec 2
011
Dec 2
012
Dec 2
014
Dec 2
013
Existing home sales prices
– 40.0
0.0
40.0
30.0
20.0
10.0
– 20.0
– 30.0
– 10.0
Per
cent
cha
nge
from
pre
viou
sye
ar (1
2 m
onth
s en
din
g)New home salesExisting home sales
Dec 2
008
Dec 2
010
Dec 2
011
Dec 2
012
Dec 2
014
Dec 2
013
Dec 2
009
continued on page 4
4.0
10.0
8.0
9.0
7.0
5.0
6.0
Per
cent
of l
oans
90
or m
ore
days
del
inq
uent
, in
fore
clos
ure,
or
tra
nsiti
oned
into
RE
O
Shreveport areaLouisiana Nation
Dec 2
008
Dec 2
010
Dec 2
011
Dec 2
012
Dec 2
014
Dec 2
013
Dec 2
009 0
400200
2005
2006
2007
2008
2009
2010
2011
2012
2014
2013
600
Sin
gle-
fam
ily h
omes
per
mitt
ed
1,000
1,400
1,800
800
1,200
1,600
Shreveport-Bossier City, LAHUD PD&R Housing Market Profiles 4
U.S. Department of Housing and Urban Development | Office of Policy Development and Research
As of January 1, 2015
Single-family home construction activity, as measured by the number of single-family homes permitted, was unchanged in the Shreveport-Bossier City metropolitan area from 2013 to 2014 but remained much less than building levels recorded earlier in the decade.
• During 2014, the number of single-family homes permitted was relatively unchanged at 1,150 compared with the number permit-ted during 2013 (preliminary data).
• Single-family homebuilding activity averaged 1,750 homes per-mitted annually during the peak building years of 2005 and 2006 before declining to an average of 1,125 homes permitted annually from 2007 through 2011.
• One large master-planned community currently under construc-tion in the metropolitan area is the 1,100-home Provenance. New homes in this subdivision range in size from 1,500 to 2,500 square feet, and prices range from $250,000 to $320,000. Con-struction is expected to be complete by 2025.
Apartment Market ConditionsApartment market conditions in the Shreveport-Bossier City metropolitan area are currently balanced. The apartment market improved significantly during the past 4 years because of increased demand for rental units and reduced multifamily building activity from 2009 through 2011.
During the fourth quarter of 2014—
• The apartment vacancy rate in the metropolitan area was 5.2 percent, down from 6.4 percent a year earlier (Reis, Inc.). The apartment vacancy rate is currently the lowest it has been since the third quarter of 2012.
• The average effective apartment rent in the metropolitan area was $762, an increase of $20, or 3 percent, from the same period a year earlier.
• The average apartment rents by number of bedrooms were $670, $810, and $1,020 for one-, two-, and three-bedroom apartments, respectively.
Multifamily construction, as measured by the number of multi-family units permitted, increased in the Shreveport-Bossier City metropolitan area during 2014 as builders responded to improv-ing apartment market conditions.
• Approximately 480 multifamily units were permitted during 2014, an increase of 14 percent compared with the 420 units permitted during 2013 (preliminary data).
• Multifamily construction activity peaked in 2005, when 750 units were permitted, before declining to an average of about 80 units a year from 2006 through 2007. Multifamily permitting averaged 290 units a year from 2008 through 2010 before increasing to an average of 360 units a year from 2011 through 2013.
• About 230 units in the metropolitan area are currently in the planning stages and are expected to come on line during the next 3 years (CB Richard Ellis).
• The 222-unit Boulders on Fern apartment complex was recently completed in the city of Shreveport and is currently in lease up. The development consists of one-, two-, and three-bedroom units with rents starting at $920, $980, and $1,720, respectively. Lease up began in April 2014, and the property is currently 90 percent occupied, reflecting an average absorption of roughly 20 units per month.
• The 50-unit Lofts @ 624 apartments, currently under construction in downtown Shreveport, are expected to be complete in June 2015. Rents are expected to start at approximately $730 for studio units, $850 for split lofts, and $900 for penthouse units.
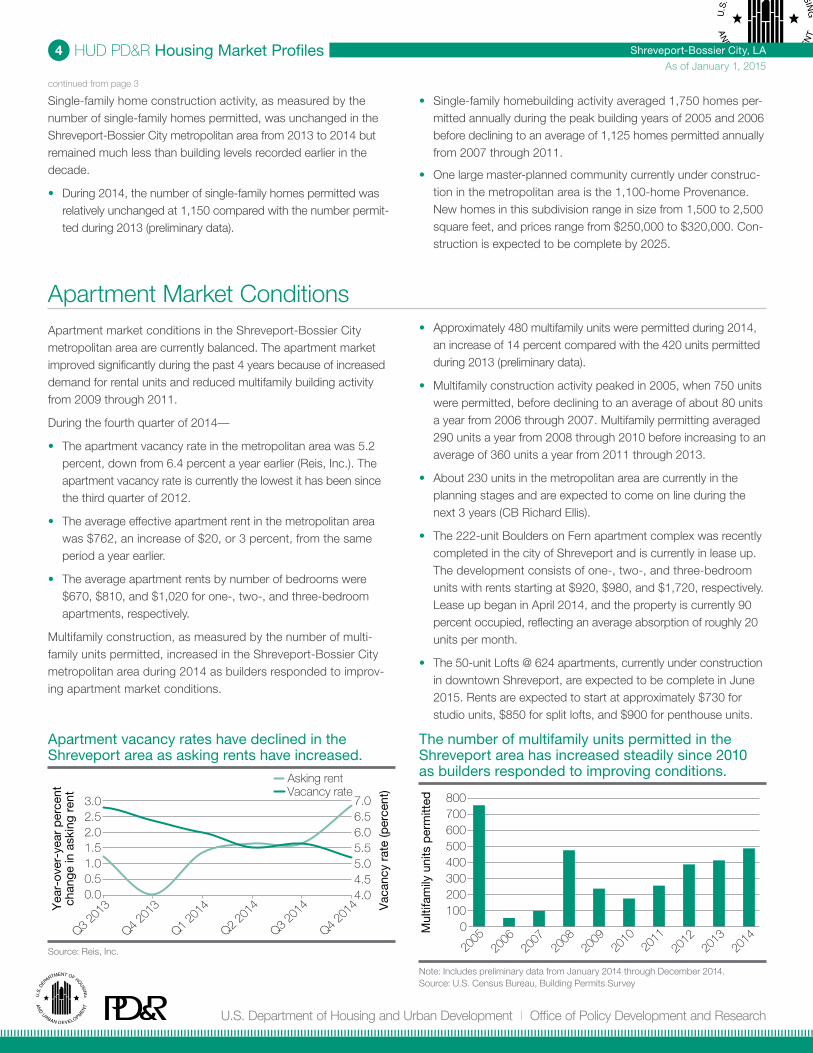
Apartment vacancy rates have declined in the Shreveport area as asking rents have increased.
Source: Reis, Inc.
The number of multifamily units permitted in the Shreveport area has increased steadily since 2010 as builders responded to improving conditions.
Note: Includes preliminary data from January 2014 through December 2014.Source: U.S. Census Bureau, Building Permits Survey
continued from page 3
400
100 200
600
800
300
500
700
0Mul
tifam
ily u
nits
per
mitt
ed
2005
2006
2007
2008
2009
2010
2011
2012
2014
2013
3.0
1.0
0.00.5
2.0
4.0
6.0
7.02.5
1.5 5.5
6.5
4.55.0
Q4 20
13
Q3 20
13
Q1 20
14
Q2 20
14
Q4 20
14 Vac
ancy
rat
e (p
erce
nt)
Yea
r-ov
er-y
ear
per
cent
chan
ge in
ask
ing
rent
Asking rent Vacancy rate
Q3 20
14
Top Related