


Languages
Pages
Legal

Horace Mann Elementary SchoolSchool Accountability Report Card, 2010–2011Glendale Unified School District
An annual report to the
community about teaching,
learning, test results,
resources, and measures of
progress in our school.
»
Published bySCHOOL WISE PRESS

Horace Mann Elementary School School Accountability Report Card, 2010–2011Glendale Unified School District
»Contents
ONLINE USERS: CLICK ON A TITLE TO JUMP TO THAT SECTION
This School Accountability Report Card (SARC) provides information that can be used to evaluate and compare schools. State and federal laws require all schools to publish a SARC each year.
The information in this report represents the 2010–2011 school year, not the current school year. In most cases, this is the most recent data available. We present our school’s results next to those of the average elementary school in the county and state to provide the most meaningful and fair comparisons. To find additional facts about our school online, please use the DataQuest tool offered by the California Department of Education.
Please note that words that appear in a smaller, bold typeface are links in the online version of this report to more information. You can find a list of those linked words and their Web page URLs at:http://www.schoolwisepress.com/sarc/links_2011_en.html
Reports about other schools are available on the California Department of Education Web site. Internet access is available in local libraries.
If you have any questions related to this report, or would like to request a hardcopy version, please contact our school office.
How to Contact Our School501 East Acacia Ave.Glendale, CA 91205Principal: Rosa AlonsoPhone: (818) 246-2421
How to Contact Our District223 North Jackson St.Glendale, CA 91206Phone: (818) 241-3111http://gusd.net/
Published by
SCHOOL WISE PRESS385 Ashton Ave., Ste. 200San Francisco, CA 94112Phone: (415) 337-7971www.schoolwisepress.com
©2011 Publishing 20/20
Principal’s Message
Measures of Progress
Student Achievement
Students
Climate for Learning
Leadership, Teachers, and Staff
Adequacy of Key Resources 2011–2012
Data Almanac

»
Horace Mann Elementary SchoolSchool Accountability Report Card, 2010–2011Glendale Unified School District
Glendale Unified School District
Grade range and calendar
K–5TRADITIONAL
Academic Performance Index
831County Average: 802State Average: 807
Student enrollment
680County Average: 608State Average: 534
Teachers
28Students per teacher
24
Principal�s Message
Horace Mann Elementary is committed to providing all students with a high quality instructional program. We are all working on improving our students’ reading comprehension and we are doing this through our emphasis on standards-based instruction, engaging all of our students throughout the instruction and our implementation of research-based strategies. Our teachers meet twice a month to work in grade levels teams to collaborate on their best practices, plan lessons that focus on the standards and analyze student assessment results to make sure each student’s needs are addressed. They not only discuss how to teach the standards, but also determine how students will demonstrate proficiency in those standards.
Every student at Horace Mann makes a daily pledge every morning to listen attentively, follow directions, be respectful, be responsible, act safely and do their best. These expectations are our school wide rules and they are reminded of them throughout the day. All students also are encouraged to wear their school uniform and be part of our winning team!
We are very proud of our students and our parents as well as the commitment of our staff to help our students reach academic excellence.
Rosa Alonso, PRINCIPAL

Horace Mann Elementary School School Accountability Report Card for 2010–2011 Page 2
School ExpendituresA combination of state and federal funding is used to cover all aspects of our instructional program. We have various reading and math interventions for our at-risk students. These programs are used to target specific student needs in these areas. We also are committed to lowering the students to teacher ratio during our Language Arts block. We use a large percentage of our funds to pay for an instructional assistant for every classroom during this protected Language Arts time. We just recently purchased new Apple computers for our primary computer lab. Students visit the computer lab weekly and work on developing computer literacy as well as taking Accelerated Reader quizzes.
SafetyAt Horace Mann Elementary, we follow a safety plan that is reviewed and revised yearly. We have a closed campus and all visitors are required to check in through the office and is required to wear a visitor’s badge.
We have added surveillance cameras throughout the school. The campus is closely monitored during and after school hours.
We have an emergency plan in place and have monthly emergency drills. Our entire staff participates in the emergency drills and we evaluate our plan after we practice. This plan includes command posts for all teachers and staff in the event of an emergency All staff members are trained in the specific area they are assigned to during an emergency and mock drills are done once a year.
BuildingsWe have finished modernization plan. The plan calls for making improvements to most of our buildings, and updating our library. Our restrooms and classrooms were modernized, and a new administration building was built. During the summer, new air conditioning units were added to our second story building.
Our custodian closely monitors our maintenance through weekly inspections. Any problems are addressed quickly by our facilities and support operation.
Parent InvolvementThere are various opportunities for parents to get involved at Horace Mann Elementary. We have monthly Coffee with the Principal meetings where all parents are invited. There is usually a specific topic to discuss based on parent request or needs observed by staff and time is given for questions and comments.
We use an automated phone system to alert parents of events at our school. This system is also utilized during the summer months to remind the students of activities they can participate in such as taking the time to read.
Parents are encouraged to volunteer in classrooms, special events and on field trips. A monthly newsletter is sent to communicate special events for the specific month and a parent calendar is given to every family with policies and expectations.
We invite parents to join the School Site Council (SSC), which is an important component for parent involvement. Here, parents are involved in policy making, and help decide how to spend school categorical money.
Kindergarten teachers have monthly Tea with the Teachers and other grade levels also have monthly meetings. Here, parents get together with teachers to learn methods for helping their child at home with homework.
Some teachers also send out weekly newsletters.
Glendale Unified School District
Horace Mann Elementary School School Accountability Report Card for 2010–2011 Page 3
Academic Performance IndexThe Academic Performance Index (API) is California’s way of comparing schools based on student test scores. The index was created in 1999 to help parents and educators recognize schools that show progress and identify schools that need help. It is also used to compare schools in a statewide ranking system. The California Department of Education (CDE) calculates a school’s API using student test results from the California Standards Tests and, for high schools, the California High School Exit Exam (CAHSEE). APIs range from 200 to 1000. The CDE expects all schools to eventually obtain APIs of at least 800. Additional
information on the API can be found on the CDE Web site.
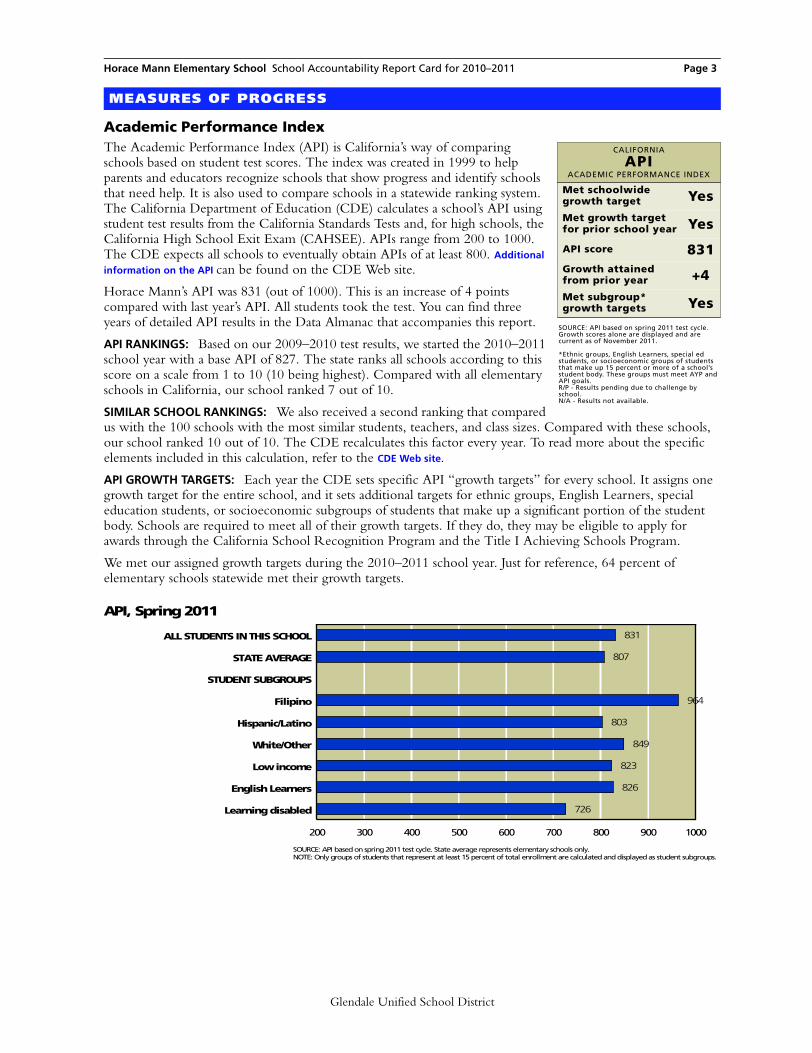
Horace Mann’s API was 831 (out of 1000). This is an increase of 4 points compared with last year’s API. All students took the test. You can find three years of detailed API results in the Data Almanac that accompanies this report.
API RANKINGS: Based on our 2009–2010 test results, we started the 2010–2011 school year with a base API of 827. The state ranks all schools according to this score on a scale from 1 to 10 (10 being highest). Compared with all elementary schools in California, our school ranked 7 out of 10.
SIMILAR SCHOOL RANKINGS: We also received a second ranking that compared us with the 100 schools with the most similar students, teachers, and class sizes. Compared with these schools, our school ranked 10 out of 10. The CDE recalculates this factor every year. To read more about the specific elements included in this calculation, refer to the CDE Web site.
API GROWTH TARGETS: Each year the CDE sets specific API “growth targets” for every school. It assigns one growth target for the entire school, and it sets additional targets for ethnic groups, English Learners, special education students, or socioeconomic subgroups of students that make up a significant portion of the student body. Schools are required to meet all of their growth targets. If they do, they may be eligible to apply for awards through the California School Recognition Program and the Title I Achieving Schools Program.
We met our assigned growth targets during the 2010–2011 school year. Just for reference, 64 percent of elementary schools statewide met their growth targets.
MEASURES OF PROGRESS
CALIFORNIA
APIACADEMIC PERFORMANCE INDEX
Met schoolwide growth target YesMet growth target for prior school year Yes
API score 831Growth attained from prior year +4Met subgroup* growth targets Yes
SOURCE: API based on spring 2011 test cycle. Growth scores alone are displayed and are current as of November 2011.
*Ethnic groups, English Learners, special ed students, or socioeconomic groups of students that make up 15 percent or more of a school’s student body. These groups must meet AYP and API goals. R/P - Results pending due to challenge by school. N/A - Results not available.
200 300 400 500 600 700 800 900 1000
Learning disabled
English Learners
Low income
White/Other
Hispanic/Latino
Filipino
STUDENT SUBGROUPS
STATE AVERAGE
ALL STUDENTS IN THIS SCHOOL
API, Spring 2011
831
807
964
803
849
823
826
726
SOURCE: API based on spring 2011 test cycle. State average represents elementary schools only.NOTE: Only groups of students that represent at least 15 percent of total enrollment are calculated and displayed as student subgroups.
Glendale Unified School District

Horace Mann Elementary School School Accountability Report Card for 2010–2011 Page 4
Adequate Yearly ProgressIn addition to California’s accountability system, which measures student achievement using the API, schools must also meet requirements set by the federal education law known as No Child Left Behind (NCLB). This law requires all schools to meet a different goal: Adequate Yearly Progress (AYP).
We met 17 out of 21 criteria for yearly progress. Because we fell short in four areas, we did not make AYP. Our school is also on the federal watchlist known as Program Improvement (PI). See the next page for background on this matter and an explanation of the consequences.
To meet AYP, elementary schools must meet three criteria. First, a certain percentage of students must score at or above Proficient levels on the California Standards Tests (CST), the California Modified Assessment (CMA), and the California Alternate Performance Assessment (CAPA): 67.6 percent on the English/language arts test and 68.5 percent on the math test. All ethnic, English Learners, special education, and socioeconomic subgroups of students also must meet these goals. Second, the schools must achieve an API of at least 710 or increase the API by one point from the prior year. Third, 95 percent of the student body must take the required standardized tests.
If even one subgroup of students fails to meet just one of the criteria, the school fails to meet AYP. While all schools must report their progress toward meeting AYP, only schools that receive federal funding to help economically disadvantaged students are actually penalized if they fail to meet AYP goals. Schools that do not make AYP for two or more years in a row in the same subject enter Program Improvement (PI). They must offer students transfers to other schools in the district and, in their second year in PI, tutoring services as well.
The table at left shows our success or failure in meeting AYP goals in the 2010–2011 school year. The green dots represent goals we met; red dots indicate goals we missed. Just one red dot means that we failed to meet AYP.
Note: Dashes indicate that too few students were in the category to draw meaningful conclusions. Federal law requires valid test scores from at least 50 students for statistical significance.
FEDERAL
AYPADEQUATE YEARLY PROGRESS
Met AYP NoMet schoolwide participation rate YesMet schoolwide test score goals NoMet subgroup* participation rate YesMet subgroup* test score goals NoMet schoolwide API for AYP YesProgram Improvement school in 2011
Yes
SOURCE: AYP is based on the Accountability Progress Report of November 2011. A school can be in Program Improvement based on students’ test results in the 2010–2011 school year or earlier.
*Ethnic groups, English Learners, special ed students, or socioeconomic groups of students that make up 15 percent or more of a school’s student body. These groups must meet AYP and API goals. R/P - Results pending due to challenge by school. N/A - Results not available.
Adequate Yearly Progress, Detail by Subgroup
● MET GOAL ● DID NOT MEET GOAL � NOT ENOUGH STUDENTS
English/Language Arts Math
DID 95%OF STUDENTS TAKE THE CST,
CMA OR CAPA?
DID 67.6%OF STUDENTS
SCOREPROFICIENT OR ADVANCED ON THE CST, CMA,
& CAPA?
DID 95%OF STUDENTS TAKE THE CST,
CMA OR CAPA?
DID 68.5%OF STUDENTS
SCOREPROFICIENT OR ADVANCED ON THE CST, CMA,
& CAPA?
SCHOOLWIDE RESULTS ● ● ● ●
SUBGROUPS OF STUDENTS
Low income ● ● ● ●
Students learning English ● ● ● ●
STUDENTS BY ETHNICITY
Hispanic/Latino ● ● ● ●
White/Other ● ● ● ●SOURCE: AYP release of November 2011, CDE.
Glendale Unified School District

Horace Mann Elementary School School Accountability Report Card for 2010–2011 Page 5
Program Improvement, a Federal Intervention ProgramA BRIEF HISTORY OF OUR SCHOOL’S PLACEMENT IN PROGRAM IMPROVEMENT: Horace Mann was placed on the list of schools needing improvement (also known as Program Improvement, or PI) for the first time in 2011. In California, 849 elementary schools were in stage 1 of PI as of November 2011.
THE STAGES OF PROGRAM IMPROVEMENT: Program Improvement is a five-stage process for monitoring, improving, and, if necessary, reorganizing any school that receives federal money under the Title I section of No Child Left Behind (NCLB). Schools in PI get extra attention from their district office to help them improve.
When a school misses even one of its goals for Adequate Yearly Progress, it is at risk of entering PI. If a school misses the same AYP goals two years in a row, it enters stage 1 of PI. Each subsequent year that a school misses any of its AYP goals, it goes one stage deeper into the process. Each stage results in increasingly severe consequences. The first stage gives parents the right to choose another school. In the second stage, students have the right to free tutoring in addition to the option to change schools. The last three stages can result in a change of staff and leadership, the conversion of the school to charter status, transferring the school to another district, or even the school’s closure.
CONSEQUENCESPARENTS: Because Horace Mann is in stage (year) 1 of PI, parents of students have just one option. They can enroll their children in different schools in the district. To see the list of these schools, parents can contact either the principal or the district office staff.
SCHOOL: The school’s staff is revising its improvement plan. The staff is also using as much as ten percent of the school’s Title I (federal) funds for coaching teachers.
DISTRICT: The district is establishing a peer review group to evaluate the school’s annual improvement plan.
YEARPI
STAGE SUMMARY OF EVENTS FOR THIS YEARAYP GOALS NOT MET ■
AYP GOALS MET ■
2010 Not in PI
Horace Mann met 19 of the 21 criteria for Adequate Yearly Progress established by the federal law known as No Child Left Behind (NCLB).
■■■■■■■■■■■■■■■■■■■■■
2011 1 We met 17 of the 21 criteria for Adequate Yearly Progress, causing the school to enter the first stage of Program Improvement.
■■■■■■■■■■■■■■■■■■■■■
SOURCE: PI status is based on the Accountability Progress Report of November 2011. A school can be in Program Improvement based on students’ test results in the 2010–2011 school year or earlier. Some schools were in Program Improvement prior to the passage of No Child Left Behind, when the definition of PI was significantly modified.
FEDERAL INTERVENTION PROGRAM
PIPROGRAM IMPROVEMENT
In PI since 2011
Stage of PI 1 of 5
Change in 2011 Entered PI
SOURCE: PI status is based on the Accountability Progress Report of November 2011. A school can be in Program Improvement based on students’ test results in the 2010–2011 school year or earlier.
Glendale Unified School District
Horace Mann Elementary School School Accountability Report Card for 2010–2011 Page 6
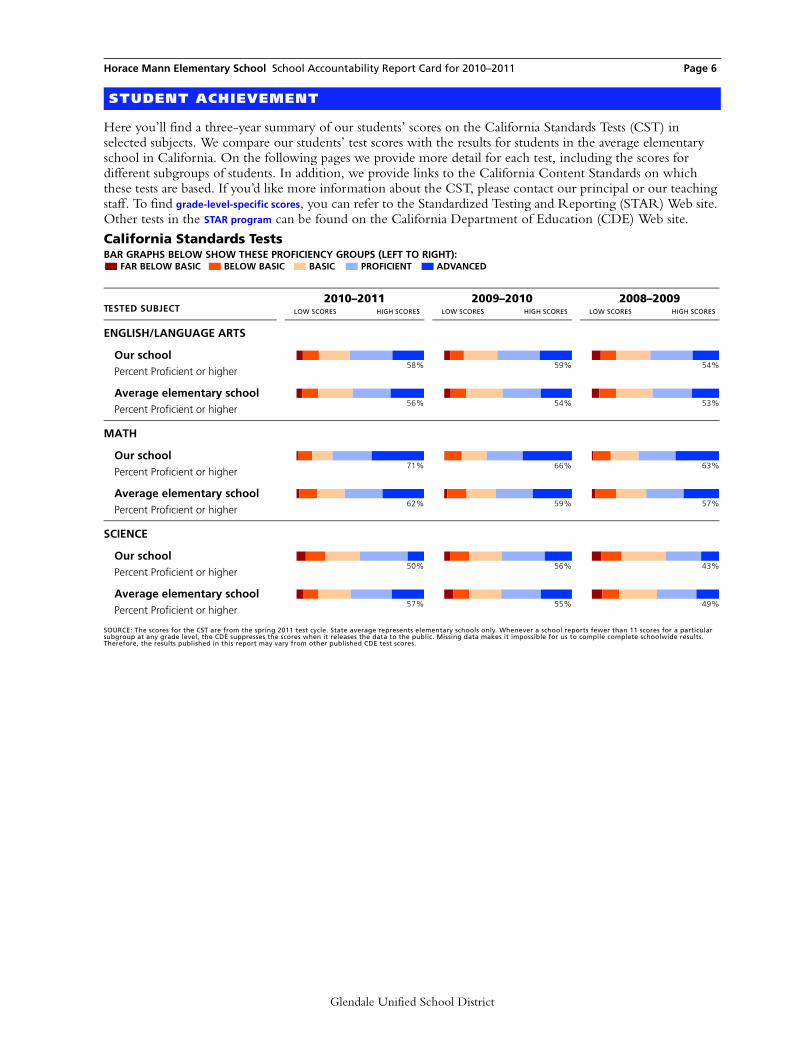
Here you’ll find a three-year summary of our students’ scores on the California Standards Tests (CST) in selected subjects. We compare our students’ test scores with the results for students in the average elementary school in California. On the following pages we provide more detail for each test, including the scores for different subgroups of students. In addition, we provide links to the California Content Standards on which these tests are based. If you’d like more information about the CST, please contact our principal or our teaching staff. To find grade-level-specific scores, you can refer to the Standardized Testing and Reporting (STAR) Web site. Other tests in the STAR program can be found on the California Department of Education (CDE) Web site.
STUDENT ACHIEVEMENT
BAR GRAPHS BELOW SHOW THESE PROFICIENCY GROUPS (LEFT TO RIGHT):FAR BELOW BASIC BELOW BASIC BASIC PROFICIENT ADVANCED
California Standards Tests
TESTED SUBJECT2010–2011
LOW SCORES HIGH SCORES
2009–2010 LOW SCORES HIGH SCORES
2008–2009 LOW SCORES HIGH SCORES
ENGLISH/LANGUAGE ARTS
Our schoolPercent Proficient or higher
58% 59% 54%
Average elementary schoolPercent Proficient or higher
56% 54% 53%
MATH
Our schoolPercent Proficient or higher
71% 66% 63%
Average elementary schoolPercent Proficient or higher
62% 59% 57%
SCIENCE
Our schoolPercent Proficient or higher
50% 56% 43%
Average elementary schoolPercent Proficient or higher
57% 55% 49%
SOURCE: The scores for the CST are from the spring 2011 test cycle. State average represents elementary schools only. Whenever a school reports fewer than 11 scores for a particular subgroup at any grade level, the CDE suppresses the scores when it releases the data to the public. Missing data makes it impossible for us to compile complete schoolwide results. Therefore, the results published in this report may vary from other published CDE test scores.
Glendale Unified School District

Horace Mann Elementary School School Accountability Report Card for 2010–2011 Page 7
Frequently Asked Questions About Standardized TestsWHERE CAN I FIND GRADE-LEVEL REPORTS? Due to space constraints and concern for statistical reliability, we have omitted grade-level detail from these test results. Instead we present results at the schoolwide level. You can view the results of far more students than any one grade level would contain, which also improves their statistical reliability. Grade-level results are online on the STAR Web site. More information about student test scores is available in the Data Almanac that accompanies this report.
WHAT DO THE FIVE PROFICIENCY BANDS MEAN? Test experts assign students to one of these five proficiency levels, based on the number of questions they answer correctly. Our immediate goal is to help students move up one level. Our eventual goal is to enable all students to reach either of the top two bands, Advanced or Proficient. Those who score in the middle band, Basic, have come close to attaining the required knowledge and skills. Those who score in either of the bottom two bands, Below Basic or Far Below Basic, need more help to reach the Proficient level.
HOW HARD ARE THE CALIFORNIA STANDARDS TESTS? Experts consider California’s standards to be among the most clear and rigorous in the country. Just 56 percent of elementary school students scored Proficient or Advanced on the English/language arts test; 62 percent scored Proficient or Advanced in math. You can review the California Content Standards on the CDE Web site.
ARE ALL STUDENTS’ SCORES INCLUDED? No. Only students in grades two through eleven are required to take the CST. When fewer than 11 students in one grade or subgroup take a test, state officials remove their scores from the report. They omit them to protect students’ privacy, as called for by federal law.
CAN I REVIEW SAMPLE TEST QUESTIONS? Sample test questions for the CST are on the CDE’s Web site. These are actual questions used in previous years.
WHERE CAN I FIND ADDITIONAL INFORMATION? The CDE has a wealth of resources on its Web site. The STAR Web site publishes detailed reports for schools and districts, and assistance packets for parents and teachers. This site includes explanations of technical terms, scoring methods, and the subjects covered by the tests for each grade. You’ll also find a guide to navigating the STAR Web site as well as help for understanding how to compare test scores.
Glendale Unified School District
Horace Mann Elementary School School Accountability Report Card for 2010–2011 Page 8
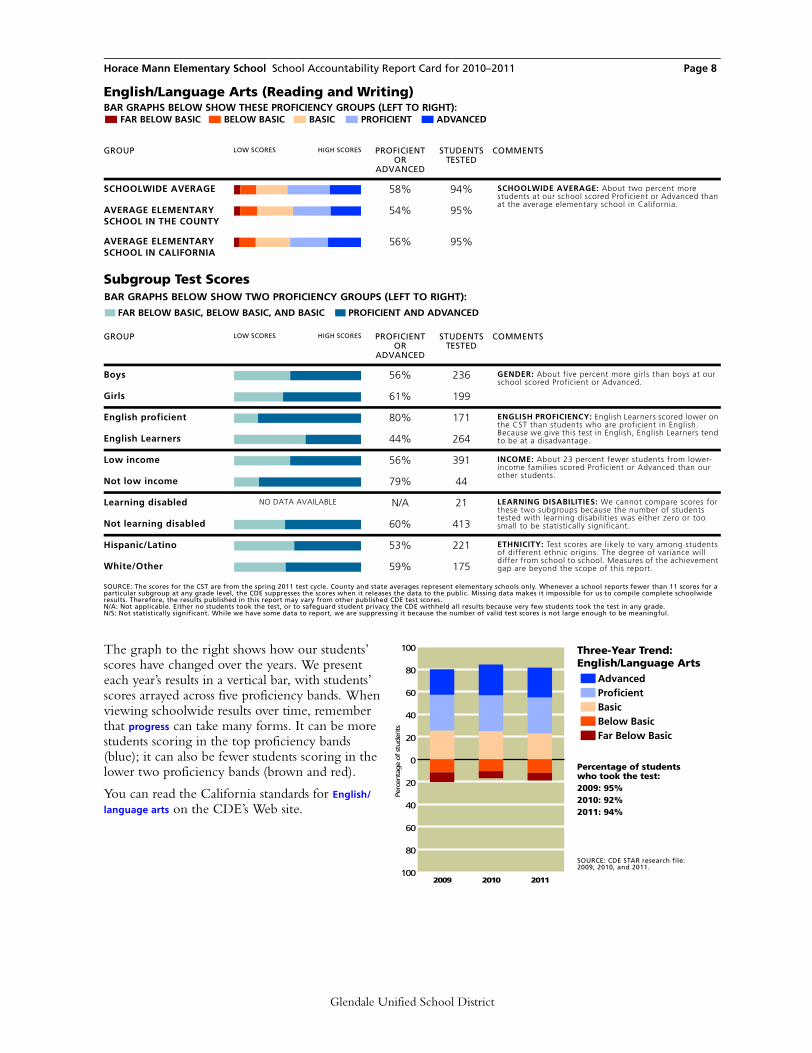
The graph to the right shows how our students’ scores have changed over the years. We present each year’s results in a vertical bar, with students’ scores arrayed across five proficiency bands. When viewing schoolwide results over time, remember that progress can take many forms. It can be more students scoring in the top proficiency bands (blue); it can also be fewer students scoring in the lower two proficiency bands (brown and red).
You can read the California standards for English/
language arts on the CDE’s Web site.
BAR GRAPHS BELOW SHOW THESE PROFICIENCY GROUPS (LEFT TO RIGHT):FAR BELOW BASIC BELOW BASIC BASIC PROFICIENT ADVANCED
English/Language Arts (Reading and Writing)
GROUP LOW SCORES HIGH SCORES PROFICIENT OR
ADVANCED
STUDENTS TESTED
COMMENTS
SCHOOLWIDE AVERAGE 58% 94% SCHOOLWIDE AVERAGE: About two percent more students at our school scored Proficient or Advanced than at the average elementary school in California.
AVERAGE ELEMENTARY SCHOOL IN THE COUNTY
54% 95%
AVERAGE ELEMENTARY SCHOOL IN CALIFORNIA
56% 95%
BAR GRAPHS BELOW SHOW TWO PROFICIENCY GROUPS (LEFT TO RIGHT):
FAR BELOW BASIC, BELOW BASIC, AND BASIC PROFICIENT AND ADVANCED
Subgroup Test Scores
GROUP LOW SCORES HIGH SCORES PROFICIENT OR
ADVANCED
STUDENTS TESTED
COMMENTS
Boys 56% 236 GENDER: About five percent more girls than boys at our school scored Proficient or Advanced.
Girls 61% 199
English proficient 80% 171 ENGLISH PROFICIENCY: English Learners scored lower on the CST than students who are proficient in English. Because we give this test in English, English Learners tend to be at a disadvantage. English Learners 44% 264
Low income 56% 391 INCOME: About 23 percent fewer students from lower-income families scored Proficient or Advanced than our other students.
Not low income 79% 44
Learning disabled NO DATA AVAILABLE N/A 21 LEARNING DISABILITIES: We cannot compare scores for these two subgroups because the number of students tested with learning disabilities was either zero or too small to be statistically significant. Not learning disabled 60% 413
Hispanic/Latino 53% 221 ETHNICITY: Test scores are likely to vary among students of different ethnic origins. The degree of variance will differ from school to school. Measures of the achievement gap are beyond the scope of this report.White/Other 59% 175
SOURCE: The scores for the CST are from the spring 2011 test cycle. County and state averages represent elementary schools only. Whenever a school reports fewer than 11 scores for a particular subgroup at any grade level, the CDE suppresses the scores when it releases the data to the public. Missing data makes it impossible for us to compile complete schoolwide results. Therefore, the results published in this report may vary from other published CDE test scores.N/A: Not applicable. Either no students took the test, or to safeguard student privacy the CDE withheld all results because very few students took the test in any grade.N/S: Not statistically significant. While we have some data to report, we are suppressing it because the number of valid test scores is not large enough to be meaningful.
Three-Year Trend:
AdvancedProficientBasicBelow BasicFar Below Basic
English/Language Arts
Percentage of studentswho took the test:2009: 95%2010: 92%2011: 94%
SOURCE: CDE STAR research file: 2009, 2010, and 2011.
100
80
60
40
20
0
20
40
60
80
100
2009 2010 2011
Perc
enta
ge
of
studen
ts
Glendale Unified School District
Horace Mann Elementary School School Accountability Report Card for 2010–2011 Page 9
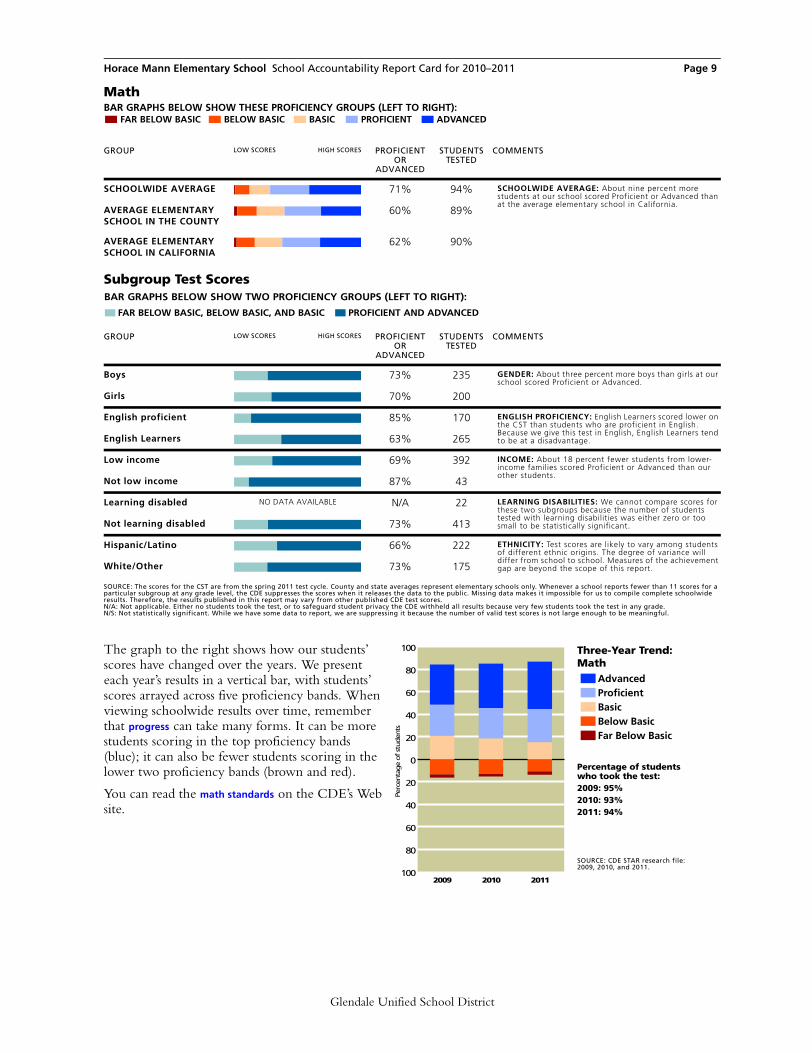
The graph to the right shows how our students’ scores have changed over the years. We present each year’s results in a vertical bar, with students’ scores arrayed across five proficiency bands. When viewing schoolwide results over time, remember that progress can take many forms. It can be more students scoring in the top proficiency bands (blue); it can also be fewer students scoring in the lower two proficiency bands (brown and red).
You can read the math standards on the CDE’s Web site.
BAR GRAPHS BELOW SHOW THESE PROFICIENCY GROUPS (LEFT TO RIGHT):FAR BELOW BASIC BELOW BASIC BASIC PROFICIENT ADVANCED
Math
GROUP LOW SCORES HIGH SCORES PROFICIENT OR
ADVANCED
STUDENTS TESTED
COMMENTS
SCHOOLWIDE AVERAGE 71% 94% SCHOOLWIDE AVERAGE: About nine percent more students at our school scored Proficient or Advanced than at the average elementary school in California.
AVERAGE ELEMENTARY SCHOOL IN THE COUNTY
60% 89%
AVERAGE ELEMENTARY SCHOOL IN CALIFORNIA
62% 90%
BAR GRAPHS BELOW SHOW TWO PROFICIENCY GROUPS (LEFT TO RIGHT):
FAR BELOW BASIC, BELOW BASIC, AND BASIC PROFICIENT AND ADVANCED
Subgroup Test Scores
GROUP LOW SCORES HIGH SCORES PROFICIENT OR
ADVANCED
STUDENTS TESTED
COMMENTS
Boys 73% 235 GENDER: About three percent more boys than girls at our school scored Proficient or Advanced.
Girls 70% 200
English proficient 85% 170 ENGLISH PROFICIENCY: English Learners scored lower on the CST than students who are proficient in English. Because we give this test in English, English Learners tend to be at a disadvantage. English Learners 63% 265
Low income 69% 392 INCOME: About 18 percent fewer students from lower-income families scored Proficient or Advanced than our other students.
Not low income 87% 43
Learning disabled NO DATA AVAILABLE N/A 22 LEARNING DISABILITIES: We cannot compare scores for these two subgroups because the number of students tested with learning disabilities was either zero or too small to be statistically significant. Not learning disabled 73% 413
Hispanic/Latino 66% 222 ETHNICITY: Test scores are likely to vary among students of different ethnic origins. The degree of variance will differ from school to school. Measures of the achievement gap are beyond the scope of this report.White/Other 73% 175
SOURCE: The scores for the CST are from the spring 2011 test cycle. County and state averages represent elementary schools only. Whenever a school reports fewer than 11 scores for a particular subgroup at any grade level, the CDE suppresses the scores when it releases the data to the public. Missing data makes it impossible for us to compile complete schoolwide results. Therefore, the results published in this report may vary from other published CDE test scores.N/A: Not applicable. Either no students took the test, or to safeguard student privacy the CDE withheld all results because very few students took the test in any grade.N/S: Not statistically significant. While we have some data to report, we are suppressing it because the number of valid test scores is not large enough to be meaningful.
Three-Year Trend:
AdvancedProficientBasicBelow BasicFar Below Basic
Math
Percentage of studentswho took the test:2009: 95%2010: 93%2011: 94%
SOURCE: CDE STAR research file: 2009, 2010, and 2011.
100
80
60
40
20
0
20
40
60
80
100
2009 2010 2011
Perc
enta
ge
of
studen
ts
Glendale Unified School District
Horace Mann Elementary School School Accountability Report Card for 2010–2011 Page 10
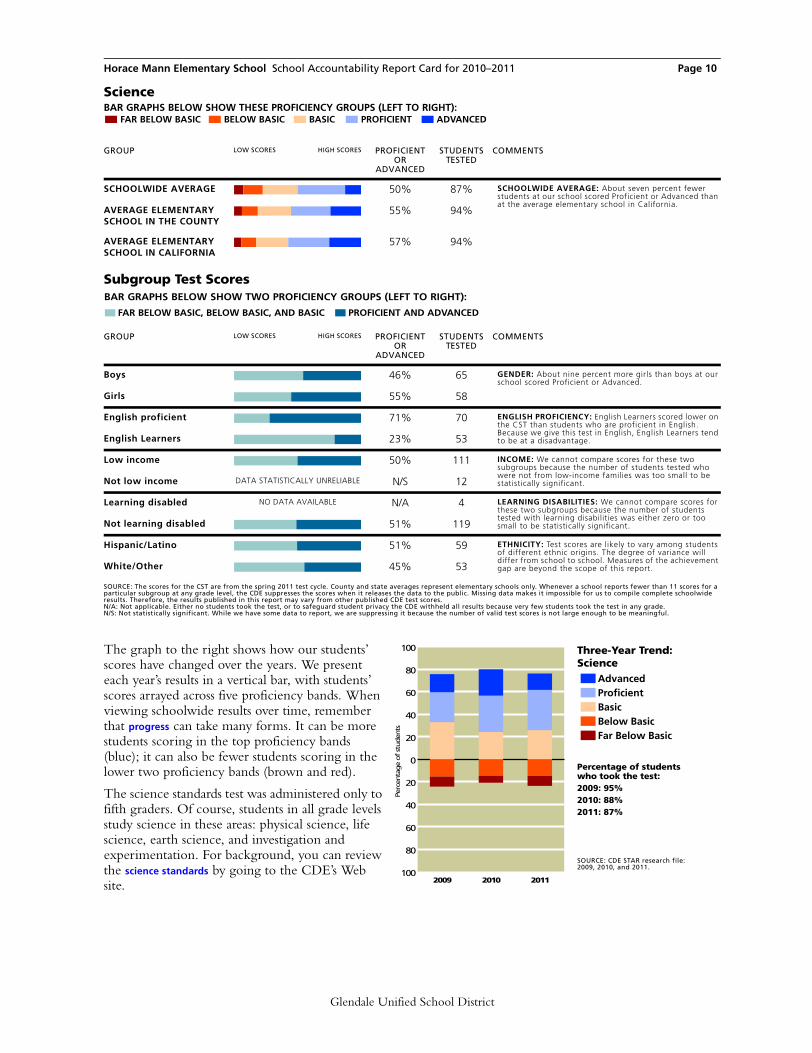
The graph to the right shows how our students’ scores have changed over the years. We present each year’s results in a vertical bar, with students’ scores arrayed across five proficiency bands. When viewing schoolwide results over time, remember that progress can take many forms. It can be more students scoring in the top proficiency bands (blue); it can also be fewer students scoring in the lower two proficiency bands (brown and red).
The science standards test was administered only to fifth graders. Of course, students in all grade levels study science in these areas: physical science, life science, earth science, and investigation and experimentation. For background, you can review the science standards by going to the CDE’s Web site.
BAR GRAPHS BELOW SHOW THESE PROFICIENCY GROUPS (LEFT TO RIGHT):FAR BELOW BASIC BELOW BASIC BASIC PROFICIENT ADVANCED
Science
GROUP LOW SCORES HIGH SCORES PROFICIENT OR
ADVANCED
STUDENTS TESTED
COMMENTS
SCHOOLWIDE AVERAGE 50% 87% SCHOOLWIDE AVERAGE: About seven percent fewer students at our school scored Proficient or Advanced than at the average elementary school in California.
AVERAGE ELEMENTARY SCHOOL IN THE COUNTY
55% 94%
AVERAGE ELEMENTARY SCHOOL IN CALIFORNIA
57% 94%
BAR GRAPHS BELOW SHOW TWO PROFICIENCY GROUPS (LEFT TO RIGHT):
FAR BELOW BASIC, BELOW BASIC, AND BASIC PROFICIENT AND ADVANCED
Subgroup Test Scores
GROUP LOW SCORES HIGH SCORES PROFICIENT OR
ADVANCED
STUDENTS TESTED
COMMENTS
Boys 46% 65 GENDER: About nine percent more girls than boys at our school scored Proficient or Advanced.
Girls 55% 58
English proficient 71% 70 ENGLISH PROFICIENCY: English Learners scored lower on the CST than students who are proficient in English. Because we give this test in English, English Learners tend to be at a disadvantage. English Learners 23% 53
Low income 50% 111 INCOME: We cannot compare scores for these two subgroups because the number of students tested who were not from low-income families was too small to be statistically significant. Not low income DATA STATISTICALLY UNRELIABLE N/S 12
Learning disabled NO DATA AVAILABLE N/A 4 LEARNING DISABILITIES: We cannot compare scores for these two subgroups because the number of students tested with learning disabilities was either zero or too small to be statistically significant. Not learning disabled 51% 119
Hispanic/Latino 51% 59 ETHNICITY: Test scores are likely to vary among students of different ethnic origins. The degree of variance will differ from school to school. Measures of the achievement gap are beyond the scope of this report.White/Other 45% 53
SOURCE: The scores for the CST are from the spring 2011 test cycle. County and state averages represent elementary schools only. Whenever a school reports fewer than 11 scores for a particular subgroup at any grade level, the CDE suppresses the scores when it releases the data to the public. Missing data makes it impossible for us to compile complete schoolwide results. Therefore, the results published in this report may vary from other published CDE test scores.N/A: Not applicable. Either no students took the test, or to safeguard student privacy the CDE withheld all results because very few students took the test in any grade.N/S: Not statistically significant. While we have some data to report, we are suppressing it because the number of valid test scores is not large enough to be meaningful.
Three-Year Trend:
AdvancedProficientBasicBelow BasicFar Below Basic
Science
Percentage of studentswho took the test:2009: 95%2010: 88%2011: 87%
SOURCE: CDE STAR research file: 2009, 2010, and 2011.
100
80
60
40
20
0
20
40
60
80
100
2009 2010 2011
Perc
enta
ge
of
studen
ts
Glendale Unified School District

Horace Mann Elementary School School Accountability Report Card for 2010–2011 Page 11
Students’ English Language SkillsAt Horace Mann, 46 percent of students were considered to be proficient in English, compared with 77 percent of elementary school students in California overall.
Languages Spoken atHome by English Learners, 2010–2011Please note that this table describes the home languages of just the 366 students classified as English Learners. At Horace Mann, the language these students most often speak at home is Spanish. In California it’s common to find English Learners in classes with students who speak English well. When you visit our classrooms, ask our teachers how they work with language differences among their students.
EthnicityMost students at Horace Mann identify themselves as Hispanic/Latino. The state of California allows citizens to choose more than one ethnic identity, or to select “two or more races” or “decline to state.” As a consequence, the sum of all responses rarely equals 100 percent.
Family Income and EducationThe free or reduced-price meal subsidy goes to students whose families earned less than $40,793 a year (based on a family of four) in the 2010-2011 school year. At Horace Mann, 89 percent of the students qualified for this program, compared with 60 percent of students in California.
The parents of 37 percent of the students at Horace Mann have attended college and 25 percent have a college degree. This information can provide some clues to the level of literacy children bring to school. One precaution is that the students themselves provide this data when they take the battery of standardized tests each spring, so it may not be completely accurate. About 60 percent of our students provided this information.
STUDENTS
LANGUAGE SKILLSOUR
SCHOOLCOUNTYAVERAGE
STATEAVERAGE
English-proficient students 46% 87% 77%
English Learners 54% 13% 23%
SOURCE: Language Census for school year 2010–2011. County and state averages represent elementary schools only.
LANGUAGEOUR
SCHOOLCOUNTYAVERAGE
STATEAVERAGE
Spanish 55% 81% 82%
Vietnamese 0% 2% 3%
Cantonese 0% 3% 2%
Hmong 0% 0% 1%
Filipino/Tagalog 3% 1% 2%
Korean 0% 2% 1%
Khmer/Cambodian 0% 1% 0%
All other 42% 10% 9%
SOURCE: Language Census for school year 2010–2011. County and state averages represent elementary schools only.
ETHNICITYOUR
SCHOOLCOUNTYAVERAGE
STATEAVERAGE
African American 1% 9% 6%
Asian American/Pacific Islander
8% 10% 11%
Hispanic/Latino 54% 64% 53%
White 38% 14% 26%
SOURCE: California Longitudinal Pupil Achievement Data System (CALPADS), October 2010. County and state averages represent elementary schools only.
FAMILY FACTORSOUR
SCHOOLCOUNTYAVERAGE
STATEAVERAGE
Low-income indicator 89% 69% 60%
Parents with some college 37% 49% 56%
Parents with college degree 25% 28% 32%
SOURCE: The free and reduced-price lunch information is gathered by most districts in October. This data is from the 2010–2011 school year. Parents’ education level is collected in the spring at the start of testing. Rarely do all students answer these questions.
Glendale Unified School District

Horace Mann Elementary School School Accountability Report Card for 2010–2011 Page 12
Average Class SizesBecause funding for class-size reduction was focused on the early grade levels, our school’s class sizes, like those of most elementary schools, differ across grade levels.
The average class size at Horace Mann varies across grade levels from a low of 21 students to a high of 36. Our average class size schoolwide is 25 students.
CLIMATE FOR LEARNING
AVERAGE CLASS SIZE BY GRADEOUR
SCHOOL
Kindergarten 24
First grade 21
Second grade 23
Third grade 22
Fourth grade 36
Fifth grade 30
SOURCE: California Department of Education, SARC Research File. State and county averages represent elementary schools only.
Glendale Unified School District
Horace Mann Elementary School School Accountability Report Card for 2010–2011 Page 13
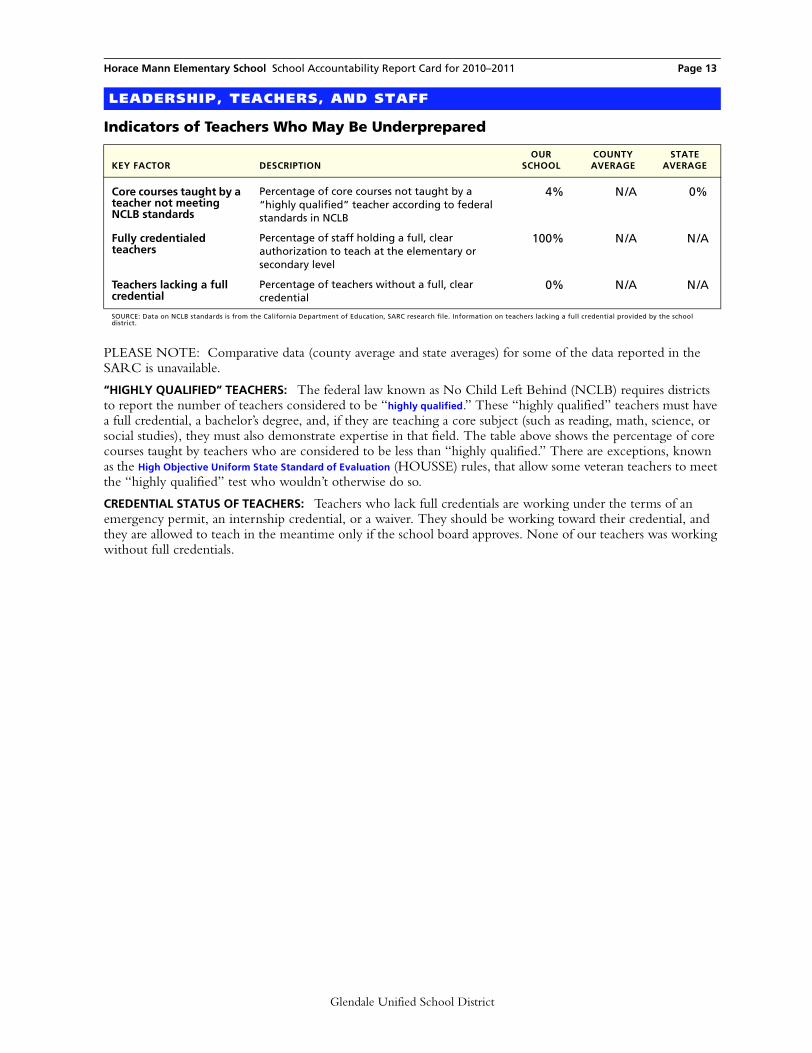
PLEASE NOTE: Comparative data (county average and state averages) for some of the data reported in the SARC is unavailable.
“HIGHLY QUALIFIED” TEACHERS: The federal law known as No Child Left Behind (NCLB) requires districts to report the number of teachers considered to be “highly qualified.” These “highly qualified” teachers must have a full credential, a bachelor’s degree, and, if they are teaching a core subject (such as reading, math, science, or social studies), they must also demonstrate expertise in that field. The table above shows the percentage of core courses taught by teachers who are considered to be less than “highly qualified.” There are exceptions, known as the High Objective Uniform State Standard of Evaluation (HOUSSE) rules, that allow some veteran teachers to meet the “highly qualified” test who wouldn’t otherwise do so.
CREDENTIAL STATUS OF TEACHERS: Teachers who lack full credentials are working under the terms of an emergency permit, an internship credential, or a waiver. They should be working toward their credential, and they are allowed to teach in the meantime only if the school board approves. None of our teachers was working without full credentials.
LEADERSHIP, TEACHERS, AND STAFF
Indicators of Teachers Who May Be Underprepared
KEY FACTOR DESCRIPTIONOUR
SCHOOLCOUNTYAVERAGE
STATEAVERAGE
Core courses taught by a teacher not meeting NCLB standards
Percentage of core courses not taught by a “highly qualified” teacher according to federal standards in NCLB
4% N/A 0%
Fully credentialed teachers
Percentage of staff holding a full, clear authorization to teach at the elementary or secondary level
100% N/A N/A
Teachers lacking a full credential
Percentage of teachers without a full, clear credential
0% N/A N/A
SOURCE: Data on NCLB standards is from the California Department of Education, SARC research file. Information on teachers lacking a full credential provided by the school district.
Glendale Unified School District
Horace Mann Elementary School School Accountability Report Card for 2010–2011 Page 14
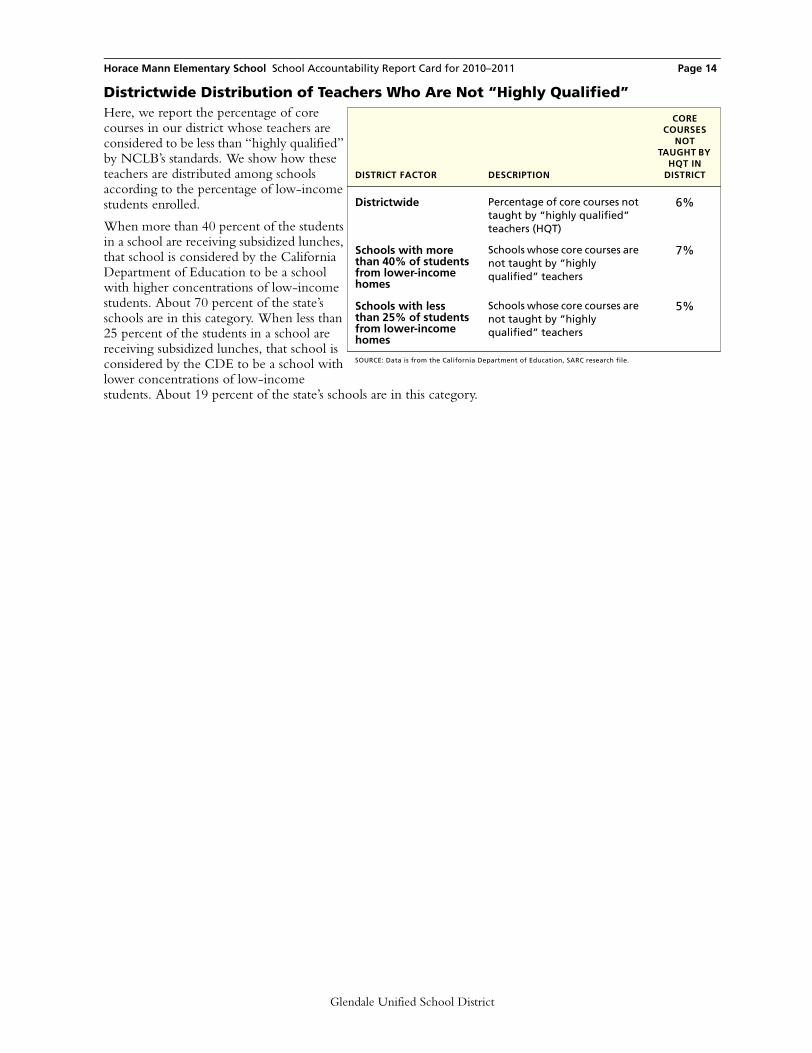
Districtwide Distribution of Teachers Who Are Not “Highly Qualified”Here, we report the percentage of core courses in our district whose teachers are considered to be less than “highly qualified” by NCLB’s standards. We show how these teachers are distributed among schools according to the percentage of low-income students enrolled.
When more than 40 percent of the students in a school are receiving subsidized lunches, that school is considered by the California Department of Education to be a school with higher concentrations of low-income students. About 70 percent of the state’s schools are in this category. When less than 25 percent of the students in a school are receiving subsidized lunches, that school is considered by the CDE to be a school with lower concentrations of low-income students. About 19 percent of the state’s schools are in this category.
DISTRICT FACTOR DESCRIPTION
CORE COURSES
NOT TAUGHT BY
HQT IN DISTRICT
Districtwide Percentage of core courses not taught by “highly qualified” teachers (HQT)
6%
Schools with more than 40% of students from lower-income homes
Schools whose core courses are not taught by “highly qualified” teachers
7%
Schools with less than 25% of students from lower-income homes
Schools whose core courses are not taught by “highly qualified” teachers
5%
SOURCE: Data is from the California Department of Education, SARC research file.
Glendale Unified School District
Horace Mann Elementary School School Accountability Report Card for 2010–2011 Page 15
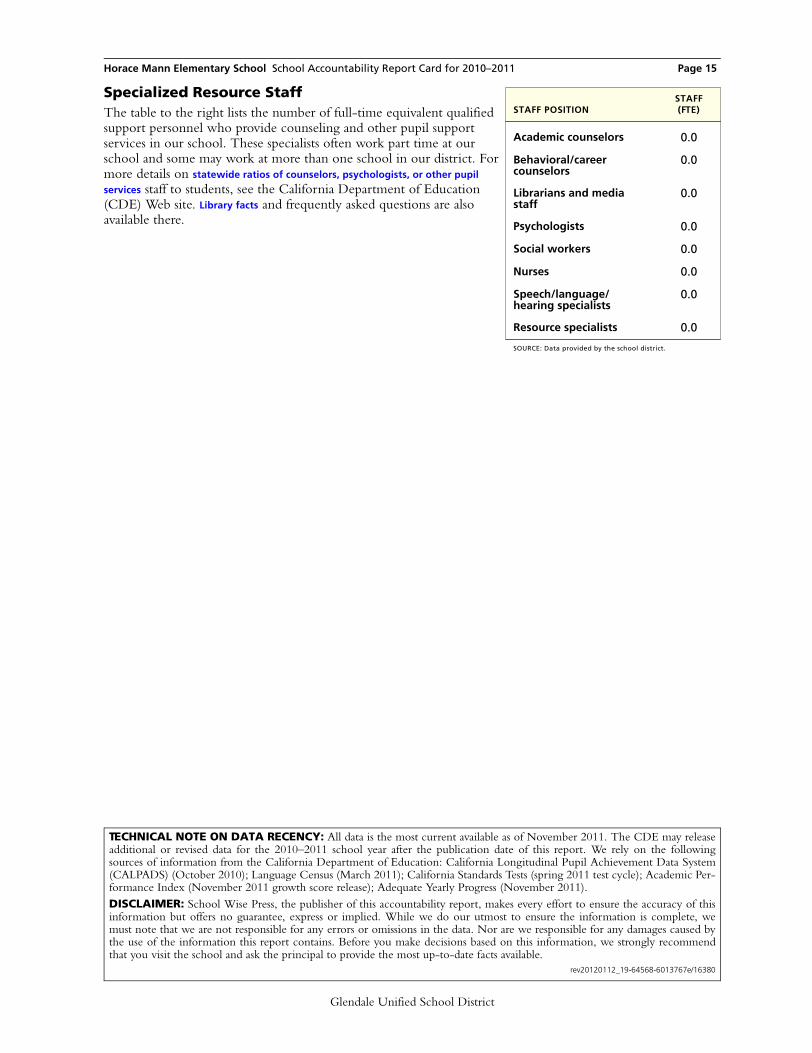
Specialized Resource StaffThe table to the right lists the number of full-time equivalent qualified support personnel who provide counseling and other pupil support services in our school. These specialists often work part time at our school and some may work at more than one school in our district. For more details on statewide ratios of counselors, psychologists, or other pupil
services staff to students, see the California Department of Education (CDE) Web site. Library facts and frequently asked questions are also available there.
STAFF POSITIONSTAFF (FTE)
Academic counselors 0.0
Behavioral/career counselors
0.0
Librarians and media staff
0.0
Psychologists 0.0
Social workers 0.0
Nurses 0.0
Speech/language/hearing specialists
0.0
Resource specialists 0.0
SOURCE: Data provided by the school district.
TECHNICAL NOTE ON DATA RECENCY: All data is the most current available as of November 2011. The CDE may releaseadditional or revised data for the 2010–2011 school year after the publication date of this report. We rely on the followingsources of information from the California Department of Education: California Longitudinal Pupil Achievement Data System(CALPADS) (October 2010); Language Census (March 2011); California Standards Tests (spring 2011 test cycle); Academic Per-formance Index (November 2011 growth score release); Adequate Yearly Progress (November 2011). DISCLAIMER: School Wise Press, the publisher of this accountability report, makes every effort to ensure the accuracy of thisinformation but offers no guarantee, express or implied. While we do our utmost to ensure the information is complete, wemust note that we are not responsible for any errors or omissions in the data. Nor are we responsible for any damages caused bythe use of the information this report contains. Before you make decisions based on this information, we strongly recommendthat you visit the school and ask the principal to provide the most up-to-date facts available.
rev20120112_19-64568-6013767e/16380
Glendale Unified School District


Horace Mann Elementary School School Accountability Report Card for 2010–2011
»
Page 17
Adequacy of Key Resources 2011�2012
Here you’ll find key facts about our teachers, textbooks, and facilities during the school year in progress, 2011–2012. Please note that these facts are based on evaluations our staff conducted in accordance with the Williams legislation.
This section also contains information about 2010–2011 staff development days, and, for high schools, percentages of seniors who met our district’s graduation requirements.
Glendale Unified School District

Horace Mann Elementary School School Accountability Report Card for 2010–2011
TEACHERS
Teacher Vacancies
KEY FACTOR 2009–2010 2010–2011 2011–2012
TEACHER VACANCIES OCCURRING AT THE BEGINNING OF THE SCHOOL YEAR
Total number of classes at the start of the year 31 27 3
Number of classes that lacked a permanently assigned teacher within the first 20 days of school
0 0 0
TEACHER VACANCIES OCCURRING DURING THE SCHOOL YEAR
Number of classes where the permanently assigned teacher left during the year
0 2 0
Number of those classes where you replaced the absent teacher with a single new teacher
0 2 0
NOTES:
There are two general circumstances that can lead to the unfortunate case of a classroom without a full-time, permanently assigned teacher. Within the first 20 days of the start of school, we can be surprised by too many students showing up for school or too few teachers showing up to teach. After school starts, however, teachers can also be surprised by sudden changes: family emergencies, injuries, accidents, etc. When that occurs, it is our school’s and our district’s responsibility to fill that teacher’s vacancy with a qualified, full-time, and permanently assigned replacement. For that reason, we report teacher vacancies in two parts: at the start of school and after the start of school.
Glendale Unified School District
Page 18

Horace Mann Elementary School School Accountability Report Card for 2010–2011
Teacher Misassignments A “misassigned” teacher is one who lacks the appropriate subject-area authorization for a class she is teaching. Under the terms of the Williams settlement, schools must inform the public of the number of their teachers who are misassigned. It is possible for a teacher who lacks the authorization for a subject to get special permission—in the form of an emergency permit, waiver, or internship authorization—from the school board or county office of education to teach the subject anyway. This permission prevents the teacher from being counted as misassigned.
KEY FACTOR DESCRIPTION 2009–2010 2010–2011 2011–2012
Teacher Misassignments
Total number of classes taught by teachers without a legally recognized certificate or credential
0 0 0
Teacher Misassignments in Classes that Include English Learners
Total number of classes that include English Learners and are taught by teachers without CLAD/BCLAD authorization, ELD or SDAIE training, or equivalent authorization from the California Commission on Teacher Credentialing
1 0 1
Other Employee Misassignments
Total number of service area placements of employees without the required credentials
0 0 0
NOTES:.
Staff Development
Teachers take some time each year to improve their teaching skills and to extend their knowledge of the subjects they teach. Here you’ll see the amount of time we set aside for the past three years for their continuing education and professional development.
PROFESSIONAL DEVELOPMENT DAYS YEAR
3.00 2010–2011
Glendale Unified School District
3.00 2009–2010
2008–2009 3.00
Page 19

Horace Mann Elementary School School Accountability Report Card for 2010–2011
Glendale Unified School District
TEXTBOOKS
The main fact about textbooks that the Williams legislation calls for described whether schools have enough books in core classes for all students. The law also asks districts to reveal whether those books are presenting what the California Content Standards call for. All of our textbooks except for those in the following subject areas are the most recently approved by the State Board of Education or our Local Governing Agency: This information was collected on 11/15/2011.
NOTES:
ARE THERE TEXTBOOKS OR INSTRUCTIONAL MATERIALS IN
USE? ARE THERE ENOUGH BOOKS
FOR EACH STUDENT?
TAUGHT AT OUR
SCHOOL? SUBJECT STANDARDS ALIGNED?
OFFICIALLY ADOPTED?
FOR USE IN CLASS?
PERCENTAGE OF STUDENTS
HAVING BOOKS TO TAKE HOME?
English 100%
Math 100%
Science 100%
Social Science 100%
Foreign Languages
Health
Visual/Performing Arts
Page 20
Horace Mann Elementary School School Accountability Report Card for 2010–2011
Glendale Unified School District
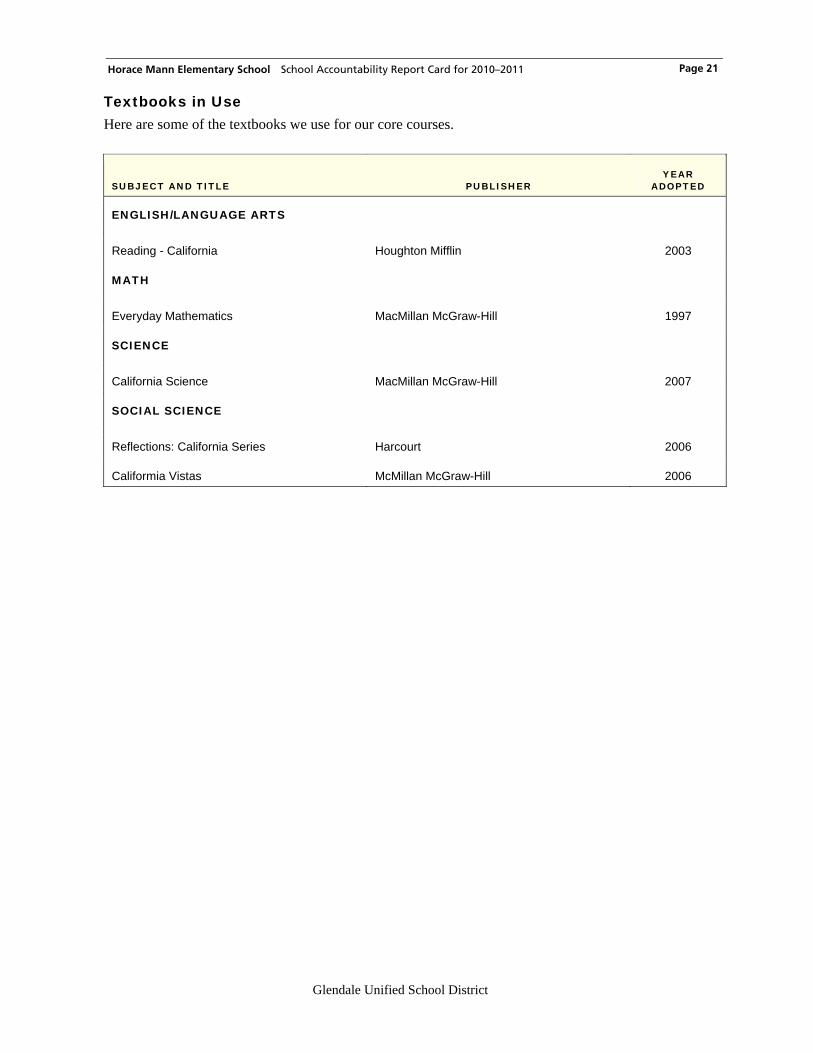
Textbooks in Use Here are some of the textbooks we use for our core courses.
SUBJECT AND TITLE PUBLISHER YEAR
ADOPTED
ENGLISH/LANGUAGE ARTS
Reading - California Houghton Mifflin 2003
MATH
Everyday Mathematics MacMillan McGraw-Hill 1997
SCIENCE
California Science MacMillan McGraw-Hill 2007
SOCIAL SCIENCE
Reflections: California Series Harcourt 2006
Califormia Vistas McMillan McGraw-Hill 2006
Page 21
Horace Mann Elementary School School Accountability Report Card for 2010–2011
Glendale Unified School District
FACILITIES
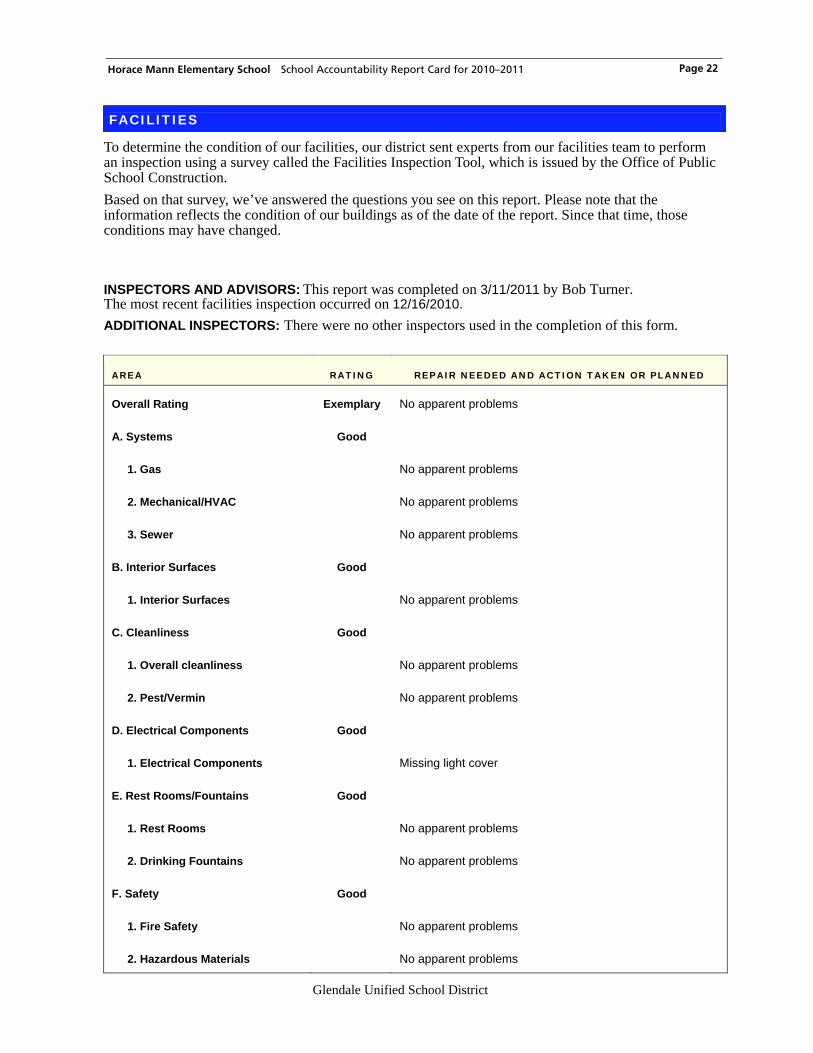
To determine the condition of our facilities, our district sent experts from our facilities team to perform an inspection using a survey called the Facilities Inspection Tool, which is issued by the Office of Public School Construction. Based on that survey, we’ve answered the questions you see on this report. Please note that the information reflects the condition of our buildings as of the date of the report. Since that time, those conditions may have changed. INSPECTORS AND ADVISORS: This report was completed on 3/11/2011 by Bob Turner. The most recent facilities inspection occurred on 12/16/2010. ADDITIONAL INSPECTORS: There were no other inspectors used in the completion of this form.
AREA RATING REPAIR NEEDED AND ACTION TAKEN OR PLANNED
Overall Rating Exemplary No apparent problems
A. Systems Good
1. Gas No apparent problems
2. Mechanical/HVAC No apparent problems
3. Sewer No apparent problems
B. Interior Surfaces Good
1. Interior Surfaces No apparent problems
C. Cleanliness Good
1. Overall cleanliness No apparent problems
2. Pest/Vermin No apparent problems
D. Electrical Components Good
1. Electrical Components Missing light cover
E. Rest Rooms/Fountains Good
1. Rest Rooms No apparent problems
2. Drinking Fountains No apparent problems
F. Safety Good
1. Fire Safety No apparent problems
2. Hazardous Materials No apparent problems
Page 22
Horace Mann Elementary School School Accountability Report Card for 2010–2011
Glendale Unified School District
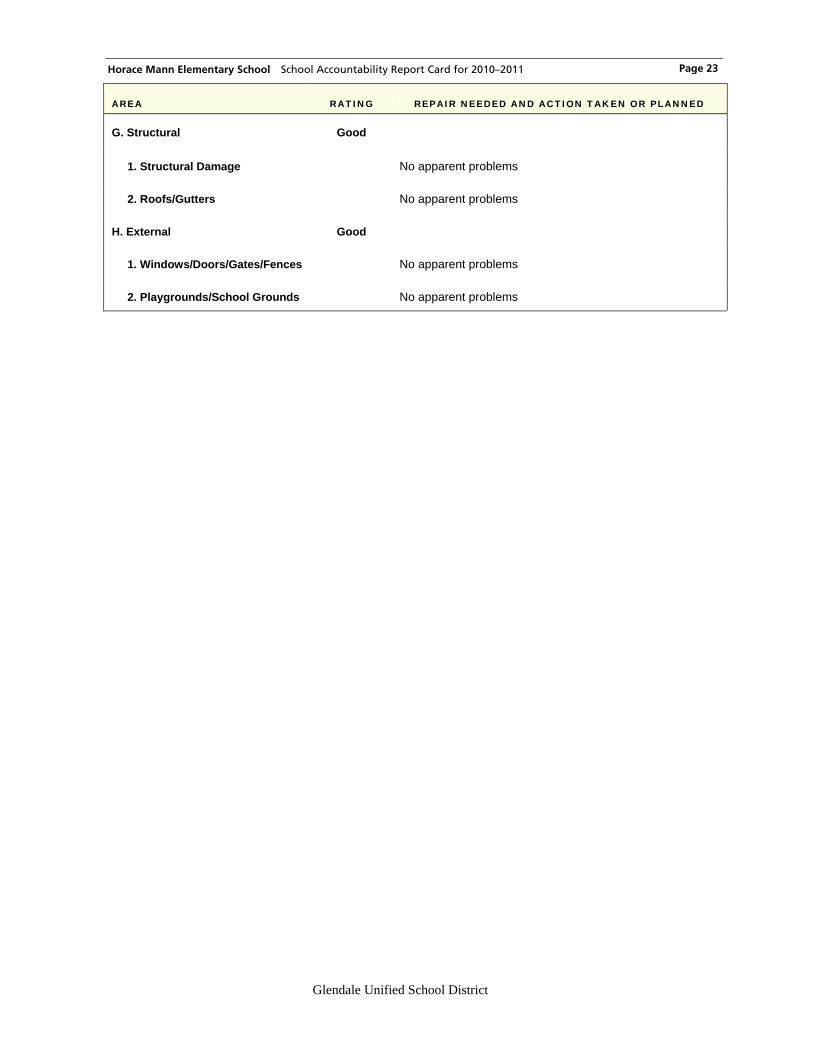
AREA RATING REPAIR NEEDED AND ACTION TAKEN OR PLANNED
G. Structural Good
1. Structural Damage No apparent problems
2. Roofs/Gutters No apparent problems
H. External Good
1. Windows/Doors/Gates/Fences No apparent problems
2. Playgrounds/School Grounds No apparent problems
Page 23

Horace Mann Elementary School School Accountability Report Card for 2010–2011
Glendale Unified School District
SCHOOL FINANCES, 2009–2010
We are required by the California Dept. of Education to report financial data from the 2009–2010 school year. More recent financial data is available on request from the district office.
Spending per Student To make comparisons possible across schools and districts of varying sizes, we first report our overall spending per student. We base our calculations on our average daily attendance (ADA). We’ve broken down expenditures by the type of funds used to pay for them. Unrestricted funds can be used for any lawful purpose. Restricted funds, however, must be spent for specific purposes set out by legal requirements or the donor. Examples include funding for instructional materials, economic impact aid, and teacher and principal training funds. Next to the figures for the district and state averages, we show the percentage by which the school’s spending varies from the district and state averages. For example, we calculate the school’s variance from the district average using this formula:
(SCHOOL AMOUNT – DISTRICT AVERAGE)
DISTRICT AVERAGE
TYPE OF FUNDS OUR
SCHOOL DISTRICT AVERAGE
SCHOOL-TO-DISTRICT VARIANCE
STATE AVERAGE
SCHOOL-TO-STATE VARIANCE
Unrestricted funds ($/student) $4,226 $4,059 4% $5,513 -23%
Restricted funds ($/student) $2,551 $1,684 51% $2,939 -13%
Total ($/student) $6,776 $5,744 18% $8,452 -20%
Compensation for Staff with Teaching Credentials To make comparisons possible across schools and districts of varying sizes, we report our compensation per full-time equivalent (FTE) certificated staff.* A teacher/administrator/pupil services person who works full-time counts as 1.0 FTE. Those who work only half time count as 0.5 FTE.
CERTIFICATED STAFF* OUR
SCHOOL DISTRICT AVERAGE
SCHOOL-TO-DISTRICT VARIANCE
STATE AVERAGE
SCHOOL-TO-STATE VARIANCE
Salary ($/certificated staff) $77,277 $73,624 5% $71,246 8%
Benefits ($/certificated staff) $23,908 $22,954 4% $16,062 49%
Total ($/certificated staff) $101,186 $96,578 5% $87,308 16%
* A certificated staff person is a school employee who is required by the state to hold teaching credentials, including full-time, part-time, substitute, or temporary teachers and most administrators.
Page 24
Horace Mann Elementary School School Accountability Report Card for 2010–2011
»
Page 25
Data Almanac
This Data Almanac provides additional information about students, teachers, student performance, accountability, and district expenditures.
Glendale Unified School District
Horace Mann Elementary School School Accountability Report Card for 2010–2011 Page 26
STUDENTS AND TEACHERS
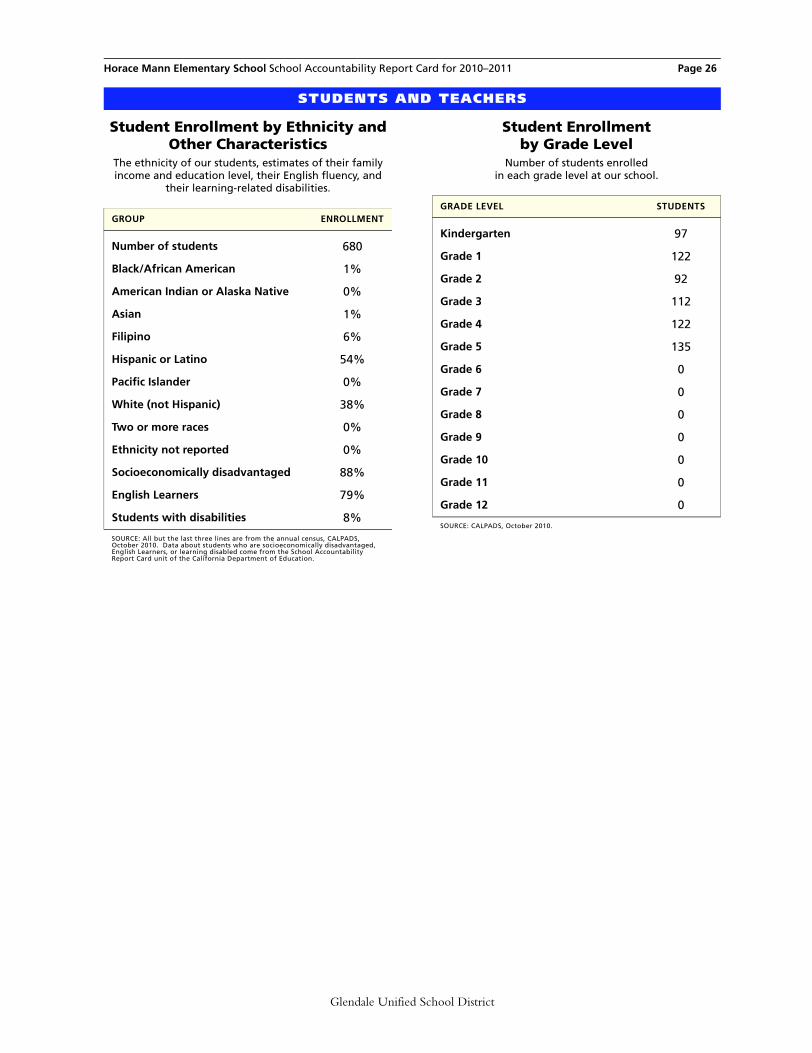
Student Enrollment by Ethnicity and Other Characteristics
The ethnicity of our students, estimates of their family income and education level, their English fluency, and
their learning-related disabilities.
Student Enrollment by Grade Level
Number of students enrolled in each grade level at our school.
GROUP ENROLLMENT
Number of students 680
Black/African American 1%
American Indian or Alaska Native 0%
Asian 1%
Filipino 6%
Hispanic or Latino 54%
Pacific Islander 0%
White (not Hispanic) 38%
Two or more races 0%
Ethnicity not reported 0%
Socioeconomically disadvantaged 88%
English Learners 79%
Students with disabilities 8%
SOURCE: All but the last three lines are from the annual census, CALPADS, October 2010. Data about students who are socioeconomically disadvantaged, English Learners, or learning disabled come from the School Accountability Report Card unit of the California Department of Education.
GRADE LEVEL STUDENTS
Kindergarten 97
Grade 1 122
Grade 2 92
Grade 3 112
Grade 4 122
Grade 5 135
Grade 6 0
Grade 7 0
Grade 8 0
Grade 9 0
Grade 10 0
Grade 11 0
Grade 12 0
SOURCE: CALPADS, October 2010.
Glendale Unified School District

Horace Mann Elementary School School Accountability Report Card for 2010–2011 Page 27
Average Class Size by Grade Level
Average Class Size by Grade Level, DetailThe number of classrooms that fall into each range of class sizes.
GRADE LEVEL 2008–2009 2009–2010 2010–2011
Kindergarten 20 23 24
Grade 1 20 21 21
Grade 2 20 22 23
Grade 3 20 20 22
Grade 4 28 36 36
Grade 5 36 36 30
Grade 6 N/A N/A N/A
Grade 7 N/A N/A N/A
Grade 8 N/A N/A N/A
Combined K–3 15 N/A N/A
Combined 3–4 N/A N/A N/A
Combined 4–8 27 35 N/A
Other N/A N/A N/A
SOURCE: CALPADS, October 2010. Information for 2009-2010 provided by the school district.
2008–2009 2009–2010 2010–2011
GRADE LEVEL 1–20 21–32 33+ 1–20 21–32 33+ 1–20 21–32 33+
Kindergarten 5 0 0 0 5 0 0 4 0
Grade 1 5 0 0 2 3 0 1 5 0
Grade 2 5 0 0 0 5 0 2 2 0
Grade 3 6 0 0 5 1 0 2 3 0
Grade 4 0 4 0 0 0 3 0 0 3
Grade 5 0 0 3 0 0 3 1 0 4
Grade 6 0 0 0 0 0 0 N/A N/A N/A
Combined K–3 1 0 0 0 0 0 N/A N/A N/A
Combined 3–4 0 0 0 0 0 0 N/A N/A N/A
Combined 4–8 0 1 0 0 0 1 N/A N/A N/A
Other 0 0 0 0 0 0 N/A N/A N/A
SOURCE: CALPADS, October 2010. Information for 2009-2010 provided by the school district.
Glendale Unified School District
Horace Mann Elementary School School Accountability Report Card for 2010–2011 Page 28
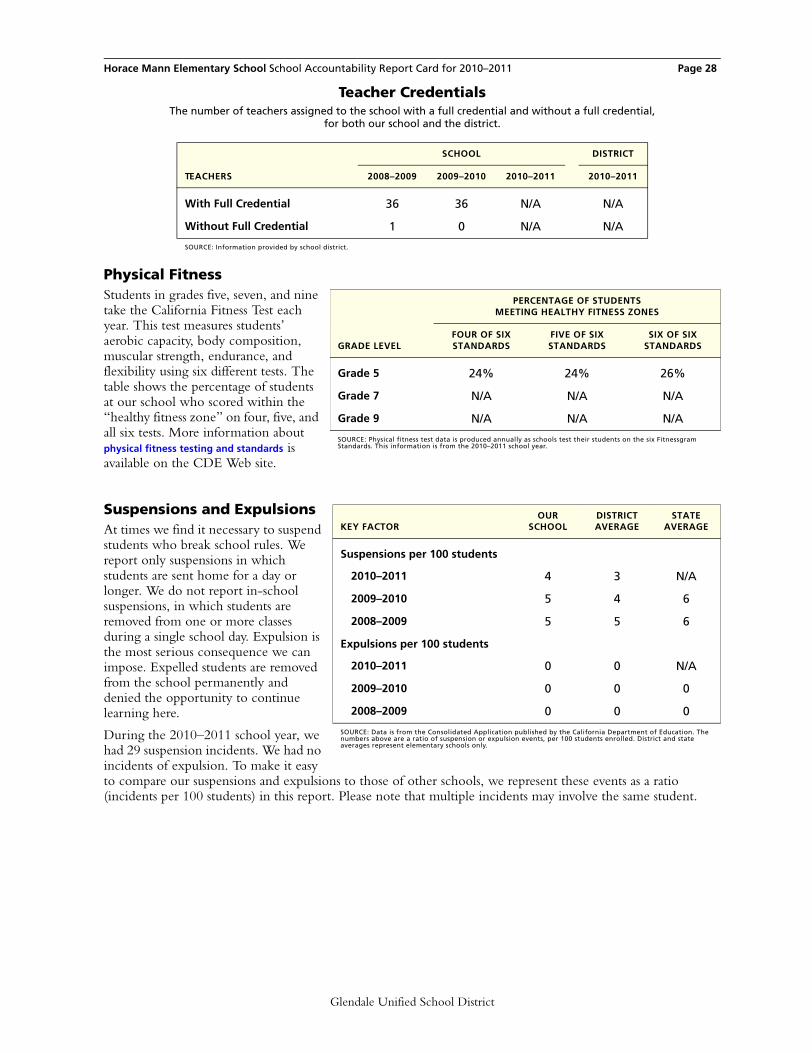
Teacher CredentialsThe number of teachers assigned to the school with a full credential and without a full credential,
for both our school and the district.
Physical FitnessStudents in grades five, seven, and nine take the California Fitness Test each year. This test measures students’ aerobic capacity, body composition, muscular strength, endurance, and flexibility using six different tests. The table shows the percentage of students at our school who scored within the “healthy fitness zone” on four, five, and all six tests. More information about physical fitness testing and standards is available on the CDE Web site.
Suspensions and ExpulsionsAt times we find it necessary to suspend students who break school rules. We report only suspensions in which students are sent home for a day or longer. We do not report in-school suspensions, in which students are removed from one or more classes during a single school day. Expulsion is the most serious consequence we can impose. Expelled students are removed from the school permanently and denied the opportunity to continue learning here.
During the 2010–2011 school year, we had 29 suspension incidents. We had no incidents of expulsion. To make it easy to compare our suspensions and expulsions to those of other schools, we represent these events as a ratio (incidents per 100 students) in this report. Please note that multiple incidents may involve the same student.
SCHOOL DISTRICT
TEACHERS 2008–2009 2009–2010 2010–2011 2010–2011
With Full Credential 36 36 N/A N/A
Without Full Credential 1 0 N/A N/A
SOURCE: Information provided by school district.
PERCENTAGE OF STUDENTS MEETING HEALTHY FITNESS ZONES
GRADE LEVELFOUR OF SIX STANDARDS
FIVE OF SIX STANDARDS
SIX OF SIX STANDARDS
Grade 5 24% 24% 26%
Grade 7 N/A N/A N/A
Grade 9 N/A N/A N/A
SOURCE: Physical fitness test data is produced annually as schools test their students on the six Fitnessgram Standards. This information is from the 2010–2011 school year.
KEY FACTOROUR
SCHOOLDISTRICTAVERAGE
STATEAVERAGE
Suspensions per 100 students
2010–2011 4 3 N/A
2009–2010 5 4 6
2008–2009 5 5 6
Expulsions per 100 students
2010–2011 0 0 N/A
2009–2010 0 0 0
2008–2009 0 0 0
SOURCE: Data is from the Consolidated Application published by the California Department of Education. The numbers above are a ratio of suspension or expulsion events, per 100 students enrolled. District and state averages represent elementary schools only.
Glendale Unified School District
Horace Mann Elementary School School Accountability Report Card for 2010–2011 Page 29
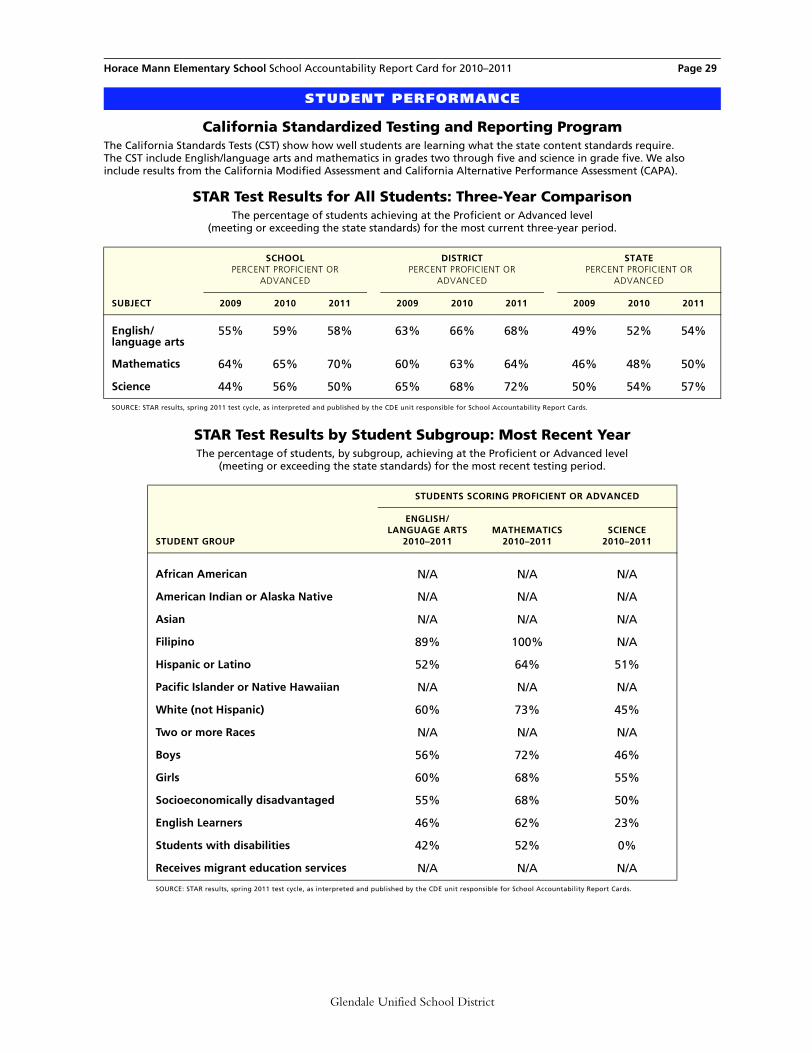
California Standardized Testing and Reporting ProgramThe California Standards Tests (CST) show how well students are learning what the state content standards require. The CST include English/language arts and mathematics in grades two through five and science in grade five. We also include results from the California Modified Assessment and California Alternative Performance Assessment (CAPA).
STAR Test Results for All Students: Three-Year ComparisonThe percentage of students achieving at the Proficient or Advanced level
(meeting or exceeding the state standards) for the most current three-year period.
STAR Test Results by Student Subgroup: Most Recent YearThe percentage of students, by subgroup, achieving at the Proficient or Advanced level
(meeting or exceeding the state standards) for the most recent testing period.
STUDENT PERFORMANCE
SCHOOLPERCENT PROFICIENT OR
ADVANCED
DISTRICTPERCENT PROFICIENT OR
ADVANCED
STATEPERCENT PROFICIENT OR
ADVANCED
SUBJECT 2009 2010 2011 2009 2010 2011 2009 2010 2011
English/language arts
55% 59% 58% 63% 66% 68% 49% 52% 54%
Mathematics 64% 65% 70% 60% 63% 64% 46% 48% 50%
Science 44% 56% 50% 65% 68% 72% 50% 54% 57%
SOURCE: STAR results, spring 2011 test cycle, as interpreted and published by the CDE unit responsible for School Accountability Report Cards.
STUDENTS SCORING PROFICIENT OR ADVANCED
STUDENT GROUP
ENGLISH/LANGUAGE ARTS
2010–2011MATHEMATICS
2010–2011SCIENCE
2010–2011
African American N/A N/A N/A
American Indian or Alaska Native N/A N/A N/A
Asian N/A N/A N/A
Filipino 89% 100% N/A
Hispanic or Latino 52% 64% 51%
Pacific Islander or Native Hawaiian N/A N/A N/A
White (not Hispanic) 60% 73% 45%
Two or more Races N/A N/A N/A
Boys 56% 72% 46%
Girls 60% 68% 55%
Socioeconomically disadvantaged 55% 68% 50%
English Learners 46% 62% 23%
Students with disabilities 42% 52% 0%
Receives migrant education services N/A N/A N/A
SOURCE: STAR results, spring 2011 test cycle, as interpreted and published by the CDE unit responsible for School Accountability Report Cards.
Glendale Unified School District
Horace Mann Elementary School School Accountability Report Card for 2010–2011 Page 30
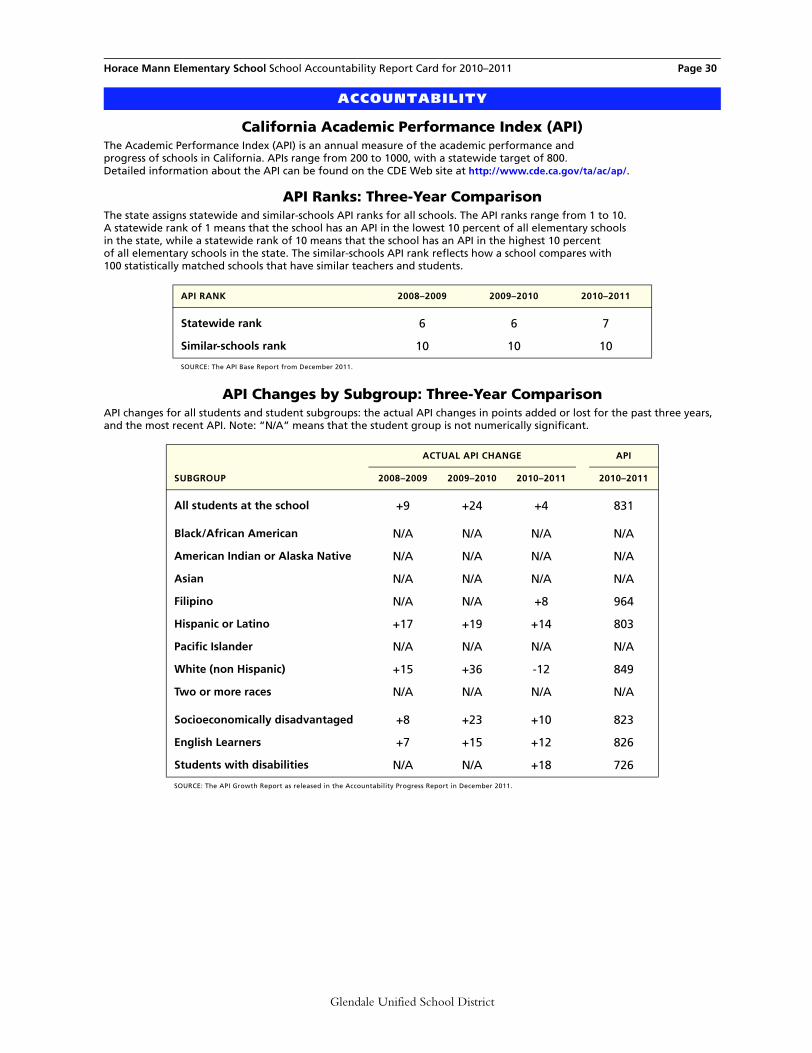
California Academic Performance Index (API)The Academic Performance Index (API) is an annual measure of the academic performance and progress of schools in California. APIs range from 200 to 1000, with a statewide target of 800. Detailed information about the API can be found on the CDE Web site at http://www.cde.ca.gov/ta/ac/ap/.
API Ranks: Three-Year ComparisonThe state assigns statewide and similar-schools API ranks for all schools. The API ranks range from 1 to 10. A statewide rank of 1 means that the school has an API in the lowest 10 percent of all elementary schools in the state, while a statewide rank of 10 means that the school has an API in the highest 10 percent of all elementary schools in the state. The similar-schools API rank reflects how a school compares with 100 statistically matched schools that have similar teachers and students.
API Changes by Subgroup: Three-Year ComparisonAPI changes for all students and student subgroups: the actual API changes in points added or lost for the past three years, and the most recent API. Note: “N/A” means that the student group is not numerically significant.
ACCOUNTABILITY
API RANK 2008–2009 2009–2010 2010–2011
Statewide rank 6 6 7
Similar-schools rank 10 10 10
SOURCE: The API Base Report from December 2011.
ACTUAL API CHANGE API
SUBGROUP 2008–2009 2009–2010 2010–2011 2010–2011
All students at the school +9 +24 +4 831
Black/African American N/A N/A N/A N/A
American Indian or Alaska Native N/A N/A N/A N/A
Asian N/A N/A N/A N/A
Filipino N/A N/A +8 964
Hispanic or Latino +17 +19 +14 803
Pacific Islander N/A N/A N/A N/A
White (non Hispanic) +15 +36 -12 849
Two or more races N/A N/A N/A N/A
Socioeconomically disadvantaged +8 +23 +10 823
English Learners +7 +15 +12 826
Students with disabilities N/A N/A +18 726
SOURCE: The API Growth Report as released in the Accountability Progress Report in December 2011.
Glendale Unified School District
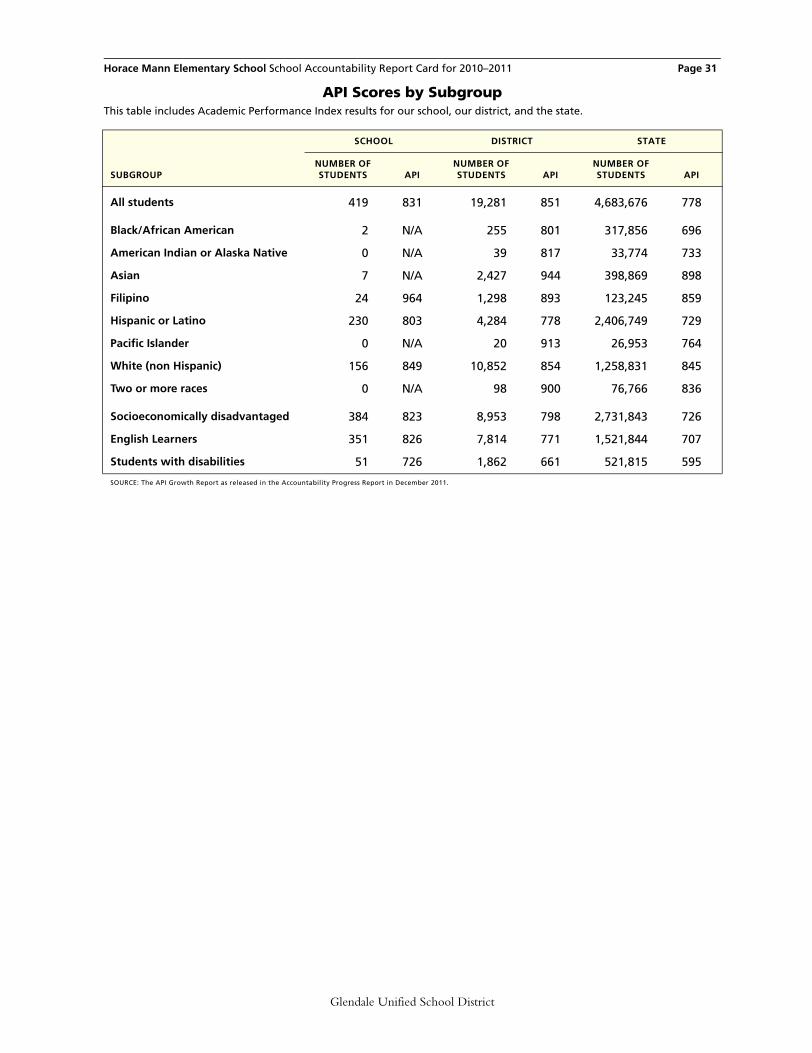
Horace Mann Elementary School School Accountability Report Card for 2010–2011 Page 31
API Scores by SubgroupThis table includes Academic Performance Index results for our school, our district, and the state.
SCHOOL DISTRICT STATE
SUBGROUPNUMBER OF STUDENTS API
NUMBER OF STUDENTS API
NUMBER OF STUDENTS API
All students 419 831 19,281 851 4,683,676 778
Black/African American 2 N/A 255 801 317,856 696
American Indian or Alaska Native 0 N/A 39 817 33,774 733
Asian 7 N/A 2,427 944 398,869 898
Filipino 24 964 1,298 893 123,245 859
Hispanic or Latino 230 803 4,284 778 2,406,749 729
Pacific Islander 0 N/A 20 913 26,953 764
White (non Hispanic) 156 849 10,852 854 1,258,831 845
Two or more races 0 N/A 98 900 76,766 836
Socioeconomically disadvantaged 384 823 8,953 798 2,731,843 726
English Learners 351 826 7,814 771 1,521,844 707
Students with disabilities 51 726 1,862 661 521,815 595
SOURCE: The API Growth Report as released in the Accountability Progress Report in December 2011.
Glendale Unified School District

Horace Mann Elementary School School Accountability Report Card for 2010–2011 Page 32
Federal Adequate Yearly Progress (AYP) and Intervention ProgramsThe federal law known as No Child Left Behind requires that all schools and districts meet all three of the following criteria in order to attain Adequate Yearly Progress (AYP): (a) a 95-percent participation rate on the state’s tests (b) a CDE-mandated percentage of students scoring Proficient or higher on the state’s English/language arts and mathematics tests (c) an API of at least 710 or growth of at least one point (d) the graduation rate for the graduating class must be higher than 90 percent (or satisfy alternate improvement criteria).
AYP for the DistrictWhether the district met the federal requirement for AYP overall,
and whether the district met each of the AYP criteria.
Intervention Program: District Program Improvement (PI)Districts receiving federal Title I funding enter Program Improvement (PI) if they do not make AYP for two consecutive years in the same content area (English/language arts or mathematics)and for each grade span or on the same indicator (API or graduation rate). After entering PI, districts advance to the next level of intervention with each additional year that they do not make AYP.
AYP CRITERIA DISTRICT
Overall No
Graduation rate Yes
Participation rate in English/language arts Yes
Participation rate in mathematics Yes
Percent Proficient in English/language arts No
Percent Proficient in mathematics No
Met Academic Performance Index (API) Yes
SOURCE: The AYP Report as released in the Accountability Progress Report in December 2011.
INDICATOR DISTRICT
PI stage 1 of 3
The year the district entered PI 2011
Number of schools currently in PI 11
Percentage of schools currently in PI 34%
SOURCE: The Program Improvement Report as released in the Accountability Progress Report in December 2011.
Glendale Unified School District

Horace Mann Elementary School School Accountability Report Card for 2010–2011 Page 33
According to the CDE, “State certification/release dates for fiscal data occur in middle to late spring, precluding the inclusion of 2010–11 data in most cases. Therefore, 2009–10 data are used for report cards prepared during 2011–12.”
Total expenses include only the costs related to direct educational services to students. This figure does not include food services, land acquisition, new construction, and other expenditures unrelated to core educational purposes. The expenses-per-student figure is calculated by dividing total expenses by the district’s average daily attendance (ADA). More information is available on the CDE’s Web site.
District Salaries, 2009–2010This table reports the salaries of teachers and administrators in our district for the 2009–2010 school year. This table compares our average salaries with those in districts like ours, based on both enrollment and the grade level of our students. In addition, we report the percentage of our district’s total budget dedicated to teachers’ and administrators’ salaries. The costs of health insurance, pensions, and other indirect compensation are not included.
DISTRICT EXPENDITURES
CATEGORY OF EXPENSE OUR DISTRICT SIMILAR DISTRICTS ALL DISTRICTS
FISCAL YEAR 2009–2010
Total expenses $212,092,576 N/A N/A
Expenses per student $8,325 $8,543 $8,452
FISCAL YEAR 2008–2009
Total expenses $217,571,164 N/A N/A
Expenses per student $8,471 $8,823 $8,736
SOURCE: Fiscal Services Division, California Department of Education.
SALARY INFORMATIONDISTRICTAVERAGE
STATEAVERAGE
Beginning teacher’s salary
$42,451 $42,017
Midrange teacher’s salary $65,170 $67,294
Highest-paid teacher’s salary
$88,157 $86,776
Average principal’s salary (elementary school)
$107,023 $108,534
Superintendent’s salary $286,847 $226,417
Percentage of budget for teachers’ salaries
41% 38%
Percentage of budget for administrators’ salaries
5% 5%
SOURCE: School Accountability Report Card unit of the California Department of Education.
rev20120116_19-64568-6013767e/16380
Glendale Unified School District

Top Related