


Languages
Pages
Legal


University of Southern Queensland
Faculty of Engineering and Surveying
High-Strength Structural Concrete with Recycled Aggregates
A Dissertation Submitted By
Nelson, Shing Chai NGO
In fulfilment of the requirement of
Course ENG 4111 and ENG 4112 Research Project
Towards the degree of
Bachelor of Engineering (Civil)
Submitted: November, 2004

Abstract Recycled aggregates are comprised of crushed, graded inorganic particles processed from
the materials that have been used in the constructions and demolition debris. The aim for
this on – going project is to determine the strength characteristic of recycled aggregates
for application in high strength structural concrete, which will give a better understanding
on the properties of concrete with recycled aggregates, as an alternative material to coarse
aggregate in structural concrete. The scope of this project is to determine and compare the
high strength concrete by using different percentage of recycled aggregates.
The investigation was carried out using workability test, compressive test, indirect tensile
test and modulus of elasticity test. There were total of eight batches of concrete mixes,
consists of every 20% increment of recycled aggregate replacement from 0% to 100%.
Moreover, 100% of recycled aggregate mix batches included fly ash, water/cement ratio
of 0.36 and 0.43. The workability of concrete considerably reduced as the amount of
recycled aggregate increased. This was evaluated through standard slump test and
compacting factor test. For strength characteristics, the results showed that a gradually
decreasing in compressive strength, tensile strength and modulus of elasticity as the
percentage of recycled aggregate used in the specimens increased.


Certification I certify that the ideas, designs and experimental work, results and analyses and conclusions set out in this dissertation are entirely my own effort, except where otherwise indicated and acknowledged. I further certify that the work is original and has not been previously submitted for assessment in any other course or institution, except where specifically stated. NGO Shing Chai, Nelson Student Number: D1230158 _____________________ Signature _____________________ Date

Acknowledgments Firstly, I would like to thank Dr. Thiru Aravinthan for his advice, support and assistance
throughout the duration of this project.
I also want to thanks Mr. Glen Bartkowski, and Mr. Bernhard Black for their valuable
assistance during the testing phase of the project.
The help of my fellow students who are Mr. Ronald Wong Chuan Mein, Mr. Eric Cheong
Fong Chin and Mr. Tagarajan Perumal is also greatly appreciated.
Finally, to my family and friends, thanks for all the time, patience and undying support
provided throughout the year.

Table of Contents
Abstract i
Disclaimer ii
Acknowledgement iii
Table of Content v
List of Figures viii
List of Tables x
Appendices xi
Chapter 1 Introduction
1.1 Introduction of Recycled Aggregate 1-1
1.2 Historical Background 1-2
1.3 Applications of Recycled Aggregate 1-3
1.4 International Status 1-8
1.5 Advantages 1-10
1.6 Disadvantages 1-12
1.7 Project Aim 1-13
1.8 Project Scope 1-13
1.9 Dissertation Overview 1-14
Chapter 2 Review of Recycled Aggregate
2.1 Literature Review of Recycled Aggregate 2-1
2.2 Review on Recycled Process 2-4
2.2.1 Recycling Plant 2-4
2.2.2 Sources of Recycled Aggregate 2-4
2.2.3 Equipments used during Recycling Process 2-5
2.2.3.1 Portland Cement Pavement 2-5
2.2.3.2 Structural Building 2-7
v

2.2.4 Transportation 2-9
2.2.5 Crushing Plant 2-10
2.2.6 Screening Plant and Washing Plant 2-13
2.2.7 Stockpile 2-14
2.3 Comparison of Recycled Aggregate and Natural Aggregate 2-16
Chapter 3 Properties and Testing of Aggregate
3.1 Particle Density and Water Absorption of Course and Fine Aggregate 3-1
3.1.1 Apparatus and Test Procedure of Course Aggregate 3-2
3.1.2 Apparatus and Test Procedure of Fine Aggregate 3-3
3.1.3 Result and Analysis 3-6
3.2 Sieve Analysis 3-11
3.2.1 Apparatus and Test Procedure of Sieve Analysis 3-12
3.2.2 Result and Analysis 3-14
3.3 Mix Design 3-15
3.4 Mixing of Concrete 3-17
3.5 Placing, Compaction and Casting of Concrete Specimens 3-19
3.6 Stripping and Curing of Concrete Specimens 3-21
3.7 Summary 3-22
Chapter 4 Experimental Methodology
4.1 Introduction 4-1
4.2 Workability Tests of Fresh Concrete 4-1
4.2.1 Slump Test 4-2
4.2.1.1 Apparatus and Test Procedure of Slump Test 4-3
4.2.2 Compacting Factor Test 4-6
4.2.2.1 Apparatus and Test Procedure of Compacting Factor Test 4-7
4.3 Testing on Hardened Concrete Specimens 4-10
4.3.1 Compression Test 4-11
vi

4.3.1.1 Apparatus and Test Procedure of Compression Test 4-11
4.3.2 Indirect Tensile Test 4-13
4.3.2.1 Apparatus and Test Procedure of Indirect Tensile Test 4-14
4.3.3 Modulus of Elasticity 4-15
4.3.3.1 Apparatus and Test Procedure of Modulus of Elasticity 4-16
4.4 Summary 4-18
Chapter 5 Tests Results and Analysis
5.1 Introduction 5-1
5.2 Slump Test Result and Analysis 5-1
5.3 Compacting Factor Test Result and Analysis 5-3
5.4 Compression Test Result and Analysis 5-5
5.5 Indirect Tensile Test Result and Analysis 5-11
5.6 Modulus of Elasticity Result and Analysis 5-16
5.7 Summary 5-19
Chapter 6 Conclusion and Recommendations
6.1 Achievement of Objectives 6-1
6.2 Conclusion 6-2
6.3 Recommendations for Further Studies 6-3
Reference
vii

List of Figures
Figure 1.1: Recycled Aggregate 1-1
Figure 1.2: Application of Recycled Aggregate as Road Kerb 1-3
Figure 1.3: Recycled Aggregate used as Granular Base Course 1-4
Figure 1.4: Typical Paving Blacks 1-5
Figure 1.5: Recycled Aggregate as Backfill Materials 1-6
Figure 1.6: Recycled Aggregate used as Building Blocks 1-7
Figure 1.7: Construction of the New High School in Sorumsand, Oslo, Norway 1-8
Figure 2.1: Diesel Pile – Driving Hammer 2-5
Figure 2.2: Rhino – horn – tooth – ripper – equipped Hydraulic Excavator 2-6
Figure 2.3: Hydraulic Crusher with Long Boon Arm 2-7
Figure 2.4: Wrecking Ball 2-8
Figure 2.5: Kingdome Implosion 2-8
Figure 2.6: Roll – off Container 2-9
Figure 2.7: Load into Primary Crusher 2-10
Figure 2.8: Electromagnetic Separation Process 2-11
Figure 2.9: Picking Shed 2-12
Figure 2.10: Wet Separation Process (Aquamator) 2-12
Figure 2.11: Screening Plant 2-13
Figure 2.12: Washing Plant 2-14
Figure 2.13: Stockpile 2-14
Figure 2.14: Load Out and Sales 2-15
Figure 2.15: Recycling Portland Cement Concrete Flow Chart 2-15
Figure 2.16: Comparison between Natural Aggregate and Recycled Aggregate 2-16
Figure 3.1: Balance for Aggregate Weighting 3-5
Figure 3.2: Thermostatically Controlled Oven 3-6
Figure 3.3: Sieve Machine for Course Aggregate 3-13
Figure 3.4: Sieve Machine for Fine Aggregate 3-13
Figure 3.5: Horizontal Pan Mixer 3-18
Figure 3.6: Cylinder Moulds for the Concrete Specimens 3-20
viii

Figure 3.7: Vibrator for Fresh Concrete Compaction 3-20
Figure 3.8: Curing Room for Concrete Specimens 3-21
Figure 4.1: The Apparatus for Slump Test 4-4
Figure 4.2: Typical Slump Test 4-5
Figure 4.3: The Apparatus for Compacting Factor Test 4-6
Figure 4.4: Standard Compacting Factor Apparatus 4-8
Figure 4.5: Setup of Compression Test 4-13
Figure 4.6: Setup of Indirect Tensile Test 4-15
Figure 4.7: Setup of Modulus of Elasticity 4-17
Figure 5.1: Graph showing the result of Slump Test 5-2
Figure 5.2: Graph showing the result of Compacting Factor Ratio 5-4
Figure 5.3: Variation of Compressive Strength with Age 5-6
Figure 5.4: Specimens after Testing 5-7
Figure 5.5: Graph shows the Percentage of Compressive Strength Remained 5-8
Figure 5.6: Graph shows the Percentage of Decreasing in Compressive Strength 5-9
Figure 5.7: Variation of Compressive Strength Gained with Time 5-10
Figure 5.8: Variation of Tensile Strength 5-12
Figure 5.9: Specimens after Testing 5-13
Figure 5.10: Graph shows the Percentage of Tensile Strength Remained 5-14
Figure 5.11: Graph shows the Percentage of Tensile Strength Dropped 5-14
Figure 5.12: Variation of Modulus of Elasticity 5-17
Figure 5.13: Stress and Strain Relationship 5-18
ix

List of Table
Table 3.1: Weight of course aggregate in the test 3-6
Table 3.2: Weight of fine aggregate in the test 3-9
Table 3.3: Result of particle density and water absorption of all aggregate 3-10
Table 3.4: Percentage sieve size passing for all aggregate 3-14
Table 3.5: Percentage of aggregate used in all 8 batches of mixes 3-16
Table 3.6: Initial data for mix design 3-16
Table 3.7: Proportion and weight of each mix materials 3-16
Table 5.1: The slump result for each batch of mix concrete 5-1
Table 5.2: The compacting factor ratio for each of mix concrete 5-3
Table 5.3: Variation of compressive strength (MPa) with age 5-5
Table 5.4: Percentage of compressive strength remained and dropped 5-8
Table 5.5: Variation of tensile strength 5-11
Table 5.6: Percentage of tensile strength remained and dropped 5-13
Table 5.7: The results obtained from different percentage of 5-16 recycled aggregate replacement
x

Appendices
Appendix A Project Specification
Appendix B Reference Required for Properties and Testing of Aggregate
Appendix C Individual Compressive Strength Result
Appendix D Individual Percentage Compressive Strength Gain with Time
Appendix E Individual Test Results for Indirect Tensile Strength
Appendix F Individual Stress and Strain Relationship
xi

Chapter 1 Introduction
CHAPTER 1
INTRODUCTION
1.1 Introduction of Recycled Aggregate
Recycling is the act of processing the used material for use in creating new product. The
usage of natural aggregate is getting more and more intense with the advanced
development in infrastructure area. In order to reduce the usage of natural aggregate,
recycled aggregate can be used as the replacement materials. Recycled aggregate are
comprised of crushed, graded inorganic particles processed from the materials that have
been used in the constructions and demolition debris. These materials are generally from
buildings, roads, bridges, and sometimes even from catastrophes, such as wars and
earthquakes.
Figure 1.1: Recycled Aggregate
1-1

Chapter 1 Introduction
1.2 Historical Background
The applications of recycled aggregate in the construction areas are wide and they had
been used long time ago.
Wilmot and Vorobieff (1997) stated that recycled aggregate have been used in the road
industry for the last 100 years in Australia. They also stated that the use of recycled
aggregate for the construction and rehabilitation of local government roads has a great
improve in the last five years.
C & D Recycling Industry (n.d.), the fact file stated that from the time of the Romans, the
stones from the previous roads were reused when rebuilding their vaunted set of roads. It
also stated that since the end of world war two, the recycling industry had been well
established in Europe.
According to Seecharan (2004), the Detroid News stated that in 1980s, the old concrete
crushed into a powder was a popular road builder at Michigan, USA.
1-2

Chapter 1 Introduction
1.3 Applications of Recycled Aggregate
Traditionally, the application of recycled aggregate is used as landfill. Nowadays, the
applications of recycled aggregate in construction areas are wide. The applications are
different from country to country.
• Concrete Kerb and Gutter Mix
Recycled aggregate have been used as concrete kerb and gutter mix in Australia.
According to Building Innovation & Construction Technology (1999), Stone says that the
10mm recycled aggregate and blended recycled sand are used for concrete kerb and
gutter mix in the Lenthall Street project in Sdyney.
Figure 1.2: Application of Recycled Aggregate as Road Kerb
(Source: Building Innovation & Construction Technology, 1999)
1-3

Chapter 1 Introduction
• Granular Base Course Materials
According to Market Development Study for Recycled Aggregate Products (2001),
recycled aggregate are used as granular base course in the road construction. It also stated
that recycled aggregate had proved that better than natural aggregate when used as
granular base course in roads construction. They also found that when the road is built on
the wet sub grade areas, recycled aggregate will stabilize the base and provide an
improved working surface for pavement structure construction.
Figure 1.3: Recycled Aggregate used as Granular Base Course
(Source: Mehus and Lillestol (n.d))
1-4

Chapter 1 Introduction
• Embankment Fill Materials
Market Development Study for Recycled Aggregate Products (2001) stated that recycled
aggregate can be used in embankment fill. The reason for being able to use in
embankment fill is same as it is used in granular base course construction. The
embankment site is on the wet sub grade areas. Recycled aggregate can stabilize the base
and provide an improved working surface for the remaining works.
• Paving Blocks
Recycled aggregate have been used as paving blocks in Hong Kong. According to Hong
Kong Housing Department (n.d.), recycled aggregate are used as typical paving blocks. A
trial project had been started to test the long – term performance of paving blocks made
with recycled aggregate in 2002.
Figure 1.4: Typical Paving Blocks
(Source: Hong Kong Housing Department, (n.d.))
1-5

Chapter 1 Introduction
• Backfill Materials
Recycled aggregate can be used as backfill materials. Mehus and Lillestol (n.d) found
that Norwegian Building Research Institute (n.d) mentioned that recycled concrete
aggregate can be used as backfill materials in the pipe zone along trenches after having
testing in laboratory.
Figure 1.5: Recycled Aggregate as Backfill Materials
(Source: Mehus and Lillestol (n.d))
1-6

Chapter 1 Introduction
• Building Blocks
Recycled aggregate used as building blocks. Mehus and Lillestol (n.d) stated that Optiroc
AS had used recycled aggregate to produce the masonry sound insulation blocks. The
masonry sound insulation blocks that produced had met all the requirements during the
laboratory testing.
Figure 1.6: Recycled Aggregate used as Building Blocks
(Source: Mehus and Lillestol (n.d))
1-7

Chapter 1 Introduction
1.4 International Status
Mehus and Lillestol (n.d.) stated that RESIBA had constructed a new high school in
Sorumsand, outside the city of Oslo, Norway in 2001. Recycled concrete aggregate had
been used in this project. Thirty – five percent of coarse aggregate were replaced by
recycled concrete aggregate in the foundations, half of the basement walls and columns.
Several tests were conducted based on fresh and hardened concrete properties and the
results shown that the concrete with thirty – five percent of recycled concrete aggregate
have good freeze – thaw resistance. The use of recycled concrete aggregate did not shown
any noticeable increase in cracking.
Figure 1.7: Construction of the New High School in Sorumsand, Oslo, Norway
(Source: Mehus and Lillestol (n.d))
1-8

Chapter 1 Introduction
According to Grubl, Nealen and Schmidt (n.d.), there is a building project, the
“Waldspirale” by Friedensreich Hundertwasser, made from concrete with recycled
aggregate in Darmstadf from November 1998 to September 1999. Numerous tests were
evaluated for freshly missed and also hardened concrete properties. The result shown that
the consistency controlled method for concrete with recycled aggregate is applicable.
And it leads to concrete of equal quality when compared with concrete made from natural
aggregate.
According to Regain (1993/94), recycled aggregate were used as capping and sub-base
layers in housing development at North Bracknell, UK in 1993/94. Visual inspections and
condition surveys were carried out by using the falling weight deflectometer in 1998. The
result shown that the sections with recycled aggregate did not show any difference in
appearance compared to the sections that using natural aggregate. The tests gave the
larger values of elastic modulus in the recycled aggregate sections.
According to Regain (2001), footway paving slabs are being replaced gradually in
London Borough of Bexley. Recycled aggregate are used as coarse aggregate in the
concrete mix with a 12:1 aggregate to cement mix.
1-9
Chapter 1 Introduction
1.5 Advantages
There are many advantages through using the recycled aggregate. The advantages that
occur through usage of recycled aggregate are listed below.
• Environmental Gain
The major advantage is based on the environmental gain. According to CSIRO (n.d.),
construction and demolition waste makes up to around 40% of the total waste each year
(estimate around 14 million tones) going to land fill. Through recycled these material, it
can keep diminishing the resources of urban aggregated. Therefore, natural aggregate can
be used in higher –grade applications.
• Save Energy
The recycling process can be done on site. According to Kajima Technical Research
Institute (2002), Kajima is developing a method of recycling crushed concrete that used
in the construction, known as the Within-Site Recycling System. Everything can be done
on the construction site through this system, from the process of recycled aggregate,
manufacture and use them. This can save energy to transport the recycled materials to the
recycling plants.
• Cost
Secondly is based on the cost. The cost of recycled aggregate is cheaper than virgin
aggregate. According to PATH Technology Inventory (n.d.), the costs of recycled
concrete aggregateare sold around $3.50 to $7.00 per cubic yard. It depends on the
aggregate size limitation and local availability. This is just around one and half of the cost
for natural aggregate that used in the construction works. The transportation cost for the
recycled aggregate is reduced due to the weight of recycled aggregate is lighter than
virgin aggregate. Concrete Network (n.d) stated that recycling concrete from the
1-10

Chapter 1 Introduction
demolition projects can saves the costs of transporting the concrete to the land fill
(around $0.25 per ton/ mile), and the cost of disposal (around $100 per ton). Beside that,
Aggregate Advisory Service (n.d.) also state that the recycling site may accept the
segregates materials at lower cost than landfill without tax levy and recycled aggregate
can be used at a lower prices than primary aggregate in the construction works.
• Job Opportunities
There will be many people involved in this new technology, such as specialized and
skilled persons, general workers, drivers and etc. According to Scottish Executive (2004),
a Scottish Market Development Program is developed. The purpose of this program is to
recycle the materials that arising in Scotland. This program will provide 150 new jobs in
the Scottish industry.
• Sustainability
The amount of waste materials used for landfill will be reducing through usage of
recycled aggregate. This will reduce the amount of quarrying. Therefore this will extend
the lives of natural resources and also extend the lives of sites that using for landfill.
• Market is Wide
The markets for recycled concrete aggregate are wide. According to Environmental
Council of Concrete Organization (n.d), recycled concrete aggregate can be used for
sidewalk, curbs, bridge substructures and superstructures, concrete shoulders, residential
driveways, general and structural fills. It also mentioned that recycled concrete aggregate
can be used in sub bases and support layers such as unstabilized base and permeable
bases.
1-11
Chapter 1 Introduction
1.6 Disadvantages
Although there are many advantages by using recycled aggregate. But there are still some
disadvantages in recycled aggregate.
• Hard to have permit
Jacobsen (1999) stated that it is hard to get the permit for the machinery that needed air
permit or permit to operate during the recycling process. These has to depend on the local
or state regulations whether this technology is implemented or not.
• Lack of Specification and Guidelines
According to Kawano (n.d), there is no specification or any guideline when using
recycled concrete aggregate in the constructions. In many cases, the strength
characteristic will not meet the requirement when using recycled concrete aggregate.
Therefore, more testing should be considered when using recycled concrete aggregate.
• Water Pollution
The recycled process will cause water pollution. Morris of National Ready Mix Concrete
Association (n.d) had mentioned that the wash out water with the high pH is a serious
environmental issue. According to Building Green (1993), the alkalinity level of wash
water from the recycling plants is pH12. This water is toxic to the fish and other aquatic
life.
1-12

Chapter 1 Introduction
1.7 Project Aim
The aim for this on – going project is to determine the strength characteristic of recycled
aggregate for application in high strength structural concrete, which will give a better
understanding on the properties of concrete with recycled aggregate, where can be an
alternative material to coarse aggregate in structural concrete.
1.8 Project Scope
The scope of this project:
• Review and research of recycled aggregate.
• Construct the concrete specimens by using different percentage of recycled
aggregate.
• Investigation and laboratory testing on high strength concrete with recycled
aggregate.
• Analysis the results and recommendation for further research area.
1-13

Chapter 1 Introduction
1.9 Dissertation Overview
This dissertation is structured in the following format.
• Chapter 2 provides a review of relevant literature, overview of recycling process,
as well as comparison of recycled aggregate and natural aggregate. This chapter
also discussed the previous investigation and testing done with recycled
aggregate.
• Chapter 3 includes the preliminary design and information on the recycled
aggregate testing, sieve analysis and design of the concrete mix.
• Chapter 4 describes the experimental methodology carried out in order to obtain
the required data.
• Chapter 5 discusses the results and analysis of all experimental results obtained
from the testing procedures.
• Chapter 6 contains the conclusions of the research and recommendations on
further work.
1-14
Chapter 2 Review of Recycled Aggregate
Chapter 2
Review of Recycled Aggregate
2.1 Literature Review of Recycled Aggregate
The applications of recycled aggregate in the construction area are very wide. There are
many testing based on the recycled aggregate have been carried out all around the world.
Hanson and Torben (1986) stated that since 1945, the research on recycled aggregate had
been carried out in many countries. Some of the literature reviews on recycled aggregate
are shown as below.
The main aim that testing the recycled aggregate is to find out the result of the strength
characteristic on it and analysis whether recycled aggregate is suitable to apply in the
construction area. According to Rammamurthy and Gumaster (1998), the compressive
strength of recycled aggregate concrete was relatively lower and variation was depended
on the strength of parent concrete from the obtained aggregate.
Limbachiya and Leelawat (2000) found that recycled concrete aggregate had 7 to 9%
lower relative density and 2 times higher water absorption than natural aggregate.
According to their test results, it shown that there was no effect with the replacement of
30% coarse recycled concrete aggregate used on the ceiling strength of concrete. It also
mentioned that recycled concrete aggregate could be used in high strength concrete mixes
with the recycled concrete aggregate content in the concrete.
Sagoe, Brown and Taylor (2002) stated that the difference between the characteristic of
fresh and hardened recycled aggregate concrete and natural aggregate concrete is
relatively narrower than reported for laboratory crush recycled aggregate concrete mixes.
There was no difference at the 5% significance level in concrete compressive and tensile
strength of recycled concrete and control normal concrete made from natural aggregate.
2-1

Chapter 2 Review of Recycled Aggregate
In the same year, poon (2002) reported that there were not much effect of the
compressive strength of brick specimens with the replacement of 25% and 50% of
recycled aggregate. But when the percentage of recycled aggregate replacement
increased, the compressive strength of the specimens was reducing. Mandal, Chakarborty
and Gupta (2002) also found that there will no effects on the concrete strength with the
replacement of 30% of recycled aggregate. But the compressive strength was gradually
decreasing when the amount replacement of recycled increased. They concluded that the
properties and the strength characteristic of recycled aggregate concrete were deficiency
when compared to the specimens that made by the natural aggregate.
Limbachiya (2003) found that there is no effect by using up to 30% of coarse recycled
concrete aggregate on the standard 100mm concrete cube compressive strength. But
when the percentage of recycled concrete aggregate used increased, the compressive
strength was reducing.
From the literature review shown, the results of the compressive strength are all reducing
when the replacement of recycled aggregate used in the concrete increased. There must
be some influences that cause the reducing of compressive strength of recycled aggregate.
According to Tavakoli (1996), the strength characteristics of recycled aggregate concrete
were influenced by the strength of the original concrete, the ratio of coarse aggregate to
fine aggregate in the original concrete, and the ratio of top size of the aggregate in the
original concrete in the recycled aggregate. He also mentioned that water absorption and
Los Angeles abrasion loss will influence the water cement ratio and top size ratio for the
strength characteristic of recycled aggregate.
Bodin and Zaharieva (2002) stated that decreasing of the strength of recycled concrete
specimen was due to the increase of water/cement ratio that required by the preservation
of workability.
2-2

Chapter 2 Review of Recycled Aggregate
There are some methods used to improve the strength of the recycled aggregate.
Kantawong and Laksana (1998) mentioned that the fineness modulus and percentage of
water absorption used instead with the recycled aggregate is higher than natural
aggregate. The results of compressive strength of added reduce water admixture concrete
is higher than the one that not added reduce water admixture concrete, ane the
compressive strength of concrete produced that using recycled aggregate is higher than
concrete using natural coarse aggregate.
Sawamoto and Takehino (2000) found that the strength of the recycled aggregate
concrete can be increased by using Pozzolanic material that can absorb the water.
Mandal (2002) stated that adjusted the water/cement ratio when using recycled concrete
aggregate during the concrete mixing can improved the strength of the recycled aggregate
concrete specimens. From the obtained result, recycled aggregate concrete specimens had
the same engineering and durability performance when compared to the concrete
specimens made by natural aggregate within 28days design strength.
Chen and Kuan (2003) found that the strength of the concrete specimens was affected by
the unwashed recycled aggregate in the concrete. The effect will more strange at the low
water cement ratio. These effects can be improved by using the washed recycled
aggregate.
Another improving method is using the sly ash in the recycled aggregate mixing. Mandal
(2002) stated that application of fly ash in the recycled concrete aggregate had improved
the durability of the recycled aggregate concrete. Poon (2002) also mentioned that the use
of fly ash could improve the strength characteristic of recycled aggregate. He stated that
the compressive strength of concrete paving blocks was reached 49MPa at 28days by
using fly ash. Berry and Malhotra (1980) stated that for high strength concrete, fly ash
functions by providing increased strength at late ages of curing (56 to 91 days) that
cannot be achieved through the use of additional Portland cement.
2-3

Chapter 2 Review of Recycled Aggregate
Some precautions must be taken while using recycled aggregate in the concrete mixing.
According to Bodin and Zaharieva, the precautions must be taken was because of there
were some pathological reactions such as alkali – aggregate reaction and sulphate
reaction may be include in the performed characterisation of industrially produced
recycled aggregate. They also mentioned that the mix proportioning of recycled
aggregate concrete must be suited when both fine and coarse recycled aggregate were
substituted for natural aggregate.
2.2 Review on Recycled Process
This section discusses the recycling process and method.
2.2.1 Recycling Plant
Recycling plant normally located in the suburbs of cities due to the noise pollution that
make by the equipments that used during recycling process. According to Aggregate and
Quarry (n.d.), all the machinery used have to fit with the effective mufflers to reduce the
noise from the processing activity.
2.2.2 Sources of Recycled Aggregate
Traditionally, Portland concrete aggregate from the demolition construction are used for
landfill. But nowadays, Portland concrete aggregate can be used as a new material for
construction usage.
According to Recycling of Portland Cement Concrete (n.d), recycled aggregate are
mainly produced from the crushing of Portland concrete pavement and structures
building. It stated that the isolated areas of 1 inch of asphalt concrete can be used to
produce the recycled aggregate. The main reason that choosing the structural building as
the source for recycled aggregate is because there is a huge amount of crushed demolition
Portland cement concrete can be produced.
2-4

Chapter 2 Review of Recycled Aggregate
2.2.3 Equipments used during Recycling Process
The equipments that used during recycling process are various from the site conditions
and also country to country. There are few different types of equipment had been used
effectively to break up the Portland cement pavement and structural building.
2.2.3.1 Portland Cement Pavement
Recycling of Portland Cement Concrete (n.d) mentioned that there are few different types
of equipment had been used for crushing the Portland cement pavement. The equipments
are as below:
(1) Diesel pile – driving hammer. It is mounting on a motor grader that sticks in the
Portland cement pavement on around 30cm grid pattern.
Figure 2.1: Diesel Pile – Driving Hammer
(Source: Recycling of Portland Cement Concrete, (n.d))
2-5

Chapter 2 Review of Recycled Aggregate
(2) Rhino – horn – tooth – ripper – equipped hydraulic excavator. It is used to
remove all the steel reinforcement that remaining in the Portland cement
pavement.
Figure 2.2: Rhino – horn – tooth – ripper – equipped Hydraulic Excavator
(Source: Recycling of Portland Cement Concrete, (n.d))
2-6

Chapter 2 Review of Recycled Aggregate
2.2.3.2 Structural Building
Hong Kong Building Department (n.d) mentioned that the following methods had been
used to crush the structural building.
(1) Mechanical by hydraulic crusher with long boom arm. The concrete and steel
reinforcements are broken by the crusher through the long boom arm system. This
method is suitable for the dangerous buildings.
Figure 2.3: Hydraulic Crusher with Long Boom Arm
(Source: Hydraulic Circuit Technology, 2000)
2-7

Chapter 2 Review of Recycled Aggregate
(2) Wrecking ball. The building is demolished by the impact energy of the wrecking
ball which suspended from the crawler crane.
Figure 2.4: Wrecking Ball
(Source: The Trading Tribe, 2003)
(3) Implosion. A design included pre – weakening of the structure, the placement of
the explosives and the building collapse in a safe manner have to develop.
Figure 2.5: Kingdome Implosion
(Source: Davinel, 2000)
2-8

Chapter 2 Review of Recycled Aggregate
2.2.4 Transportation
After the structural buildings and Portland cement pavements are demolished, the
concrete debris has to send to the recycling plants for processing. Construction and
Demolition Waste Recycling Information (n.d.) mentioned that it is good to use the roll –
off containers or large dump body trailers to transport the mixed load of construction and
demolition debris. This is the most effective and cost effective means of the
transportation. It also mentioned that the construction and demolition debris can be
transport by the closed box trailers and covered containers.
Figure 2.6: Roll – off Container
(Source: On – site Disposal Facility, 2000)
2-9

Chapter 2 Review of Recycled Aggregate
2.2.5 Crushing Plant
Crushing is the initial process of producing the construction and demolition debris into
recycled aggregate. The concrete debris is crushed into pieces in this process. Aggregate
and Quarry (2001) stated that generally the equipments used for crushing process are
either jaw or impacted mill crushers. It also stated that all the recycling crushers have a
special protection for conveyor belts to prevent damage by the reinforcement steel that in
the concrete debris. They are fitted with the magnetic conveyors to remove all the scrap
metal.
According to Recycling of Portland Cement Concrete (n.d.), the equipments used to
crush and size the existing concrete have to include the jaw and cone crushers. The
concrete debris will break down to around 3 inches by the primary jaw crusher. It also
mentioned that the secondary cone crushers will breaks the materials to the maximum
size required which vary between ¾ and 2 inches.
Figure 2.7: Load into Primary Crusher
(Source: Boral, 2002)
2-10
Chapter 2 Review of Recycled Aggregate
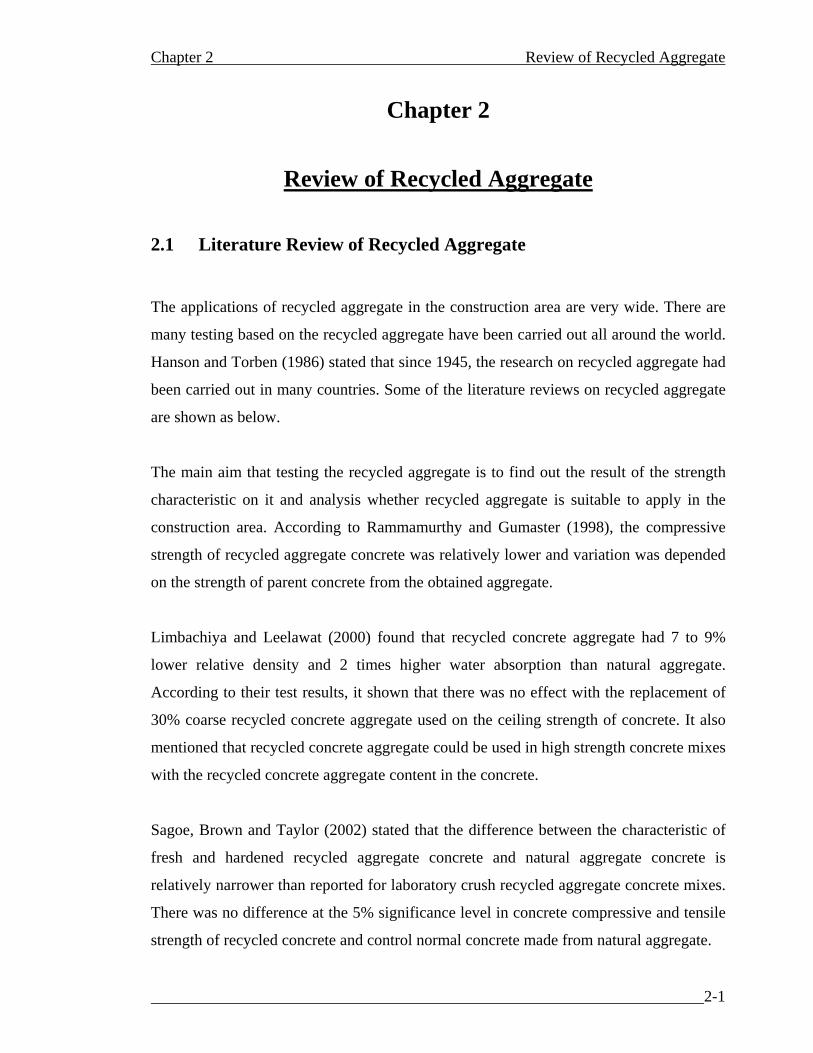
During the crushing process, all the reinforcing steels have to remove away. Professor S
L Bakoss and Dr R Sri Ravindarajah (1999) stated that there are three methods of sorting
and cleaning the recycled aggregate, which are electromagnetic separation, dry separation
and wet separation. Electromagnetic separation process is removal of reinforcing steel by
the magnet that fitted across the conveyor belt in the primary and secondary crushers.
Dry separation process is removing the lighter particles from the heavier stony materials
by bowing air. This method always causes lot of dust. Wet separation process is the
aquamator, which the low density contaminants are removed by the water jets and float –
sink tank, and this will produces very clean aggregate.
According to COST 337 Unbound Granular Materials for Road Pavements (n.d.), the
wood pieces that contained in the concrete debris can be removed by hand – picking from
a special platform over the discharge conveyor.
After finish the crushing process, the materials are then sent to the screening plant.
Figure 2.8: Electromagnetic Separation Process
(Source: Boral, 2002)
2-11

Chapter 2 Review of Recycled Aggregate
Figure 2.9: Picking Shed
(Source: Boral, 2002)
Figure 2.10: Wet Separation Process (Aquamator)
(Source: Boral, 2002)
2-12

Chapter 2 Review of Recycled Aggregate
2.2.6 Screening Plant and Washing Plant
Screening is the process that separates the various sizes of recycled aggregate. The
screening plant is made of a series of large sieves separates the materials into the size
required.
Recycling of Portland Cement Concrete (n.d.) stated that the size of screen that used to
separate the coarse recycled concrete aggregate and fine recycled aggregate is 3/8 inch.
The size of screen used to separate the coarse recycled aggregate can be under or over ¾
inches. It also stated that one more screen should be used to separate those particles that
more than the specified size.
After the screening process, the recycled are then sent to the washing plant. COST 337
Unbound Granular Materials for Road Pavements (n.d.) stated that the recycled aggregate
that produced have to be very clean when using in the high quality product situation.
Figure 2.11: Screening Plant
(Source: R. R. Equipment Company, 2003)
2-13
Chapter 2 Review of Recycled Aggregate
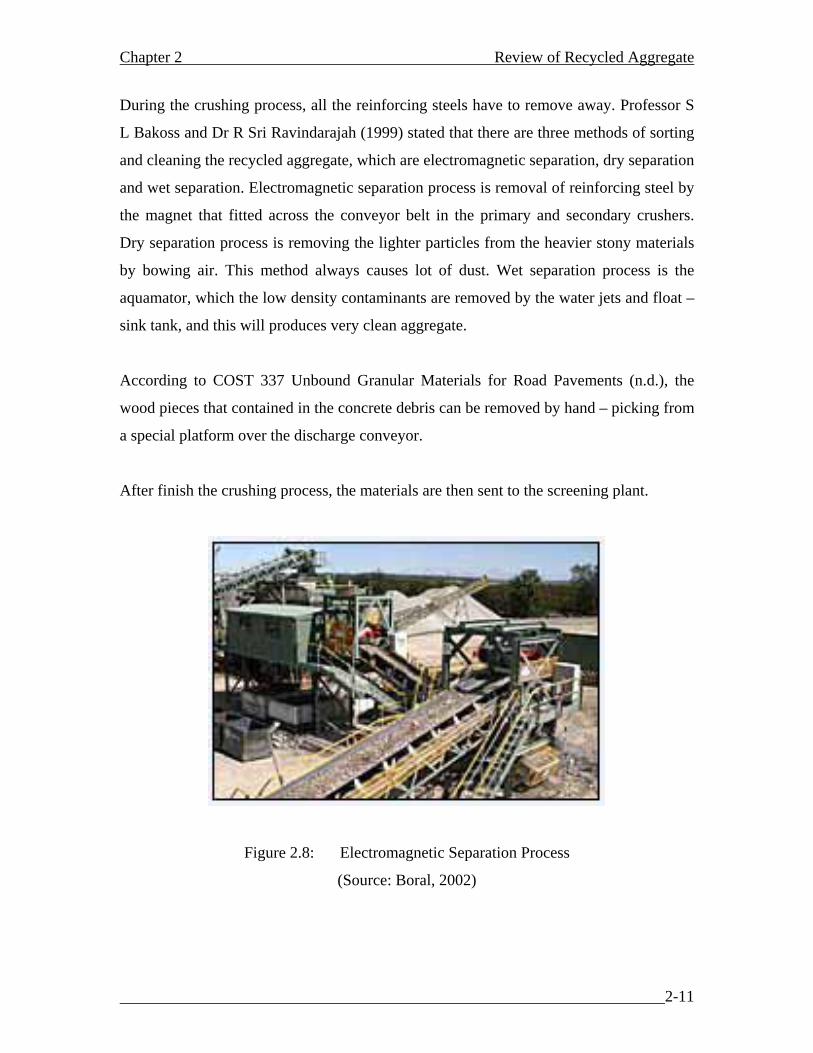
Figure 2.12: Washing Plant
(Source: R. R. Equipment Company, 2003)
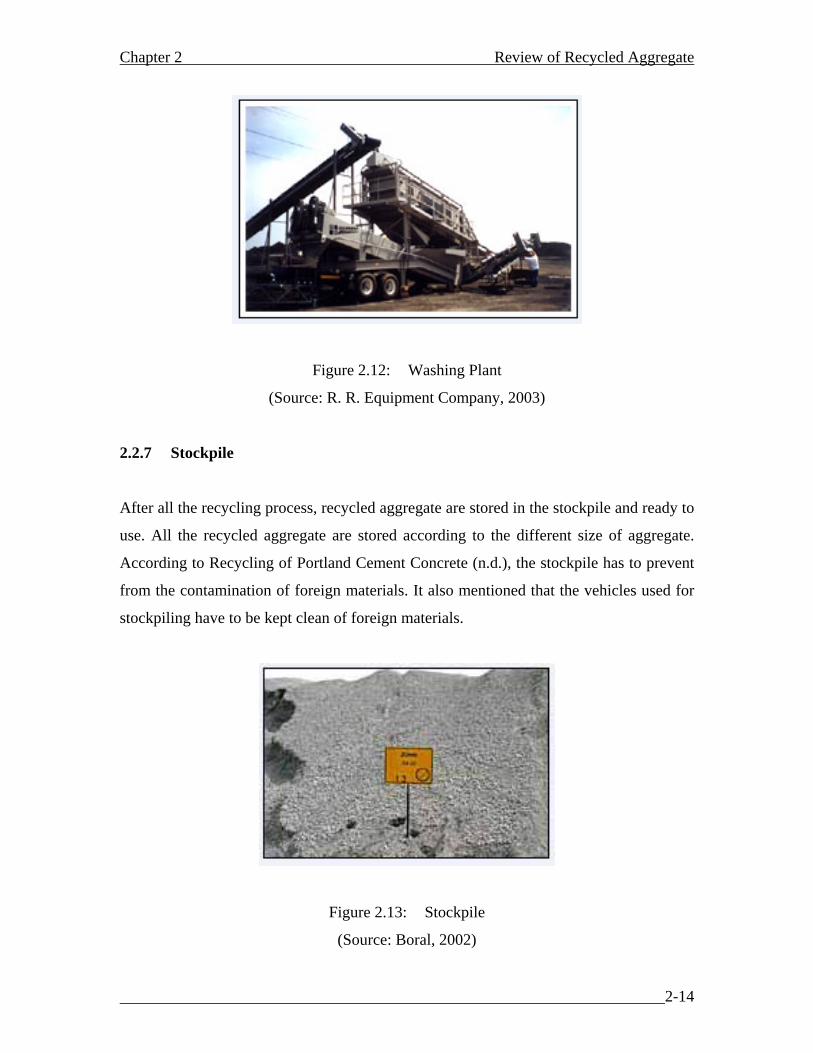
2.2.7 Stockpile
After all the recycling process, recycled aggregate are stored in the stockpile and ready to
use. All the recycled aggregate are stored according to the different size of aggregate.
According to Recycling of Portland Cement Concrete (n.d.), the stockpile has to prevent
from the contamination of foreign materials. It also mentioned that the vehicles used for
stockpiling have to be kept clean of foreign materials.
Figure 2.13: Stockpile
(Source: Boral, 2002)
2-14
Chapter 2 Review of Recycled Aggregate
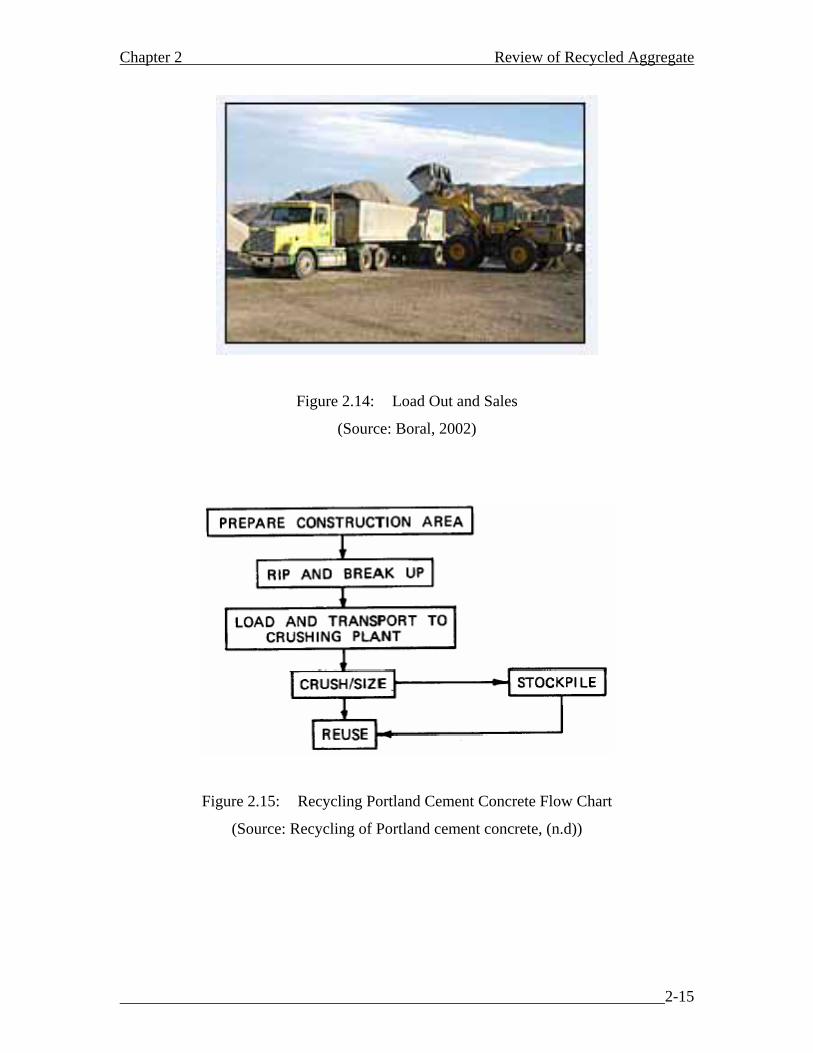
Figure 2.14: Load Out and Sales
(Source: Boral, 2002)
Figure 2.15: Recycling Portland Cement Concrete Flow Chart
(Source: Recycling of Portland cement concrete, (n.d))
2-15
Chapter 2 Review of Recycled Aggregate
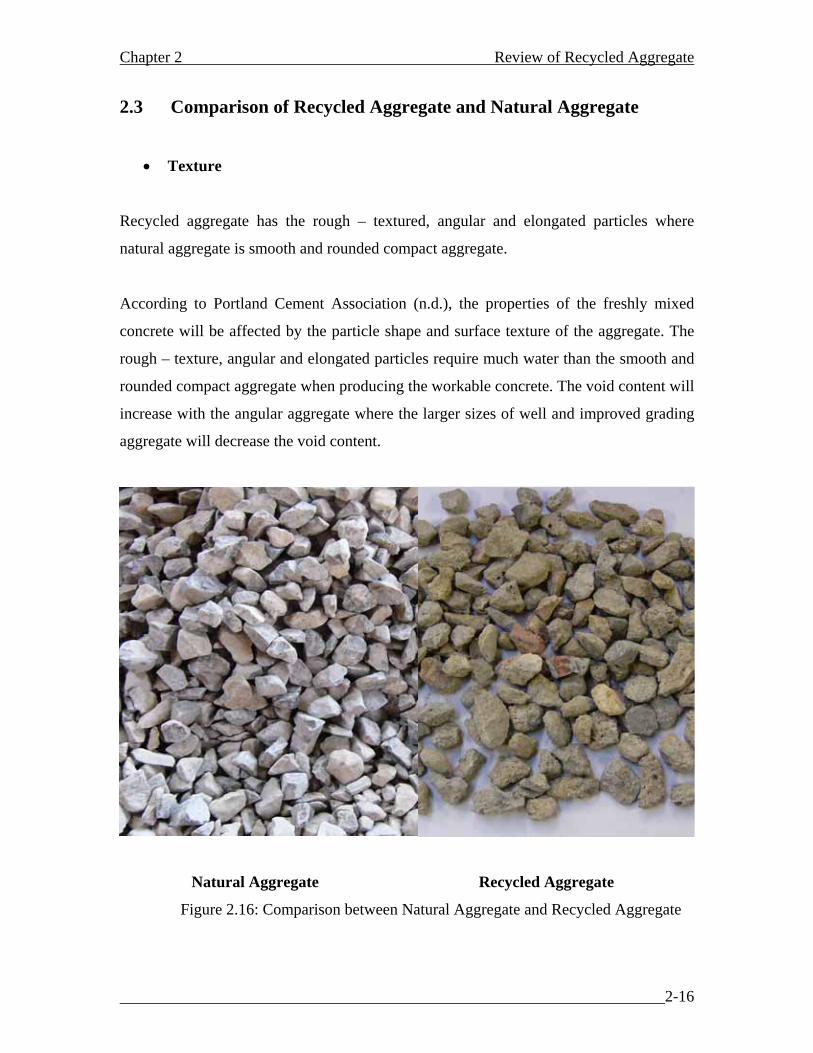
2.3 Comparison of Recycled Aggregate and Natural Aggregate
• Texture
Recycled aggregate has the rough – textured, angular and elongated particles where
natural aggregate is smooth and rounded compact aggregate.
According to Portland Cement Association (n.d.), the properties of the freshly mixed
concrete will be affected by the particle shape and surface texture of the aggregate. The
rough – texture, angular and elongated particles require much water than the smooth and
rounded compact aggregate when producing the workable concrete. The void content will
increase with the angular aggregate where the larger sizes of well and improved grading
aggregate will decrease the void content.
Natural Aggregate Recycled Aggregate
Figure 2.16: Comparison between Natural Aggregate and Recycled Aggregate
2-16

Chapter 2 Review of Recycled Aggregate
• Quality
The quality is different between recycled aggregate and recycled aggregate. According to
Sagoe and Brown (1998), the quality of natural aggregate is based on the physical and
chemical properties of sources sites, where recycled aggregate is depended on
contamination of debris sources. It also stated that natural resources are suitable for
multiple product and higher product have larger marketing area, but recycled aggregate
have limited product mixes and the lower product mixes may restrain the market.
• Density
The density of the recycled concrete aggregate is lower than natural aggregate. Sagoe and
Brown (1998) stated that when compare with natural aggregate, recycled concrete
aggregate have lower density because of the porous and less dense residual mortar lumps
that is adhering to the surfaces. When the particle size is increased, the volume
percentage of residual mortar will increase too.
• Strength
The strength of recycled aggregate is lower than natural aggregate. Sagoe and Brown
(1998) stated that this is due to the weight of recycled aggregate is lighter than natural
aggregate. This is the general effect that will reduce the strength of reinforcement
concrete. Further discussion on the strength of recycled aggregate will be mentioned in
chapter 5.
2-17
Chapter 2 Review of Recycled Aggregate
• Location
Natural aggregate are derived from a variety of rock sources. The processing plant for
natural aggregate depends on the resource. It usually occurs at the mining site and outside
the city.
Recycled aggregate are derived from debris of building constructions and roads. The
locations of recycling plants are depended on where the structures are demolished. The
recycling process is often located in the urban area.
2-18
Chapter 3 Properties and Testing of Aggregate
Chapter 3
Properties and Testing of Aggregate
3.1 Particle Density and Water Absorption of Course and Fine
Aggregate
Particle density is one of the important factors that used to determine the properties of
aggregate. It is required when calculate the mix design for concrete. Australian Standard
HB64 (2002) stated that in the concrete mix, substituting different density of aggregate
would influence the yield, unit mass of concrete and quality of aggregate needed for a
concrete volume. The particle density of aggregate is generally affected by the amount of
moisture present and the geological properties of aggregate. In this project, particle
density of aggregate was carried out to determine the volume and weight of aggregate
needed for the concrete mixes. The determination of particle density was according to
AS1141.5 and AS1141.6.1.
Water absorption is the amount of moisture absorbed in the aggregate. The water
absorption capacity is based on saturated surface dry condition and oven dried condition.
Australian Standard HB64 (2002) mentioned that the amount of water in a concrete mix
has direct effect on the setting time and compressive strength of concrete. It also stated
that moisture content of the aggregate had to determine first before preparing a mix
design for a particular aggregate. If the moisture content of the concrete is not met the
target, then more water have to add to avoid a loss of workability. If the moisture content
exceeds the target, then less water should be added. The determination of water
absorption of aggregate was according to AS1141.5 and AS 1141.6.1.
In this project, determination of particle density and water absorption of aggregate were
based on natural aggregate with grain size of 20mm, 10mm and 7mm, recycled aggregate
3-1
Chapter 3 Properties and Testing of Aggregate
with gain size of 14mm and 5mm, and fine aggregate (sand). All the testing was carried
out in the engineering laboratory of University of Southern Queensland.
3.1.1 Apparatus and Test Procedure of Course Aggregate
The following apparatus and equipments used were complied with AS1141.2.
1. Wire Basket: With a suitable mesh and size, and with wire hangers for suspended
it from the balance.
2. Water Bath: Appropriate size and shape to locate the basket and give a cover of
at least 50mm water above the top of the immersed basket.
3. Balance: Sufficient capacity with a limit performance that not more or less than
5g and have a type which can locate a basket that containing the sample to be
suspended from it and weight in the water.
4. Oven: Thermostatically controlled that gives a temperature of 105ºC to 110ºC.
5. Container: Suitable size for putting the sample.
6. Towels and Dry Cloths: To dry the surface of aggregate.
7. Dishes: Suitable Sizes.
The test procedure was according to AS1141.6.1 – 2000. The procedures were as below:
1. Immersed the aggregate in the water at room temperature with the 20mm height
of water above the top of aggregate. The aggregate was stirred occasionally to
dislodge the air bubbles. The aggregate was immersed for one day (24hours).
3-2

Chapter 3 Properties and Testing of Aggregate
2. The aggregate was transferred to the basket and immersed in the water contained
in a bath below the balance. The basket was jiggled to dislodge the air bubbles.
Then, attached the basket hanger to the balance. The basket and aggregate in the
water was weighted and recorded.
3. The basket and aggregate was then removed from the water and let them to drain.
All the aggregate was transferred to a dish. The aggregate was dried out after
determined the particle density and water absorption.
4. The empty basket was put into the water bath and jiggled to dislodge the air
bubbles. The basket was weighted in the water to the nearest 1g and recorded.
5. Surface dried the aggregate by rolling on a dry cloth. The aggregate was spread
one stone deep over a dry cloth and allowed it to surface dry. Continue drying
until all visible films of water had been removed but the surface of aggregate still
damp.
6. The aggregate was dried in the oven at the temperature of 105ºC to 110ºC to get
the constant mass.
3.1.2 Apparatus and Test Procedure of Fine Aggregate
The following apparatus and equipments used were complied with AS1141.2.
1. Metal Mould: 0.88mm sheet metal, truncated cone shape, 75mm height with
diameter of 90mm decrease to 38mm diameter.
2. Balance: Sufficient capacity with a limit performance that not more or less than
5g.
3. Tamping Rod: A flat circular tamping face with 25mm diameter.
3-3

Chapter 3 Properties and Testing of Aggregate
4. Oven: Thermostatically controlled that gives a temperature of 105ºC to 110ºC.
5. Container: Suitable size for putting the sample.
6. Glass Container and Flask: 400mm diameter and 600mm height glass container
to contain water and a flask of 500mL volumetric flask with a lid.
7. Heater or Drier: Provide gentle flow of warm air.
8. Dishes: Suitable sizes.
The test procedure was according to AS1142.5. The procedures were as below:
1. Immersed the sand in the water at room temperature for a period (24hours). The
aggregate was stirred to dislodge the air bubbles.
2. Drained off the water and the sand was spread on a flat impervious surface. Dried
the sand surface by exposing to a moving current of warm air. Stirred it regularly
until uniform dried. The sand can also dry under the sun for few hours.
3. Filled the sand into a conical mould. Tamped the surface of sand with tamping
tool (25 times). Conical mould was lift vertically. The cone of sand will retain it
shape if free moisture presented. Added more water if the sand was too dry.
4. Continued drying with constant stirring. Repeated step 3 until the cone of sand
slump on the removal of the mould. This mean the sand had reached saturated dry
condition. Weighted and recorded the mass of sand.
5. The sand was placed into a volumetric flask and filled in the water. Weighted and
recorded the mass of sand, flask and water.
3-4

Chapter 3 Properties and Testing of Aggregate
6. Removed the sand from the flask without loosing any particle into a container.
Filled the water into the flask. Weighted and recorded the mass of flask and water.
7. The sand was dried in the oven at the temperature of 105ºC to 110ºC. Weighted
and recorded the mass of sand after 24 hours.
Figure 3.1: Balance for Aggregate Weighting.
3-5

Chapter 3 Properties and Testing of Aggregate
Figure 3.2: Thermostatically Controlled Oven.
3.1.3 Result and Analysis
Table 3.1: Weight of course aggregate in the test.
Types and size of aggregate Natural
20mm
Natural
10mm
Natural
7mm
Recycled
14mm
Recycled
5mm
A, Mass of oven dried aggregate (g) 1445.0 1482.7 1724.5 1133.6 1308.4
B, Mass of SSD aggregate (g) 1463.2 1502.6 1751.8 1196.7 1388.7
C, Mass of aggregate and wire basket in water (g)
1097.6
1125.7
1292.0
846.6
949.1
D, Mass of wire basket in water (g) 135.0 135.0 133.3 133.5 133.5
3-6

Chapter 3 Properties and Testing of Aggregate
• 20mm Natural Aggregate
Bulk Density (dry) = A x 1000 D – (C - B)
= 2886.54 kg/m3
Bulk Density (dry) = B x 1000 D – (C - B)
= 2922.89 kg/m3
Bulk Density (dry) = (B – A) x 100 A
= 1.26 %
• 10mm Natural Aggregate
Bulk Density (dry) = A x 1000 D – (C - B)
= 2896.46 kg/m3
Bulk Density (dry) = B x 1000 D – (C - B)
= 2935.34 kg/m3
Bulk Density (dry) = (B – A) x 100 A
= 1.34 %
3-7

Chapter 3 Properties and Testing of Aggregate
• 7mm Natural Aggregate
Bulk Density (dry) = A x 1000 D – (C - B)
= 2907.60 kg/m3
Bulk Density (dry) = B x 1000 D – (C - B)
= 2953.63 kg/m3
Bulk Density (dry) = (B – A) x 100 A
= 1.58 %
• 14mm Recycled Aggregate
Bulk Density (dry) = A x 1000 D – (C - B)
= 2344.09 kg/m3
Bulk Density (dry) = B x 1000 D – (C - B)
= 2474.57 kg/m3
Bulk Density (dry) = (B – A) x 100 A
= 5.57 %
3-8
Chapter 3 Properties and Testing of Aggregate
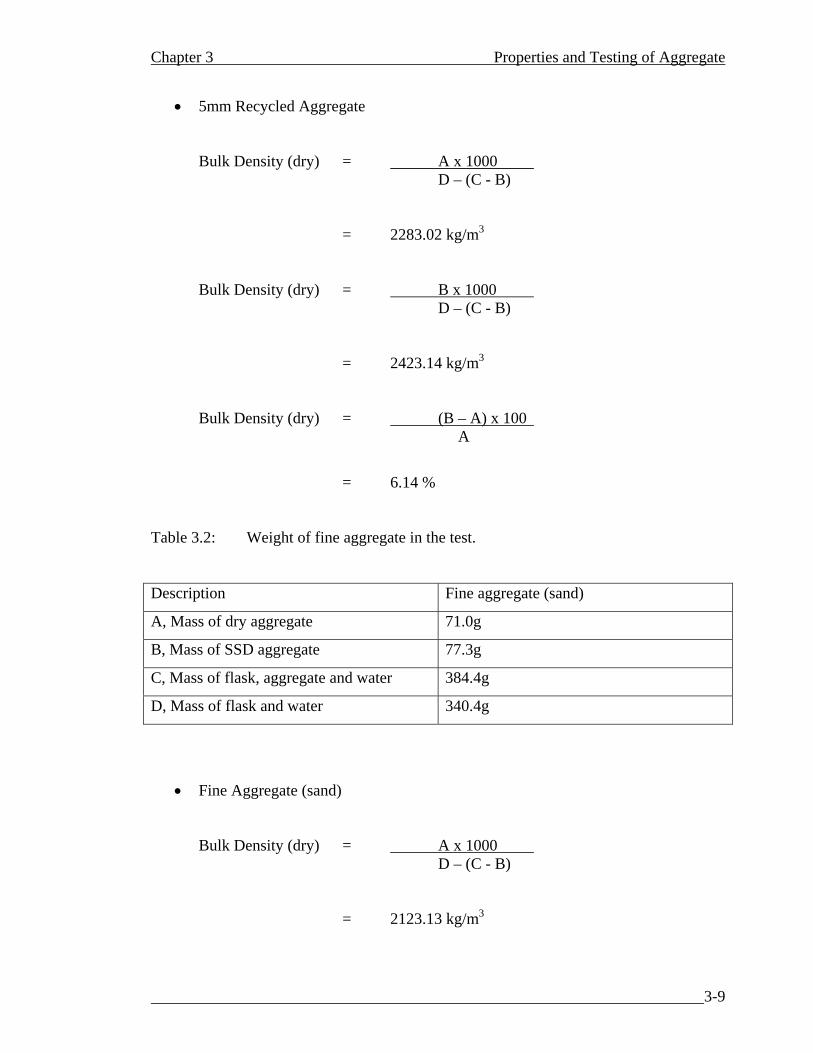
• 5mm Recycled Aggregate
Bulk Density (dry) = A x 1000 D – (C - B)
= 2283.02 kg/m3
Bulk Density (dry) = B x 1000 D – (C - B)
= 2423.14 kg/m3
Bulk Density (dry) = (B – A) x 100 A
= 6.14 %
Table 3.2: Weight of fine aggregate in the test.
Description Fine aggregate (sand)
A, Mass of dry aggregate 71.0g
B, Mass of SSD aggregate 77.3g
C, Mass of flask, aggregate and water 384.4g
D, Mass of flask and water 340.4g
• Fine Aggregate (sand)
Bulk Density (dry) = A x 1000 D – (C - B)
= 2123.13 kg/m3
3-9

Chapter 3 Properties and Testing of Aggregate
Bulk Density (dry) = B x 1000 D – (C - B)
= 2321.32 kg/m3
Bulk Density (dry) = (B – A) x 100 A
= 4.01 %
Table 3.3: Result of particle density and water absorption of all aggregate.
Types and Size of Aggregate
Particle Density (Dry), kg/m3
Particle Density (SSD), kg/m3
Water Absorption, %
20mm natural aggregate 2886.54 2922.89 1.26
10mm natural aggregate 2896.46 2935.34 1.34
7mm natural aggregate 2907.60 2953.63 1.58
14mm recycled aggregate 2344.09 2474.57 5.57
5mm recycled aggregate 2283.02 2423.14 6.14
Fine aggregate (sand) 2132.13 2321.32 4.01
The results shows that fine aggregate has lower density than natural aggregate and
recycled aggregate. There is a difference of 25% among fine aggregate and natural
aggregate. And 5% difference between fine aggregate and recycled aggregate. From the
result, the density of recycled aggregate is lower than natural aggregate. The average
particle density of natural aggregate is 2900kg/m3 but average particle density of recycled
aggregate is only 2300kg/m3. This mean recycled aggregate is lighter than natural
aggregate.
The water absorption capacity of recycled aggregate is higher than natural aggregate and
fine aggregate. The average water absorption rate of recycled aggregate is around 6%, but
water absorption rate of natural aggregate is only 1.4% and fine aggregate is 4%. This
3-10

Chapter 3 Properties and Testing of Aggregate
shows that water absorption of recycled aggregate is around 4 times of natural aggregate
and 1.5 times of fine aggregate. This result shows that more water needed to be added
when using recycled aggregate in the concrete mixing to get an acceptable workability.
3.2 Sieve Analysis
Sieve analysis is used to find the amount of different size of aggregate used in a concrete
mix. It is carried out to let the aggregate pass through a series of sieves. The sieve
analysis can be done either by hand or sieve machine. It is recommended that using sieve
machine will give more accurate result and can use several sieves in one time.
The aggregate was air – dried before carried out the sieve analysis. According to Neville
(1997), this is to avoid lumps of fine particles being classified as large particles and
prevent clogging of the finer sieves. A method called ‘sample reduction’ was carried out,
where the amount of aggregate was reduced from bucket by riffling. The aggregate was
discharged in the riffle and collected in two boxes at the bottom of the chutes. One box
was discharge and the other box was riffled repeatedly until met the specification.
Determination of the sieve analysis was according to AS1141.11.
In this project, sieve analysis was carried out base on course aggregate and fine
aggregate. The sieve sizes for course aggregate was from 19mm to 1.18mm and sieve
sizes for fine aggregate was from 2.36mm to 75µm.
3-11

Chapter 3 Properties and Testing of Aggregate
3.2.1 Apparatus and Test Procedure of Sieve Analysis
The following apparatus and equipments used were complied with AS1141.2
1. Balance: Sufficient capacity with a limit performance that not more or less than
5g of weight.
2. Sieves: Test sieves that complied with AS1152.
3. Brush: With soft and fine broom.
4. Mechanical Sieve Shaker: Good Condition.
5. Riffle: A box with a few parallel vertical divisions.
The test procedure was according to AS1141.11 – 1996. The procedures were as below:
1. The required sieves were placed in the order of decreasing size from top to
bottom. Placed the collected aggregate in the top sieve.
2. The sieves were shacked up and down mechanically with a rate of 100 strokes per
minutes.
3. Force through the aggregate more than 19mm size by hand. Sieve was ended
when no more than 1 percent of aggregate by weight passed from the sieve layer.
4. The mass of the aggregate in each sieve was determined by weighting.
3-12
Chapter 3 Properties and Testing of Aggregate
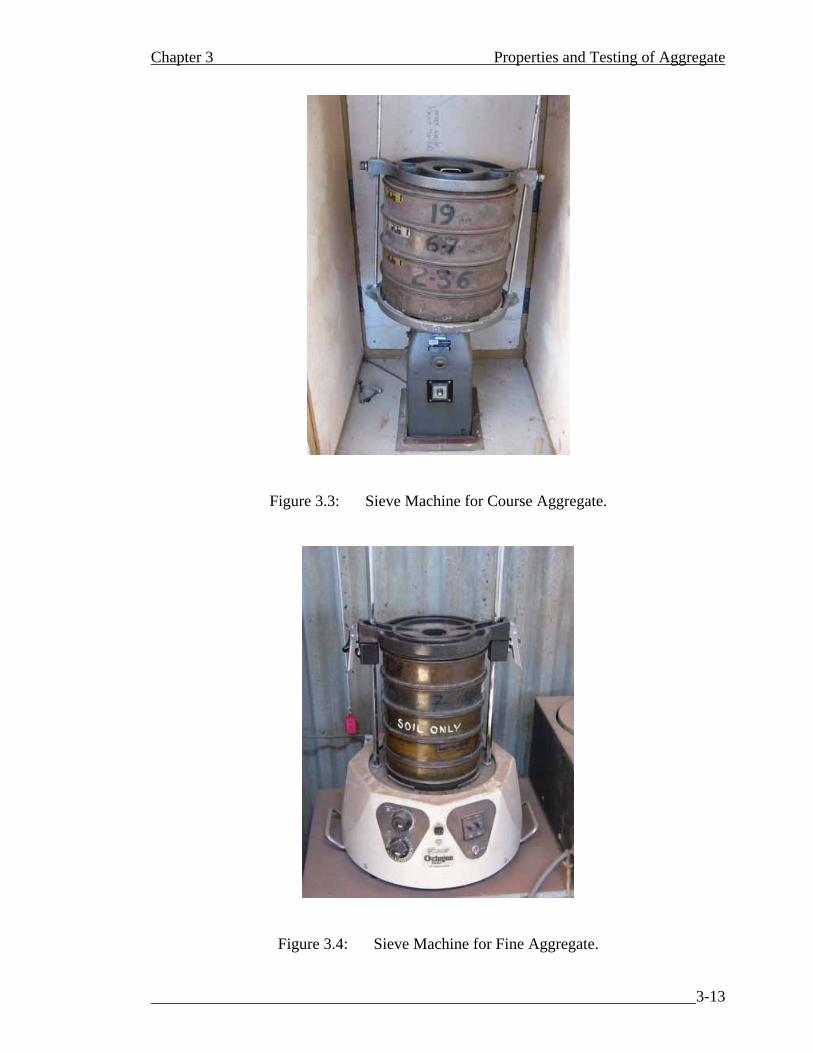
Figure 3.3: Sieve Machine for Course Aggregate.
Figure 3.4: Sieve Machine for Fine Aggregate.
3-13

Chapter 3 Properties and Testing of Aggregate
3.2.2 Result and Analysis
Table 3.4: Percentage sieve size passing for all aggregate.
Percentage passing (%) Natural Natural Natural Recycled Recycled Sieve size
(mm) 20mm 10mm 7mm 14mm 5mm Sand 19.00mm 100.00 100.00 - 100.00 - - 13.20mm 44.48 100.00 - 95.98 100.00 - 9.50mm 8.09 90.51 100.00 29.41 98.51 - 4.75mm 0.53 1.21 18.06 0.23 2.86 - 2.36mm 0.37 0.34 2.09 0.14 0.21 98.86 1.18mm 0.35 0.31 0.75 - 0.19 96.93 600µm - - - - - 90.45 300µm - - - - - 58.54 150µm - - - - - 19.28 75µm - - - - - 4.72 Pan 0.13 0.21 0.57 0.00 0.00 2.80
The result of sieve analysis is an important factor when determine the amount of different
aggregate used in a concrete mix. From the obtained result, most of the natural aggregate
and recycled aggregate passed through 19mm sieve size, but less than 1% of aggregate
passed through 1.18mm sieve size. Almost all the recycled aggregate passed through
13.20mm sieve size, but only 80% of natural aggregate passed through 13.20mm sieve
size. Around 60% of natural aggregate and recycled aggregate passed through 9.50mm
sieve size. Most of the sand particle passed through 600µm sieve size.
3-14

Chapter 3 Properties and Testing of Aggregate
3.3 Mix Design
Before having any concrete mixing, the selection of mix materials and their required
materials proportion must done through a process called mix design. There are lots of
methods for determine concrete mix design. According to Sullivan (2003), the method
called British Method was widely used in Australia. In this project, altogether eight
batches of mixtures were determined in this project.
The initial mix batch will be 100% natural aggregate mix batch. Second mix batch was
80% natural aggregate and 20% recycled aggregate. There was increased of every 20% of
recycled aggregate added into every series of mix batch. To fully compare the different
types of full recycled aggregate concrete, there were three mix batches that contained of
100% recycled aggregate. Two batches of 100% recycled aggregate were used different
water cement ratio and the remaining one batch was mixed with blended cement.
Usage of fly ash cement in construction had gained increasing acceptance by structural
engineers. According to Kelvin (2003), high volume of fly ash concrete mixes may be
used effectively for applications where the surface exposure is minimal. Kelvin (2003)
stated that the difference between fly ash and Portland cement is the fly ash particles are
spherical in shape, which allowed them to flow and blend freely in mixture. This
capability is one of the properties that make fly ash as a desirable admixture for concrete.
He also stated that the spherical shape of fly ash creates a “ball bearing”, which improved
the workability of concrete mixes without assign more water. The spherical shape of fly
ash also improves the consolidation of concrete. Other benefits that can obtain through
usage of fly ash in concrete are resistance to corrosion of concrete reinforcement, attack
from Alkali – silica reaction, sulfate attack, and salt attack.
3-15
Chapter 3 Properties and Testing of Aggregate
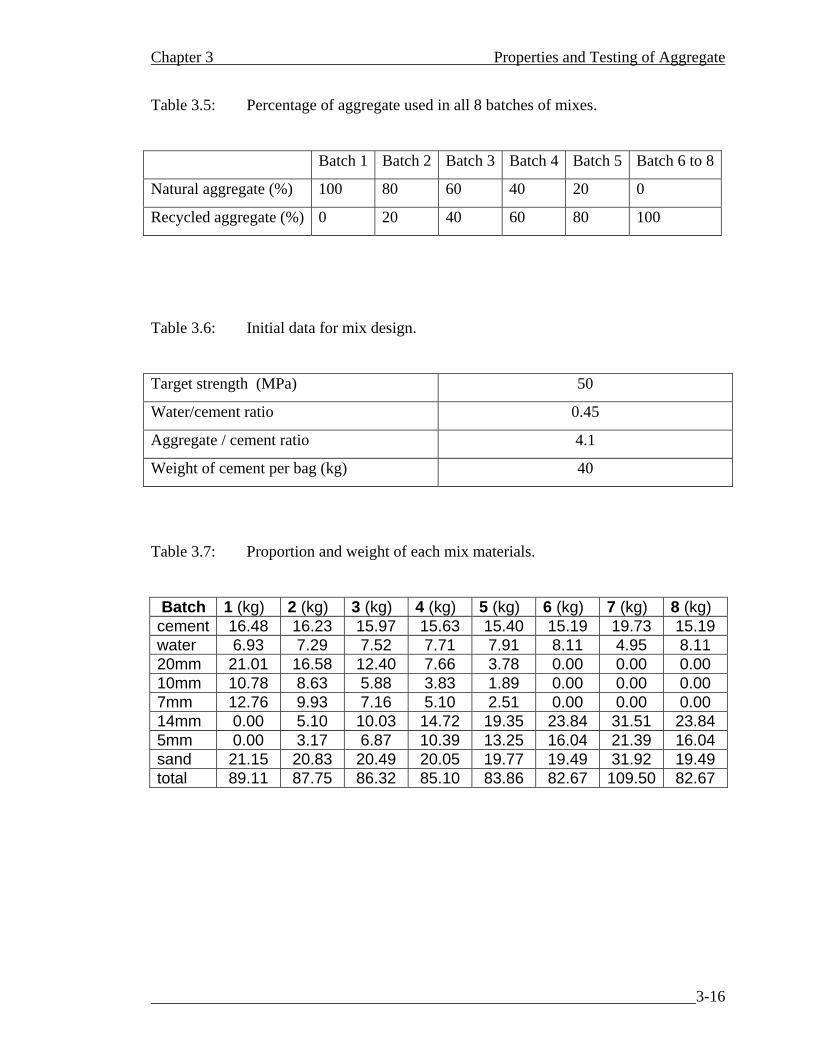
Table 3.5: Percentage of aggregate used in all 8 batches of mixes.
Batch 1 Batch 2 Batch 3 Batch 4 Batch 5 Batch 6 to 8
Natural aggregate (%) 100 80 60 40 20 0
Recycled aggregate (%) 0 20 40 60 80 100
Table 3.6: Initial data for mix design.
Target strength (MPa) 50
Water/cement ratio 0.45
Aggregate / cement ratio 4.1
Weight of cement per bag (kg) 40
Table 3.7: Proportion and weight of each mix materials.
Batch 1 (kg) 2 (kg) 3 (kg) 4 (kg) 5 (kg) 6 (kg) 7 (kg) 8 (kg) cement 16.48 16.23 15.97 15.63 15.40 15.19 19.73 15.19 water 6.93 7.29 7.52 7.71 7.91 8.11 4.95 8.11 20mm 21.01 16.58 12.40 7.66 3.78 0.00 0.00 0.00 10mm 10.78 8.63 5.88 3.83 1.89 0.00 0.00 0.00 7mm 12.76 9.93 7.16 5.10 2.51 0.00 0.00 0.00 14mm 0.00 5.10 10.03 14.72 19.35 23.84 31.51 23.84 5mm 0.00 3.17 6.87 10.39 13.25 16.04 21.39 16.04 sand 21.15 20.83 20.49 20.05 19.77 19.49 31.92 19.49 total 89.11 87.75 86.32 85.10 83.86 82.67 109.50 82.67
3-16

Chapter 3 Properties and Testing of Aggregate
3.4 Mixing of Concrete
The performance of the recycled aggregate concrete was influenced by the mixing. This
means that a proper and good practice of mixing can lead a better performance and
quality of the recycled aggregate concrete. The quality of the concrete also can influence
by the homogeneity of the mix material during the mixing and after the placement of
fresh concrete. A proper mix of concrete is encouraged to the strength of concrete and
better bonding of cement with the aggregate.
Once the concrete mix design was calculated, the mixing of the concrete can be carried
out. The mixing of recycled aggregate concrete was carried out with an electrical 60 litres
pan mixer, which was conducted in the concrete laboratory of University of Southern
Queensland. Before the concrete mixing begins, all of the mix materials were weighted
and prepared according to the mix design.
3.4.1 Apparatus and Test Procedure of Mixing
The apparatus and equipments used for mixing were as below:
1. Mixer: A pan mixer with capacity of 60 litres mixing.
2. Buckets: Suitable size of buckets for containing the materials before mixing.
3. Wheel Barrier: A suitable size of wheel barrier to contain the fresh concrete for
workability tests and also place the fresh concrete into the moulds.
The test procedure for the process of mixing was as below:
1. All of the material was weighted and prepared according to the mix design.
2. Before the mixing begins, the surface of the mixer was damped with a wet cloth.
3-17

Chapter 3 Properties and Testing of Aggregate
3. All of the aggregate were added into the mixer till the aggregate uniformly
distributed throughout the mixer.
4. The cement was poured into the mixer after the aggregate were added.
5. The water was added into the mixer slowly while the mixing of the aggregate and
cement was going on.
6. The concrete was mixed approximately 3 minutes after the water was added.
7. The mixer was off after 3 minutes of mixing.
8. The handle of the mixer was opened to allow the concrete to fill into the wheel
barrier for workability test and casting of concrete.
Figure 3.5: Horizontal Pan Mixer
3-18

Chapter 3 Properties and Testing of Aggregate
3.5 Placing, Compaction and Casting of Concrete Specimens
Before the placing of concrete, the concrete mould must be oiled for the ease of concrete
specimens stripping. The oil used is a mixture of diesel and kerosene. Special care was
taken during the oiling of the moulds, so that there no concrete stains and left on the
moulds. Once the workability test of recycled aggregate concrete was done, the fresh
concrete must placed into the concrete moulds for hardened properties tests. Every batch
of recycled aggregate concrete required 15 small cylinders and 2 large cylinders. The
dimensions of small cylinder were 100mm diameter by 200mm height, while the large
cylinder was 150mm diameter by 300mm height.
During the placing of fresh concrete into the moulds, vibrations were done using an
immersion vibration. The vibration of concrete allows full compaction of the fresh
concrete to release any entrained air voids contained in the fresh concrete. If the concrete
specimens were not compact in a proper manner, the maximum strength of the concrete
cannot be achieved. The vibration was done every sufficient one third layer of the fresh
concrete was poured into the moulds. It is found that the placing and compacting of
concrete is getting difficult when the percentage of recycled aggregate increased. This
shows that the workability of recycled aggregate used in the concrete is very poor.
The levelling of concrete was done on the surface of the concrete. Levelling is the initial
operation carried out after the concrete has been placed and compacted. After the
levelling of the fresh concrete specimen was done, the concrete in the mould was left
overnight to allow the fresh concrete to set.
3-19

Chapter 3 Properties and Testing of Aggregate
Figure 3.6: Cylinder Moulds for the Concrete Specimens.
Figure 3.7: Vibrator for Fresh Concrete Compaction.
3-20

Chapter 3 Properties and Testing of Aggregate
3.6 Stripping and Curing of Concrete Specimens
After leaving the fresh concrete in the moulds to set overnight, the concrete specimens in
the moulds were stripping. The identification of concrete specimens was done and the
moulds were cleaned and oiled for the next batch of concrete mix. All concrete specimens
were placed into the curing room with a controlled temperature of 25ºc in further for 28
days for the hardened properties test of recycled aggregate concrete.
Curing is an important process to prevent the concrete specimens from losing of moisture
while it is gaining its required strength. Lack of curing will tends to lead the concrete
specimen to perform less well in its strength required. Inadequate curing will cause the
unexpected cracks appear on the concrete specimens. After 28 days of curing, the
concrete specimens were removed from the curing room to conduct hardened properties
test of recycled aggregate concrete. However, the small cylinders were taken out at the
required day for the compressive test.
Figure 3.8: Curing Room for Concrete Specimens.
3-21

Chapter 3 Properties and Testing of Aggregate
3.7 Summary
It shows that the mix design depends on the variables of aggregate/cement ratio, water
absorption, particles density and proportioning of the aggregates. It seems that volume of
aggregate for each mix batches were different.
Once the fresh concrete was mixed, the workability test of the fresh concrete will be
conduct. Moreover, after required days of the concrete specimens were cured, the
compression test was conducted on day 1, 3, 7, 14 and 28. On day 28, the indirect tensile
test and modulus of elasticity test will be conducted. All the test procedures and methods
on workability and hardened properties were discussed in chapter 4.
3-22

Chapter 4 Experimental Methodology
Chapter 4
Experimental Methodology
4.1 Introduction
This chapter discussed on the testing procedure for the workability test and hardened
concrete specimens test. Workability test included slump test and compacting factor test.
Hardened concrete specimens tests included compression test, indirect tensile test and
modulus of elasticity.
4.2 Workability Tests of Fresh Concrete
Sabaa and Ravindrarajah (1999) had mentioned that workability is a very important
property of concrete which will affect the rate of placement and the degree of compaction
of concrete.
Cement Association of Canada (2003) stated that the workability is the ease of placing,
combining and finishing freshly concrete mixed and the degree to which it resists
segregation.
According to Cement Manufacturer’s Association India (n.d), a good concrete must has
workability in the fresh state and also develop sufficient strength. It also mentioned that
there are four factors that can affect the workability. They are as below:
1. Consistency: The degree of consistency is depended on the nature of works and
type of compaction.
4-1

Chapter 4 Experimental Methodology
2. Water/cement Ratio or Water Control of a concrete: Water/cement ratio is the
ratio of water in a mix to the weight of cement. The quality of water that required
for a mix is depended on the mix proportions, types and grading of aggregate.
3. Grading of Aggregate: The smooth and rounded aggregate will produce a more
workable concrete than the sharp angular aggregate.
4. Cement Content: The greater workability can be obtained with the higher cement
content.
This chapter will describe two types of test produce and workability tests. The tests are
slump test and compacting test. Results and analysis of the results are also discussed in
this chapter.
4.2.1 Slump Test
Slump test is used to determine the workability of fresh concrete. The test is simple and
cheap. It is suitable to use in the laboratory and also at site. Although the test is simple,
but the testing has to be done carefully due to a huge slump may obtain if there is any
disturbance in the process.
Logic Sphere (n.d.) mentioned that the slump test will give a reasonable indication of
how easily a mix can be places although it does not directly measure the work needed to
compact the concrete. It also mentioned that a slump less than 25mm will indicate a very
stiff concrete and a slump that more than 125mm will indicates a very runny concrete.
Australia Standard (2002) stated that slump test will not indicate well for the concrete
with very high workability and also very low workability. This is because a very high
workability concrete will lose the shape by flowing and collapse, where a very low
workability concrete will not collapse.
4-2

Chapter 4 Experimental Methodology
4.2.1.1 Apparatus and Test Procedure of Slump Test
The following apparatus and equipments used were complied with the AS 1012.3.1 –
1998.
1. Mould: A hollow frustum of a cone that made from galvanized steed sheet. The
thickness is between 1.5mm to 2mm. The mould has a foot piece, and handles on
outer surface, and smooth internal surface. The bottom diameter of the mould is
200mm, the top diameter of the mould is 100mm and the vertical diameter of the
mould is 300mm.
2. Rod: A metal rod of 16mm diameter, 600mm long and having a 25mm height of
spherical shape at one end with a radius of 5mm.
3. Base plate: A 3mm thickness of a smooth, rigid and non absorbent material base
metal plate.
4. Scoop: A suitable size to carry the aggregate of concrete.
5. Ruler: A suitable steel ruler to measure the height of slump.
4-3

Chapter 4 Experimental Methodology
Figure 4.1: The Apparatus for Slump Test
The test procedure was according to the AS 1012.3.1 – 1998. The procedures were as
below:
1. Before the test, the internal surface of the mould was cleaned and moistened with
a damp cloth.
2. The mould was placed on a smooth and horizontal surface that free from vibration
or shock. While the mould was being filled, it was hold firmly by standing on the
foot pieces.
4-4

Chapter 4 Experimental Methodology
3. The mould was filled in three layers. Each layer was around one – third of the
height of the mould. Each layer was being rod with 25 strokes of rounded end of
the rod. Each stroke has rod in a uniform manner that over the cross section of the
mould.
4. The surface concrete was rolled off after the top layer has been rod. Then, remove
the mould immediately by raising it slowly and carefully in the vertical direction.
5. Measured the height of slump immediately. It was determined between the height
of the mould and the average height of the top surface of the concrete.
Figure 4.2: Typical Slump Test
4-5

Chapter 4 Experimental Methodology
4.2.2 Compacting Factor Test
Compacting factor test also used to determine the workability of fresh concrete. It is not
used on site testing because the apparatus is very heavy. According to Streetworks Info
(n.d.), the compacting factor test gives a more accurate workability of fresh concrete than
slump test. It mentioned that the compacting factor test also known as the “drop test”,
which measures the weight of fully compacted concrete and compare it with the weight
of partially compacted concrete.
All the procedures for the compacting factor test is carried out by according to the AS
1012.3.2 – 1998.
Figure 4.3: The Apparatus for Compacting Factor Test
4-6

Chapter 4 Experimental Methodology
4.2.2.1 Apparatus and Test Procedure of Compacting Factor Test
The following apparatus and equipments used were complied with the AS 1012.3.2 –
1998.
1. Compacting Factor Apparatus: It consists of two conical hoppers mounted above
a cylinder. The hoppers and cylinder are made from the rigid materials that not
readily attack by cement paste. The rim of the cylinder is perpendicular from the
plane surface to its axis. The frame that the hoppers and cylinder mounted shall be
rigid construction and locate in the right construction and locate in the right
position. The cylinder has to be easy to take off from the frame.
2. Trowels: There are two trowels are required.
3. Scoop: A suitable size of scoop to take the increments of concrete.
4. Rod: A metal rod of 16mm in diameter, 600mm long and having a 25mm height
of spherical shape at one end with a radius of 5mm.
5. Balance: A balance that capable of weighing to an accuracy of 0.1percent in the
operation range.
6. Level: A suitable level is required.
4-7

Chapter 4 Experimental Methodology
Figure 4.4: Standard Compacting Factor Apparatus
(Source: AS1012.3.2, 1998)
4-8

Chapter 4 Experimental Methodology
The test procedure was according to the AS 1012.3.2 – 1998. The procedures were as
below:
1. Before the test, the internal surface of the mould was cleaned and moistened with
a damp cloth.
2. The apparatus was placed on a level rigid surface that free from vibration or
shock.
3. The concrete was placed in the upper hopper until the hopper is filled. Opened the
trapdoor and let the concrete fell into the lower hopper.
4. Opened the trapdoor of the lower hopper and let the concrete fell into the cylinder.
5. Cut off the concrete that excess the level of the cylinder by holding a towel in
each hand.
6. The mass (M1) of concrete in the cylinder was determined (Mass of the partially
compacted concrete) and recorded.
7. The cylinder was empty and filled with the concrete again in the layers around
50mm deep. Each layer was rod with the metal rod, until compaction was
achieved.
8. The mass (M2) of concrete in the cylinder was determined again (Mass of fully
compacted concrete) and recorded.
4-9

Chapter 4 Experimental Methodology
The compacting factor was determined from the following equation:
Compacting Factor = Mass of partially compacted concrete (M1)
Mass of fully compacted concrete (M2)
4.3 Testing on Hardened Concrete Specimens
Concrete is a combination of Portland cement, water and aggregate that consists of rocks
and sand. Normally, concrete is strong in compression but weak in tension.
There are many ways that we can used to indicate the strength of concrete, according to
University of Florida (n.d.), the tests used to indicate the strength of concrete can be
categorized as destructive and non – destructive tests.
The testing for the strength if concrete is very important in the civil works. University of
Florida (n.d.) also mentioned that the engineers can compare the value of the testing to
the designed value used for the building structure. This is to make sure that the structure
was built well.
This chapter consists of three types of hardened concrete testing. They are compression
test, indirect tensile test and modulus of elasticity. All the procedure used was according
to the Australia Standard Code.
4-10

Chapter 4 Experimental Methodology
4.3.1 Compression Test
According to Cement Association of Canada (2003), compressive strength of concrete
can be defined as the measured maximum resistance of a concrete to axial loading.
Compression test is the most common test used to test the hardened concrete specimens
because the testing is easy to make. The strength of the concrete specimens with different
percentage of recycled aggregate replacement can be indicating through the compression
test.
The specimens used in the compression test were 100mm diameter and 200mm height.
There are three specimens were used in the compression testing in every batches.
Differences of the strength among the different percentage of recycled aggregate used in
the age of 1, 3, 7, 14, and 28 days also indicated through the compression test. The
compression test was carried out in the engineering laboratory of University of Southern
Queensland. The compression testing procedures was according to the Australia Standard
Code.
4.3.1.1 Apparatus and Test Procedure of Compression Test
The apparatus and equipments used in the compression test were according to AS 1012.9
– 1999.
1. Testing Machine: ‘Avery’ testing machine.
2. Rubber Cap: A suitable diameter of rubber cap.
3. Ruler: 400mm long ruler to measure the height of specimen.
4. Balance: To measure the weight of the concrete specimens.
5. Vernier Caliper: To measure the diameter of the concrete specimens.
4-11

Chapter 4 Experimental Methodology
The test procedure was according to the AS 1012.9 – 1999. The procedures were as
below:
1. The testing for the specimens should be carried out as soon as possible after took
out from the curing room. The specimens need to get the measurements before the
testing.
2. The diameter and height of the specimens were measured and recorded. The
weight of each specimen was measured and recorded too.
3. The platens of the testing machine were cleaned with a clean rag.
4. Cleaned the uncapped surface of the specimen and place the specimen in the
testing machine. The axis of the specimen was aligned with the centre of the
thrust of the spherically seated platen.
5. Carefully placed the rubber cap on the specimen.
6. The platen was lowered to the rubber cap until the uniform bearing was obtained.
7. The force was applied and increased continuously at a rate equivalent to 20MPa
compressive stress per minute until the specimen failed.
8. Recorded the maximum force from the testing machine.
4-12

Chapter 4 Experimental Methodology
Figure 4.5: Setup of Compression Test
4.3.2 Indirect Tensile Test
Normally, concrete is very strong in compression but weak in tension. Indirect tensile test
is used to indicate the brittle nature of the concrete specimens that contained of different
percentage of recycled aggregate replacement. Indirect tensile test also called as the
Brazil of splitting test. According to the Composition and Properties of Concrete (n.d.),
the indirect tensile test will give more uniform results than other tension tests. It also
mentioned that the result obtained by the indirect tensile test is closer to the true tensile
strength of concrete than the modulus of rupture.
The indirect tensile test was just carried out after 28days of casting. It is because once the
concrete specimens reach day 28, the increased rate of concrete stress was uniform and
there is not much stress increased after 28days.
The testing specimen was 150mm diameter and 300mm length. Two specimens were
used in the testing for every batch. The indirect tensile test was carried out in the
4-13

Chapter 4 Experimental Methodology
University of Southern Queensland engineering laboratory. All the testing procedures
were according to the Australia Standard Code.
4.3.2.1 Apparatus and Test Procedure of Indirect Tensile Test
The following apparatus and equipments used in the indirect tensile test were according
to the AS 1012.10 – 1999.
1. Testing Machine: ‘Avery’ testing machine.
2. Testing Jig: An appropriate size of steel jig.
3. Supplementary Bearing Bar or Plate: Width of 50mm and thickness of 20mm.
4. Bearing Strips: Two grade hardboard widths of 5mm thick, 25mm wide and
300mm long.
5. Ruler: 400mm long, to measure the height of the concrete specimens.
6. Vernier Caliper: To measure the diameter of the concrete specimens.
The test procedure is according to the AS 1012.10 – 1999. The procedures were as below:
1. Measured the diameter and length of the specimen. Recorded the measurements.
2. Placed the specimen on the testing jig. Bearing strips were aligned on the top and
bottom of the specimen and placed the bearing plate outside the bearing strips.
3. Applied a small initial force and the side constrain was removed.
4. Applied the force without shock and increased continuously at a constant rate of
15MPa.
4-14

Chapter 4 Experimental Methodology
5. Recorded the maximum force from the testing machine when the specimen failed.
Figure 4.6: Setup of Indirect Tensile Test
4.3.3 Modulus of Elasticity
Modulus of elasticity of concrete is a very important property to determine the deflection
of the structural elements. According to Cement Association of Canada (2003), deflection
of concrete beams and slabs is a common building movement. It also mentioned that the
deflection is the result of the flexural strains that develop under dead and live loads and
this may occur cracking in the tensile zone.
The modulus of elasticity testing is used to determine the deflection of the concrete
specimens that having different percentage of recycled aggregate replacement. The
testing is just carried out after 28 days of casting. The resting specimen was 150mm
diameter and 300mm height. The modulus of elasticity test was carried out in the
University of Southern Queensland engineering laboratory.
4-15

Chapter 4 Experimental Methodology
4.3.3.1 Apparatus and Test Procedure of Modulus of Elasticity Test
The apparatus and equipments used were as below:
1. Testing Machine: ‘Avery’ testing machine.
2. Strain Measuring Equipment.
The test procedure was according to the AS 1012.17 – 1999. The procedures were as
below:
1. All of the measurement on the diameter and height of the concrete specimens was
measured using Vernier Caliper and recorded in the record book.
2. Using the data from compressive test, the maximum load was estimated by
multiplying the cross sectional area of the modulus of elasticity’s concrete
specimen to the average compressive strength from compressive strength test of
particular batch.
3. Once the maximum load for each specimen was determined, the 60% of estimated
ultimate load was obtained for the requirement for modulus of elasticity test.
4. The load meter of ‘Avery’ test machine was marked at every 25kN of load
interval with a red marker pen until the 60% of estimated ultimate load.
5. The strain-measuring equipment was set at the concrete specimen.
6. Once the strain-measuring equipment was placed, the screws on top and bottom of
the equipment were loosened. Consequently, the hollow bars in between the top
and bottom were taken away.
4-16

Chapter 4 Experimental Methodology
7. The concrete specimen with the strain-measuring equipment was positioned at the
‘Avery’ test machine with care.
8. Rubber capping was placed on the rough surface of the concrete specimen.
9. The loading platen of the test machine was brought to the top of the specimen. A
seating load was applying with not exceeding 100N to the top of the rubber
capping.
10. The concrete specimen was checked and placed firmly on the test machine and in
between the top and bottom steel platens. Once, this check was done, the strain
gauges was set to zero to eliminate zero detects.
11. Applied the force without shock and increased continuously at a constant rate of
15MPa.
12. Recorded the force that applied at every 25kN. Stop the testing when the force
had reached the estimated ultimate load.
Figure 4.7: Setup of Modulus of Elasticity
4-17

Chapter 4 Experimental Methodology
4.4 Summary
It shows that all the test procedures and methods are according to Australia Standard. Due
to the records of the test results, it was found that test machine and human error may
affect the accuracy of the results. To overcome these problems, all the test specimens
were tested to obtain its average values. The results of each testing and each discussion
will be discussed in chapter 5.
4-18

Chapter 5 Tests Results and Analysis
Chapter 5
Tests Results and Analysis
5.1 Introduction
Series of test was carried out on the concrete cylinder to obtain the strength
characteristics of recycled aggregate for potential application in high strength structural
concrete. This chapter discuss on the results that obtained from the testing. The results are
such as slump test, compacting factor test, compression test, indirect tensile test and
modulus of elasticity.
5.2 Slump Test Result and Analysis
The slump test indicates a decreasing trend of workability when the percentage of
recycled aggregate increased. Table 5.1 below shows the average slump recorded during
the test. Figure 5.1 below shows a graphical representation of slump height.
Table 5.1: The slump result for each batch of mix concrete
Percentage of Recycled Aggregate (%) Slump (mm)
0% recycled aggregate 90
20% recycled aggregate 85
40% recycled aggregate 85
60% recycled aggregate 82
80% recycled aggregate 81
100% recycled aggregate (with 0.43 water/cement ratio) 78
100% recycled aggregate (with 0.36 water/cement ratio) 64
100% recycled aggregate (with fly ash cement) 80
5-1

Chapter 5 Tests Results and Analysis
0
20
40
60
80
100
0 20 40 60 80 100
Percentage of Recycled Aggregate (%)
Slum
p H
eigh
t (m
m)
0.36 water cement ratio
0.43 water cement ratio
fly ash cement
Figure 5.1: Graph showing the result of Slump Test
According to the result, the highest slump obtained was 90mm and the lowest slump was
64mm. The average slump for each batch of mix was 82mm. Therefore, target slump had
been achieved, where the range is from 50mm to 120mm.
The workability was good and can be satisfactorily handle for 0% recycled aggregate to
80% recycled aggregate. The slump from 0% recycled aggregate to 80% recycled
aggregate were considered moderate due to the drop in the range of 5mm to 9mm.
The average slumps that obtained for 100% recycled aggregate (with 0.43 water cement
ratio) and 100% recycled aggregate (with fly ash cement) was 79mm. There was no
problem for the placement and compaction of fresh concrete in these two batches. The
only problem that obtained was the batch with 100% recycled aggregate (with 0.36 water
cement ratio). The workability was very low due to the slump was just 64mm. The reason
was because of the high absorption capacity of recycled aggregate.
From the result obtained, it shows that the workability was getting lower when more
recycled aggregate were used.
5-2
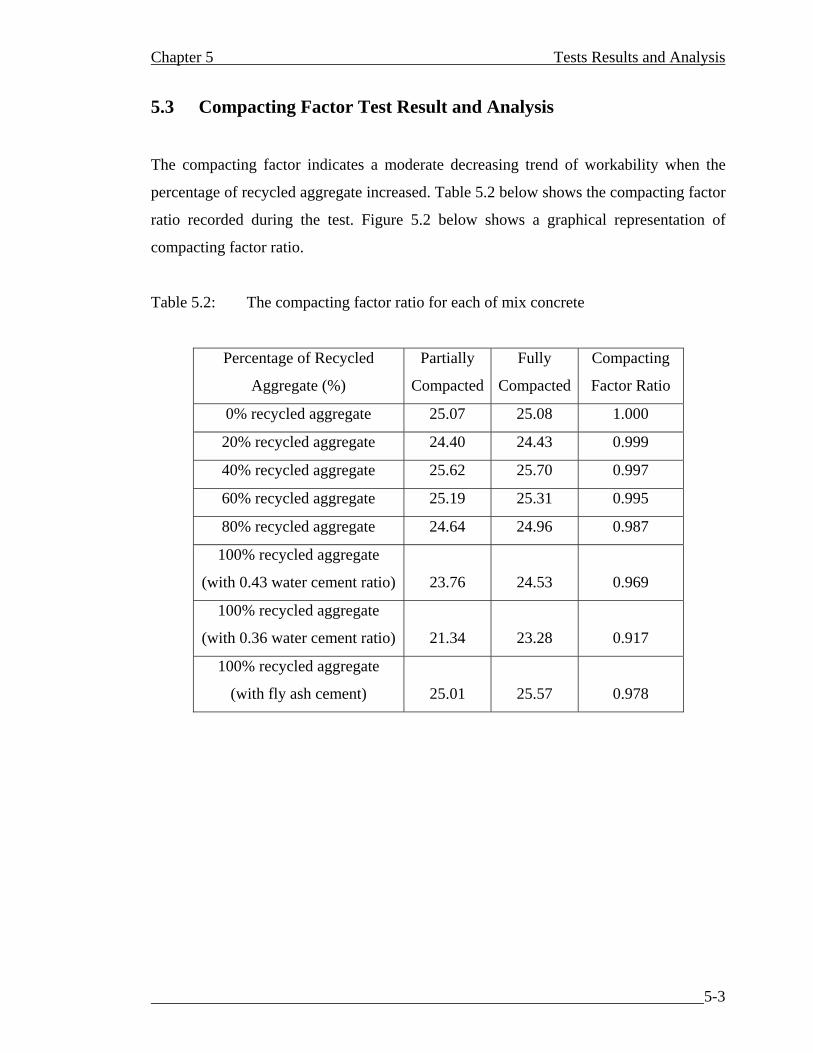
Chapter 5 Tests Results and Analysis
5.3 Compacting Factor Test Result and Analysis
The compacting factor indicates a moderate decreasing trend of workability when the
percentage of recycled aggregate increased. Table 5.2 below shows the compacting factor
ratio recorded during the test. Figure 5.2 below shows a graphical representation of
compacting factor ratio.
Table 5.2: The compacting factor ratio for each of mix concrete
Percentage of Recycled
Aggregate (%)
Partially
Compacted
Fully
Compacted
Compacting
Factor Ratio
0% recycled aggregate 25.07 25.08 1.000
20% recycled aggregate 24.40 24.43 0.999
40% recycled aggregate 25.62 25.70 0.997
60% recycled aggregate 25.19 25.31 0.995
80% recycled aggregate 24.64 24.96 0.987
100% recycled aggregate
(with 0.43 water cement ratio)
23.76
24.53
0.969
100% recycled aggregate
(with 0.36 water cement ratio)
21.34
23.28
0.917
100% recycled aggregate
(with fly ash cement)
25.01
25.57
0.978
5-3

Chapter 5 Tests Results and Analysis
0.86
0.88
0.9
0.92
0.94
0.96
0.98
1
1.02
0 20 40 60 80 100
Percentage of Recycled Aggregate (%)
Com
pact
ing
Fact
or R
atio fly ash cement
0.43 water cement ratio
0.36 water cement ratio
Figure 5.2: Graph showing the result of Compacting Factor Ratio
Figure 5.2 shown that the compacting factor ratio is decreasing as the percentage of
recycled aggregate increased. The result is very similar to the result of slump test. The
highest compacting factor ratio is 1.000 and the lowest is 0.917.
The average of compacting factor ratio for 0% recycled aggregate to 80% recycled
aggregate is 0.996. The average of compacting factor ratio for 100% recycled aggregate
(with 0.43 water cement ratio) and 100% recycled aggregate (with fly ash cement) is
0.973. There is no problem in handle and compact the fresh concrete in these batches.
The lowest workability is the batch with 100% recycled aggregate (with 0.36 water
cement ratio), which is 0.917. This is the batch that problem occurred during the handling
and compaction of fresh concrete. The reason is due to the high absorption capacity of
recycled aggregate.
From the result obtained, we can say that the workability is getting lower due to the
increasing of recycled aggregate used.
5-4
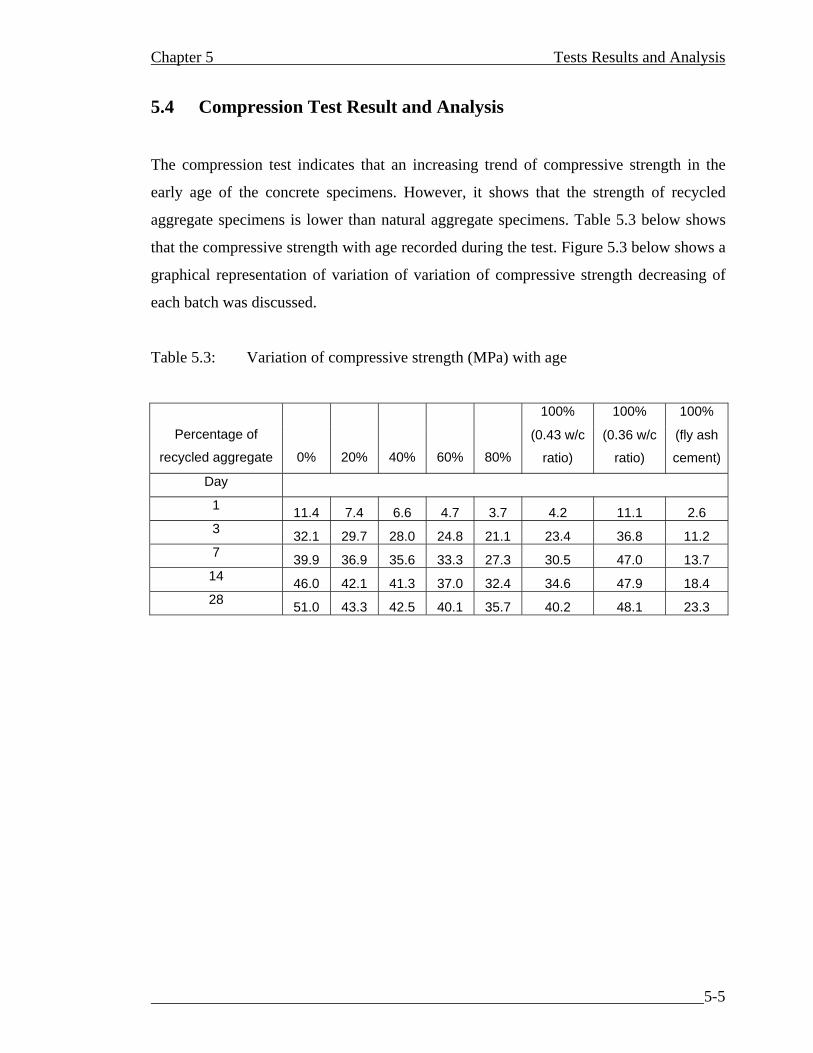
Chapter 5 Tests Results and Analysis
5.4 Compression Test Result and Analysis
The compression test indicates that an increasing trend of compressive strength in the
early age of the concrete specimens. However, it shows that the strength of recycled
aggregate specimens is lower than natural aggregate specimens. Table 5.3 below shows
that the compressive strength with age recorded during the test. Figure 5.3 below shows a
graphical representation of variation of variation of compressive strength decreasing of
each batch was discussed.
Table 5.3: Variation of compressive strength (MPa) with age
100% 100% 100%
Percentage of
recycled aggregate 0% 20% 40% 60% 80%
(0.43 w/c
ratio)
(0.36 w/c
ratio)
(fly ash
cement)
Day
1 11.4 7.4 6.6 4.7 3.7 4.2 11.1 2.6 3 32.1 29.7 28.0 24.8 21.1 23.4 36.8 11.2 7 39.9 36.9 35.6 33.3 27.3 30.5 47.0 13.7 14 46.0 42.1 41.3 37.0 32.4 34.6 47.9 18.4 28 51.0 43.3 42.5 40.1 35.7 40.2 48.1 23.3
5-5

Chapter 5 Tests Results and Analysis
0.00
10.00
20.00
30.00
40.00
50.00
60.00
0 5 10 15 20 25 30
Day
Com
pres
sive
Str
engt
h (M
Pa)
0% recycled aggregate
20% recycled aggregate
40% recycled aggregate
60% recycled aggregate
80% recycled aggregate
100% recycled aggregate(0.43 water cement ratio)100% recycled aggegate (0.36water cement ratio)100% recycled aggregate (flyash cement)
Figure 5.3: Variation of Compressive Strength with Age
The target strength for this project is 50MPa. From the obtained result, it shown that the
only batch that met the target strength is the batch with 0% recycled aggregate. The
compressive strength for other batches is around 40MPa; expect the concrete specimens
for 100% recycled with fly ash cement. This may because of the usage of blended cement
in these concrete specimens that may reduce the compressive strength while using the
recycled aggregate. The compressive strength of the concrete specimens for 100%
recycled aggregate with 0.43 water/cement ratio is 48.1MPa, which almost met the target
strength. This shown that the 100% recycled aggregate may achieve high strength by
reducing the water/cement ratio.
5-6

Chapter 5 Tests Results and Analysis
From figure 5.3, it shows that the strongest initial compression strength if the batch for
100% recycled aggregate with 0.36 water/cement ratio, but after day 7, the rate of
increment is decreasing when compared with other batches.
The results also shows that the concrete specimens with more replacement of recycled
aggregate will get the lowest strength when compared to the concrete specimens with less
recycled aggregate.
Figure 5.4: Specimens after Testing
5-7

Chapter 5 Tests Results and Analysis
Table 5.4: Percentage of compressive strength remained and dropped
Percentage of recycled
aggregate
Remained of compressive
strength
Dropped of compressive
strength
0% 100% 0%
20% 85% 15%
40% 83% 17%
60% 79% 21%
80% 70% 30%
100%
(0.43 water cement ratio)
79%
21%
100%
(0.36 water cement ratio)
95%
5%
100%
(fly ash cement)
46%
54%
0
20
40
60
80
100
120
0 20 40 60 80 100
Percentage of Recycled Aggregate (%)
Com
pres
sive
Str
engt
h (M
Pa)
fly ash cement
0.43 water/cement ratio
0.36 water/cement ratio
Figure 5.5: Graph shows the Percentage of Compressive Strength Remained
5-8

Chapter 5 Tests Results and Analysis
0
10
20
30
40
50
60
0 20 40 60 80 100
Percentage of Recycled Aggregate (%)
Com
pres
sive
Str
engt
h (M
Pa)
0.36 water cement ratio
0.43 water cement ratio
fly ash cement
Figure 5.6: Graph shows the Percentage of Decreasing in Compressive Strength
Figure 5.6 shows the percentage of the compressive strength remained when percentage
of recycled aggregate replacement increased. The compressive strength used from each
batches were based on day 28 strength. The compressive strength of 0% recycled
aggregate was taken as the 100% compressive strength.
From the result, the batch of 100% recycled aggregate with fly ash cement has the lowest
compressive strength remained, which is only 46%. There is a drop of 54% when
compared to 0% recycled aggregate. The reason is mainly because of the fly ash cement
that may reduce the compressive strength of the concrete specimen.
The compressive strength for 20% recycled aggregate replacement had dropped around
15%. The concrete specimens from 0% recycled aggregate to 80% recycled aggregate
replacement had the average dropped of 8%. There is a drop of 21% compressive strength
for the 100% recycled aggregate (0.43 water/cement ratio), where it only drops 5% of
compressive strength for 100% recycled aggregate (0.36 water/cement ratio). The main
5-9

Chapter 5 Tests Results and Analysis
reason is because of the lower water cement ratio and also the particular size of recycled
aggregate used in this batch is smaller than other concrete specimens
From the obtained result, it is possible to use 100% recycled aggregate with the less water
cement ratio in the high strength structures.
0.00
20.00
40.00
60.00
80.00
100.00
120.00
0 5 10 15 20 25 30
Day
Perc
enta
ge o
f Com
pres
sive
Str
engt
h G
aine
d
0% recycled aggregate
20% recycled aggregate
40% recycled aggregate
60% recycled aggregate
80% recycled aggregate
100% recycled aggregate (0.43 watercement ratio)100% recycled aggregate (0.36 watercement ratio)100% recycled aggregate (fly ash cement)
Figure 5.7: Variation of Compressive Strength Gained with Time
Figure 5.7 shows the variation of compressive strength gained with time. It indicates that
how fast the structural building can support itself without any other support after the day
having casting.
From the figure 5.7, the compressive strength of 100% recycled aggregate with 0.36
water/cement ratio has gained most of the strength when compared with other concrete
specimens. The compressive strength of 100% recycled aggregate with fly ash cement
has gained the lowest strength among all the concrete specimens. According to this
5-10

Chapter 5 Tests Results and Analysis
figure, the compressive strength of recycled aggregate (from 20% to 60%) gained higher
than the compressive strength of recycle aggregate (0%, 80% and 100% with 0.43 water
cement ratio). The specimens with the 100% recycled aggregate (fly ah cement) had
gained the lowest strength.
Based on the result, it shows that with the more percentage of recycled aggregate, the
higher the compressive strength will gained. This means that the structural building can
take off the support earlier when using the recycled aggregate.
5.5 Indirect Tensile Test Result and Analysis
The indirect tensile test indicates a decreasing trend of indirect tensile strength when the
percentage of recycled aggregate increased. Table 5.5 below shows the average tensile
strength recorded during the test. Figure 5.8 below shows a graphical representation of
variation of tensile strength.
Table 5.5: Variation of tensile strength
Percentage of Recycled Aggregate (%) Average Tensile Strength (MPa)
0% 3.98
20% 3.44
40% 3.32
60% 2.86
80% 2.67
100% (0.43 water/cement ratio) 3.10
100% (0.36 water/cement ratio) 3.49
100% (fly ash cement) 2.53
5-11

Chapter 5 Tests Results and Analysis
0.00
0.50
1.00
1.50
2.00
2.50
3.00
3.50
4.00
4.50
0 20 40 60 80 100
Percentage of Recycled Aggregate (%)
Ave
rage
of T
ensi
le S
tren
gth
(MPa
)0.36 water cement ratio
0.43 water cement ratio
fly ash cement
Figure 5.8: Variation of Tensile Strength
From the figure 5.8, it shows that the tensile strength is gradually decreasing for the
concrete specimens that with the replacement of 0% recycled aggregate to 80% of
recycled aggregate. The average tensile strength for the concrete specimens of 100%
recycled aggregate (0.43 water/cement ratio) and 100% recycled aggregate (0.36
water/cement ratio) was 3.30MPa. The average tensile strength drop for the concrete
specimens with the replacement of recycled aggregate (from 0% to 80%) was 0.26MPa.
The concrete specimen of 100% recycled aggregate with fly ash cement had the lowest
tensile strength, which was only 2.53MPa. It is around 64% drop compared to 0%
recycled aggregate concrete specimen. The reason is mainly because of the fly ash
cement that will reduce the tensile strength of the concrete specimen.
According to the result, it can say that the tensile strength is decreasing as the increasing
in the replacement of recycled aggregate percentage. But when the water/cement ratio
used in the recycled aggregate specimen is lower, the tensile stress will getting higher.
5-12

Chapter 5 Tests Results and Analysis
Figure 5.9: Specimens after Testing
Table 5.6: Percentage of tensile strength remained and dropped
Percentage of recycled
aggregate
Remained of tensile
strength
Dropped of tensile strength
0% 100% 0%
20% 86% 14%
40% 83% 17%
60% 72% 28%
80% 67% 33%
100%
(0.43 water/cement ratio)
78%
22%
100%
(0.36 water/cement ratio)
88%
12%
100%
(fly ash cement)
64%
36%
5-13

Chapter 5 Tests Results and Analysis
0
20
40
60
80
100
120
0 20 40 60 80 100
Percentage of Recycled Aggregate (%)
Perc
enta
ge o
f Ten
sile
Str
engt
h R
emai
ned
(%)
fly ash cement
0.43 water cement ratio
0.36 water cement ratio
Figure 5.10: Graph shows the Percentage of Tensile Strength Remained
0
5
10
15
20
25
30
35
40
0 20 40 60 80 100
Percentage of Recycled Aggregate (%)
Perc
enta
ge o
f Ten
sile
Str
engt
h D
ropp
ed
(%)
0.36 water cement ratio
0.43 water cement ratio
fly ash cement
Figure 5.11: Graph shows the Percentage of Tensile Strength Dropped
5-14

Chapter 5 Tests Results and Analysis
Figure 5.10 shows the percentage of tensile strength remained for the concrete specimens
with the different percentage of recycled aggregate replacement. The result is almost
same as the result of compressive strength. The concrete specimen of 100% recycled
aggregate with the fly ash cement has the lowest tensile strength remained, which is only
64%. The main reason is also cause of the fly ash cement that will reduce the strength in
concrete specimen. There is a drop of 22% for the concrete specimen with 100% recycled
aggregate (0.43 water/cement ratio), which is still remained 78% of tensile strength when
compare to 0% recycled aggregate concrete specimen. However, the concrete specimen
with the 100% recycled aggregate (0.36 water/cement ratio) has the most tensile strength
remained. It just drops 12%, which is still remained 88% when compared to 0% recycled
aggregate concrete specimen. The reason is because of the lower water cement ratio and
also because of the particular size of recycled aggregate used is smaller than other
batches of concrete specimens.
From the result, it clearly shows that with more percentage replacement of recycled
aggregate used in the concrete specimen, the percentage of tensile strength remained are
gradually decreasing. The tensile strength will remain higher when the water/cement ratio
is getting lower.
5-15

Chapter 5 Tests Results and Analysis
5.6 Modulus of Elasticity Result and Analysis
The modulus of elasticity test indicates a decreasing trend of modulus of elasticity value
when the percentage of recycled aggregate increased. Table 5.2 below shows the average
modulus of elasticity recorded during the test. Figure 5.12 below shows a graphical
representation of the variation of modulus elasticity.
Table 5.7: The results obtained from different percentage of recycled aggregate replacement.
Percentage of recycled aggregate Modulus of elasticity (MPa)
0% 44303
20% 36641
40% 35297
60% 27906
80% 27748
100%
(0.43 water cement ratio)
26422
100%
(0.36 water cement ratio)
30560
100%
(fly ash cement)
21342
5-16

Chapter 5 Tests Results and Analysis
0
5000
10000
15000
20000
25000
30000
35000
40000
45000
50000
0% 20% 40% 60% 80% 100%
Percentage of Recycled Aggregate (%)
Mod
ulus
of E
last
icity
(MPa
)
0.36 water cement ratio
0.43 water cement ratio
fly ash cement
Figure 5.12: Variation of Modulus of Elasticity
Figure 5.12 indicate shows the variation of modulus of elasticity of concrete specimens
with the increasing of 20% of recycled aggregate. It shows a decreasing trend occurs
when the percentage of recycled aggregate increasing. Consequently, specimens made
with recycled aggregate have less modulus of elasticity value than the specimens made
with all natural aggregate.
From the experimental results, the modulus of elasticity of full natural aggregate
specimens was 44303MPa, while the modulus of elasticity of full recycled aggregate
specimens was 26422MPa. It indicates a drop of 17881MPa, which is 67% difference
between the 0% and 100% recycled aggregate batches. Additionally, the difference with
each 20% recycled aggregate increase is approximately 21%.
By comparing all different type of 100% recycled aggregate, the reduced water 100%
recycled aggregate specimen has the highest value of modulus of elasticity, while the
normal recycled aggregate (0.43% water/cement ratio) is moderate and the fly ash 100%
recycled aggregate specimen was the lowest..
5-17

Chapter 5 Tests Results and Analysis
0
5
10
15
20
25
30
0 0.0002 0.0004 0.0006 0.0008 0.001 0.0012
Strain
Stre
ss (M
Pa)
0%
20%
40%
60%
80%
100%(0.43w/c)
100%(0.36w/c)
100% (Fly Ash)
Figure 5.13: Stress and Strain Relationship
Figure 5.13 shows the stress / strain curve for all concrete specimens which taken from
modulus of elasticity tests. Each specimen will represent the increasing amount of 20% of
recycled aggregate.
It shows that the replacement of increase recycled aggregate percentage used in the
concrete specimens, the ultimate strength of concrete decreased, while the deformation of
the concrete is still remaining the same rate. This figure also shows that the slope is
decreasing when the rate usage of recycled aggregate increased. However, the
comparisons for all different 100% recycled aggregate are very obvious.
Comparing all recycled aggregate specimen, it shows that the 0.36% water/cement ratio
recycled aggregate specimen has an increasing rate slope higher than 0.43%
5-18

Chapter 5 Tests Results and Analysis
water/cement ratio and fly ash recycled aggregate specimen. As this indicates these
results were similar the compression strength and indirect tensile strength results.
5.7 Summary
The experimental results show the recycled aggregate will influence much in fresh and
hardened properties of a concrete. As the percentage of the recycled aggregate increased,
the workability and strength of the concrete will decreased. By comparing the different
type of 100% recycled aggregate specimens, it was found that fly ash cement recycled
aggregate concrete mix batch were not sufficient to achieve the high strength target. The
reduced water (0.36 water/cement ratio) recycled aggregate concrete mix indicates a
higher strength but the workability is not very satisfied.
5-19

Chapter 6 Conclusion and Recommendations
Chapter 6
Conclusion and Recommendations This chapter was set out to represent the conclusion of this project. Before the conclusion
is list, the achievement of objectives set in beginning of the project was also discussed
and achieved. Lastly, some testing, investigations and studies were also recommended
after the conclusion, to further the strength characteristics of recycled aggregates for the
application in high strength concrete.
6.1 Achievement of Objectives
The project achievements are as follows:
• In this project, the review and research of current usage to the use of recycled
aggregate in the concrete was discussed into different sectors, such as
constructions, industries, applications, recycling process, previous research and
investigation.
• Total of six batches of concrete mixes required by the scope of the project. The
concrete mixes consisted of every 20% increment of recycled aggregate
replacement from 0% to 100%.
• The investigation and laboratory testing on recycled aggregate concrete specimens
such as compression test, indirect tensile test and modulus of elasticity. However,
not all the specimens had achieved to the high strength requirement.
• All the result for the tests was recorded in an appropriate manner. Moreover,
result of each test was analysed in detail. All of this was discussed in chapter 5.
6-1

Chapter 6 Conclusion and Recommendations
• With extra time permit, two extra 100% recycled aggregate concrete mixes on
were cast which is water/cement ratio of 0.36 and fly ash cement. These two
mixes were compared to 100% recycled aggregate concrete mix (0.43
water/cement ratio)
6.2 Conclusion Research on the usage of waste construction materials is very important due to the
materials waste is gradually increasing with the increased of population and increasing of
urban development. The reasons that many investigations and analysis had been made on
recycled aggregate are because recycled aggregate is easy to obtain and the cost is
cheaper than virgin aggregate. Virgin aggregate need to mine but recycled aggregate can
ignore this process.
This on-going research project is to determine the strength characteristics of recycled
aggregate for potential application in the high concrete structural concrete. The study
shows that when the water/cement ratio was decreased, the compressive strength can
reach 48MPa. This is classified as high strength concrete and they can be applied in the
infrastructures, which need compressive strength up to 40MPa. Furthermore, with the
cheaper price of recycled aggregate compared to natural aggregate, the builders can carry
out the construction task with lesser material costs.
Another result found in this research is that when reducing the water amount used in
recycled aggregate mixes, tensile strength and modulus of elasticity are also improved.
This will give an improvement in general strength characteristics of structural building.
Although recycled aggregate can be applied in the high strength structure, but one issue
must not be neglected as recycled aggregate with reduce water content would have low
workability. Whenever recycled aggregate is applied, water content in the concrete mix
has to be monitored carefully due to the water absorption capacity of recycled aggregate
6-2

Chapter 6 Conclusion and Recommendations
will vary. This type of concrete can only be used under the condition that does not
involve a lot of handling works.
6.3 Recommendations for Further Studies
Further testing and studies on the recycled aggregate concrete is highly recommended to
indicate the strength characteristics of recycled aggregates for application in high strength
concrete. Below are some of the recommendations for further studies:
• Although by decreasing the water/cement ratio, recycled aggregate can achieve
high strength concrete. But the workability will be very low. Therefore, it is
recommended that adding admixtures such as super plasticizer and silica fume
into the mixing so that the workability will be improved.
• More investigations and laboratory tests should be done on the strength
characteristics of recycled aggregate. It is recommended that testing can be done
on concrete slabs, beams and walls. Some mechanical properties such as creeping
and abrasion were also recommended.
• More trials with different particle sizes of recycled aggregate and percentage of
replacement of recycled aggregate are recommended to get different outcomes
and higher strength characteristics in the recycled aggregate concrete.
6-3

Reference
Aggregate Advisory Service, n.d., Sand and Cement, viewed 16 May 2004,
<http://www.p2pays.org/ref/17/16595.pdf>
Aggregate Advisory Service, n.d., Save Cost, viewed 16 May 2004,
<http://www.p2pays.org/ref/17/16595.pdf>
Aggregate and Quarry, n.d., Quarries and the Environment, viewed 27 April 2004,
<http://www.quarrying.org.nz/environment.html>
Agg Regain, 2001, Recycled aggregate for use as capping in housing development,
viewed 12 August 2004,
<http://www.aggregain.org.uk/casestudy_detial.asp?projectID=44>
Australia Standard, 1999, ‘Online Reference’, viewed on 27 Dec 2003.
<http://online.standards.com.au/online/autologin.asp>
Bakoss P. S. L. and Ravindrarajah R Sri, 1999, Recycled Construction and
Demolition Materials for use in Roadworks and other Local, viewed 4 March 2004,
<http://www.ipwea.org.au/upload/final_scoping_report.pdf>
Bora Australia, n.d., Recycled Aggregate Process, viewed 29 Jun 2004,
<http://www.boral.com.au/Atricle/nsw_recycling_process?site=biral%OA>
Building Innovation and Construction Technology, 1999, Recycled Hits, New High,
viewed 30 August 2004, <http://www.cmit.csiro.au/innovation/1999-
02/recyclestreet.htm>
Buyle-Bodin F. and Hadijieva-Zaharieva R., 2002, Influence of industrially produced
recycled aggregates on flow properties of concrete, Materials and Structures, Volume
35, September-October 2002, p504-509.

Cement Association of Canada, 2003, Compressive Strength, viewed 25 August 2004,
<http://www.cement.ca/cement.nsf/0/FD75CF9BCOFB1029852568A9005B082?Ope
nDocument>
Cement Association of Canada, 2003, Elastic and Inelastic Deformation, viewed 25
August 2004,
<http://www.cement.ca/cement.nsf/0/52D6016170D92AD885268AB000FCF65?Ope
nDocument>
Cement Association of Canada, 2003, Workability, viewed 25 August 2004,
<http://www.cement.ca/cement.nsf/0/AE12614CF961D1C852568A90055A775?Open
Document>
Cement Manufacturer’s Association India, n.d., What is Good Concrete, viewed 1
April 2004, <http://www.cmaindia.org/fag3.html>
Circuit Technology, 2001, Hydraulic Cruncher, viewed 3 March 2004,
<http://www.hctkits.com/about.html>
Concrete Network, n.d., viewed 10 Jun 2004,
<http://www.concretenetwork.com/concrete/demolition/recycling-concrete.htm>
Copeland, 2003, Fly Ash Properties and Uses, viewed 16 July 2004,
<http://www.monolithic.com/constrcution/flyash/>
Cost Unbound Granular Materials For Road Pavements, n.d., Review of Production,
Construction and Quality Issues, viewed 25 August 2004,
<http://www.nottongham.ac.uk/~evzard/cost2d-1.html#25>
CRISO, n.d., Commonwealth Scientific & Industrial Research Organisation, viewed 4
April 2004, <http://www.csiro.au/index.asp?id>

CRISO, n.d., Australia First for Recycled Concrete, viewed 4 April 2004,
<http://www.csiro.au/index.asp?id=AustraliaFirstForRecycledConcrete&type=media
Release.htm>
Davinel, 2000, Implusion, viewed 3 March 2004,
<http://www.eskimo.com/~davin/phpts/home.2000.implode.html>
Davinel, 2000, Jackhammer, viewed 3 March 2004,
<http://www.dansville.k12.ny.us/construction/what_we_/jackhammer.jpg >
Engineers Australia, 2002, Using recyclables in concrete, Volume 74, number 5, May
2002.
Environmental Council of Concrete Organizations, n.d., Recycling concrete saves
resources, Eliminates Dumping, viewed 6 July 2004,
<http://www.ecco.org/pdfs/ev15.pdf>
Fact File C&D Recycling Industry, n.d., History, viewed 11 April 2004,
<http://cdrecycling.org/history.htm>
Fong F.K. Winston, Yeung S.K. Jaime, and Poon C.S., n.d., HONG KONG
EXPERIENCE OF USING RECYCLED AGGREGATES FROM CONSTRUCTION
AND DEMOLITION MATERIALS IN READY MIX CONCRETE, viewed 26 Jun 2004,
<http://www.ctre.iastate.edu/pubs/sustainable/fonghongkong.pdf>
Hong Kong Housing Department, n.d. Use of Recycled Aggregate,
viewed 25 March 2004,
<http://www.housingauthority.gov.hk/en/businesspartners/ura/0,,,00.html#10473>
Kajima Corporation Research and Development, 2002, Recycled Aggregate Concrete
for Within-Site Recycling, viewed 9 September 2004,
<http://www.kajima.co.jp/ir/annual/2002/research-development.html>

Limbachiya M. C., Leelawat T. and Dhir R. K., 2000, Use of recycled concrete
aggregate in high-strength concrete, Materials and Structures, Volume 33, November
2000, p574-580.
Logic Sphere, n.d., Slump test, viewed 31 March 2004,
<http://logicsphere.com/products/firstmix/hlp/html/work5xd0.htm>
Neville A.M., 1997, Properties of Concrete, John Wiley & sons Inc., New York,
United State of America.
Otsuki N., Miyazato S. and Yodsudjai W., 2003, Influence of Recycled Aggregate on
Interfacial Transition Zone, Chloride Penetration and Carbonation of Concrete,
Journal of Materials in Civil Engineering, Volume 15, Number 5, September/October
2003, p443.
Path Technology Inventory, n.d., Concrete Aggregate Substitutes,
viewed 16 September 2004,
<http://www.toolbase.org/tertiaryT.asp?DocumentID=4125&categoryID=1402>
Peter G. and Marcus R., 2004, German Committee for Reinforced Concrete- Code:
Concrete with Recycled Aggregates, viewed 27 April 2004,
<http://b-i-m.de/public/tudmassiv/dundeegrueblruehl.htm>
Recycling of Portland Cement Concrete, n.d., Recycling of Portland Cement
Concrete, viewed 20 March 2004, <http://www.hnd.usace.army.mil/techinfo/UFC/
UFC3_250_07/TM582210/chap5.pdf>
Roos F., 1998, Verification of the Dimensioning Values for Concrete with Recycled
Concrete Aggregates, viewed 27 February 2004,
<http://www.b-i-m.de/public/TUM/dundeeroos.htm>

Sabaa B and Ravindrarajah R.S., 1999, Workability Assessment For Polystyrene
aggregate Concrete, viewed 26 March 2004,
<http://services.eng.uts.edu.au/~navir/workability%20Testing%20for%20Aggregate%
20Concrete.pdf>
Standards Australia, 2002, Guide to Concrete Construction, SAA HB64, Standards
Australia International, Australia.
Standards Australia, 2003, Australia Standards for Civil Engineering Students,
HB2.2, Part 2, Standards Australia International, Australia.
Standards Australia, 2003, Concrete Structures, AS3600, Standards Australia
International, Australia.
Standards Australia, 2003, Methods for sampling and testing aggregates, AS1141,
Standards Australia International, Australia.
Standards Australia, 2003, Methods of testing concrete, AS1012, Standards Australia
International, Australia.
Sullivan B.W., 2001, Part C: Concrete Technology, CIV2605 Construction
Engineering, DEC, Toowoomba, Australia.
The trading tribe, 2003, Wrecking ball, viewed 3 March 2004,
<http://www.seykota.com/tribe/pages/2003_Apr/Apr_27_30>
University of Florida, n.d., Concrete Demonstration, viewed 4 April 2004,
<http://www.ce.ufl.edu/activities_ce/what_is/concrete/htm>
US Army Corp of Engineers, n.d., RECYCLING OF PORTLAND CEMENT
CONCRETE, viewed 5 August 2004,
<http://www.usace.army.mil/inet/usace-docs/armytm/tm5-822-10/chap5.pdf>

Water Pollution and Land Contamination, n.d., Controlling environmental effects:
recycled and secondary aggregates production, viewed 5 May 2004,
<http://www.odpm.gov.uk/stellent/groups/odpm_planning/documents.oage/odpm_pla
n_606242-13.hcsp>
Wilmot T. and Vorobieff G., 1997, Is Road Recycling A Good Community Policy?,
viewed 25 July 2004, <http://www.auststab.com.au/tp15.pdf>
Top Related