


Languages
Pages
Legal

Health Information Technology Eva lua tion Toolkit 2009 Update Prepared for: Agency for Healthcare Research and Quality U.S. Department of Health and Human Services 540 Gaither Road Rockville, MD 20850 www.ahrq.gov Contract No. 290-04-0016 Prepared by: Caitlin M. Cusack, M.D., M.P.H., NORC of the University of Chicago Colene M. Byrne, Ph.D., Center for IT Leadership, Partners HealthCare System Julie M. Hook, M.A., M.P.H., John Snow, Inc. Julie McGowan, Ph.D., F.A.C.M.I., Indiana University School of Medicine Eric Poon, M.D., M.P.H., Division of General Medicine and Primary Care, Brigham and Women's Hospital Atif Zafar, M.D., Regenstrief Institute Inc. AHRQ Publication No. 09-0083-EF June 2009
Health Information Technology Evaluation Toolkit: 2009 Update i
This document is in the public domain and may be used and reprinted without permission except those copyrighted materials that are clearly noted in the document. Further reproduction of those copyrighted materials is prohibited without the specific permission of copyright holders.
Suggested Citation: Cusack CM, Byrne C, Hook JM, McGowan J, Poon EG, Zafar A. Health Information Technology Evaluation Toolkit: 2009 Update (Prepared for the AHRQ National Resource Center for Health Information Technology under Contract No. 290-04-0016.) AHRQ Publication No. 09-0083-EF. Rockville, MD: Agency for Healthcare Research and Quality. June 2009.
Acknowledgments The authors would like to thank numerous members of the AHRQ National Resource Center’s Value and Evaluation Team for their invaluable input and feedback: Davis Bu, M.D., M.A. (Center for IT Leadership); Karen Cheung, M.P.H. (National Opinion Resource Center); Dan Gaylin, M.P.A. (National Opinion Resource Center); Julie McGowan, Ph.D. (Indiana University School of Medicine); Adil Moiduddin, M.P.P. (National Opinion Resource Center); Anita Samarth (eHealth Initiative); Jan Walker, R.N., M.B.A. (Center for IT Leadership); and Atif Zafar, M.D. (Indiana University School of Medicine). Thank you also to Mary Darby, Burness Communications, for editorial review.
The authors of this report are responsible for its content. Statements in the report should not be construed as endorsement by the Agency for Healthcare Research and Quality or the U.S. Department of Health and Human Services.
Health Information Technology Evaluation Toolkit: 2009 Update ii
Contents Introduction ................................................................................................................... 1Section I: Developing an Evaluation Plan ............................................................... 3
I. Develop Brief Project Description ...............................................................3
II. Determine Project Goals ..............................................................................3
III. Set Evaluation Goals ....................................................................................4
IV. Choose Evaluation Measures .......................................................................4
V. Consider Both Quantitative and Qualitative Measures ................................5
VI. Consider Ongoing Evaluation of Barriers, Facilitators, and Lessons Learned ........................................................................................................7
VII. Search for Other Easily Accessible Measures .............................................7
VIII. Consider Project Impacts on Potential Measures ........................................9
IX. Rate Your Chosen Measures in Order of Importance to Your Stakeholders 10
X. Determine Which Measurements Are Feasible .........................................10
XI. Determine Your Sample Size .....................................................................11
XII. Rank Your Choices on Both Importance And Feasibility .........................12
XIII. Choose the Measures You Want To Evaluate ...........................................13
XIV. Determine Your Study Design ...................................................................13
XV. Consider the Impact of Study Design on Relative Cost And Feasibility ..15
XVI. Choose Your Final Measures .....................................................................17
XVII. Draft Your Plan Around Each Measure .....................................................19
XVIII. Write Your Evaluation Plan .......................................................................20
Section II: Examples of Measures That May Be Used to Evaluate Your Project .21
Section III: Examples of Projects ..............................................................................42
Appendixes Appendix A: Sample Size Example .............................................................................56
Appendix B: Health IT Evaluation Resources ............................................................58
Appendix C: Statistics Resources ...............................................................................59
Health Information Technology Evaluation Toolkit: 2009 Update 1
In troduction
We are pleased to present this updated version of the Agency for Healthcare Research and Quality (AHRQ) National Resource Center for Health Information Technology (NRC) Evaluation Toolkit. This toolkit provides step-by-step guidance for project teams who are developing evaluation plans for their health information technology (health IT) projects.
You might ask: “Why evaluate?” For years, health IT has been implemented with the goals of improving clinical care processes, health care quality, and patient safety, without questioning the evidence base behind the true impact of these systems. In short, these systems were implemented because they were viewed as the right thing to do. In the early days of health IT implementation, evaluations took a back seat to project work and frequently were not performed at all, at a tremendous loss to the health IT field. Imagine how much easier it would be for you to implement your project if you had solid cost and impact data at your fingertips.
Health IT projects require large investments, and, increasingly, stakeholders are demanding information about both the actual and future value of these projects. As a result, we as a field are moving away from talking about theoretical value, to a place where we measure real value. We have reached a point where isolated studies and anecdotal evidence are not enough – not for our stakeholders, nor for the health care community at large. Evaluations must be viewed as an integral piece of every project, not as an afterthought.
It is difficult to predict a project’s impact, or even to determine impact once a project is completed. Evaluations allow us to analyze our predictions about our projects and to understand what has worked and what has not. Lessons learned from evaluations help everyone involved in health IT implementation and adoption improve upon what they are doing.
In addition, evaluations help justify investment in health IT projects by demonstrating project impacts. This is exactly the type of information needed to convert late adopters and others resistant to health IT. We can also share such information with our communities, raising awareness of efforts in the health IT field on behalf of patient safety and increasing quality of care.
Thus, the question posed today is no longer why do we do evaluations but how do we do them? This toolkit will help assist you through the process of planning an evaluation. Section I walks you and your team step-by-step through the process of determining the goals of your project, what is important to your stakeholders, what needs to be measured to satisfy stakeholders, what is realistic and feasible to measure, and how to measure these items.
Health Information Technology Evaluation Toolkit: 2009 Update 2
Section II includes a list of measures that you may use to evaluate your project. In this latest version, new measures have been added to each of the domains, and a new domain has been added around quality measures. For each domain, we include a table of possible measures, suggested data sources, cost considerations, potential risks, and general notes. A new column has been added to this updated version of the toolkit, with links to sources that expand on how these measures can be evaluated and with references in the literature.
Section III contains examples of a range of implementation projects with suggested evaluation methodologies for each. In this latest version, two examples have been added on computerized provider order entry (CPOE) and picture archiving and communication systems (PACS).
We invite and encourage your feedback on the content, organization, and usefulness of this toolkit as we continue to expand and improve it. Please send your comments or questions about the evaluation toolkit or the National Resource Center to [email protected].

Health Information Technology Evaluation Toolkit: 2009 Update 3
Sec tion I: Develop ing an Evalua tion P lan
I. De ve lop Brie f P ro jec t Des crip tion This may come straight out of your project plan or proposal.
II. De te rmine Pro jec t Goals What does your team hope to gain from this implementation? What are the goals of your stakeholders (CEO, CMO, CFO, clinicians, patients, and so on) for this project? What needs to happen for the project to be deemed a success by your stakeholders?
Example:
To improve patient safety; to improve the financial position of the hospital; to be seen by our patients as making patient safety an organizational priority.
Health Information Technology Evaluation Toolkit: 2009 Update 4
III. Se t Eva lua tion Goals
Who is the audience for your evaluation? Do you intend to prepare a report for your stakeholders? Are you required to prepare a report for your funders? Will you use the evaluation to convince late adopters of the value of your implementation? To share lessons learned? To demonstrate the project’s return on investment? To improve your standing and competitive edge in your community? Or are your goals more external? Would you like to share your experiences with a wider audience and publish your findings? If you plan to publish your findings, this may affect your approach to your evaluation.
Example:
To prepare a report for the stakeholders and funders of the project.
IV. Choos e Eva lua tion Meas ures
Take a good look at your project goals. What needs to be measured in order to demonstrate that the project has met those goals? Brainstorm with your team on everything that could be measured, without regard to feasibility. Section II provides a wide range of potential measures in the following categories:
Clinical Outcomes Measures
Clinical Process Measures
Provider Adoption and Attitudes Measures
Patient Adoption, Knowledge, and Attitudes Measures
Workflow Impact Measures
Financial Impact Measures

Health Information Technology Evaluation Toolkit: 2009 Update 5
Your team might find it helpful to break down your measures in similar categories. Keep in mind that measures should map back to your original project goals, and that they may include both quantitative and qualitative data.
Example:
(1) Goal: To improve patient safety. Measurement: The number of preventable adverse drug events is reduced post-implementation. (2) Goal: To improve the hospital’s financial position. Measurement: The number of claims rejected is reduced post-implementation. (3) Goal: To be seen by our patients as making patient safety an organizational priority. Measurement: In patient surveys, patients answer “yes” to the question, “Do you believe this hospital takes your safety seriously?”
V. Cons ider Both Quantita tive and Qualita tive Meas ures
Many people feel more comfortable in the realm of numbers and, as a result, frequently design their evaluations solely around quantitative data. But this approach provides only a partial picture of your project. Quantitative data can lead to conclusions about your project that miss the larger picture.
For example:
A hospital implements a new clinical reminder system with the goal of increasing compliance with health maintenance recommendations. An evaluation study is devised to measure the percentage change in the number of patients discharged from the facility who receive influenza vaccines, as recommended.
The study is carried out, and, to the disappointment of the research team, the rates of vaccinated patients discharged pre- and post-implementation do not change. The team concludes that their implementation goals have not been met, and that the money spent on the system was a poor investment.
Health Information Technology Evaluation Toolkit: 2009 Update 6
But a qualitative study of the behaviors of the clinicians using the new system would have reached different conclusions. In this scenario, the qualitative study reveals that clinicians, bombarded with a number of alerts and health maintenance reminders, click through the alerts without reading them. The influenza vaccine reminders are not read; thus the rates of influenza vaccination remain unchanged.
The study also notes that a significant number of clinicians are distracted by and frustrated with the frequent alerts generated by the new system, with no way to distinguish the more important alerts from the less important ones. In addition, some clinicians are unaware of the evidence supporting this vaccine reminder and of the financial (pay-for-performance) implications for the hospital if too few patients receive this vaccine. One clinician had the idea that the vaccine reminder could be added to the common admission order sets. These findings could be used to refocus the design, education, and implementation efforts for this intervention.
However, lacking a qualitative evaluation, these insights are lost on the project team.
Qualitative studies add another important dimension to an evaluation study: they allow evaluators to understand how users interact with a new system. In addition, qualitative studies speak to a larger audience because they generally are easier to understand than quantitative studies. They often generate anecdotes and stories that resonate with audiences.
Therefore, it is important to consider both quantitative and qualitative data in your evaluation plan. Please add any qualitative measures you would like to consider.
The National Resource Center has developed a Compendium of Health IT Surveys that may be found on the NRC Web site at Health IT Survey Compendium. This tool allows a user to search for publically available surveys by survey type, technology, care setting, and targeted respondent. These surveys can then be used as is, or can be modified to suit a user’s needs.
Health Information Technology Evaluation Toolkit: 2009 Update 7
VI. Cons ider Ongoing Eva lua tion o f Barrie rs , Fac ilita tors , and Les s ons Learned
Lessons learned are important measures of your project and typically are captured using qualitative techniques. These lessons may reflect the facilitators and barriers you encountered at various phases of your project. Barriers may be organizational, financial, or legal, among many other areas. Facilitators might include strong leadership, training, and community buy-in.
This type of information is extremely valuable not only to you but also to others undertaking similar projects. In formulating a plan for capturing this information, consider scheduling regular meetings with your project team to discuss the issues at hand openly and to record these discussions. In addition, you could conduct focus groups with appropriate individuals to capture this information more formally. For example, you could ask nurses who are using a new technology about what has gone well, what has gone poorly, and what the unexpected consequences of the project have been. Another way to capture valuable lessons learned is to conduct real-time observations on how users interact with the new technology. Consider how you could incorporate these analysis techniques into your evaluation plan. Clearly state what you want to learn, how you plan to collect the necessary data, and how you would analyze the data.
VII. Search for Othe r Eas ily Acces s ib le Meas ures
Hospitals collect a tremendous amount of data for multiple purposes: to satisfy various Federal and State requirements, to conduct ongoing quality assurance evaluations, and to measure patient and staff satisfaction. Therefore, there are teams within your facility already collecting data that might be useful to you. Reach out to these groups to learn what information they are currently collecting and to determine whether those data can be used as an evaluation measure.
In addition, contact the various departments in your facility to learn the reporting capabilities of their current software programs as well as current data collection methods. There may be
Health Information Technology Evaluation Toolkit: 2009 Update 8
opportunities to leverage these reporting capabilities and data collection methods for your project. For example, does the billing department already measure the number of claims rejected? Is there a team already abstracting charts for information that your team would like to examine? Could your team piggy-back with another group to abstract a bit of additional information? Are there useful measurements that could be taken from existing reports? Likewise, you may find that activities you are planning as part of your evaluation would be helpful to other teams within your facility. Cooperation in these activities can increase goodwill on both sides.
Section II outlines several potential measures and provides sources where you may find those measures.
Example:
The finance department’s billing system can report the number of emergency department encounters that are coded as levels I, II, III, IV, and V. These reports are simple to run, and the finance department is willing to run them for you. You already know that many visits are down-coded because a visit was not sufficiently documented – an oversight that can lead to large revenue losses. A new evaluation measure is added to determine whether the new implementation improves documentation so that visits are coded appropriately and revenues are increased.
Health Information Technology Evaluation Toolkit: 2009 Update 9
VIII. Cons ider Pro jec t Impac ts on Po ten tia l Meas ures
A project may have many impacts on a facility, but often these impacts depend on where the project is implemented – for example, across groups of hospitals versus across a single facility versus within a single department. In addition, impacts may vary according to the group that is using a new technology – for example, all facility clinicians versus nurses only. Consider the potential measures on your list and how your project might impact those measures. You may find that this exercise eliminates some measures from your list if you are trying to measure outcomes that will not be impacted by your project.
Health Information Technology Evaluation Toolkit: 2009 Update 10
IX. Ra te Your Chos en Meas ures in Order of Importance to Your S takeholders
Now that your team has a list of measures to evaluate, rate each measure in order of importance to your stakeholders, i.e., your CEO, clinicians, or patients, and so on You could use a scale such as: 1 = Very Important, 2 = Moderately Important, 3 = Not Important. This will help you begin to filter out those measures that are interesting to you but will not provide you with information of interest to your stakeholders.
1. Very Important:____________________________________________________
____________________________________________________________________
2. Moderately Important:_______________________________________________
____________________________________________________________________
3. Not Important:_____________________________________________________
____________________________________________________________________
X. Dete rmine Which Meas urements Are Feas ib le
Now examine your list to determine which measures are feasible for you to measure. Be realistic about the resources available to you. Teams frequently are forced to abandon evaluation projects that are labor-intensive and expensive. Instead, focus on what is achievable and on what needs to be measured to determine whether your implementation has met its goals. For example, you might want to know whether your implementation reduces adverse drug events (ADEs). While this is a terrific evaluation project, if you have neither the money nor the individuals needed for chart abstraction, the project will likely fail. Keep focused on what can be achieved. Again, you can use a ranking scale: 1 = Feasible, 2 = Feasible with Moderate Effort, 3 = Not Feasible.
1. Feasible:__________________________________________________________
____________________________________________________________________
2. Moderate Effort:___________________________________________________
____________________________________________________________________
3. Not Feasible:_______________________________________________________
____________________________________________________________________

Health Information Technology Evaluation Toolkit: 2009 Update 11
XI. Dete rmine Your Sample S ize
A second, extremely important, facet of feasibility is sample size. An evaluation effort can hinge on the number of observations planned or on the frequency of events to be observed. The less frequently the event occurs, the less feasible the planned measure becomes. If a measurement requires a large amount of resources—for example, to directly observe clinicians at work or to conduct manual chart review—or if you are observing very rare events, such as patient deaths, your plan may not be feasible at all.
In planning how to study your measure, determine the number of observations you will need to make. Generally, you need enough observations to feel confident about the conclusions you want to draw from the data collected. If you have never estimated a sample size, you should consult a statistician to help you do this correctly or utilize the resources on the AHRQ NRC Web site. Appendix A offers a hypothetical example of determining sample size.
Estimate the number of observations you will need for each measure. You may find that this exercise eliminates further measures from being feasible.
Health Information Technology Evaluation Toolkit: 2009 Update 12
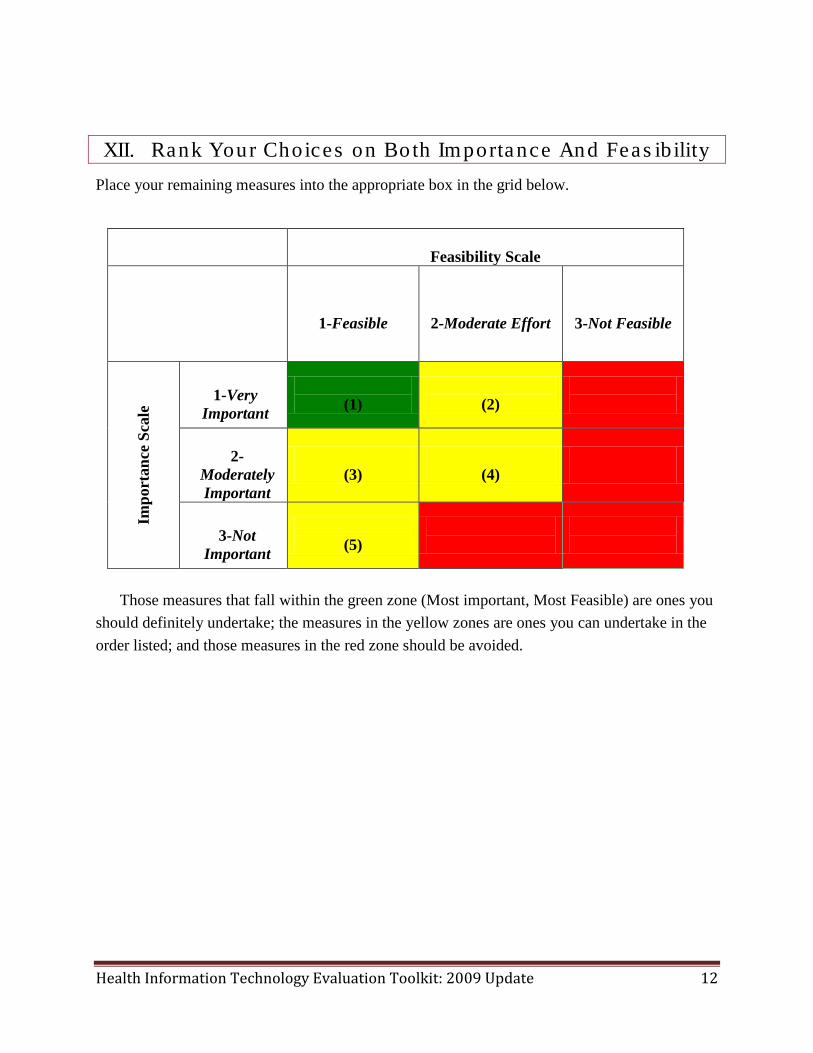
XII. Rank Your Choices on Both Importance And Feas ib ility Place your remaining measures into the appropriate box in the grid below.
Feasibility Scale
1-Feasible
2-Moderate Effort
3-Not Feasible
Im
port
ance
Sca
le
1-Very
Important
(1)
(2)
2-
Moderately Important
(3)
(4)
3-Not
Important
(5)
Those measures that fall within the green zone (Most important, Most Feasible) are ones you
should definitely undertake; the measures in the yellow zones are ones you can undertake in the order listed; and those measures in the red zone should be avoided.
Health Information Technology Evaluation Toolkit: 2009 Update 13
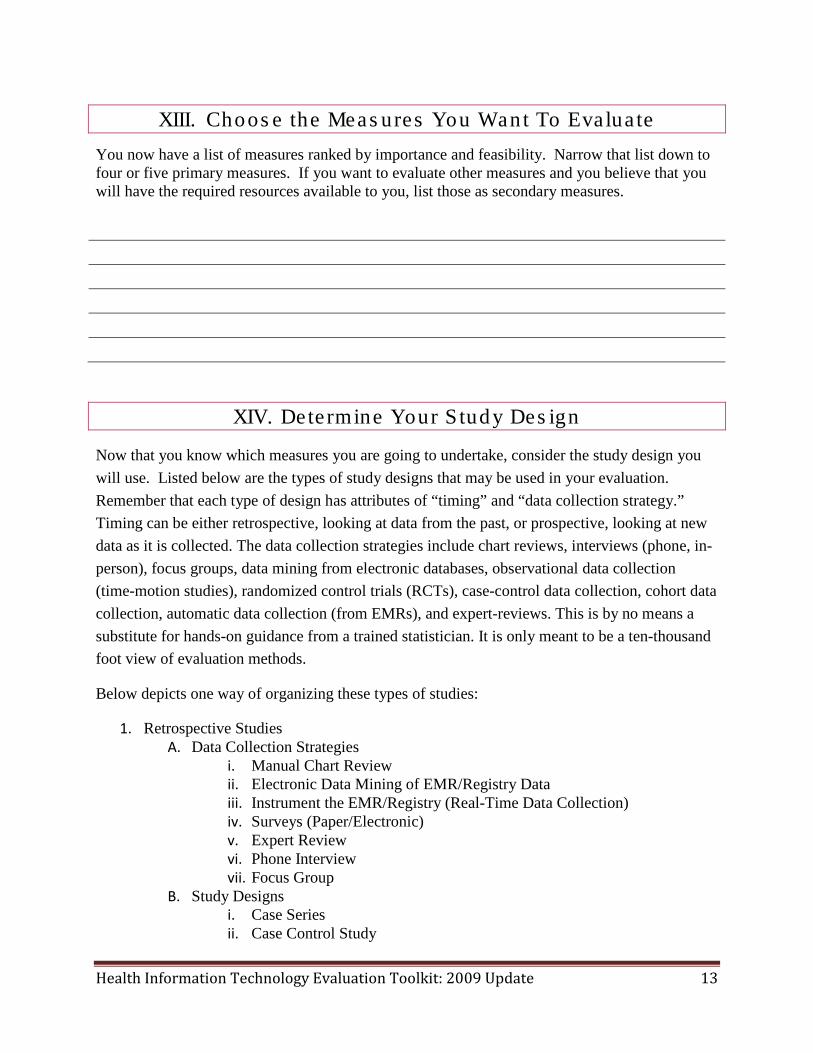
XIII. Choos e the Meas ures You Want To Evalua te You now have a list of measures ranked by importance and feasibility. Narrow that list down to four or five primary measures. If you want to evaluate other measures and you believe that you will have the required resources available to you, list those as secondary measures.
XIV. Dete rmine Your S tudy Des ign
Now that you know which measures you are going to undertake, consider the study design you will use. Listed below are the types of study designs that may be used in your evaluation. Remember that each type of design has attributes of “timing” and “data collection strategy.” Timing can be either retrospective, looking at data from the past, or prospective, looking at new data as it is collected. The data collection strategies include chart reviews, interviews (phone, in-person), focus groups, data mining from electronic databases, observational data collection (time-motion studies), randomized control trials (RCTs), case-control data collection, cohort data collection, automatic data collection (from EMRs), and expert-reviews. This is by no means a substitute for hands-on guidance from a trained statistician. It is only meant to be a ten-thousand foot view of evaluation methods.
Below depicts one way of organizing these types of studies:
1. Retrospective Studies A. Data Collection Strategies
i. Manual Chart Review ii. Electronic Data Mining of EMR/Registry Data iii. Instrument the EMR/Registry (Real-Time Data Collection) iv. Surveys (Paper/Electronic) v. Expert Review vi. Phone Interview vii. Focus Group
B. Study Designs i. Case Series ii. Case Control Study
Health Information Technology Evaluation Toolkit: 2009 Update 14
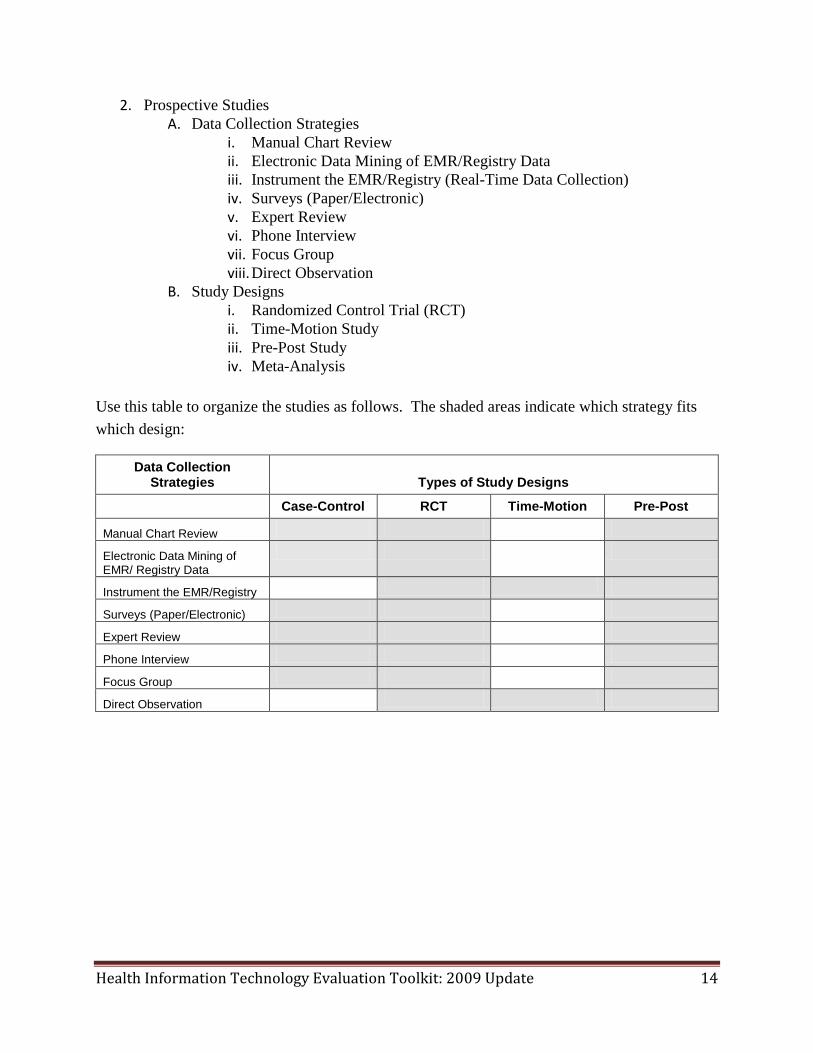
2. Prospective Studies A. Data Collection Strategies
i. Manual Chart Review ii. Electronic Data Mining of EMR/Registry Data iii. Instrument the EMR/Registry (Real-Time Data Collection) iv. Surveys (Paper/Electronic) v. Expert Review vi. Phone Interview vii. Focus Group viii. Direct Observation
B. Study Designs i. Randomized Control Trial (RCT) ii. Time-Motion Study iii. Pre-Post Study iv. Meta-Analysis
Use this table to organize the studies as follows. The shaded areas indicate which strategy fits which design:
Data Collection Strategies Types of Study Designs
Case-Control RCT Time-Motion Pre-Post
Manual Chart Review
Electronic Data Mining of EMR/ Registry Data
Instrument the EMR/Registry
Surveys (Paper/Electronic)
Expert Review
Phone Interview
Focus Group
Direct Observation
Health Information Technology Evaluation Toolkit: 2009 Update 15
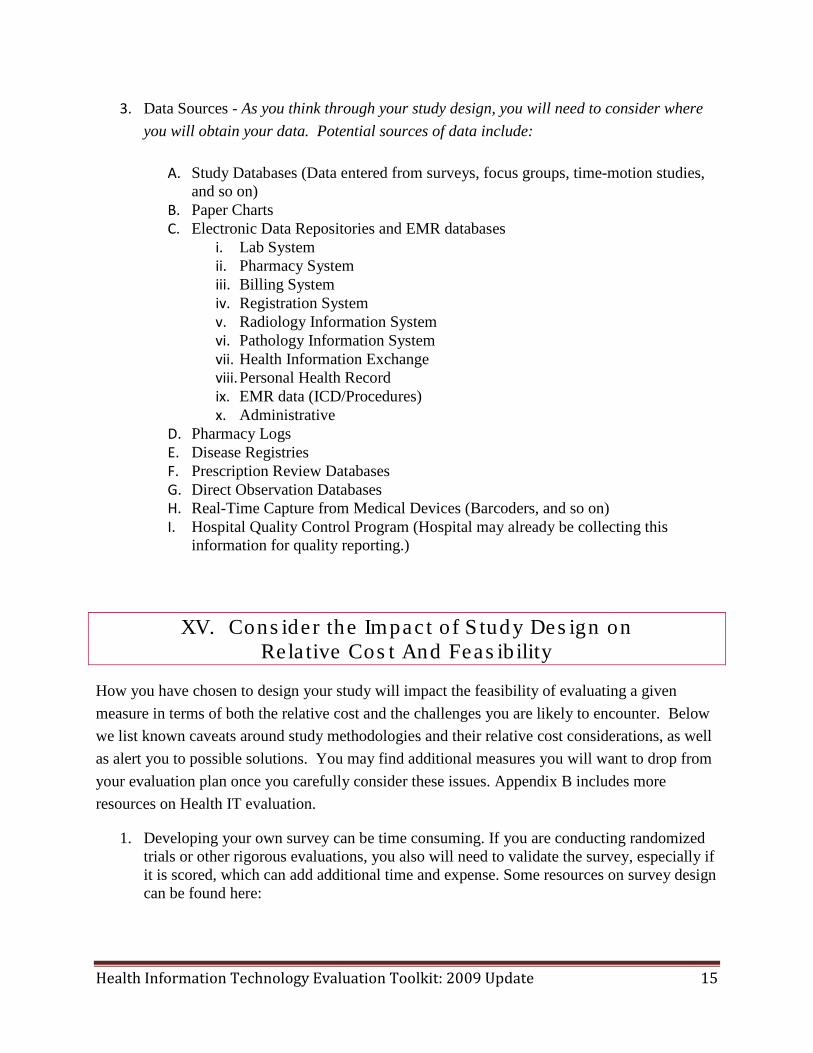
3. Data Sources - As you think through your study design, you will need to consider where you will obtain your data. Potential sources of data include:
A. Study Databases (Data entered from surveys, focus groups, time-motion studies, and so on)
B. Paper Charts C. Electronic Data Repositories and EMR databases
i. Lab System ii. Pharmacy System iii. Billing System iv. Registration System v. Radiology Information System vi. Pathology Information System vii. Health Information Exchange viii. Personal Health Record ix. EMR data (ICD/Procedures) x. Administrative
D. Pharmacy Logs E. Disease Registries F. Prescription Review Databases G. Direct Observation Databases H. Real-Time Capture from Medical Devices (Barcoders, and so on) I. Hospital Quality Control Program (Hospital may already be collecting this
information for quality reporting.)
XV. Cons ider the Impac t of S tudy Des ign on Re la tive Cos t And Feas ib ility
How you have chosen to design your study will impact the feasibility of evaluating a given measure in terms of both the relative cost and the challenges you are likely to encounter. Below we list known caveats around study methodologies and their relative cost considerations, as well as alert you to possible solutions. You may find additional measures you will want to drop from your evaluation plan once you carefully consider these issues. Appendix B includes more resources on Health IT evaluation.
1. Developing your own survey can be time consuming. If you are conducting randomized trials or other rigorous evaluations, you also will need to validate the survey, especially if it is scored, which can add additional time and expense. Some resources on survey design can be found here:
Health Information Technology Evaluation Toolkit: 2009 Update 16
A. Doyle JK. Introduction to survey methodology and design. In: Woods DW. Handbook for IQP advisors and students. Chap. 10. Worcester, MA: Worcester Polytechnic Institute; 2006.
B. AHRQ National Resource Center for Health IT. Health IT survey compendium. C. California Health Interview Survey. Survey design and methods. D. Hinkin TR. A brief tutorial on the development of measures for use in survey
questionnaires. Organizational Research Methods 1998;1(1):104-21. 2. Focus groups require planning and the logistics can become complicated when busy
stakeholders are asked to convene. The methodology for data analysis from focus groups requires the expertise of a qualitative researcher to analyze free-text narratives for themes and common principles. This can also increase the cost of your evaluation quickly.
A. Iowa State University. Focus group fundamentals. Methodology Brief (PM
1969b) 2004 May. B. Kitzinger, J. Qualitative research: introducing focus groups. BMJ 1995 Jul
29;311(7000):299-302. C. Robert Woods Johnson Foundation. Focus groups. D. Dawson S, Manderson L, Tallo VL. A manual for the use of focus groups
(Methods for social research in disease) Boston, MA: International Nutrition Foundation for Developing Countries; 1993.
.
3. Manual chart reviews are time consuming and expensive, depending on how many charts
you need to review or how many data elements are abstracted. Common pitfalls with chart reviews include unintentional data omission, data entry problems, or the chart itself may be incomplete or have missing information. In addition, reviewers can fatigue easily from the tediousness of the work.
4. Some prospective studies can be done fairly efficiently and quickly. For example, time-
motion studies (also known as work-sampling or observational studies) can be quickly performed by motivated research assistants or students at reasonable costs. However, these studies require the development of a list of tasks that the subjects will perform and also require that you have a data collection tool (personal digital assistant-based timer tool, paper-based tool, and so on) where you can record the times for the completion of each task. One could also automate the process by directly “instrumenting” an EMR, meaning specific programming is added to an EMR to capture data. For example, if evaluators want to evaluate the “usefulness of an alert,” programming is added to automatically track every time an alert is fired and every time that alert is followed. In another example, if evaluators want to capture use of e-prescribing, the system will automatically track and aggregate the number of times users prescribe medications electronically.
A. Finkler SA, Knickman JR, Hendrickson G, Lipkin M Jr, Thompson WG. A
comparison of work-sampling and time-motion techniques for studies in health services research. Health Serv Res 1993 Dec;28(5):577-97.
Health Information Technology Evaluation Toolkit: 2009 Update 17
B. Caughey MR, Chang BL. Computerized data collection: example of a time-motion study. West J Nurs Res 1998 Apr;20(2):251-6.
5. Other types of prospective studies (randomized controlled trials) and before-after type
observational studies are more complicated and expensive. They require modeling of the outcome variables using advanced statistical techniques (generalized linear models, logistic regression, analysis of variance (ANOVA), and so on). While they may provide the most accurate and valid data of all the study designs, they are also the most expensive to undertake. Appendix C includes more resources on statistics.
A. Sibbald B, Roland M. Understanding controlled trials: why are randomized trials
important? BMJ 1998;316(7126):201. B. Green S, Raley P. What to look for in a randomized controlled trial. Science
Editor 2000 Sept-Oct; 23(5):157. C. Concato J, Shah N, Horwitz R. Randomized, controlled trials, observational
studies, and the hierarchy of research designs. N Engl J Med 2000;342:1887-92.
6. For retrospective data analysis or case-control studies, you will need cohorts of matched cases and controls in order to then evaluate the outcome in question. The challenge in these studies is trying to identify the matched cases and controls.
A. Barlow WE, Ichikawa L, Rosner D, Izumi S. Analysis of case-cohort designs. J
Clin Epidemiol 1999 Dec;52(12):1165-72. B. Schenker M. Case control studies. Department of Public Health Sciences, UC
Davis. C. Meirik O. Cohort and case control studies. Geneva Foundation for Medical
Education and Research. D. Ernster VL. Nested case-control studies. Prev Med 1994 Sep;23(5):587-90.
7. Data mining refers to the use of sophisticated statistical techniques in the analysis of existing data within a given database. You may need to have access to experienced statisticians to model and analyze patterns within a dataset that can indicate certain conditions or outcomes.
A. Moore A. Statistical data mining tutorials. B. Palace B. Data mining. Technology notes prepared for management 274A; 1996.
XVI. Choos e Your Fina l Meas ures
Based on your study design choice and their relative costs, you may have eliminated additional measures from your evaluation plan. You should now be left with a final list of measures that you want to evaluate as part of your evaluation plan.

Health Information Technology Evaluation Toolkit: 2009 Update 18
Health Information Technology Evaluation Toolkit: 2009 Update 19
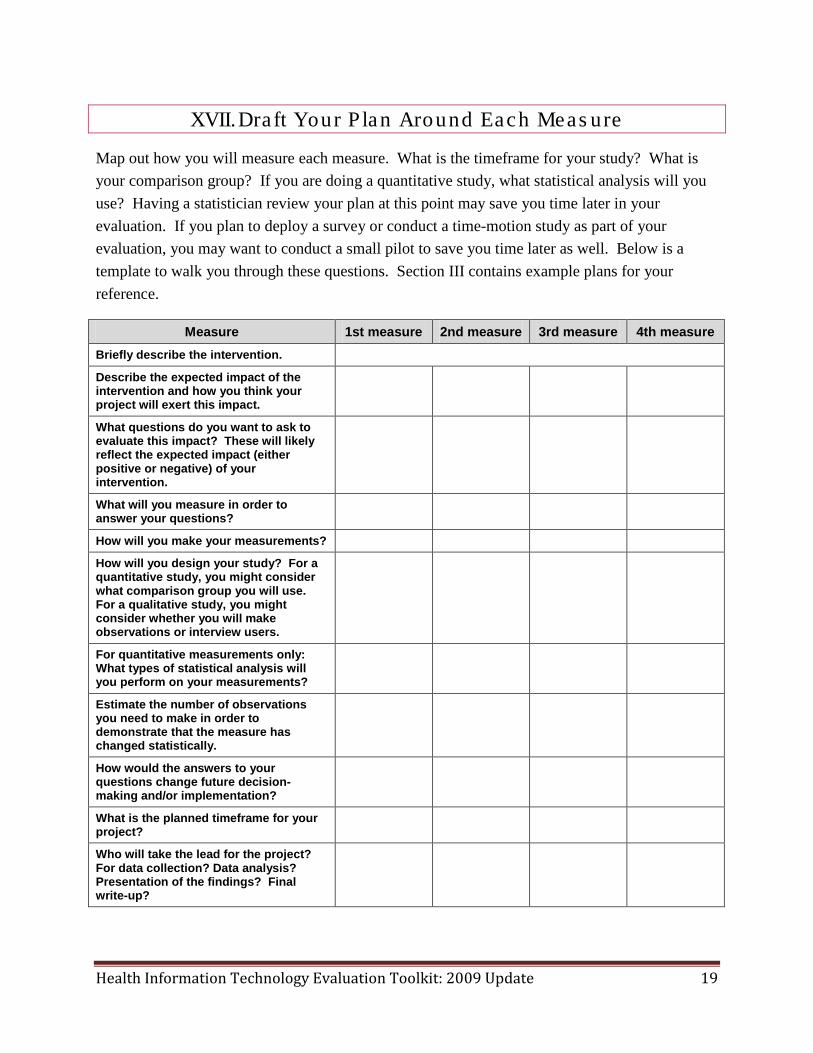
XVII. Draft Your P lan Around Each Meas ure
Map out how you will measure each measure. What is the timeframe for your study? What is your comparison group? If you are doing a quantitative study, what statistical analysis will you use? Having a statistician review your plan at this point may save you time later in your evaluation. If you plan to deploy a survey or conduct a time-motion study as part of your evaluation, you may want to conduct a small pilot to save you time later as well. Below is a template to walk you through these questions. Section III contains example plans for your reference.
Measure 1st measure 2nd measure 3rd measure 4th measure Briefly describe the intervention. Describe the expected impact of the intervention and how you think your project will exert this impact.
What questions do you want to ask to evaluate this impact? These will likely reflect the expected impact (either positive or negative) of your intervention.
What will you measure in order to answer your questions?
How will you make your measurements? How will you design your study? For a quantitative study, you might consider what comparison group you will use. For a qualitative study, you might consider whether you will make observations or interview users.
For quantitative measurements only: What types of statistical analysis will you perform on your measurements?
Estimate the number of observations you need to make in order to demonstrate that the measure has changed statistically.
How would the answers to your questions change future decision-making and/or implementation?
What is the planned timeframe for your project?
Who will take the lead for the project? For data collection? Data analysis? Presentation of the findings? Final write-up?
Health Information Technology Evaluation Toolkit: 2009 Update 20
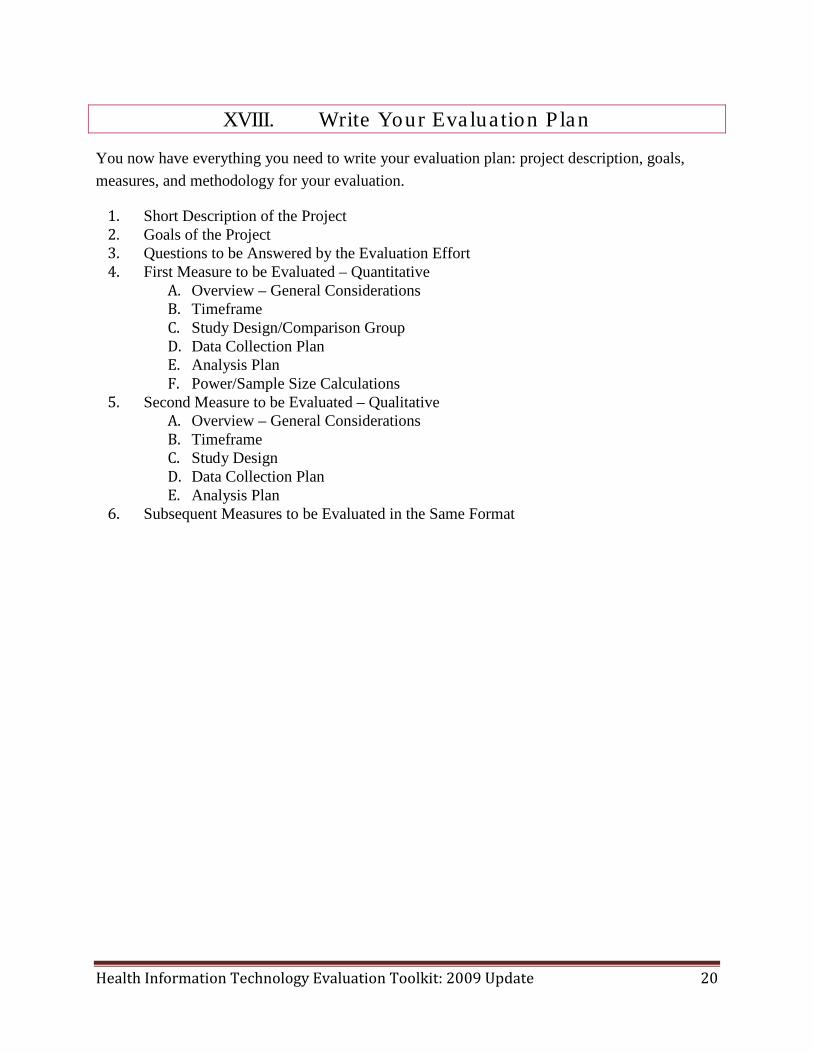
XVIII. Write Your Eva lua tion P lan
You now have everything you need to write your evaluation plan: project description, goals, measures, and methodology for your evaluation.
1. Short Description of the Project 2. Goals of the Project 3. Questions to be Answered by the Evaluation Effort 4. First Measure to be Evaluated – Quantitative
A. Overview – General Considerations B. Timeframe C. Study Design/Comparison Group D. Data Collection Plan E. Analysis Plan F. Power/Sample Size Calculations
5. Second Measure to be Evaluated – Qualitative A. Overview – General Considerations B. Timeframe C. Study Design D. Data Collection Plan E. Analysis Plan
6. Subsequent Measures to be Evaluated in the Same Format
Health Information Technology Evaluation Toolkit: 2009 Update 21
Section II: Examples o f Meas ures That May Be Us ed to Evalua te Your Pro jec t
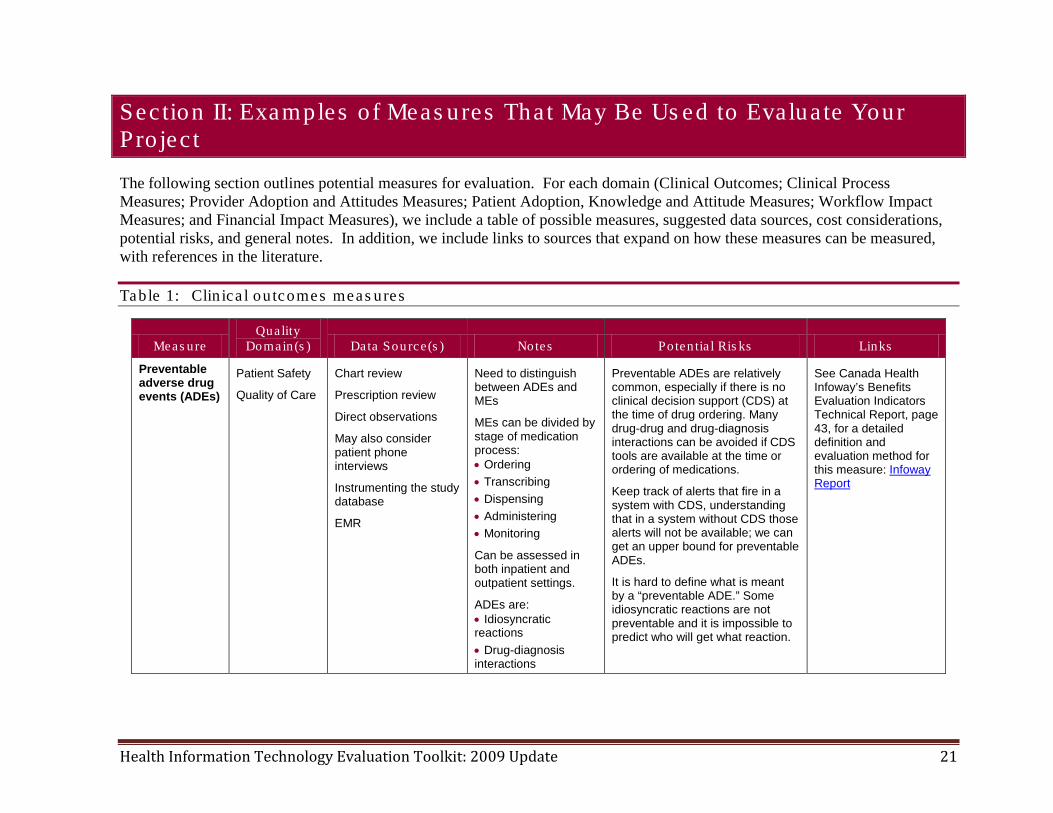
The following section outlines potential measures for evaluation. For each domain (Clinical Outcomes; Clinical Process Measures; Provider Adoption and Attitudes Measures; Patient Adoption, Knowledge and Attitude Measures; Workflow Impact Measures; and Financial Impact Measures), we include a table of possible measures, suggested data sources, cost considerations, potential risks, and general notes. In addition, we include links to sources that expand on how these measures can be measured, with references in the literature.
Table 1: Clin ica l ou tcomes meas ures
Meas ure Quality
Domain(s ) Data Sou rce(s ) Notes Po ten tia l Ris ks Links
Preventable adverse drug events (ADEs)
Patient Safety
Quality of Care
Chart review
Prescription review
Direct observations
May also consider patient phone interviews
Instrumenting the study database
EMR
Need to distinguish between ADEs and MEs
MEs can be divided by stage of medication process: • Ordering • Transcribing • Dispensing • Administering • Monitoring
Can be assessed in both inpatient and outpatient settings.
ADEs are: • Idiosyncratic reactions • Drug-diagnosis interactions
Preventable ADEs are relatively common, especially if there is no clinical decision support (CDS) at the time of drug ordering. Many drug-drug and drug-diagnosis interactions can be avoided if CDS tools are available at the time or ordering of medications.
Keep track of alerts that fire in a system with CDS, understanding that in a system without CDS those alerts will not be available; we can get an upper bound for preventable ADEs.
It is hard to define what is meant by a “preventable ADE.” Some idiosyncratic reactions are not preventable and it is impossible to predict who will get what reaction.
See Canada Health Infoway’s Benefits Evaluation Indicators Technical Report, page 43, for a detailed definition and evaluation method for this measure: Infoway Report
Health Information Technology Evaluation Toolkit: 2009 Update 22
Meas ure Quality
Domain(s ) Data Sou rce(s ) Notes Po ten tia l Ris ks Links
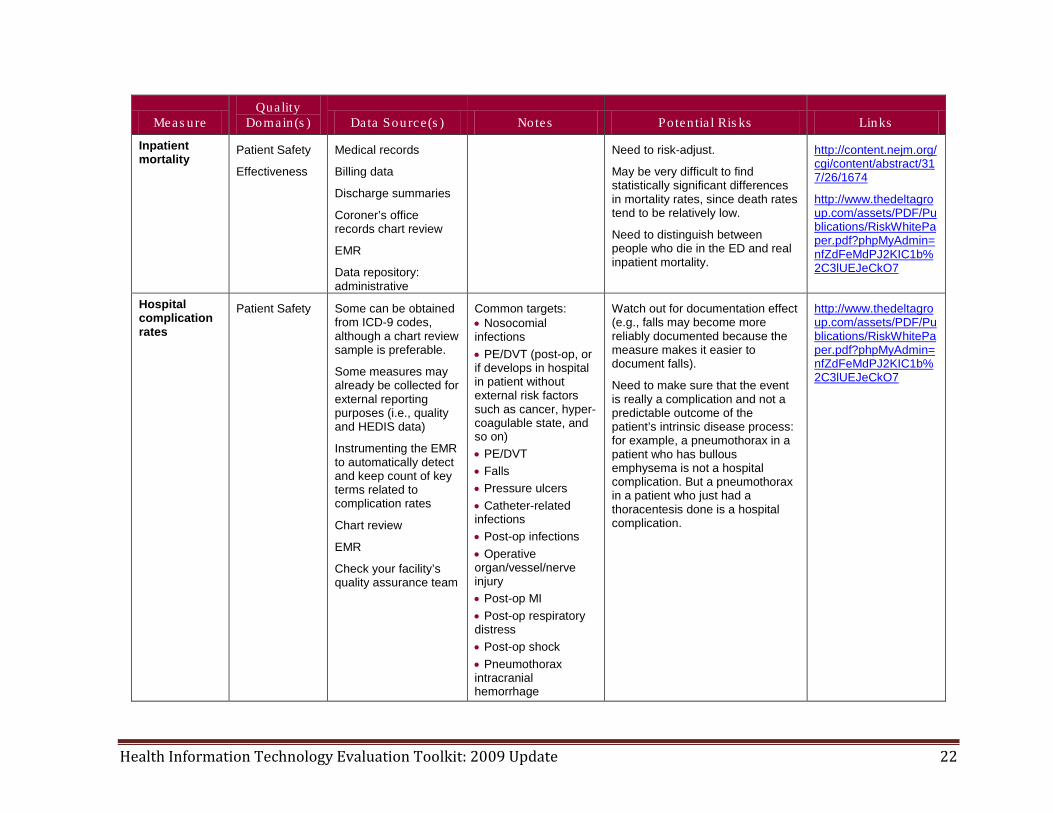
Inpatient mortality
Patient Safety
Effectiveness
Medical records
Billing data
Discharge summaries
Coroner’s office records chart review
EMR
Data repository: administrative
Need to risk-adjust.
May be very difficult to find statistically significant differences in mortality rates, since death rates tend to be relatively low.
Need to distinguish between people who die in the ED and real inpatient mortality.
http://content.nejm.org/cgi/content/abstract/317/26/1674
http://www.thedeltagroup.com/assets/PDF/Publications/RiskWhitePaper.pdf?phpMyAdmin=nfZdFeMdPJ2KIC1b%2C3lUEJeCkO7
Hospital complication rates
Patient Safety Some can be obtained from ICD-9 codes, although a chart review sample is preferable.
Some measures may already be collected for external reporting purposes (i.e., quality and HEDIS data)
Instrumenting the EMR to automatically detect and keep count of key terms related to complication rates
Chart review
EMR
Check your facility’s quality assurance team
Common targets: • Nosocomial infections • PE/DVT (post-op, or if develops in hospital in patient without external risk factors such as cancer, hyper-coagulable state, and so on) • PE/DVT • Falls • Pressure ulcers • Catheter-related infections • Post-op infections • Operative organ/vessel/nerve injury • Post-op MI • Post-op respiratory distress • Post-op shock • Pneumothorax intracranial hemorrhage
Watch out for documentation effect (e.g., falls may become more reliably documented because the measure makes it easier to document falls).
Need to make sure that the event is really a complication and not a predictable outcome of the patient’s intrinsic disease process: for example, a pneumothorax in a patient who has bullous emphysema is not a hospital complication. But a pneumothorax in a patient who just had a thoracentesis done is a hospital complication.
http://www.thedeltagroup.com/assets/PDF/Publications/RiskWhitePaper.pdf?phpMyAdmin=nfZdFeMdPJ2KIC1b%2C3lUEJeCkO7
Health Information Technology Evaluation Toolkit: 2009 Update 23
Meas ure Quality
Domain(s ) Data Sou rce(s ) Notes Po ten tia l Ris ks Links
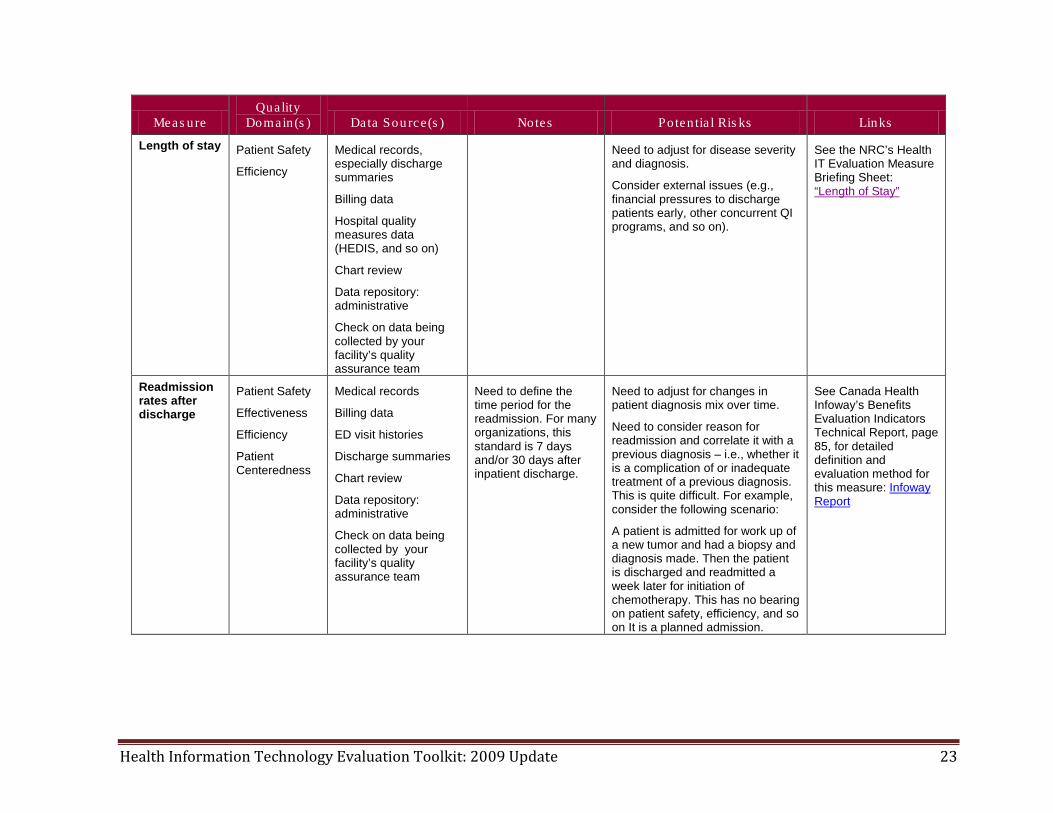
Length of stay Patient Safety
Efficiency
Medical records, especially discharge summaries
Billing data
Hospital quality measures data (HEDIS, and so on)
Chart review
Data repository: administrative
Check on data being collected by your facility’s quality assurance team
Need to adjust for disease severity and diagnosis.
Consider external issues (e.g., financial pressures to discharge patients early, other concurrent QI programs, and so on).
See the NRC’s Health IT Evaluation Measure Briefing Sheet: “Length of Stay”
Readmission rates after discharge
Patient Safety
Effectiveness
Efficiency
Patient Centeredness
Medical records
Billing data
ED visit histories
Discharge summaries
Chart review
Data repository: administrative
Check on data being collected by your facility’s quality assurance team
Need to define the time period for the readmission. For many organizations, this standard is 7 days and/or 30 days after inpatient discharge.
Need to adjust for changes in patient diagnosis mix over time.
Need to consider reason for readmission and correlate it with a previous diagnosis – i.e., whether it is a complication of or inadequate treatment of a previous diagnosis. This is quite difficult. For example, consider the following scenario:
A patient is admitted for work up of a new tumor and had a biopsy and diagnosis made. Then the patient is discharged and readmitted a week later for initiation of chemotherapy. This has no bearing on patient safety, efficiency, and so on It is a planned admission.
See Canada Health Infoway’s Benefits Evaluation Indicators Technical Report, page 85, for detailed definition and evaluation method for this measure: Infoway Report
Health Information Technology Evaluation Toolkit: 2009 Update 24
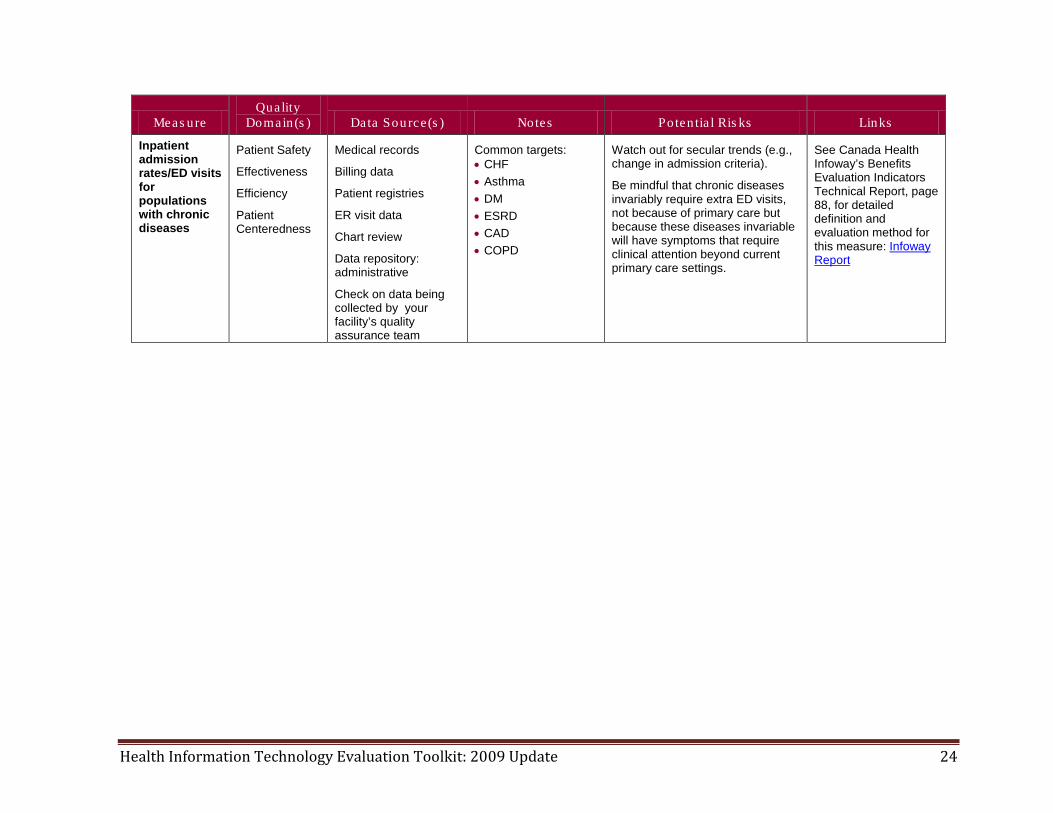
Meas ure Quality
Domain(s ) Data Sou rce(s ) Notes Po ten tia l Ris ks Links
Inpatient admission rates/ED visits for populations with chronic diseases
Patient Safety
Effectiveness
Efficiency
Patient Centeredness
Medical records
Billing data
Patient registries
ER visit data
Chart review
Data repository: administrative
Check on data being collected by your facility’s quality assurance team
Common targets: • CHF • Asthma • DM • ESRD • CAD • COPD
Watch out for secular trends (e.g., change in admission criteria).
Be mindful that chronic diseases invariably require extra ED visits, not because of primary care but because these diseases invariable will have symptoms that require clinical attention beyond current primary care settings.
See Canada Health Infoway’s Benefits Evaluation Indicators Technical Report, page 88, for detailed definition and evaluation method for this measure: Infoway Report
Health Information Technology Evaluation Toolkit: 2009 Update 25
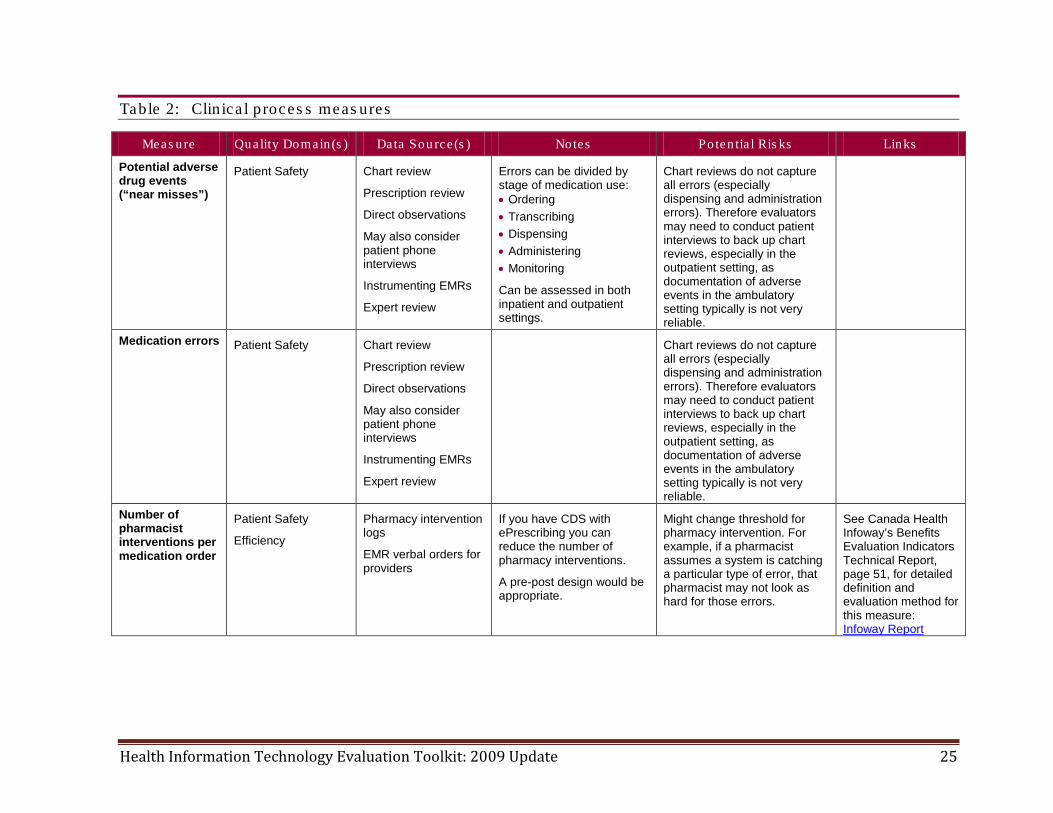
Table 2: Clin ica l p roces s meas ures
Meas ure Quality Domain(s ) Data Sou rce(s ) Notes Po ten tia l Ris ks Links
Potential adverse drug events (“near misses”)
Patient Safety Chart review
Prescription review
Direct observations
May also consider patient phone interviews
Instrumenting EMRs
Expert review
Errors can be divided by stage of medication use: • Ordering • Transcribing • Dispensing • Administering • Monitoring
Can be assessed in both inpatient and outpatient settings.
Chart reviews do not capture all errors (especially dispensing and administration errors). Therefore evaluators may need to conduct patient interviews to back up chart reviews, especially in the outpatient setting, as documentation of adverse events in the ambulatory setting typically is not very reliable.
Medication errors Patient Safety Chart review
Prescription review
Direct observations
May also consider patient phone interviews
Instrumenting EMRs
Expert review
Chart reviews do not capture all errors (especially dispensing and administration errors). Therefore evaluators may need to conduct patient interviews to back up chart reviews, especially in the outpatient setting, as documentation of adverse events in the ambulatory setting typically is not very reliable.
Number of pharmacist interventions per medication order
Patient Safety
Efficiency
Pharmacy intervention logs
EMR verbal orders for providers
If you have CDS with ePrescribing you can reduce the number of pharmacy interventions.
A pre-post design would be appropriate.
Might change threshold for pharmacy intervention. For example, if a pharmacist assumes a system is catching a particular type of error, that pharmacist may not look as hard for those errors.
See Canada Health Infoway’s Benefits Evaluation Indicators Technical Report, page 51, for detailed definition and evaluation method for this measure: Infoway Report
Health Information Technology Evaluation Toolkit: 2009 Update 26
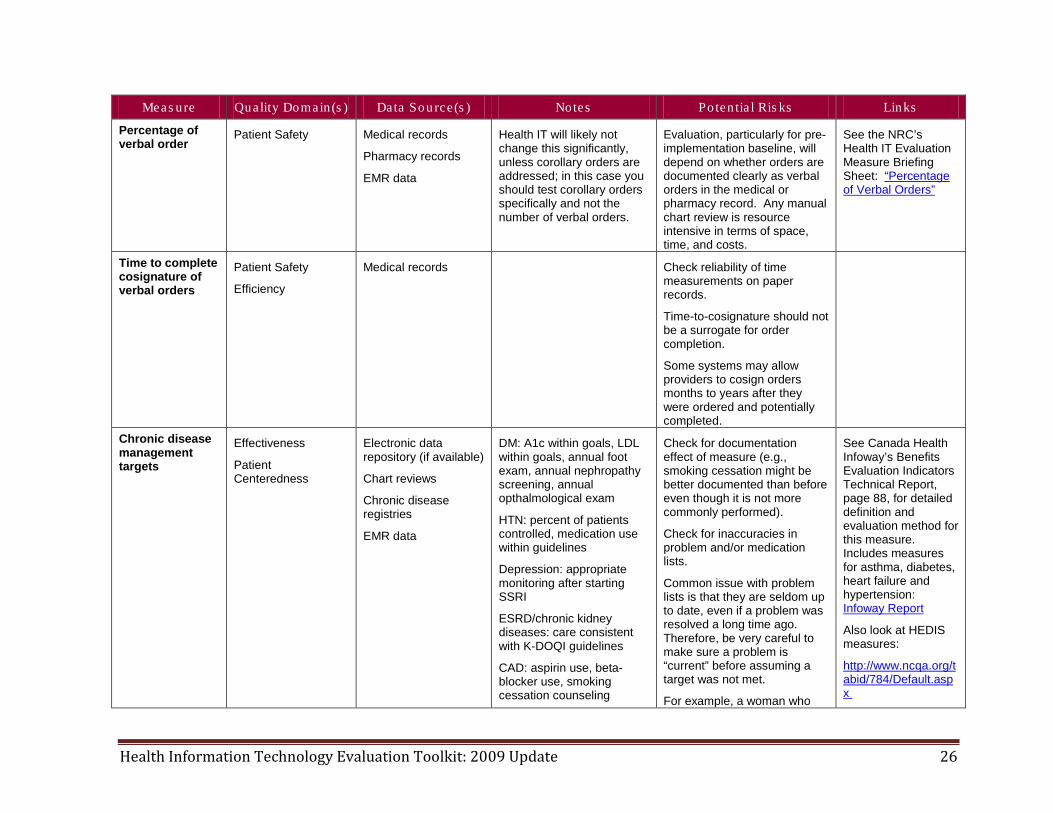
Meas ure Quality Domain(s ) Data Sou rce(s ) Notes Po ten tia l Ris ks Links
Percentage of verbal order
Patient Safety Medical records
Pharmacy records
EMR data
Health IT will likely not change this significantly, unless corollary orders are addressed; in this case you should test corollary orders specifically and not the number of verbal orders.
Evaluation, particularly for pre-implementation baseline, will depend on whether orders are documented clearly as verbal orders in the medical or pharmacy record. Any manual chart review is resource intensive in terms of space, time, and costs.
See the NRC’s Health IT Evaluation Measure Briefing Sheet: “Percentage of Verbal Orders”
Time to complete cosignature of verbal orders
Patient Safety
Efficiency
Medical records Check reliability of time measurements on paper records.
Time-to-cosignature should not be a surrogate for order completion.
Some systems may allow providers to cosign orders months to years after they were ordered and potentially completed.
Chronic disease management targets
Effectiveness
Patient Centeredness
Electronic data repository (if available)
Chart reviews
Chronic disease registries
EMR data
DM: A1c within goals, LDL within goals, annual foot exam, annual nephropathy screening, annual opthalmological exam
HTN: percent of patients controlled, medication use within guidelines
Depression: appropriate monitoring after starting SSRI
ESRD/chronic kidney diseases: care consistent with K-DOQI guidelines
CAD: aspirin use, beta-blocker use, smoking cessation counseling
Check for documentation effect of measure (e.g., smoking cessation might be better documented than before even though it is not more commonly performed).
Check for inaccuracies in problem and/or medication lists.
Common issue with problem lists is that they are seldom up to date, even if a problem was resolved a long time ago. Therefore, be very careful to make sure a problem is “current” before assuming a target was not met.
For example, a woman who
See Canada Health Infoway’s Benefits Evaluation Indicators Technical Report, page 88, for detailed definition and evaluation method for this measure. Includes measures for asthma, diabetes, heart failure and hypertension: Infoway Report
Also look at HEDIS measures:
http://www.ncqa.org/tabid/784/Default.aspx
Health Information Technology Evaluation Toolkit: 2009 Update 27
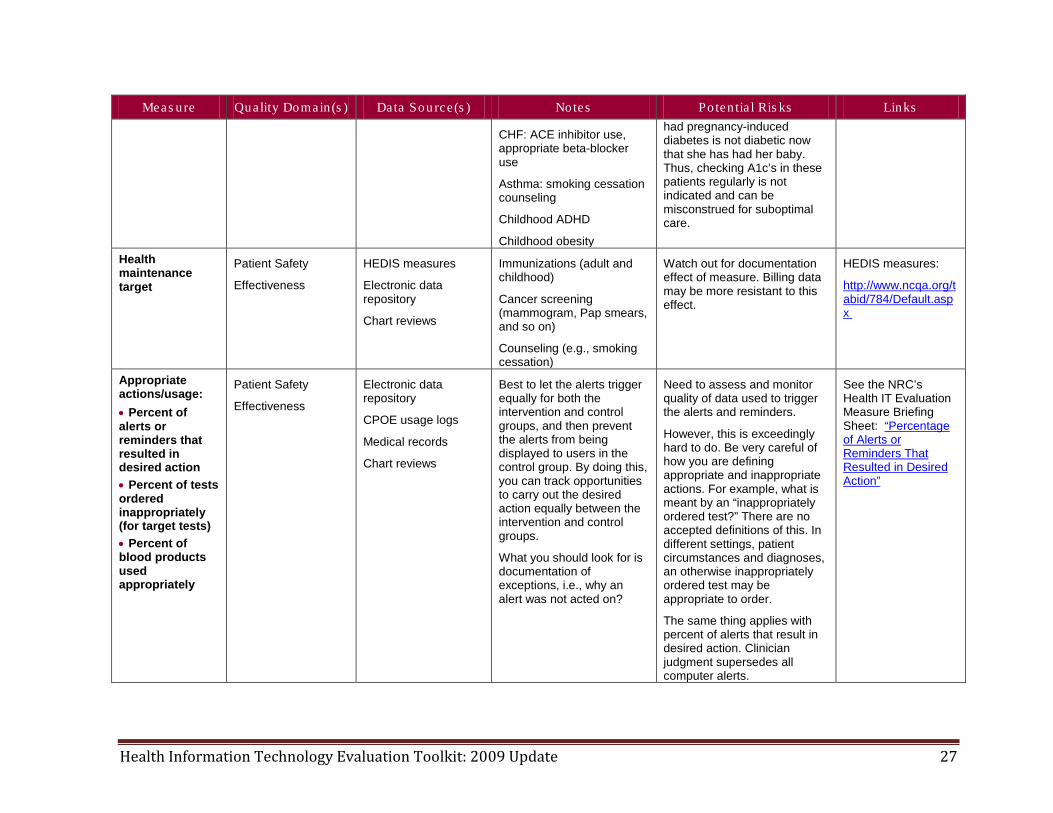
Meas ure Quality Domain(s ) Data Sou rce(s ) Notes Po ten tia l Ris ks Links
CHF: ACE inhibitor use, appropriate beta-blocker use
Asthma: smoking cessation counseling
Childhood ADHD
Childhood obesity
had pregnancy-induced diabetes is not diabetic now that she has had her baby. Thus, checking A1c’s in these patients regularly is not indicated and can be misconstrued for suboptimal care.
Health maintenance target
Patient Safety
Effectiveness
HEDIS measures
Electronic data repository
Chart reviews
Immunizations (adult and childhood)
Cancer screening (mammogram, Pap smears, and so on)
Counseling (e.g., smoking cessation)
Watch out for documentation effect of measure. Billing data may be more resistant to this effect.
HEDIS measures:
http://www.ncqa.org/tabid/784/Default.aspx
Appropriate actions/usage: • Percent of alerts or reminders that resulted in desired action • Percent of tests ordered inappropriately (for target tests) • Percent of blood products used appropriately
Patient Safety
Effectiveness
Electronic data repository
CPOE usage logs
Medical records
Chart reviews
Best to let the alerts trigger equally for both the intervention and control groups, and then prevent the alerts from being displayed to users in the control group. By doing this, you can track opportunities to carry out the desired action equally between the intervention and control groups.
What you should look for is documentation of exceptions, i.e., why an alert was not acted on?
Need to assess and monitor quality of data used to trigger the alerts and reminders.
However, this is exceedingly hard to do. Be very careful of how you are defining appropriate and inappropriate actions. For example, what is meant by an “inappropriately ordered test?” There are no accepted definitions of this. In different settings, patient circumstances and diagnoses, an otherwise inappropriately ordered test may be appropriate to order.
The same thing applies with percent of alerts that result in desired action. Clinician judgment supersedes all computer alerts.
See the NRC’s Health IT Evaluation Measure Briefing Sheet: “Percentage of Alerts or Reminders That Resulted in Desired Action”
Health Information Technology Evaluation Toolkit: 2009 Update 28
Meas ure Quality Domain(s ) Data Sou rce(s ) Notes Po ten tia l Ris ks Links
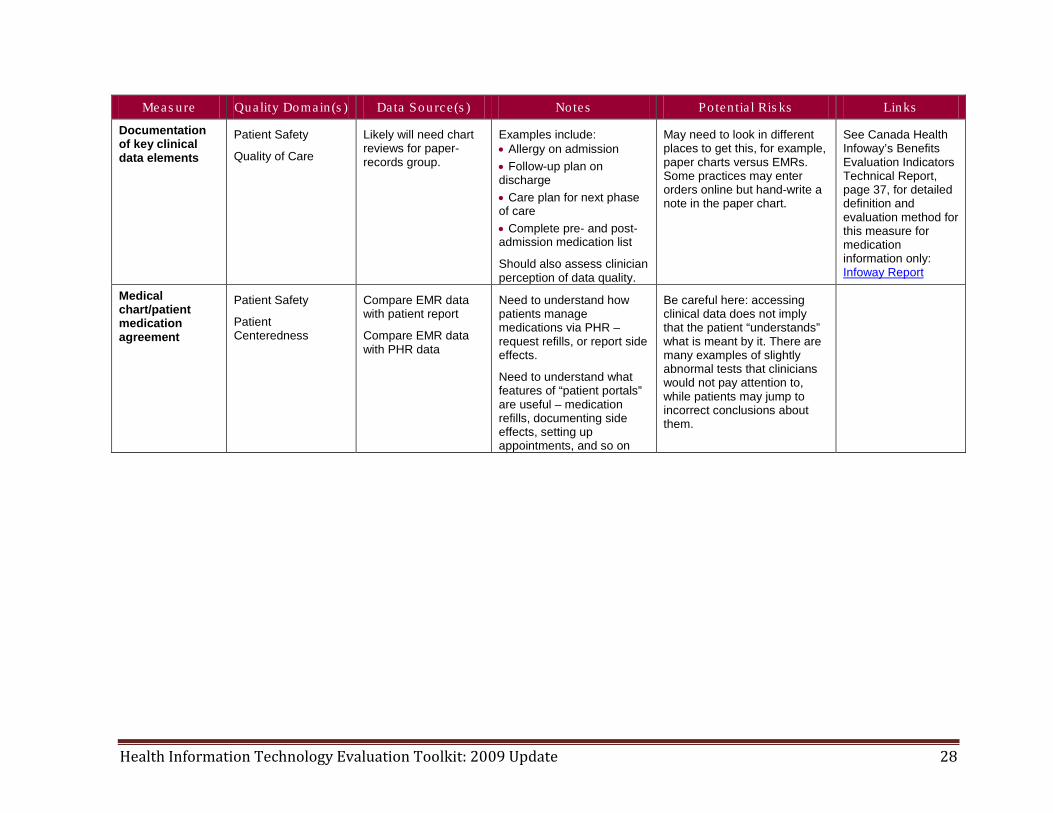
Documentation of key clinical data elements
Patient Safety
Quality of Care
Likely will need chart reviews for paper-records group.
Examples include: • Allergy on admission • Follow-up plan on discharge • Care plan for next phase of care • Complete pre- and post-admission medication list
Should also assess clinician perception of data quality.
May need to look in different places to get this, for example, paper charts versus EMRs. Some practices may enter orders online but hand-write a note in the paper chart.
See Canada Health Infoway’s Benefits Evaluation Indicators Technical Report, page 37, for detailed definition and evaluation method for this measure for medication information only: Infoway Report
Medical chart/patient medication agreement
Patient Safety
Patient Centeredness
Compare EMR data with patient report
Compare EMR data with PHR data
Need to understand how patients manage medications via PHR –request refills, or report side effects.
Need to understand what features of “patient portals” are useful – medication refills, documenting side effects, setting up appointments, and so on
Be careful here: accessing clinical data does not imply that the patient “understands” what is meant by it. There are many examples of slightly abnormal tests that clinicians would not pay attention to, while patients may jump to incorrect conclusions about them.
Health Information Technology Evaluation Toolkit: 2009 Update 29
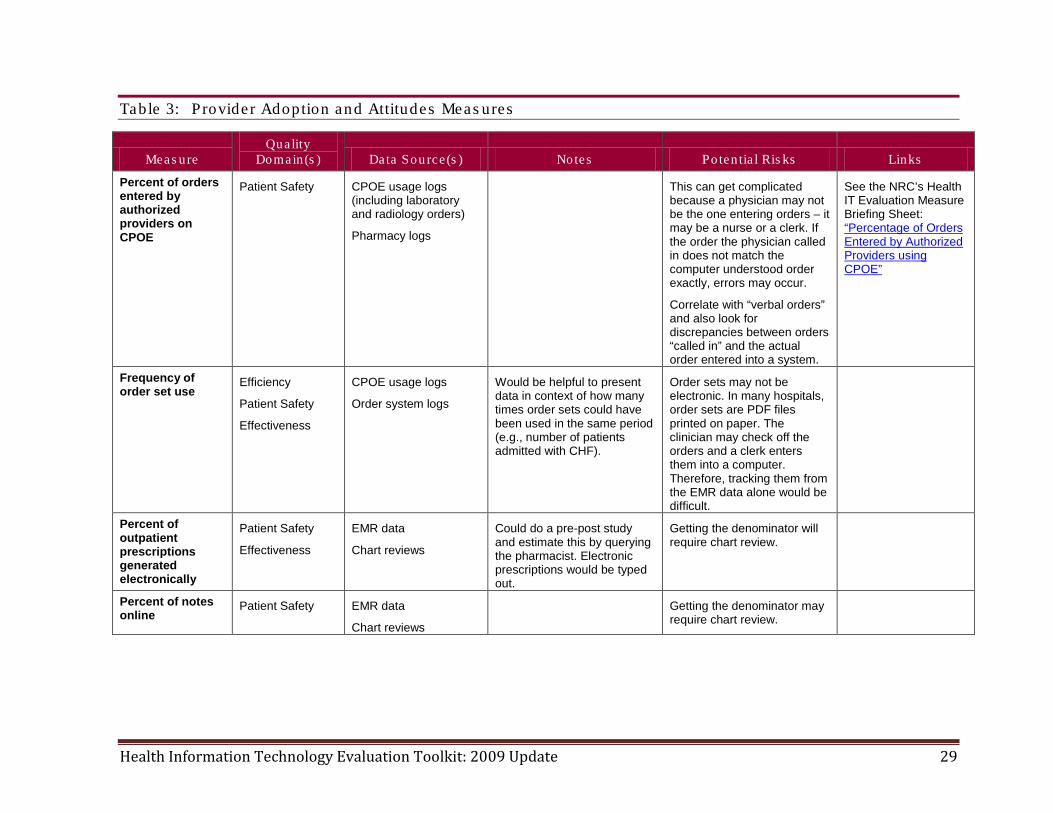
Table 3: Provider Adoption and Attitudes Meas ures
Meas ure Quality
Domain(s ) Data Sou rce(s ) Notes Po ten tia l Ris ks Links
Percent of orders entered by authorized providers on CPOE
Patient Safety CPOE usage logs (including laboratory and radiology orders)
Pharmacy logs
This can get complicated because a physician may not be the one entering orders – it may be a nurse or a clerk. If the order the physician called in does not match the computer understood order exactly, errors may occur.
Correlate with “verbal orders” and also look for discrepancies between orders “called in” and the actual order entered into a system.
See the NRC’s Health IT Evaluation Measure Briefing Sheet: “Percentage of Orders Entered by Authorized Providers using CPOE”
Frequency of order set use
Efficiency
Patient Safety
Effectiveness
CPOE usage logs
Order system logs
Would be helpful to present data in context of how many times order sets could have been used in the same period (e.g., number of patients admitted with CHF).
Order sets may not be electronic. In many hospitals, order sets are PDF files printed on paper. The clinician may check off the orders and a clerk enters them into a computer. Therefore, tracking them from the EMR data alone would be difficult.
Percent of outpatient prescriptions generated electronically
Patient Safety
Effectiveness
EMR data
Chart reviews
Could do a pre-post study and estimate this by querying the pharmacist. Electronic prescriptions would be typed out.
Getting the denominator will require chart review.
Percent of notes online
Patient Safety EMR data
Chart reviews
Getting the denominator may require chart review.
Health Information Technology Evaluation Toolkit: 2009 Update 30
Meas ure Quality
Domain(s ) Data Sou rce(s ) Notes Po ten tia l Ris ks Links
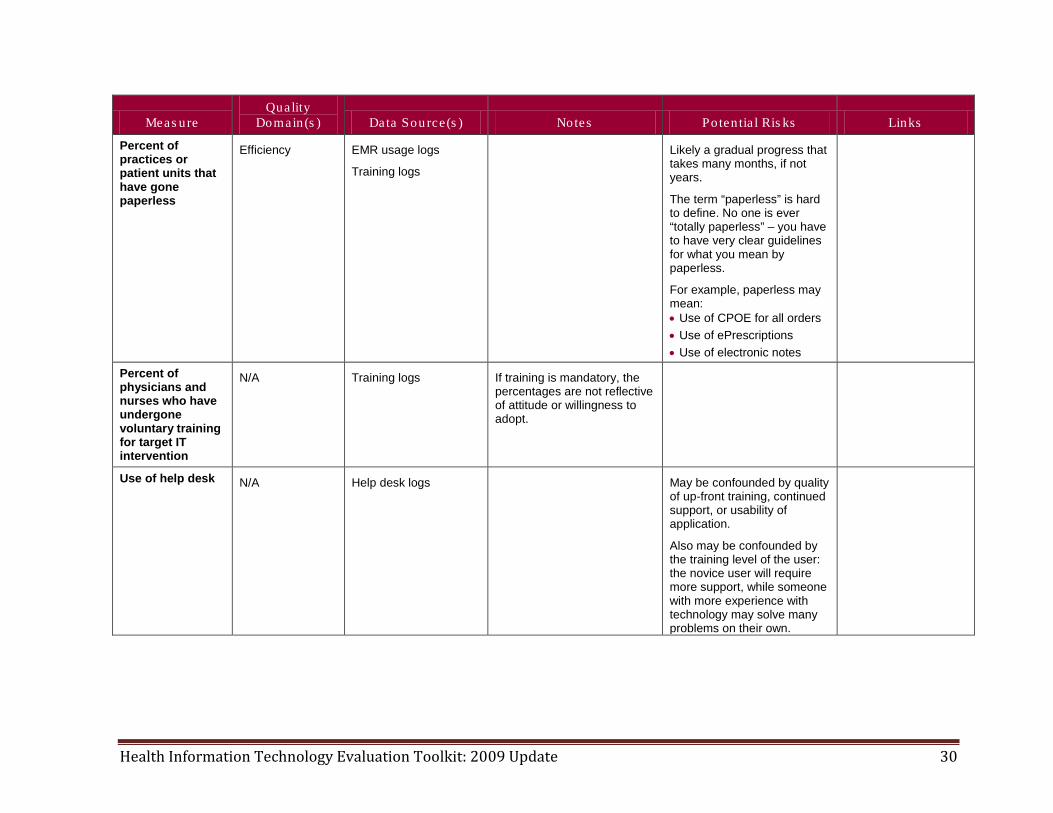
Percent of practices or patient units that have gone paperless
Efficiency EMR usage logs
Training logs
Likely a gradual progress that takes many months, if not years.
The term “paperless” is hard to define. No one is ever “totally paperless” – you have to have very clear guidelines for what you mean by paperless.
For example, paperless may mean: • Use of CPOE for all orders • Use of ePrescriptions • Use of electronic notes
Percent of physicians and nurses who have undergone voluntary training for target IT intervention
N/A Training logs If training is mandatory, the percentages are not reflective of attitude or willingness to adopt.
Use of help desk N/A Help desk logs May be confounded by quality of up-front training, continued support, or usability of application.
Also may be confounded by the training level of the user: the novice user will require more support, while someone with more experience with technology may solve many problems on their own.
Health Information Technology Evaluation Toolkit: 2009 Update 31
Meas ure Quality
Domain(s ) Data Sou rce(s ) Notes Po ten tia l Ris ks Links
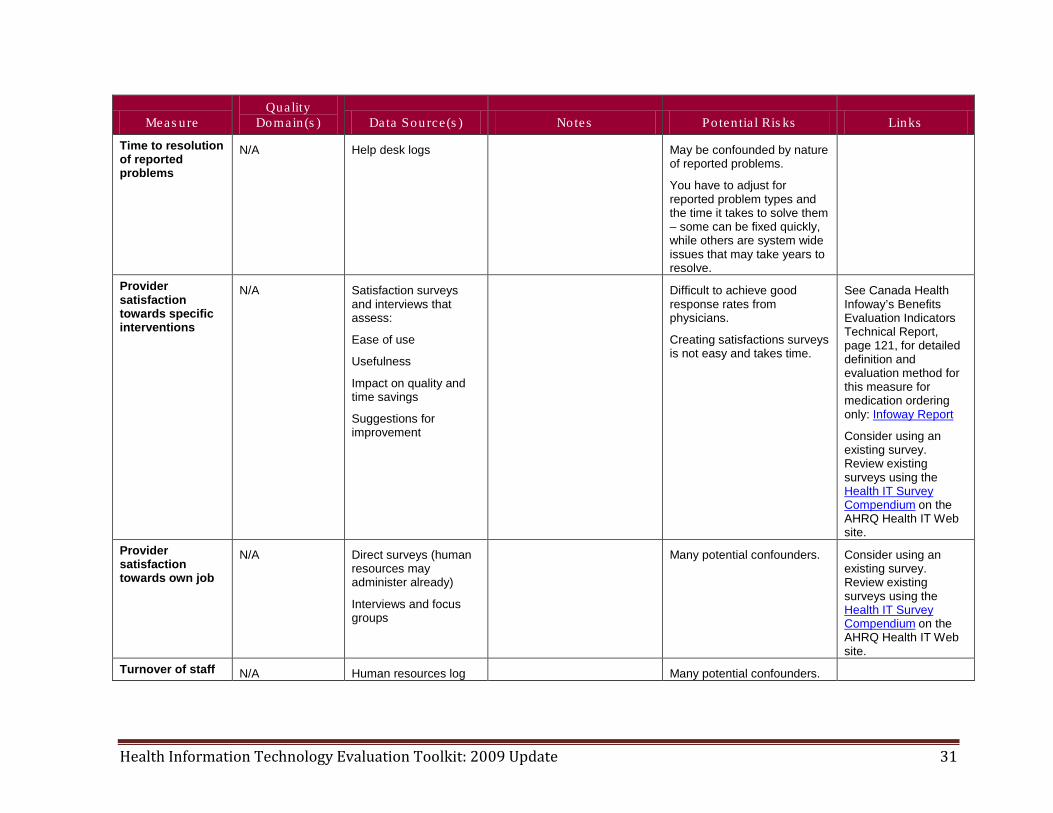
Time to resolution of reported problems
N/A Help desk logs May be confounded by nature of reported problems.
You have to adjust for reported problem types and the time it takes to solve them – some can be fixed quickly, while others are system wide issues that may take years to resolve.
Provider satisfaction towards specific interventions
N/A Satisfaction surveys and interviews that assess:
Ease of use
Usefulness
Impact on quality and time savings
Suggestions for improvement
Difficult to achieve good response rates from physicians.
Creating satisfactions surveys is not easy and takes time.
See Canada Health Infoway’s Benefits Evaluation Indicators Technical Report, page 121, for detailed definition and evaluation method for this measure for medication ordering only: Infoway Report
Consider using an existing survey. Review existing surveys using the Health IT Survey Compendium on the AHRQ Health IT Web site.
Provider satisfaction towards own job
N/A Direct surveys (human resources may administer already)
Interviews and focus groups
Many potential confounders.
Consider using an existing survey. Review existing surveys using the Health IT Survey Compendium on the AHRQ Health IT Web site.
Turnover of staff N/A Human resources log Many potential confounders.
Health Information Technology Evaluation Toolkit: 2009 Update 32
Meas ure Quality
Domain(s ) Data Sou rce(s ) Notes Po ten tia l Ris ks Links
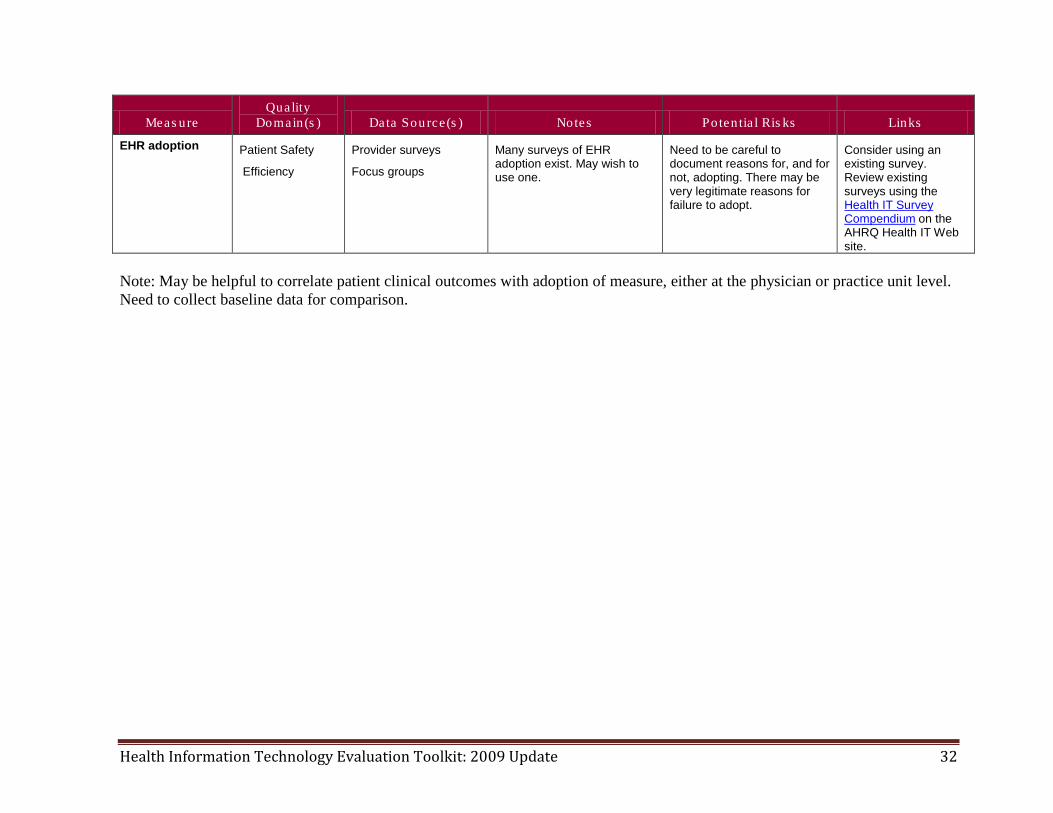
EHR adoption Patient Safety
Efficiency
Provider surveys
Focus groups
Many surveys of EHR adoption exist. May wish to use one.
Need to be careful to document reasons for, and for not, adopting. There may be very legitimate reasons for failure to adopt.
Consider using an existing survey. Review existing surveys using the Health IT Survey Compendium on the AHRQ Health IT Web site.
Note: May be helpful to correlate patient clinical outcomes with adoption of measure, either at the physician or practice unit level. Need to collect baseline data for comparison.
Health Information Technology Evaluation Toolkit: 2009 Update 33
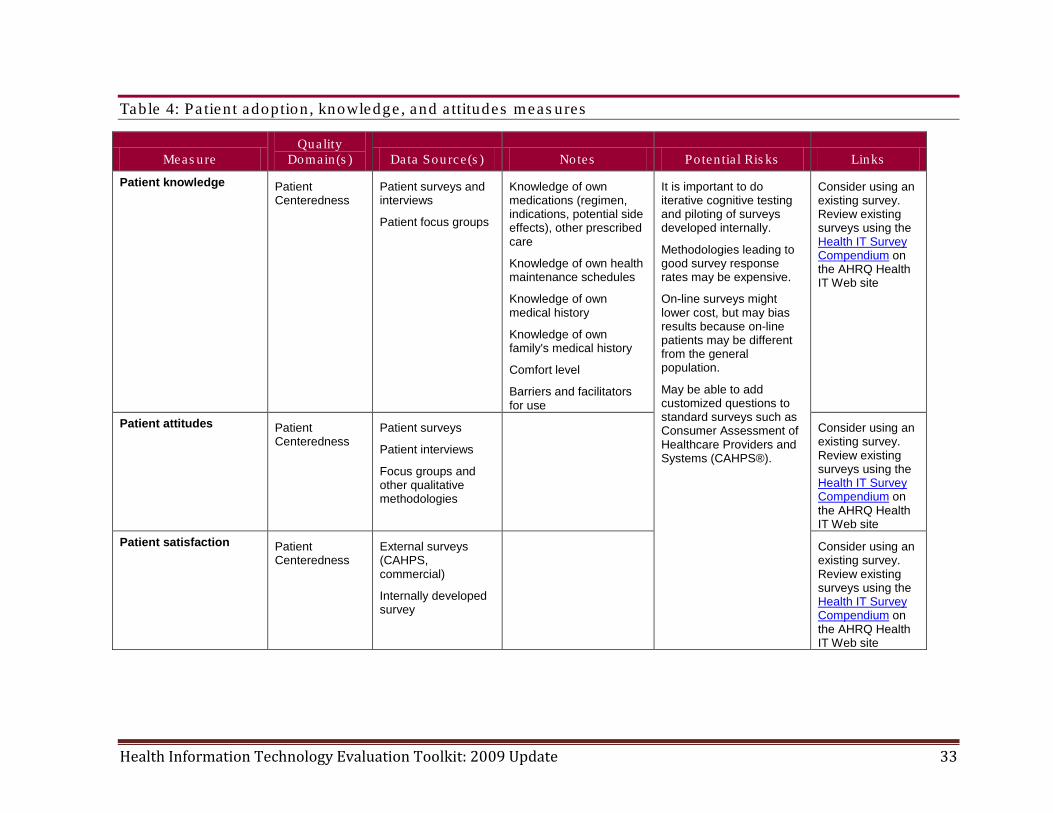
Table 4: Pa tien t adoption , knowledge , and a ttitudes meas ures
Meas ure Quality
Domain(s ) Data Sou rce(s ) Notes Po ten tia l Ris ks Links
Patient knowledge Patient Centeredness
Patient surveys and interviews
Patient focus groups
Knowledge of own medications (regimen, indications, potential side effects), other prescribed care
Knowledge of own health maintenance schedules
Knowledge of own medical history
Knowledge of own family's medical history
Comfort level
Barriers and facilitators for use
It is important to do iterative cognitive testing and piloting of surveys developed internally.
Methodologies leading to good survey response rates may be expensive.
On-line surveys might lower cost, but may bias results because on-line patients may be different from the general population.
May be able to add customized questions to standard surveys such as Consumer Assessment of Healthcare Providers and Systems (CAHPS®).
Consider using an existing survey. Review existing surveys using the Health IT Survey Compendium on the AHRQ Health IT Web site
Patient attitudes Patient Centeredness
Patient surveys
Patient interviews
Focus groups and other qualitative methodologies
Consider using an existing survey. Review existing surveys using the Health IT Survey Compendium on the AHRQ Health IT Web site
Patient satisfaction Patient Centeredness
External surveys (CAHPS, commercial)
Internally developed survey
Consider using an existing survey. Review existing surveys using the Health IT Survey Compendium on the AHRQ Health IT Web site
Health Information Technology Evaluation Toolkit: 2009 Update 34
Meas ure Quality
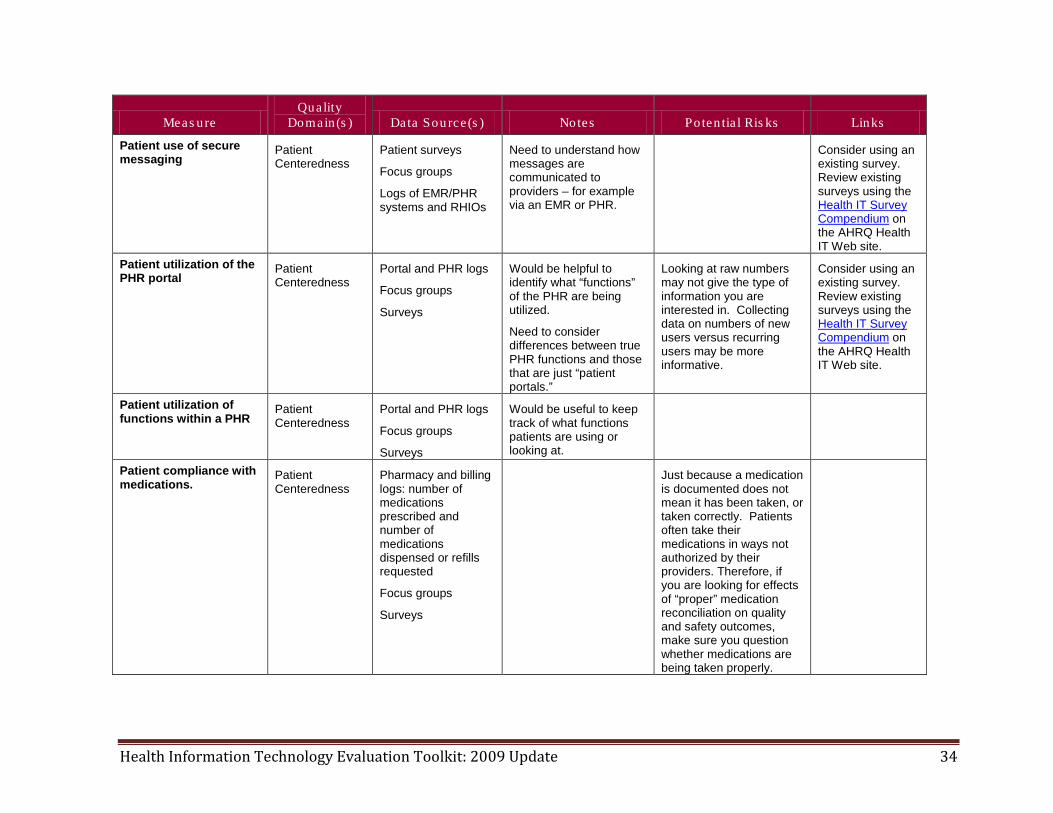
Domain(s ) Data Sou rce(s ) Notes Po ten tia l Ris ks Links
Patient use of secure messaging
Patient Centeredness
Patient surveys
Focus groups
Logs of EMR/PHR systems and RHIOs
Need to understand how messages are communicated to providers – for example via an EMR or PHR.
Consider using an existing survey. Review existing surveys using the Health IT Survey Compendium on the AHRQ Health IT Web site.
Patient utilization of the PHR portal
Patient Centeredness
Portal and PHR logs
Focus groups
Surveys
Would be helpful to identify what “functions” of the PHR are being utilized.
Need to consider differences between true PHR functions and those that are just “patient portals.”
Looking at raw numbers may not give the type of information you are interested in. Collecting data on numbers of new users versus recurring users may be more informative.
Consider using an existing survey. Review existing surveys using the Health IT Survey Compendium on the AHRQ Health IT Web site.
Patient utilization of functions within a PHR
Patient Centeredness
Portal and PHR logs
Focus groups
Surveys
Would be useful to keep track of what functions patients are using or looking at.
Patient compliance with medications.
Patient Centeredness
Pharmacy and billing logs: number of medications prescribed and number of medications dispensed or refills requested
Focus groups
Surveys
Just because a medication is documented does not mean it has been taken, or taken correctly. Patients often take their medications in ways not authorized by their providers. Therefore, if you are looking for effects of “proper” medication reconciliation on quality and safety outcomes, make sure you question whether medications are being taken properly.
Health Information Technology Evaluation Toolkit: 2009 Update 35
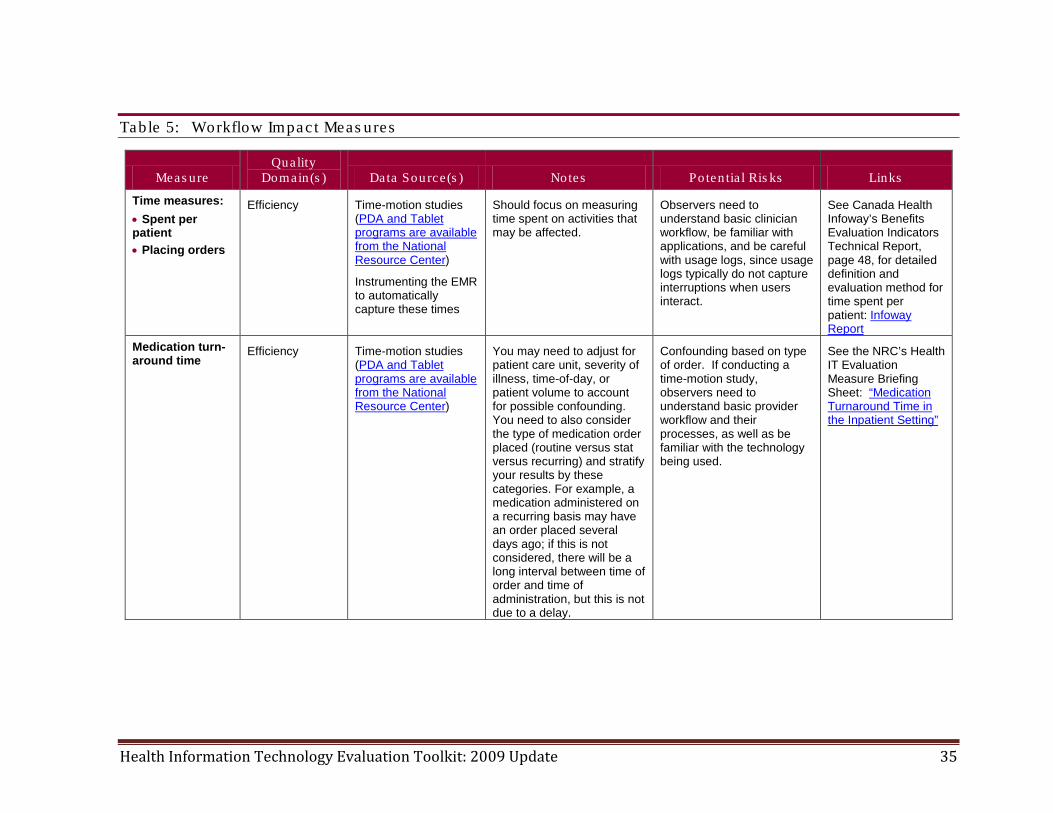
Table 5: Workflow Impac t Meas ures
Meas ure Quality
Domain(s ) Data Sou rce(s ) Notes Po ten tia l Ris ks Links
Time measures: • Spent per patient • Placing orders
Efficiency Time-motion studies (PDA and Tablet programs are available from the National Resource Center)
Instrumenting the EMR to automatically capture these times
Should focus on measuring time spent on activities that may be affected.
Observers need to understand basic clinician workflow, be familiar with applications, and be careful with usage logs, since usage logs typically do not capture interruptions when users interact.
See Canada Health Infoway’s Benefits Evaluation Indicators Technical Report, page 48, for detailed definition and evaluation method for time spent per patient: Infoway Report
Medication turn-around time
Efficiency Time-motion studies (PDA and Tablet programs are available from the National Resource Center)
You may need to adjust for patient care unit, severity of illness, time-of-day, or patient volume to account for possible confounding. You need to also consider the type of medication order placed (routine versus stat versus recurring) and stratify your results by these categories. For example, a medication administered on a recurring basis may have an order placed several days ago; if this is not considered, there will be a long interval between time of order and time of administration, but this is not due to a delay.
Confounding based on type of order. If conducting a time-motion study, observers need to understand basic provider workflow and their processes, as well as be familiar with the technology being used.
See the NRC’s Health IT Evaluation Measure Briefing Sheet: “Medication Turnaround Time in the Inpatient Setting”
Health Information Technology Evaluation Toolkit: 2009 Update 36
Meas ure Quality
Domain(s ) Data Sou rce(s ) Notes Po ten tia l Ris ks Links
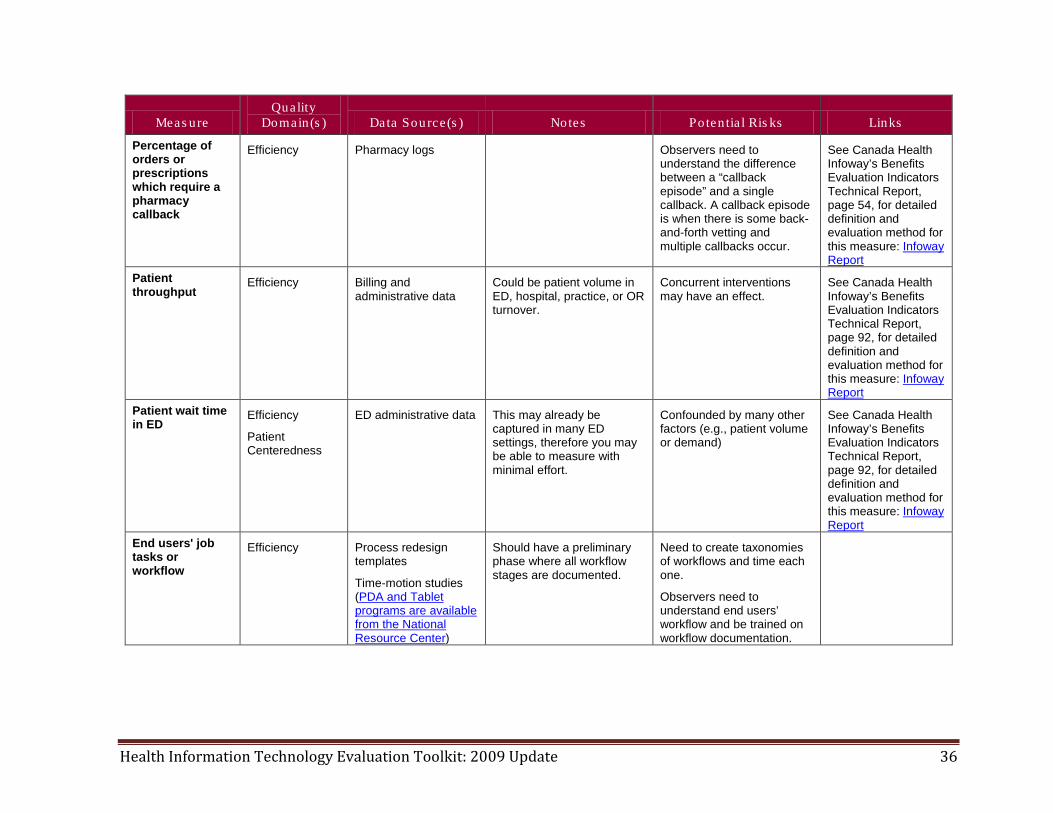
Percentage of orders or prescriptions which require a pharmacy callback
Efficiency Pharmacy logs Observers need to understand the difference between a “callback episode” and a single callback. A callback episode is when there is some back-and-forth vetting and multiple callbacks occur.
See Canada Health Infoway’s Benefits Evaluation Indicators Technical Report, page 54, for detailed definition and evaluation method for this measure: Infoway Report
Patient throughput
Efficiency Billing and administrative data
Could be patient volume in ED, hospital, practice, or OR turnover.
Concurrent interventions may have an effect.
See Canada Health Infoway’s Benefits Evaluation Indicators Technical Report, page 92, for detailed definition and evaluation method for this measure: Infoway Report
Patient wait time in ED
Efficiency
Patient Centeredness
ED administrative data This may already be captured in many ED settings, therefore you may be able to measure with minimal effort.
Confounded by many other factors (e.g., patient volume or demand)
See Canada Health Infoway’s Benefits Evaluation Indicators Technical Report, page 92, for detailed definition and evaluation method for this measure: Infoway Report
End users' job tasks or workflow
Efficiency Process redesign templates
Time-motion studies (PDA and Tablet programs are available from the National Resource Center)
Should have a preliminary phase where all workflow stages are documented.
Need to create taxonomies of workflows and time each one.
Observers need to understand end users’ workflow and be trained on workflow documentation.
Health Information Technology Evaluation Toolkit: 2009 Update 37
Meas ure Quality
Domain(s ) Data Sou rce(s ) Notes Po ten tia l Ris ks Links
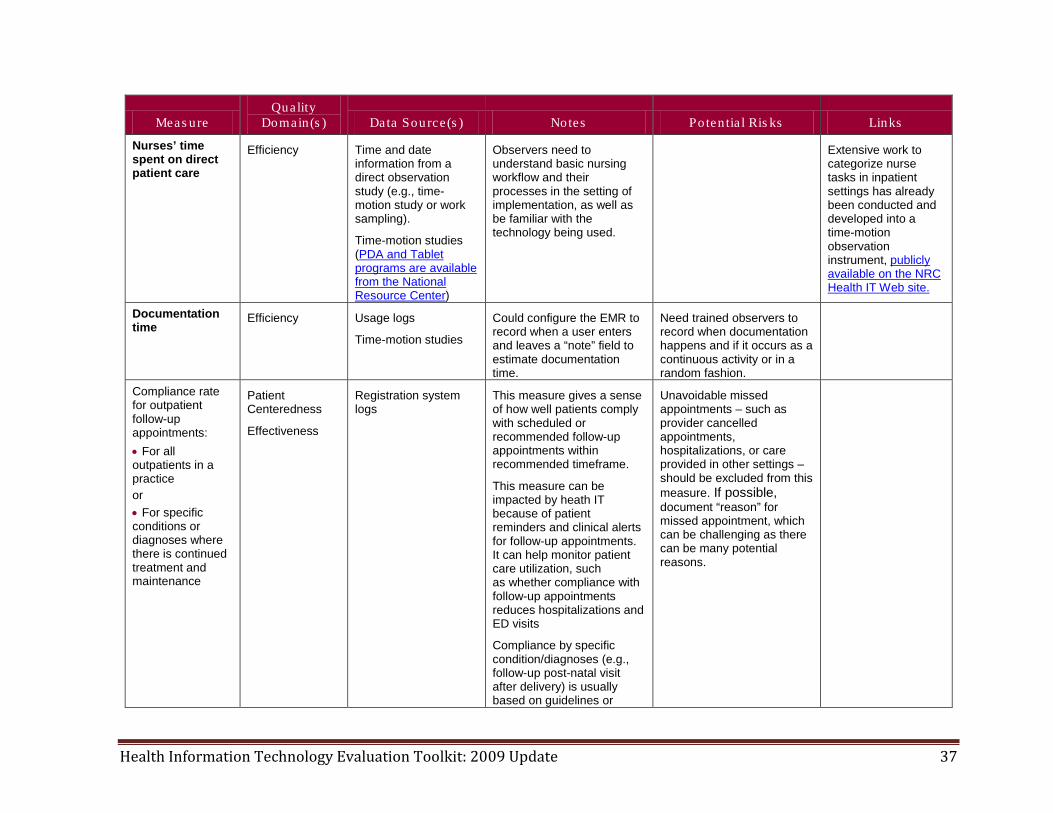
Nurses’ time spent on direct patient care
Efficiency Time and date information from a direct observation study (e.g., time-motion study or work sampling).
Time-motion studies (PDA and Tablet programs are available from the National Resource Center)
Observers need to understand basic nursing workflow and their processes in the setting of implementation, as well as be familiar with the technology being used.
Extensive work to categorize nurse tasks in inpatient settings has already been conducted and developed into a time-motion observation instrument, publicly available on the NRC Health IT Web site.
Documentation time
Efficiency Usage logs
Time-motion studies
Could configure the EMR to record when a user enters and leaves a “note” field to estimate documentation time.
Need trained observers to record when documentation happens and if it occurs as a continuous activity or in a random fashion.
Compliance rate for outpatient follow-up appointments: • For all outpatients in a practice or • For specific conditions or diagnoses where there is continued treatment and maintenance
Patient Centeredness
Effectiveness
Registration system logs
This measure gives a sense of how well patients comply with scheduled or recommended follow-up appointments within recommended timeframe.
This measure can be impacted by heath IT because of patient reminders and clinical alerts for follow-up appointments. It can help monitor patient care utilization, such as whether compliance with follow-up appointments reduces hospitalizations and ED visits
Compliance by specific condition/diagnoses (e.g., follow-up post-natal visit after delivery) is usually based on guidelines or
Unavoidable missed appointments – such as provider cancelled appointments, hospitalizations, or care provided in other settings – should be excluded from this measure. If possible, document “reason” for missed appointment, which can be challenging as there can be many potential reasons.
Health Information Technology Evaluation Toolkit: 2009 Update 38
Meas ure Quality
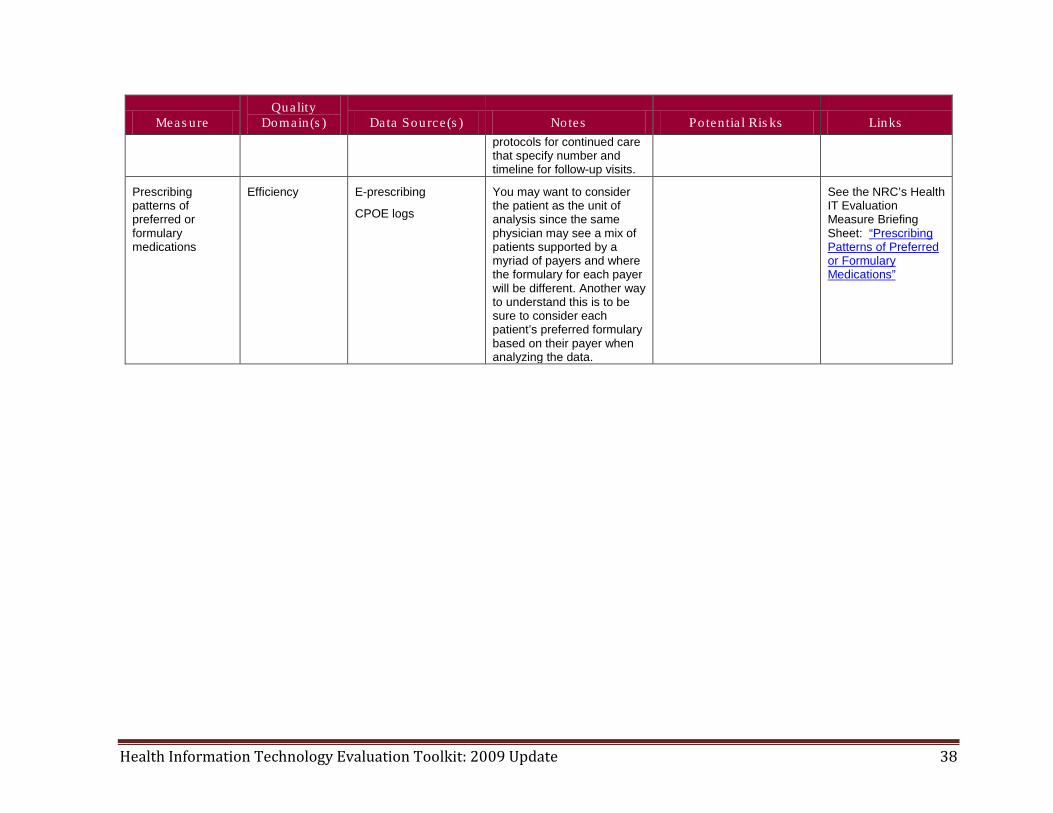
Domain(s ) Data Sou rce(s ) Notes Po ten tia l Ris ks Links protocols for continued care that specify number and timeline for follow-up visits.
Prescribing patterns of preferred or formulary medications
Efficiency
E-prescribing
CPOE logs
You may want to consider the patient as the unit of analysis since the same physician may see a mix of patients supported by a myriad of payers and where the formulary for each payer will be different. Another way to understand this is to be sure to consider each patient’s preferred formulary based on their payer when analyzing the data.
See the NRC’s Health IT Evaluation Measure Briefing Sheet: “Prescribing Patterns of Preferred or Formulary Medications”
Health Information Technology Evaluation Toolkit: 2009 Update 39
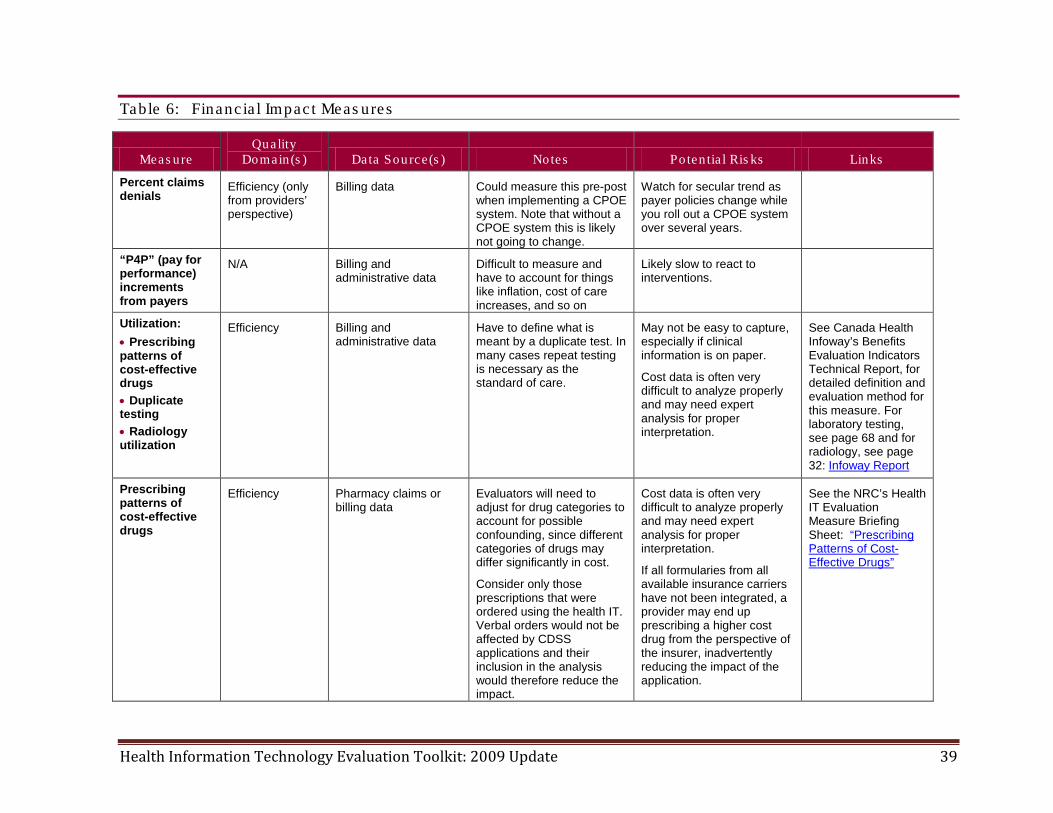
Table 6: Financ ia l Impac t Meas ures
Meas ure Quality
Domain(s ) Data Sou rce(s ) Notes Po ten tia l Ris ks Links
Percent claims denials
Efficiency (only from providers’ perspective)
Billing data Could measure this pre-post when implementing a CPOE system. Note that without a CPOE system this is likely not going to change.
Watch for secular trend as payer policies change while you roll out a CPOE system over several years.
“P4P” (pay for performance) increments from payers
N/A Billing and administrative data
Difficult to measure and have to account for things like inflation, cost of care increases, and so on
Likely slow to react to interventions.
Utilization: • Prescribing patterns of cost-effective drugs • Duplicate testing • Radiology utilization
Efficiency Billing and administrative data
Have to define what is meant by a duplicate test. In many cases repeat testing is necessary as the standard of care.
May not be easy to capture, especially if clinical information is on paper.
Cost data is often very difficult to analyze properly and may need expert analysis for proper interpretation.
See Canada Health Infoway’s Benefits Evaluation Indicators Technical Report, for detailed definition and evaluation method for this measure. For laboratory testing, see page 68 and for radiology, see page 32: Infoway Report
Prescribing patterns of cost-effective drugs
Efficiency Pharmacy claims or billing data
Evaluators will need to adjust for drug categories to account for possible confounding, since different categories of drugs may differ significantly in cost.
Consider only those prescriptions that were ordered using the health IT. Verbal orders would not be affected by CDSS applications and their inclusion in the analysis would therefore reduce the impact.
Cost data is often very difficult to analyze properly and may need expert analysis for proper interpretation.
If all formularies from all available insurance carriers have not been integrated, a provider may end up prescribing a higher cost drug from the perspective of the insurer, inadvertently reducing the impact of the application.
See the NRC’s Health IT Evaluation Measure Briefing Sheet: “Prescribing Patterns of Cost-Effective Drugs”
Health Information Technology Evaluation Toolkit: 2009 Update 40
Meas ure Quality
Domain(s ) Data Sou rce(s ) Notes Po ten tia l Ris ks Links
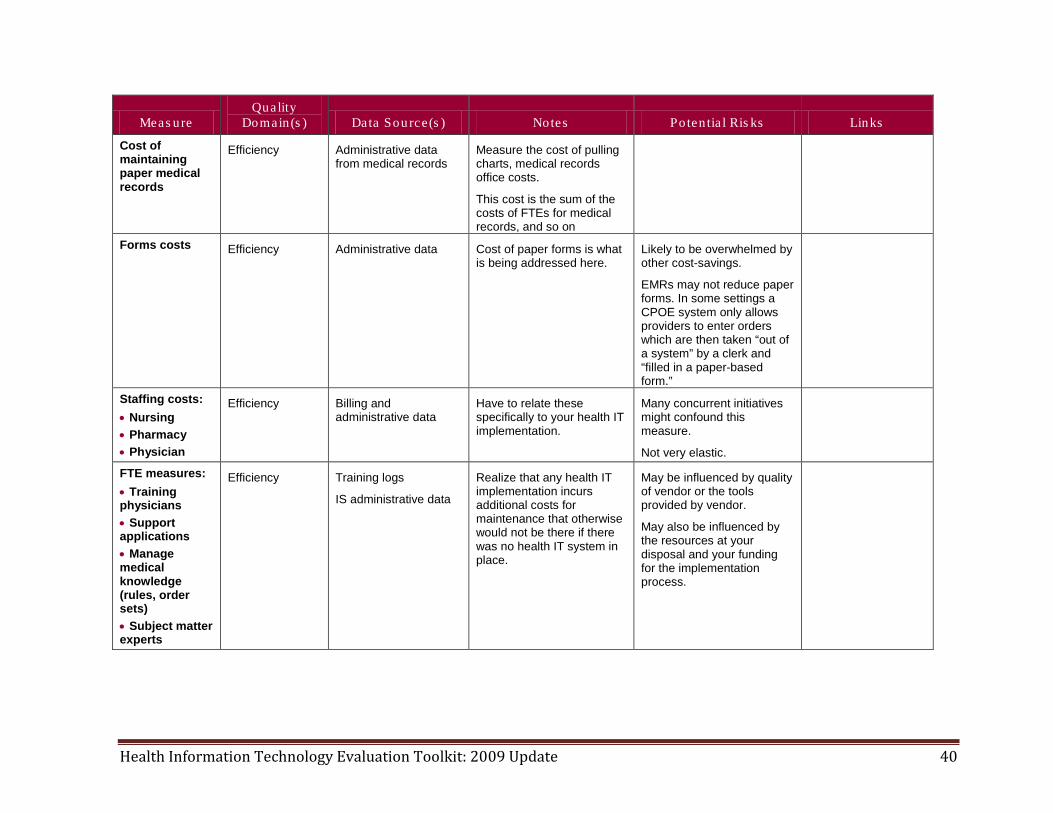
Cost of maintaining paper medical records
Efficiency Administrative data from medical records
Measure the cost of pulling charts, medical records office costs.
This cost is the sum of the costs of FTEs for medical records, and so on
Forms costs Efficiency Administrative data Cost of paper forms is what is being addressed here.
Likely to be overwhelmed by other cost-savings.
EMRs may not reduce paper forms. In some settings a CPOE system only allows providers to enter orders which are then taken “out of a system” by a clerk and “filled in a paper-based form.”
Staffing costs: • Nursing • Pharmacy • Physician
Efficiency Billing and administrative data
Have to relate these specifically to your health IT implementation.
Many concurrent initiatives might confound this measure.
Not very elastic.
FTE measures: • Training physicians • Support applications • Manage medical knowledge (rules, order sets) • Subject matter experts
Efficiency Training logs
IS administrative data
Realize that any health IT implementation incurs additional costs for maintenance that otherwise would not be there if there was no health IT system in place.
May be influenced by quality of vendor or the tools provided by vendor.
May also be influenced by the resources at your disposal and your funding for the implementation process.
Health Information Technology Evaluation Toolkit: 2009 Update 41
Meas ure Quality
Domain(s ) Data Sou rce(s ) Notes Po ten tia l Ris ks Links
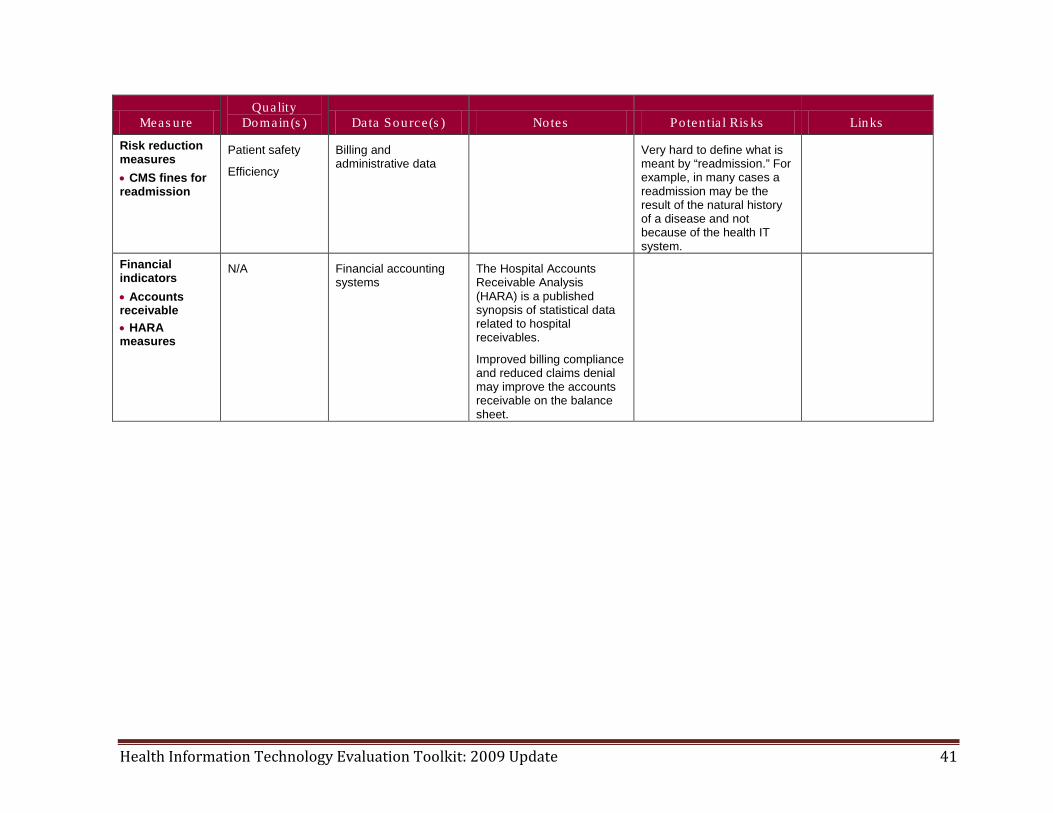
Risk reduction measures • CMS fines for readmission
Patient safety
Efficiency
Billing and administrative data
Very hard to define what is meant by “readmission.” For example, in many cases a readmission may be the result of the natural history of a disease and not because of the health IT system.
Financial indicators • Accounts receivable • HARA measures
N/A Financial accounting systems
The Hospital Accounts Receivable Analysis (HARA) is a published synopsis of statistical data related to hospital receivables.
Improved billing compliance and reduced claims denial may improve the accounts receivable on the balance sheet.
Health Information Technology Evaluation Toolkit: 2009 Update 42
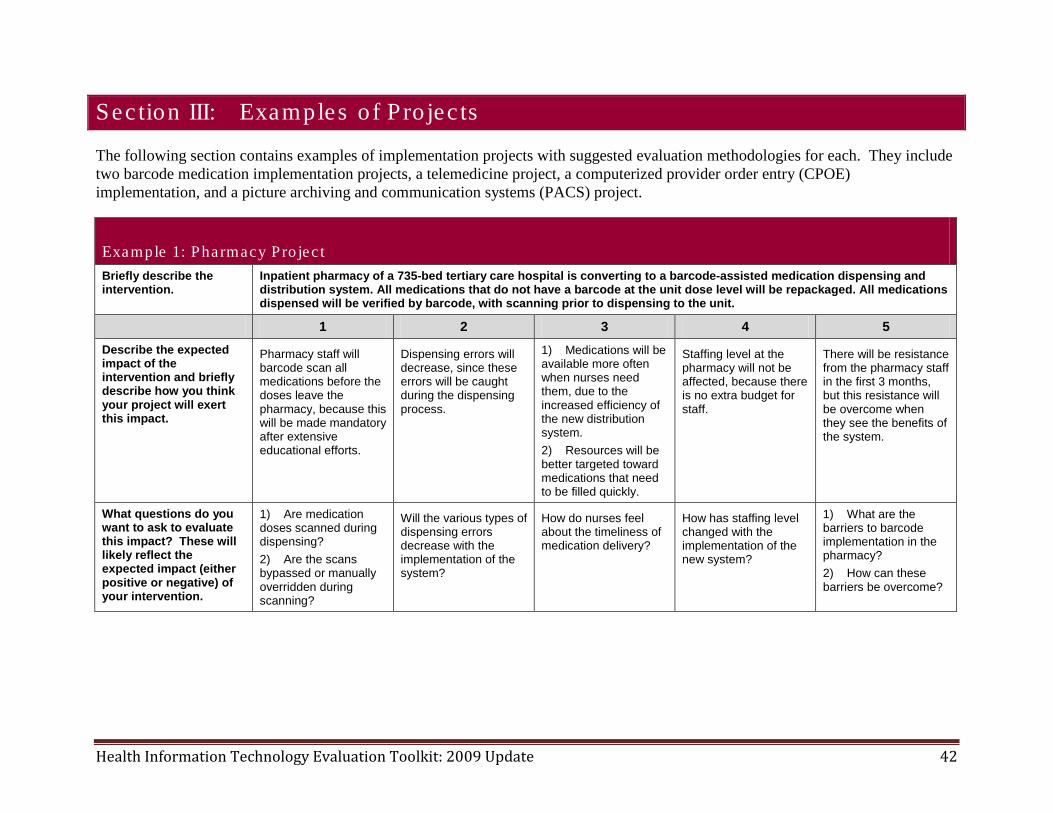
Section III: Examples o f Pro jec ts
The following section contains examples of implementation projects with suggested evaluation methodologies for each. They include two barcode medication implementation projects, a telemedicine project, a computerized provider order entry (CPOE) implementation, and a picture archiving and communication systems (PACS) project.
Example 1: Pharmacy Pro jec t Briefly describe the intervention.
Inpatient pharmacy of a 735-bed tertiary care hospital is converting to a barcode-assisted medication dispensing and distribution system. All medications that do not have a barcode at the unit dose level will be repackaged. All medications dispensed will be verified by barcode, with scanning prior to dispensing to the unit.
1 2 3 4 5 Describe the expected impact of the intervention and briefly describe how you think your project will exert this impact.
Pharmacy staff will barcode scan all medications before the doses leave the pharmacy, because this will be made mandatory after extensive educational efforts.
Dispensing errors will decrease, since these errors will be caught during the dispensing process.
1) Medications will be available more often when nurses need them, due to the increased efficiency of the new distribution system. 2) Resources will be better targeted toward medications that need to be filled quickly.
Staffing level at the pharmacy will not be affected, because there is no extra budget for staff.
There will be resistance from the pharmacy staff in the first 3 months, but this resistance will be overcome when they see the benefits of the system.
What questions do you want to ask to evaluate this impact? These will likely reflect the expected impact (either positive or negative) of your intervention.
1) Are medication doses scanned during dispensing? 2) Are the scans bypassed or manually overridden during scanning?
Will the various types of dispensing errors decrease with the implementation of the system?
How do nurses feel about the timeliness of medication delivery?
How has staffing level changed with the implementation of the new system?
1) What are the barriers to barcode implementation in the pharmacy? 2) How can these barriers be overcome?
Health Information Technology Evaluation Toolkit: 2009 Update 43
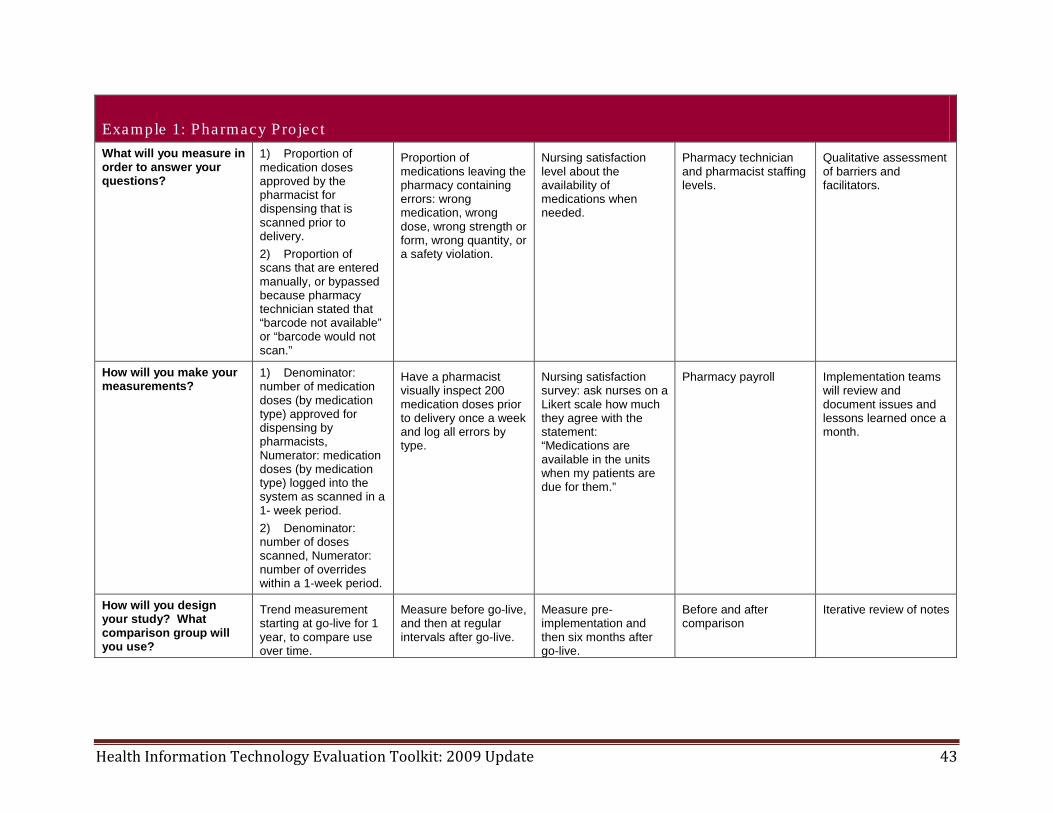
Example 1: Pharmacy Pro jec t What will you measure in order to answer your questions?
1) Proportion of medication doses approved by the pharmacist for dispensing that is scanned prior to delivery. 2) Proportion of scans that are entered manually, or bypassed because pharmacy technician stated that “barcode not available” or “barcode would not scan.”
Proportion of medications leaving the pharmacy containing errors: wrong medication, wrong dose, wrong strength or form, wrong quantity, or a safety violation.
Nursing satisfaction level about the availability of medications when needed.
Pharmacy technician and pharmacist staffing levels.
Qualitative assessment of barriers and facilitators.
How will you make your measurements?
1) Denominator: number of medication doses (by medication type) approved for dispensing by pharmacists, Numerator: medication doses (by medication type) logged into the system as scanned in a 1- week period. 2) Denominator: number of doses scanned, Numerator: number of overrides within a 1-week period.
Have a pharmacist visually inspect 200 medication doses prior to delivery once a week and log all errors by type.
Nursing satisfaction survey: ask nurses on a Likert scale how much they agree with the statement: “Medications are available in the units when my patients are due for them.”
Pharmacy payroll Implementation teams will review and document issues and lessons learned once a month.
How will you design your study? What comparison group will you use?
Trend measurement starting at go-live for 1 year, to compare use over time.
Measure before go-live, and then at regular intervals after go-live.
Measure pre-implementation and then six months after go-live.
Before and after comparison
Iterative review of notes
Health Information Technology Evaluation Toolkit: 2009 Update 44
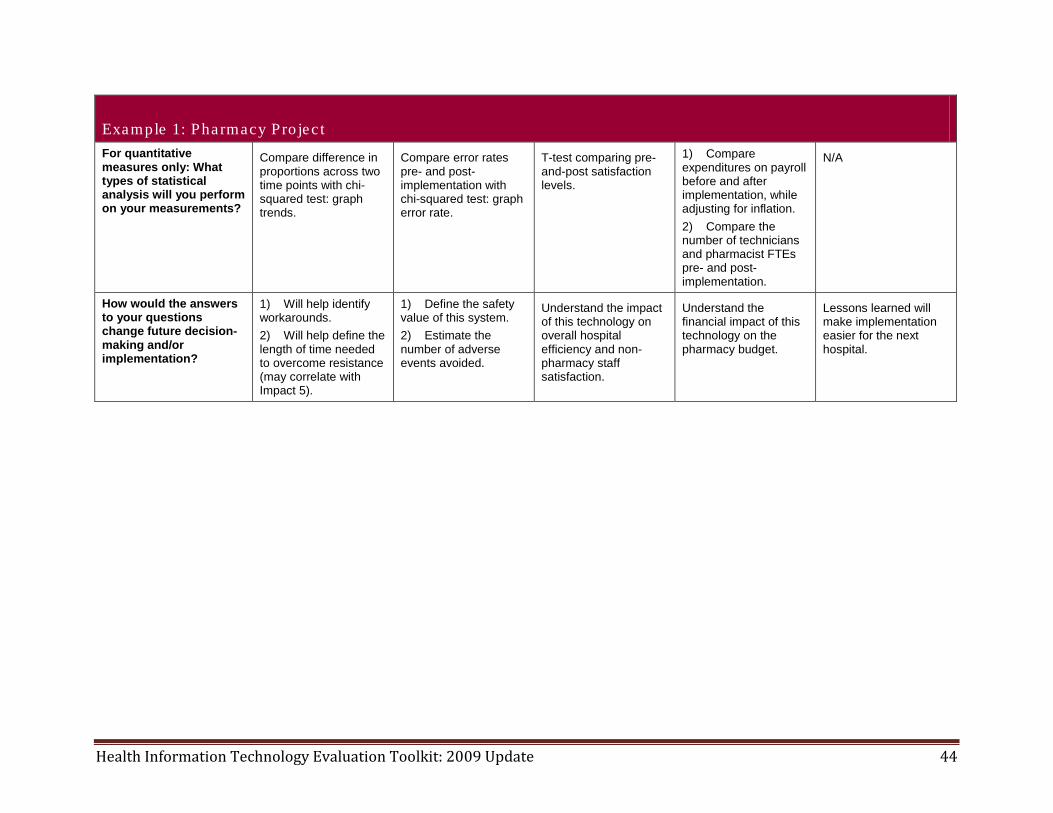
Example 1: Pharmacy Pro jec t For quantitative measures only: What types of statistical analysis will you perform on your measurements?
Compare difference in proportions across two time points with chi-squared test: graph trends.
Compare error rates pre- and post-implementation with chi-squared test: graph error rate.
T-test comparing pre-and-post satisfaction levels.
1) Compare expenditures on payroll before and after implementation, while adjusting for inflation. 2) Compare the number of technicians and pharmacist FTEs pre- and post-implementation.
N/A
How would the answers to your questions change future decision-making and/or implementation?
1) Will help identify workarounds. 2) Will help define the length of time needed to overcome resistance (may correlate with Impact 5).
1) Define the safety value of this system. 2) Estimate the number of adverse events avoided.
Understand the impact of this technology on overall hospital efficiency and non-pharmacy staff satisfaction.
Understand the financial impact of this technology on the pharmacy budget.
Lessons learned will make implementation easier for the next hospital.
Health Information Technology Evaluation Toolkit: 2009 Update 45
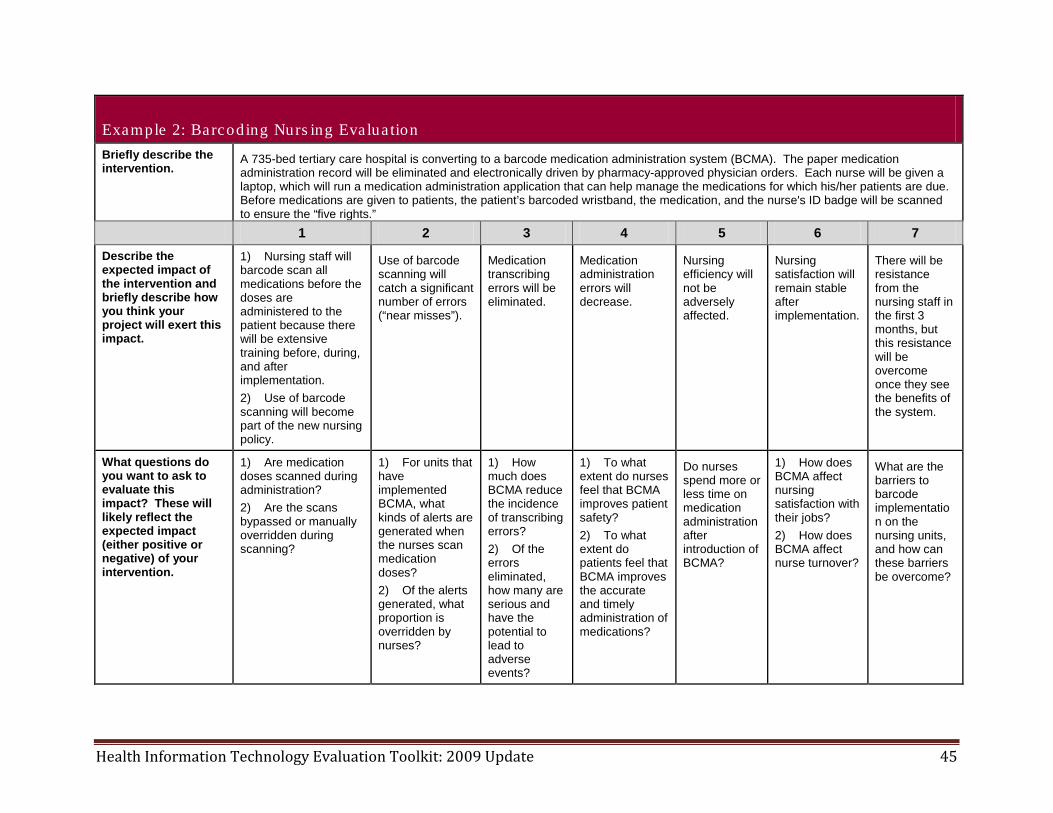
Example 2: Barcoding Nurs ing Eva lua tion Briefly describe the intervention.
A 735-bed tertiary care hospital is converting to a barcode medication administration system (BCMA). The paper medication administration record will be eliminated and electronically driven by pharmacy-approved physician orders. Each nurse will be given a laptop, which will run a medication administration application that can help manage the medications for which his/her patients are due. Before medications are given to patients, the patient’s barcoded wristband, the medication, and the nurse's ID badge will be scanned to ensure the “five rights.”
1 2 3 4 5 6 7 Describe the expected impact of the intervention and briefly describe how you think your project will exert this impact.
1) Nursing staff will barcode scan all medications before the doses are administered to the patient because there will be extensive training before, during, and after implementation. 2) Use of barcode scanning will become part of the new nursing policy.
Use of barcode scanning will catch a significant number of errors (“near misses”).
Medication transcribing errors will be eliminated.
Medication administration errors will decrease.
Nursing efficiency will not be adversely affected.
Nursing satisfaction will remain stable after implementation.
There will be resistance from the nursing staff in the first 3 months, but this resistance will be overcome once they see the benefits of the system.
What questions do you want to ask to evaluate this impact? These will likely reflect the expected impact (either positive or negative) of your intervention.
1) Are medication doses scanned during administration? 2) Are the scans bypassed or manually overridden during scanning?
1) For units that have implemented BCMA, what kinds of alerts are generated when the nurses scan medication doses? 2) Of the alerts generated, what proportion is overridden by nurses?
1) How much does BCMA reduce the incidence of transcribing errors? 2) Of the errors eliminated, how many are serious and have the potential to lead to adverse events?
1) To what extent do nurses feel that BCMA improves patient safety? 2) To what extent do patients feel that BCMA improves the accurate and timely administration of medications?
Do nurses spend more or less time on medication administration after introduction of BCMA?
1) How does BCMA affect nursing satisfaction with their jobs? 2) How does BCMA affect nurse turnover?
What are the barriers to barcode implementation on the nursing units, and how can these barriers be overcome?
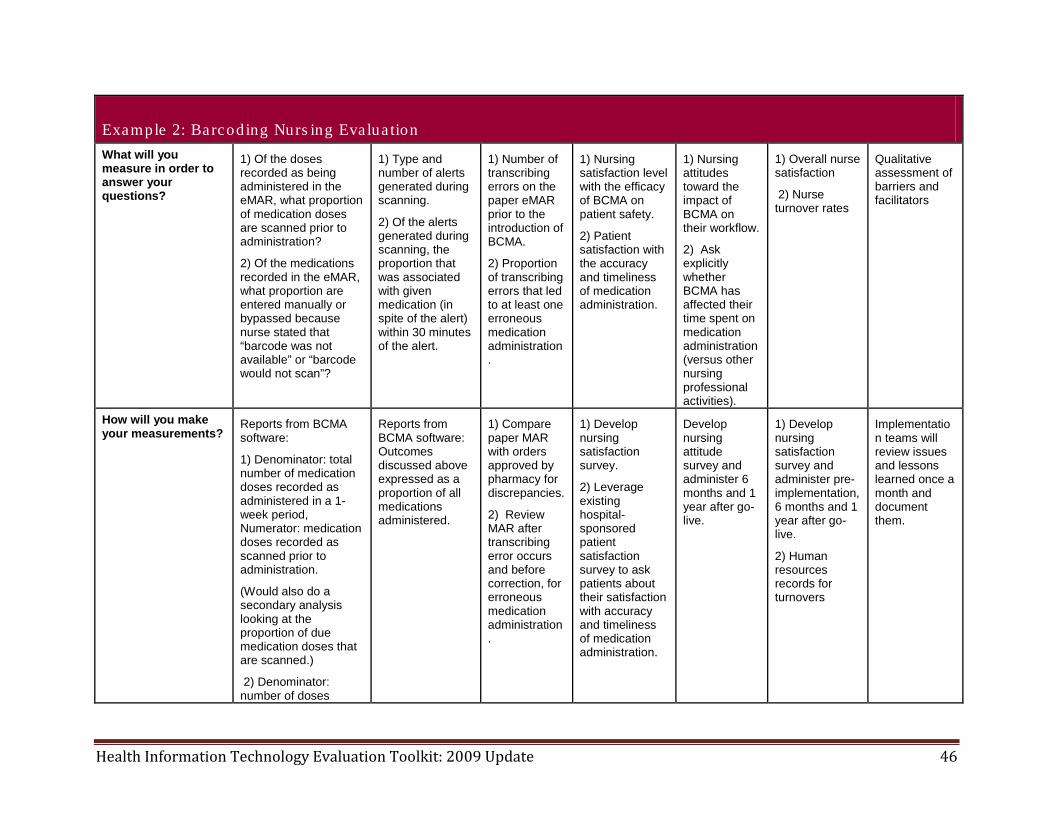
Health Information Technology Evaluation Toolkit: 2009 Update 46
Example 2: Barcoding Nurs ing Eva lua tion What will you measure in order to answer your questions?
1) Of the doses recorded as being administered in the eMAR, what proportion of medication doses are scanned prior to administration?
2) Of the medications recorded in the eMAR, what proportion are entered manually or bypassed because nurse stated that “barcode was not available” or “barcode would not scan”?
1) Type and number of alerts generated during scanning.
2) Of the alerts generated during scanning, the proportion that was associated with given medication (in spite of the alert) within 30 minutes of the alert.
1) Number of transcribing errors on the paper eMAR prior to the introduction of BCMA.
2) Proportion of transcribing errors that led to at least one erroneous medication administration.
1) Nursing satisfaction level with the efficacy of BCMA on patient safety.
2) Patient satisfaction with the accuracy and timeliness of medication administration.
1) Nursing attitudes toward the impact of BCMA on their workflow.
2) Ask explicitly whether BCMA has affected their time spent on medication administration (versus other nursing professional activities).
1) Overall nurse satisfaction
2) Nurse turnover rates
Qualitative assessment of barriers and facilitators
How will you make your measurements?
Reports from BCMA software:
1) Denominator: total number of medication doses recorded as administered in a 1-week period, Numerator: medication doses recorded as scanned prior to administration.
(Would also do a secondary analysis looking at the proportion of due medication doses that are scanned.)
2) Denominator: number of doses
Reports from BCMA software: Outcomes discussed above expressed as a proportion of all medications administered.
1) Compare paper MAR with orders approved by pharmacy for discrepancies.
2) Review MAR after transcribing error occurs and before correction, for erroneous medication administration.
1) Develop nursing satisfaction survey.
2) Leverage existing hospital-sponsored patient satisfaction survey to ask patients about their satisfaction with accuracy and timeliness of medication administration.
Develop nursing attitude survey and administer 6 months and 1 year after go-live.
1) Develop nursing satisfaction survey and administer pre-implementation, 6 months and 1 year after go-live.
2) Human resources records for turnovers
Implementation teams will review issues and lessons learned once a month and document them.
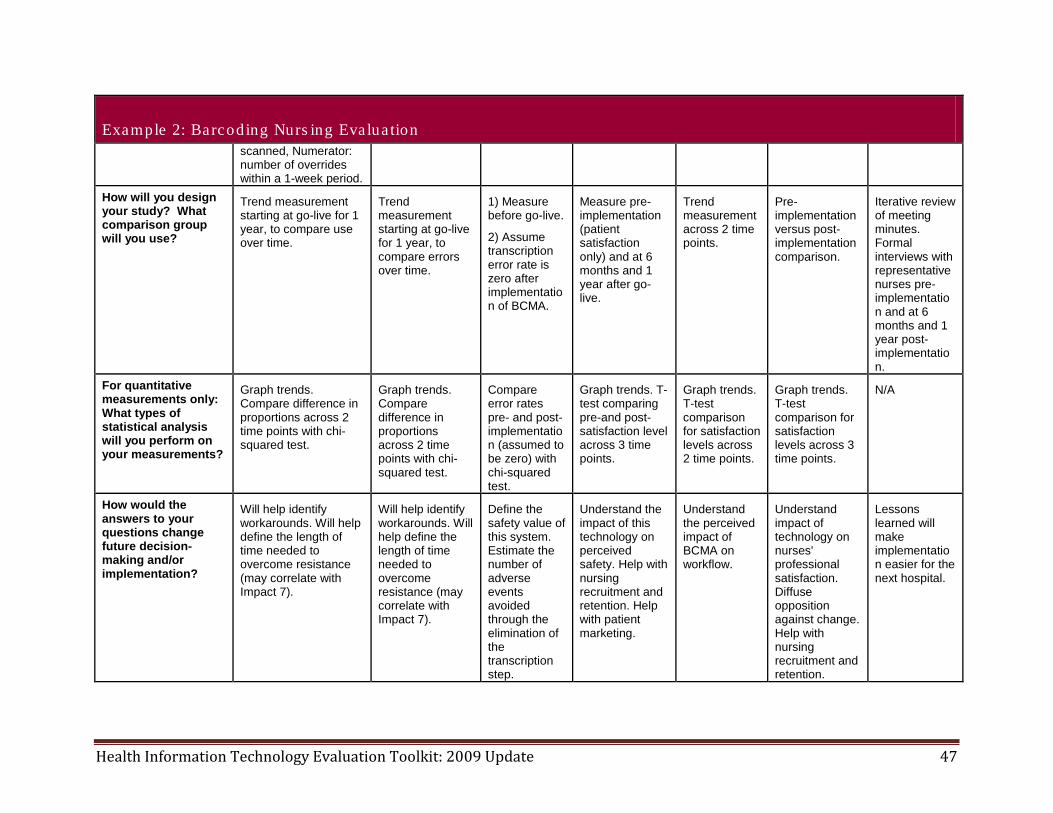
Health Information Technology Evaluation Toolkit: 2009 Update 47
Example 2: Barcoding Nurs ing Eva lua tion scanned, Numerator: number of overrides within a 1-week period.
How will you design your study? What comparison group will you use?
Trend measurement starting at go-live for 1 year, to compare use over time.
Trend measurement starting at go-live for 1 year, to compare errors over time.
1) Measure before go-live.
2) Assume transcription error rate is zero after implementation of BCMA.
Measure pre-implementation (patient satisfaction only) and at 6 months and 1 year after go-live.
Trend measurement across 2 time points.
Pre-implementation versus post-implementation comparison.
Iterative review of meeting minutes. Formal interviews with representative nurses pre-implementation and at 6 months and 1 year post-implementation.
For quantitative measurements only: What types of statistical analysis will you perform on your measurements?
Graph trends. Compare difference in proportions across 2 time points with chi-squared test.
Graph trends. Compare difference in proportions across 2 time points with chi-squared test.
Compare error rates pre- and post-implementation (assumed to be zero) with chi-squared test.
Graph trends. T-test comparing pre-and post- satisfaction level across 3 time points.
Graph trends. T-test comparison for satisfaction levels across 2 time points.
Graph trends. T-test comparison for satisfaction levels across 3 time points.
N/A
How would the answers to your questions change future decision-making and/or implementation?
Will help identify workarounds. Will help define the length of time needed to overcome resistance (may correlate with Impact 7).
Will help identify workarounds. Will help define the length of time needed to overcome resistance (may correlate with Impact 7).
Define the safety value of this system. Estimate the number of adverse events avoided through the elimination of the transcription step.
Understand the impact of this technology on perceived safety. Help with nursing recruitment and retention. Help with patient marketing.
Understand the perceived impact of BCMA on workflow.
Understand impact of technology on nurses' professional satisfaction. Diffuse opposition against change. Help with nursing recruitment and retention.
Lessons learned will make implementation easier for the next hospital.
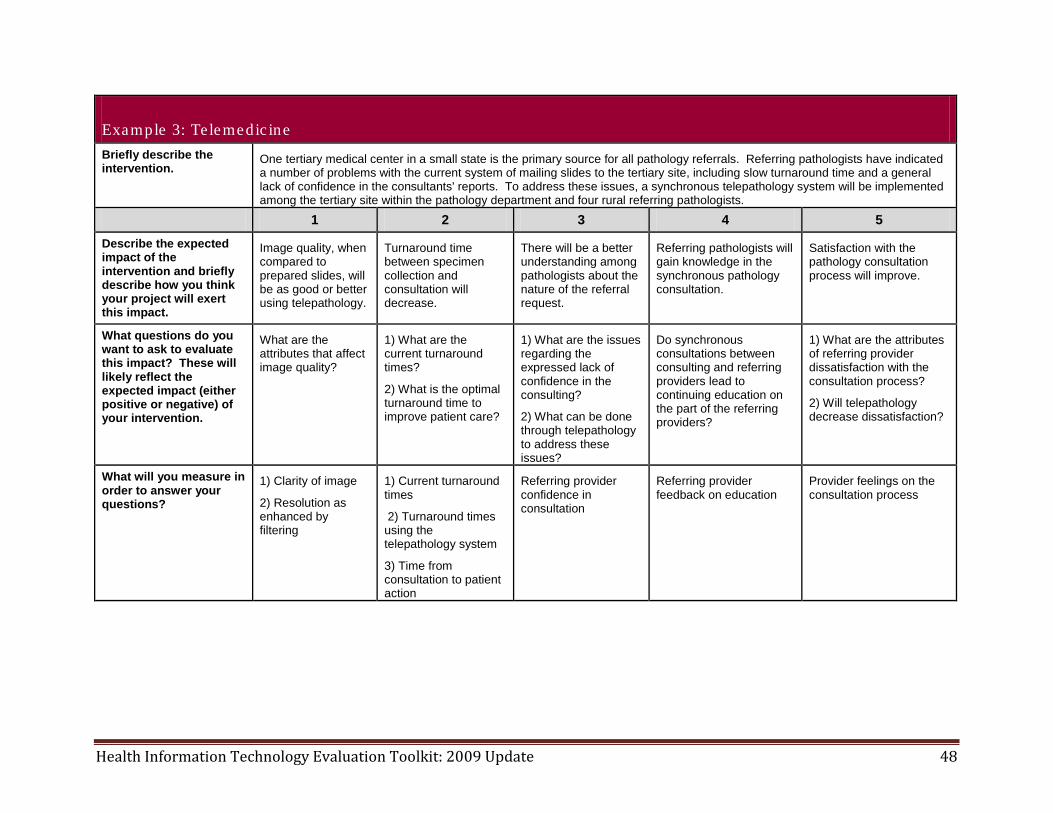
Health Information Technology Evaluation Toolkit: 2009 Update 48
Example 3: Telemedic ine Briefly describe the intervention.
One tertiary medical center in a small state is the primary source for all pathology referrals. Referring pathologists have indicated a number of problems with the current system of mailing slides to the tertiary site, including slow turnaround time and a general lack of confidence in the consultants' reports. To address these issues, a synchronous telepathology system will be implemented among the tertiary site within the pathology department and four rural referring pathologists.
1 2 3 4 5
Describe the expected impact of the intervention and briefly describe how you think your project will exert this impact.
Image quality, when compared to prepared slides, will be as good or better using telepathology.
Turnaround time between specimen collection and consultation will decrease.
There will be a better understanding among pathologists about the nature of the referral request.
Referring pathologists will gain knowledge in the synchronous pathology consultation.
Satisfaction with the pathology consultation process will improve.
What questions do you want to ask to evaluate this impact? These will likely reflect the expected impact (either positive or negative) of your intervention.
What are the attributes that affect image quality?
1) What are the current turnaround times?
2) What is the optimal turnaround time to improve patient care?
1) What are the issues regarding the expressed lack of confidence in the consulting?
2) What can be done through telepathology to address these issues?
Do synchronous consultations between consulting and referring providers lead to continuing education on the part of the referring providers?
1) What are the attributes of referring provider dissatisfaction with the consultation process?
2) Will telepathology decrease dissatisfaction?
What will you measure in order to answer your questions?
1) Clarity of image
2) Resolution as enhanced by filtering
1) Current turnaround times
2) Turnaround times using the telepathology system
3) Time from consultation to patient action
Referring provider confidence in consultation
Referring provider feedback on education
Provider feelings on the consultation process
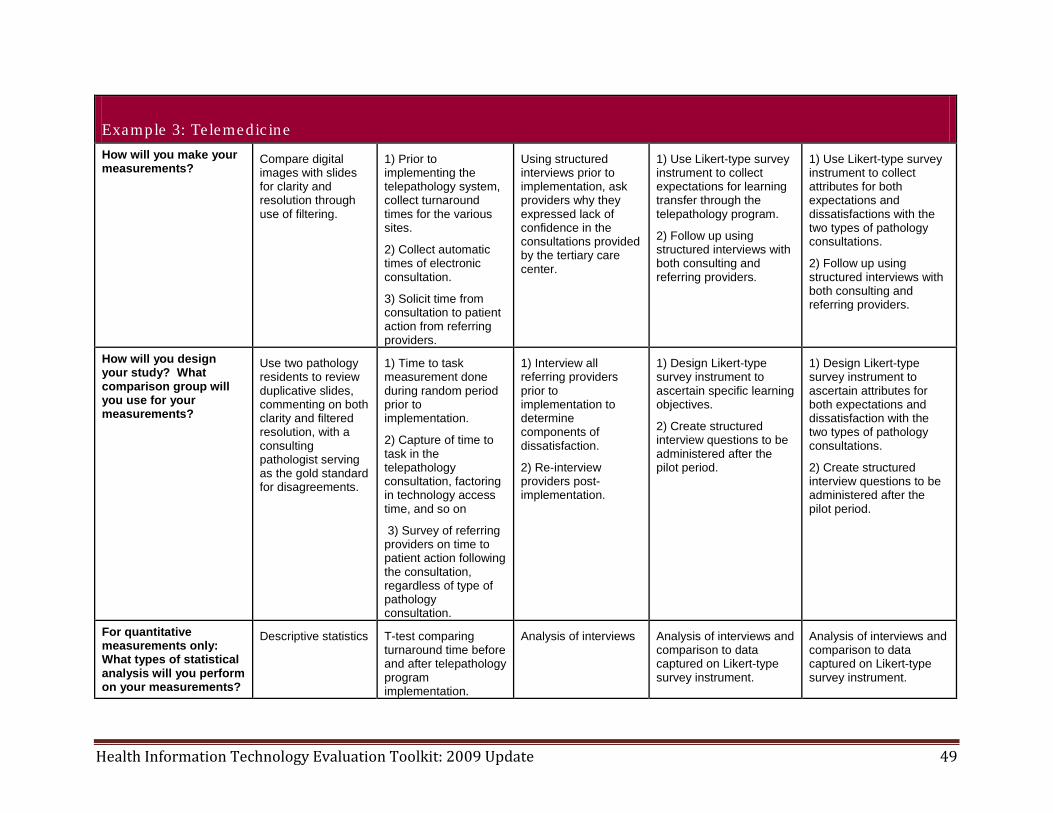
Health Information Technology Evaluation Toolkit: 2009 Update 49
Example 3: Telemedic ine How will you make your measurements?
Compare digital images with slides for clarity and resolution through use of filtering.
1) Prior to implementing the telepathology system, collect turnaround times for the various sites.
2) Collect automatic times of electronic consultation.
3) Solicit time from consultation to patient action from referring providers.
Using structured interviews prior to implementation, ask providers why they expressed lack of confidence in the consultations provided by the tertiary care center.
1) Use Likert-type survey instrument to collect expectations for learning transfer through the telepathology program.
2) Follow up using structured interviews with both consulting and referring providers.
1) Use Likert-type survey instrument to collect attributes for both expectations and dissatisfactions with the two types of pathology consultations.
2) Follow up using structured interviews with both consulting and referring providers.
How will you design your study? What comparison group will you use for your measurements?
Use two pathology residents to review duplicative slides, commenting on both clarity and filtered resolution, with a consulting pathologist serving as the gold standard for disagreements.
1) Time to task measurement done during random period prior to implementation.
2) Capture of time to task in the telepathology consultation, factoring in technology access time, and so on
3) Survey of referring providers on time to patient action following the consultation, regardless of type of pathology consultation.
1) Interview all referring providers prior to implementation to determine components of dissatisfaction.
2) Re-interview providers post-implementation.
1) Design Likert-type survey instrument to ascertain specific learning objectives.
2) Create structured interview questions to be administered after the pilot period.
1) Design Likert-type survey instrument to ascertain attributes for both expectations and dissatisfaction with the two types of pathology consultations.
2) Create structured interview questions to be administered after the pilot period.
For quantitative measurements only: What types of statistical analysis will you perform on your measurements?
Descriptive statistics T-test comparing turnaround time before and after telepathology program implementation.
Analysis of interviews Analysis of interviews and comparison to data captured on Likert-type survey instrument.
Analysis of interviews and comparison to data captured on Likert-type survey instrument.
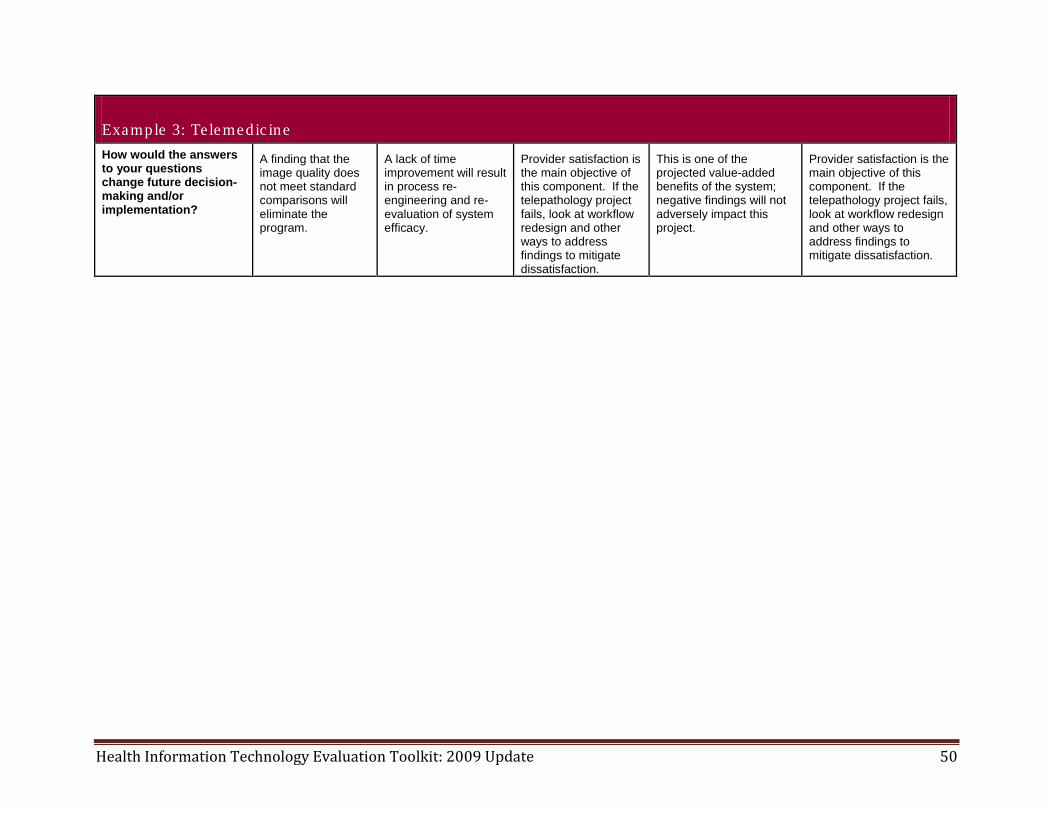
Health Information Technology Evaluation Toolkit: 2009 Update 50
Example 3: Telemedic ine How would the answers to your questions change future decision-making and/or implementation?
A finding that the image quality does not meet standard comparisons will eliminate the program.
A lack of time improvement will result in process re-engineering and re-evaluation of system efficacy.
Provider satisfaction is the main objective of this component. If the telepathology project fails, look at workflow redesign and other ways to address findings to mitigate dissatisfaction.
This is one of the projected value-added benefits of the system; negative findings will not adversely impact this project.
Provider satisfaction is the main objective of this component. If the telepathology project fails, look at workflow redesign and other ways to address findings to mitigate dissatisfaction.
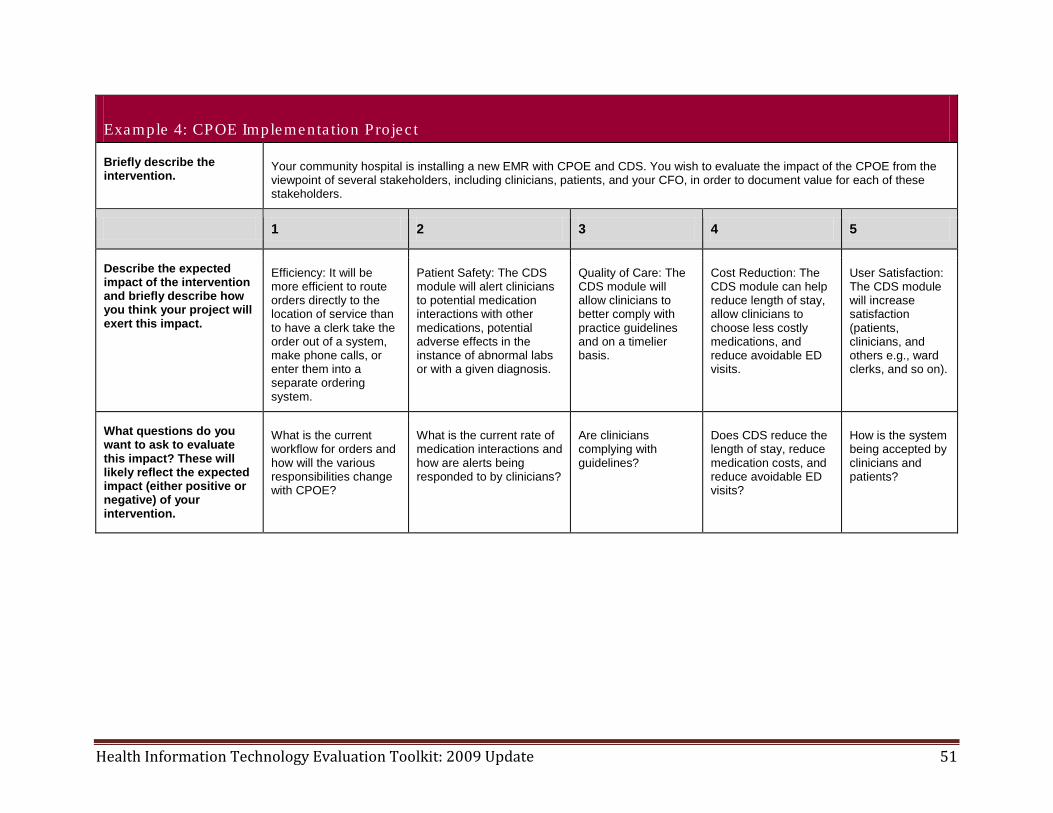
Health Information Technology Evaluation Toolkit: 2009 Update 51
Example 4: CPOE Implementa tion Pro jec t
Briefly describe the intervention.
Your community hospital is installing a new EMR with CPOE and CDS. You wish to evaluate the impact of the CPOE from the viewpoint of several stakeholders, including clinicians, patients, and your CFO, in order to document value for each of these stakeholders.
1 2 3 4 5
Describe the expected impact of the intervention and briefly describe how you think your project will exert this impact.
Efficiency: It will be more efficient to route orders directly to the location of service than to have a clerk take the order out of a system, make phone calls, or enter them into a separate ordering system.
Patient Safety: The CDS module will alert clinicians to potential medication interactions with other medications, potential adverse effects in the instance of abnormal labs or with a given diagnosis.
Quality of Care: The CDS module will allow clinicians to better comply with practice guidelines and on a timelier basis.
Cost Reduction: The CDS module can help reduce length of stay, allow clinicians to choose less costly medications, and reduce avoidable ED visits.
User Satisfaction: The CDS module will increase satisfaction (patients, clinicians, and others e.g., ward clerks, and so on).
What questions do you want to ask to evaluate this impact? These will likely reflect the expected impact (either positive or negative) of your intervention.
What is the current workflow for orders and how will the various responsibilities change with CPOE?
What is the current rate of medication interactions and how are alerts being responded to by clinicians?
Are clinicians complying with guidelines?
Does CDS reduce the length of stay, reduce medication costs, and reduce avoidable ED visits?
How is the system being accepted by clinicians and patients?
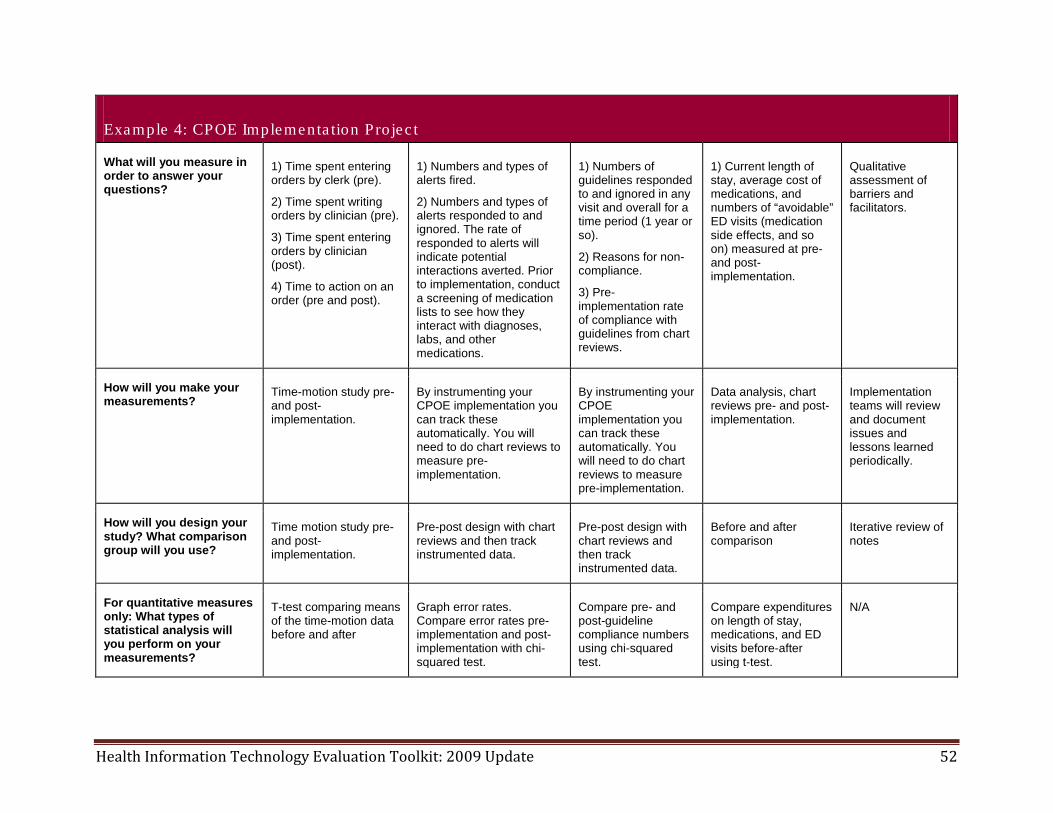
Health Information Technology Evaluation Toolkit: 2009 Update 52
Example 4: CPOE Implementa tion Pro jec t
What will you measure in order to answer your questions?
1) Time spent entering orders by clerk (pre).
2) Time spent writing orders by clinician (pre).
3) Time spent entering orders by clinician (post).
4) Time to action on an order (pre and post).
1) Numbers and types of alerts fired.
2) Numbers and types of alerts responded to and ignored. The rate of responded to alerts will indicate potential interactions averted. Prior to implementation, conduct a screening of medication lists to see how they interact with diagnoses, labs, and other medications.
1) Numbers of guidelines responded to and ignored in any visit and overall for a time period (1 year or so).
2) Reasons for non-compliance.
3) Pre-implementation rate of compliance with guidelines from chart reviews.
1) Current length of stay, average cost of medications, and numbers of “avoidable” ED visits (medication side effects, and so on) measured at pre- and post-implementation.
Qualitative assessment of barriers and facilitators.
How will you make your measurements?
Time-motion study pre- and post-implementation.
By instrumenting your CPOE implementation you can track these automatically. You will need to do chart reviews to measure pre-implementation.
By instrumenting your CPOE implementation you can track these automatically. You will need to do chart reviews to measure pre-implementation.
Data analysis, chart reviews pre- and post- implementation.
Implementation teams will review and document issues and lessons learned periodically.
How will you design your study? What comparison group will you use?
Time motion study pre- and post-implementation.
Pre-post design with chart reviews and then track instrumented data.
Pre-post design with chart reviews and then track instrumented data.
Before and after comparison
Iterative review of notes
For quantitative measures only: What types of statistical analysis will you perform on your measurements?
T-test comparing means of the time-motion data before and after
Graph error rates. Compare error rates pre-implementation and post-implementation with chi-squared test.
Compare pre- and post-guideline compliance numbers using chi-squared test.
Compare expenditures on length of stay, medications, and ED visits before-after using t-test.
N/A
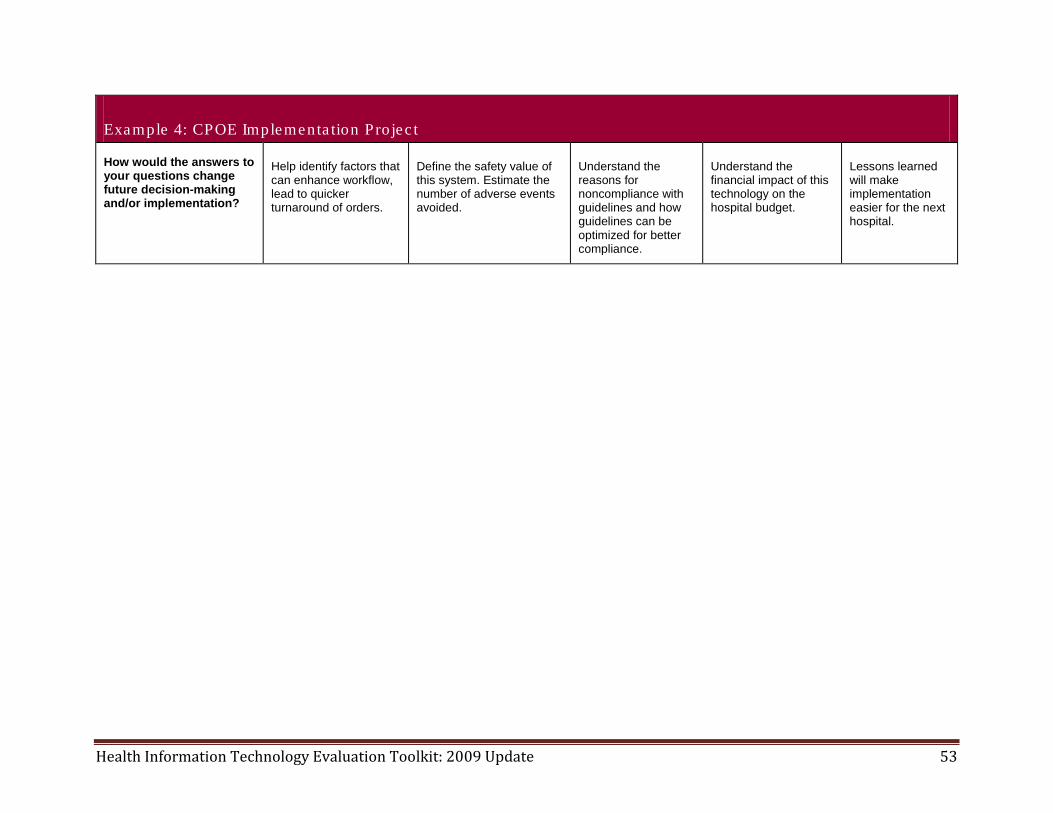
Health Information Technology Evaluation Toolkit: 2009 Update 53
Example 4: CPOE Implementa tion Pro jec t
How would the answers to your questions change future decision-making and/or implementation?
Help identify factors that can enhance workflow, lead to quicker turnaround of orders.
Define the safety value of this system. Estimate the number of adverse events avoided.
Understand the reasons for noncompliance with guidelines and how guidelines can be optimized for better compliance.
Understand the financial impact of this technology on the hospital budget.
Lessons learned will make implementation easier for the next hospital.
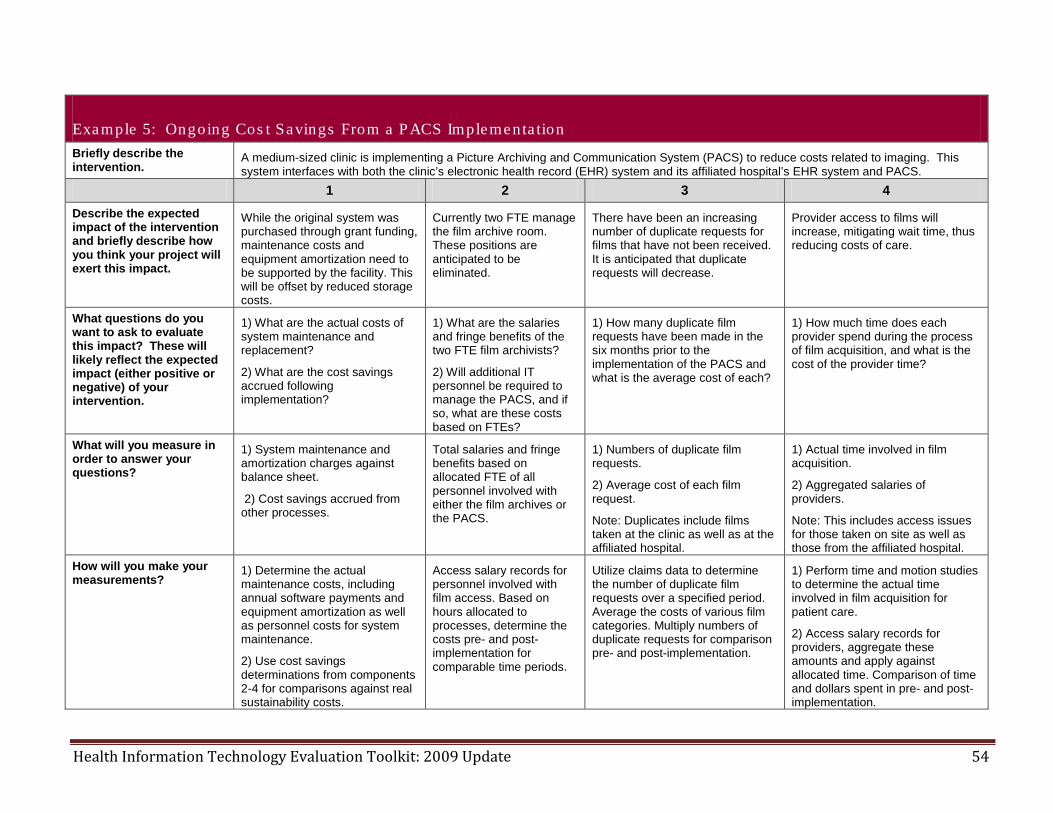
Health Information Technology Evaluation Toolkit: 2009 Update 54
Example 5: Ongoing Cos t Savings From a PACS Implementa tion Briefly describe the intervention.
A medium-sized clinic is implementing a Picture Archiving and Communication System (PACS) to reduce costs related to imaging. This system interfaces with both the clinic’s electronic health record (EHR) system and its affiliated hospital’s EHR system and PACS.
1 2 3 4 Describe the expected impact of the intervention and briefly describe how you think your project will exert this impact.
While the original system was purchased through grant funding, maintenance costs and equipment amortization need to be supported by the facility. This will be offset by reduced storage costs.
Currently two FTE manage the film archive room. These positions are anticipated to be eliminated.
There have been an increasing number of duplicate requests for films that have not been received. It is anticipated that duplicate requests will decrease.
Provider access to films will increase, mitigating wait time, thus reducing costs of care.
What questions do you want to ask to evaluate this impact? These will likely reflect the expected impact (either positive or negative) of your intervention.
1) What are the actual costs of system maintenance and replacement?
2) What are the cost savings accrued following implementation?
1) What are the salaries and fringe benefits of the two FTE film archivists?
2) Will additional IT personnel be required to manage the PACS, and if so, what are these costs based on FTEs?
1) How many duplicate film requests have been made in the six months prior to the implementation of the PACS and what is the average cost of each?
1) How much time does each provider spend during the process of film acquisition, and what is the cost of the provider time?
What will you measure in order to answer your questions?
1) System maintenance and amortization charges against balance sheet.
2) Cost savings accrued from other processes.
Total salaries and fringe benefits based on allocated FTE of all personnel involved with either the film archives or the PACS.
1) Numbers of duplicate film requests.
2) Average cost of each film request.
Note: Duplicates include films taken at the clinic as well as at the affiliated hospital.
1) Actual time involved in film acquisition.
2) Aggregated salaries of providers.
Note: This includes access issues for those taken on site as well as those from the affiliated hospital.
How will you make your measurements?
1) Determine the actual maintenance costs, including annual software payments and equipment amortization as well as personnel costs for system maintenance.
2) Use cost savings determinations from components 2-4 for comparisons against real sustainability costs.
Access salary records for personnel involved with film access. Based on hours allocated to processes, determine the costs pre- and post- implementation for comparable time periods.
Utilize claims data to determine the number of duplicate film requests over a specified period. Average the costs of various film categories. Multiply numbers of duplicate requests for comparison pre- and post-implementation.
1) Perform time and motion studies to determine the actual time involved in film acquisition for patient care.
2) Access salary records for providers, aggregate these amounts and apply against allocated time. Comparison of time and dollars spent in pre- and post-implementation.
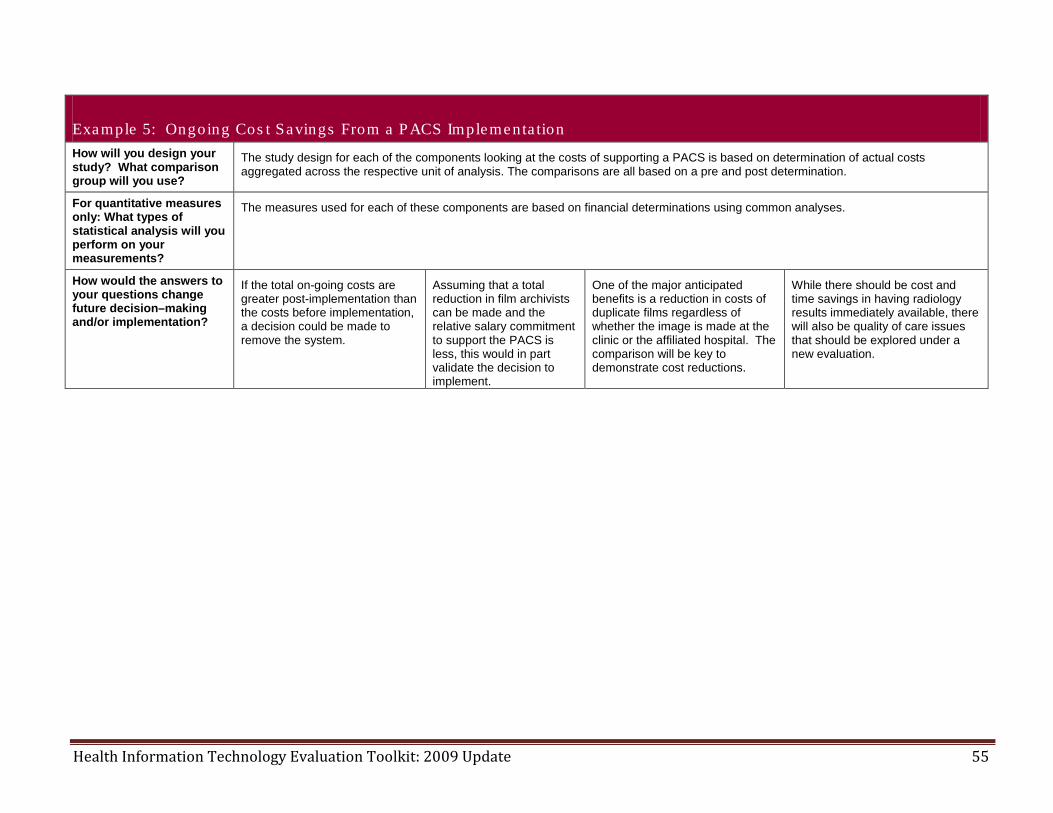
Health Information Technology Evaluation Toolkit: 2009 Update 55
Example 5: Ongoing Cos t Savings From a PACS Implementa tion How will you design your study? What comparison group will you use?
The study design for each of the components looking at the costs of supporting a PACS is based on determination of actual costs aggregated across the respective unit of analysis. The comparisons are all based on a pre and post determination.
For quantitative measures only: What types of statistical analysis will you perform on your measurements?
The measures used for each of these components are based on financial determinations using common analyses.
How would the answers to your questions change future decision–making and/or implementation?
If the total on-going costs are greater post-implementation than the costs before implementation, a decision could be made to remove the system.
Assuming that a total reduction in film archivists can be made and the relative salary commitment to support the PACS is less, this would in part validate the decision to implement.
One of the major anticipated benefits is a reduction in costs of duplicate films regardless of whether the image is made at the clinic or the affiliated hospital. The comparison will be key to demonstrate cost reductions.
While there should be cost and time savings in having radiology results immediately available, there will also be quality of care issues that should be explored under a new evaluation.
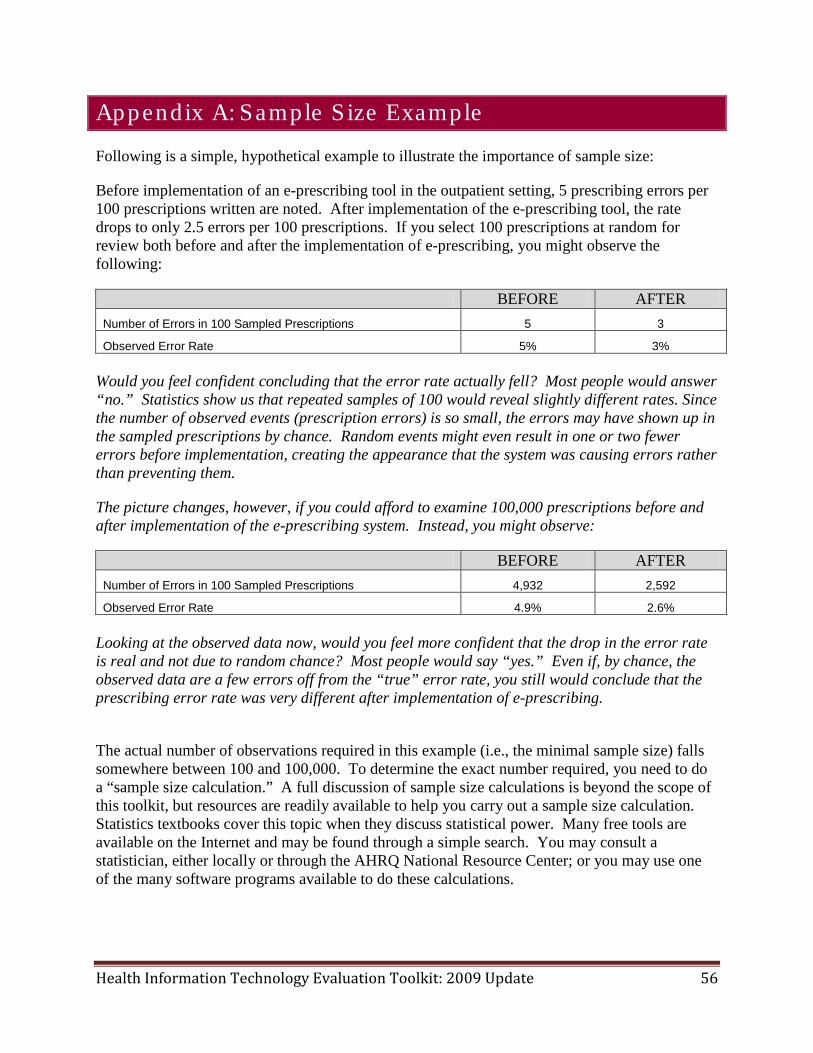
Health Information Technology Evaluation Toolkit: 2009 Update 56
Appendix A: Sample S ize Example
Following is a simple, hypothetical example to illustrate the importance of sample size:
Before implementation of an e-prescribing tool in the outpatient setting, 5 prescribing errors per 100 prescriptions written are noted. After implementation of the e-prescribing tool, the rate drops to only 2.5 errors per 100 prescriptions. If you select 100 prescriptions at random for review both before and after the implementation of e-prescribing, you might observe the following:
BEFORE AFTER Number of Errors in 100 Sampled Prescriptions 5 3
Observed Error Rate 5% 3% Would you feel confident concluding that the error rate actually fell? Most people would answer “no.” Statistics show us that repeated samples of 100 would reveal slightly different rates. Since the number of observed events (prescription errors) is so small, the errors may have shown up in the sampled prescriptions by chance. Random events might even result in one or two fewer errors before implementation, creating the appearance that the system was causing errors rather than preventing them.
The picture changes, however, if you could afford to examine 100,000 prescriptions before and after implementation of the e-prescribing system. Instead, you might observe:
BEFORE AFTER Number of Errors in 100 Sampled Prescriptions 4,932 2,592
Observed Error Rate 4.9% 2.6% Looking at the observed data now, would you feel more confident that the drop in the error rate is real and not due to random chance? Most people would say “yes.” Even if, by chance, the observed data are a few errors off from the “true” error rate, you still would conclude that the prescribing error rate was very different after implementation of e-prescribing.
The actual number of observations required in this example (i.e., the minimal sample size) falls somewhere between 100 and 100,000. To determine the exact number required, you need to do a “sample size calculation.” A full discussion of sample size calculations is beyond the scope of this toolkit, but resources are readily available to help you carry out a sample size calculation. Statistics textbooks cover this topic when they discuss statistical power. Many free tools are available on the Internet and may be found through a simple search. You may consult a statistician, either locally or through the AHRQ National Resource Center; or you may use one of the many software programs available to do these calculations.

Health Information Technology Evaluation Toolkit: 2009 Update 57
No matter how you perform the sample size calculation, it is important to do it before you embark on an evaluation. Many evaluation projects have failed after the investigators found that insufficient data were collected to show a statistically significant difference. A sample size calculation can be a sobering experience: You may learn that your team cannot answer the desired question because the required sample size is too large. In that case, you may need to address a question that is less interesting but feasible to answer.
Health Information Technology Evaluation Toolkit: 2009 Update 58
Appendix B: Health IT Eva lua tion Res ources
The following articles address the important issue of evaluation methods for assessing the impact of health information systems in various domains:
Ammenwerth E, Gräber S, Herrmann G, et al. Evaluation of health information systems-problems and challenges. Int J Med Inform 2003 Sep;71(2-3):125-35.
Chaudhry B, Wang J, Wu S, et al. Systematic review: impact of health information technology on quality, efficiency, and costs of medical care. Ann Intern Med 2006 May 16;144(10):742-52.
de Keizer N, Ammenwerth E. Trends in evaluation research 1982 - 2002: a study on how the quality of IT evaluation studies develop. Stud Health Technol Inform 2005;116:581-6.
Fehrenbach N, Ross D, Hastings T, Renahan-White A. Towards measuring value: an evaluation framework for public health information systems. Association of Public Health Laboratories, Public Health Informatics Institute Research Brief 2005 April.
Friedman CP, Wyatt JC, Shortliffe EH, et al. Evaluation methods in medical informatics. New York: Springer; 2000.
Grémy F, Degoulet P. Assessment of health information technology: which questions for which systems? Proposal for taxonomy. Med Inform (Lond.) 1993 Jul-Sep;18(3):185-93.
Grant A, Plante I, Leblanc F. The TEAM methodology for the evaluation of information systems in biomedicine. Comput Biol Med 2002 May;32(3):195-207.
Kushniruk AW, Patel VL. Cognitive and usability engineering methods for the evaluation of clinical information systems. J Biomed Inform 2004 Feb;37(1):56-76.
Kushniruk AW, Patel VL, Cimino JJ. Usability testing in medical informatics: cognitive approaches to evaluation of information systems and user interfaces. Proc AMIA Annu Fall Symp. 1997:218-22.
Neville D, O'Reilly S, MacDonald D, et al. Measuring the impact of electronic health records projects on health outcomes and costs: an evaluation framework. AcademyHealth 2003;20:845.
Roderer, NK. Outcome measures in clinical information systems evaluation. Stud Health Technol Inform 2004;107(Pt2):1096-100.
Toward an evaluation framework for electronic health records initiatives. Available at: Health Canada. http://www.hc-sc.gc.ca/hcs-sss/pubs/kdec/nf_eval/index-eng.php. Accessed July 14, 2008.
Yusof MM, Paul RJ, Stergioulas LK. Towards a framework for health information systems evaluation. In: Proceedings of the 39th Annual Hawaii International Conference on System Sciences; 2006 Jan 4-7; Kauai, HI. Vol. 5. Washington, DC: IEEE Computer Society; 2006. p. 95a.
Health Information Technology Evaluation Toolkit: 2009 Update 59
Appendix C: S ta tis tics Res ources
There are a number of free resources on the Internet to assist with statistics:
Textbooks http://www.bmj.com/collections/statsbk/index.dtl This is a brief but technical introduction to statistics with some details about how to perform the calculations. It starts out with a description of data types and then proceeds to explain some of the basic types of statistical estimation techniques and models. It concludes with a section on non-parametric statistics and how to select a specific study design.
http://www.statsoft.com/textbook/stathome.html This is an exhaustive “online textbook of statistics.” It is frequently referenced and provides an excellent overview of basic and advanced statistical techniques and study design issues.
http://davidmlane.com/hyperstat/ Another online statistical textbook that is more basic than the one above. It provides general tutorials on some of the basic statistical methods.
Online Statistical Calculators http://statpages.org/ This webpage is frequently referenced and contains an exhaustive list of online statistical calculators (in Java and other languages) that allow you to perform some basic statistical procedures. This is not SAS but provides an introduction to how some of these tests are done.
http://faculty.vassar.edu/lowry/VassarStats.html This is another site that provides online statistical calculation tools but is less advanced than the one above. It also has some basic explanations of how the statistical tests are accomplished.
http://www.socr.ucla.edu/SOCR.html This is the site for the Statistical Online Computational Resource, a set of Java applets that let you perform basic statistical calculations and view the results graphically. It provides a set of tutorials as well.
Downloadable Free Statistical Software List http://freestatistics.altervista.org/en/stat.php
This site provides an exhaustive list of downloadable and freely available software for statistical calculations. Topics include everything from general statistical calculations to structural equation modeling and data mining.
Top Related