![INDEX [midlandhort.co.nz] · Abutilon White CR 2L 70 6.60 4.95 Agapanthus Orientalis 2L 20 6.60 4.95 Acaccia Melanoxylon CR 1.5L 6.60 4.95 Agapanthus Peter Pan 1.5L 6.60 4.95 Acacia](https://static.fdocuments.net/doc/165x107/5e498d6cd9bc84245a7aa0ad/index-abutilon-white-cr-2l-70-660-495-agapanthus-orientalis-2l-20-660-495.jpg)


Languages
Pages
Legal

Haemoglobin A1c analysis:Understanding what is measured is
fundamental to interpretationCrossing Science and Education
Garry John
Norfolk and Norwich University Hospital
& The Norwich Medical School, UEA
UK
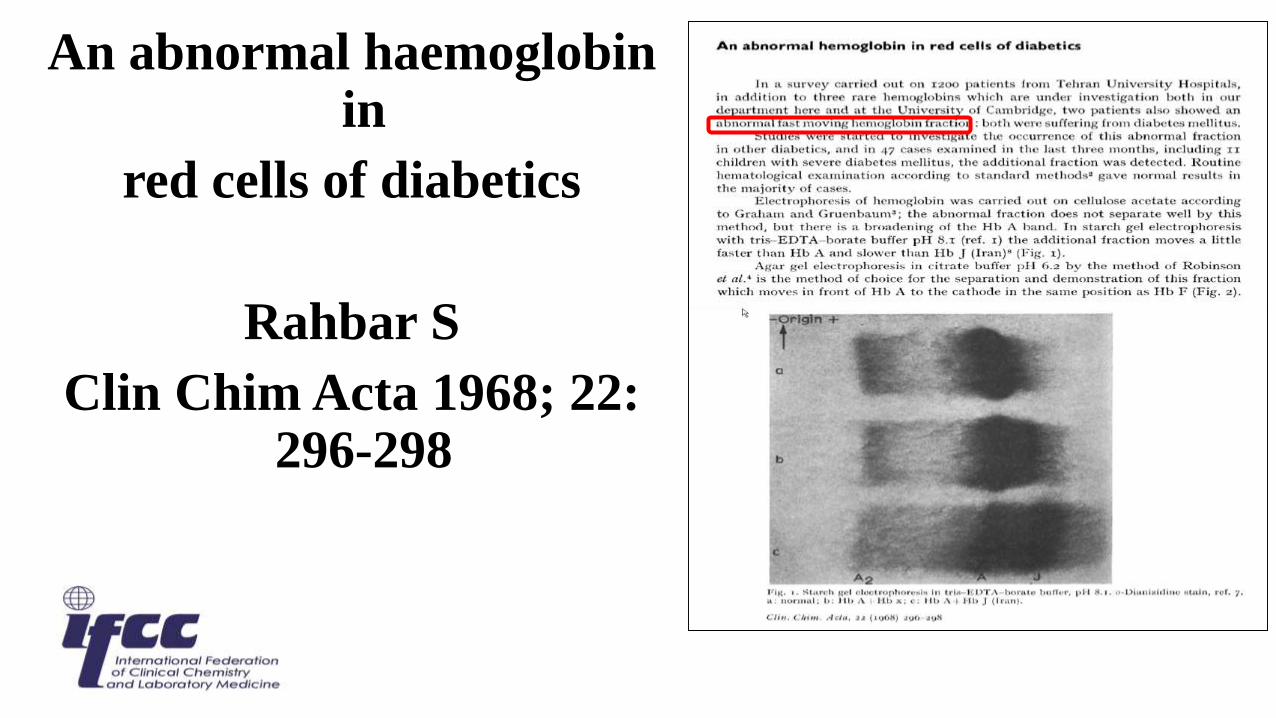
An abnormal haemoglobin in
red cells of diabetics
Rahbar S
Clin Chim Acta 1968; 22: 296-298
Haemoglobin A1 was first described in 1955
Kunkel and Wallenius using charge separaration identified a “new”
fraction HbA1. The amino acid sequence of HbA1 was shown to be identical to
HbA0
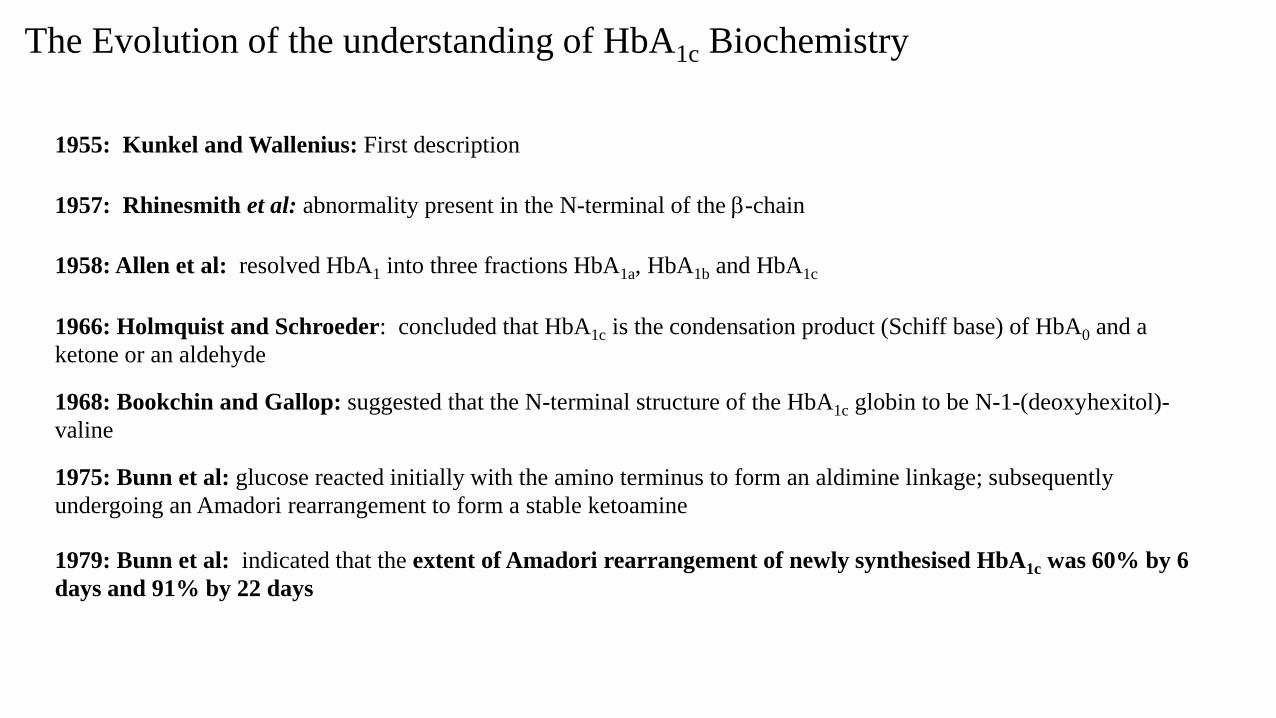
1955: Kunkel and Wallenius: First description
1957: Rhinesmith et al: abnormality present in the N-terminal of the b-chain
1966: Holmquist and Schroeder: concluded that HbA1c is the condensation product (Schiff base) of HbA0 and a
ketone or an aldehyde
1958: Allen et al: resolved HbA1 into three fractions HbA1a, HbA1b and HbA1c
1968: Bookchin and Gallop: suggested that the N-terminal structure of the HbA1c globin to be N-1-(deoxyhexitol)-
valine
1975: Bunn et al: glucose reacted initially with the amino terminus to form an aldimine linkage; subsequently
undergoing an Amadori rearrangement to form a stable ketoamine
1979: Bunn et al: indicated that the extent of Amadori rearrangement of newly synthesised HbA1c was 60% by 6
days and 91% by 22 days
The Evolution of the understanding of HbA1c Biochemistry
bA
O
O O
HC
HCOH
HCOH
HCOH
CH 2OH
HOCH
OHHC
HCOH
HC
HCOH
CH 2OH
Glucoseb–N – valyl – 1 –
deoxyglucoseb– N –valyl – 1 – deoxyfructose
HOCH
HC
HCOH
HC
HCOH
CH 2OH
HOCH
O
NH bAH 2C
COH
HC
HCOH
CH 2OH
HOCH
NHC
HCOH
HCOH
HCOH
CH 2OH
HOCH
C
HCOH
HCOH
CH 2OH
HOCHH +
H +
O
N +H 2 bAH 2C
COH
HC
HCOH
CH 2OH
HOCH
KetoamineAldimine
(Schiff base)
bA CH 2NH bA
O C
HCOH
HCOH
CH 2OH
HOCH
O
CH 2N +H 2 bA
H 2N +bA
Amadori
rearrange-
ment
NH
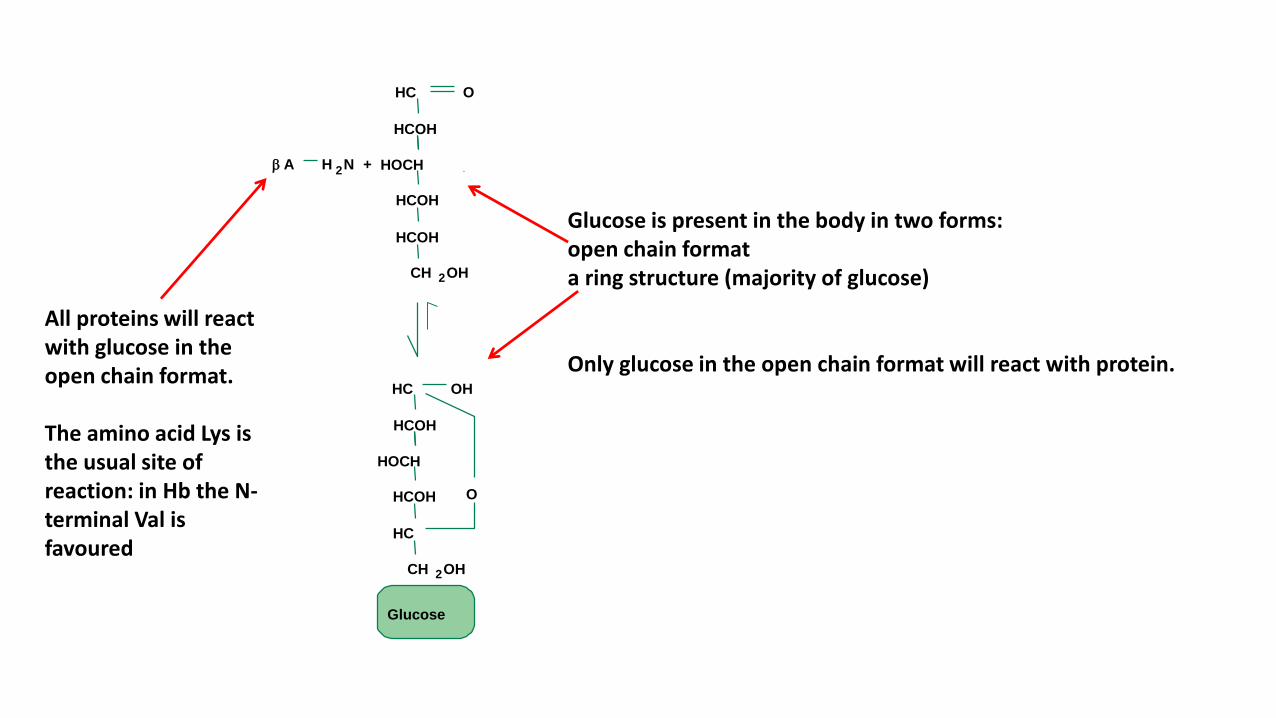
Glucose is present in the body in two forms: open chain formata ring structure (majority of glucose)
Only glucose in the open chain format will react with protein.
All proteins will react with glucose in the open chain format.
The amino acid Lys is the usual site of reaction: in Hb the N-terminal Val is favoured
bA
O
O O
HC
HCOH
HCOH
HCOH
CH 2OH
HOCH
OHHC
HCOH
HC
HCOH
CH 2OH
Glucoseb–N – valyl – 1 –
deoxyglucoseb– N –valyl – 1 – deoxyfructose
HOCH
HC
HCOH
HC
HCOH
CH 2OH
HOCH
O
NH bAH 2C
COH
HC
HCOH
CH 2OH
HOCH
NHC
HCOH
HCOH
HCOH
CH 2OH
HOCH
C
HCOH
HCOH
CH 2OH
HOCHH +
H +
O
N +H 2 bAH 2C
COH
HC
HCOH
CH 2OH
HOCH
KetoamineAldimine
(Schiff base)
bA CH 2NH bA
O C
HCOH
HCOH
CH 2OH
HOCH
O
CH 2N +H 2 bA
H 2N +bA
Amadori
rearrange-
ment
NH
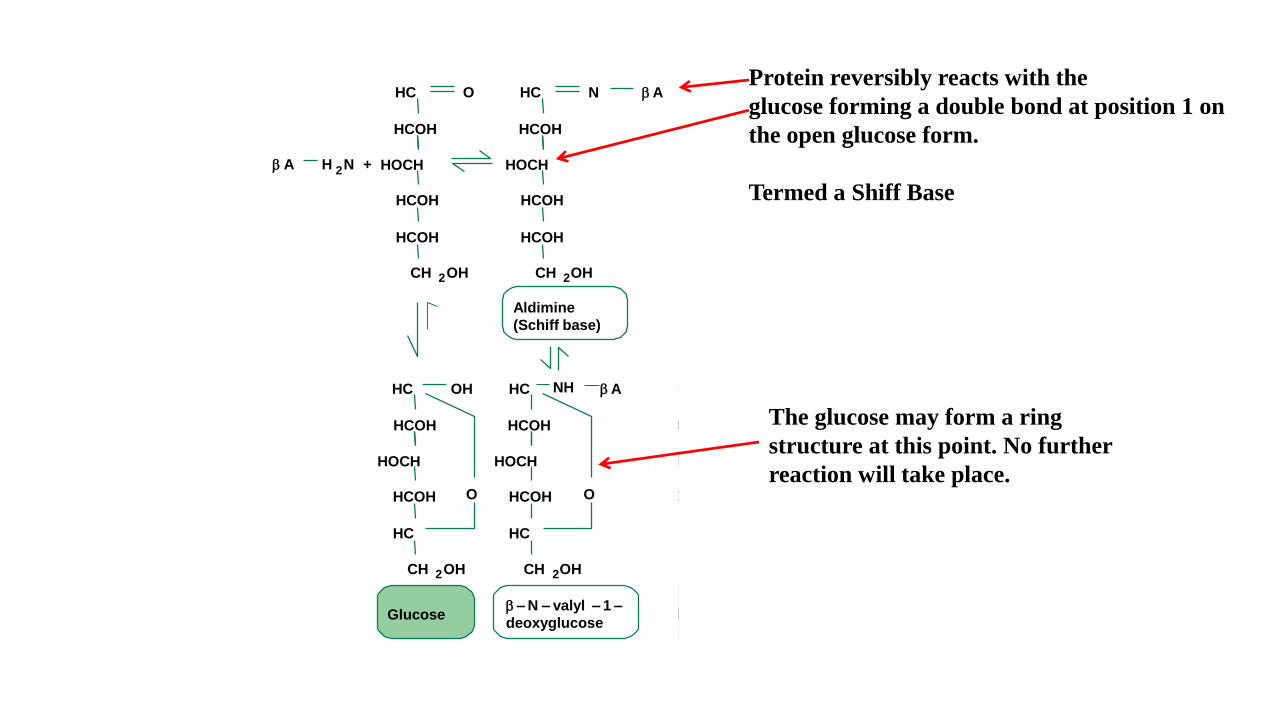
Protein reversibly reacts with the
glucose forming a double bond at position 1 on
the open glucose form.
Termed a Shiff Base
The glucose may form a ring
structure at this point. No further
reaction will take place.
bA
O
O O
HC
HCOH
HCOH
HCOH
CH 2OH
HOCH
OHHC
HCOH
HC
HCOH
CH 2OH
Glucoseb–N – valyl – 1 –
deoxyglucoseb – N –valyl – 1 – deoxyfructose
HOCH
HC
HCOH
HC
HCOH
CH 2OH
HOCH
O
NH bAH 2C
COH
HC
HCOH
CH 2OH
HOCH
NHC
HCOH
HCOH
HCOH
CH 2OH
HOCH
C
HCOH
HCOH
CH 2OH
HOCHH +
H +
O
N +H 2 bAH 2C
COH
HC
HCOH
CH 2OH
HOCH
KetoamineAldimine
(Schiff base)
bA CH 2NH bA
O C
HCOH
HCOH
CH 2OH
HOCH
O
CH 2N +H 2 bA
H 2N +bA
Amadori
rearrange-
ment
NH
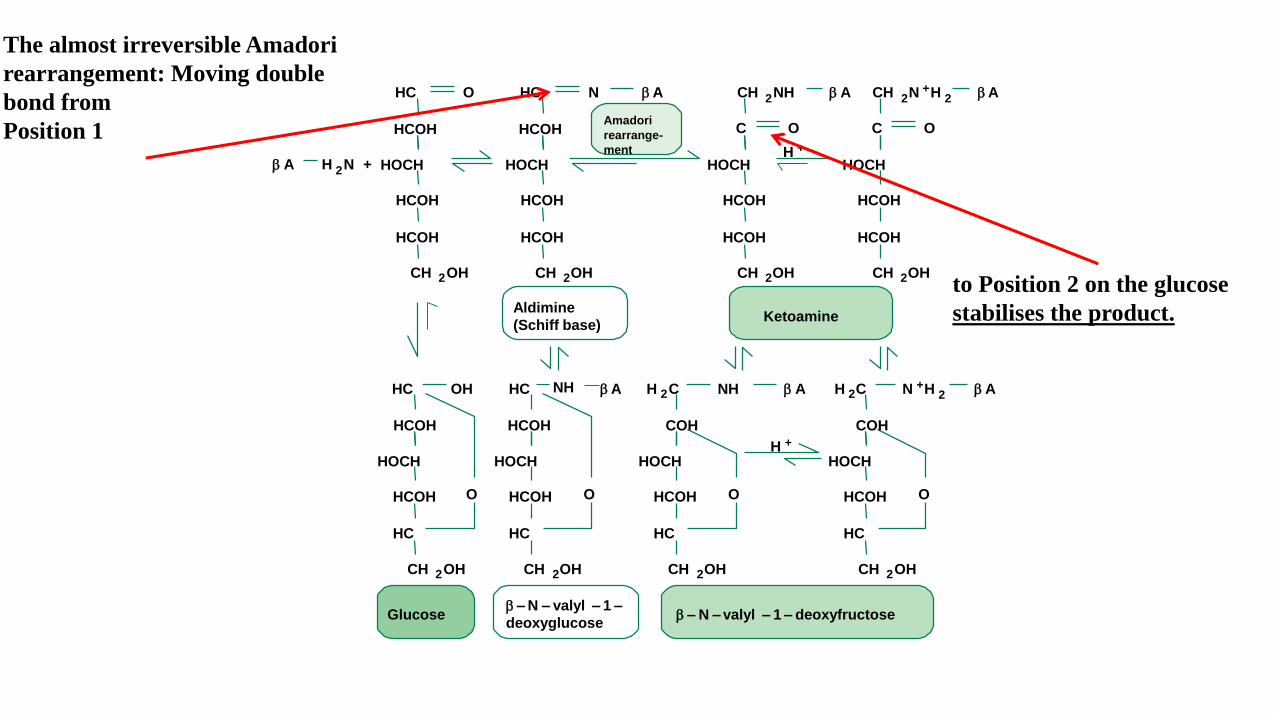
The almost irreversible Amadori
rearrangement: Moving double
bond from
Position 1
to Position 2 on the glucose
stabilises the product.
bA
O
O O
HC
HCOH
HCOH
HCOH
CH 2OH
HOCH
OHHC
HCOH
HC
HCOH
CH 2OH
Glucoseb–N – valyl – 1 –
deoxyglucoseb – N –valyl – 1 – deoxyfructose
HOCH
HC
HCOH
HC
HCOH
CH 2OH
HOCH
O
NH bAH 2C
COH
HC
HCOH
CH 2OH
HOCH
NHC
HCOH
HCOH
HCOH
CH 2OH
HOCH
C
HCOH
HCOH
CH 2OH
HOCHH +
H +
O
N +H 2 bAH 2C
COH
HC
HCOH
CH 2OH
HOCH
KetoamineAldimine
(Schiff base)
bA CH 2NH bA
O C
HCOH
HCOH
CH 2OH
HOCH
O
CH 2N +H 2 bA
H 2N +bHb
Amadori
rearrange-
ment
NH
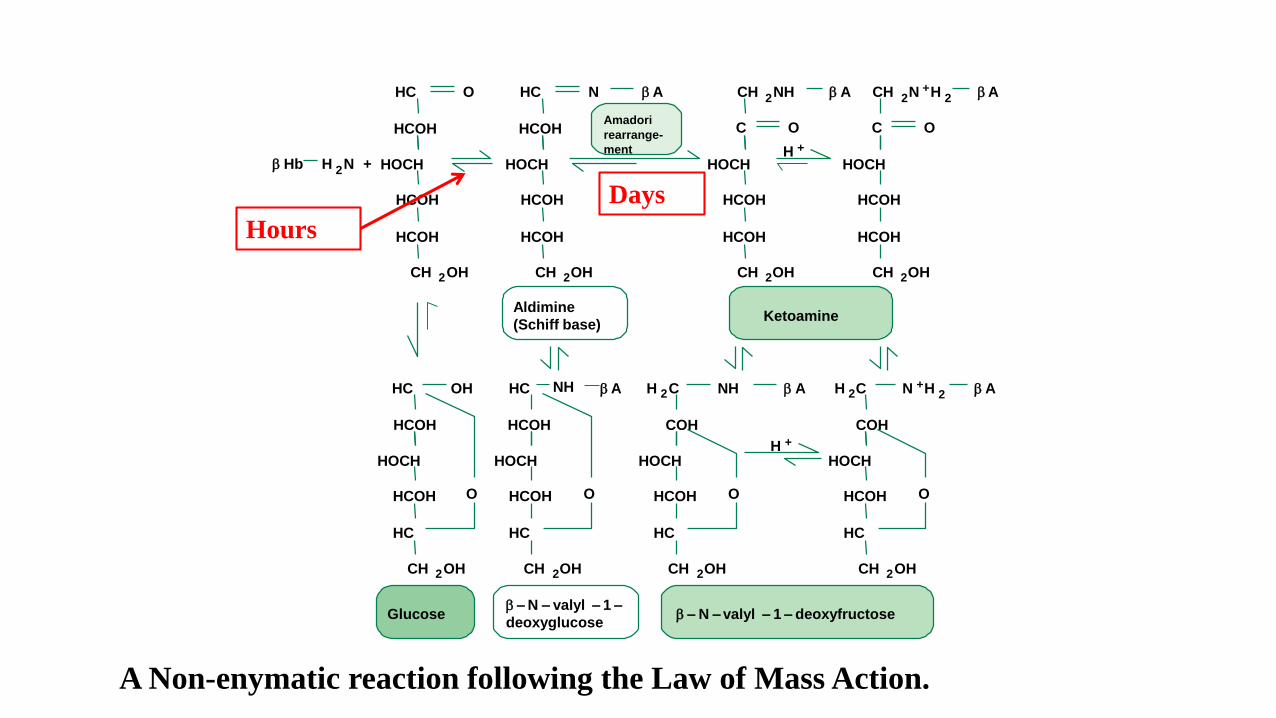
A Non-enymatic reaction following the Law of Mass Action.
Hours
Days
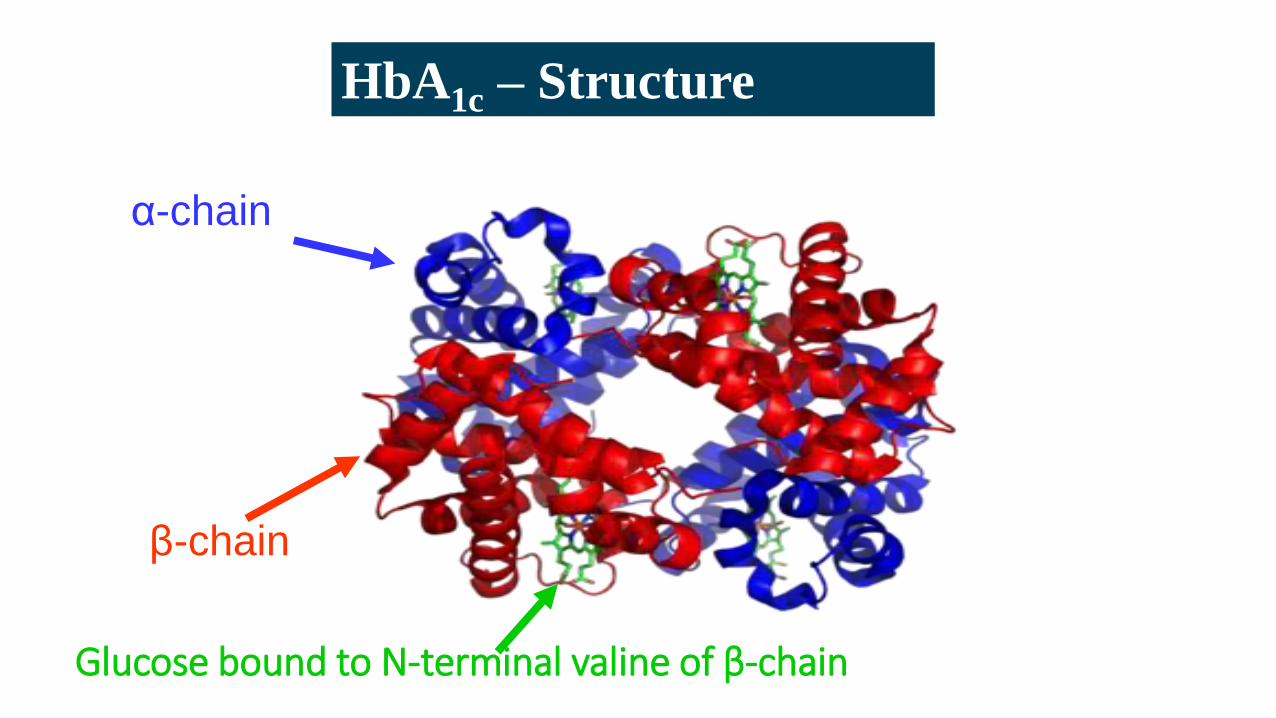
HbA1c – Structure
β-chain
α-chain
Glucose bound to N-terminal valine of β-chain
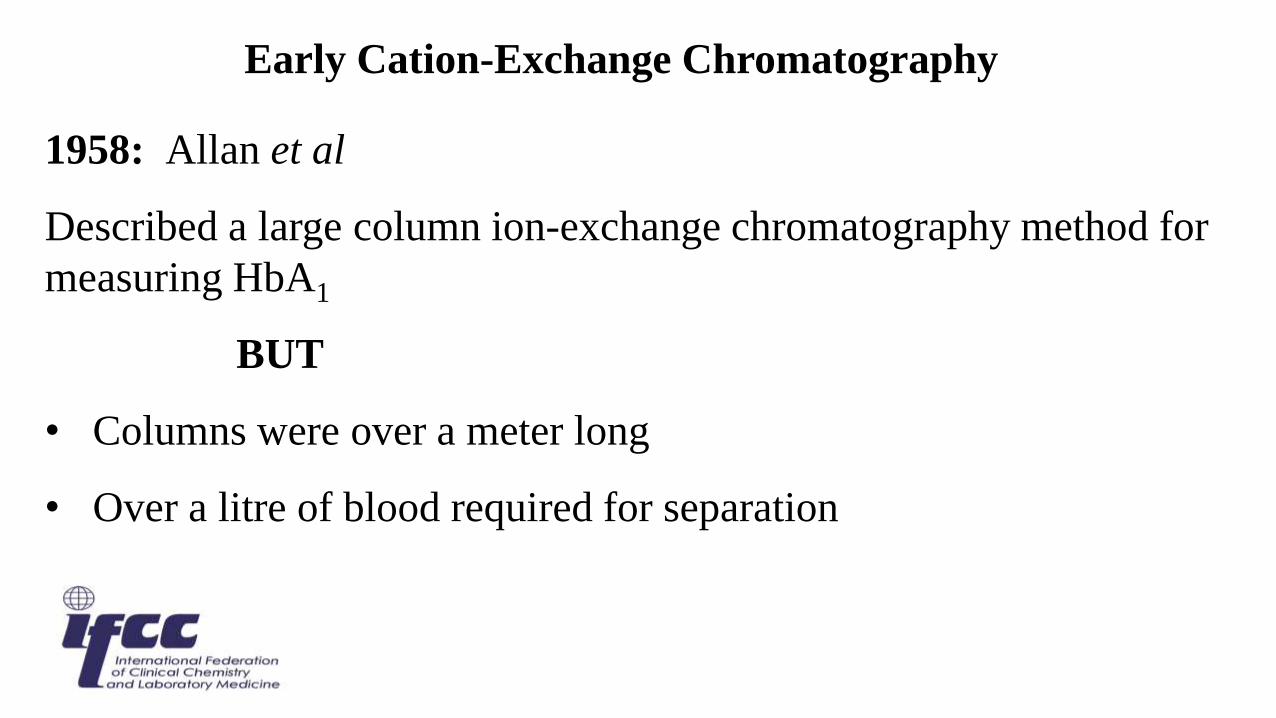
Early Cation-Exchange Chromatography
1958: Allan et al
Described a large column ion-exchange chromatography method for
measuring HbA1
BUT
• Columns were over a meter long
• Over a litre of blood required for separation
Only another half litre of blood then we can measure your HbA1
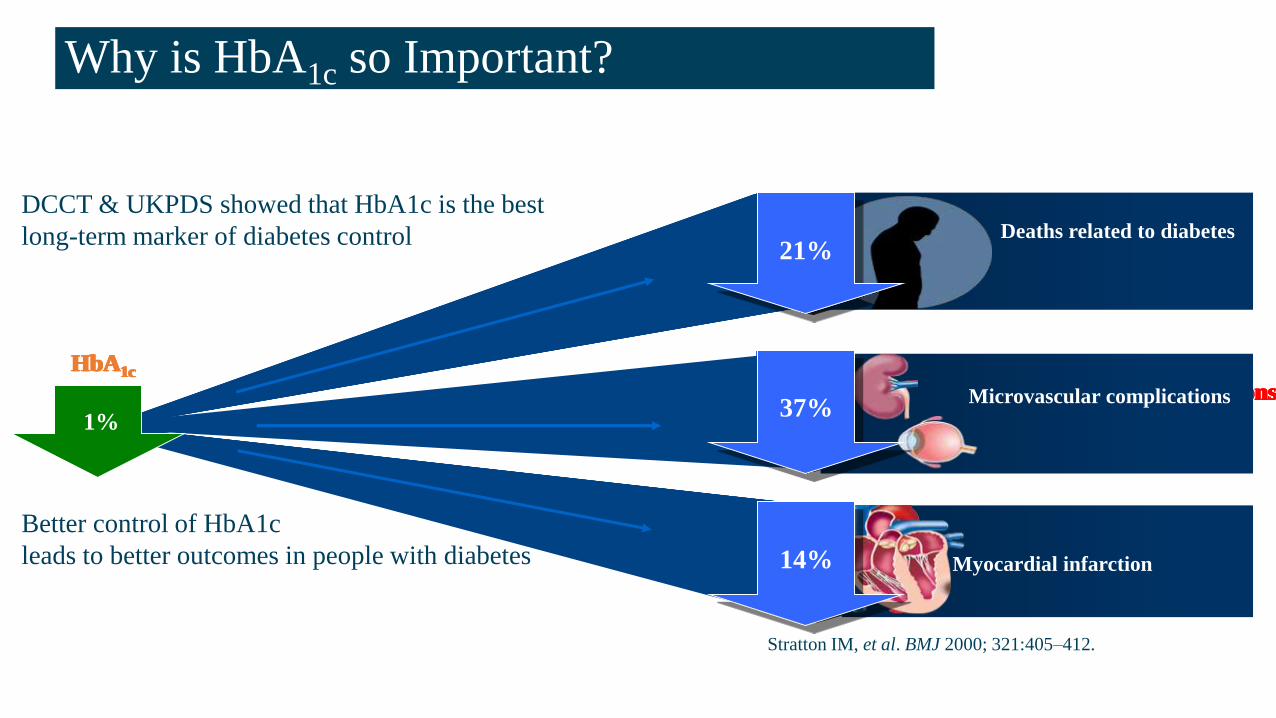
Why is HbA1c so Important?
Microvascular complications37%
14%
Deaths related to diabetes
Microvascular complications
HbA1c
37%
14%
Deaths related to diabetes
Microvascular complications
HbA1c
37%
14%
Deaths related to diabetes
Microvascular complications
HbA1c
37%
14%
Deaths related to diabetes21%
Microvascular complications
HbA1c
37%
14%
Deaths related to diabetes21%
Microvascular complications
HbA1c
37%
14%
Deaths related to diabetes21%
1%
Myocardial infarction
DCCT & UKPDS showed that HbA1c is the best
long-term marker of diabetes control
Better control of HbA1c
leads to better outcomes in people with diabetes
Stratton IM, et al. BMJ 2000; 321:405–412.
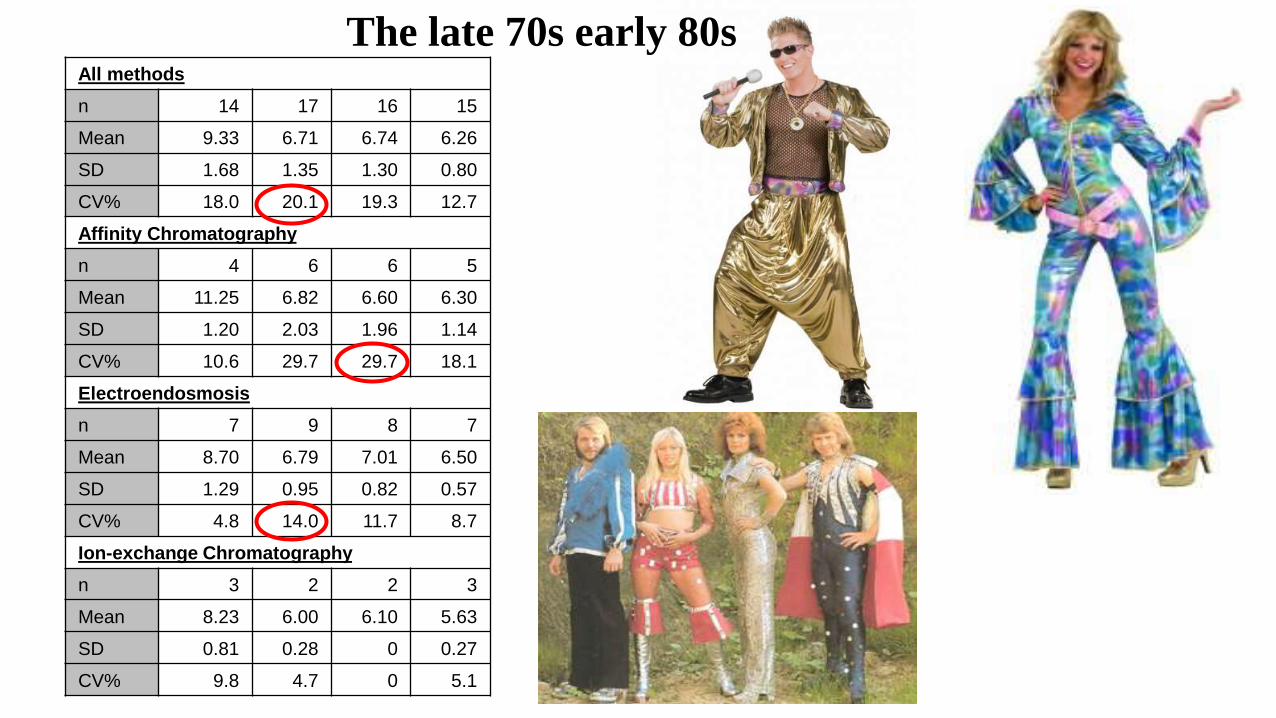
All methods
n 14 17 16 15
Mean 9.33 6.71 6.74 6.26
SD 1.68 1.35 1.30 0.80
CV% 18.0 20.1 19.3 12.7
Affinity Chromatography
n 4 6 6 5
Mean 11.25 6.82 6.60 6.30
SD 1.20 2.03 1.96 1.14
CV% 10.6 29.7 29.7 18.1
Electroendosmosis
n 7 9 8 7
Mean 8.70 6.79 7.01 6.50
SD 1.29 0.95 0.82 0.57
CV% 4.8 14.0 11.7 8.7
Ion-exchange Chromatography
n 3 2 2 3
Mean 8.23 6.00 6.10 5.63
SD 0.81 0.28 0 0.27
CV% 9.8 4.7 0 5.1
The late 70s early 80s
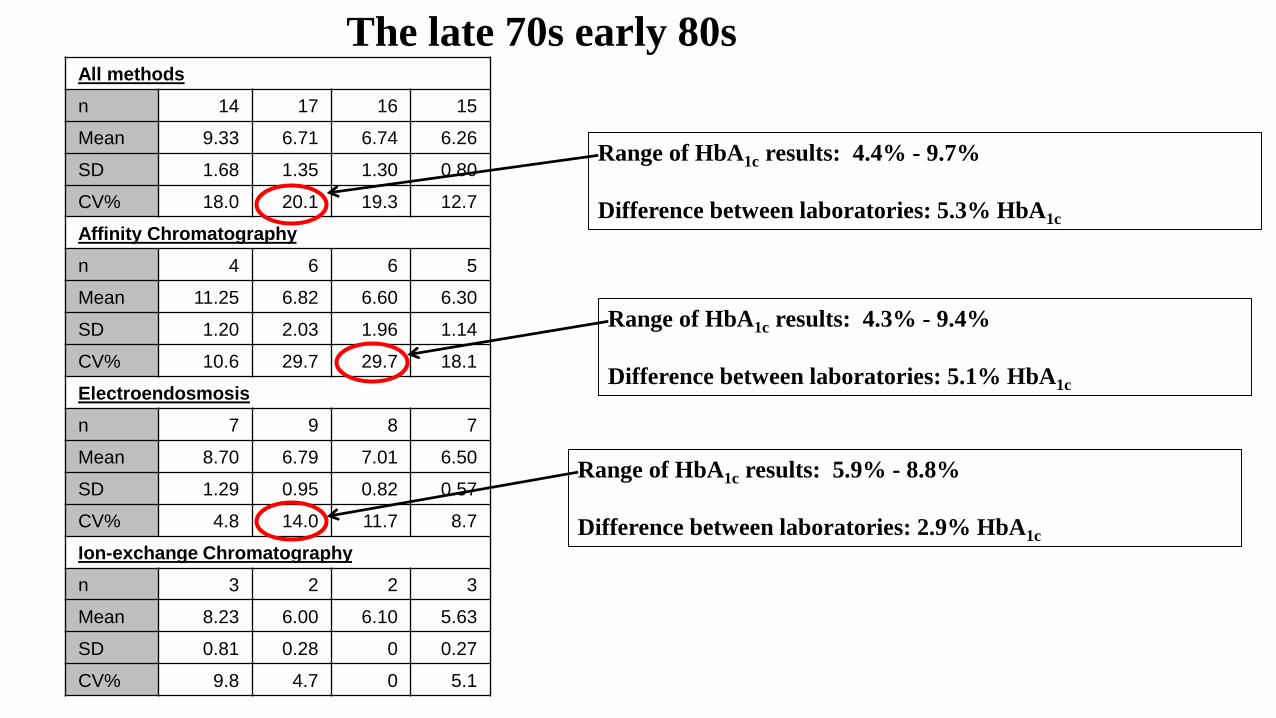
Range of HbA1c results: 4.4% - 9.7%
Difference between laboratories: 5.3% HbA1c
Range of HbA1c results: 4.3% - 9.4%
Difference between laboratories: 5.1% HbA1c
Range of HbA1c results: 5.9% - 8.8%
Difference between laboratories: 2.9% HbA1c
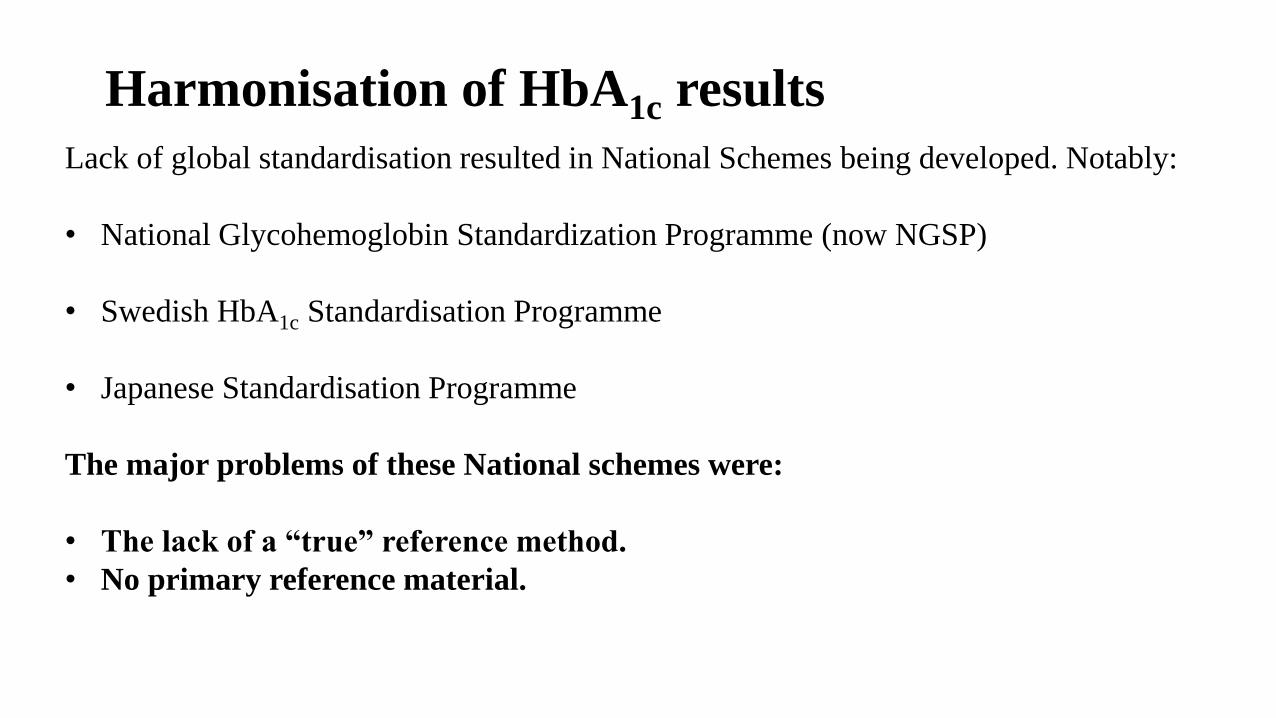
Lack of global standardisation resulted in National Schemes being developed. Notably:
• National Glycohemoglobin Standardization Programme (now NGSP)
• Swedish HbA1c Standardisation Programme
• Japanese Standardisation Programme
The major problems of these National schemes were:
• The lack of a “true” reference method.
• No primary reference material.
Harmonisation of HbA1c results
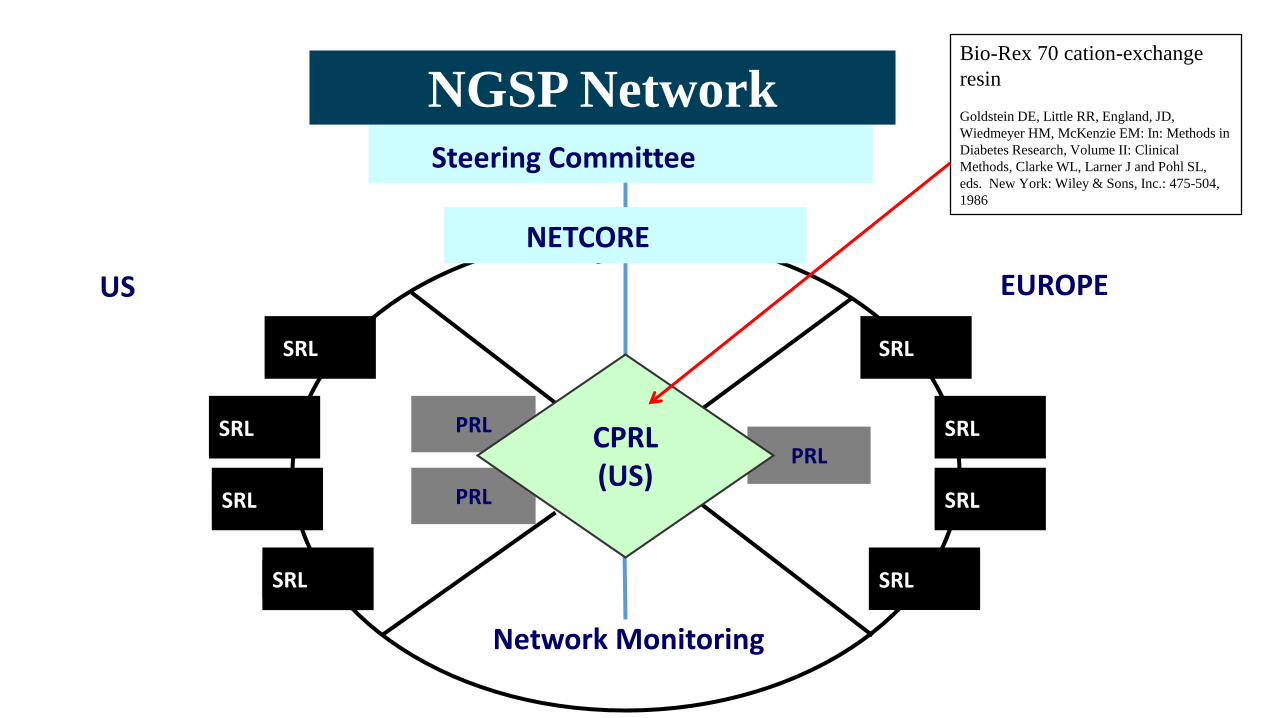
PRL
PRL
PRL
Steering Committee
NETCORE
SRLSRL
SRL
Network Monitoring
SRL
CPRL(US)
NGSP Network
SRL
SRL
SRL
SRL
EUROPEUS
Bio-Rex 70 cation-exchange
resin
Goldstein DE, Little RR, England, JD,
Wiedmeyer HM, McKenzie EM: In: Methods in
Diabetes Research, Volume II: Clinical
Methods, Clarke WL, Larner J and Pohl SL,
eds. New York: Wiley & Sons, Inc.: 475-504,
1986
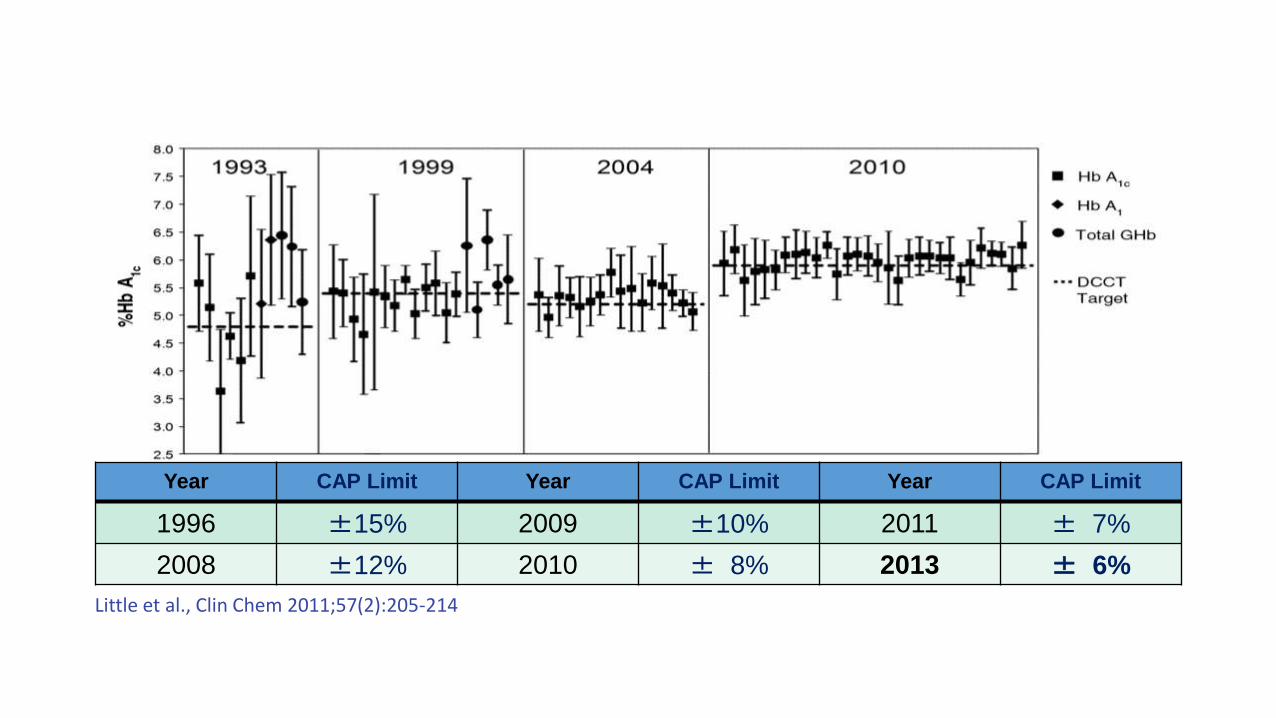
Year CAP Limit Year CAP Limit Year CAP Limit
1996 ±15% 2009 ±10% 2011 ± 7%
2008 ±12% 2010 ± 8% 2013 ± 6%
Little et al., Clin Chem 2011;57(2):205-214
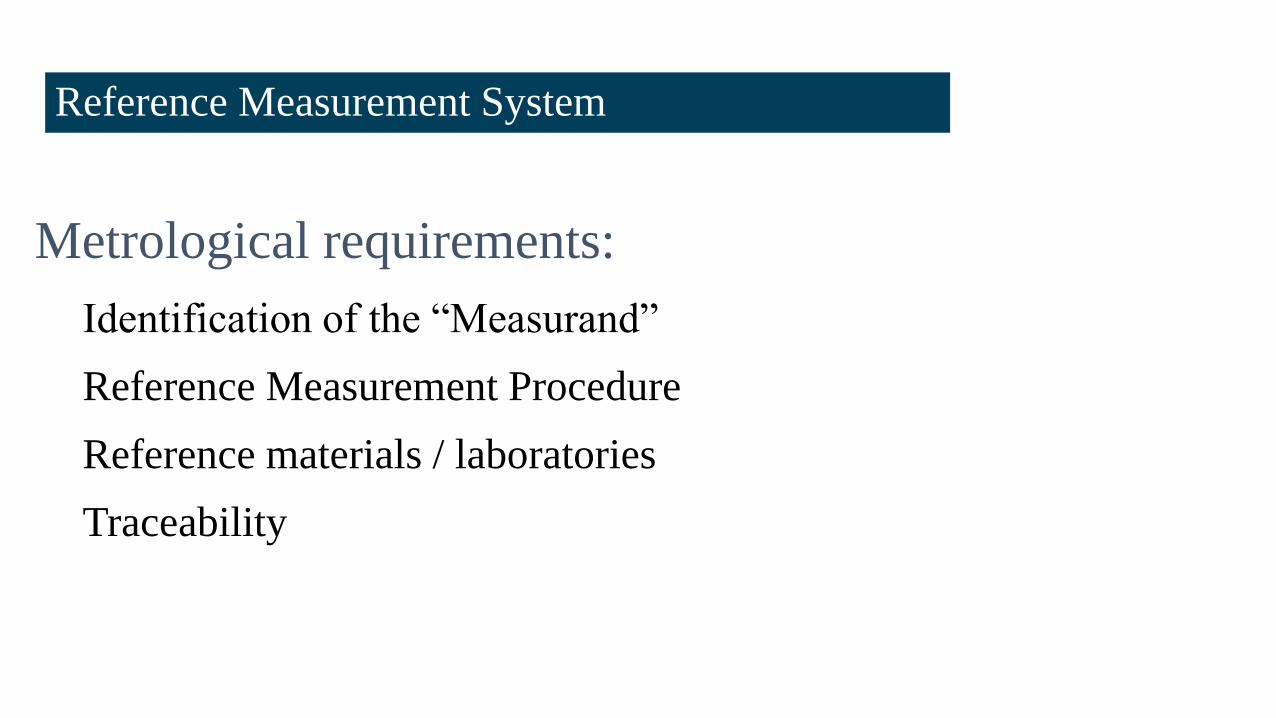
Reference Measurement System
Metrological requirements:
Identification of the “Measurand”
Reference Measurement Procedure
Reference materials / laboratories
Traceability
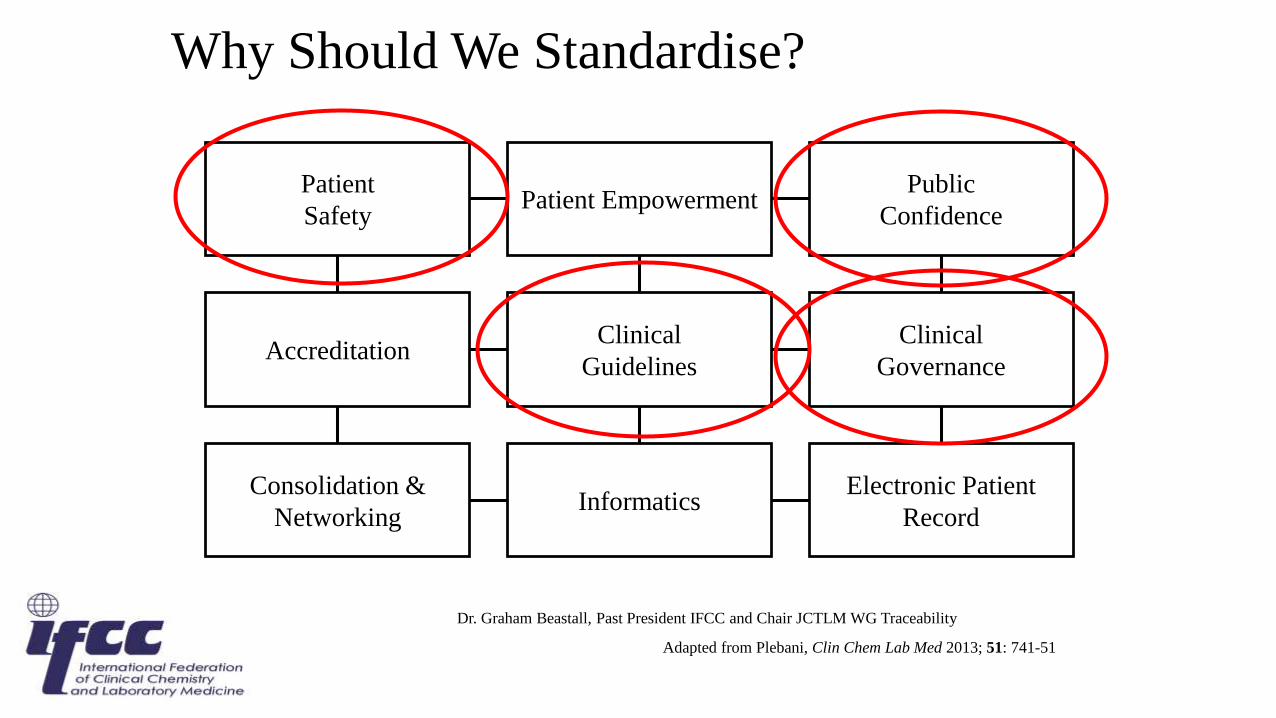
Why Should We Standardise?
Patient
SafetyPatient Empowerment
Public
Confidence
Accreditation
Consolidation &
Networking
Clinical
Guidelines
Clinical
Governance
InformaticsElectronic Patient
Record
Adapted from Plebani, Clin Chem Lab Med 2013; 51: 741-51
Dr. Graham Beastall, Past President IFCC and Chair JCTLM WG Traceability
Clin Chem
2008
The IFCC Reference Measurement System for HbA1c:A 6-Year Progress Report
Cas Weykamp (1*), W. Garry John (2), Andrea Mosca (3)Tadao Hoshino (4), Randie Little (5), Jan-Olof Jeppsson (6)
Kor Miedema (8), Gary Myers (9), Hans Reinauer (10)David Sacks (11), Robbert Slingerland (8), Carla Siebelder (1)
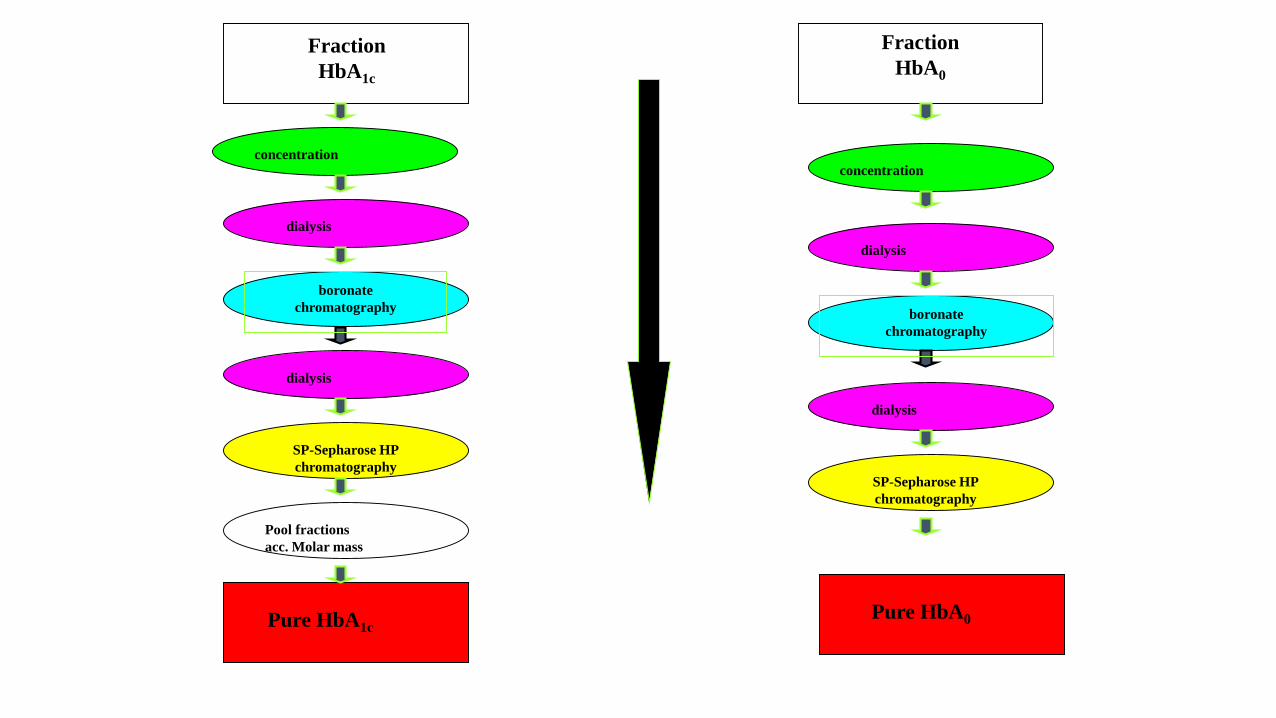
Fraction
HbA1c
Fraction
HbA0
Pure HbA1cPure HbA0
concentration
dialysis
boronate
chromatography
dialysis
SP-Sepharose HP
chromatography
Pool fractions
acc. Molar mass
concentration
dialysis
boronate
chromatography
dialysis
SP-Sepharose HP
chromatography
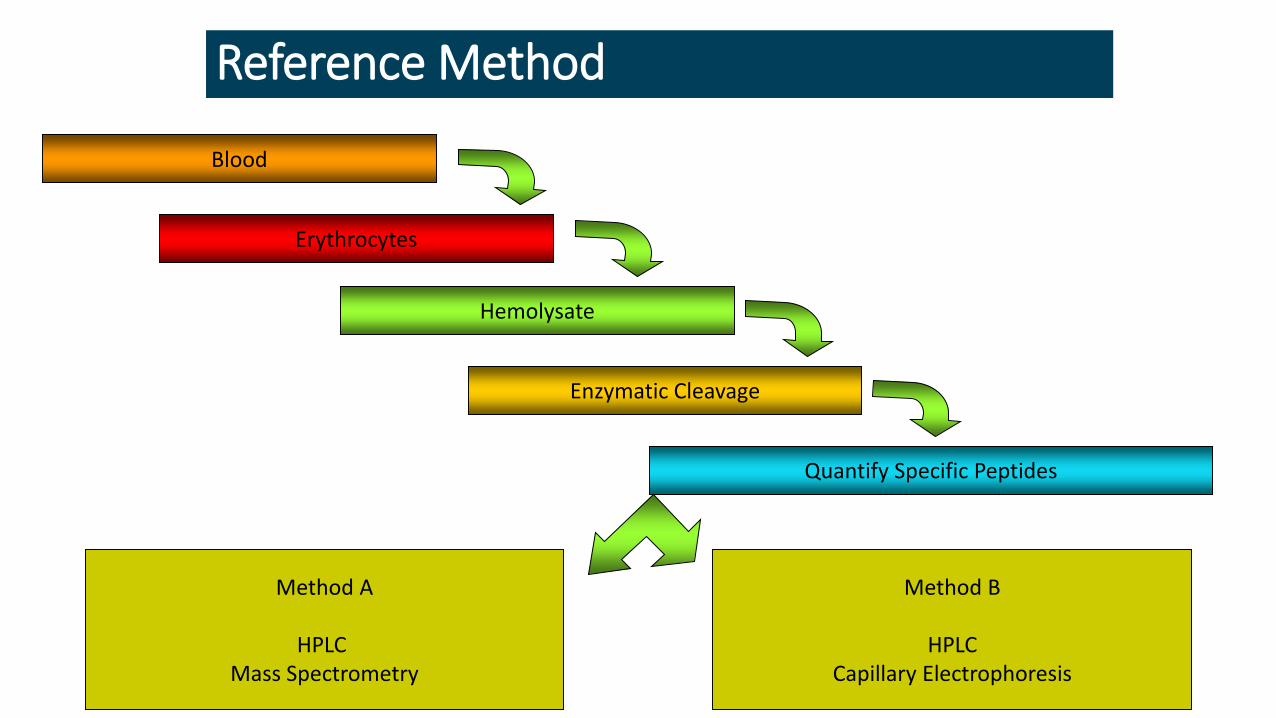
Reference Method
Blood
Method A
HPLC Mass Spectrometry
Erythrocytes
Hemolysate
Enzymatic Cleavage
Quantify Specific Peptides
Method B
HPLCCapillary Electrophoresis
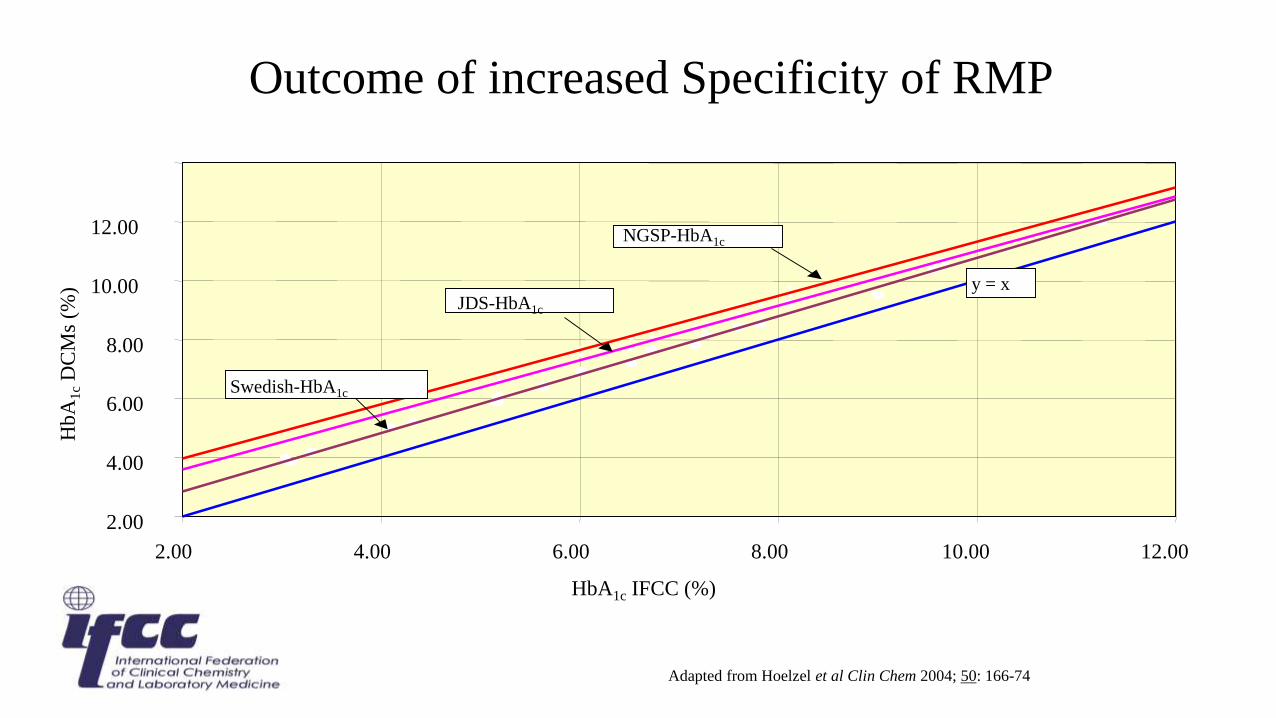
Outcome of increased Specificity of RMP
2.00
4.00
6.00
8.00
10.00
12.00
2.00 4.00 6.00 8.00 10.00 12.00
HbA1c IFCC (%)
NGSP-HbA1c
JDS-HbA1c
Swedish-HbA1c
y = x
Hb
A1
cD
CM
s (%
)
Adapted from Hoelzel et al Clin Chem 2004; 50: 166-74
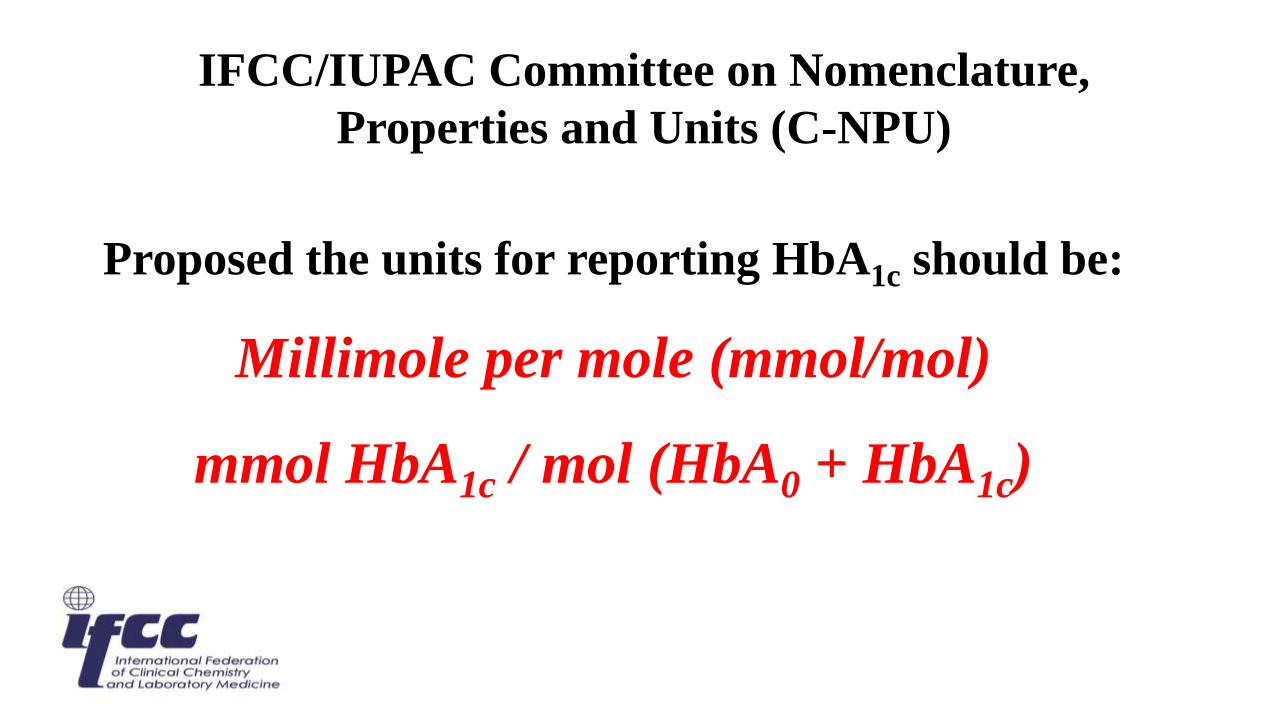
IFCC/IUPAC Committee on Nomenclature,
Properties and Units (C-NPU)
Proposed the units for reporting HbA1c should be:
Millimole per mole (mmol/mol)
mmol HbA1c / mol (HbA0 + HbA1c)
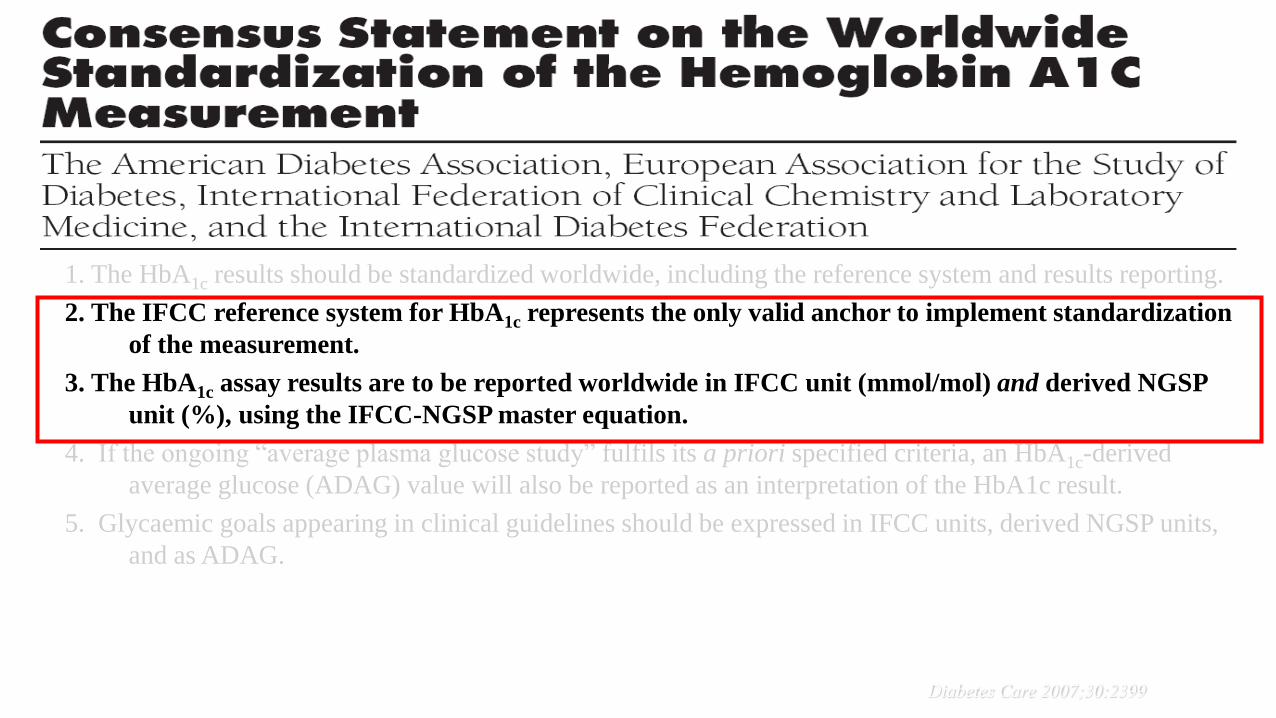
1. The HbA1c results should be standardized worldwide, including the reference system and results reporting.
2. The IFCC reference system for HbA1c represents the only valid anchor to implement standardization
of the measurement.
3. The HbA1c assay results are to be reported worldwide in IFCC unit (mmol/mol) and derived NGSP
unit (%), using the IFCC-NGSP master equation.
4. If the ongoing “average plasma glucose study” fulfils its a priori specified criteria, an HbA1c-derived
average glucose (ADAG) value will also be reported as an interpretation of the HbA1c result.
5. Glycaemic goals appearing in clinical guidelines should be expressed in IFCC units, derived NGSP units,
and as ADAG.
Diabetes Care 2007;30:2399
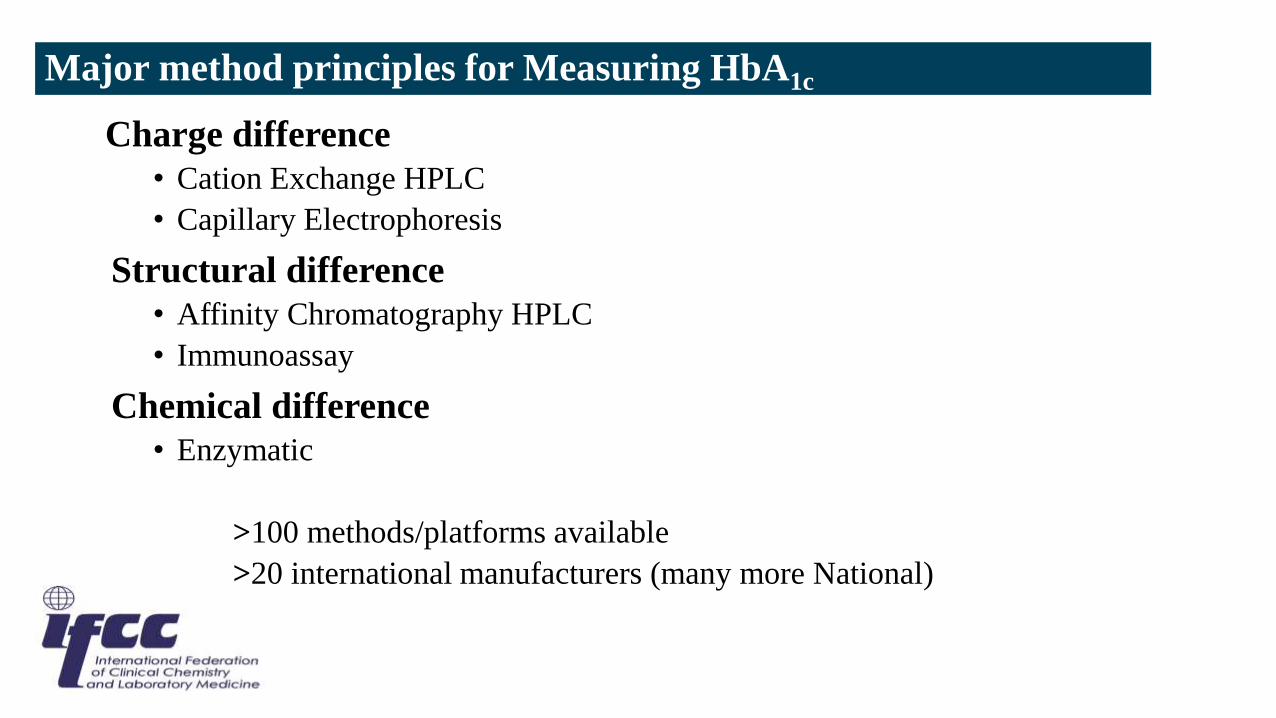
Major method principles for Measuring HbA1c
Charge difference
• Cation Exchange HPLC
• Capillary Electrophoresis
Structural difference
• Affinity Chromatography HPLC
• Immunoassay
Chemical difference
• Enzymatic
>100 methods/platforms available
>20 international manufacturers (many more National)
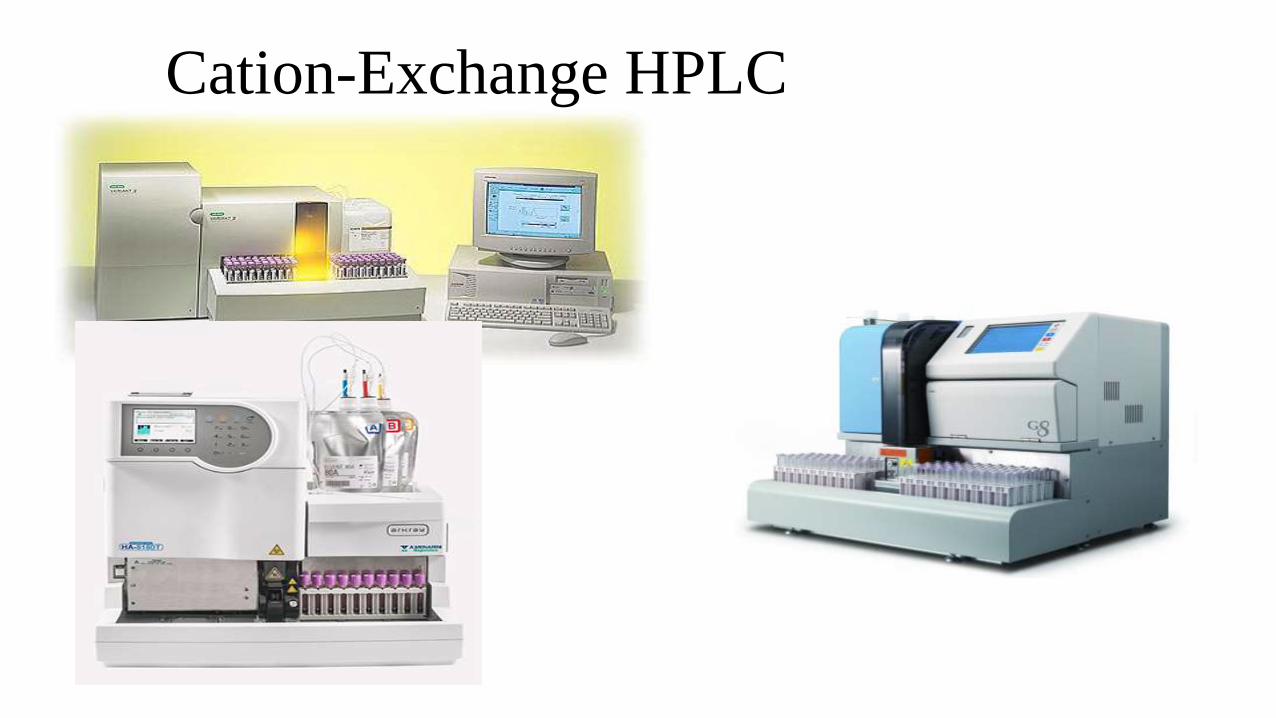
Cation-Exchange HPLC
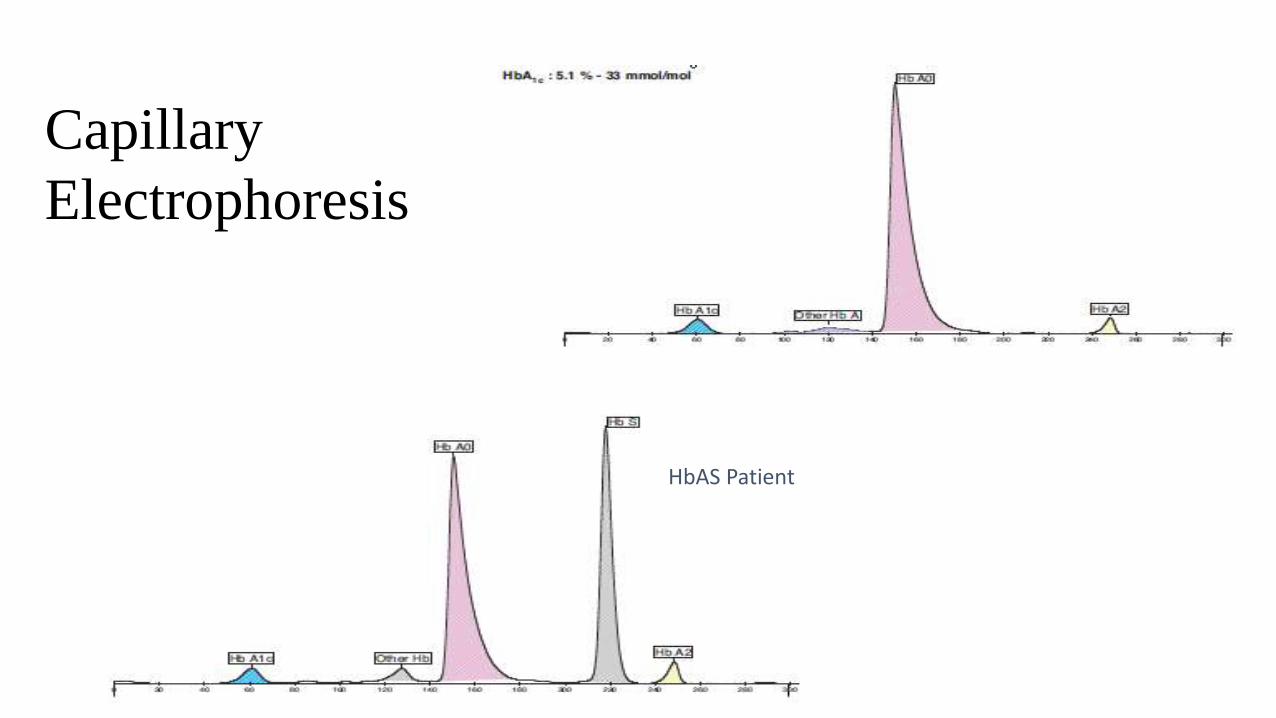
Capillary
Electrophoresis
HbAS Patient
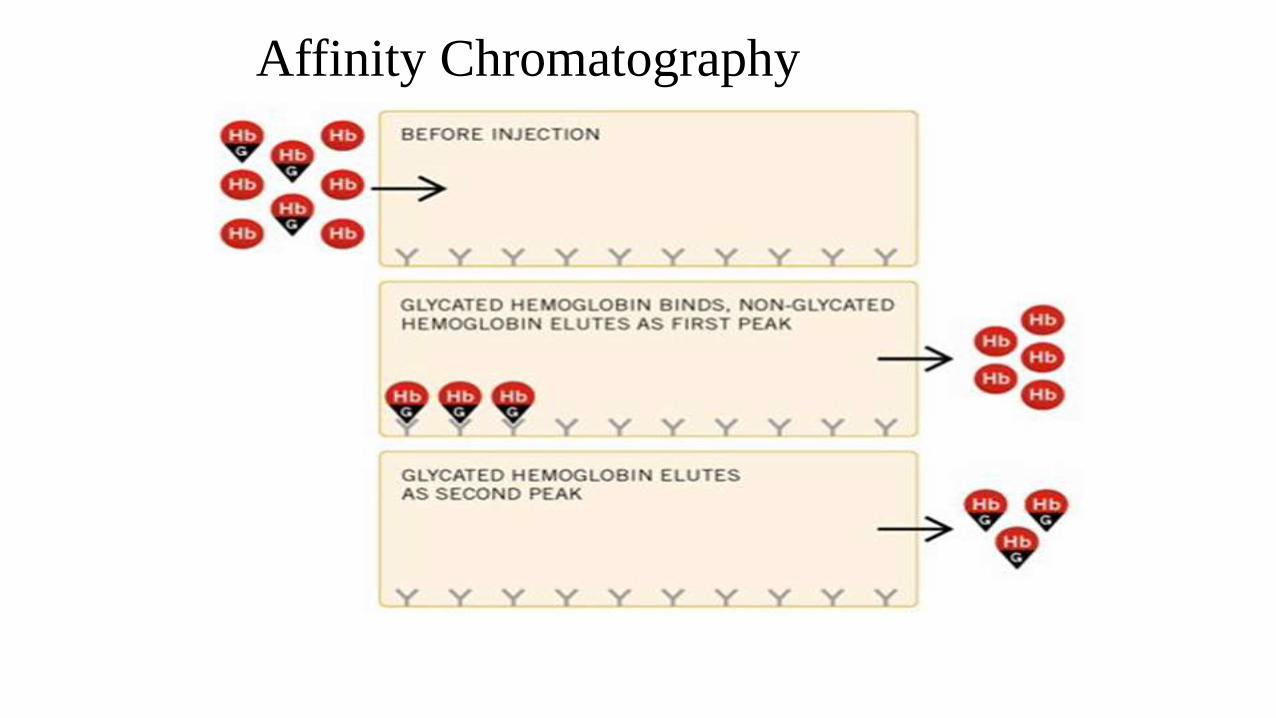
Affinity Chromatography
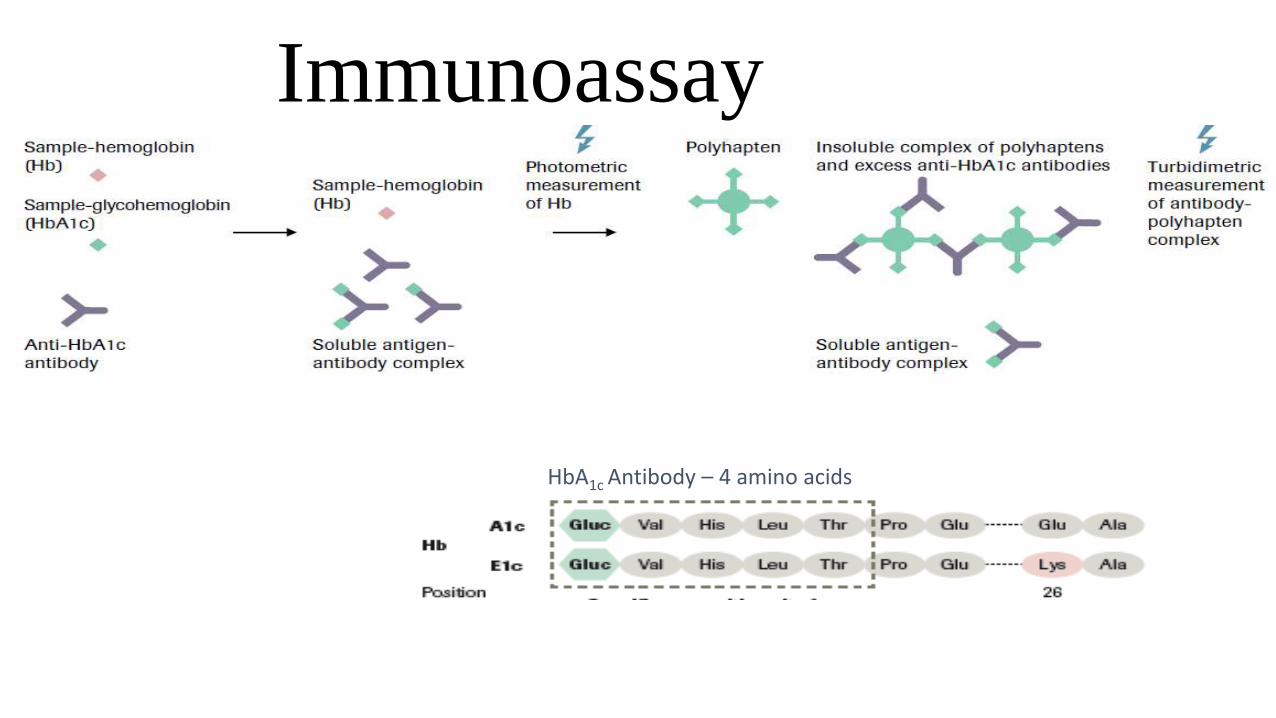
Immunoassay
HbA1c Antibody – 4 amino acids
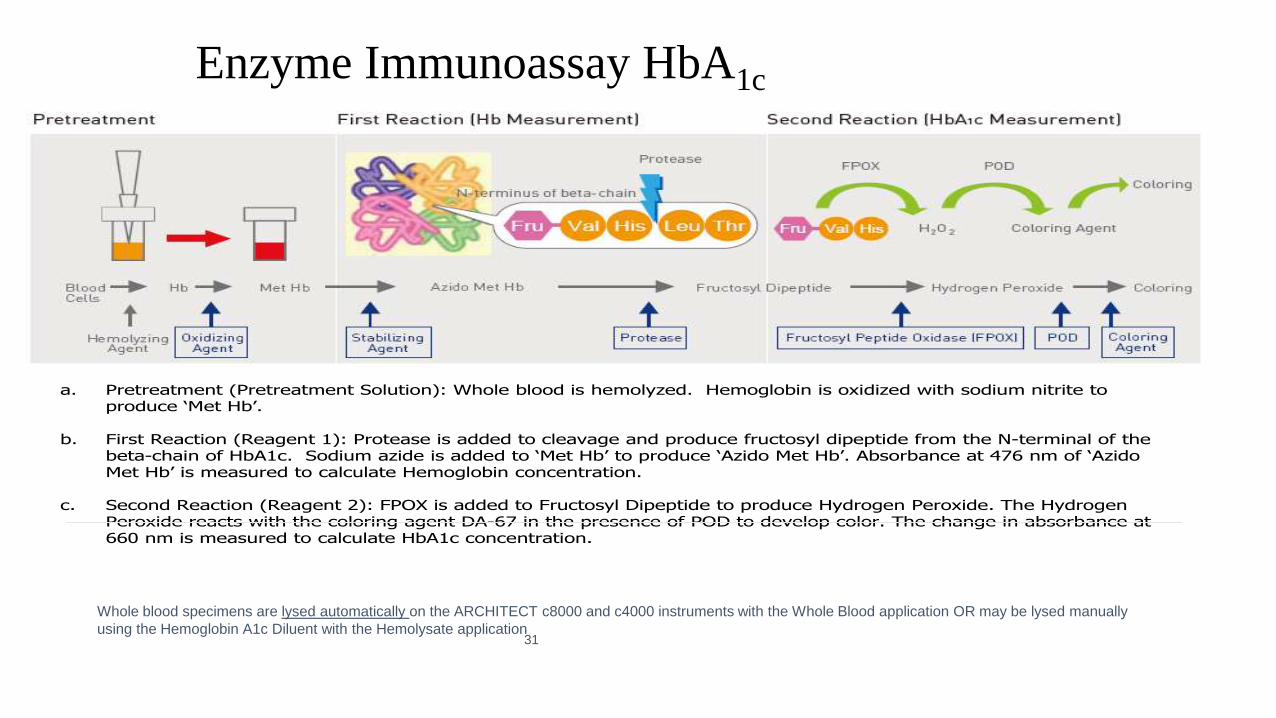
Enzyme Immunoassay HbA1c
a. Pretreatment (Pretreatment Solution): Whole blood is hemolyzed. Hemoglobin is oxidized with sodium nitrite to produce ‘Met Hb’.
b. First Reaction (Reagent 1): Protease is added to cleavage and produce fructosyl dipeptide from the N-terminal of the beta-chain of HbA1c. Sodium azide is added to ‘Met Hb’ to produce ‘Azido Met Hb’. Absorbance at 476 nm of ‘AzidoMet Hb’ is measured to calculate Hemoglobin concentration.
c. Second Reaction (Reagent 2): FPOX is added to Fructosyl Dipeptide to produce Hydrogen Peroxide. The Hydrogen Peroxide reacts with the coloring agent DA-67 in the presence of POD to develop color. The change in absorbance at 660 nm is measured to calculate HbA1c concentration.
31
Whole blood specimens are lysed automatically on the ARCHITECT c8000 and c4000 instruments with the Whole Blood application OR may be lysed manually
using the Hemoglobin A1c Diluent with the Hemolysate application
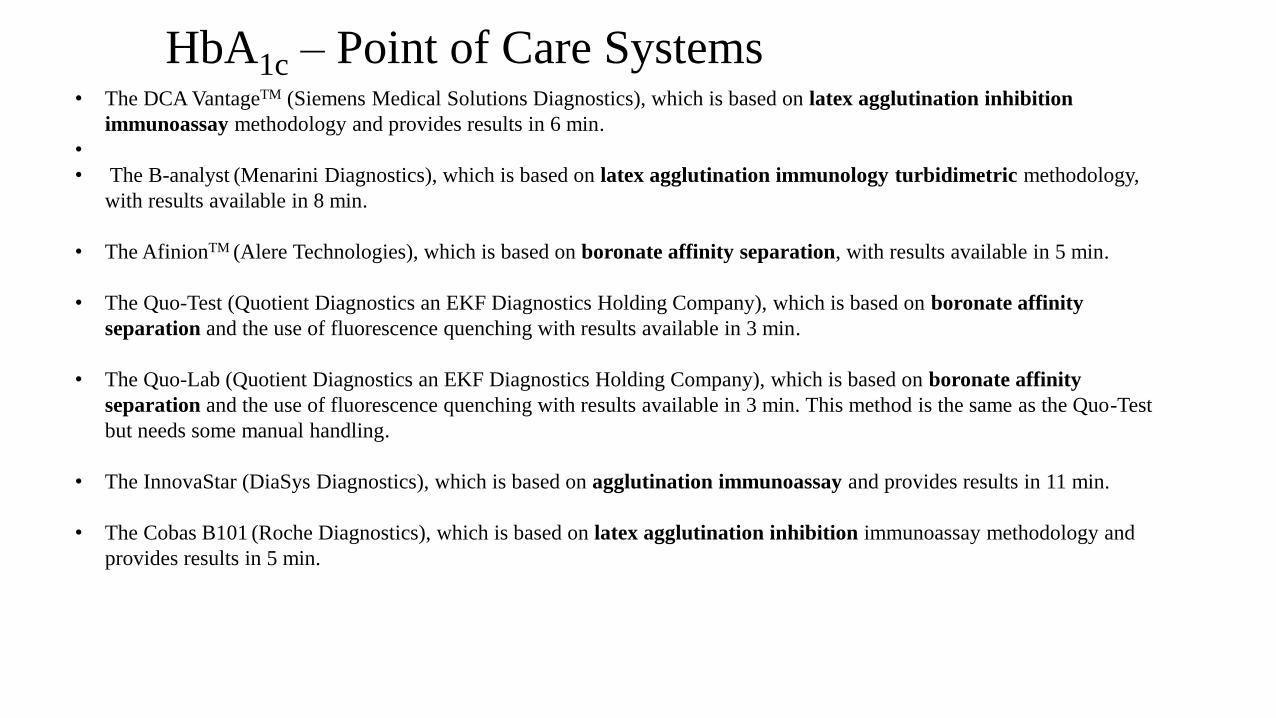
• The DCA VantageTM (Siemens Medical Solutions Diagnostics), which is based on latex agglutination inhibition
immunoassay methodology and provides results in 6 min.
•
• The B-analyst (Menarini Diagnostics), which is based on latex agglutination immunology turbidimetric methodology,
with results available in 8 min.
• The AfinionTM (Alere Technologies), which is based on boronate affinity separation, with results available in 5 min.
• The Quo-Test (Quotient Diagnostics an EKF Diagnostics Holding Company), which is based on boronate affinity
separation and the use of fluorescence quenching with results available in 3 min.
• The Quo-Lab (Quotient Diagnostics an EKF Diagnostics Holding Company), which is based on boronate affinity
separation and the use of fluorescence quenching with results available in 3 min. This method is the same as the Quo-Test
but needs some manual handling.
• The InnovaStar (DiaSys Diagnostics), which is based on agglutination immunoassay and provides results in 11 min.
• The Cobas B101 (Roche Diagnostics), which is based on latex agglutination inhibition immunoassay methodology and
provides results in 5 min.
HbA1c – Point of Care Systems

Science
Education
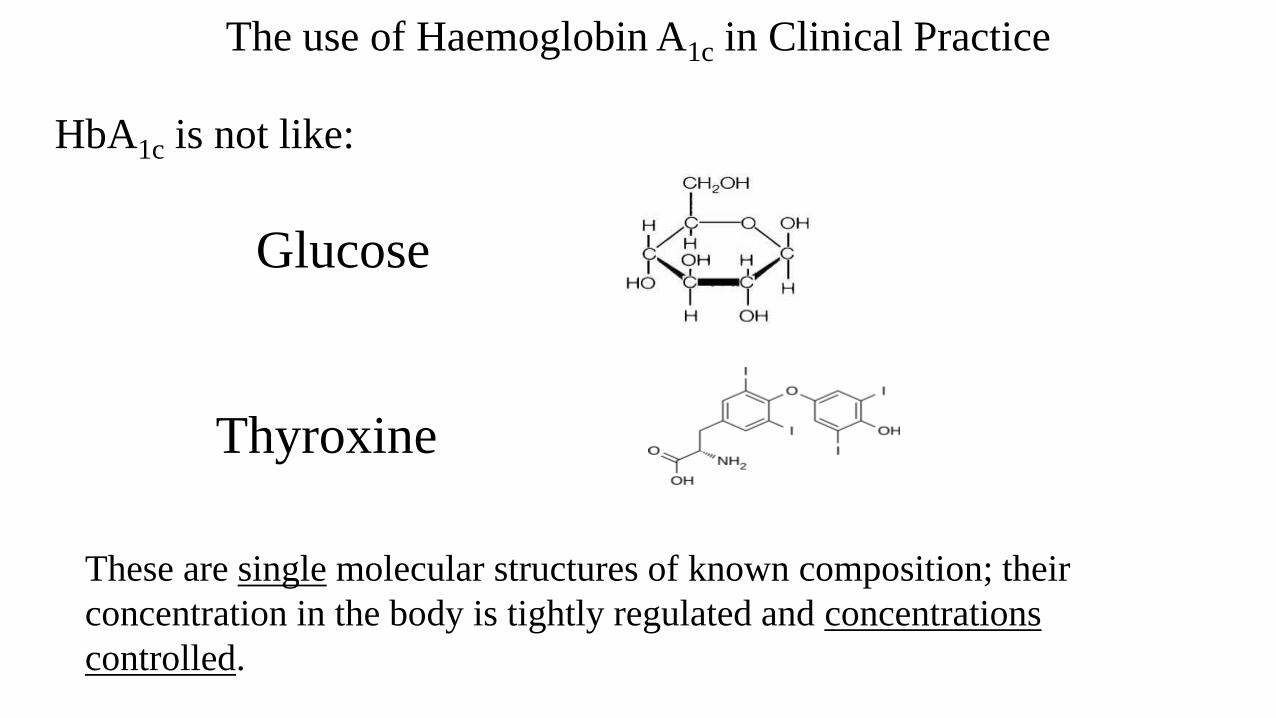
The use of Haemoglobin A1c in Clinical Practice
HbA1c is not like:
Glucose
Thyroxine
These are single molecular structures of known composition; their
concentration in the body is tightly regulated and concentrations
controlled.
The use of Haemoglobin A1c in Clinical Practice
HbA1c is:
A product of a non-enzymatic Glycation reaction; the
reaction follows the Law of Mass action. The reaction is not
controlled and the Glycated Haemoglobin formed is not a
single molecular structure.
The use of Haemoglobin A1c in Clinical Practice
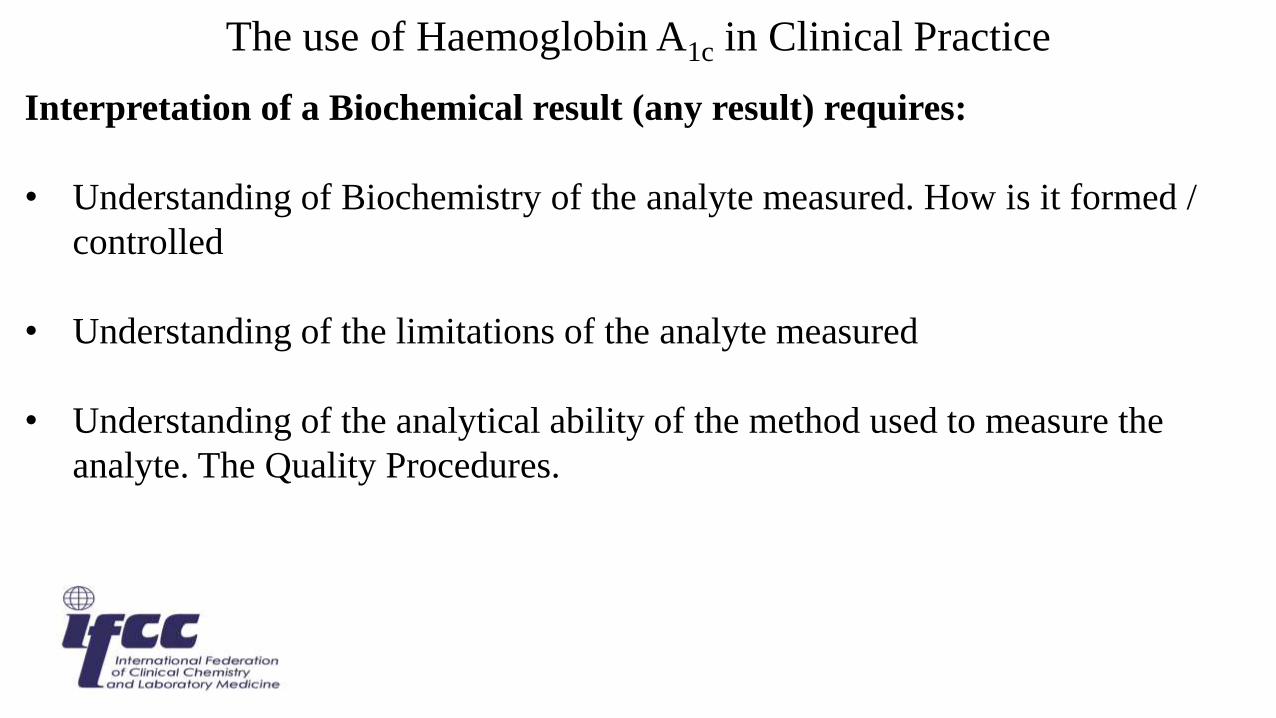
Interpretation of a Biochemical result (any result) requires:
• Understanding of Biochemistry of the analyte measured. How is it formed /
controlled
• Understanding of the limitations of the analyte measured
• Understanding of the analytical ability of the method used to measure the
analyte. The Quality Procedures.

The use of Haemoglobin A1c in Clinical Practice
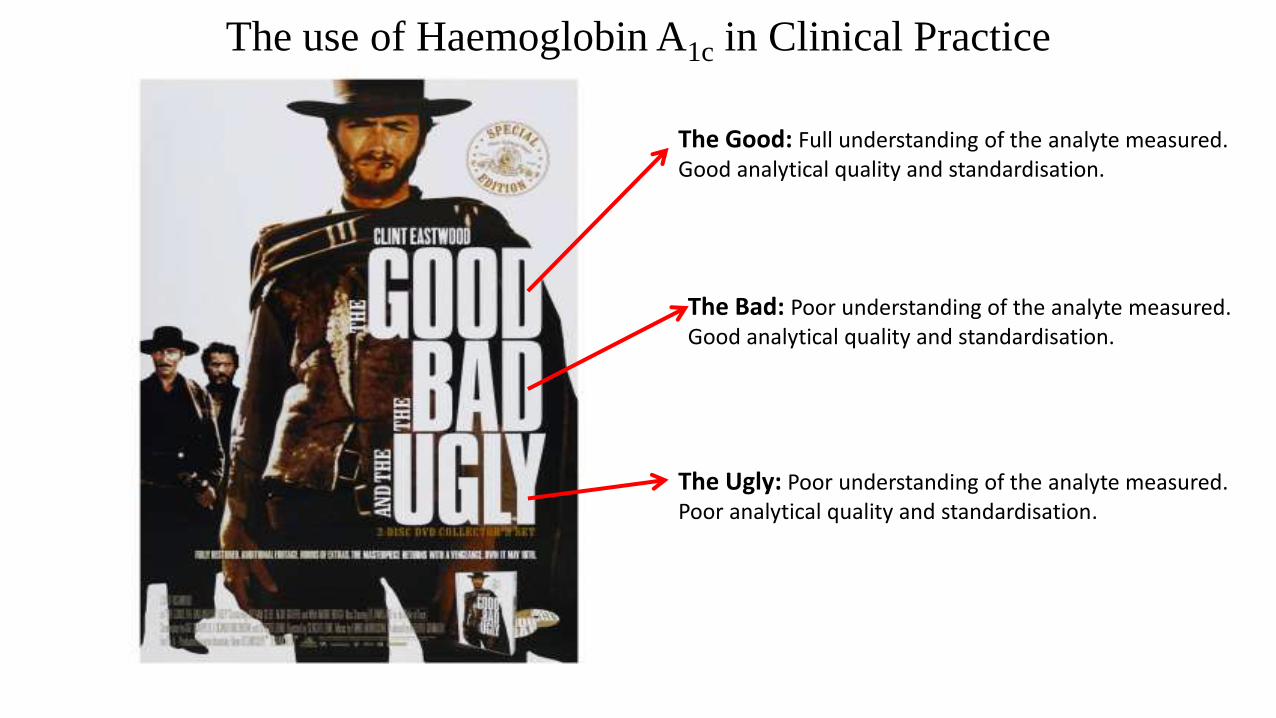
The Good: Full understanding of the analyte measured. Good analytical quality and standardisation.
The Bad: Poor understanding of the analyte measured. Good analytical quality and standardisation.
The Ugly: Poor understanding of the analyte measured. Poor analytical quality and standardisation.
The use of Haemoglobin A1c in Clinical Practice
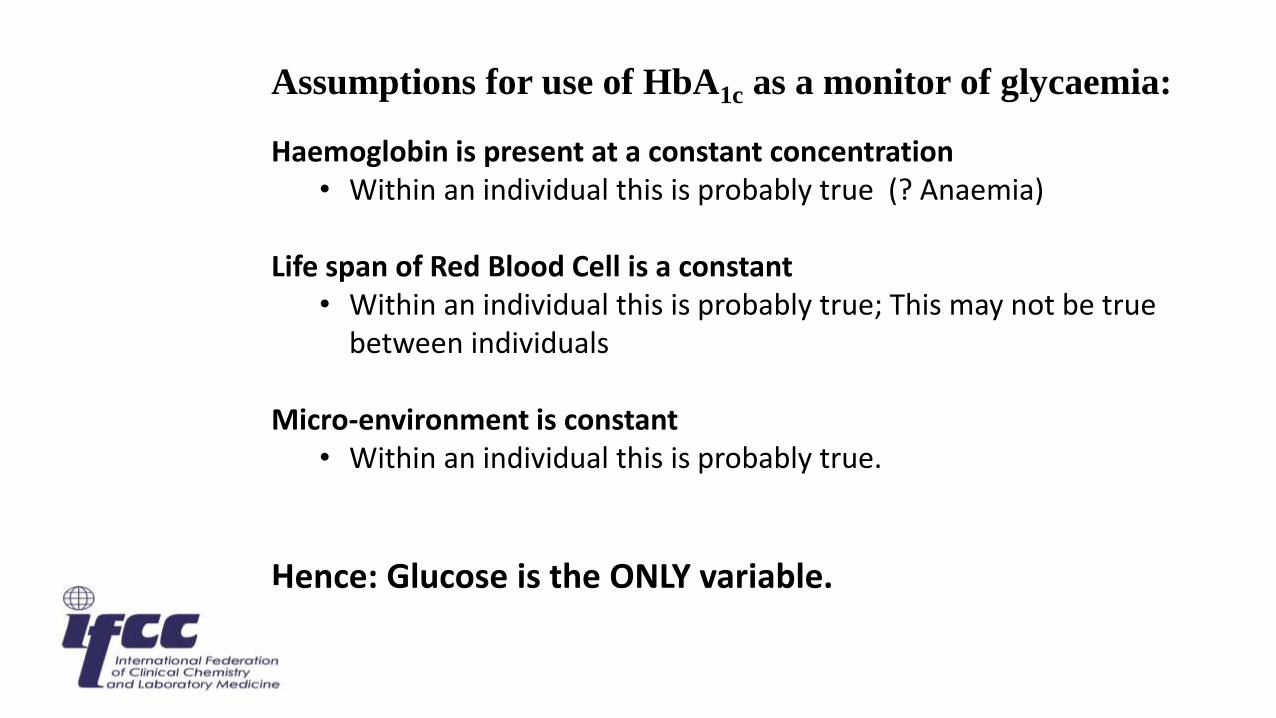
Assumptions for use of HbA1c as a monitor of glycaemia:
Haemoglobin is present at a constant concentration• Within an individual this is probably true (? Anaemia)
Life span of Red Blood Cell is a constant• Within an individual this is probably true; This may not be true
between individuals
Micro-environment is constant• Within an individual this is probably true.
Hence: Glucose is the ONLY variable.
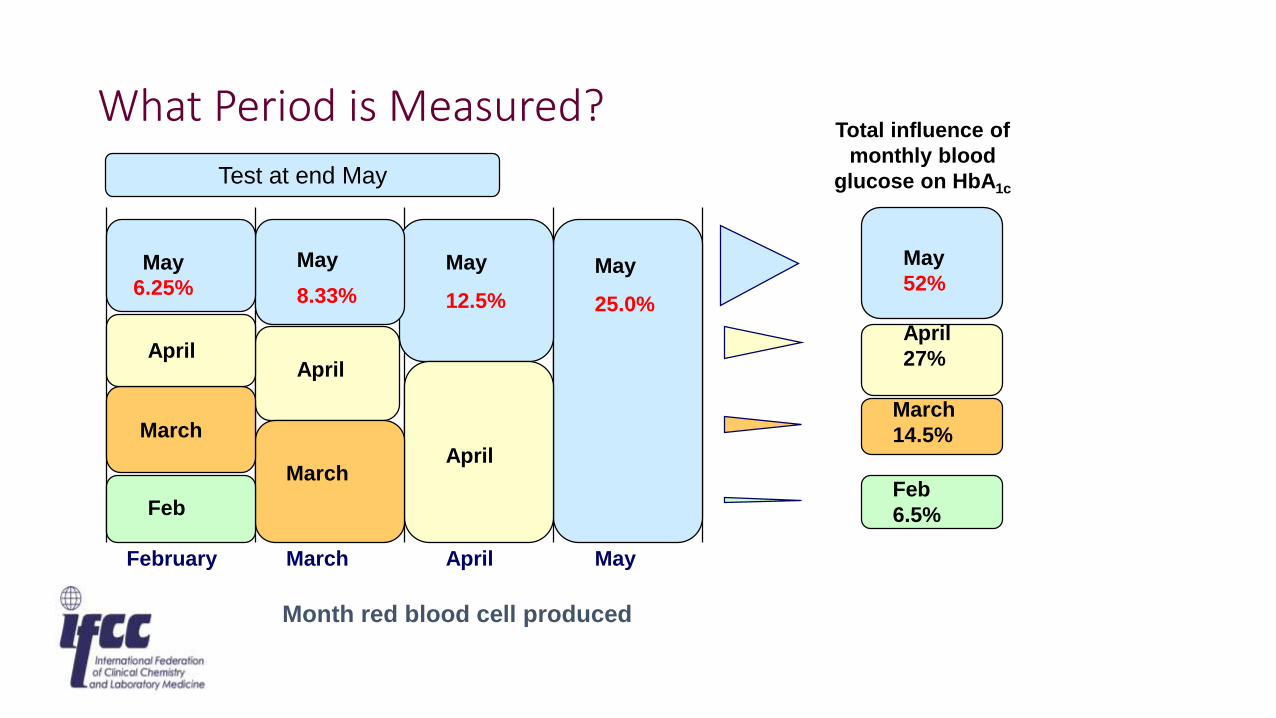
MarchFebruary MayApril
May
6.25%
April
March
Feb
March
April
April
May
8.33%
May
12.5%
May
25.0%
May
52%
April
27%
March
14.5%
Feb
6.5%
Test at end May
Month red blood cell produced
Total influence of
monthly blood
glucose on HbA1c
What Period is Measured?
What affect does anaemia have on HbA1c?
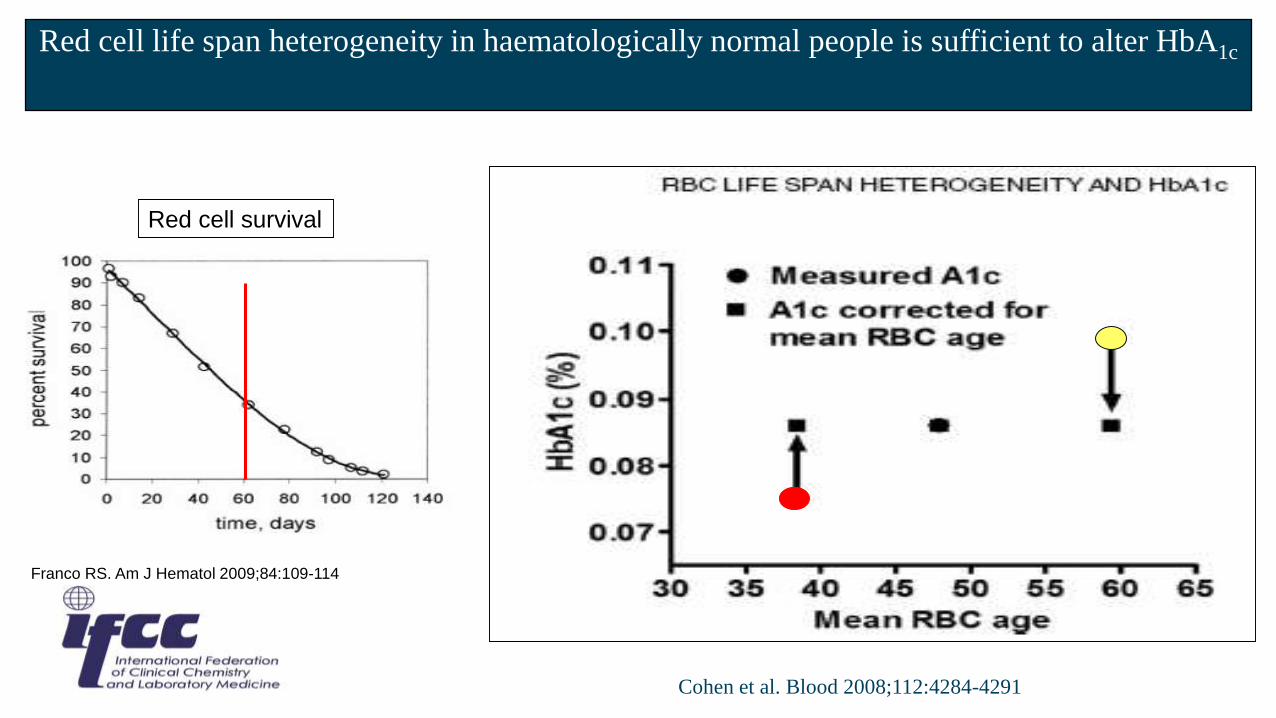
Franco RS. Am J Hematol 2009;84:109-114
Red cell survival
Red cell life span heterogeneity in haematologically normal people is sufficient to alter HbA1c
Cohen et al. Blood 2008;112:4284-4291
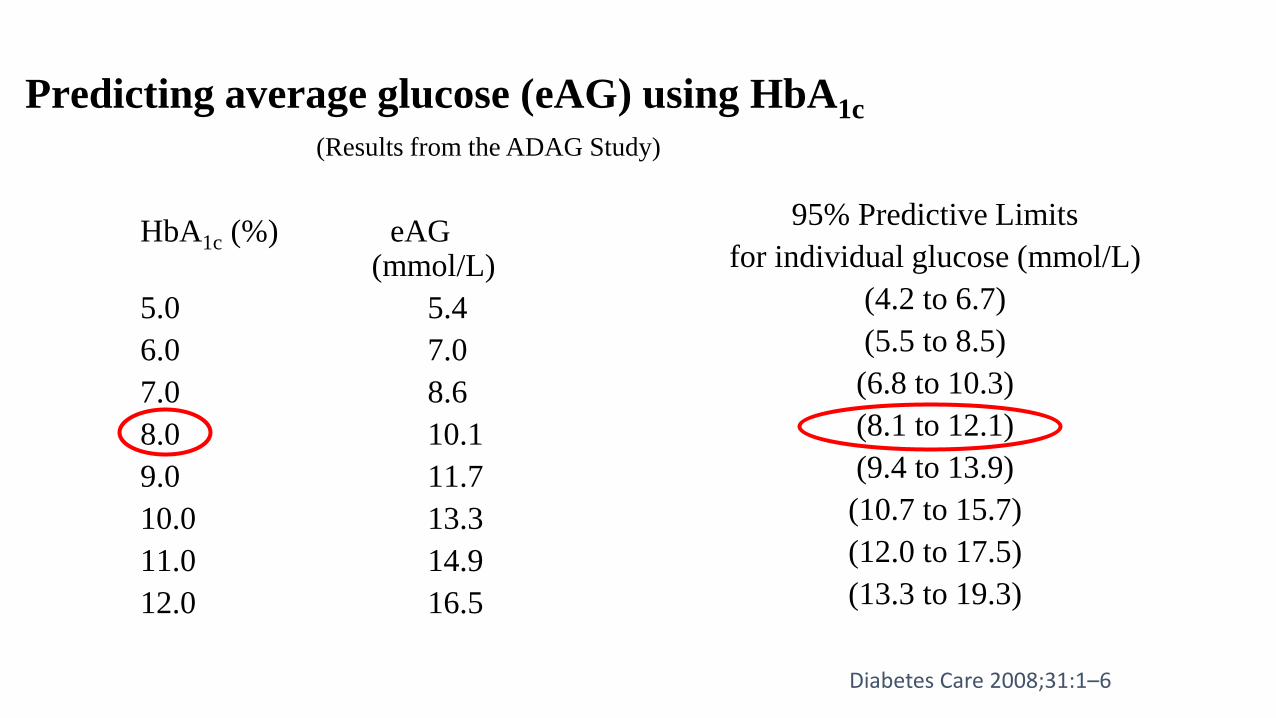
Predicting average glucose (eAG) using HbA1c
HbA1c (%) eAG(mmol/L)
5.0 5.4
6.0 7.0
7.0 8.6
8.0 10.1
9.0 11.7
10.0 13.3
11.0 14.9
12.0 16.5
95% Predictive Limits
for individual glucose (mmol/L)
(4.2 to 6.7)
(5.5 to 8.5)
(6.8 to 10.3)
(8.1 to 12.1)
(9.4 to 13.9)
(10.7 to 15.7)
(12.0 to 17.5)
(13.3 to 19.3)
(Results from the ADAG Study)
Diabetes Care 2008;31:1–6
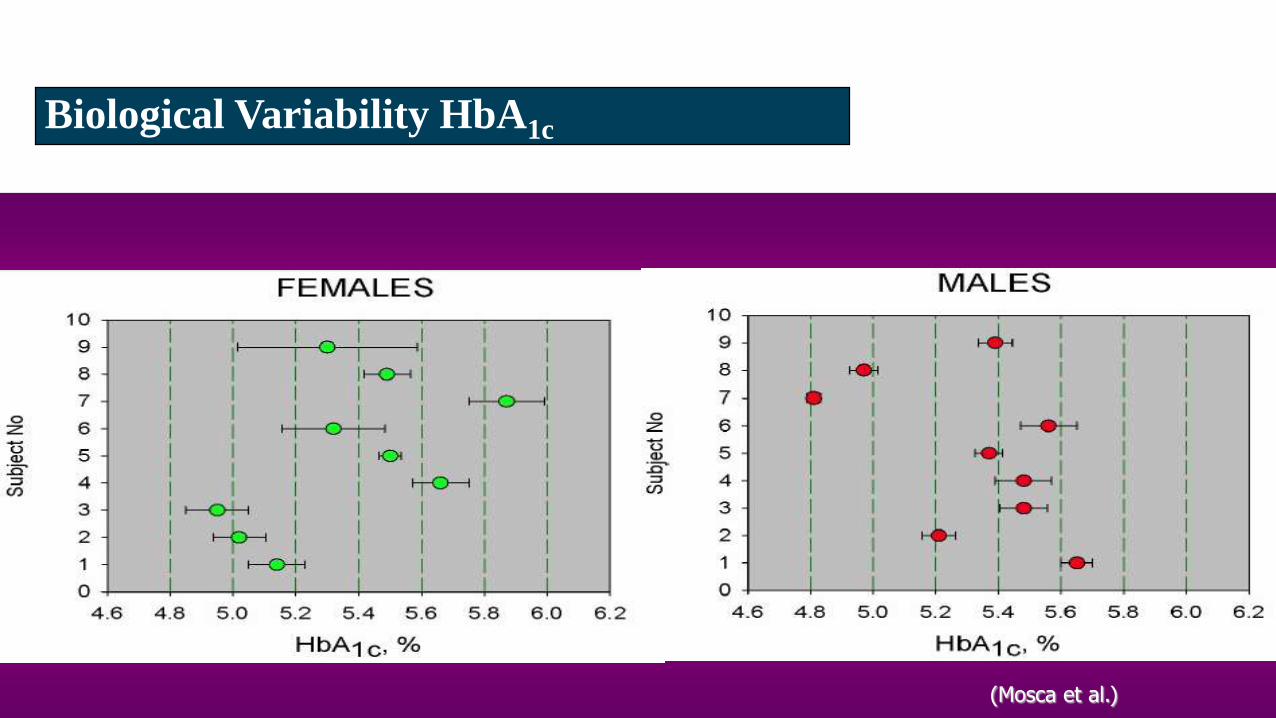
(Mosca et al.)
Biological Variability HbA1c
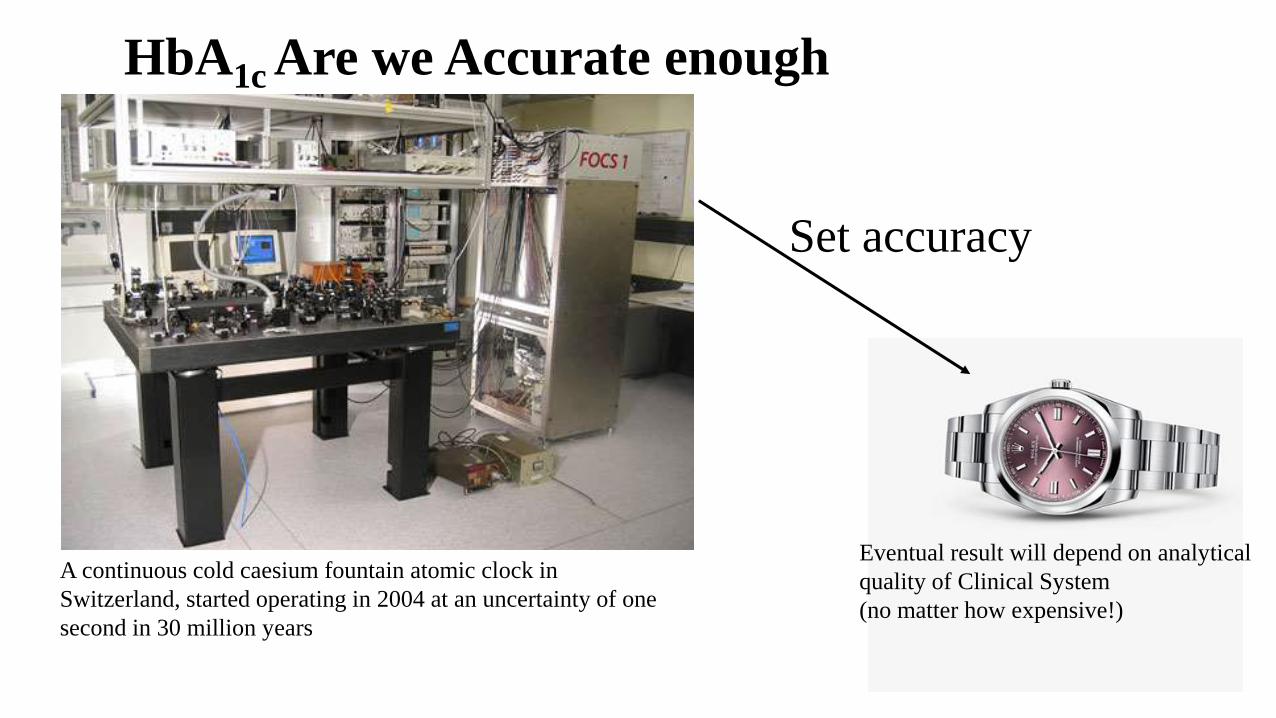
A continuous cold caesium fountain atomic clock in
Switzerland, started operating in 2004 at an uncertainty of one
second in 30 million years
Set accuracy
Eventual result will depend on analytical
quality of Clinical System
(no matter how expensive!)
HbA1c Are we Accurate enough
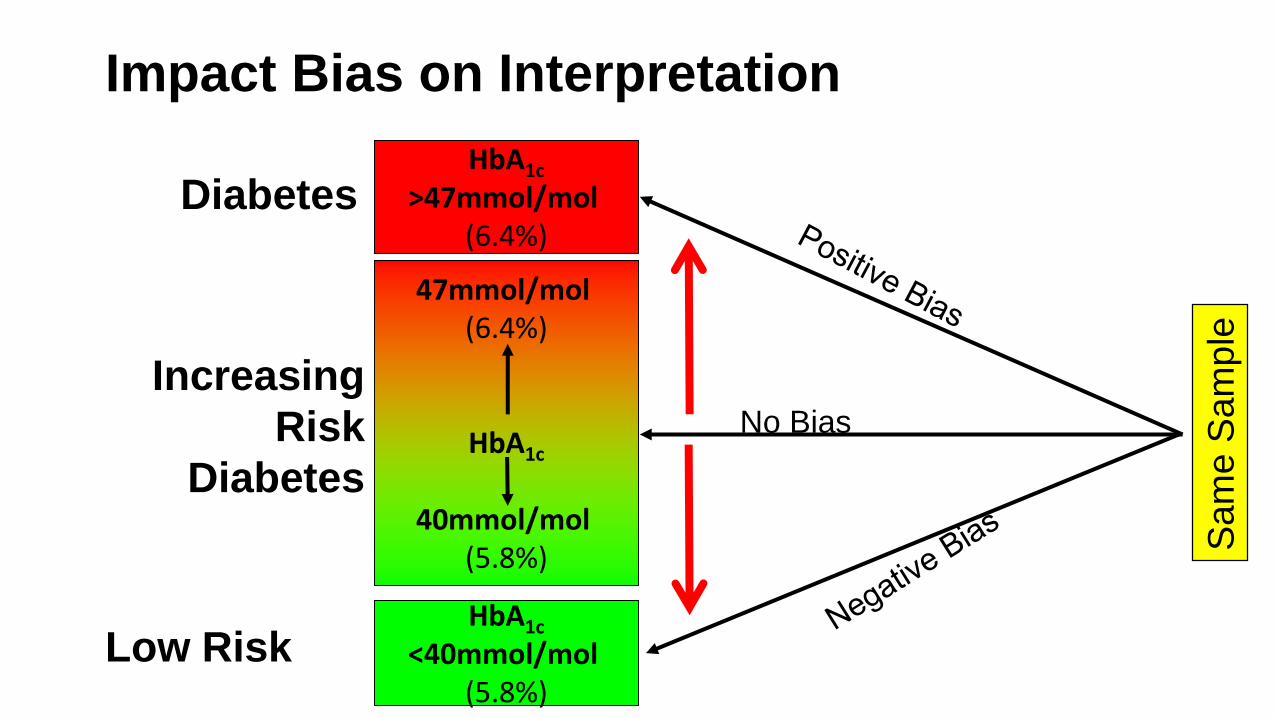
HbA1c
>47mmol/mol (6.4%)
HbA1c
<40mmol/mol (5.8%)
47mmol/mol (6.4%)
HbA1c
40mmol/mol (5.8%)
Diabetes
Increasing
Risk
Diabetes
Low Risk
Impact Bias on Interpretation
No Bias
Sam
e S
am
ple
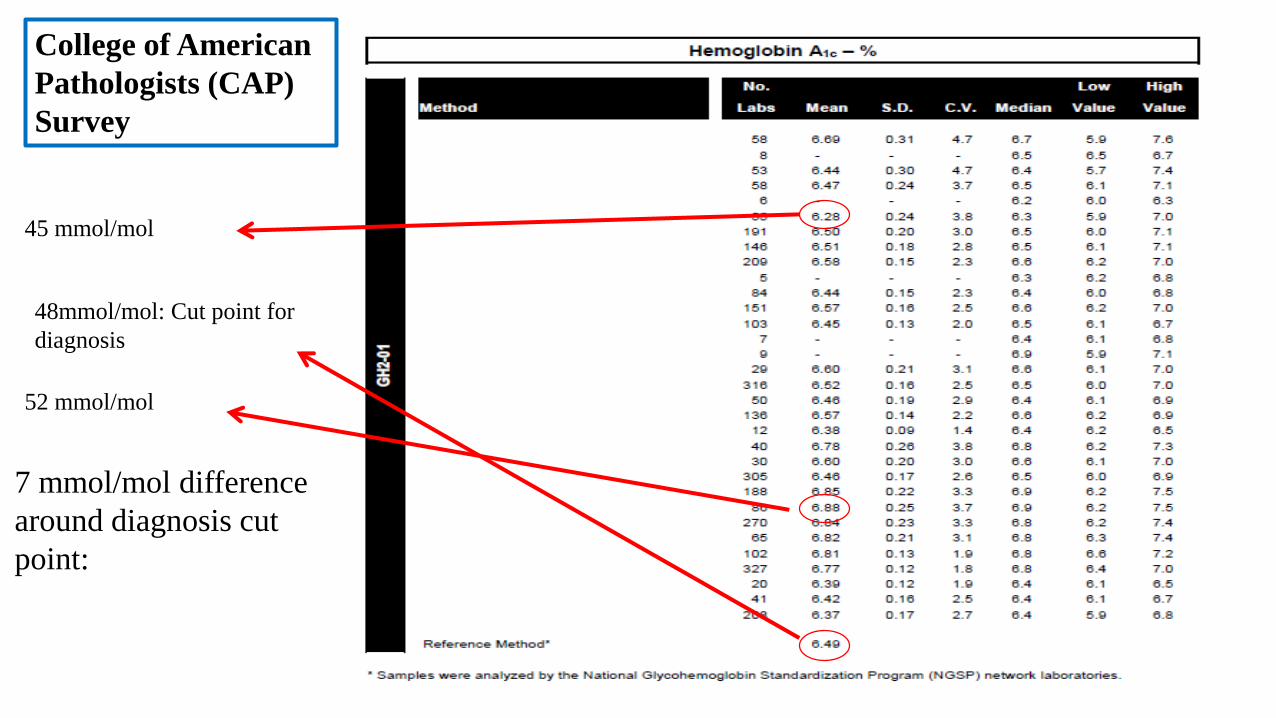
45 mmol/mol
52 mmol/mol
7 mmol/mol difference
around diagnosis cut
point:
48mmol/mol: Cut point for
diagnosis
College of American
Pathologists (CAP)
Survey
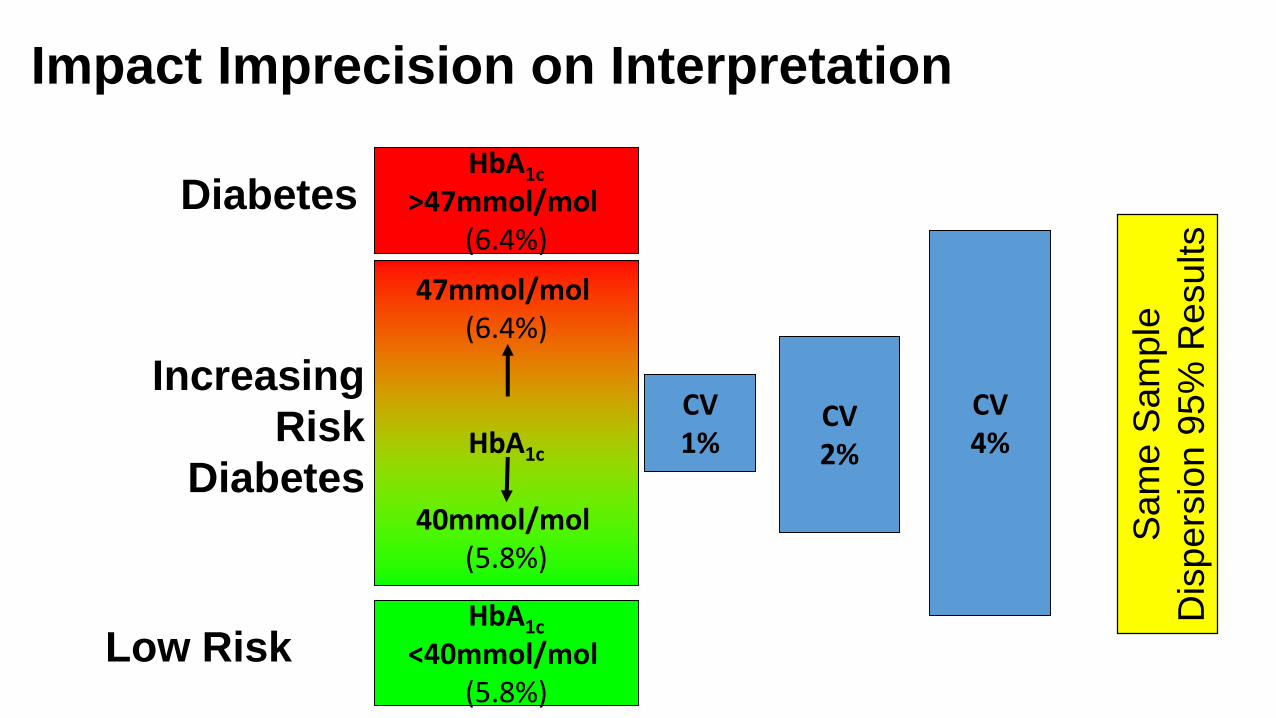
HbA1c
>47mmol/mol (6.4%)
HbA1c
<40mmol/mol (5.8%)
47mmol/mol (6.4%)
HbA1c
40mmol/mol (5.8%)
Diabetes
Increasing
Risk
Diabetes
Low Risk
Impact Imprecision on Interpretation
Sam
e S
am
ple
Dis
pers
ion
95
% R
esults
CV1%
CV2%
CV4%
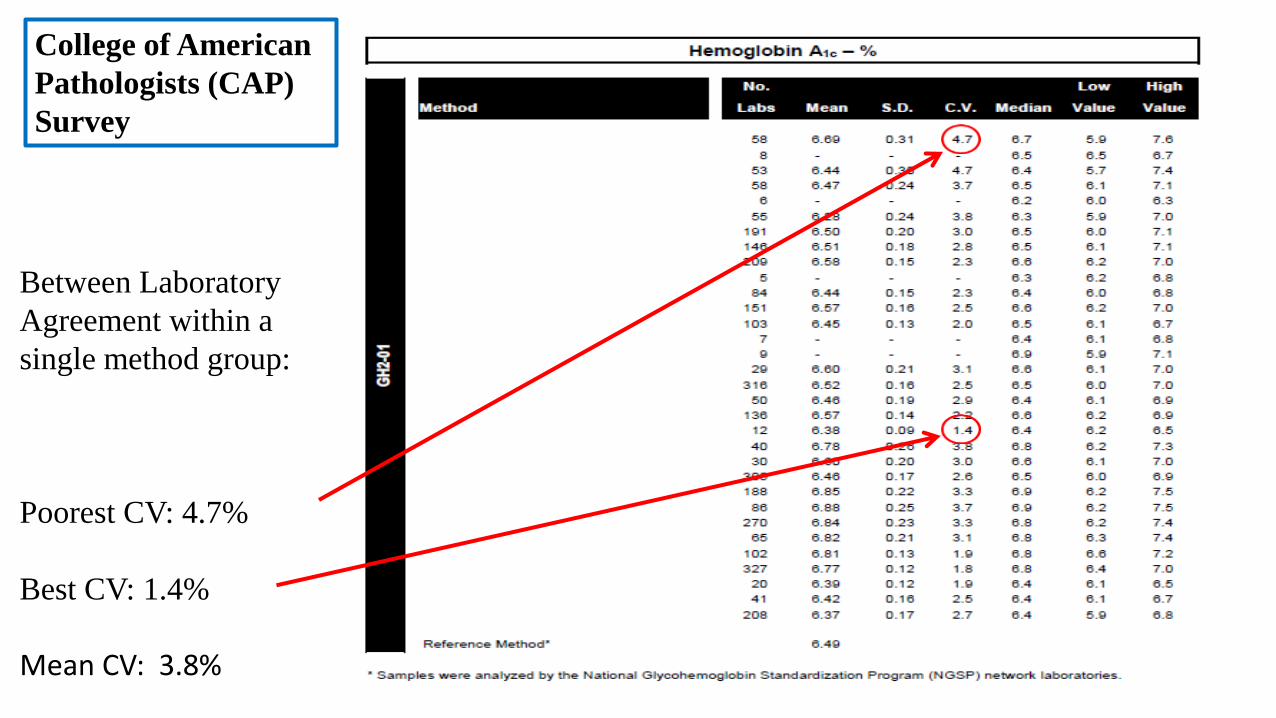
Between Laboratory
Agreement within a
single method group:
College of American
Pathologists (CAP)
Survey
Poorest CV: 4.7%
Best CV: 1.4%
Mean CV: 3.8%
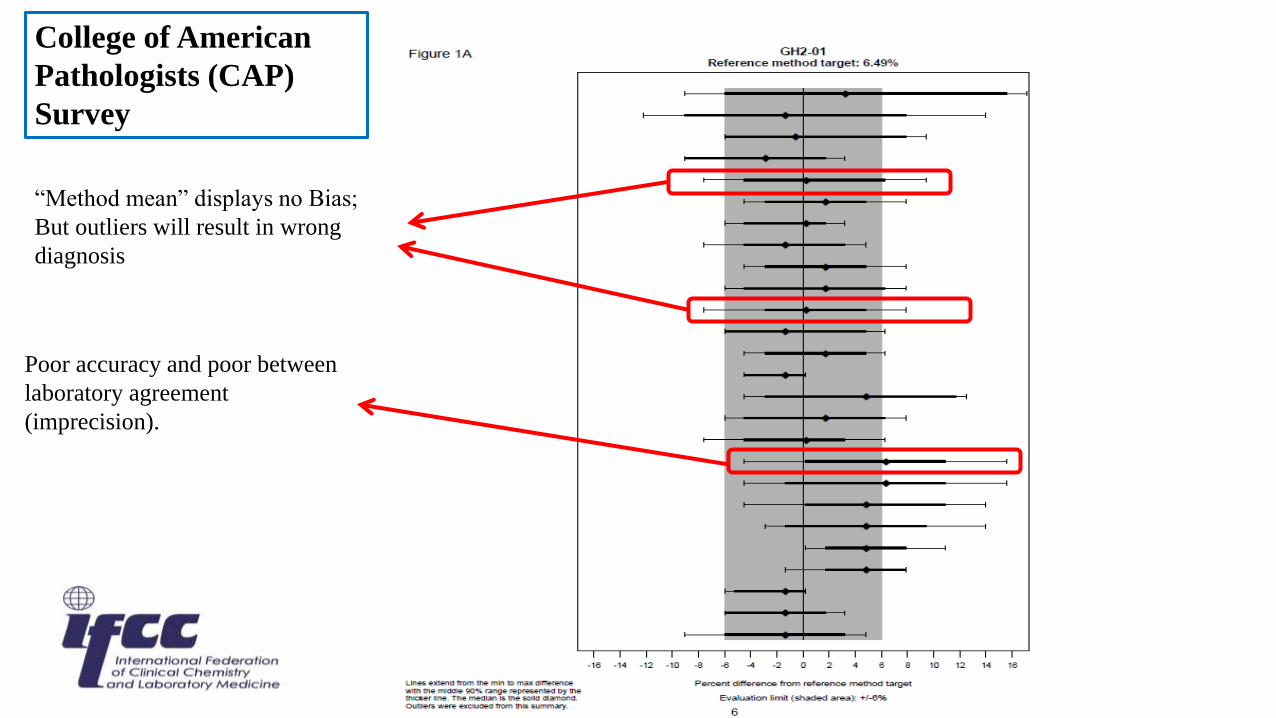
College of American
Pathologists (CAP)
Survey
“Method mean” displays no Bias;
But outliers will result in wrong
diagnosis
Poor accuracy and poor between
laboratory agreement
(imprecision).
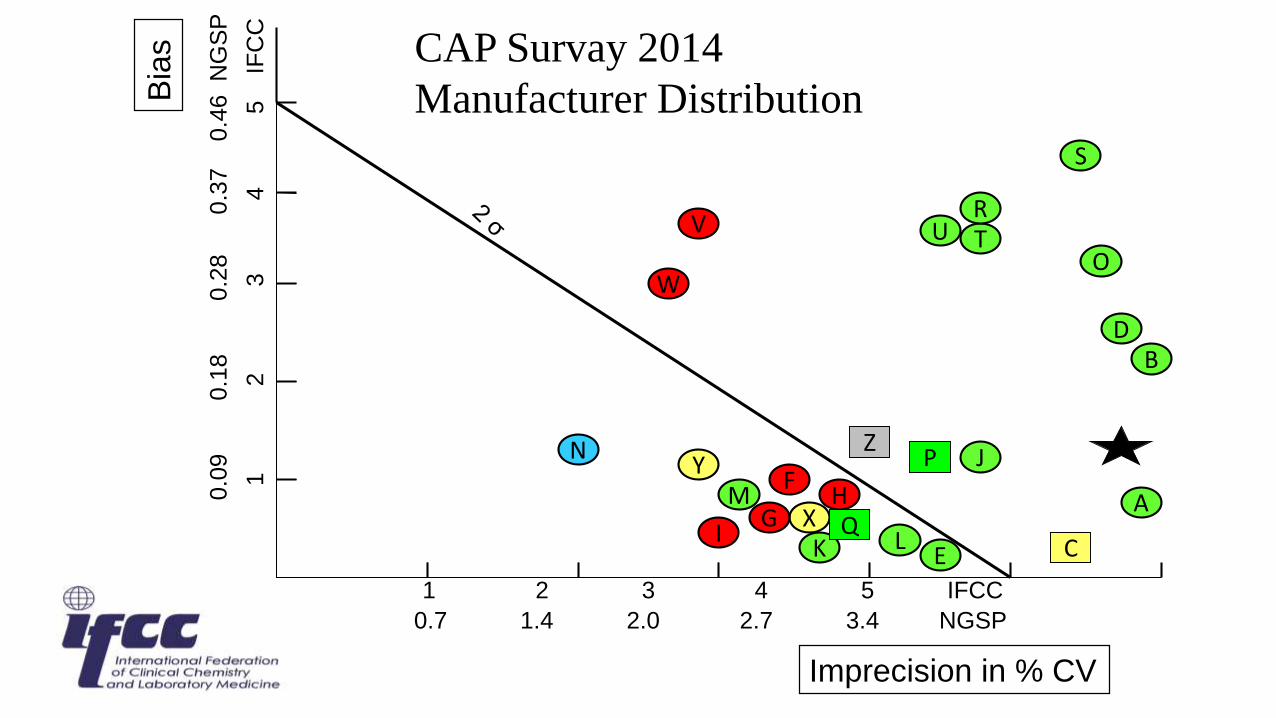
Imprecision in % CV
Bia
s
1 2 3 4 5 IFCC
1
2
3
4
5
IF
CC
0.0
9
0.1
8
0.2
8 0.3
7
0.4
6 N
GS
P
0.7 1.4 2.0 2.7 3.4 NGSP
T
XH
GK
I
FM
W
YN
V
EL
J
B
A
R
S
D
UO
Z
C
P
Q
CAP Survay 2014
Manufacturer Distribution
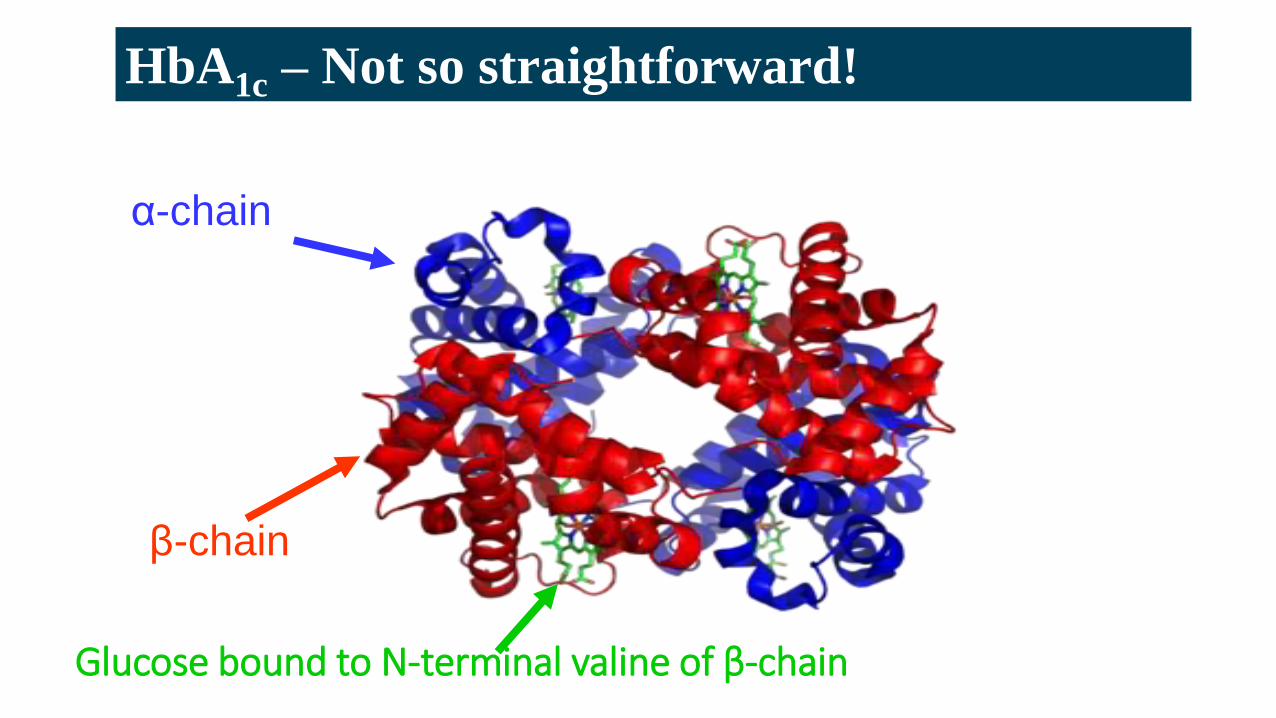
HbA1c – Not so straightforward!
β-chain
α-chain
Glucose bound to N-terminal valine of β-chain
Top Related