


Languages
Pages
Legal


Graphics
Graphics will help you achieve: conciseness – large amounts of information in a
small space
clarity – clarify complex information Trends in line graphs Comparisons between like components in bar
graphs Percentages in pie charts Facts and figures in tables
cosmetic appeal – breaks up words on a page

Criteria for Effective Graphics
Are integrated with the text. Graphic explains text or vice versa
Are appropriately located. Immediately following the text referring to the
graphic
Add to the material explained in the text. Without being redundant
Communicate important information that could not be obtained easily in text.

Criteria for Effective Graphics
Do not contain details that detract from rather than enhance the information.
Are an effective size. Are neatly printed to be readable. Are correctly labeled. Sustain the style common to other
figures or tables in the text. Are well conceived and carefully executed.
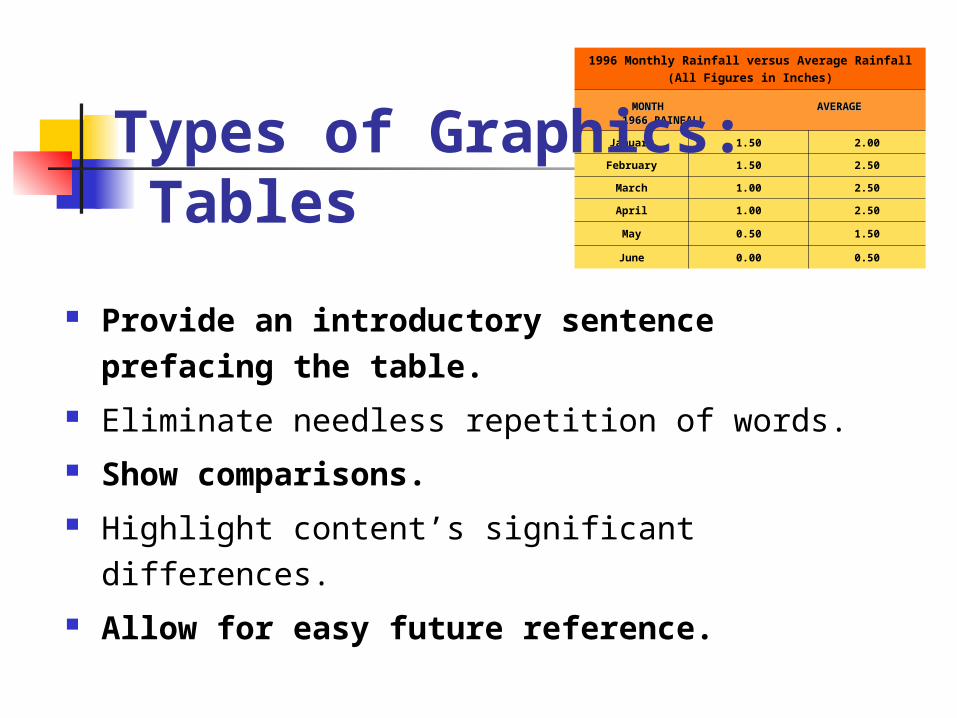
1996 Monthly Rainfall versus Average Rainfall(All Figures in Inches)
MONTHMONTH AVERAGE 1966 AVERAGE 1966 RAINFALLRAINFALL
January 1.50 2.00
February 1.50 2.50
March 1.00 2.50
April 1.00 2.50
May 0.50 1.50
June 0.00 0.50
Types of Graphics: Tables
Provide an introductory sentence prefacing the table.
Eliminate needless repetition of words. Show comparisons. Highlight content’s significant differences. Allow for easy future reference.

Types of Graphics: Tables
1996 Monthly Rainfall versus Average Rainfall
(All Figures in Inches) MONTHMONTH 1996 RAINFALL AVERAGE 1996 RAINFALL AVERAGE RAINFALLRAINFALL
January 1.50 2.00
February 1.50 2.50
March 1.00 2.50
April 1.00 2.50
May 0.50 1.50
June 0.00 0.50
July 0.25 0.50
August 0.00 0.25
September 0.50 0.50
October 0.50 0.50
November 1.50 1.50
December 2.00 1.50

Criteria for Effective Tables
Number tables in order of presentation. Table 1, Table 2, Table 3, etc.
Title every table. Placed above the table. In your writing, refer to table by its number, not its
title. Table 1 shows . . .
Present the table as soon as possible after you’ve mentioned it in your text.
Place table on same page as appropriate text.

Criteria for Effective Tables
Don’t present the table until you’ve mentioned it.
Use an introductory sentence or two to lead into the table.
Explain the table’s significance.
Thus the rainfall in both March and
April exceeded the actual rainfall by 1.50 inches,
showing how dry the spring was.

Criteria for Effective Tables
Write headings for each column. Choose terms that summarize information in columns.
Abbreviate terms to accommodate column size.
Be sure audience understands terminology.
Center tables between right and left margins.
Separate columns with ample white space, vertical lines, or dashes.

Criteria for Effective Tables
Show omitted information by
printing 2-3 periods or hyphens in
empty columns.
Be consistent when using numbers. 3-1/4 and 3-3/4 or 3.25 and 3.75
If using decimals, write whole
numbers as 9.00 for nine.

Criteria for Effective Tables
If table takes more than one page, on the second page write (Continued) in parentheses after the table number and title.
1996 Monthly Rainfall versus Average Rainfall
(All Figures in Inches) MONTHMONTH 1996 RAINFALL AVERAGE 1996 RAINFALL AVERAGE RAINFALLRAINFALL
January 1.50 2.00
February 1.50 2.50
March 1.00 2.50
April 1.00 2.50
TABLE 1: MONTHLY RAINFALL (Continued)

Using Figures
Bar charts Pie charts Line charts Flowcharts
Organizational charts
Photographs Icons Line drawings
Figures highlight and supplement important points.
Figures include:

Criteria for Effective Figures
Number figures in order of presentation. Title each figure. Preface each figure with introductory
statement. Don’t use figure until you’ve mentioned it in
text. Present figure as soon as possible
after mentioning it. Explain figure’s significance.

Criteria for Effective Figures
Label the figure’s components. When necessary, provide a legend or key at
the bottom to explain information. If you abbreviate any labels, define these
in a footnote. Place an * after the term and at the bottom of the
figure explain the terminology.
Note the source of the information at the bottom of the figure.
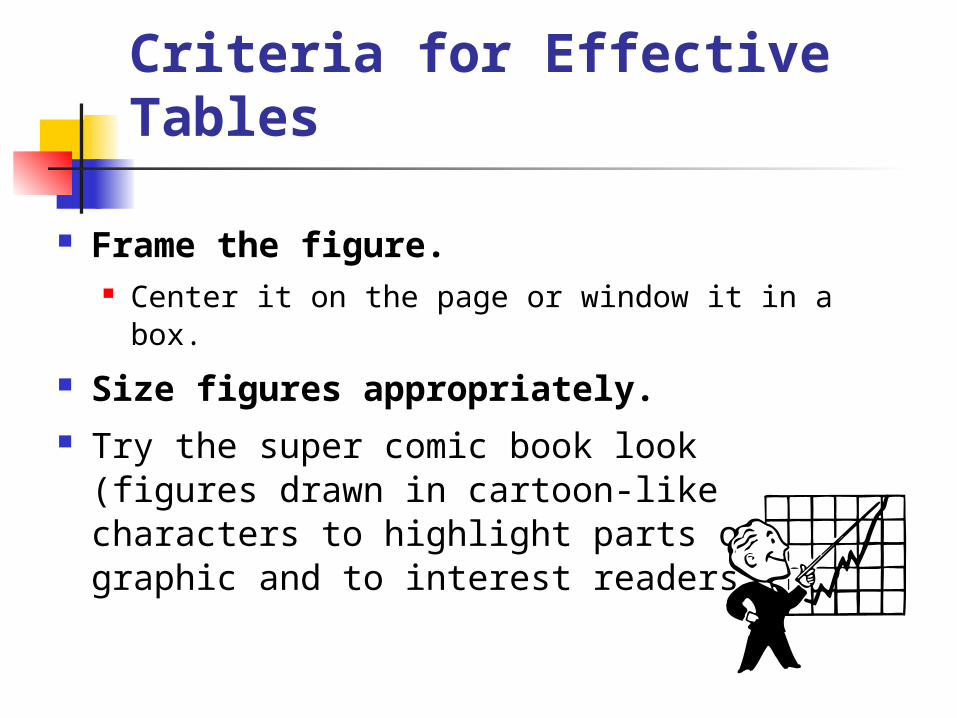
Criteria for Effective Tables
Frame the figure. Center it on the page or window it in a box.
Size figures appropriately. Try the super comic book look (figures
drawn in cartoon-like characters to highlight parts of the graphic and to interest readers.

Bar Charts
Bars are scaled to reveal quantities and comparative values.
May use vertical bars or horizontal bars.
QUARTERLY EARNINGS
020406080
100
1st
Qtr
2nd Q
tr
3rd
Qtr
4th
Qtr
EastWestNorth

Pie Charts
Illustrate portions of a whole.
Circle = 100% Begin spacing wedges at
the 12 o’clock position. Use shading/color for
emphasis. Use horizontal writing to
label wedges OR provide a key.
Provide percentages within wedges when possible.
ANNUAL EARNINGS
13%
17%
13%
57%
1st Qtr2nd Qtr3rd Qtr4th Qtr

Line Charts
Reveal relationships between sets of figures.
Line charts of more than one line are useful in showing comparisons between two sets of values.
ANNUAL EARNINGS
020406080
100120140160180
1st
Qtr
2nd Q
tr
3rd
Qtr
4th
Qtr
NorthWestEast
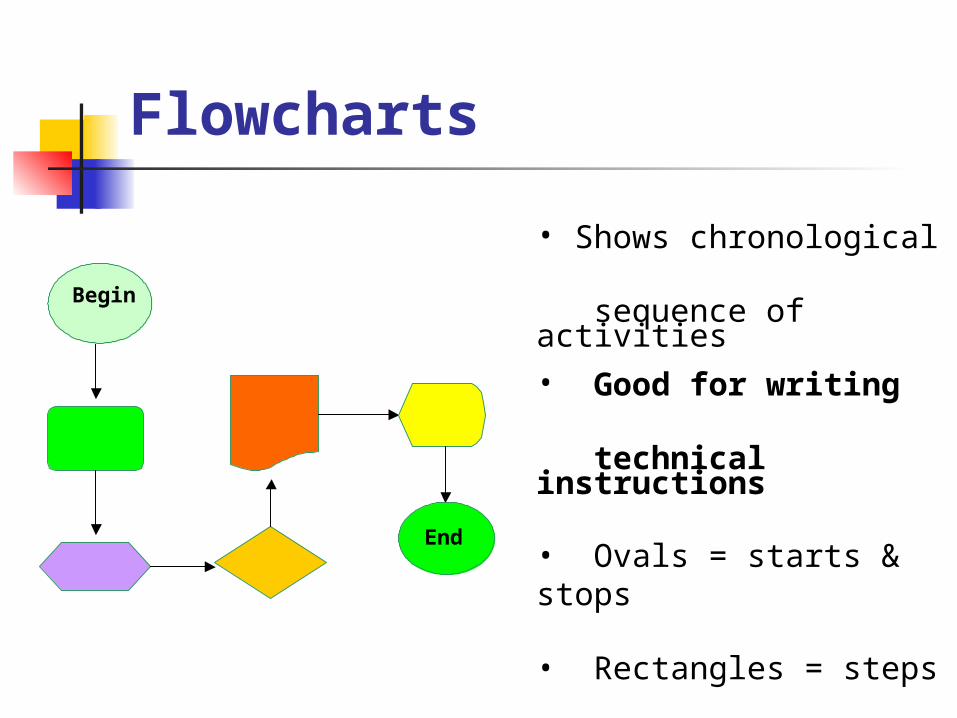
Flowcharts
• Shows chronological
sequence of activities• Good for writing
technical instructions
• Ovals = starts & stops
• Rectangles = steps
• Diamonds = decisions
Begin
End

Icons
Visual representations of a capability, a danger, a direction, etc. Keep it simple. Create a realistic image. Make it recognizable. Avoid cultural and
gender stereotyping. Strive for universality.

Line Drawings
Use line drawings to show important parts of a mechanism or to enhance your text cosmetically.
• Maintain correct proportions in relation to each part of the object.
• If drawings illustrate steps in a process, place them in left-to-right or top-to-bottom order.
• Label the components of the object.• Use letters or numbers to refer to numerous parts and provide
a key.• Use exploded views or cutaways to highlight parts.

For further assistance:
Use any of the following programs to make tables and graphs. Microsoft Word Excel Power Point
Word also can assist with indexes, tables of content, and tables of figures Insert > Indexes and Tables
Top Related