


Languages
Pages
Legal


Global Ports Holding PLC and its Subsidiaries
Full-Year Financial Report 2017
1
12 March 2018
GLOBAL PORTS HOLDING PLC Full Year Results
Positioned for growth
Global Ports Holding (“GPH”, the “Company” or the “Group”), the world’s largest cruise port operator, today announces its audited results the year ended 31 December 2017.
Key financial and operational metrics
2017 20164 YoY Change
Passengers (m PAX)1 4.1 3.5 15.2%
General & Bulk Cargo ('000) 1,628.9 1,401.4 16.2%
Throughput ('000 TEU) 249.4 213.9 16.6%
Revenue (USD m) 116.4 114.9 1.3%
Cruise Revenue (USD m)2 50.3 53.7 (6.3%)
Commercial Revenue (USD m) 66.1 61.2 7.9%
Segmental EBITDA (USD m)3 80.5 80.9 (0.5%)
Segmental EBITDA Margin3 69.2% 70.5% (130bps)
Cruise EBITDA (USD m) 32.2 36.9 (12.7%)
Cruise Margin 64.1% 68.8% (470bps)
Commercial EBITDA (USD m) 48.3 44.0 9.7%
Commercial Margin 73.1% 71.9% 120bps
Adjusted EBITDA (USD m)3 75.3 75.9 (0.8%)
Adjusted EBITDA Margin3 64.7% 66.1% (140bps)
Operating Profit (USD m) 10.9 20.9 (47.6%)
(Loss)/Profit for the year (USD m) (14.1) 4.4 n.m.
Underlying Profit (USD m)3 28.5 34.3 (17.0%)
Cash Conversion (%)3 81.6% 88.9% (730bps)
Proposed Dividend per share (GBP p)5 41.7 n.a. -
Net Debt (USD m)3 227.5 280.4 (18.8%)
Group highlights
Improving 2H 2017 performance. Q4 revenues up 15.8%, and Q4 Segmental EBITDA up 1.5%
YoY
Group operating profit for the year was lower than prior year at USD 10.9m, almost fully
attributable to the one off costs associated with 2017 IPO as well as higher amortization
expenses in relation to Port Operating Rights
Adjusted EBITDA was flat but margin remained strong at 64.7% despite a challenging trading
environment in Turkish ports
The period resulted in a net loss of USD 14.1m, due to the decline in operating profit in addition
to a non-cash foreign currency impact from the EUR / USD exchange rate
Underlying profit was affected by the aforementioned non-cash foreign currency impact but
otherwise in line with 2016 due to the robust operational performance. Underlying profit provides
1 Passenger numbers refer to controlled operations, hence excluding equity pick-up entities Venice, Lisbon and Singapore 2 Cruise revenues include sum of all cruise ports excluding Venice, Lisbon and Singapore (equity accounted investee entities) 3 Refer to the Glossary of Alternative Performance Measures for the definition of these items 4 The consolidated results of Global Ports Holding PLC have been prepared under the merger accounting basis of preparation following the IPO which assumes Global Ports Holding PLC consolidates the results of the Global Liman Isletmeleri A.S. group since 1 January 2016 5 Total annual dividend of USD 35m as proposed by the Directors of the Company

Global Ports Holding PLC and its Subsidiaries
Full-Year Financial Report 2017
2
a useful profitability benchmark as it excludes one-off IPO expenses and amortisation of port
operating rights.
Strong passenger number growth of 15.2% supported by inorganic growth, but 6.3% cruise
revenue decline due to lower contribution from higher yielding Turkish ports. Strong growth at
non-Turkish ports where revenue and Segmental EBITDA increased by 9.9% and 6.3%,
respectively
Robust commercial performance with cargo volumes up over 16% and Segmental EBITDA up
9.7%. Segmental EBITDA growth lower than volume growth due to deferral of project cargo from
2017 to 2018 at Port of Adria
Following USD 17.5m interim dividend (21.6p per share) paid in September 2017, the Directors
proposed additional dividend of USD 17.5m (20.1p per share at current exchange rate). This
would bring total dividend in respect of the year to a USD 35.0m or 41.7p per share.
2018 expected to show mid to high single digit organic growth in Revenue and Adjusted EBITDA
Cruise highlights
Strong passenger growth of 15.2% which includes a full year contribution from and growth in our
Italian ports
Non-Turkish cruise ports grew strongly, revenue up 9.9% and Segmental EBITDA up 6.3% with
improving second half trends
Turkish cruise ports’ revenue was 49.2% lower, impacted by geopolitical events, but remains
highly profitable at 59.7% Segmental EBITDA margin
Q4 2017 showed positive revenue growth of 6.6%
State of the art Lisbon terminal opened; Ege Port renovation completed
Commercial highlights
Robust performance with container volumes up 16.6%, general bulk cargo volumes up 16.2%
Total commercial revenues up 7.9%, Segmental EBITDA up 9.7% to USD 48.3 million with
Commercial Segmental EBITDA Margin 120bps ahead of 2016 level
Growth driven by strong marble and cement exports at Port Akdeniz, and rollout of our
modernization programme at Port of Adria
Accelerated growth; Q4 commercial revenue and Segmental EBITDA up 23.6% and 21.7%,
respectively
Outlook and current trading
Current trading in our Cruise segment in our non-Turkish based ports remains strong. The
weakness in Turkish cruise ports is expected to continue into 2018, although passengers and
revenue are expected to stabilize compared to the decline experienced in 2017

Global Ports Holding PLC and its Subsidiaries
Full-Year Financial Report 2017
3
o A number of cruise lines have begun to communicate their plans to visit our Turkish
ports in 2018, which we see as a good sign of a possible recovery.
The Group remains confident about its M&A activity in and outside Europe in Cruise ports
Following strong trading in Q4 2017, we expect resilient demand for exports from our
commercial ports to continue into 2018, supporting continued growth in commercial revenues
2018 expected to show mid to high single digit organic growth in Revenue and Adjusted
EBITDA
Mehmet Kutman, Chairman and Co-Founder said;
“In May 2017 we listed on the London Stock Exchange. Despite the geopolitical challenges in Turkey
since then, we have been able to deliver stable revenues and underlying profits, achieve strong
operating cash flow and attractive dividends. Operating profit was down year on year mainly reflecting
the costs of the IPO. Delivering shareholder value remains a key priority for the group as we look to
the year ahead.”
Emre Sayın, Chief Executive Officer said;
“Our 2017 financial performance reflects the importance of our diversified business, with robust
contributions from our commercial operations and strong performance in our cruise ports outside
Turkey, where the geopolitical situation continues to be challenging. We are making progress with our
strategy set out at the IPO to expand our global footprint of cruise ports, also reducing the
significance of Turkey on our overall business. M&A discussions both in and outside Europe are
progressing well and we have strengthened our global team as we pursue the next phase of growth.
We feel good about 2018 as it starts growing again.”
Please join us for a live webcast of the presentation at 9am GMT via the following link:
http://cache.merchantcantos.com/webcast/webcaster/4000/7464/16532/100738/Lobby/default.htm
Alternatively, you can join by dialing +44 (0) 20 3003 2666, # 9923467
An audio recording of results will be made together with a playback facility to be provided after the
presentation has finished on GPH IR website at http://www.globalportsholding.com/main-page
Enquiries:
GPH, Investor Relations +90 212 244 60 00 [email protected] Asli Su Ata Ismail Ozer
Brunswick Group LLP +44 (0) 20 7404 5959 Nina Coad Will Rowberry Imran Jina
Global Ports Holding PLC and its Subsidiaries
Full-Year Financial Report 2017
4
Notes to Editors
Global Ports Holding PLC (GPH) is the world's largest cruise port operator with an established
presence in the Mediterranean, Atlantic and Asia-Pacific regions.
Global Ports Holding was established in 2004 as an international port operator with a diversified
portfolio of cruise and commercial ports. As an independent cruise port operator, the group holds a
unique position in the cruise port landscape, positioning itself as the world’s leading cruise port brand,
with an integrated platform of cruise ports serving cruise liners, ferries, yachts and mega-yachts. As
the world’s sole cruise ports consolidator, GPH portfolio consists of investments in 15 ports in 7
countries and continues to grow steadily. GPH provides services for 7.0 million passengers reaching
a market share of 23% in the Mediterranean annually. The group also offers commercial port
operations which specialize in container, bulk and general cargo handling.
A portfolio of award-winning ports and terminals allows GPH to transfer best practices to its
subsidiaries. With a strong focus on operational excellence, enhanced security practices and
customer-oriented services, GPH aims to contribute to the development of the cruise industry. It is
listed on the London Stock Exchange.

Global Ports Holding PLC and its Subsidiaries
Full-Year Financial Report 2017
5
Chairman and founder’s statement
Our differentiated model
GPH has shown this year the benefits of its diversified business model. It has delivered a strong
performance in its cruise business outside Turkey and a robust performance in commercial. Taken as
a whole, I am satisfied with our progress in this reporting year.
The IPO was a key milestone in 2017 with investors acknowledging the exceptional growth potential
in the cruise sector, as well as the strength of our container and bulk cargo business.
We are not immune to external events, and during 2017 the business faced a number of unexpected
challenges outside of its control, including cancellations due to security concerns in the Eastern
Mediterranean region. However, drawing upon our experience, market knowledge and collective and
local expertise, we are well positioned and sufficiently resilient and diversified for navigating these
challenging markets.
Market growth
What is clear to all our stakeholders is that the cruise industry, and the industries that serve it, have
vast growth opportunities. The sector may have been around for a long time, but recent penetration in
the market has only peaked at around 3.6% in the core market of the USA, 2.5% in the EU and much
less than 2% for most of the rest of the world1.
This is now changing fast as new ideas, fresh fleets and a younger passenger demographic alter the
face of the industry. Already running above 100% occupancy, the cruise lines are investing to add
c.47% capacity by 2026 and they are growing the market: brands such as Virgin and Disney are
enticing aboard a new generation and character of passenger who, previously, might never have
considered cruising. Every facet of the cruise experience is also being reimagined. Picture the full
drama of a Cirque du Soleil performance aboard a cruise ship – it’s already happening, along with a
new generation of technologies to make every experience unforgettable.
Against this backdrop, we foresee around five percent annual growth over the next ten years,
evidenced by the cruise lines’ orders for new ships: the major yards around the world already have
contracts to build over 97 new cruise liners, and only a lack of capacity prevents them accepting
more. These ships are larger, providing fabulous accommodation, hospitality and entertainment for up
to 6,500 passengers.
1 GDP Per Capita: World Bank databank, BREA The Global Economic Contribution of Cruise Tourism 2016 for CLIA

Global Ports Holding PLC and its Subsidiaries
Full-Year Financial Report 2017
6
In turn, economies of scale will drive lower costs, widening the market still further. We are also
seeing new target audiences emerging, such as increasingly wealthy citizens from new markets such
as China who can fly in and enjoy six Mediterranean countries in seven days.
Expanding into new territories
As the largest port operator in the world, Global Ports Holding is perfectly placed to serve this growth.
We have the resources and the know-how to extend existing infrastructure, develop new locations,
and find innovative ways to embark, disembark and look after thousands more passengers. As
importantly, we bring an unrivalled 360o view of the sector – the cruise lines, the ships, the
passengers, the crews and the destination stakeholders – that enables us to perform our role as port
operators in a way that meets everyone’s needs.
Our growth will also come with new territories. In particular, we believe our vision and skills are highly
transferrable to the Americas, including the Caribbean, where passenger numbers (one of our key
sources of revenue) are considerably higher.
In the Mediterranean, only our Barcelona port sees the levels of passengers that routinely pass
through the core ports of the Caribbean, and this region is our principal focus for business
development going forward.
Closer to home, we are looking to continue our expansion through inorganic growth in the
Mediterranean, and as I write we are in negotiations with a number of potential new ports.
Typically, port infrastructure is owned by government agencies in one form or another, and
negotiations are complex and unpredictable but we are hopeful of making further progress in 2018 in
this regard.
As well as the port acquisitions, we continue to drive ancillary revenues, as we look to the
opportunities ahead.
We have a skilled and experienced team, and in addition to network growth they will continue to
optimise our ports, maximise ancillary revenues from retail and other sources, and assist in restoring
business as usual to the world’s most beautiful and inspiring regions. I thank them all, and all our
stakeholders as we embark on our new chapter of growth.
Mehmet Kutman
Chairman and Co-Founder
Global Ports Holding PLC and its Subsidiaries
Full-Year Financial Report 2017
7
Group Chief Executive’s Review
Resilient Results
I am pleased with progress in 2017, a year when we achieved tangible advances in integrating our
assets, sharing know-how, working to unified codes and systemising the way we do business. In
parallel, we were active in raising our ambitions, not only identifying new growth opportunities in our
current heartland of the Mediterranean, but also beyond. We also strengthened our management
team with new capabilities.
It was also a year when our key metrics broadly confirmed the outcome we had targeted: increased
passenger numbers, an expanded port network, good growth in our container and freight business, a
sound HSE performance, and a clutch of awards that recognise our standing as the world’s leading
independent port operator.
Indeed, in the areas that were within our control, we showed how our all-round expertise is working to
the benefit of our stakeholders and, by extension, ourselves.
Unfortunately we were impacted by the unexpected geopolitical challenge in Turkey. An attempted
coup, attacks and the migrant crisis inevitably affected sentiment and confidence. Cruise lines felt
obliged to redirect their programmes elsewhere, resulting in a significant impact on traffic through our
most profitable ports in Turkey in 2017. Despite the issues we experienced, based on conversations
with our cruise line customers, we are confident that they will restore normal routes in the Eastern
Mediterranean, as soon as circumstances allow.
That issue aside, we take many positives from this reporting year. We closed the period with a strong
set of Q4 results, showing that our business is sufficiently diversified and robust to withstand even
considerable impacts from market conditions. Diversity not only comes from having commercial
business run side by side cruise business, but also from the geographical distribution of our ports in
different regions in the Mediterranean. Expanding further into the other regions such as the Americas,
Asia will further improve our resilience.
Listing on the London Stock Exchange
The year brought several financial, operational and reputational highlights. Perhaps the standout
event was our IPO on the London Stock Exchange in May 2017. The IPO has given us additional
resources to cultivate new territories and opportunities, as well as to invest in our existing
infrastructure as we look to improve the totality of the cruising experience. The year also saw
significant expansion as we on boarded investments made in 2016. We hold the majority interest in
the ports of Catania, Ravenna and Cagliari, and we made good progress in integrating these
excellent locations. I believe we have a clear strength in knowing how to instil our culture in new

Global Ports Holding PLC and its Subsidiaries
Full-Year Financial Report 2017
8
assets, while giving our local teams the respect and autonomy they deserve. Although it is early days,
we can already see material improvements and results in these three Italian ports, whose combined
revenues grew by 68% against the previous year. We also keep investing and upgrading our existing
ports. A good example is the recent renovation of Ege Port where we have undergone a major
upgrade of shopping facilities. Upon the increase of passengers, we expect this project to have a
positive impact on both passenger experience and ancillary revenues.
As well as optimizing existing ports, we also brought a fresh project to fruition, from the ground up.
Lisbon’s new flagship terminal is one of the cruising sectors finest, and GPH was instrumental in
bringing together the state authorities of Portugal and the cruise lines to make this innovation happen.
We were involved at the blueprint stage, contributing our experience of operational needs, and
ensured that day-to-day operations continued seamlessly alongside the project. The new
infrastructure stands ready to welcome a projected passenger increase of over 20% in 2018.
This commitment to playing our part in the overall cruise experience was again recognised by both
industry and external media. Most notably, Valletta Cruise Port gained the title “Best Terminal
Operator 2017” and Barcelona “Best Turnaround Port Operations 2017”. This was one of nine awards
that GPH ports won during the year, including success in the consumer-facing World Travel Awards
and accolades from the industry’s respected Cruise Insight publication.
Strength from diversification
Our numbers for 2017 tell the dual story I have outlined: a year of strong performances from a diverse
but centralized port network, offsetting the impact on our business of external factors in the Eastern
Mediterranean. The net result was that Segmental EBITDA was essentially flat year-on-year. Whilst
operating profit reduced from USD 20.9 m to USD 10.9 m, this was principally due to the costs of the
IPO and higher amortization costs.
Passenger numbers, our main revenue stream from the cruise sector, grew by 15.2%, driven by good
performances in the Mediterranean and the contribution of our 3 new Italian ports. This was offset by
the decline in the Turkish cruise ports which have significantly higher yields per passengers such that
overall cruise revenue declined. I was also pleased with our commercial operation, where container
business grew by 16.6% and general bulk by 16.2%, and revenue increased by 7.9% Overall,
commercial services contributed 56.9% of our total revenues.
Market overview
Overall the backdrop for the cruise industry remains extremely positive. The current cruise ship order
book is supportive of the outlook for the global cruise industry and passenger volumes, with global
projections of 27.2 million passengers in 2018 (5.4% growth vs 2017). There are currently 97 ships
on order for the global fleet between 2018 and 2026, the highest on record.

Global Ports Holding PLC and its Subsidiaries
Full-Year Financial Report 2017
9
In addition to a record high in terms of the number of ships, cruise ships are also getting increasingly
bigger. The average number of berths per vessel in 2017 was 1,466, while the average size for the 97
new ships on order is over 3,000 berths per ship.
Based on current known orders and the greater size of new ships once completed this implies an
average passenger growth rate of c. 5% per annum over the medium term, with new supply arguably
creating its own demand. The European order book through 2026 indicates that ship fleet capacity is
to increase at a CAGR of c. 6%.
According to Cruise Industry News, the Europe market is set to grow at a 10.2%, from 6.8mn PAX in
2017 to 7.5mn PAX in 2018, and the Asia-Pacific market to grow at 9% to 5.2mn PAX, while the
America’s pace is lower, at 4.5%, to reach 14.3mn PAX by 2018.
In addition, the global macro environment remains supportive of with resilient and strong growth
through our commercial ports. Given our geographic exposure to Turkish exports, notably in marble
and cement, we would expect, all other things being equal, to benefit from the growing construction
markets in MENA, Asia and the Western Mediterranean.
2018 Outlook
Current trading in our Cruise segment in our non-Turkish based ports remains strong. The weakness
in Turkish cruise ports is expected to continue into 2018, although passengers and revenue are
expected to stabilize compared to the decline experienced in 2017. A number of cruise lines have
begun to communicate their plans to visit our Turkish ports in 2018, which we see as a good sign of a
possible recovery.
The Group also remains confident about its M&A activity in and outside Europe in cruise ports.
Following strong trading in Q4 2017, we expect resilient demand for exports from our commercial
ports to continue into 2018, supporting continued growth in commercial revenues.
Full year 2018 is expected to show mid to high single digit organic growth in Revenue and Adjusted
EBITDA.
We look ahead with confidence and ambition. There are more than 750 cruise ports around the globe,
and it would be a natural progression to take our compelling offering of expertise and resources to
fresh markets.
Global Ports Holding PLC and its Subsidiaries
Full-Year Financial Report 2017
10
We will continue to achieve the triple-win of performing for, and benefiting from, our cruise lines, host
governments/owners, and passengers. Western markets continue to look buoyant and we expect to
see an increased number of passengers passing through our infrastructure during 2018.
Our ambitious plans, as we continue to coalesce as a Group and target international growth, are
being well served by a strengthened team. Dr. Ece Gürsoy joined us as Chief Legal Officer, bringing
with her a wealth of experience in project finance, infrastructure and private equity. Collin Murphy is
our new Regional Coordinator, having previously managed development, port negotiations and
relationships for Norwegian Cruise Line Holdings for more than 20 years. Mark Robinson joined GPH
as Chief Commercial Officer, the former President of Intercruises Shoreside&Port Services - who
brings with him an excellent experience in spanning operations, infrastructure and management, and
will help to deliver the development of ancillary services as part of our core strategy. Burak Gülay
took up the role of Ancillary Services Director, having gained a proven track record of increasing
ancillary passenger revenues at Pegasus, Turkey’s largest low-cost airline.
GPH has also been honored with hosting the industry’s prestigious Seatrade Cruise Med event at our
Lisbon port in 2018, and at our Malaga port in 2020. Both are excellent opportunities to showcase our
strengths to cruise lines, government tourist offices and port authorities. We have a great business
and look forward to its continued progress.
EMRE SAYIN
CEO
Financial Overview
Overall revenues during the year increased slightly by 1.3% from USD 114.9m in FY 2016 to USD
116.4m in 2017, and Operating profit declined to USD 10.9m in 2017 from 20.9m in 2016, mainly due
to the IPO expenses in 2017 (approximately USD 11.6m). The movement in revenue reflected
inorganic growth contribution from the Italian ports offset by a move in passengers away from the
higher-yielding Turkish ports.
Thanks to the well diversified portfolio, the ongoing weakness in Turkish Cruise ports has been offset
by the strong performance of the Commercial business and non-Turkish cruise ports in the network,
maintaining Segmental EBITDA margin at a high level of 69.2%.
The period resulted in a net loss of USD 14.1 mainly due to IPO expenses and increased
amortization expenses in relation to Port Operating Rights (similar to the Operating profit), as well as
a non-cash foreign currency effect from EUR / USD exchange rate. Underlying Profit in 2017 was
impacted by this non-cash foreign currency effect from EUR / USD exchange rate, but otherwise was

Global Ports Holding PLC and its Subsidiaries
Full-Year Financial Report 2017
11
in line with 2016 due to the robust operational performance (IPO expenses and amortization of Port
Operating Rights excluded from Underlying Profit).
During the year, the Commercial segment performed well with Commercial Revenue and Segmental
EBITDA growing by 7.9% and 9.7% YoY, respectively. Also, we have seen a strong performance in
our non-Turkish cruise ports, with 9.9% revenue and 6.3% EBITDA growth in 2017 YoY.
Our cruise segment demonstrated a strong passenger growth of 15.2%
Far above Mediterranean averages
3.5% organic growth across the cruise port portfolio (taking into account pro-forma effect for
Italian port acquisitions which are consolidated for the first time in 2017) more than offset the
decline in the Turkish ports of 58.2%
GPH’s non-Turkish ports registered solid 25.9% passenger growth in 2017 (organic growth:
10.8%)
Despite the overall positive volume trend in passengers, revenues and Segmental EBITDA from
cruise operations have declined by 6.3% and 12.7% respectively, due to a lower share of higher-
yielding Turkish ports.
Passenger mix changed slightly in favor of transit passengers, resulting in a slightly lower cruise
segment’s profitability. Transit passengers recorded a 20.3% increase in 2017, while the expansion of
more profitable turnaround passengers was relatively lower at 8.0%, resulting in 2pp decrease in the
share of turnaround passengers.
Meanwhile, the Cruise Segment was positively impacted by Euro/USD parity in 2017. All cruise ports’
revenues are mainly Euro denominated while our reporting currency is USD therefore, the
appreciation of the Euro in 2017 had a slight positive impact on overall financials.
Commercial revenues were USD 66.1m in FY 2017, up 7.9% year-on-year, due to strong growth in
container volumes (up 16.6% YoY), along with a 16.2% increase in general and bulk cargo compared
to FY 2016. Growth in container volumes was driven by marble exports at Port Akdeniz. Growth in
general and bulk cargo was driven by cement exports in Port Akdeniz, as well as steel coils in Port of
Adria.
Container yields declined by 5.7% driven by the change in TEU mix between full and empty
containers. General & bulk cargo yields were down 8.5% due to lower project cargo volume. Also,
change in product mix (increase in steel coils volume in particular in Port of Adria) had an impact on
yields.
Global Ports Holding PLC and its Subsidiaries
Full-Year Financial Report 2017
12
Commercial Segmental EBITDA increased by 9.7% to USD 48.3m, and the Commercial EBITDA
margin grew by 120 bps in FY 2017 YoY, mainly driven by operational improvement at Port Akdeniz,
increase in high-margin TEU business and the currency environment in Turkey which is favorable for
GPH with its USD revenue streams but mainly TL cost base.
Capital Expenditure
Capital Expenditure for 2017 was USD 13.9m, primarily to fund the modernization programme at Port
of Adria (investment in equipment and machinery) which essentially competed in 2017, and
renovation works for Ege Port’s shopping mall which completed in H1 2017.
Debt Profile
Net debt at 31 December 2017 decreased to USD 227.5m from USD 280.4m at 2016YE mainly due
to cash generated from operations of USD 46.0m, as well as net IPO proceeds of USD 73m and the
collection of related party receivable of USD 27.7m. Main cash outflows are CAPEX of USD 13.9m
and dividends of USD 46.1m (including interim dividend in September 2017 of USD 18m) and
financing-related cash outflow of USD 34.7m (mainly financing expenses and net repayment of gross
debt). The Group’s Net Debt to Adjusted EBITDA ratio of 3.0x is in line with GPH’s financial policy as
communicated during the IPO process. The Leverage Ratio as per the Eurobond issued by Global
Liman Isletmeleri A.S. (100% subsidiary of GPH) is 4.5x versus a covenant of 5.0x.
Liquidity and IPO
Global Ports Holding Listed on the London Stock Exchange in May 2017
Offer Price: 740 pence per GPH share
Offer size: USD 207m (including USD 7m over-allotment option)
The Group raised net primary proceeds of USD 73m which will be used to develop and expand
the Group’s Cruise business
Free float of 34.37% while GIH and EBRD hold 60.60% and 5.03% respectively
Dividends
Following USD 17.5m interim dividend (21.6p per share) paid in September 2017, the Directors
proposed additional dividend of USD 17.5m (20.1p per share at current exchange rate). This would
bring total dividend in respect of the year to a USD 35.0m or 41.7p per share.

Global Ports Holding PLC and its Subsidiaries
Full-Year Financial Report 2017
13
Segment Review
Cruise Business
FY 2017 Detailed Financial Review – Cruise Segment
2017 2016
YoY Change
Cruise Port Operations Passengers (m)
1 4.1 3.5 15.2%
Turnaround Passengers 1.6 1.5 8.0% Transit Passengers 2.5 2.1 20.3% Revenue (USD m) 50.3 53.6 (6.3%)
of which Ancillary Revenue 13.1 14.2 (7.8%)
Yield (USD, revenue per passenger) 12.3 15.1 (18.7%)
Yield (USD, ancillary revenue per passenger) 3.2 4.0 (20.0%)
Segmental EBITDA (USD m) 32.2 36.9 (12.7%)
Segmental EBITDA Margin 64.1% 68.8% (480bps)
Creuers (Barcelona and Malaga)
Passengers (m) 2.4 2.3 5.1%
Turnaround Passengers 1.3 1.3 0.0% Transit Passengers 1.1 1.0 11.9% Revenue (USD m) 27.4 27.1 1.0% of which Ancillary Revenue 2.6 2.5 2.8% Yield (USD, revenue per passenger) 11.4 11.9 (4.0%) Yield (USD, ancillary revenue per passenger) 1.1 1.1 (2.2%) Segmental EBITDA (USD m) 17.6 18.0 (2.6%) Segmental EBITDA Margin 64.1% 66.5% (240bps)
Ege Port
Passengers (m) 0.2 0.4 (53.4%)
Turnaround Passengers 0.0 0.0 8.9% Transit Passengers 0.2 0.4 (56.3%) Revenue (USD m) 4.8 11.7 (58.6%) of which Ancillary Revenue 2.4 3.9 (39.1%) Yield (USD, revenue per passenger) 25.5 28.7 (11.2%) Yield (USD, ancillary revenue per passenger) 12.5 9.6 30.7% Segmental EBITDA (USD m) 3.0 9.0 (67.1%) Segmental EBITDA Margin 61.3% 77.0% n.m
Valletta Cruise Port
Passengers (m) 0.8 0.7 14.1%
Turnaround Passengers 0.2 0.1 89.2% Transit Passengers 0.6 0.6 (1.0%) Revenue (USD m) 12.9 11.8 9.1% of which Ancillary Revenue 6.9 7.1 (3.0%) Yield (USD, revenue per passenger) 16.6 17.3 (4.4%) Yield (USD, ancillary revenue per passenger) 8.8 10.4 (15.0%) Segmental EBITDA (USD m) 6.8 5.9 16.5% Segmental EBITDA Margin 52.8% 49.5% 340bps
Other Cruise
Passengers (m) 0.7 0.2 297.5%
Turnaround Passengers 0.1 0.0 31.8% Transit Passengers 0.7 0.1 383.0% Revenue (USD m) 5.2 3.0 70.3% of which Ancillary Revenue 1.3 0.7 73.9% Segmental EBITDA (USD m) 4.9 4.1 20.4%
1Passenger numbers refer to consolidation perimeter, hence excluding equity pick-up entities Venice, Lisbon and Singapore
In 2017, GPH’s consolidated cruise ports welcomed more than 2,801 calls and 4.1m passengers,
while it was over 7.0m passengers via 4,214 calls for all ports including equity pick-up entities Venice,
Lisbon and Singapore. It generated 43.2% of the company’s revenue and 40% of its Segmental

Global Ports Holding PLC and its Subsidiaries
Full-Year Financial Report 2017
14
EBITDA. 26% of the cruise revenues were derived from ancillary sources such as retail outlets and
advertising.
Ports Update
For the FY 2017, Creuers (Barcelona and Malaga) received 868 cruise calls (+9.0% over 2016)
bringing in 2.4m cruise passengers (+5.1% yoy), of which 1.3m were turnaround passengers (stable
yoy) and 1.1m were transit passengers(+11.9 yoy). Creuers’ revenues remained flat at USD 27m, and
Segmental EBITDA slightly decreased by 2.6% to 17.6m. The decline in yield of Creuers was mainly
due to:
changes in passenger mix in favor of transit passengers, which are less profitable compared
to turnaround passengers
turnaround passenger increase driven by Malaga, which has lower margins compared to
Barcelona
Valletta Cruise Port, with its unique position for West Med and East Med itineraries, contributed
significantly to GPH’s FY 2017 passenger and Segmental EBITDA performance. In FY 2017, Valletta
Cruise Port received 342 cruise calls (+7.9 yoy) bringing in 0.8m cruise passengers (+14.1% yoy), of
which 0.2 were turnaround passengers (+89.2% yoy). Segmental EBITDA of the Valletta Cruise Port
was up by 216.5% to USD 6.8m, implying a 340bps increase in Segmental EBITDA margin, thanks to
the increasing share of turnaround passengers in the passenger mix. In addition, a stronger EUR has
also impacted operating figures positively. Meanwhile, lower travel retail has resulted in decline in
yield.
In 2017, Ege Port had 130 cruise calls (-53.2% yoy) bringing in 118,954 cruise passengers (-65.8
yoy) and a total of 477 ferry calls bringing in 69,989 ferry passengers with a total of 188,843 (-53.4%
yoy) passengers visiting the port. Ege Port revenues and Segmental EBITDA declined by 58.6% and
67.1%, respectively, due to the decline in number of calls and passenger numbers as a result of
ongoing weakness in sentiment for Turkish cruise ports. Management remains cautious for 2018 but
we are hopeful of seeing a recovery as a number of cruise lines have begun to communicate their
plans to visit GPH’s Turkish ports in 2018.

Global Ports Holding PLC and its Subsidiaries
Full-Year Financial Report 2017
15
Commercial Business
FY 2017 Detailed Financial Review – Commercial Business
2017 2016 YoY
Change
Commercial Port Operations
General & Bulk Cargo ('000 tonnes) 1,628.9 1,401.4 16.2%
Throughput ('000 TEU) 249.4 213.9 16.6%
Revenue (USD m) 66.1 61.2 7.9%
Yield (USD, Revenue per TEU) 174.7 185.2 (5.7%) Yield (USD, Revenue per tonnes) 9.0 9.8 (8.5%)
Segmental EBITDA (USD m) 48.3 44.0 9.7%
Segmental EBITDA Margin 73.1% 71.9% 120bps
Port Akdeniz
General & Bulk Cargo ('000) 1,415.7 1,319.2 7.3%
Throughput ('000 TEU) 200.1 172.0 16.3%
Revenue (USD m) 58.5 53.4 9.7%
Yield (USD,Revenue per TEU) 194.3 205.9 (5.6%)
Yield (USD,Revenue per tonnes) 8.7 8.4 3.8%
Segmental EBITDA (USD m) 46.4 41.3 12.5%
Segmental EBITDA Margin 79.3% 77.4% 190bps
Port of Adria
General & Bulk Cargo ('000) 213.2 82.2 159.4%
Throughput ('000 TEU) 49.3 41.8 17.8%
Revenue (USD m) 7.5 7.9 (4.4%)
Yield (USD,Revenue per TEU) 95.0 99.9 (5.0%)
Yield (USD,Revenue per tonnes) 10.8 32.6 (66.9%)
Segmental EBITDA (USD m) 1.9 2.7 (32.0%)
Segmental EBITDA Margin 24.6% 34.6% (1,000bp)
GPH operates two growing commercial ports, in Turkey and Montenegro. Together, they handled
around 249.4k TEU and 1,628.9k tonnes of throughput in 2017.
In 2017, the commercial port operations generated 56.8% of the company’s revenue and 60% of its
Segmental EBITDA.
TEU throughput increased by 16.6% in FY 2017 YoY thanks to strong marble export at Port of
Akdeniz. TEU yields softened slightly by 5.7% due to changes in TEU mix between full and empty.
General & bulk cargo volume was up 16.2% driven by a solid increase of steel coils export at Port of
Adria and growth in cement exports in Port Akdeniz. Due to lower volumes of project cargo in 2017
(which has less visibility by nature) as well as change in product mix led to a decline in the yield, from
USD 9.8 to USD 9.0. Revenue growth was below volume growth in 2017, mainly due to lower project
cargo volumes. Segmental EBITDA for the Commercial business was USD 48.3m in FY 2017, up
9.7% over FY 2016, translating into c.120bps improvement in Segmental EBITDA margin. The
improvement was driven by operational improvement at Port Akdeniz, increase in high-margin TEU
business and a favorable currency environment in Turkey.
An agreement has been signed with regards to project cargo in the Port of Adria as contracted project
cargo at Port of Adria has not been realized in 2017. And some of the anticipated revenue would be

Global Ports Holding PLC and its Subsidiaries
Full-Year Financial Report 2017
16
into 2018 (we currently estimate that this could have an EBITDA impact of USD 1.3m) in this financial
year.
Principal risks and uncertainties
The Group faces a number of risks, which if they arise, could affect its ability to achieve strategic
objectives. The Board is responsible for determining the nature of these risks and ensuring
appropriate mitigating actions are in place to manage them effectively.
The level of risk is regulary monitored by the Audit and Risk Committee and reviewed and validated
by the Board on an annual basis. The Audit and Risk Committee provides risk reports to the Board on
a quarterly basis at least. The Group is exposed to four categories of risks:
1. General Risk
a. The risk of not extending the concessions: The Group operates each of its
ports under long-term concession agreements, including BOT agreements, with the
state owner of the port. For the ports where the Group does not have the contractual
right to extend these fixed-term agreements, it would need to apply for an extension
before they expire. Granting these applications would be at the discretion of the
state owner of the relevant port, and there can be no certainty that any of the
Group’s concession agreements will be extended. For mitigation, the Group has in
the past taken, and may continue to take, formal legal processes relating to the
extension of concession processes. For example, the Group is legally engaged over
the renewal of the concession terms for Port Akdeniz, Antalya, Ege Port, Kuşadası
and Bodrum Cruise Port, As another example, in Spain, Creuers is entitled to apply
for the extension of the Adossat agreement period
b. Complex regulatory environment and changes may affect the Group’s
business: The Group must satisfy a range of legal requirements, across the
countries it operates. Although the Group seeks to continue to comply with all
relevant laws, regulations and the terms of its concession agreements, licences and
permits, failure to do so could result in significant administrative or civil penalties.
Having local management teams, fully conversant with their country and language,
and have a detailed knowledge of applicable local regulations, as well as the
Group’s internal audit practices, the Group reviews if obligations are being met.
c. Reputation risk due to fraud and bribery: GPH has a zero-tolerance policy on
corruption of any sort. Anti-Bribery and Corruption Policy is an integral part of the
Company’s directives and/or policies that have been approved by the Board of
Directors. The Group has also adopted a Code of Ethics that is intended to improve
service quality, the effective use of resources, prevent unfair competition, organise
relationships among employees, and set standards for fraud prevention. Additionally,
Global Ports Holding PLC and its Subsidiaries
Full-Year Financial Report 2017
17
the Audit and Risk Committee advises the Board on, and reviews, the Company's
procedures for detecting fraud and the prevention of bribery and corruption.
d. The risk of not being fully covered by insurance: The Group has actively
studied actions that are within its control to pre-empt and mitigate these types of
operational risks, which have been formalised into the GPH Security Code and GPH
Health, Safety & Environment policy. Both were published in 2017. In addition, the
Group carries out a security audit through our internal audit department.
2. Risks relating to the Group’s cruise port operations
a. Demand for cruise port services is sensitive to macroeconomic
conditions: The Group’s cruise port operations depend on consumer demand from
cruise passengers, and economic uncertainty and the spending power of these
passengers are influenced by factors beyond the Group’s control. However,
experience has shown that even in the financial crisis in 2007/2008, cruise bookings
remained resilient. Holidays are high-priority for many people, and when spending is
tight, cruising delivers vacations within a pre-defined budget. Also, cruise lines will
go to great lengths to fill their ships, from aggressive price reductions to re-deploying
vessels to other regions.
b. Demand for cruise port services can be influenced by trends and
perceptions beyond the Group’s control such as safety: In order to diversify
risks, GPH’s expansion strategy includes acquiring marquee ports in other important
cruise areas such as the Americas including the Caribbean. As cruise lines diversify
into areas with a good safety perception, the Group’s aim is that if we lose business
in one place, we can regain it in another. This is exactly what happened following
turmoil in the Eastern Mediterranean; GPH ports in the Western Mediterranean
gained instead. For any ports that have a negative safety perception, GPH has direct
contact with cruise lines to show the security measures applied, both in the port and
the wider destination.
c. Duty-free and ancillary revenues may be affected by economic or
regulatory changes: GPH management actively tracks duty-free operations,
including those operated by third parties, and focuses on increasing passenger
satisfaction inside the terminals. Refurbishing and refreshing duty-free and other
retail areas is a priority. GPH also protects against the effects of decreasing
passenger numbers on revenues by agreeing minimum guaranteed rents with third
party retail tenants.
d. The Group’s cruise ports could face competition, primarily within the
Mediterranean: There can be no assurance that long-term changes in cruise
itineraries will not result in increased competition in the future. GPH’s acquisition
strategy has been selective, choosing ‘marquee’ ports (such as Barcelona, Venice,
Lisbon, Kuşadasi and Valletta) which are less susceptible to being replaced by

Global Ports Holding PLC and its Subsidiaries
Full-Year Financial Report 2017
18
others. These are complemented by GPH’s other ports, which enable GPH to offer
commercial incentives to cruise lines when they include several GPH ports in the
same itinerary.
3. Risks relating to the Group’s commercial port operations
a. External factors may affect demand at the Group’s commercial ports:
central risk mitigation strategy is to diversify the types of cargo we handle, and their
destinations. GPH’s commercial ports are actively working to identify new cargo
types and new customers. Furthermore, the Group’s share of imports, particularly in
Antalya, is low and the objective is to increase this share through marketing to local
customers. Another mitigating factor is that Antalya exports cargo volumes that are
abundantly available.
b. Barriers to trade may adversely affect the Group’s commercial ports: The
normal free-flow of goods can be interrupted by external factors ranging from
international trade disputes to restrictions on imports or exports, and mitigation of
these risks lies in diversification.
c. The Group’s commercial ports may face increased competition: For Port
Akdeniz in Antalya, an external risk mitigation is geography, while the hinterland
features the largest marble and mining reserves in Turkey.. The nearest ports are
Izmir and Mersin / Iskenderun, but they are too far away to compete with Antalya.
There is limited leakage to these ports because of high land transportation costs.
Port of Adria, is Montenegro’s main seaport. The Group does not know of any new
port developments, but it monitors closely for proposed plans.
d. Safety and environmental risks specific to cargo handling: Heavy industry
such as cargo handling brings attendant risks of accidents, whether to people or to
the environment. The safety of people is non-negotiable, and The Group is
committed to act with the utmost care in its environments. GPH has been active in
raising standards with the creation of a groupwide HSE manual. The Group has also
implemented a plan of environmental and social mitigation, prepared in line with
EBRD’s Environmental and Social Action Plan (ESAP).
4. Risks relating to the Group’s investments and strategy
a. The Group may not be able to achieve its growth strategy: The investment
universe of GPH, with very limited competition from mainly local players, is
extremely wide and diverse in terms of available ports in all regions.
b. The Group is exposed to risks related to integrating new ports: induction
process is well established and based on solid experience. The target is to have
clear plans on human resources, operations, financial reporting, policies and
procedures before the takeover of a port. During the process, the finance, operations

Global Ports Holding PLC and its Subsidiaries
Full-Year Financial Report 2017
19
and business development departments of the company work in harmony to transfer
the best practices to the new business.
c. The risks of additional indebtedness: Management controls the Group’s debt
levels on a regular basis, using KPIs such as gross debt to EBITDA and net debt to
EBITDA. The Group does not have significant capex requirements that would lead to
increased indebtedness on its current financials. A high cash conversion rate on
operations, with low working capital requirements, has a positive impact on Group
indebtedness levels.
Key Corporate Events Post 2017 Year-End
Port of Adria - EBRD Loan Agreement:
Port of Adria signed a loan agreement with EBRD for a total of €20 million to modernize its facilities.
The majority of these modernization investments have already been completed. Accordingly this loan
will be refinancing those investments and will essentially be net-debt neutral.
In the long term, Port of Adria is aiming to transform its terminals at Montenegro into a hub that can
be used as an intermediate destination by trucks travelling between Western Europe and Turkey. The
Company is also planning to increase the volume of Serbian cargo as the rail link between Belgrade
and the city of Bar is being refurbished.
In addition, Port of Adria is exploring ways to increase the role the port is playing in Montenegro’s
tourism, a sector which remains constrained by the underdeveloped transport infrastructure.

Global Ports Holding PLC and its Subsidiaries
Full-Year Financial Report 2017
20
Director’s Responsibility Statement
The responsibility statement below has been prepared in connection with the company's full annual
report for the year ending 31 December 2017. Certain parts thereof are not included within this
announcement.
We confirm to the best of our knowledge:
the financial statements, prepared in accordance with International Financial Reporting Standards as
adopted by the EU, give a true and fair view of the assets, liabilities, financial position and profit or
loss of the company and the undertakings included in the consolidation taken as a whole;
the strategic report includes a fair review of the development and performance of the business and
the position of the company and the undertakings included in the consolidation taken as a whole,
together with a description of the principal risks and uncertainties they face; and
the annual report and financial statements, taken as a whole, are fair, balanced and understandable
and provide the information necessary for shareholders to assess the company's performance,
business model and strategy.
This responsibility statement was approved by the board of directors on 11 March 2018 and is signed
on its behalf by:
Mehmet Kutman
Chairman

Global Ports Holding PLC and its Subsidiaries
Consolidated income statement
For the years ended 31 December 2017 and 2016
21
Note
Year ended
31 December
2017
(USD ‘000)
Year ended
31 December
2016
Restated*
(USD ‘000)
Revenue 4 116,366 114,869
Cost of sales 4 (75,548) (72,083)
Gross profit
40,818 42,786
Other income
2,228 477
Gain on bargain purchase 3 -- 131
Selling and marketing expenses
(1,296) (808)
Administrative expenses 5 (16,375) (16,204)
Other expenses
(14,440) (5,508)
Operating profit
10,935 20,874
Finance income 6 15,778 17,509
Finance costs 6 (39,793) (35,272)
Net finance costs
(24,015) (17,763)
Share of profit of equity-accounted investees
2,548 2,219
(Loss) / Profit before tax
(10,532) 5,330
Tax benefit / (expense) 9 (3,599) (925)
(Loss) / Profit for the year
(14,131) 4,405
(Loss) / Profit for the year attributable to:
Owners of the Company (15,576) 2,338
Non-controlling interests 1,445 2,067
(14,131) 4,405
(*) As set out in note 3, the Group acquired three Italian cruise ports in September 2016 and October 2016. In accordance with IFRS 3
Business Combinations the previously reported provisional acquisition values were finalized during 2017 giving rise to a previously unrecognized gain on bargain purchase of USD 131 thousand and the 2016 financial information has been restated to reflect this gain and
the final asset and liability figures.

Global Ports Holding PLC and its Subsidiaries
22
Note
Year ended
31 December
2017
(USD ‘000)
Year ended
31 December
2016
Restated*
(USD ‘000)
Other comprehensive income
Items that will not be reclassified subsequently
to profit or loss
Remeasurement of defined benefit liability
(23) 50
Income tax relating to items that will not be
reclassified subsequently to profit or loss 9 5 (10)
(18) 40 Items that may be reclassified subsequently
to profit or loss
Foreign currency translation differences 41,699 25,182
Cash flow hedges - effective portion of changes in
fair value (55) (530)
Cash flow hedges – realized amounts transferred to
income statement 389 345
Losses on a hedge of a net investment (13,389) (47,656)
28,644 (22,659)
Other comprehensive income / (loss) for the year,
net of income tax
28,626 (22,619)
Total comprehensive income / (loss) for the year
14,495 (18,214)
Total comprehensive income / (loss) attributable to:
Owners of the Company
2,231 (17,687)
Non-controlling interests
12,264 (527)
14,495 (18,214)
Basic and diluted earnings per share
(cents per share) 14 (26.01) 4.25
(*) As set out in note 3, the Group acquired three Italian cruise ports in September 2016 and October 2016. In accordance with IFRS 3
Business Combinations the previously reported provisional acquisition values were finalized during 2017 giving rise to a previously
unrecognized gain on bargain purchase of USD 131 thousand and the 2016 financial information has been restated to reflect this gain and the final asset and liability figures.

Global Ports Holding PLC and its Subsidiaries
Consolidated statement of financial position
For the years ended 31 December 2016 and 2017
23
Note
As at 31 December
2017
(USD ‘000)
As at 31 December
2016
Restated*
(USD ‘000)
Non-current assets
Property and equipment 7 134,664
115,765
Intangible assets 8 433,075
432,642
Goodwill 14,088
12,405
Equity-accounted investees 22,004 17,168
Other investments
6
8
Deferred tax assets 9 1,695
3,111
Other non-current assets
5,022
8,700
610,554
589,799
Current assets
Trade and other receivables 15,702
11,922
Due from related parties 1,599
31,501
Other investments 14,728
14,602
Other current assets 4,947
5,797
Inventories 1,714 1,294
Prepaid taxes 2,932 1,815
Cash and cash equivalents 10 99,448
44,310
141,070
111,241
Total assets
751,624
701,040
Current liabilities
Loans and borrowings 12 44,878 42,982
Other financial liabilities 17 -- 140
Trade and other payables 15,862 14,463
Due to related parties 16 483 581
Current tax liabilities 17 2,217 1,814
Provisions 1,202 1,492
64,642 61,472
Non-current liabilities
Loans and borrowings 12 296,842
296,307
Other financial liabilities 17 2,662 2,525
Derivative financial liabilities 17 852
1,131
Deferred tax liabilities 9 99,879
98,489
Provisions 21,081 16,545
Employee benefits 936
1,287
422,252
416,284
Total liabilities
486,894
477,756
Net assets
264,730
223,284
Equity
Share capital 11 811
33,836
Share premium account 11 -- 54,539
Legal reserves 11 13,012
12,424
Hedging and translation reserves 14,863 (2,962)
Retained earnings
143,148
43,752
Equity attributable to equity holders of the Company
171,834
141,589
Non-controlling interests
92,896
81,695
Total equity
264,730
223,284
(*) As set out in note 3, the Group acquired three Italian cruise ports in September 2016 and October 2016. In accordance with IFRS 3 Business Combinations the previously reported provisional acquisition values were finalized during 2017 giving rise to a previously
unrecognized gain on bargain purchase of USD 131 thousand and the 2016 financial information has been restated to reflect this gain and
the final asset and liability figures.

Global Ports Holding PLC and its Subsidiaries
Consolidated statement of changes in equity
For the year ended 31 December 2017
24
(*) As set out in note 3, the Group acquired three Italian cruise ports in September 2016 and October 2016. In accordance with IFRS 3 Business Combinations the previously reported provisional acquisition values were finalized during 2017 giving rise to a previously unrecognized gain on bargain purchase of USD 131 thousand and the 2016 financial information has been restated to reflect this gain and the final asset and liability figures.
(USD ‘000) Notes
Share
capital
Share
premium
Legal
reserves
Hedging
reserves
Translation
reserves
Retained
earnings
Total
Non-
controlling
interests
Total
equity
Balance at 1 January 2017 33,836 54,539 12,424 (122,708) 119,764 43,622 141,477 80,588 222,065
Impact of finalization of acquisition
accounting (*)
-- -- -- -- (18) 131 113 1,107 1,220
Restated balance at 1 January 2017 33,836 54,539 12,424 (122,708) 119,746 43,753 141,590 81,695 223,285
(Loss) / income for the year -- -- -- -- -- (15,576) (15,576) 1,445 (14,131)
Other comprehensive (loss) / income for the
year
-- -- -- (13,055) 30,880 (18) 17,807 10,819 28,626
Total comprehensive (loss) / income for the
year
-- -- -- (13,055) 30,880 (15,594) 2,231 12,264 14,495
Transactions with owners of the Company
Group restructuring 320,969 (54,539) -- -- -- (266,430) -- -- -- Issuance of shares on IPO 50,492 22,543 -- -- -- -- 73,035 -- 73,035 Share capital reduction (404,486) (22,543) -- -- -- 427,029 -- -- --
Transfer to legal reserves -- -- 588 -- -- (588) -- -- -- Dividends -- -- -- -- -- (45,022) (45,022) (1,063) (46,085)
Total contributions and distributions (33,025) (54,539) 588 -- -- 114,989 28,013 (1,063) 26,950
Total transactions with owners of the Company (33,025) (54,539) 588 (13,055) 30,880 99,395 30,244 11,201 41,445
Balance at 31 December 2017 811 -- 13,012 (135,763) 150,626 143,148 171,834 92,896 264,730

Global Ports Holding PLC and its Subsidiaries
Consolidated statement of changes in equity
For the year ended 31 December 2016
25
(*) As set out in note 3, the Group acquired three Italian cruise ports in September 2016 and October 2016. In accordance with IFRS 3 Business Combinations the previously reported provisional acquisition values were finalized
during 2017 giving rise to a previously unrecognized gain on bargain purchase of USD 131 thousand and the 2016 financial information has been restated to reflect this gain and the final asset and liability figures.
Restated *
USD ‘000 Note
Share
capital
Share
premium
Legal
reserves
Hedging
reserves
Translation
reserves
Retained
earnings
Total
Non-
controlling
interests
Total
equity
Balance at 1 January 2016 33,836 54,539 9,917 (74,867) 91,970 78,488 193,883 83,941 277,824
Profit for the year -- -- -- -- -- 2,338 2,338 2,067 4,405 Other comprehensive income / (loss) for the
year
-- -- -- (47,841) 27,776 40 (20,025) (2,594) (22,619)
Total comprehensive income / (loss) for the
year
-- -- -- (47,841) 27,776 2,378 (17,686) (527) (18,214)
Transactions with owners of the Company
Transfer to legal reserves -- -- 2,507 -- -- (2,507) -- -- --
Dividends -- -- -- -- -- (34,607) (34,607) (3,010) (37,618)
Total contributions and distributions -- -- 2,507 -- -- (37,114) (34,607) (3,010) (37,618)
Changes in ownership interests
Acquisition of subsidiary 6 -- -- -- -- -- -- -- 1,292 1,292
Total changes in ownership interests -- -- -- -- -- -- -- 1,292 1,292
Total transactions with owners of the Company -- -- 2,507 (47,841) 27,776 (34,735) (52,293) (2,246) (54,540)
Balance at 31 December 2016 (*) 33,836 54,539 12,424 (122,708) 119,746 43,752 141,589 81,695 223,284
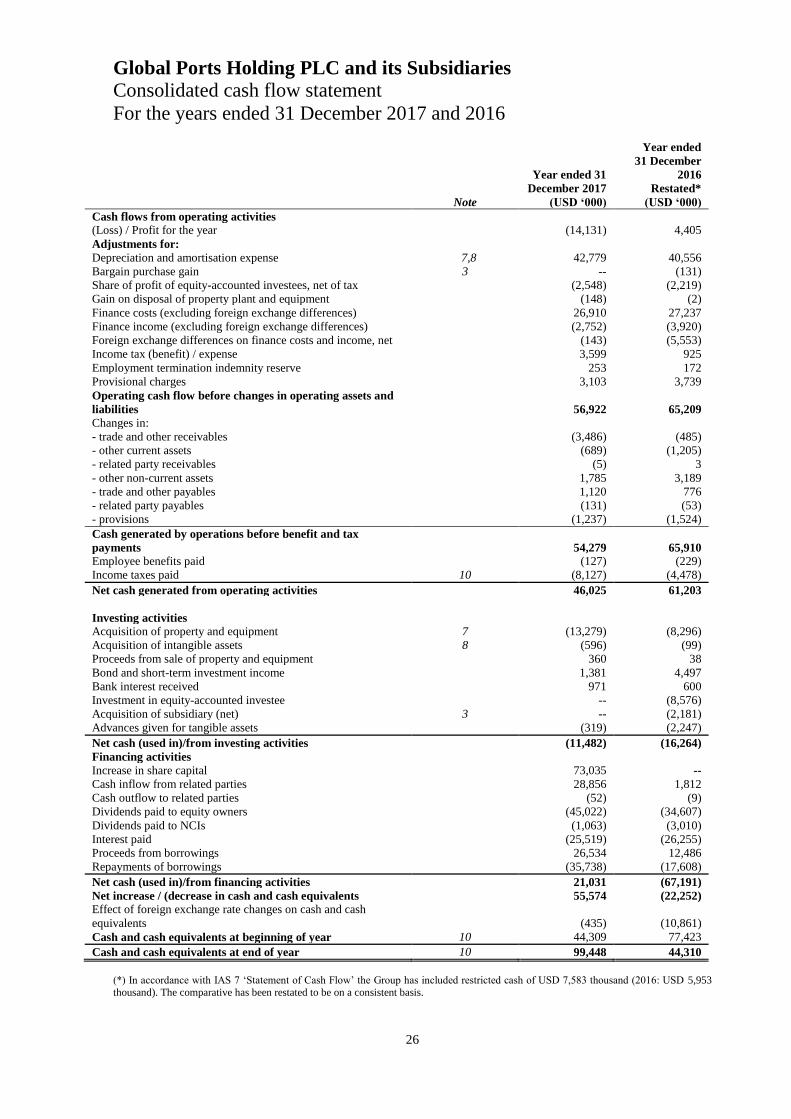
Global Ports Holding PLC and its Subsidiaries
Consolidated cash flow statement
For the years ended 31 December 2017 and 2016
26
Note
Year ended 31
December 2017
(USD ‘000)
Year ended
31 December
2016
Restated*
(USD ‘000)
Cash flows from operating activities
(Loss) / Profit for the year
(14,131) 4,405
Adjustments for:
Depreciation and amortisation expense 7,8 42,779 40,556
Bargain purchase gain 3 -- (131)
Share of profit of equity-accounted investees, net of tax (2,548) (2,219)
Gain on disposal of property plant and equipment (148) (2)
Finance costs (excluding foreign exchange differences) 26,910 27,237
Finance income (excluding foreign exchange differences) (2,752) (3,920)
Foreign exchange differences on finance costs and income, net (143) (5,553)
Income tax (benefit) / expense 3,599 925
Employment termination indemnity reserve 253 172
Provisional charges 3,103 3,739
Operating cash flow before changes in operating assets and
liabilities
56,922 65,209
Changes in:
- trade and other receivables
(3,486) (485)
- other current assets
(689) (1,205)
- related party receivables (5) 3
- other non-current assets
1,785 3,189
- trade and other payables
1,120 776
- related party payables (131) (53)
- provisions (1,237) (1,524)
Cash generated by operations before benefit and tax
payments
54,279 65,910
Employee benefits paid
(127) (229)
Income taxes paid 10 (8,127) (4,478)
Net cash generated from operating activities
46,025 61,203
Investing activities
Acquisition of property and equipment 7 (13,279) (8,296)
Acquisition of intangible assets 8 (596) (99)
Proceeds from sale of property and equipment 360 38
Bond and short-term investment income 1,381 4,497
Bank interest received 971 600
Investment in equity-accounted investee -- (8,576)
Acquisition of subsidiary (net) 3 -- (2,181)
Advances given for tangible assets
(319) (2,247)
Net cash (used in)/from investing activities
(11,482) (16,264)
Financing activities
Increase in share capital 73,035 --
Cash inflow from related parties 28,856 1,812
Cash outflow to related parties (52) (9)
Dividends paid to equity owners (45,022) (34,607)
Dividends paid to NCIs (1,063) (3,010)
Interest paid
(25,519) (26,255)
Proceeds from borrowings
26,534 12,486
Repayments of borrowings
(35,738) (17,608)
Net cash (used in)/from financing activities
21,031 (67,191)
Net increase / (decrease in cash and cash equivalents
55,574 (22,252)
Effect of foreign exchange rate changes on cash and cash
equivalents
(435) (10,861)
Cash and cash equivalents at beginning of year 10 44,309 77,423
Cash and cash equivalents at end of year 10 99,448 44,310
(*) In accordance with IAS 7 ‘Statement of Cash Flow’ the Group has included restricted cash of USD 7,583 thousand (2016: USD 5,953
thousand). The comparative has been restated to be on a consistent basis.

Global Ports Holding PLC and its Subsidiaries
Notes to the consolidated financial statements
27
1 Basis of preparation
The financial information for the year ended 31 December 2017 contained in this News Release was approved
by the Board on 11 March 2018. This announcement does not constitute statutory financial statements of the
Company within the meaning of Section 435 of the Companies Act 2006, but is derived from those financial
statements, which have been prepared in accordance with International Financial Reporting Standards (IFRS) as
endorsed and adopted for use by the European Union
The information is prepared under the historical cost method except where other measurement bases are
required to be applied under IFRS, using all standards and interpretations required for financial periods
beginning 1 January 2017. No standards or interpretations have been adopted before the required
implementation date. Whilst the financial information included within this announcement has been prepared in
accordance with the recognition and measurement critiera of IFRS, it does not comply with all disclosure
requirements.
Global Ports Holding PLC is a public company incorporated in the United Kingdom and registered in England
and Wales under the Companies Act 2006. The address of the registered office is 100 New Bridge Street,
London EC4V 6JA, United Kingdom. Global Ports Holding PLC is the parent company of Global Liman
Isletmeleri A.S. and its subsidiaries (the “Existing Group”). The ultimate holding company is Global Yatırım
Holding.
On 17 May 2017, the Group completed the initial public offering (“IPO”) of its ordinary shares and was
admitted to the standard listing segment of the Official List of the Financial Conduct Authority (“FCA”) and is
trading on the main market of the London Stock Exchange.
As part of a restructuring accompanying the IPO of the Group on 17 May 2017, Global Ports Holding PLC
replaced Global Liman Isletmeleri A.S. as the parent company of the Group by way of a Share exchange
agreement. Under IFRS 3 this has been accounted for as a group reconstruction under merger accounting. The
results for the Group for the period from 1 January 2017 to 31 December 2017 have been presented as if Global
Ports Holding PLC was the parent company from 1 January 2017. The prior year comparatives reflect the
consolidated results of the Group under Global Liman Isletmeleri A.S.
Statutory financial statements for the year ended 31 December 2017, which have been prepared on a going
concern basis, will be delivered to the Registrar of Companies in due course. The auditor has reported on those
financial statements. Their report was not qualified, did not include a reference to any matters to which the
auditors drew attention by way of emphasis without qualifying their report, and did not contain a statement
under Section 498 (2) or (3) of the Companies Act 2006.

Global Ports Holding PLC and its Subsidiaries
Notes to the consolidated financial statements
28
2 Segment reporting
a) Products and services from which reportable segments derive their revenues
The Group operates various cruise and commercial ports and all revenue is generated from external
customers such as cruise liners, ferries, yachts, individual passengers, container ships and bulk and general
cargo ships.
b) Reportable segments
Operating segments are defined as components of an enterprise for which discrete financial information is
available that is evaluated regularly by the chief operating decision-maker, in deciding how to allocate
resources and assessing performance.
The Group has identified each port as an operating segment, as each port represents a set of activities which
generates revenue and the financial information of each port is reviewed by the Group’s chief operating
decision-maker in deciding how to allocate resources and assess performance. The Group’s chief operating
decision-maker is the Chief Executive Officer (“CEO”), who reviews the management reports of each port at
least on a monthly basis.
The CEO evaluates segmental performance on the basis of earnings before interest, tax, depreciation and
amortisation excluding the effects of exceptional and other non-cash income and expenses comprising project
expenses, bargain purchase gains and reserves, board member leaving fees, employee termination payments,
unallocated expenses, finance income, finance costs, and including the share of equity-accounted investees
which is fully integrated into GPH cruise port network (“Adjusted EBITDA” or “Segmental EBITDA”).
Adjusted EBITDA is considered by Group management to be the most appropriate profit measure for the
review of the segment operations because it excludes items which the Group does not consider to represent
the operating cash flows generated by underlying business performance. The share of equity-accounted
investees has been included as it is considered to represent operating cash flows generated by the Group’s
operations that are structured in this manner.
The Group has the following operating segments under IFRS 8:
BPI (“Creuers” or “Creuers (Barcelona and Málaga)”), VCP (“Valetta Cruise Port”), Ege Liman
(“Ege Ports-Kuşadası”), Bodrum Liman (“Bodrum Cruise Port”), Ortadoğu Liman (Cruise port
operations), POH, Lisbon Cruise Terminals, LDA (“Port of Lisbon” or “Lisbon Cruise Port”), SATS
– Creuers Cruise Services Pte. Ltd. (“Singapore Port”), Venezia Investimenti Srl. (“Venice
Investment” or “Venice Cruise Port”) and La Spezia Cruise Facility Srl. (“La Spezia”) which fall
under the Group’s cruise port operations.
Ortadoğu Liman (Commercial port operations) (“Port Akdeniz-Antalya”) and Port of Adria (“Port
of Adria-Bar”) which both fall under the Group’s commercial port operations.
The Group’s reportable segments under IFRS 8 are BPI, VCP, Ege Liman, Ortadoğu Liman (Commercial
port operations) and Port of Adria. Segments that do not exceed the quantitative thresholds for reporting
information about operating segments have been included in Other.
Global Depolama does not generate any revenues and therefore is presented as unallocated to reconcile to the
consolidated financial statements results.
Ravenna, Cagliari and Catania (consolidated under POH) were acquired at the end of 2016, therefore they did
not generate any revenue for the Group in 2016.
Assets, revenue and expenses directly attributable to segments are reported under each reportable segment.
Any items which are not attributable to segments have been disclosed as unallocated.

Global Ports Holding PLC and its Subsidiaries
Notes to the consolidated financial statements
29
5 2 Segment reporting (continued)
b) Reportable segments (continued)
(i) Segment revenues, results and reconciliation to profit before tax
The following is an analysis of the Group’s revenue, results and reconciliation to profit before tax by reportable segment:
(*) As of 31 December 2017, exceptional and other non-cash items totalled USD 19,015 thousand. These comprised of IPO costs of USD 9,768 thousand (31 December 2016: USD nil), project costs
(mostly relating to bidding for new port operations) of USD 4,734 thousand (31 December 2016: USD 5,306 thousand), employee termination expenses amounting to USD 250 thousand (31 December
2016: USD 1,758 thousand), other provisions reversed amounting to a gain of USD 636 thousand (31 December 2016: a loss of USD 853 thousand), replacement provision expenses amounting USD 2,078
thousand (31 December 2016: USD 2,600 thousand), other expenses consists of donations, insurance, commissions amounting to USD 627 thousand (31 December 2016: USD 1,889 thousand) and
personnel premiums related based on success for the Group’s listing on LSE which completed on 17 May 2017 amounting USD 1,841 thousand (31 December 2016: none).
The Group did not have inter-segment revenues in any of the periods shown above.
USD ‘000 BPI VCP Ege Liman Other Total Cruise
Ortadoğu
Liman
Port of
Adria
Total
Commercial Total
31 December 2017
Revenue 27,376 12,916 4,819 5,165 50,276 58,549 7,541 66,090 116,366
Segmental EBITDA 17,558 6,826 2,954 4,877 32,215 46,436 1,855 48,291 80,506
Unallocated expenses (5,230)
Adjusted EBITDA 75,277
Reconciliation to profit before tax
Depreciation and amortisation expenses (42,779)
Exceptional & other non-cash items(*) (19,015)
Finance income 15,778
Finance costs (39,793)
(Loss) before income tax (10,532)
31 December 2016
Revenue 27,113 11,838 11,650 3,033 53,634 53,351 7,884 61,235 114,869
Segmental EBITDA 18,032 5,859 8,976 4,050 36,917 41,288 2,728 44,016 80,933
Unallocated expenses (5,010)
Adjusted EBITDA 75,923
Reconciliation to profit before tax
Depreciation and amortisation expenses (40,556)
Exceptional & other non-cash items(*) (12,276)
Finance income 17,511
Finance costs (35,272)
Profit before income tax 5,330

Global Ports Holding PLC and its Subsidiaries
Notes to the consolidated financial statements
30
2 Segment reporting (continued)
b) Reportable segments (continued)
(ii) Segment assets and liabilities
The following is an analysis of the Group’s assets and liabilities by reportable segment for the years ended:
USD ‘000 BPI VCP
Ege
Liman Other
Total
Cruise
Ortadoğu
Liman
Port of
Adria
Total
Commercial Total
31 December 2017
Segment assets 164,043 115,673 55,965 13,900 349,581 234,902 70,526 305,428 655,009
Equity-accounted investees -- -- -- 22,004 22,004 -- -- -- 22,004
Unallocated assets 74,611
Total assets 751,624
Segment liabilities 98,490 37,471 13,285 5,069 154,315 53,333 8,157 61,490 215,804
Unallocated liabilities 271,090
Total liabilities 486,894
31 December 2016
Segment assets 146,068 101,804 53,066 16,228 317,166 250,527 59,127 309,654 626,820
Equity-accounted investees -- -- -- 17,168 17,168 -- -- -- 17,168
Unallocated assets 57,052
Total assets 701,040
Segment liabilities 88,696 35,075 12,942 6,487 143,200 50,840 9,630 60,470 203,670
Unallocated liabilities 274,085
Total liabilities 477,755

Global Ports Holding PLC and its Subsidiaries
Notes to the consolidated financial statements
31
2 Segment reporting (continued) 3
b) Reportable segments (continued)
(iii) Other segment information
The following table details other segment information for the years ended:
(*) Non-current assets exclude those relating to deferred tax assets and financial instruments (including equity-accounted investees).
USD ‘000 BPI VCP
Ege
Liman Other Total Cruise
Ortadoğu
Liman
Port of
Adria
Total
Commercial Unallocated Total
31 December 2017
Depreciation and amortisation expenses (10,869) (2,582) (2,788) (3,119) (19,358) (20,742) (2,514) (23,256) (165) (42,779)
Additions to non-current assets (*)
- Capital expenditures 209 801 3,448 1,447 5,905 2,851 6,581 9,432 467 15,804
- Other -- -- -- -- -- -- -- -- -- --
Total additions to non-current assets
(*) 209 801 3,448 1,447 5,905 2,851 6,581 9,432 467 15,804
31 December 2016
Depreciation and amortisation expenses (10,572) (2,356) (2,543) (2,205) (17,676) (20,589) (2,177) (22,766) (114) (40,556)
Additions to non-current assets (*)
- Capital expenditures 126 1,960 1,255 4 3,345 1,400 4,009 5,409 261 9,015
- Other -- -- -- -- -- -- -- -- 6,561 6,561
Total additions to non-current assets
(*) 126 1,960 1,255 4 3,345 1,400 4,009 5,409 6,822 15,576

Global Ports Holding PLC and its Subsidiaries
Notes to the consolidated financial statements
32
5 2 Segment reporting (continued)
b) Reportable segments (continued)
(iv) Geographical information
The Port operations of the Group are managed on a worldwide basis, but operational ports and management offices are primarily in Turkey, Montenegro, Spain and Singapore. The
geographic information below analyses the Group’s revenue and non-current assets by countries. In presenting the following information, segment revenue has been based on the
geographic location of port operations and segment non-current assets were based on the geographic location of the assets.
Revenue
Year ended
31 December 2017
(USD ‘000)
Year ended
31 December 2016
(USD ‘000)
Turkey 66,009 68,034
Montenegro 7,541 7,884
Malta 12,916 11,838
Spain 27,376 27,113
Italy 2,524 --
116,366 114,869
Non-current assets exclude those relating to deferred tax assets and financial instruments (including equity-accounted investees).
(v) Information about major customers
The Group did not have a single customer that accounted for more than 10% of the Group’s consolidated net revenues in any of the periods presented.
Non-current assets
As at
31 December 2017
(USD ‘000)
As at
31 December 2016
(USD ‘000)
Turkey 265,791 277,845
Spain 144,939 137,601
Malta 100,632 90,321
Montenegro 67,416 56,094
Italy 7,960 7,659
UK 117 --
586,855 569,520

Global Ports Holding PLC and its Subsidiaries
Notes to the consolidated financial statements
33
3 Acquisition of subsidiary
Acquisition of Ravenna, Cagliari and Catania Cruise Ports
The Group acquired 67.55% shares of Cagliari Passenger Terminal, 59.05% shares of Catania Passenger Terminal
on 18 October 2016 and 51% shares of Ravenna Passenger Terminal on 22 September 2016 (together “the
acquisition date”) in Italy, for a total cash consideration of USD 2,411 thousand and provisionally fair valued the
related port operations right at USD 6,561 thousand recognised in the consolidated balance sheet.
The acquisitions of Ravenna, Cagliari, and Catania were completed as part of the Group’s plans to increase port
investments overseas and expand its port portfolio overseas.
The Group incurred acquisition-related costs of USD 160 thousand on legal fees and due diligence costs. These
costs have been included in “other expenses” as project expenses.
(i) Identifiable assets acquired and liabilities assumed
The following table summarises the recognised amounts of assets acquired and liabilities assumed at the
acquisition date.
The adjustments have been made retrospectively, restating 2016 financial information.
The gross contractual amount of receivables of Ravenna, Cagliari, and Catania as of the acquisition date is USD
678 thousand and there are no contractual cash flows which are not expected to be collected.
(ii) Gain on bargain purchase
The gain on bargain purchase arising from the acquisition of Ravenna, Cagliari, and Catania has arisen as follows:
As at the acquisition date (USD ‘000) Note
Provisional
accounting
Final
accounting
Consideration paid (a) 2,411 2,411
Fair value of identifiable net assets acquired (100%) (a)(i) (570) (3,834)
NCI, based on their proportionate interest in the recognised amounts
of the assets and liabilities of Ravenna, Cagliari, and Catania 269 1,292
Goodwill / (Gain on bargain purchase) 2,110 (131)
USD 131 thousand gain on bargain purchase has been recognised in the profit and loss statement for the year
ended 31 December 2016.
As at 30 November 2016 (acquisition date) Note
Provisional
fair values
USD’000
Adjustments
USD’000
Final
fair value
USD ‘000
Property and equipment 12 939 -- 939
Intangible assets 13 136 6,561 6,697
Other assets 236 -- 236
Trade and other receivables 678 -- 678
Cash and cash equivalents 230 -- 230
Loans and borrowings (604) -- (604)
Trade and other payables (1,031) -- (1,031)
Deferred tax liabilities -- (1,317) (1,317)
Provisions -- (1,980) (1,980)
Employee termination indemnity (14) -- (14)
Total identifiable net assets acquired 570 3,834

Global Ports Holding PLC and its Subsidiaries
Notes to the consolidated financial statements
34
3 Acquisition of subsidiary (continued)
Acquisition of Ravenna, Cagliari and Catania Cruise Ports (continued)
(iii) Net cash outflow on the acquisition of Ravenna, Cagliari, and Catania
USD ‘000
Consideration paid: 2,411
Cash associated with acquired assets (230)
Net cash outflow 2,181
(iv) Impact of acquisition on results of the Group
The financial statements of all three companies for the year ended 31 December 2016 has been included in the
consolidated financial statements. If the acquisitions had occurred on 1 January 2016, management estimates that
consolidated revenue would have been USD 116,482 thousand, and consolidated profit for the year would have
been USD 4,393 thousand higher.

Global Ports Holding PLC and its Subsidiaries
Notes to the consolidated financial statements
35
4 Revenue and cost of sales
Revenue
For the years ended 31 December, revenue comprised the following:
2017
(USD ‘000)
2016
(USD ‘000)
Container revenue 43,560 39,529
Landing fees 31,676 31,148
Port service revenue 12,145 14,458
Rental income 8,140 9,586
Cargo revenue 14,603 13,452
Income from duty free operations 4,528 5,025
Domestic water sales 848 973
Other revenue 866 698
Total 116,366 114,869
Cost of sales
For the years ended 31 December, cost of sales comprised the following:
2017
(USD ‘000)
2016
(USD ‘000)
Depreciation and amortization expenses 39,507 37,575
Personnel expenses 14,329 13,789
Cost of inventories sold 2,590 3,201
Commission fees to government authorities and
pilotage expenses 3,204 3,204
Replacement provision 2,078 1,939
Security expenses 1,940 1,866
Repair and maintenance expenses 1,808 1,716
Subcontractor lashing expenses 1,624 1,415
Subcontractor crane expenses 1,408 1,368
Container transportation expenses 964 600
Insurance expenses 987 1,102
Fuel expenses 842 642
Port energy usage expenses 747 786
Shopping mall expenses 660 159
Fresh water expenses 602 601
Port rental expenses 571 154
Waste removal expenses 192 215
Other expenses 1,495 1,751
Total 75,548 72,083
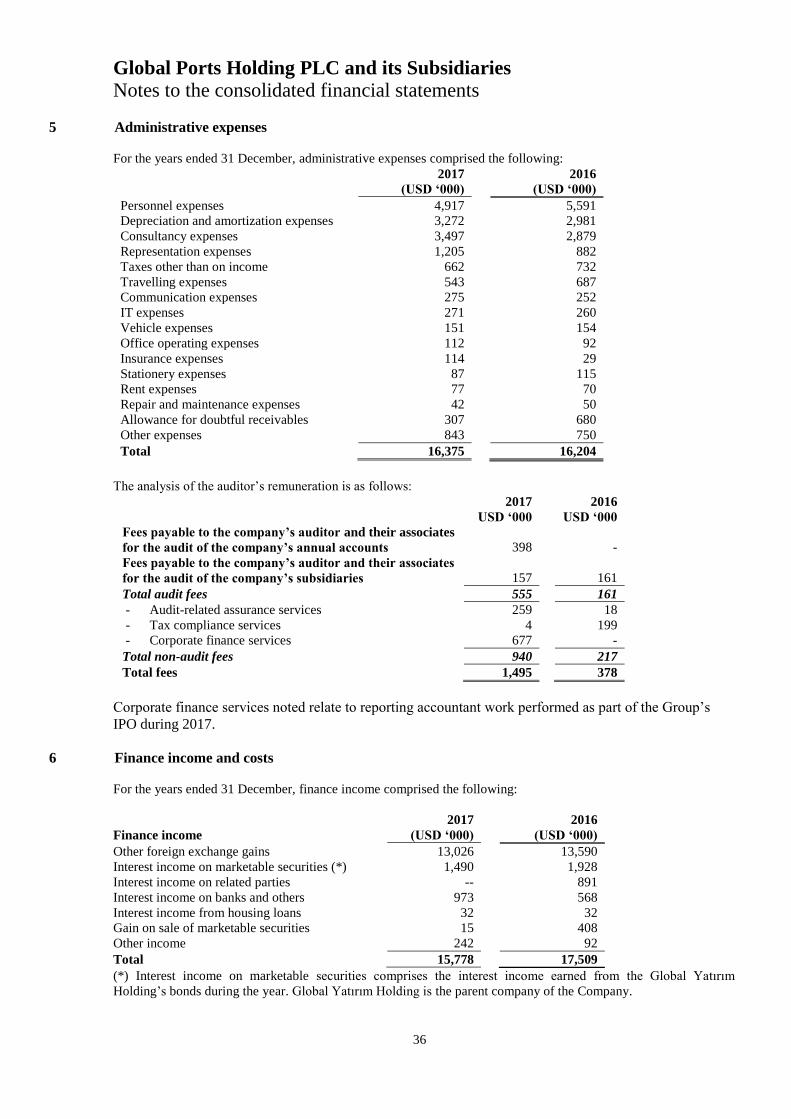
Global Ports Holding PLC and its Subsidiaries
Notes to the consolidated financial statements
36
5 Administrative expenses
For the years ended 31 December, administrative expenses comprised the following:
2017
(USD ‘000)
2016
(USD ‘000)
Personnel expenses 4,917 5,591
Depreciation and amortization expenses 3,272 2,981
Consultancy expenses 3,497 2,879
Representation expenses 1,205 882
Taxes other than on income 662 732
Travelling expenses 543 687
Communication expenses 275 252
IT expenses 271 260
Vehicle expenses 151 154
Office operating expenses 112 92
Insurance expenses 114 29
Stationery expenses 87 115
Rent expenses 77 70
Repair and maintenance expenses 42 50
Allowance for doubtful receivables 307 680
Other expenses 843 750
Total 16,375 16,204
The analysis of the auditor’s remuneration is as follows:
2017
USD ‘000
2016
USD ‘000
Fees payable to the company’s auditor and their associates
for the audit of the company’s annual accounts 398 -
Fees payable to the company’s auditor and their associates
for the audit of the company’s subsidiaries 157 161
Total audit fees 555 161
- Audit-related assurance services 259 18
- Tax compliance services 4 199
- Corporate finance services 677 -
Total non-audit fees 940 217
Total fees 1,495 378
Corporate finance services noted relate to reporting accountant work performed as part of the Group’s
IPO during 2017.
6 Finance income and costs
For the years ended 31 December, finance income comprised the following:
Finance income
2017
(USD ‘000)
2016
(USD ‘000)
Other foreign exchange gains 13,026 13,590
Interest income on marketable securities (*) 1,490 1,928
Interest income on related parties -- 891
Interest income on banks and others 973 568
Interest income from housing loans 32 32
Gain on sale of marketable securities 15 408
Other income 242 92
Total 15,778 17,509
(*) Interest income on marketable securities comprises the interest income earned from the Global Yatırım
Holding’s bonds during the year. Global Yatırım Holding is the parent company of the Company.
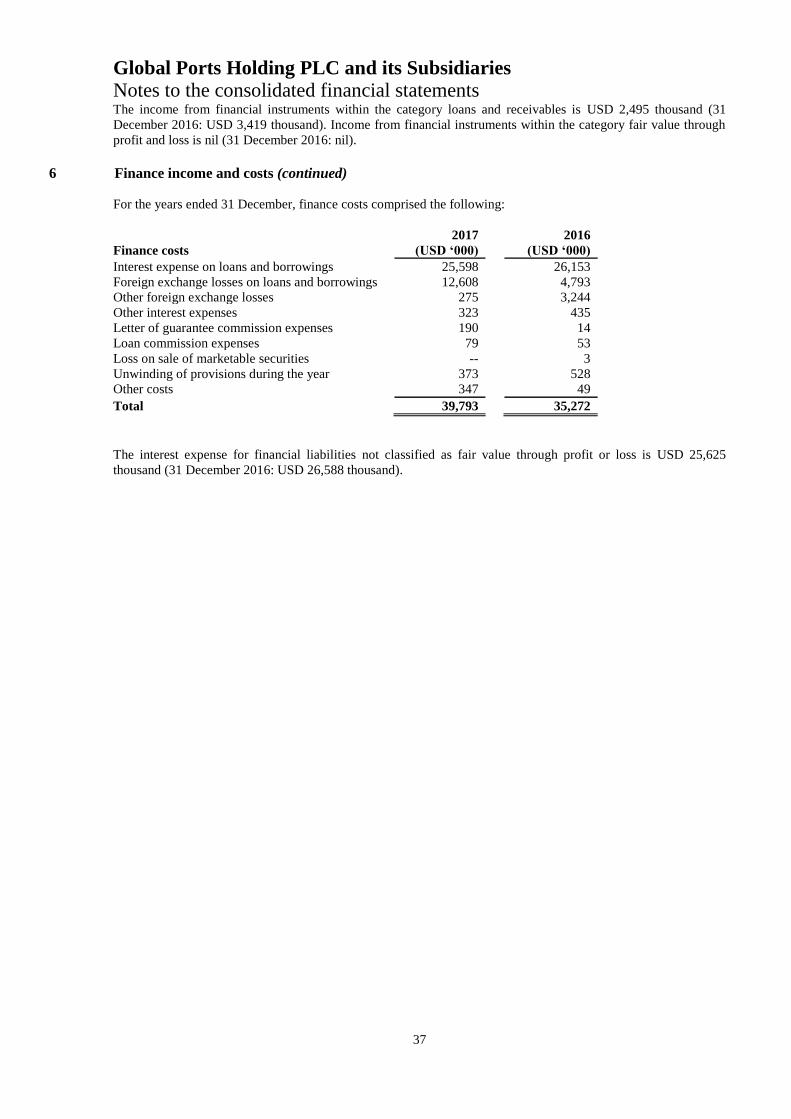
Global Ports Holding PLC and its Subsidiaries
Notes to the consolidated financial statements
37
The income from financial instruments within the category loans and receivables is USD 2,495 thousand (31
December 2016: USD 3,419 thousand). Income from financial instruments within the category fair value through
profit and loss is nil (31 December 2016: nil).
6 Finance income and costs (continued)
For the years ended 31 December, finance costs comprised the following:
Finance costs
2017
(USD ‘000)
2016
(USD ‘000)
Interest expense on loans and borrowings 25,598 26,153
Foreign exchange losses on loans and borrowings 12,608 4,793
Other foreign exchange losses 275 3,244
Other interest expenses 323 435
Letter of guarantee commission expenses 190 14
Loan commission expenses 79 53
Loss on sale of marketable securities -- 3
Unwinding of provisions during the year 373 528
Other costs 347 49
Total 39,793 35,272
The interest expense for financial liabilities not classified as fair value through profit or loss is USD 25,625
thousand (31 December 2016: USD 26,588 thousand).

Global Ports Holding PLC and its Subsidiaries
Notes to the consolidated financial statements
38
7 Property and equipment
Movements of property and equipment for the year ended 31 December 2017 comprised the following:
USD ‘000
Cost 1 January 2017 Additions Disposals Transfers
Acquisition
through
business
combinations
Currency
translation
differences
31 December
2017
Leasehold improvements 98,310 2,875 (163) 5,062 -- 15,606 121,690
Machinery and equipment 41,212 2,281 (563) 9,468 -- 829 53,227
Motor vehicles 16,849 252 (4) -- -- 1,496 18,593
Furniture and fixtures 7,387 566 (5) 28 -- 1,290 9,266
Construction in progress 5,753 9,234 -- (14,762) -- 1,371 1,596
Land improvement 8 1 -- 151 -- (9) 151
Total 169,519 15,209 (735) (53) -- 20,584 204,523
Accumulated depreciation 1 January 2017
Depreciation
expense Disposals Transfers
Acquisition
through
business
combinations
Currency
translation
differences
31 December
2017
Leasehold improvements 20,720 4,349 -- -- -- 3,011 28,080
Machinery and equipment 22,344 3,839 (525) -- -- 583 26,241
Motor vehicles 7,178 1,465 -- -- -- 498 9,141
Furniture and fixtures 3,511 1,052 -- -- -- 890 5,453
Land improvement 1 429 -- -- -- 514 944
Total 53,754 11,134 (525) -- -- 5,496 69,859
Net book value 115,765 (210) (53) -- 15,088 134,664
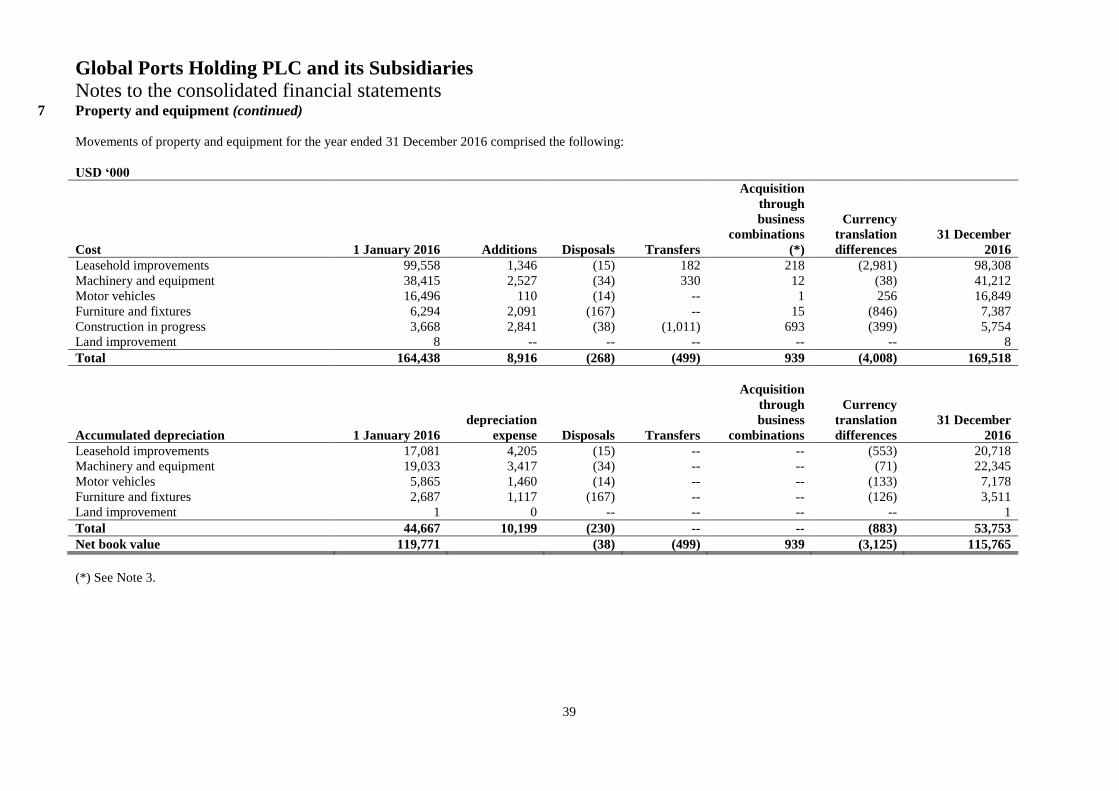
Global Ports Holding PLC and its Subsidiaries
Notes to the consolidated financial statements
39
7 Property and equipment (continued)
Movements of property and equipment for the year ended 31 December 2016 comprised the following:
USD ‘000
Cost 1 January 2016 Additions Disposals Transfers
Acquisition
through
business
combinations
(*)
Currency
translation
differences
31 December
2016
Leasehold improvements 99,558 1,346 (15) 182 218 (2,981) 98,308
Machinery and equipment 38,415 2,527 (34) 330 12 (38) 41,212
Motor vehicles 16,496 110 (14) -- 1 256 16,849
Furniture and fixtures 6,294 2,091 (167) -- 15 (846) 7,387
Construction in progress 3,668 2,841 (38) (1,011) 693 (399) 5,754
Land improvement 8 -- -- -- -- -- 8
Total 164,438 8,916 (268) (499) 939 (4,008) 169,518
Accumulated depreciation 1 January 2016
depreciation
expense Disposals Transfers
Acquisition
through
business
combinations
Currency
translation
differences
31 December
2016
Leasehold improvements 17,081 4,205 (15) -- -- (553) 20,718
Machinery and equipment 19,033 3,417 (34) -- -- (71) 22,345
Motor vehicles 5,865 1,460 (14) -- -- (133) 7,178
Furniture and fixtures 2,687 1,117 (167) -- -- (126) 3,511
Land improvement 1 0 -- -- -- -- 1
Total 44,667 10,199 (230) -- -- (883) 53,753
Net book value 119,771 (38) (499) 939 (3,125) 115,765
(*) See Note 3.

Global Ports Holding PLC and its Subsidiaries
Notes to the consolidated financial statements
40
7 Property and equipment (continued)
As at 31 December 2017, the net book value of machinery and equipment purchased through leasing amounts to
USD 2,064 thousand (31 December 2016: USD 2,438 thousand), the net book value of motor vehicles purchased
through leasing amounts to USD 9,428 thousand (31 December 2016: USD 9,829 thousand), and the net book
value of furniture and fixtures purchased through leasing amounts to USD 124 thousand (31 December 2016: USD
190 thousand). In 2017, no capital expenditure was made through finance leases (31 December 2016: USD 620
thousand).
As at 31 December 2017 and 2016, according to the “TOORA” and “BOT” tender agreements signed with the
related Authorities, at the end of the agreement periods, real estate with their capital improvements will be
returned as running, clean, free of any liability and free of charge.
For the years ended 31 December 2017 and 2016, there are no borrowing costs capitalised into property and
equipment.
As at 31 December 2017, the insured amount of property and equipment amounts to USD 265,598 thousand (31
December 2016: USD 202,880 thousand).
8 Intangible assets
Movements of intangible assets for the year ended 31 December 2017 comprised the following:
USD ‘000
Cost
1 January
2017 Additions Disposals Transfers
Acquisition
through business
combinations
Currency
translation
differences
31 December
2017
Port operation
rights 579,520 -- -- -- -- 36,891 616,411
Customer
relationships 3,622 -- -- -- -- 491 4,113
Software 592 529 (2) -- -- 36 1,155
Other intangibles 716 66 -- 53 -- 54 889
Total 584,450 595 (2) 53 -- 37,472 622,568
Accumulated
amortisation
1 January
2017
Amortisation
expense Disposals Transfers
Acquisition
through business
combinations
Currency
translation
differences
31 December
2017
Port operation
rights 148,751 31,032 -- -- -- 5,669 185,452
Customer
relationships 2,492 323 -- -- -- 358 3,173
Software 348 136 -- -- -- 8 492
Other intangibles 217 154 -- -- -- 5 376
Total 151,808 31,645 -- -- -- 6,040 189,493
Net book value 432,642 (31,050) (2) 53 -- 31,432 433,075
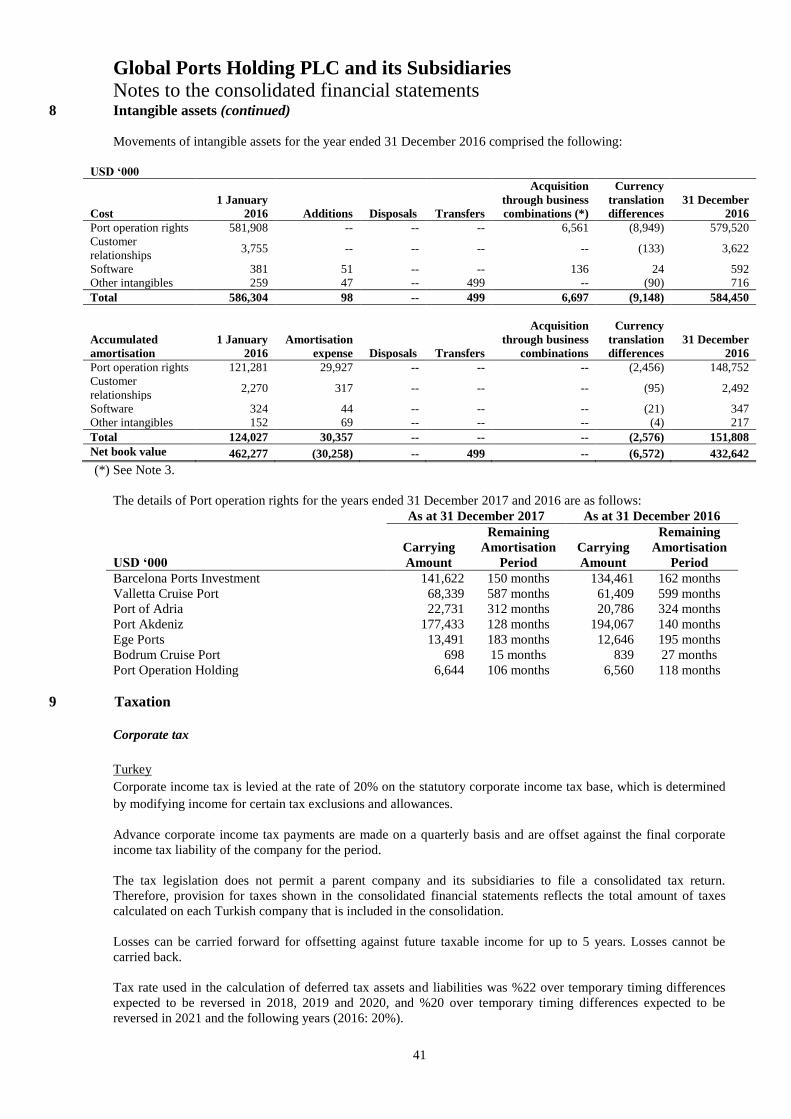
Global Ports Holding PLC and its Subsidiaries
Notes to the consolidated financial statements
41
8 Intangible assets (continued)
Movements of intangible assets for the year ended 31 December 2016 comprised the following:
USD ‘000
Cost
1 January
2016 Additions Disposals Transfers
Acquisition
through business
combinations (*)
Currency
translation
differences
31 December
2016
Port operation rights 581,908 -- -- -- 6,561 (8,949) 579,520
Customer
relationships 3,755 -- -- -- -- (133) 3,622
Software 381 51 -- -- 136 24 592
Other intangibles 259 47 -- 499 -- (90) 716
Total 586,304 98 -- 499 6,697 (9,148) 584,450
Accumulated
amortisation
1 January
2016
Amortisation
expense Disposals Transfers
Acquisition
through business
combinations
Currency
translation
differences
31 December
2016
Port operation rights 121,281 29,927 -- -- -- (2,456) 148,752
Customer
relationships 2,270 317 -- -- -- (95) 2,492
Software 324 44 -- -- -- (21) 347
Other intangibles 152 69 -- -- -- (4) 217
Total 124,027 30,357 -- -- -- (2,576) 151,808
Net book value 462,277 (30,258) -- 499 -- (6,572) 432,642
(*) See Note 3.
The details of Port operation rights for the years ended 31 December 2017 and 2016 are as follows:
As at 31 December 2017 As at 31 December 2016
USD ‘000
Carrying
Amount
Remaining
Amortisation
Period
Carrying
Amount
Remaining
Amortisation
Period
Barcelona Ports Investment 141,622 150 months 134,461 162 months
Valletta Cruise Port 68,339 587 months 61,409 599 months
Port of Adria 22,731 312 months 20,786 324 months
Port Akdeniz 177,433 128 months 194,067 140 months
Ege Ports 13,491 183 months 12,646 195 months
Bodrum Cruise Port 698 15 months 839 27 months
Port Operation Holding 6,644 106 months 6,560 118 months
9 Taxation
Corporate tax
Turkey
Corporate income tax is levied at the rate of 20% on the statutory corporate income tax base, which is determined
by modifying income for certain tax exclusions and allowances.
Advance corporate income tax payments are made on a quarterly basis and are offset against the final corporate
income tax liability of the company for the period.
The tax legislation does not permit a parent company and its subsidiaries to file a consolidated tax return.
Therefore, provision for taxes shown in the consolidated financial statements reflects the total amount of taxes
calculated on each Turkish company that is included in the consolidation.
Losses can be carried forward for offsetting against future taxable income for up to 5 years. Losses cannot be
carried back.
Tax rate used in the calculation of deferred tax assets and liabilities was %22 over temporary timing differences
expected to be reversed in 2018, 2019 and 2020, and %20 over temporary timing differences expected to be
reversed in 2021 and the following years (2016: 20%).
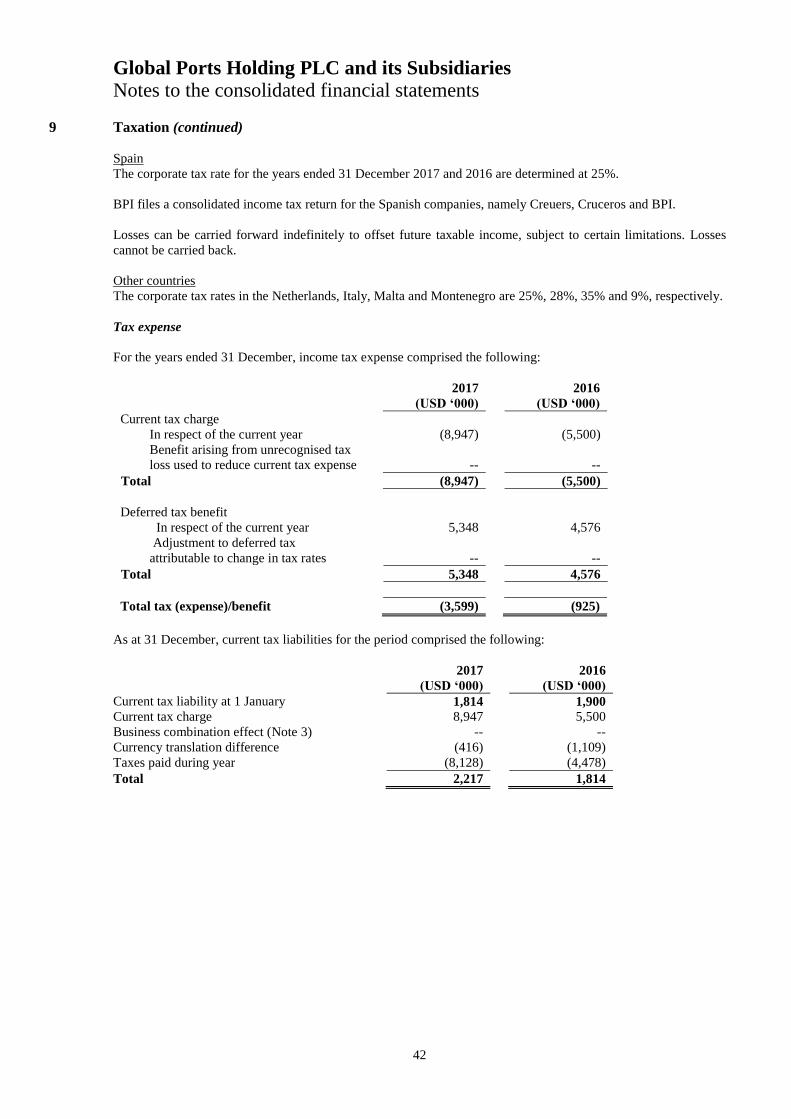
Global Ports Holding PLC and its Subsidiaries
Notes to the consolidated financial statements
42
9 Taxation (continued)
Spain
The corporate tax rate for the years ended 31 December 2017 and 2016 are determined at 25%.
BPI files a consolidated income tax return for the Spanish companies, namely Creuers, Cruceros and BPI.
Losses can be carried forward indefinitely to offset future taxable income, subject to certain limitations. Losses
cannot be carried back.
Other countries
The corporate tax rates in the Netherlands, Italy, Malta and Montenegro are 25%, 28%, 35% and 9%, respectively.
Tax expense
For the years ended 31 December, income tax expense comprised the following:
2017
(USD ‘000)
2016
(USD ‘000)
Current tax charge
In respect of the current year (8,947) (5,500)
Benefit arising from unrecognised tax
loss used to reduce current tax expense -- --
Total (8,947) (5,500)
Deferred tax benefit
In respect of the current year 5,348 4,576
Adjustment to deferred tax
attributable to change in tax rates -- --
Total 5,348 4,576
Total tax (expense)/benefit (3,599) (925)
As at 31 December, current tax liabilities for the period comprised the following:
2017
(USD ‘000)
2016
(USD ‘000)
Current tax liability at 1 January 1,814 1,900
Current tax charge 8,947 5,500
Business combination effect (Note 3) -- --
Currency translation difference (416) (1,109)
Taxes paid during year (8,128) (4,478)
Total 2,217 1,814

Global Ports Holding PLC and its Subsidiaries
Notes to the consolidated financial statements
43
9 Taxation (continued)
The tax reconciliation for the years ended 31 December is as follows:
2017
(USD ‘000)
2016
(USD ‘000)
Profit before income tax (10,532) 5,330
Tax using the Turkish corporate income tax rate of
20% 2,106 (1,040)
Effect of tax rates in foreign jurisdictions (755) (710)
Income from tax exempt maritime operations (*) 689 1,824
Recognition of previously unrecognised losses 6 827
Recognition of losses not recognised for deferred tax (1,854) (2,969)
Permanent differences (4,589) (2,712)
Impact of change in tax rate (**) (108) --
Disallowable expenses (300) (179)
Tax return filed based on Creuers acquisition (***) 420 3,091
Donations (7) 1,167
Other 793 (225)
(3,599) (925)
(*) Income generated through the vessels covered by the Turkish International Ship Registry Law authorised on 16
December 1999 is not subject to income tax and expenses related to these operations as they are considered
disallowable expenses.
(**) In Turkey, the rate for corporate income tax is scheduled to increase to 22% (up from 20%) for the tax periods
2018, 2019, and 2020. Prospective effect of this change was presented under impact of change in tax rate.
(***) A tax credit arose in BPI following a successful claim to the Spanish tax authorities to eliminate domestic
double taxation arising on the 2013 and 2014 acquisitions of interests in Creuers.
Deferred tax
The balance comprises temporary differences attributable to:
2017
(USD ‘000)
2016
(USD ‘000)
Property and equipment 1,651 1,805
Tax losses carried forward 6 1,551
Provision for employment termination
indemnity and vacation pay
326 181
Property, plant and Equipment (887) (857)
Intangible assets (97,151) (95,857)
Other (2,129) (2,199)
Set-off of deferred tax assets pursuant to set-
off provisions (1,695) (3,113)
Deferred tax liabilities (99,879) (98,489)

Global Ports Holding PLC and its Subsidiaries
Notes to the consolidated financial statements
44
9 Taxation (continued)
Deferred tax (continued)
The following is the analysis of deferred tax assets/(liabilities) presented in the consolidated balance sheet:
USD’000
Property and
equipment
Tax losses
carried
forward
Provision for
employment
termination
indemnity and
vacation pay
Intangible
assets Other Total
At 1 January 2016 1,274 1,347 355 (101,529) (1,811) (100,367)
Charge/(credit) to profit or loss (196) 510 (131) 5,212 (819) 4,576
Acquisition of subsidiary 64 -- -- (1,318) -- (1,254)
Exchange differences (194) (306) (43) 1,778 431 1,666
At 31 December 2016 948 1,551 181 (95,857) (2,199) (95,376) Charge/(credit) to profit or loss (243) (1,602) 128 5,404 1,661 5,348
Acquisition of subsidiary -- -- -- -- -- --
Exchange differences 60 58 17 (6,699) (1,592) (8,156)
At 31 December 2017 765 7 326 (97,152) (2,130) (98,184)

Global Ports Holding PLC and its Subsidiaries
Notes to the consolidated financial statements
45
9 Taxation (continued)
Deferred tax (continued)
As at 31 December 2017 and 2016, the breakdown of the tax losses carried forward in terms of their final years of utilisation is as follows:
USD ‘000 2017 2016
Expiry years of the tax losses carried forward Recognised Unrecognised Recognised Unrecognised
2017 -- -- -- 3,049
2018 -- 909 -- 902
2019 -- 6,709 -- 6,655
2020 30 3,261 2,601 3,235
2021 -- 2,694 6,435 2,672
2022 -- 2,689 -- --
30 16,262 9,036 16,513
Unrecognised deferred tax assets
At the reporting date, the Group has Turkey and Montenegro statutory tax losses available for offsetting against future profits which are shown above. Such carried forward tax
losses do not expire until 2022. Deferred tax assets have not been recognised in respect of some portions of these items since it is not probable that future taxable profits will be
available against which the Group can utilise the benefits there from.
Amounts recognised in OCI
USD ‘000 2017 2016
Before tax
Tax
(expense)/
benefit Net of tax Before tax
Tax
(expense)/
benefit Net of tax
Remeasurements of defined benefit liability (23) 5 (18) 50 (10) 40
Foreign operations - foreign currency translation differences 41,699 -- 41,699 25,182 -- 25,182
Net investment hedge (13,389) (13,389) (47,656) -- (47,656)
Cash flow hedges 334 -- 334 (185) (185)
Total 28,621 5 28,626 (22,609) (10) (22,619)

Global Ports Holding PLC and its Subsidiaries
Notes to the consolidated financial statements
46
10 Cash and cash equivalents
As at 31 December, cash and cash equivalents comprised the following:
2017
(USD ‘000)
2016
(USD ‘000)
Cash on hand 69 69
Cash at banks 99,379 44,241
- Demand deposits 19,285 13,820
- Time deposits 60,786 30,308
- Overnight deposits 19,308 113
Cash and cash equivalents 99,448 44,310
As at 31 December, maturities of time deposits comprised the following:
2017
(USD ‘000)
2016
(USD ‘000)
Up to 1 month 60,786 30,216
1-3 months -- 92
Total 60,786 30,308
As at 31 December, the ranges of interest rates for time deposits are as follows:
2017 2016
Interest rate for time deposit-TL (highest) 13.25% 6.75%
Interest rate for time deposit-TL (lowest) 10.25% 6.75%
Interest rate for time deposit-USD (highest) 2.50% 0.35%
Interest rate for time deposit-USD (lowest) 1.21% 0.35%
Interest rate for time deposit-EUR (highest) 0.15% 0.75%
Interest rate for time deposit-EUR (lowest) 0.15% 0.75%
As at 31 December 2017, cash at bank amounting to USD 7,583 thousand (31 December 2016: USD 5,954
thousand) is restricted due to the bank loan guarantees and subscription guarantees (Note 12).
The Group’s exposure to interest rate risk and sensitivity analysis for financial assets and liabilities is disclosed in
Note 17.

Global Ports Holding PLC and its Subsidiaries
Notes to the consolidated financial statements
47
11 Capital and reserves
a) Share capital
On 17 May 2017, immediately prior to the IPO, the Company became the parent company of the Group through
the acquisition of the full share capital of Global Liman İşletmeleri A.Ş., in exchange for 55,000,000 £5 shares in
the Company issued to the previous shareholders. As of this date, the Company’s share capital increased from £1
to £275,000 thousand (USD 354,805 thousand). From that point, in the consolidated financial statements, the share
capital became that of GPH PLC. The previously recognised share capital of USD 33,836 thousand and share
premium of USD 54,539 thousand was eliminated with merger reserves recognised of USD 266,430 thousand.
Also on 17 May 2017, the Group completed an IPO, achieving a standard listing on the London Stock Exchange.
During the listing, an additional 7,826,962 £5 shares were issued for net proceeds of USD 73,035 thousand, giving
additional share capital of USD 50,492 thousand and additional share premium of USD 22,543 thousand.
Following the IPO, the Company had 62,826,963, £5 ordinary shares in issuance.
As of 12 July 2017, The Company has performed a reduction of capital and cancellation of the share premium
account. The Court Order approving the Reduction of Capital has been registered with the Registrar of Companies
on 12 July 2017 and accordingly the Reduction of Capital has become effective. The nominal value of each of the
ordinary shares in the capital of GPH (the "GPH Shares") has been reduced from GBP 5.00 to GBP 0.01, whereas
the total equity of GPH remains unchanged, and the Reduction of Capital has created distributable reserves of
approximately GBP 332.3 million (USD 427.2 million) for GPH.
The Company's shares are ordinary voting shares. There are no preferential rights attached to any shares of the
Company.
The details of paid-in share capital as of 31 December are as follows:
Number of
shares
Share
capital
Share
Premium
‘000 USD’000 USD’000
Balance at 1 January 2016 74,307 33,836 54,539
Movements -- --
Balance at 31 December 2016 74,307 33,836 54,539
Group restructuring (19,307) 320,969 (54,539)
Issuance of shares on IPO 7,827 50,492 22,543
Share capital reduction -- (404,486) (22,543)
Balance at 31 December 2017 62,827 811 --
b) Nature and purpose of reserves (i) Translation reserves
The translation reserves amounting to USD 150,523 thousand (31 December 2016: USD 119,746 thousand) are
recognised as a separate account under equity and comprises foreign exchange differences arising from the
translation of the consolidated financial statements of subsidiaries and equity-accounted investees from their
functional currencies (of Euro and TL) to the presentation currency, USD.
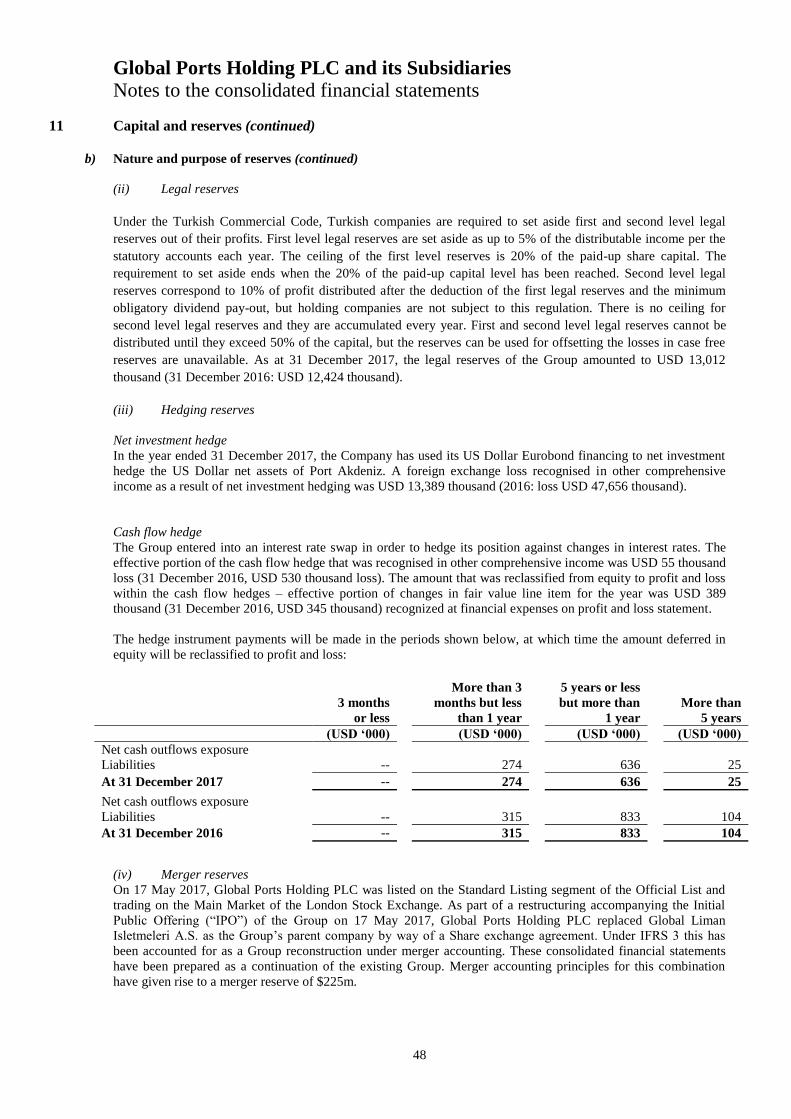
Global Ports Holding PLC and its Subsidiaries
Notes to the consolidated financial statements
48
11 Capital and reserves (continued)
b) Nature and purpose of reserves (continued)
(ii) Legal reserves
Under the Turkish Commercial Code, Turkish companies are required to set aside first and second level legal
reserves out of their profits. First level legal reserves are set aside as up to 5% of the distributable income per the
statutory accounts each year. The ceiling of the first level reserves is 20% of the paid-up share capital. The
requirement to set aside ends when the 20% of the paid-up capital level has been reached. Second level legal
reserves correspond to 10% of profit distributed after the deduction of the first legal reserves and the minimum
obligatory dividend pay-out, but holding companies are not subject to this regulation. There is no ceiling for
second level legal reserves and they are accumulated every year. First and second level legal reserves cannot be
distributed until they exceed 50% of the capital, but the reserves can be used for offsetting the losses in case free
reserves are unavailable. As at 31 December 2017, the legal reserves of the Group amounted to USD 13,012
thousand (31 December 2016: USD 12,424 thousand).
(iii) Hedging reserves
Net investment hedge
In the year ended 31 December 2017, the Company has used its US Dollar Eurobond financing to net investment
hedge the US Dollar net assets of Port Akdeniz. A foreign exchange loss recognised in other comprehensive
income as a result of net investment hedging was USD 13,389 thousand (2016: loss USD 47,656 thousand).
Cash flow hedge
The Group entered into an interest rate swap in order to hedge its position against changes in interest rates. The
effective portion of the cash flow hedge that was recognised in other comprehensive income was USD 55 thousand
loss (31 December 2016, USD 530 thousand loss). The amount that was reclassified from equity to profit and loss
within the cash flow hedges – effective portion of changes in fair value line item for the year was USD 389
thousand (31 December 2016, USD 345 thousand) recognized at financial expenses on profit and loss statement.
The hedge instrument payments will be made in the periods shown below, at which time the amount deferred in
equity will be reclassified to profit and loss:
More than 3
5 years or less
3 months
months but less
but more than
More than
or less
than 1 year
1 year
5 years
(USD ‘000) (USD ‘000) (USD ‘000) (USD ‘000)
Net cash outflows exposure
Liabilities -- 274 636 25
At 31 December 2017 -- 274 636 25
Net cash outflows exposure
Liabilities --
315
833
104
At 31 December 2016 --
315
833
104
(iv) Merger reserves
On 17 May 2017, Global Ports Holding PLC was listed on the Standard Listing segment of the Official List and
trading on the Main Market of the London Stock Exchange. As part of a restructuring accompanying the Initial
Public Offering (“IPO”) of the Group on 17 May 2017, Global Ports Holding PLC replaced Global Liman
Isletmeleri A.S. as the Group’s parent company by way of a Share exchange agreement. Under IFRS 3 this has
been accounted for as a Group reconstruction under merger accounting. These consolidated financial statements
have been prepared as a continuation of the existing Group. Merger accounting principles for this combination
have given rise to a merger reserve of $225m.

Global Ports Holding PLC and its Subsidiaries
Notes to the consolidated financial statements
49
11 Capital and reserves (continued)
c) Dividends Dividend distribution declarations are made by the Company in GBP and paid in USD in accordance with its
articles of association, after deducting taxes and setting aside the legal reserves as discussed above.
GPH PLC has proposed a 2017 final dividend of GBP 0.201per share to its shareholders, giving a proposed
distribution of GBP 12,667 thousand (USD 17,500 thousand). The final dividend is not recognised as a liability in
the financial statements until approved at the 2018 AGM.
GPH PLC proposed and paid a 2017 interim dividend of GBP 0.216 per share to its shareholders, giving a
distribution of GBP 13,570 thousand (USD 18,239 thousand).
The total dividends in respect of the year ended 31 December 2017 were USD 35,739 thousand.
Prior to the group restructuring, Global Liman İşletmeleri A.Ş. was the parent company of the group and in March
2017 it paid its 2016 final dividend to shareholders totalling USD 26,783 thousand.
The total dividends paid to shareholders in the year ended 31 December 2017 were USD 45,022 thousand.
In 2016 Global Liman İşletmeleri A.Ş paid dividends totalling USD 34,607 thousand to its shareholders.
Dividends to non-controlling interests totalled USD 1,063 in 2017 (2016: 3,010) and comprised a distribution of
USD 1,063 thousand (2016: USD 819 thousand) made to other shareholders by Valletta Cruise Port a distribution
of USD 1,063 thousand (2016: USD 2,191) was made by BPI to RCCL.
12 Loans and borrowings
As at 31 December, loans and borrowings comprised the following:
Current loans and borrowings
2017
(USD ‘000)
2016
(USD ‘000)
Current portion of Eurobond issued 18,556 18,662
Current bank loans 7,272 9,068
- TL Loans 47 1,397
- Foreign currency loans 7,225 7,671
Current portion of long term bank loans 17,571 13,711
- TL Loans 339 --
- Foreign currency loans 17,232 13,711
Finance lease obligations 1,479 1,541
Total 44,878 42,982
Non-current loans and borrowings
2017
(USD ‘000)
2016
(USD ‘000)
Non-current portion of Eurobonds issued 230,889 230,547
Non-current bank loans 64,038 62,845
- TL Loans 288 --
- Foreign currency loans 63,750 62,845
Finance lease obligations 1,915 2,915
Total 296,842 296,307
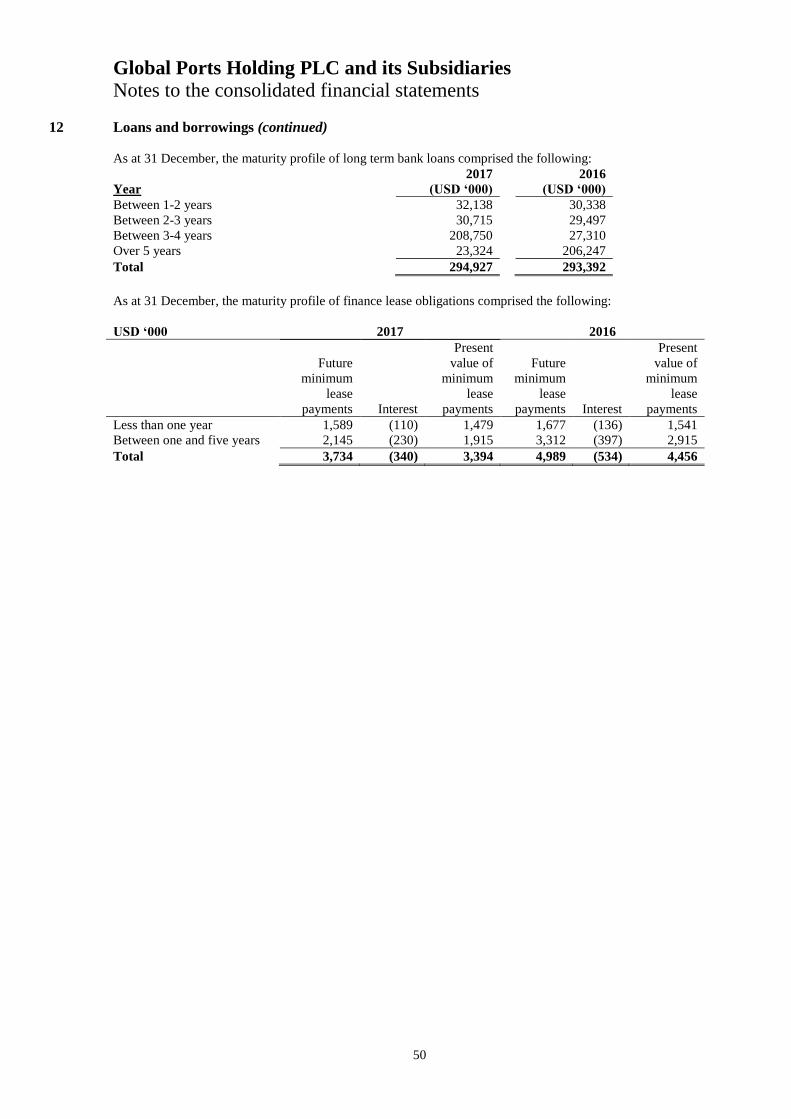
Global Ports Holding PLC and its Subsidiaries
Notes to the consolidated financial statements
50
12 Loans and borrowings (continued)
As at 31 December, the maturity profile of long term bank loans comprised the following:
Year
2017
(USD ‘000)
2016
(USD ‘000)
Between 1-2 years 32,138 30,338
Between 2-3 years 30,715 29,497
Between 3-4 years 208,750 27,310
Over 5 years 23,324 206,247
Total 294,927 293,392
As at 31 December, the maturity profile of finance lease obligations comprised the following:
USD ‘000 2017 2016
Future
minimum
lease
payments Interest
Present
value of
minimum
lease
payments
Future
minimum
lease
payments Interest
Present
value of
minimum
lease
payments
Less than one year 1,589 (110) 1,479 1,677 (136) 1,541
Between one and five years 2,145 (230) 1,915 3,312 (397) 2,915
Total 3,734 (340) 3,394 4,989 (534) 4,456

Global Ports Holding PLC and its Subsidiaries
Notes to the consolidated financial statements
51
12 Loans and borrowings (continued)
Details of the loans and borrowings as at 31 December 2017 are as follows:
As at 31 December 2017
Loans and borrowings type Company name Currency Maturity Interest type Interest rate % Principal Carrying value
Loans used to finance investments and projects
Unsecured Eurobonds (i) Global Liman USD 2021 Fixed 8.13 250,000 249,444 Secured Loan (ii) Barcelona Port Investments EUR 2023 Floating Euribor + 4.00 37,353 36,525
Secured Loan (iii) Malaga Cruise Port EUR 2025 Floating Euribor 3m + 1.75 6,477 6,378
Secured Loan (iv) Valetta Cruise Port EUR 2029 Floating Euribor + 3.00 10,807 10,600 Secured Loan (vii) Global BV EUR 2020 Floating Euribor + 4.60 17,538 17,515
Secured Loan Cagliari Cruise Port EUR 2026 Fixed 2.75 613 613
Secured Loan Ortadoğu Liman USD 2019 Fixed 4.40 186 186 Secured Loan Ortadoğu Liman USD 2018 Fixed 4.56 46 46
Secured Loan Ortadoğu Liman USD 2019 Fixed 8.20 784 784
323,804 322,091
Loans used to finance working capital
Unsecured Loan Ege Liman USD 2018 Fixed 5.90% 2,900 3,036
Unsecured Loan Ege Liman USD 2018 Fixed 4.50% 422 422
Unsecured Loan Ege Liman TL 2018 Fixed 15.39% 25 25 Unsecured Loan Ege Liman TL 2020 Fixed 15.84% 532 551
Secured Loan Ege Liman TL 2018 Fixed 16.77% 50 51
Secured Loan Ortadoğu Liman EUR 2022 Fixed 5.75% 5,471 5,516 Unsecured Loan Ortadoğu Liman USD 2018 Fixed 5.93% 3,707 3,768
Unsecured Loan Bodrum Liman TL 2018 Fixed 16.56% 72 47
Secured Loan Barcelona Cruise Port EUR 2024 Floating EURIBOR + 4.00 2,872 2,819
16,051 16,235
Finance lease obligations
Leasing (ix) Ortadoğu Liman USD 2019 Fixed 7.35% 12 12
Leasing (x) Ortadoğu Liman USD 2020 Fixed 7.35% 853 853 Leasing Ortadoğu Liman USD 2018 Fixed 7.35% 1 1
Leasing Ortadoğu Liman USD 2019 Fixed 7.35% 141 141
Leasing Ortadoğu Liman USD 2019 Fixed 7.35% 60 60 Leasing Cagliari Cruise Port EUR 2021 Fixed 1.96% 92 92
Leasing (ii) Ege Liman EUR 2020 Fixed 7.75% 1,889 1,889
Leasing Ege Liman USD 2018 Fixed 6.00% 12 12
Leasing Ege Liman USD 2020 Fixed 5.50% 334 334
3,394 3,394
343,249 341,720

Global Ports Holding PLC and its Subsidiaries
Notes to the consolidated financial statements
52
12 Loans and borrowings (continued)
Details of the loans and borrowings as at 31 December 2016 are as follows:
As at 31 December 2016
Loans and borrowings type Company name Currency Maturity Interest type Interest rate % Principal Carrying value
Loans used to finance investments and projects
Unsecured Eurobonds (i) Global Liman USD 2021 Fixed 8.13 250,000 249,210 Secured Loan (ii) Barcelona Port Investments EUR 2023 Floating Euribor + 4.00 37,603 36,644
Secured Loan (iii) Malaga Cruise Port EUR 2025 Floating Euribor 3m + 1.75 6,376 6,307
Secured Loan (iv) Valetta Cruise Port EUR 2029 Floating Euribor + 3.00 9,389 9,614 Secured Loan (vii) Global BV EUR 2020 Floating Euribor + 4.60 20,609 20,546
Secured Loan Cagliari Cruise Port EUR 2026 Fixed 2.75 604 604
Secured Loan Ortadoğu Liman USD 2016 Fixed 4.40 125 125 Secured Loan Port of Adria EUR 2017 Fixed 5.00 796 796
Secured Loan Port of Adria EUR 2017 Fixed 8.20 135 135
325,637 323,981
Loans used to finance working capital
Unsecured Loan Ege Liman USD 2017 Fixed 4.50 2,000 2,000
Unsecured Loan Ege Liman TL 2017 Fixed 15.60 200 200
Unsecured Loan Ege Liman USD 2017 Fixed 4.50 875 875 Unsecured Loan Ege Liman USD 2017 Fixed 4.95 900 900
Unsecured Loan Ege Liman TL 2017 Fixed 15.60 55 55
Unsecured Loan Ortadoğu Liman USD 2017 Fixed 4.95 3,100 3,100 Unsecured Loan Ortadoğu Liman TL 2017 Fixed 13.00 375 377
Unsecured Loan Bodrum Liman TL 2017 Fixed 15.60 509 509
Unsecured Loan Global Liman TL 2017 Fixed 13.00 256 256 Secured Loan (ii) Barcelona Cruise Port EUR 2024 Floating Euribor + 4.00 2,529 2,474
Secured Loan Port of Adria EUR 2017 Fixed 8.00 107 106
10,906 10,852
Finance lease obligations
Leasing (v) Ortadoğu Liman USD 2020 Fixed 7.35 1,150 1,150
Leasing Ortadoğu Liman USD 2019 Fixed 7.35 231 231
Leasing Ortadoğu Liman USD 2018 Fixed 7.35 108 108 Leasing Ortadoğu Liman USD 2017 Fixed 7.35 96 96
Leasing Ortadoğu Liman USD 2019 Fixed 5.75 40 40
Leasing Ortadoğu Liman USD 2019 Fixed 7.35 19 19
Leasing (vi) Ege Liman EUR 2020 Fixed 7.75 2,236 2,236
Leasing Ege Liman USD 2020 Fixed 5.50 480 480
Leasing Ege Liman USD 2017 Fixed 6.50 26 26 Leasing Ege Liman USD 2018 Fixed 6.00 46 46
Leasing Ege Liman USD 2017 Fixed 5.75 10 10
Leasing Ege Liman USD 2017 Fixed 6.00 14 14
4,456 4,456
340,999 339,289
Global Ports Holding PLC and its Subsidiaries
Notes to the consolidated financial statements
53
12 Loans and borrowings (continued)
Detailed information relating to significant loans undertaken by the Group is as follows:
(i) The sales process of the Eurobond issuances amounting to USD 250 million with 7 years of maturity, and
8.125% coupon rate based on 8.250% reoffer yield was completed on 14 November 2014. Coupon
repayment was made semi-annually. The bonds are now quoted on the Irish Stock Exchange.
Eurobonds contain the following covenants:
If a concession termination event occurs at any time, Global Liman (the “Issuer”) must offer to
repurchase all of the notes pursuant to the terms set forth in the indenture (a “Concession Termination
Event Offer”). In the Concession Termination Event Offer, the Issuer will offer a “Concession
Termination Event Payment” in cash equal to 100% of the aggregate principal amount of notes
repurchased, in addition to accrued and unpaid interest and additional amounts, if any, on the notes
repurchased, to the date of purchase (the “Concession Termination Event Payment Date”), subject to the
rights of holders of notes on the relevant record date to receive interest due on the relevant interest
payment date.
The consolidated leverage ratio may not exceed 5.0 to 1. Excluding the consolidated leverage ratio
breach, the Issuer and all its subsidiaries except Malaga Cruise Port and Lisbon Cruise Port (“Restricted
Subsidiary”) will be entitled to incur any or all of the following indebtedness:
o Indebtedness incurred by the Issuer, Ege Ports (“Guarantor”) or Ortadoğu Liman (“Guarantor”)
pursuant to one or more credit facilities in an aggregate principal amount outstanding at any time
not exceeding USD 5 million;
o Purchase money indebtedness incurred to finance the acquisition by, the Issuer or a Restricted
Subsidiary, of assets in the ordinary course of business in an aggregate principal amount which,
when added together with the amount of indebtedness incurred and then outstanding, does not
exceed USD 10 million;
o Any additional indebtedness of the Issuer or any Guarantor (other than and in addition to
indebtedness permitted above) and Port of Adria indebtedness, provided, however, that the
aggregate principal amount of Indebtedness outstanding at any time of this clause does not exceed
USD 20 million; and provided further, that more than 50% in aggregate principal amount of any
Port of Adria indebtedness incurred pursuant to this clause is borrowed from the International
Finance Corporation and/or the European Bank for Reconstruction and Development.
(ii) On 30 September 2014, BPI and Creuers entered into a syndicated loan amounting to Euro 60.25 million.
Tranche A of this loan, amounting to Euro 54 million, is paid semi-annually, at the end of June and
December, with the last payment being in 2023. Tranche B has already been repaid for
Euro 3.85 millionas of 10 October 2014. Tranche C amounting to Euro 2.4 millionhas a bullet payment in
2024. The interest rate of this loan is Euribor 6m + 4.00%. The syndicated loan is subject to a number of
financial ratios and restrictions, breach of which could lead to early repayment being requested. Under
this loan, in the event of default, the shares of BPI and Creuers are pledged together with certain rights of
these companies. The agreement includes terms about certain limitations on dividends payments, new
investments, and change in the control of the companies, change of the business, new loans and disposal
of assets.
(iii) On 12 January 2010, Cruceros Málaga, S.A. entered into a loan agreement with Unicaja regarding a Euro
9 million loan to finance the construction of the new terminal. This loan had an 18-month grace period. It
is linked to Euribor and has a term of 180 months from the agreement execution date. Therefore, the
maturity date of the loan is on 12 January 2025. A mortgage has been taken out on the administrative
concession agreement to guarantee repayment of the loan principal and accrued interest thereon.
(iv) VCP bank loans and overdraft facilities bear interest at 3.90% - 4.15% (31 December 2016: 3.90% -
4.15%) per annum and are secured by a mortgage over VCP’s present and future assets, together with a
mortgage over specific property within the concession site for a period of 65 years commencing on 21
November 2001.
Global Ports Holding PLC and its Subsidiaries
Notes to the consolidated financial statements
54
12 Loans and borrowings (continued)
(v) Global Ports Europe BV entered into a loan amounting to Euro 22 million in total on
16 November 2015 with a 6-year maturity, 12 months grace period and an interest rate of Euribor +
4.60%. Principal and interest is payale bi-annually, in May and November of each year. Under this loan
agreement, in the event of default, the shares of Global Ports Europe BV are pledged in accordance with a
share pledge agreement.
(vi) On 12 June 2014, Ortadoğu Liman s signed a finance lease agreement for a port tugboat with an interest
rate of 7.35% and maturity date of 16 July 2020.
(vii) On June 2014, Ege Liman signed a finance lease agreement for a port tugboat with an interest rate of
7.75% and maturity date in 2020.
13 Provisions
Non-current
As at
31 December
2017
(USD ‘000)
As at
31 December
2016
(USD ‘000)
Replacement provisions for Creuers (*) 17,918 13,488
Port of Adria Concession fee provision (**) 1,496 1,077
Italian Ports Concession fee provisions(***) 1,667 1,980
Total 21,081 16,545
(*) As part of the concession agreement between Creuers and the Barcelona and Malaga Port Authorities entered in 2013,
the company has an obligation to maintain the port equipment in good operating condition throughout its operating
period, and in addition return the port equipment to the Port Authorities in a specific condition at the end of the
agreement. Therefore, replacement provisions have been recognised based on Management’s best estimate of the
potential capital expenditure required to be incurred in order to replace the port equipment assets in order to meet this
requirement.
(**) On 27 December 2013, the Government of Montenegro and Container Terminal and General Cargo JSC-Bar ("CTGC")
entered into an agreement regarding the operating concession for the Port of Adria-Bar which terminates on 27
December 2043. From the fourth year of the agreement, CTGC had an obligation to pay a concession fee to the
Government of Montenegro of Euro 500,000 per year until the end of the agreement. The expense relating to this
concession agreement is recognized on a straight-line basis over the concession period, giving rise to an accrual in the
earlier years.
(***) On 16 December 2009, Ravenna Port Authority and Ravenna Passenger Terminal S.r.l. ("RTP") entered into an
agreement regarding the operating concession for the Ravenna Passenger Terminal which terminates on 27 December
2019. RTP had an obligation to pay a concession fee to the Port Authority of Euro 86,375 per year until end of
concession. The expense relating to this concession agreement is recognized on a straight-line basis over the concession
period, giving rise to an accrual in the earlier years.
On 13 June 2011, Catania Port Authority and Catania Cruise Terminal S.r.l. ("CCT") entered into an agreement
regarding the operating concession for the Catania Passenger Terminal which terminates on 12 June 2026. CCT had an
obligation to pay a concession fee to the Catania Port Authority of Euro 135,000 per year until end of concession. The
expense relating to this concession agreement is recognized on a straight-line basis over the concession period, giving
rise to an accrual in the earlier years.
On 14 January 2013, Cagliari Cruise Port (“CCP”) and Cagliari Port Authority entered into an agreement regarding the
operating concession for the Cagliari Cruise Terminal which terminates on 13 January 2027. CCP had an obligation to
pay a concession fee to the Cagliari Port Authority of Euro 44,315.74 per year until end of concession. The expense
relating to this concession agreement is recognized on a straight-line basis over the concession period, giving rise to an
accrual in the earlier years.
Global Ports Holding PLC and its Subsidiaries
Notes to the consolidated financial statements
55
13 Provisions (continued)
Current
As at
31 December
2017
(USD ‘000)
As at
31 December
2016
(USD ‘000)
Other 1,202 1,492
Total 1,202 1,492
For the years ended 31 December, the movements of the provisions as below:
2017
(USD ‘000)
2016
(USD ‘000)
Balance at 1 January 18,036 14,590
Assumed in business combination (Note 3) -- 1,980
Provisions made during the year 2,512 3,211
Provisions used during the year (1,237) (1,524)
Unwinding of provisions during the year 591 528
Currency translation difference 2,381 (748)
Balance at 31 December 22,283 18,037
Non-current 21,081 16,545
Current 1,202 1,492
22,283 18,037
14 Earnings per share
The Group presents basic earnings per share (“basic EPS”) data for its ordinary shares. Basic EPS is calculated by
dividing the profit or loss attributable to ordinary shareholders of the Company by the weighted average number of
ordinary shares outstanding during the period, less own shares acquired. In accordance with IAS 33, the
comparative weighted average number of shares was restated to apply the number of shares which arose from the
group reconstructing described in Note 11.
The Group does not present separate diluted earnings per share (“diluted EPS”) data, because there are no potential
convertible dilutive securities or options.
Earnings per share is calculated by dividing the profit attributable to ordinary shareholders, by the weighted
average number of shares outstanding.
2017
(USD ‘000)
2016
(USD ‘000)
Profit attributable to owners of the Company (15,576) 2,338
Weighted average number of shares 59,889,171 55,000,000
Basic and diluted (loss) / earnings per share with par
value of GBP 0.01 (cents per share) (26.01)
4.25

Global Ports Holding PLC and its Subsidiaries
Notes to the consolidated financial statements
56
15 Commitment and contingencies
a) Litigation
There are pending lawsuits that have been filed against or by the Group. Management of the Group assesses the
possible results and financial effects of these lawsuits at the end of each period and as a result of these
assessments, the required provisions are recognised for the possible expenses and liabilities. The total provision
amount that has been recognised as at 31 December 2017 is USD 315 thousand (31 December 2016: USD 698
thousand).
The information related to the significant lawsuits that the Group is directly or indirectly a party to, is outlined
below:
Legal proceedings in relation to Ortadoğu Antalya, Ege Liman and Bodrum Liman's applications for extension
of their concession rights
On 6 June 2013, the Turkish Constitutional Court partially annulled a law that prevented operators of privatised
facilities from applying to extend their operating term. The respective Group companies then applied to extend the
concession terms of Port Akdeniz-Antalya, Ege Ports-Kuşadası and Bodrum Cruise Port to give each concession a
total term of 49 years from original grant date. After these applications were rejected, the respective Group
companies filed lawsuits with administrative courts challenging the decisions.
Port Akdeniz-Antalya filed lawsuits against Privatization Administration and the General Directorate of Turkey
Maritime Organization requesting cancellation with respect to rejection of the extension applications. The Court
dismissed the case and the Group lawyers appealed such decision of the Court. The appeal is pending before the
Council of State.
Ege Ports-Kuşadası filed lawsuits against Privatization Administration and General Directorate of Turkey
Maritime Organization requesting cancellation with respect to rejection of the extension applications. Both
authorities filed their defenses and Ege Ports-Kuşadası submitted its reply to the defenses in due time. The Court
dismissed the case and the Group lawyers appealed such decision of the Court. The Council of State reversed the
lower courts' judgement in favor of Ege Ports-Kuşadası. The Privatization Administration applied to the Council
of State for reversal of this judgement and the case is still pending.
Bodrum Cruise Port filed a lawsuit against (i) Ministry of Finance General Directorate of National Estate, (ii) the
District Governorship of Bodrum and (iii) the Ministry of Transportation, Maritime Affairs and Communication
requesting cancellation with respect to rejection of the extension applications. Bodrum Cruise Port’s objection was
approved by the court and rejection decision of the Ministry of Transportation, Maritime Affairs and
Communication had been cancelled in favor of Bodrum Cruise Port. The Ministry’s appeal has been overruled and
first instance court judgement has been affirmed by the Council of State. The Ministry has applied for the
rectification of the decision.
Other legal proceedings
The Port of Adria-Bar (Montenegro) was party to a collective bargaining agreement with a union representing
workers in a range of functions that expired in 2010, before the Port of Adria-Bar was acquired by the Group.
However, a number of lawsuits have been brought in connection to this collective bargaining agreement seeking
(i) unpaid wages for periods before the handover of the Port to the Group (from 2011 to 2014), and (ii) alleged
underpaid wages as of the start of 2014. In April 2017, the Supreme Court ruled that the collective bargaining
agreement is not valid. Although various cases remain pending before lower courts, this judgment establishes a
precedent that would apply to the remaining pending cases before the lower courts. Accordingly, Management
believes that the pending cases will be decided in favour of the Group.

Global Ports Holding PLC and its Subsidiaries
Notes to the consolidated financial statements
57
15 Commitment and contingencies (continued)
a) Guarantees
As at 31 December, the letters of guarantee given comprised the following:
Letters of guarantee 2017
(USD ‘000)
2016
(USD ‘000)
Given to seller for the call option on APVS shares (*) 5,835 5,138
Given to Privatisation Administration / Port Authority 2,238 4,047
Given to Electricity Distribution Companies 8 8
Given to courts 6 64
Others 15 520
Total letters of guarantee 8,102 9,777
(*) Venetto Sviluppo, the 51% shareholder of APVS, which in turn owns a 53% stake in Venezia Terminal
Passegeri S.p.A (VTP), has a put option to sell its shares in APVS partially or completely (up to 51%) to Venezia
Investimenti (VI). This option can be exercised between 15th May 2017 and 15th November 2018. If VS exercises
the put option completely, VI will own 99% of APVS and accordingly 71.51% of VTP. The Group has given a
guarantee letter for its portion of 25% in VI, which in turn has given the full amount of call option as guarantee
letter to VS.
Other collaterals are disclosed in Note 12.
b) Contractual obligations
Ege Liman
The details of the TOORA dated 2 July 2003, executed by and between Ege Liman and OIB together with TDI are
stated below:
The agreement allows Ege Liman to operate Ege Ports-Kuşadası for a term of 30 years for a total consideration of
USD 24.3 million which has already been paid. Ege Liman's operation rights extend to port facilities,
infrastructure and facilities which are either owned by the State or were used by TDI for operating the port, as well
as the duty-free stores leased by the TDI. Ege Liman is entitled to construct and operate new stores in the port area
with the written consent of the TDI.
Ege Liman is able to determine tariffs for Ege Ports- Kuşadası's port services at its own discretion without TDI's
approval (apart from the tariffs for services provided to Turkish military ships).
The TOORA requires that the foreign ownership or voting rights in Ege Liman do not exceed 49%. Pursuant to the
terms of the TOORA, the TDI is entitled to hold one share in Ege Liman and to nominate one of Ege Ports-
Kuşadası's board members. Global Liman appoints the remaining board members and otherwise controls all
operational decisions associated with the port. Ege Ports-Kuşadası does not have the right to transfer its operating
rights to a third party.
Ortadoğu Liman
The details of the TOORA dated 31 August 1998, executed by and between Ortadoğu Liman and OIB together
with TDI are stated below:
Ortadoğu Liman will be performing services such as sheltering, installing, charging, discharging, shifting, terminal
services, pilotage, towing, moorings, water quenching, waste reception, operating, maintaining and repairing of
cruise terminals, in Antalya Port for an operational period of 30 years. Ortadoğu Liman is liable for the
maintenance of Antalya Port together with the port equipment in good repair and in operating condition
throughout its operating right period. After the expiry of the contractual period, the real estate and the integral
parts of it shall be surrendered to the TDI, while the movable properties stay with Ortadoğu Liman. Ortadoğu
Liman is able to determine tariffs for Port Akdeniz-Antalya's port services at its own discretion without being
subject to TDI's approval (apart from the tariffs for services provided to Turkish military ships).

Global Ports Holding PLC and its Subsidiaries
Notes to the consolidated financial statements
58
15 Commitment and contingencies (continued)
c) Contractual obligations (continued)
Ortadoğu Liman (continued)
The TOORA requires that foreign ownership or voting rights in Ortadoğu Liman do not exceed 49%. Pursuant to
the terms of the TOORA, the TDI is entitled to hold one share in Ortadoğu Liman. The TDI can also appoint one
of Ortadoğu Liman's board members. Ortadoğu Liman cannot transfer its operating rights to a third party without
the prior approval of the TDI.
Bodrum Liman The details of the BOT Agreement dated 23 June 2004, executed by and between Bodrum Liman and the DLH are
stated below:
Bodrum Liman had to construct the Bodrum Cruise Port in a period of 1 year and 4 months following the delivery
of the land and thereafter, will operate the Bodrum Cruise Port for 12 years. The final acceptance of the
construction was performed on 4 December 2007, and thus the operation period has commenced.
Bodrum Liman also executed a Concession Agreement with the General Directorate of National Property on 18
July 2006 ("Bodrum Port Concession Agreement"). The BOT Agreement is attached to the Bodrum Port
Concession Agreement and Bodrum Liman is entitled to use the Bodrum Cruise Port under these agreements. The
BOT Agreement permits Bodrum Liman to determine tariffs for Bodrum Cruise Port's port services at its own
discretion, provided that it complies with applicable legislation, such as applicable maritime laws and competition
laws.
For the first year of operation, Bodrum Liman was required to pay the Directorate General for Infrastructure
Investments a land utilisation fee of USD 125 thousand. This fee increases by 3% in US Dollar terms each year.
Port of Adria
The details of the TOORA Contract dated 15 November 2013, executed by and between Global Liman and the
Government of Montenegro and Container Terminal and General Cargo JSC-Bar ("CTGC") are stated below:
Global Liman will be performing services such as repair, financing, operation, maintenance in the Port of Adria
for an operational period of 30 years (terminating in 2043).
CTGC has an obligation to pay to the Government of Montenegro (a) a fixed concession fee in the amount of Euro
500,000 per year; (b) a variable concession fee in the amount of Euro 5 per twenty-foot equivalent (“TEU”) (full
and empty) handled over the quay (ship-to-shore and shore-to-ship container handling), no fees are charged for the
movement of the containers; (c) a variable concession fee in the amount of Euro 0.20 per ton of general cargo
handled over the quay (ship-to-shore and shore-to-ship general cargo handling). However, pursuant to
Montenegrin Law on Concessions, as an aid to the investor for investing in a port of national interest, the
concession fee was set in the amount of Euro 1 for the period of three years starting from the effective date of the
TOORA Contract. Tariffs for services are regulated pursuant to the terms of the concession agreement with the
Montenegro port authority, where the maximum rates are subject to adjustments for inflation.
For the first three years of the agreement, CTGC had to implement certain investment and social programmes
outlined in the agreement and had to commit Euro 13.6 million towards capital expenditure during that period.
This includes launching and investing Euro 6.5 million in certain social programmes at Port of Adria Bar such as
retrenching employees, the establishment of a successful management trainee programme, and subsidising
employees to attend training and acquire additional qualifications, as well as the provision of English lessons to
employees.
Global Liman is liable for the maintenance of the Port of Adria together with the port equipment in good repair
and in operating condition throughout its operating right period. After the expiry of the contractual period, the real
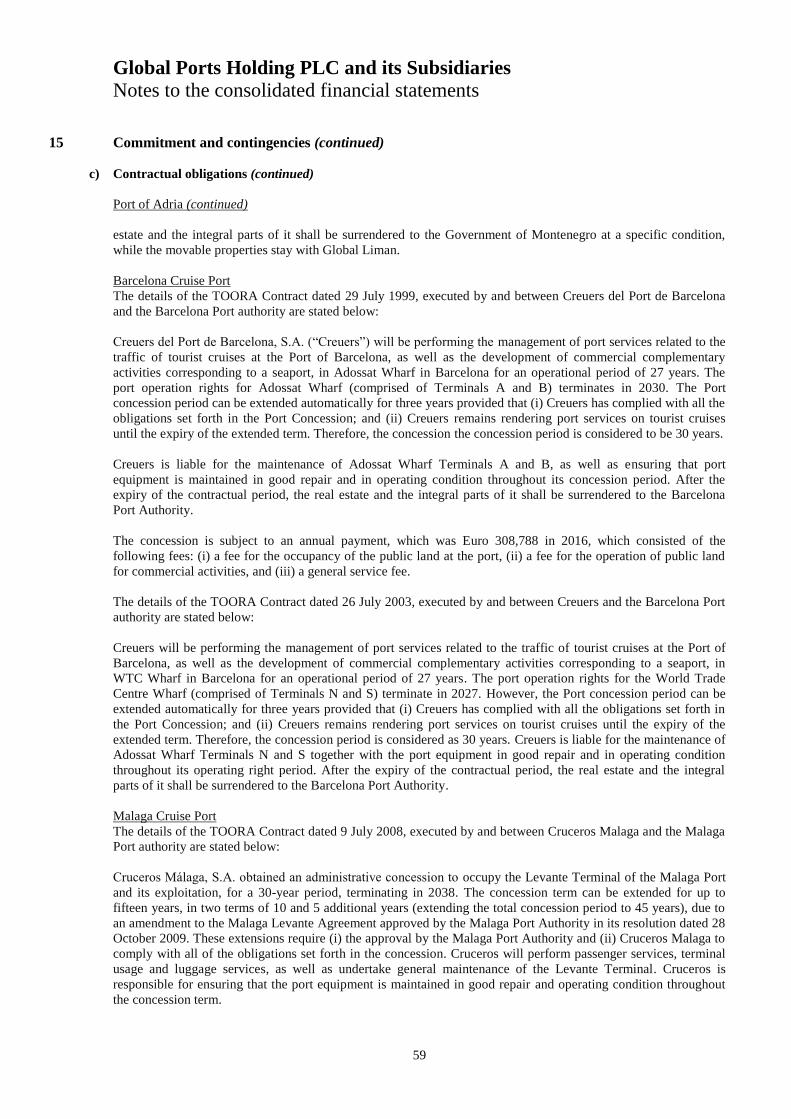
Global Ports Holding PLC and its Subsidiaries
Notes to the consolidated financial statements
59
15 Commitment and contingencies (continued)
c) Contractual obligations (continued)
Port of Adria (continued)
estate and the integral parts of it shall be surrendered to the Government of Montenegro at a specific condition,
while the movable properties stay with Global Liman.
Barcelona Cruise Port
The details of the TOORA Contract dated 29 July 1999, executed by and between Creuers del Port de Barcelona
and the Barcelona Port authority are stated below:
Creuers del Port de Barcelona, S.A. (“Creuers”) will be performing the management of port services related to the
traffic of tourist cruises at the Port of Barcelona, as well as the development of commercial complementary
activities corresponding to a seaport, in Adossat Wharf in Barcelona for an operational period of 27 years. The
port operation rights for Adossat Wharf (comprised of Terminals A and B) terminates in 2030. The Port
concession period can be extended automatically for three years provided that (i) Creuers has complied with all the
obligations set forth in the Port Concession; and (ii) Creuers remains rendering port services on tourist cruises
until the expiry of the extended term. Therefore, the concession the concession period is considered to be 30 years.
Creuers is liable for the maintenance of Adossat Wharf Terminals A and B, as well as ensuring that port
equipment is maintained in good repair and in operating condition throughout its concession period. After the
expiry of the contractual period, the real estate and the integral parts of it shall be surrendered to the Barcelona
Port Authority.
The concession is subject to an annual payment, which was Euro 308,788 in 2016, which consisted of the
following fees: (i) a fee for the occupancy of the public land at the port, (ii) a fee for the operation of public land
for commercial activities, and (iii) a general service fee.
The details of the TOORA Contract dated 26 July 2003, executed by and between Creuers and the Barcelona Port
authority are stated below:
Creuers will be performing the management of port services related to the traffic of tourist cruises at the Port of
Barcelona, as well as the development of commercial complementary activities corresponding to a seaport, in
WTC Wharf in Barcelona for an operational period of 27 years. The port operation rights for the World Trade
Centre Wharf (comprised of Terminals N and S) terminate in 2027. However, the Port concession period can be
extended automatically for three years provided that (i) Creuers has complied with all the obligations set forth in
the Port Concession; and (ii) Creuers remains rendering port services on tourist cruises until the expiry of the
extended term. Therefore, the concession period is considered as 30 years. Creuers is liable for the maintenance of
Adossat Wharf Terminals N and S together with the port equipment in good repair and in operating condition
throughout its operating right period. After the expiry of the contractual period, the real estate and the integral
parts of it shall be surrendered to the Barcelona Port Authority.
Malaga Cruise Port
The details of the TOORA Contract dated 9 July 2008, executed by and between Cruceros Malaga and the Malaga
Port authority are stated below:
Cruceros Málaga, S.A. obtained an administrative concession to occupy the Levante Terminal of the Malaga Port
and its exploitation, for a 30-year period, terminating in 2038. The concession term can be extended for up to
fifteen years, in two terms of 10 and 5 additional years (extending the total concession period to 45 years), due to
an amendment to the Malaga Levante Agreement approved by the Malaga Port Authority in its resolution dated 28
October 2009. These extensions require (i) the approval by the Malaga Port Authority and (ii) Cruceros Malaga to
comply with all of the obligations set forth in the concession. Cruceros will perform passenger services, terminal
usage and luggage services, as well as undertake general maintenance of the Levante Terminal. Cruceros is
responsible for ensuring that the port equipment is maintained in good repair and operating condition throughout
the concession term.

Global Ports Holding PLC and its Subsidiaries
Notes to the consolidated financial statements
60
15 Commitments and contingencies (continued)
c) Contractual obligations (continued)
Malaga Cruise Port (continued)
The concession is subject to an annual payment, which was Euro 509,000 in 2016, which consisted of the
following fees: (i) a fee for the occupancy of the public land at the port, and (ii) a fee for the operation of public
land for commercial activities.
The details of the TOORA Contract dated 11 December 2011, executed by and between Cruceros Malaga and the
Malaga Port authority are stated below:
Cruceros Málaga, S.A. obtained an administrative concession to occupy El Palmeral Terminal of the Malaga Port
and its exploitation, for a 30-year period, terminating in 2042. Cruceros will perform passenger services, terminal
usage and luggage services, as well as undertake general maintenance of the El Palmeral Terminal. Cruceros is
responsible for ensuring that the port equipment is maintained in good repair and operating condition throughout
the concession term.
The concession is subject to an annual payment, which was Euro 154,897 in 2016, which consisted of the
following fees: (i) a fee for the occupancy of the public land at the port, and (ii) a fee for the operation of public
land for commercial activities.
Valletta Cruise Port
On 22 November 2001, VCP signed a deed with the Government of Malta by virtue of which the Government
granted a 65-year concession over the buildings and lands situated in Floriana, which has an area of 46,197square
metres (“sqm”). VCP will perform operation and management of a cruise liner passenger terminal and an
international ferry passenger terminal together with complementary leisure facilities. The area transferred is used
as follows: retail 6,854sqm, office 4,833sqm, terminal 21,145sqm and potential buildings 13,365sqm.
A ground rent is payable by Valletta Cruise Port to the Government of Malta in the sum of Euro 734,848 per
annum. At the end of each 12 months period, VCP is required pay to the Government of Malta (a) 15% of all
revenue deriving from the letting of any buildings or facilities on the concession site for that 12 month period, and
(b) 10% of revenue deriving from passenger and cruise liner operations, subject to the deduction of direct costs
and services from the revenue upon which 10% fee is payable.
Ravenna Passenger Terminal
On 19 December 2009, Ravenna Passenger Terminal (“RTP”) signed a deed with the Ravenna Port Authority by
virtue of which the Port Authority granted a 10-year concession over the passenger terminal area situated within
Ravenna Port. RTP will perform operation and management of a cruise passenger terminal in the area.
A fixed rent is payable by RTP to the Port Authority in the sum of Euro 895,541.67 during the concession period.
The repayment of the total amount is presented as Euro 3,000 for the year 2009, Euro 28,791.67 for the year 2010
and the remaining Euro 863,750 overall for the years 2011 to 2020.
Catania Cruise Terminal
On 18 October 2011, Catania Cruise Terminal SRL (“CCT”) signed a deed with the Catania Port Authority by
virtue of which the Port Authority granted a 15-year concession over the passenger terminal area situated on
Catania City Center. CCT will perform operation and management of a cruise passenger terminal in the area.
A fixed rent is payable by CCT to the Port Authority in the sum of Euro 135,000.00 for each year during the
concession period.
Cagliari Cruise Terminal
On 14 January 2013, Cagliari Cruise Port (“CCP”) signed a deed with the Cagliari Port Authority by virtue of
which the Port Authority granted a 15-year concession over the passenger terminal area situated within Cagliari
Port. CCT will perform operation and management of a cruise passenger terminal in the area.

Global Ports Holding PLC and its Subsidiaries
Notes to the consolidated financial statements
61
A fixed rent is payable by CCP to the Port Authority in the sum of Euro 44,315.74 for each year during the
concession period.
15 Commitments and contingencies (continued)
d) Operating leases
Lease as lessee
The Group entered into various operating lease agreements. Operating lease rentals are payable as follows:
As at
31 December 2017
As at
31 December 2016
(USD ‘000) (USD ‘000)
Less than one year 3,187 2,798
Between one and five years 12,545 10,686
More than five years 139,510 109,003
155,242 122,487
In the periods presented, the Group's main operating lease arrangements as lessee are the port rent agreement of
Valletta Cruise Port until 2066, Port of Adria until 2043 and Bodrum Liman until 2019.
For the year ended 31 December 2017 payments recognised as rent expense were USD 4,765 thousand (31
December 2016: USD 3,710 thousand) in the consolidated income statement and other comprehensive income.
Lease as lessor
The future lease receipts or future lease receivables under operating leases are as follows:
As at
31 December 2017
As at
31 December 2016
(USD ‘000) (USD ‘000)
Less than one year 2,326 4,327
Between one and five years 8,569 8,013
More than five years 4,753 5,592
15,648 17,932
The Group's main operating lease arrangements as lessor are a marina lease agreement of
Ortadoğu Liman until 2028, and various shopping center rent agreements of Ege Liman and Bodrum Liman of up
to 5 years.
During the year ended 31 December 2017, USD 12,669 thousand (31 December 2016: USD 14,611 thousand) was
recognised as rental income in the consolidated income statement and other comprehensive income.
Additional lease arrangements were identified in the current year and the comparative information has been
restated.

Global Ports Holding PLC and its Subsidiaries
Notes to the consolidated financial statements
62
16 Related parties
The related parties of the Group which are disclosed in this note comprised the following:
Related parties Relationship
Mehmet Kutman Shareholder of Parent company
Global Yatırım Holding Parent company and ultimate controlling party
Global Sigorta Aracılık Hizmetleri A.Ş. ("Global Sigorta") Parent company’s subsidiary
IEG Kurumsal Finansal Danışmanlık A.Ş. Parent company’s subsidiary
Global Menkul Değerler A.Ş. ("Global Menkul") Parent company’s subsidiary
Adonia Shipping Parent company’s subsidiary
Naturel Gaz Parent company’s subsidiary
All related party transactions between the Company and its subsidiaries have been eliminated on consolidation,
and are therefore not disclosed in this note.
Due from related parties
As at 31 December, current receivables from related parties comprised the following:
Current receivables from related parties
2017
(USD ‘000)
2016
(USD ‘000)
Global Yatırım Holding 307 29,058
Adonia Shipping (*) 1,030 1,066
Naturel Gaz (*) 74 69
Mehmet Kutman 24 26
Others 164 1,282
Total 1,599 31,501
(*) These amounts are related with the work advances. The charged interest rate is 9,75% as at
31 December 2017 (31 December 2016: 10.50%). In addition, the group holds bonds issued by Global
Yatirim holding with a carrying value of 14,209 (2016 14,412).
Due to related parties
As at 31 December, current payables to related parties comprised the following:
Current payables to related parties
2017
(USD ‘000)
2016
(USD ‘000)
Mehmet Kutman 191 204
Global Sigorta (*) 244 356
Global Menkul (*) 1 21
EBRD 13 --
Other 34 --
Total 483 581
(*) These amounts are related to professional services taken. The charged interest rate is 8,50% as at 31
December 2017 (31 December 2016: 10.50%).

Global Ports Holding PLC and its Subsidiaries
Notes to the consolidated financial statements
63
16 Related parties (continued)
Transactions with related parties
For the years ended 31 December, transactions with other related parties comprised the following:
USD ‘000 2017 2016
Interest
Other
Interest
Other received received
Global Yatırım Holding 1,490 -- 2,819 --
Adonia Shipping -- -- -- 5
Total 1,490 -- 2,819 5
USD ‘000 2017 2016
Interest
Other
Interest
Other given given
Global Yatırım Holding -- 2 8 4
Global Menkul -- -- -- --
Total -- 2 8 4
For the year ended 31 December 2017, the Group recognised interest income on these bonds amounting to USD
1,490 thousand (31 December 2016: USD 1,928 thousand). For the year ended 31 December 2017, the effective
interest rate was 8% (31 December 2016: 14.45%). For the year ended 31 December 2017, the Group accounted
for a gain amounting to USD 15 thousand from the purchase and the sale of Global Yatırım Holding’s publicly
traded share certificates (31 December 2016: a gain of USD 405 thousand).
For the year ended 31 December 2017, GPH distributed a total dividend of USD 34,933 thousand to Global
Yatırım Holding (31 December 2016: USD 30,856 thousand).
Transactions with key management personnel
Key management personnel comprised the members of the Board and GPH's senior management. For the years
ended 31 December, details of benefits to key management personnel comprised the following:
2017
(USD ‘000)
2016
(USD ‘000)
Salaries 2,452 1,761
Bonus 255 34
Attendance fees to Board of Directors 122 253
Termination benefits 19 34
Total 2,848 2,082

Global Ports Holding PLC and its Subsidiaries
Notes to the consolidated financial statements
64
17 Financial risk management
Overview
The Group has exposure to the following risks from its use of financial instruments:
credit risk;
liquidity risk;
market risk.
This note presents information about the Group’s exposure to each of the above risks, the Group’s objectives,
policies and processes for measuring and managing risk, and the Group’s management of capital. Further
quantitative disclosures are included throughout this consolidated financial statements.
Financial risk management objectives
The Board of Directors has overall responsibility for the establishment and oversight of the Group’s risk
management framework.
The Group’s risk management policies are to identify and analyse the risks faced by the Group, to set appropriate
risk limits and controls, and to monitor risks and adherence to limits. Risk management policies and systems are
reviewed regularly to reflect changes in market conditions and the Group’s activities. The Group, through its
training and management standards and procedures, aims to develop a disciplined and constructive control
environment in which all employees understand their roles and obligations.
Capital risk management
The Group seeks to provide superior returns to its shareholders, and ensure that it is not overly dependent upon
short and medium term debt that might not be available at renewal. Maintaining the flexibility to invest for growth
is a key capital management consideration. The Group manages its capital structure and reacts to changes in
economic conditions by varying returns to shareholders, issuing new shares or increasing or reducing borrowings.
The Group is not exposed to any externally imposed capital requirements. The total capital structure of the Group
consists of net loans and borrowings (as detailed in Note 12 offset by cash and cash equivalents) and equity of the
Group (comprising share capital, share premium, legal reserves and retained earnings.
To maintain the financial strength to access new capital at reasonable cost. The Group monitors its net leverage
ratio which is operating net loans and borrowings to Adjusted EBITDA. The Group is also mindful of potential
impacts on the key metrics employed by the credit rating agencies in considering increases to its borrowings. The
Group is comfortably in compliance with its bank facility ratio covenants and these measures do not inhibit the
Group’s operations or its financing plans.
2017
(USD ‘000)
2016
(USD ‘000)
Gross debt 341,719 339,291
Cash and bank balances (99,448) (44,310)
Short term financial investments (14,728) (14,602)
Net debt 227,543 280,379
Equity 269,642 223,284
Net debt to Equity ratio 0.84 1.26

Global Ports Holding PLC and its Subsidiaries
Notes to the consolidated financial statements
65
17 Financial risk management (continued)
Credit risk
Credit risk management
Credit risk is the risk of financial loss to the Group if a customer or counterparty to a financial instrument fails to meet its contractual obligations, and arises principally from the
Group’s receivables from customers. Management has a credit risk policy in place to monitor the exposure to credit risk on an ongoing basis. The Group has the ability to
receive collateral for its financial assets. Furthermore, the Group obtains letters of guarantee or similar collaterals from third parties for specific agreements and projects, if
necessary. Regarding the credibility of the counterparty, letters of guarantee or advance payments are received as collateral for trade receivables from port operations. Within
the context of credit risk policies described in this paragraph, the Group does not have significant credit risk from port operations.
Credit exposure
The carrying amount of financial assets represents the maximum credit exposure. The maximum exposure to credit risk at the reporting date was:
USD ‘000 RECEIVABLES
As at 31 December 2017
Trade
receivables
Due from
related
parties
Other
receivables
Cash at
bank
Financial
investments Total
Net book value of financial assets not overdue or not exposed to
impairment 9,779 1,599 4,803 80,071 14,505 110,757
Net book value of assets overdue but not exposed to impairment 4,343 -- 39 -- -- 4,382
Net book value of assets exposed to impairment -- -- -- -- -- --
- Overdue (gross book value) 1,997 -- -- -- -- 1,997
- Impairment (1,997) -- -- -- -- (1,997)
Maximum credit risk exposure at reporting date 14,122 1,599 4,842 80,071 14,505 115,139
As at 31 December 2016
Net book value of financial assets not overdue or not exposed to
impairment 5,002 32,968 3,221 62,193 13,844 117,228
Net book value of assets overdue but not exposed to impairment 3,545 -- 163 -- -- 3,707
Net book value of assets exposed to impairment -- -- -- -- -- --
- Overdue (gross book value) 925 -- -- -- -- 925
- Impairment (925) -- -- -- -- (925)
Maximum credit risk exposure at reporting date 8,547 32,968 3,384 62,193 13,844 120,936

Global Ports Holding PLC and its Subsidiaries
Notes to the consolidated financial statements
66
17 Financial risk management (continued)
Credit risk (continued)
Maturity analysis
The maturity analysis of the assets overdue but not impaired is as follows:
Trade receivables
As at
31 December 2017
(USD ‘000)
As at
31 December 2016
(USD ‘000)
1 to 30 days overdue 851 162
1 to 3 months overdue 1,418 42
3 to 12 months overdue 338 287
Total 2,607 491
Liquidity risk
Liquidity risk management
Liquidity risk is the risk that the Group will encounter difficulty in meeting the obligations associated with its
financial liabilities that are settled by delivering cash or another financial asset. The Group’s approach to
managing liquidity is to ensure, as far as possible, that it will always have sufficient liquidity to meet its liabilities
when due, under both normal and stressed conditions, without incurring unacceptable losses or risking damage to
the Group’s reputation.
The Group has access to funding sources from banks and keeps a certain level of assets as cash and cash
equivalents required for daily operations of the Group entities. The Group continuously assesses liquidity risk by
identifying and monitoring changes in funding required in meeting business goals and targets set in terms of the
overall Group strategy.
Current and future loan needs of the Group are supplied by continuous accessibility of a sufficient number of high
quality banks for major subsidiaries of the Group.
Financing facilities
2017
(USD ‘000)
2016
(USD ‘000)
Bank credit lines
- amount used 7,636 7,761
- amount unused 1,434 509
Total 9,070 8,270

Global Ports Holding PLC and its Subsidiaries
Notes to the consolidated financial statements
67
17 Financial risk management (continued)
Liquidity risk (continued)
Liquidity risk tables
The following tables detail the Group’s remaining contractual maturity for its non-derivative and derivative
financial liabilities with agreed repayment periods. The tables have been drawn up based on the undiscounted cash
flows of financial liabilities based on the earliest date on which the Group can be required to pay. The table
includes both interest and principal cash flows. To the extent that interest flows are floating rate, the undiscounted
amount is derived from interest rate curves at the balance sheet date. The contractual maturity is based on the
earliest date on which the Group may be required to pay.
As at 31 December 2017
CONTRACTUAL MATURITIES Carrying value
Total cash
outflow
due to
contracts
0-3
months
3-12
months
1-5
years
>5
years
NON-DERIVATIVE FINANCIAL LIABILITIES
Banks loans 338,326 439,622 14,829 30,704 387,940 6,150
Finance lease liabilities 3,394 3,742 404 1,193 2,145 --
Other financial liabilities 2,662 2,662 -- -- 2,662 --
Trade and other payables (*) 13,211 13,633 2,676 10,536 422 --
Due to related parties 483 640 157 483 -- --
DERIVATIVE FINANCIAL
LIABILITIES
Net settled:
Interest rate swaps 855 1,293 -- 274 636 25
(*) Trade and other payables in the consolidated balance sheet includes taxes payable and social security
contribution USD 1,043 thousand, payables to personnel USD 391 thousand, advanced received USD 1,001
thousand and deferred revenue USD 216 thousand, which are not financial liabilities and hence excluded from the
tables above.
As at 31 December 2016
CONTRACTUAL MATURITIES Carrying value
Total
cash
outflow
due to
contract
0-3
months
3-12
months
1-5
years
>5
years
NON-DERIVATIVE FINANCIAL LIABILITIES
Banks loans 334,833 448,228 5,475 39,805 384,298 18,650
Finance lease liabilities 4,456 4,735 432 1,248 3,055 --
Other financial liabilities 2,665 2,665 140 -- 2,525 --
Trade and other payables (*) 10,486 10,486 1,854 8,632 -- --
Due to related parties 581 581 -- 581 -- --
DERIVATIVE FINANCIAL
LIABILITIES
Net settled:
Interest rate swaps 1,131 1,252 -- 315 833 104
(*) Trade and other payables in the consolidated balance sheet includes taxes payable and social security
contribution USD 1,625 thousand, payables to personnel USD 1,348 thousand, advanced received USD 880
thousand and deferred revenue USD 124 thousand, which are not financial liabilities and hence excluded from the
tables above.

Global Ports Holding PLC and its Subsidiaries
Notes to the consolidated financial statements
68
17 Financial risk management (continued)
Market risk
Market risk management
Market risk is the risk that changes in market prices, such as foreign exchange rates, interest rates and equity prices
will affect the Group’s income or the value of its holdings of financial instruments. The objective of market risk
management is to manage and control market risk exposures within acceptable parameters, while optimising the
return. Market risk for all subsidiaries is monitored and managed by the Global Yatırım Holding’s Treasury and
Fund Management Department.
The Group has exposure to the following market risks from its use of financial instruments:
currency risk
interest rate risk
Currency risk
The Group is exposed to currency risk on sales, purchases and borrowings that are denominated in a currency
other than the functional currency of each company. The currencies in which these transactions primarily are
denominated are USD, Euro and TL.
Ortadoğu Liman having functional currency of USD, and Ege Liman and Bodrum Liman having functional
currency of Euro are exposed to currency risk on purchases that are denominated in TL. Global Liman having a
functional currency of TL is exposed to currency risk on borrowings that are denominated in USD.
As at 31 December 2017, the Group had outstanding foreign-currency denominated borrowing designated as a
hedge of net foreign investment of USD 249,445 thousand (31 December 2016: USD 249,209 thousand). The
results of hedges of the Group’s net investment in foreign operations included in hedging and translation reserves
was a net loss of USD 13,389 thousand after tax for the period ended 31 December 2017 (net loss of USD 47,656
thousand after tax for the period ended 31 December 2016). In the years ended 31 December 2016 and 2017, USD
887 thousand, USD 3,931 thousand respectively was recognised in profit or loss due to hedge ineffectiveness.
In respect of other monetary assets and liabilities denominated in foreign currencies, the Group ensures that its net
exposure is kept to an acceptable level by buying or selling foreign currencies at spot rates when necessary to
address short-term imbalances.
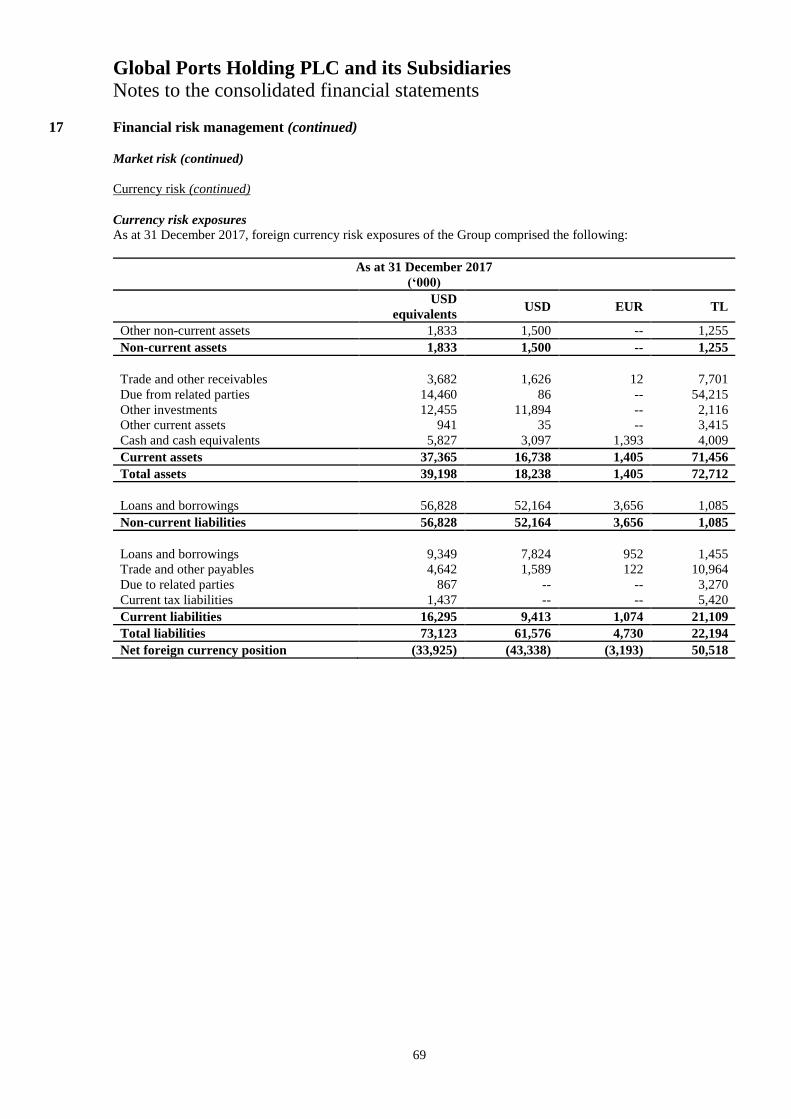
Global Ports Holding PLC and its Subsidiaries
Notes to the consolidated financial statements
69
17 Financial risk management (continued)
Market risk (continued)
Currency risk (continued)
Currency risk exposures
As at 31 December 2017, foreign currency risk exposures of the Group comprised the following:
As at 31 December 2017
(‘000)
USD
equivalents USD EUR TL
Other non-current assets 1,833 1,500 -- 1,255
Non-current assets 1,833 1,500 -- 1,255
Trade and other receivables 3,682 1,626 12 7,701
Due from related parties 14,460 86 -- 54,215
Other investments 12,455 11,894 -- 2,116
Other current assets 941 35 -- 3,415
Cash and cash equivalents 5,827 3,097 1,393 4,009
Current assets 37,365 16,738 1,405 71,456
Total assets 39,198 18,238 1,405 72,712
Loans and borrowings 56,828 52,164 3,656 1,085
Non-current liabilities 56,828 52,164 3,656 1,085
Loans and borrowings 9,349 7,824 952 1,455
Trade and other payables 4,642 1,589 122 10,964
Due to related parties 867 -- -- 3,270
Current tax liabilities 1,437 -- -- 5,420
Current liabilities 16,295 9,413 1,074 21,109
Total liabilities 73,123 61,576 4,730 22,194
Net foreign currency position (33,925) (43,338) (3,193) 50,518

Global Ports Holding PLC and its Subsidiaries
Notes to the consolidated financial statements
70
17 Financial risk management (continued)
Market risk (continued)
Currency risk (continued)
Currency risk exposures
As at 31 December 2016, foreign currency risk exposures of the Group comprised the following:
As at 31 December 2016
(‘000)
USD
equivalents USD EUR TL
Other non-current assets 3,341 1,500 -- 6,481
Non-current assets 3,341 1,500 -- 6,481
Trade and other receivables 1,233 705 -- 1,855
Due from related parties 13,987 411 97 47,417
Other investments 12,362 12,362 -- --
Other current assets 1,544 9 38 5,261
Cash and cash equivalents 26,174 2,336 22,040 2,123
Current assets 55,300 15,823 22,175 56,656
Total assets 58,641 17,323 22,175 63,137
Loans and borrowings 16,190 16,190 -- --
Non-current liabilities 16,190 16,190 -- --
Loans and borrowings 6,490 5,350 -- 4,014
Trade and other payables 5,068 156 2,727 7,172
Due to related parties 192 107 59 81
Current tax liabilities 1,589 -- -- 5,593
Current liabilities 13,339 5,613 2,786 16,860
Total liabilities 29,529 21,803 2,786 16,860
Net foreign currency position 29,112 (4,480) 19,389 46,277

Global Ports Holding PLC and its Subsidiaries
Notes to the consolidated financial statements
71
17 Financial risk management (continued)
Market risk (continued)
Currency risk (continued)
Currency risk sensitivity analysis
The foreign exchange rate sensitivity is calculated by aggregation of the net foreign exchange exposure and a
simultaneous parallel foreign exchange rates shift of all the currencies by 1 per cent against the respective
functional currencies of the Company and its subsidiaries.
The following tables detail the Group’s sensitivity analysis based on the net exposures of each of the subsidiaries
and the Group as at 31 December 2016 and 2017, which could affect the consolidated income statement and other
comprehensive income.
1 per cent is the sensitivity rate used when reporting foreign currency risk internally to key management personnel
and represents management’s assessment of the reasonably possible change in foreign exchange rates.
This analysis assumes that all other variables, in particular interest rates, remain constant.
The Group’s sensitivity to foreign currency rates has increased during the current period and is primarily due to
the increase in its portfolio of ports in the Mediterranean, namely the European region.
The following tables show the Group’s foreign currency sensitivity analysis as at 31 December 2017 and 2016:
Year ended 31 December 2017
USD ‘000 USD
TL EUR
Net financial assets 134
Net financial liabilities (433) (38)
1% appreciation/depreciation of the respective foreign currencies with respect to functional currency of the Group
and its subsidiaries would result in decrease/increase in the Group’s profit before tax and other comprehensive
income by approximately USD 86 thousand and USD 166 thousand respectively, for the year ended 2017.
Year ended 31 December 2016
USD ‘000 USD
TL EUR
Net financial assets -- 131 204
Net financial liabilities (45) -- --
1% appreciation/depreciation of the respective foreign currencies with respect to functional currency of the Group
and its subsidiaries would result in decrease/increase in the Group’s profit before tax and other comprehensive
income by approximately USD 328 thousand and USD 478 thousand respectively, for the year ended 2016.

Global Ports Holding PLC and its Subsidiaries
Notes to the consolidated financial statements
72
17 Financial risk management (continued)
Market risk (continued)
Interest rate risk
The Group’s operations are subject to the risk of interest rate fluctuations to the extent that interest-earning assets
and interest-bearing liabilities mature or reprice at different times or in differing amounts. As at 31 December
2016 and 2017, the Group uses interest rate swaps to hedge its floating interest rate risk.
Interest rate risk exposures
The Group is exposed to interest rate risk because entities in the Group borrow funds at floating interest rates. The
risk is managed by the use of interest rate swap contracts.
The Group’s operations are subject to the risk of interest rate fluctuations to the extent that interest-earning assets
and interest-bearing liabilities mature or re-price at different times or in differing amounts.
Interest rate exposure
USD 000’s
As at
31 December
2017
As at
31 December
2016
Fixed-rate financial instruments
Financial assets Cash and cash equivalents 80,093 30,308
Loans and receivables 14,728 14,602
Amounts due from related
parties 1,525 31,433
Financial liabilities Loans and borrowings (267,884) (263,705)
Other financial liabilities (2,662) (2,664)
(174,200) (190,026)
Effect of interest rate
swap (28,014) (28,203)
(202,214) (218,229)
Floating-rate financial instruments
Financial liabilities Loans and borrowings (73,836) (75,586)
Effect of interest rate
swap (*) 28,014 28,203
(45,822) (47,383)
(*) 75% of the loan to BPI has been hedged by entering into an interest rate swap requiring the Group to pay a
fixed interest rate of 0.97 percent and receive Euribor until maturity of the loan (31 December 2023).
Floating rate loans with a principal amount of USD 28,015 thousand (31 December 2016: USD 28,203 thousand)
have been designated in a cash flow hedge relationship.
Interest rate swap contracts
Under the interest rate swap contracts, the Group agrees to exchange the difference between fixed and floating rate
interest amounts calculated on agreed notional principal amounts. Such contracts enable the Group to mitigate the
risk of changing interest rates on the fair value of issued fixed rate debt held and the cash flow exposures on the
issued variable rate debt held. The fair value of interest rate swaps at the reporting date is determined by
discounting the future cash flows using the curves at the reporting date and the credit risk inherent in the contract,
and is disclosed below. The average interest rate is based on the outstanding balances at the end of the financial
year.
The following tables detail the notional principal amounts and remaining items of interest rate swap contracts
outstanding as at the reporting date.

Global Ports Holding PLC and its Subsidiaries
Notes to the consolidated financial statements
73
17 Financial risk management (continued)
Market risk (continued)
Interest rate risk (continued)
Cash flow hedges
As at 31 December 2017
fixed rate contract
Average contract fixed
interest rate
(%)
Notional principal
value
(USD ‘000)
Fair value
(USD
‘000)
Less than 1 year 0.97 3,912 266
1 to 2 years 0.97 4,449 218
2 to 5 years 0.97 16,412 348
5 years + 0.97 3,241 20
0.97 28,014 852
As at 31 December 2016
fixed rate contracts
Average contract fixed
interest rate
(%)
Notional principal
value
(USD ‘000)
Fair value
(USD
‘000)
Less than 1 year 0.97 3,533 306
1 to 2 years 0.97 3,445 257
2 to 5 years 0.97 12,984 486
5 years + 0.97 8,241 83
0.97 28,203 1,132
The interest rate swaps settle on a semi-annual basis. The floating rate on the interest rate swaps is 0.97%. The
Group will settle the difference between the fixed and floating interest rate on a net basis.
All interest rate swap contracts exchanging floating rate interest amounts for fixed rate interest amounts are
designated as cash flow hedges to reduce the Group’s cash flow exposure resulting from variable interest rates on
borrowings. The interest rate swaps and the interest payments on the loan occur simultaneously and the amount
accumulated in equity is reclassified to profit or loss over the period that the floating rate interest payments on debt
affect profit or loss.
Interest rate risk sensitivity analysis
As at 31 December 2017, had the interest rates been higher by 100 basis points where all other variables remain
constant, interest expense would have been higher by USD 458 thousand (31 December 2016: higher by USD 474
thousand) and equity attributable to equity holders of the Company, excluding tax effects, would have been lower
by USD 344 thousand (31 December 2016: lower by USD 364 thousand).
This analysis assumes that all other variables, in particular currency rates, remain constant.
The Group’s sensitivity to interest rates has decreased during the current period mainly due to the reduction in
variable rate debt instruments and the repayment of principal amounts.
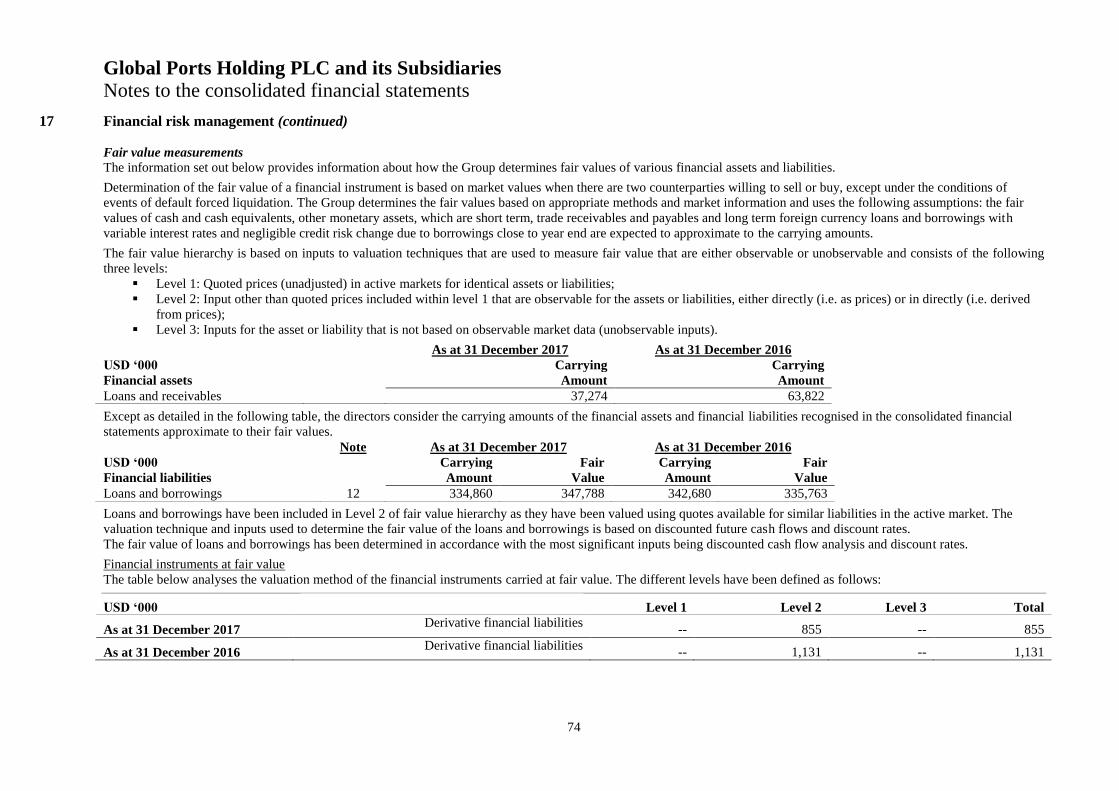
Global Ports Holding PLC and its Subsidiaries
Notes to the consolidated financial statements
74
17 Financial risk management (continued)
Fair value measurements
The information set out below provides information about how the Group determines fair values of various financial assets and liabilities.
Determination of the fair value of a financial instrument is based on market values when there are two counterparties willing to sell or buy, except under the conditions of
events of default forced liquidation. The Group determines the fair values based on appropriate methods and market information and uses the following assumptions: the fair
values of cash and cash equivalents, other monetary assets, which are short term, trade receivables and payables and long term foreign currency loans and borrowings with
variable interest rates and negligible credit risk change due to borrowings close to year end are expected to approximate to the carrying amounts.
The fair value hierarchy is based on inputs to valuation techniques that are used to measure fair value that are either observable or unobservable and consists of the following
three levels:
Level 1: Quoted prices (unadjusted) in active markets for identical assets or liabilities;
Level 2: Input other than quoted prices included within level 1 that are observable for the assets or liabilities, either directly (i.e. as prices) or in directly (i.e. derived
from prices);
Level 3: Inputs for the asset or liability that is not based on observable market data (unobservable inputs).
As at 31 December 2017 As at 31 December 2016
USD ‘000 Carrying Carrying
Financial assets Amount Amount
Loans and receivables 37,274 63,822
Except as detailed in the following table, the directors consider the carrying amounts of the financial assets and financial liabilities recognised in the consolidated financial
statements approximate to their fair values.
Note As at 31 December 2017 As at 31 December 2016
USD ‘000 Carrying Fair Carrying Fair
Financial liabilities Amount Value Amount Value
Loans and borrowings 12 334,860 347,788 342,680 335,763
Loans and borrowings have been included in Level 2 of fair value hierarchy as they have been valued using quotes available for similar liabilities in the active market. The
valuation technique and inputs used to determine the fair value of the loans and borrowings is based on discounted future cash flows and discount rates.
The fair value of loans and borrowings has been determined in accordance with the most significant inputs being discounted cash flow analysis and discount rates.
Financial instruments at fair value
The table below analyses the valuation method of the financial instruments carried at fair value. The different levels have been defined as follows:
USD ‘000 Level 1 Level 2 Level 3 Total
As at 31 December 2017 Derivative financial liabilities
-- 855 -- 855
As at 31 December 2016 Derivative financial liabilities
-- 1,131 -- 1,131

Global Ports Holding PLC and its Subsidiaries
Notes to the consolidated financial statements
75
17 Financial risk management (continued)
Fair value measurements (continued)
The valuation technique and inputs used to determine the fair value of the interest rate swap is based on future cash flows estimated based on forward interest rates (from
observable yield curves at the end of the reporting period) and contract interest rates, discounted at a rate that reflects the credit risk of various counterparties.
Reconciliation of liabilities arising from financing activities
The table below details changes in the Group’s liabilities arising from financing activities, including both cash and non-cash changes. Liabilities arising from financing
activities are those for which cash flows were, or future cash flows will be, classified in the Group’s consolidated statement of cash flows as cash flows from financing
activities.
Non-cash changes
01/01/17
Financing
cash
flows
Translation
reserves
Acquisition
of
subsidiary
Disposal
of
subsidiary
Fair value
adjustments
New
finance
leases
Other
changes 31/12/2017
Bank loans (Note 12) 339,289 (9,204) 11,346 -- -- -- -- 286 341,720
Loans from related parties (Note 16) 581 (133) 37 -- -- -- -- -- 483
Other financing liabilities 2,655 (140) 147 -- -- -- -- -- 2,662
Interest rate swaps 1,131 (389) 55 -- -- 55 -- -- 852
Total financial liabilities 343,656 (9,866) 11,585 55 286 345,717
18 Events after the reporting date
Port of Adria signed a loan agreement with EBRD for a total of €20 million to modernize its facilities.
In the long term, Port of Adria is aiming to transform its terminals at Montenegro into a hub that can be used as an intermediate destination by trucks travelling between western
Europe and Turkey. The Company is also planning to increase the volume of Serbian cargo as the rail link between Belgrade and the city of Bar is being refurbished.
In addition, Port of Adria is exploring ways to increase the role the port is playing in Montenegro’s tourism, a sector which remains constrained by the underdeveloped transport
infrastructure.
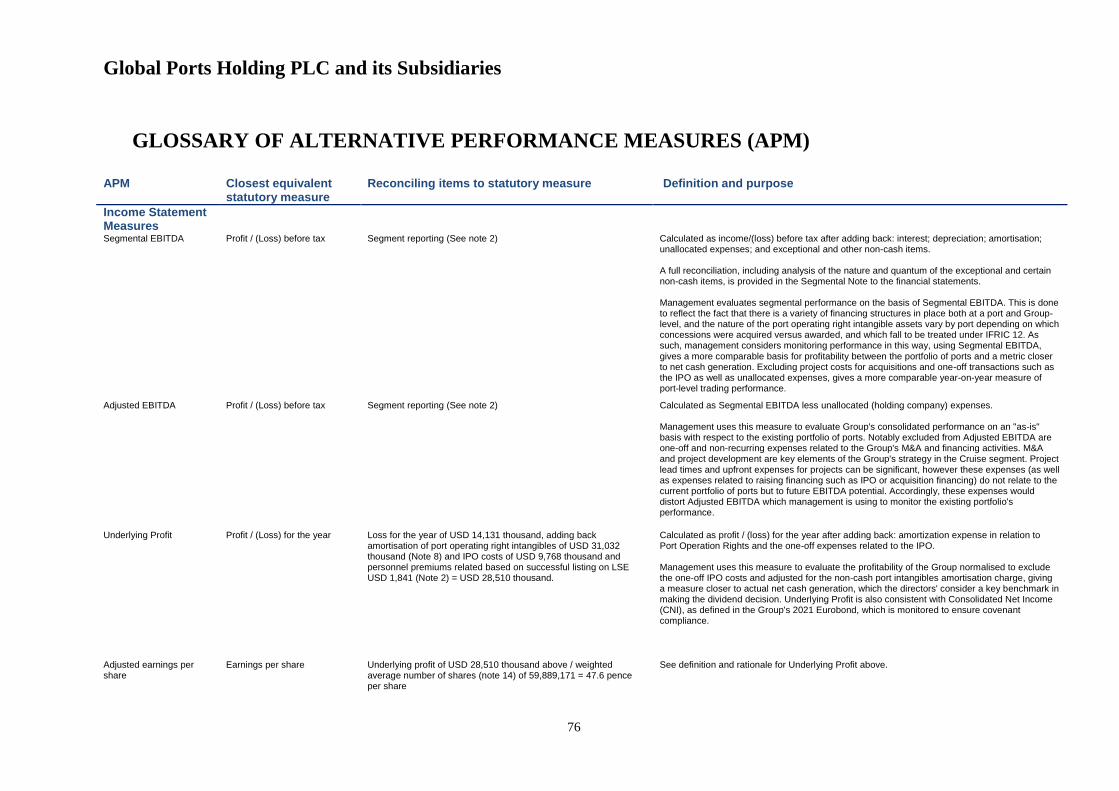
Global Ports Holding PLC and its Subsidiaries
76
GLOSSARY OF ALTERNATIVE PERFORMANCE MEASURES (APM)
APM Closest equivalent
statutory measure Reconciling items to statutory measure Definition and purpose
Income Statement Measures
Segmental EBITDA Profit / (Loss) before tax Segment reporting (See note 2) Calculated as income/(loss) before tax after adding back: interest; depreciation; amortisation; unallocated expenses; and exceptional and other non-cash items. A full reconciliation, including analysis of the nature and quantum of the exceptional and certain non-cash items, is provided in the Segmental Note to the financial statements. Management evaluates segmental performance on the basis of Segmental EBITDA. This is done to reflect the fact that there is a variety of financing structures in place both at a port and Group-level, and the nature of the port operating right intangible assets vary by port depending on which concessions were acquired versus awarded, and which fall to be treated under IFRIC 12. As such, management considers monitoring performance in this way, using Segmental EBITDA, gives a more comparable basis for profitability between the portfolio of ports and a metric closer to net cash generation. Excluding project costs for acquisitions and one-off transactions such as the IPO as well as unallocated expenses, gives a more comparable year-on-year measure of port-level trading performance.
Adjusted EBITDA Profit / (Loss) before tax Segment reporting (See note 2) Calculated as Segmental EBITDA less unallocated (holding company) expenses. Management uses this measure to evaluate Group's consolidated performance on an "as-is" basis with respect to the existing portfolio of ports. Notably excluded from Adjusted EBITDA are one-off and non-recurring expenses related to the Group's M&A and financing activities. M&A and project development are key elements of the Group's strategy in the Cruise segment. Project lead times and upfront expenses for projects can be significant, however these expenses (as well as expenses related to raising financing such as IPO or acquisition financing) do not relate to the current portfolio of ports but to future EBITDA potential. Accordingly, these expenses would distort Adjusted EBITDA which management is using to monitor the existing portfolio's performance.
Underlying Profit Profit / (Loss) for the year Loss for the year of USD 14,131 thousand, adding back amortisation of port operating right intangibles of USD 31,032 thousand (Note 8) and IPO costs of USD 9,768 thousand and personnel premiums related based on successful listing on LSE USD 1,841 (Note 2) = USD 28,510 thousand.
Calculated as profit / (loss) for the year after adding back: amortization expense in relation to Port Operation Rights and the one-off expenses related to the IPO. Management uses this measure to evaluate the profitability of the Group normalised to exclude the one-off IPO costs and adjusted for the non-cash port intangibles amortisation charge, giving a measure closer to actual net cash generation, which the directors' consider a key benchmark in making the dividend decision. Underlying Profit is also consistent with Consolidated Net Income (CNI), as defined in the Group's 2021 Eurobond, which is monitored to ensure covenant compliance.
Adjusted earnings per share
Earnings per share Underlying profit of USD 28,510 thousand above / weighted average number of shares (note 14) of 59,889,171 = 47.6 pence per share
See definition and rationale for Underlying Profit above.

Global Ports Holding PLC and its Subsidiaries
77
Balance sheet measures Net Debt None Capital risk management (see note 17) Net debt comprises total borrowings (bank loans, Eurobond and finance leases net of accrued
tax) less cash, cash equivalents and short term investments. Management includes short term investments into the definition of Net Debt, because these short term investment are comprised of marketable securities which can be quickly converted into cash.
Leverage Ratio None Gross debt (see note 17) of USD 341,719 thousand / Adjusted EBITDA (see note 2) of USD 75,277 thousand = 4.54 x
Leverage ratio is computed by dividing gross debt to Adjusted EBITDA. This APM is in line with the key financial covenant of the Group's 2021 Eurobond, and is used by management to monitor available credit capacity of the Group
Other Measures
CAPEX None Equals 'Acquisition of property and equipment' and 'Acquisition of intangible assets' per the cash flow statement.
This represents the recurring level of capital expenditure required by the Group excluding M&A related capital expenditure.
Cash Conversion None Adjusted EBITDA of USD 75,277 thousand less CAPEX of USD 13,875 thousand / Adjusted EBITDA of USD 75,277 thousand = 81.6%
Cash conversion rate is computed as Adjusted EBITDA less CAPEX for the existing portfolio of ports, divided by Adjusted EBITDA. This therefore represents a measure of cash generation after taking account of on-going capital expenditure required to maintain the existing portfolio of ports.
Top Related