


Languages
Pages
Legal


GLOBAL OVERVIEW &
STRATEGY
Rice Powell
April 3 2014, New York City
Agenda
Fresenius Medical Care Today - A Global Perspective A
Market DynamicsB
Our Global StrategyC
Page 2

FRESENIUS MEDICAL
CARE TODAY
A Global Perspective

Fresenius Medical Care Today
34% of Dialysis Product Market
$3.5bnDialysis
Products Revenue
$10.6bnServices Revenue
~$500mCare
Coordination
3,250 Clinics
40.5mTreatments
GlobalProduction
Network~40 Sites
270,000 Patients
Source: 2013 Company data and estimates Page 4

We are the World’s Leading Provider of Dialysis Services
North America
Provider Patients Countries
171,440 2
163,000 1
14,000 1
14,000 1
9,450 1
6,550 1
Europe, Middle East, Africa
Provider Patients Countries
51,540 23
18,500 2
18,500 14
11,500 17
6,900 1
2,750 3
1,650 4
Latin America
Provider Patients Countries
29,270 8
8,750 2
4,250 3
1,650 1
850 1
Asia Pacific
Provider Patients Countries
17,870 12
Zenjin-Kai 6,000 1
5,000 1
4,000 1
2,650 5
1,750 5
300 1
Source: 2013 Company data and estimates Page 5

Vertical Integration Enables Extension of Renal Care
10.6
0.2
8
3.5
4
0.5
FME Baxter/Gambro DaVita
Revenue by Business Segment ($bn in 2013)
Services Products Care Coordination
9.6
0.7
7.9
5
3.5
0.1
FME Baxter/Gambro DaVita
Revenue by Region ($bn in 2013)
NA International
Source: 2013 Company data and estimates Page 6

MARKET DYNAMICS

19
98
19
97
19
96
19
95
19
94
19
93
19
92
20
08
19
91
4.000.000
3.500.000
3.000.000
2.500.000
2.000.000
1.500.000
1.000.000
500.000
0
19
90
19
89
19
88
19
87
20
13
19
86
20
12
20
11
19
85
20
10
20
09
19
84
20
07
19
83
20
06
20
05
19
82
20
04
20
03
19
81
20
02
20
01
19
80
20
00
19
99
19
79
19
78
19
77
19
76
19
75
19
74
19
73
19
72
19
71
19
70
Development of Dialysis Patient Numbers
CAGR 6.8%
Source: 2013 Company data and estimates Page 8

19
98
19
97
19
96
19
95
19
94
19
93
19
92
20
08
19
91
4.000.000
3.500.000
3.000.000
2.500.000
2.000.000
1.500.000
1.000.000
500.000
0
19
90
20
20
e2
01
9e
19
89
20
18
e2
01
7e
19
88
20
16
e2
01
5e
19
87
20
14
e2
01
3
19
86
20
12
20
11
19
85
20
10
20
09
19
84
20
07
19
83
20
06
20
05
19
82
20
04
20
03
19
81
20
02
20
01
19
80
20
00
19
99
19
79
19
78
19
77
19
76
19
75
19
74
19
73
19
72
19
71
19
70
Development of Dialysis Patient Numbers
CAGR 2013-2020
NA 4.5%EMEA 4.4%LA 5.2%AP 8.4% CAGR 6.8%
CAGR 6.3%
Source: 2013 Company data and estimates Page 9

4.000.000
3.500.000
3.000.000
2.500.000
2.000.000
1.500.000
1.000.000
500.000
0
Innovations Shaping the Future
20
08
20
20
e
20
19
e
20
18
e
20
17
e
20
16
e
20
15
e
20
14
e
20
13
20
12
20
11
20
10
20
09
20
07
20
06
20
05
20
04
20
03
20
02
20
01
20
00
Source: 2013 Company data and estimates Page 10

Global Market Potential (Per Patient/Per Year)
Source: 2013 Company data and estimates Page 11

OUR STRATEGY
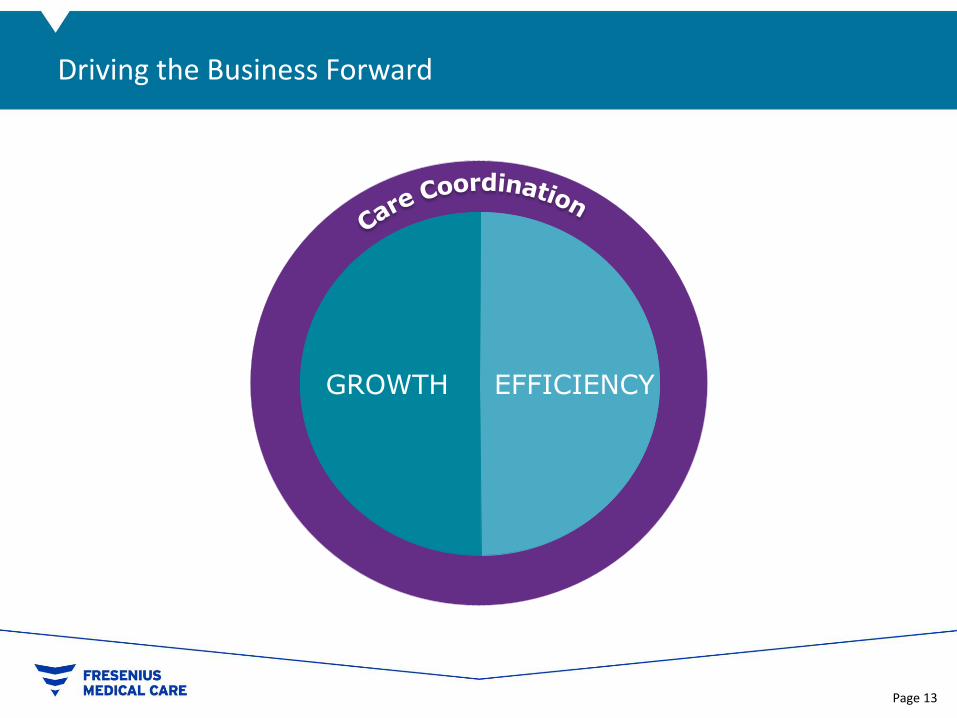
Driving the Business Forward
EFFICIENCYGROWTH
Page 13

Our Vision of Care Coordination
GROWTH
DialysisServices
Lab
DialysisProducts
Nephrology
Vascular
Pharmacy
Post-Acute
PrimaryCare
In Patient
Page 14

Objectives and Strategy for GEP
EFFICIENCY
OBJECTIVES
Identify efficiency potential
Enhance overall competitiveness
Liberate resources for reinvestment
Achieved sustained efficiency gains over multiple years
APPROACH
18 projects active with monthly results review to ensure execution and delivery
Owned and led by 2 executives with a dedicated full-time team
Page 15

2020 Vision
70%
73%
64%
30%
24%
18%
3%
18%
2000 2013 2020
Services Products Care Coordination
$4.2bn
$14.6bn
Drivers
Market consolidation globally
Introduction of single use therapy in FME clinics
International expansion
Starting expansion into Care Coordination
Source: 2013 Company data and estimates Page 16

2020 Vision
%
73%
62%
%
24%
20%
3%
18%
2000 2013 2020
Services Products Care Coordination
XXXX
$14.6bn
$28.0bn
Drivers
Compliant, profitable growth
Pushing our core beyond 128 countries with products; and >40 countries with dialysis care
Recognize that moving beyond our core brings businesses with different risk and margin profiles
Reimbursement pressure is a fact of life
Source: 2013 Company data and estimates Page 17

2020 Vision
70%
73%
62%
30%
24%
20%
3%
18%
2000 2013 2020
Services Products Care Coordination
$4.2bn
$14.6bn
$28.0bn
Focus on quality outcomes through better therapy Sustainable patient growth Strong cash flow generation
Source: 2013 Company data and estimates Page 18

v

Safe Harbor Statement: This presentation includes certain forward-looking statements within the
meaning of Section 27A of the U.S. Securities Act of 1933, as amended, and Section 21E of the U.S.
Securities Act of 1934, as amended. The Company has based these forward-looking statements on its views
with respect to future events an financial performance. Actual results could differ materially from those
included in the forward-looking statements due to various risk factors and uncertainties, including changes
in business, economic competitive conditions, regulatory reforms, foreign exchange rate fluctuations,
uncertainties in litigation or investigative proceedings and the availability of financing. Given these
uncertainties, readers should not put undue reliance on any forward-looking statements. These and other
risks and uncertainties are discussed in detail in Fresenius Medical Care AG & Co. KGaA’s (FMC AG & Co.
KGaA) reports filed with the Securities and Exchange Commission (SEC) and the German Exchange
Commission (Deutsche Börse).
Forward-looking statements represent estimates and assumptions only as of the date that they were made.
The information contained in this presentation is subject to change without notice and the company does
not undertake any duty to update the forward-looking statements, and the estimates and assumptions
associated with them, except to the extent required by applicable law and regulations.
20
If not mentioned differently the term net income after minorities refers to the net income attributable to
the shareholders of Fresenius Medical Care AG Co. KGaA independent of being the reported or the adjusted
number. Numbers mentioned are in US-$.
© | Press Conference | FY 2013
Top Related