


Languages
Pages
Legal

March 15, 2021
GLOBAL ECONOMICS
| SCOTIABANK’S PROVINCIAL OUTLOOK
1 Visit our website at scotiabank.com/economics | Follow us on Twitter at @ScotiaEconomics | Contact us by email at [email protected]
All Provinces To Enjoy Strong Rebounds in 2021
HIGHLIGHTS
• We expect all of Canada’s provinces to experience strong economic
growth this year as they rebound from pandemic lockdowns*.
• The Canadian outlook has improved: commodity prices and recoveries
from the second wave have generally surprised on the upside; the new
US stimulus package and vaccination prospects offer a further boost.
• We expect Quebec and Ontario to witness the strongest expansions this
year, but we have also revised Alberta’s forecast growth higher in light
of rallying oil prices.
• In most provinces, we anticipate that consumer spending and
residential investment will be the principal drivers of growth this year.
• Industry divergences continue: tourism and food and accommodations
are bearing the brunt of pandemic restrictions; remote-work-capable
sectors are leading the rebound.
• Fiscal policy remains accommodative. Some provinces have laid out
tentative consolidation plans to follow pandemic spending increases,
but all incorporate a degree of flexibility given the present uncertainty.
• Recent commodity price gains—particularly those of crude oil—bode
well for Canada’s net oil-producing regions, though it will likely take
time for sectoral investment to fully recover.
• We explore several macroeconomic themes and risks affecting the
provinces in greater detail on pages 2 and 3.
CONTACTS
Marc Desormeaux, Senior Economist
416.866.4733
Scotiabank Economics
INDEX
Highlights 1
Macroeconomic Themes and Risks 2–3
Newfoundland and Labrador 4
Prince Edward Island 5
Nova Scotia 6
New Brunswick 7
Quebec 8
Ontario 9
Manitoba 10
Saskatchewan 11
Alberta 12
British Columbia 13
Appendix 14
Provincial Forecast Summary Table 15
* Forecasts completed on March 10, 2021.
March 15, 2021
GLOBAL ECONOMICS
| SCOTIABANK’S PROVINCIAL OUTLOOK
2 Visit our website at scotiabank.com/economics | Follow us on Twitter at @ScotiaEconomics | Contact us by email at [email protected]
Provincial Macroeconomic Themes and Risks
COVID-19
Though this commentary tends to focus on relative infection rates and
lockdown stringency levels, we emphasize that COVID-19 has profoundly
impacted every provincial economy. In most cases, economic contractions
witnessed last year were the deepest ever recorded. Even at this juncture, each
province’s expansion will ultimately depend on its ability to get through the pandemic.
Individual jurisdictions’ caseloads and restriction severities are provided in the
appendix.
The outlook for the virus’ spread has improved in recent months, but remains
uncertain. Second wave lockdown measures appear to have had their desired
impacts and infection rates are now trending lower across most of the country. Our
base case forecast assumes that widespread vaccination will enable wider reopening
as the year progresses, and that even in the event of a third wave, the economic hit
will be small relative to prior rounds of restrictions. Still, risks remain around the
vaccine resistance of new variants, and the timing of second wave reopening.
K-SHAPED RECOVERY
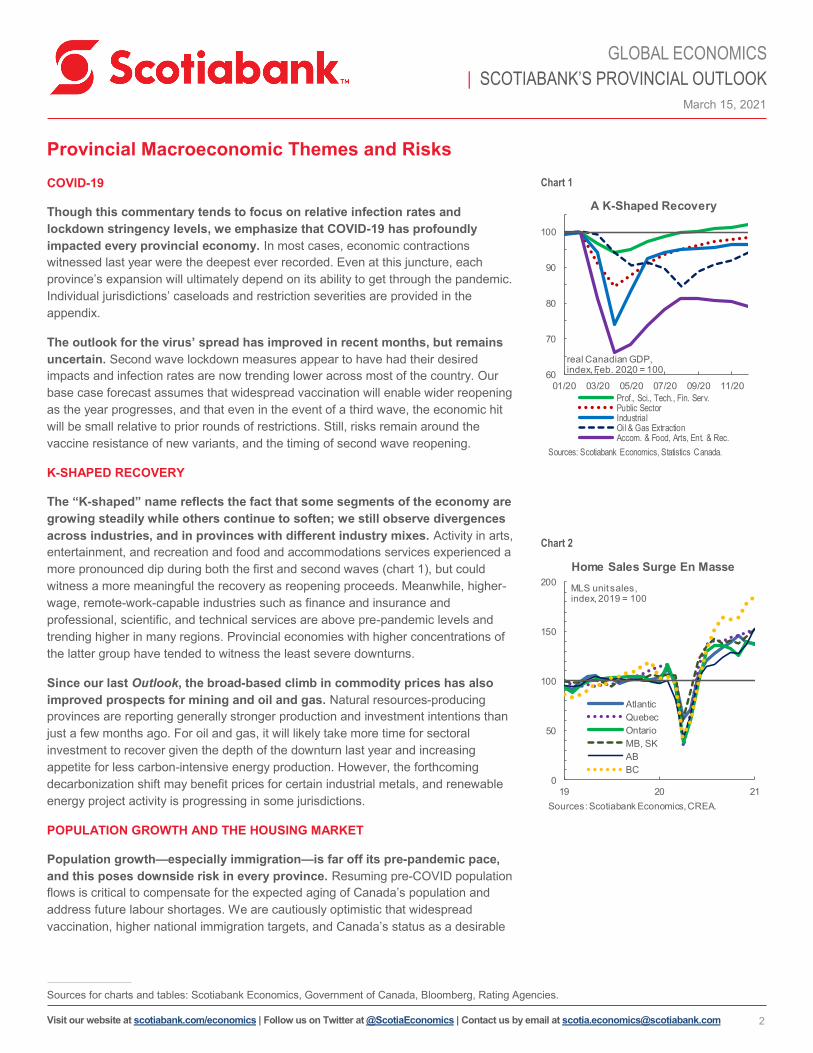
The “K-shaped” name reflects the fact that some segments of the economy are
growing steadily while others continue to soften; we still observe divergences
across industries, and in provinces with different industry mixes. Activity in arts,
entertainment, and recreation and food and accommodations services experienced a
more pronounced dip during both the first and second waves (chart 1), but could
witness a more meaningful the recovery as reopening proceeds. Meanwhile, higher-
wage, remote-work-capable industries such as finance and insurance and
professional, scientific, and technical services are above pre-pandemic levels and
trending higher in many regions. Provincial economies with higher concentrations of
the latter group have tended to witness the least severe downturns.
Since our last Outlook, the broad-based climb in commodity prices has also
improved prospects for mining and oil and gas. Natural resources-producing
provinces are reporting generally stronger production and investment intentions than
just a few months ago. For oil and gas, it will likely take more time for sectoral
investment to recover given the depth of the downturn last year and increasing
appetite for less carbon-intensive energy production. However, the forthcoming
decarbonization shift may benefit prices for certain industrial metals, and renewable
energy project activity is progressing in some jurisdictions.
POPULATION GROWTH AND THE HOUSING MARKET
Population growth—especially immigration—is far off its pre-pandemic pace,
and this poses downside risk in every province. Resuming pre-COVID population
flows is critical to compensate for the expected aging of Canada’s population and
address future labour shortages. We are cautiously optimistic that widespread
vaccination, higher national immigration targets, and Canada’s status as a desirable
Chart 1
Chart 2
Sources for charts and tables: Scotiabank Economics, Government of Canada, Bloomberg, Rating Agencies.
0
50
100
150
200
19 20 21
Atlantic
Quebec
Ontario
MB, SK
AB
BC
MLS unit sales, index, 2019 = 100
Home Sales Surge En Masse
Sources:Scotiabank Economics, CREA.
60
70
80
90
100
01/20 03/20 05/20 07/20 09/20 11/20
Prof., Sci., Tech., Fin. Serv.Public SectorIndustrialOil & Gas ExtractionAccom. & Food, Arts, Ent. & Rec.
real Canadian GDP,index, Feb. 2020 = 100
A K-Shaped Recovery
Sources: Scotiabank Economics, Statistics Canada.

March 15, 2021
GLOBAL ECONOMICS
| SCOTIABANK’S PROVINCIAL OUTLOOK
3 Visit our website at scotiabank.com/economics | Follow us on Twitter at @ScotiaEconomics | Contact us by email at [email protected]
destination for newcomers will eventually lead to a recovery*. As it stands, our
forecast assumes a resumption of steady population growth this year, but there is
clearly significant uncertainty on that front.
Despite the slowdown, most Canadian housing markets enter 2021 with
significant momentum. For sales and housing starts, the pandemic essentially
amounted to a two-month pause in March and April that was followed by some of the
strongest purchasing volume gains on record (chart 2, p.1). Many cities are reporting
extremely tight supply-demand balances and affordability is once again becoming
stretched. Persistent softness in population growth may eventually undermine further
gains. Yet, we begin this year with high-wage sectors on firm footing, low borrowing
rates, household transfer supports in place, and widening supply shortages, all of
which should contribute to strong residential investment and price gains this year.
FLEXIBLE FISCAL POLICY
Budget season will begin in earnest shortly, which means that many Provinces
will soon release their first multi-year plans since the pandemic reached
Canadian shores. Those that have already released outer-year blueprints have
tended to incorporate significant contingencies for cost overruns and emphasize the
fluid nature of the pandemic and economic situation, and avoided concrete timelines
for a return to surplus. This is likely wise given the present uncertainty and the need to
balance long-run fiscal sustainability goals while bolstering the economic recovery.
Still, providing reasonable medium-term fiscal anchors will be critical to signal
discipline to creditors; Current provincial budget balance projections are provided in
chart 3, while credit ratings are summarized in table 1.
NEW US PRESIDENTIAL ADMINISTRATION
We note four key impacts related to plans outlined by the Biden Administration.
First and foremost, we expect a boost to US growth via the new fiscal stimulus
package to generate meaningful gains in Canadian exports and industrial activity.
Second, the imposition of “Buy American” rules to support the domestic economy may
displace some Canadian firms from cross-border supply chains of which they would
otherwise have been part, though the sheer strength of US growth will likely dominate.
Third, clean energy development could have adverse effects on Canadian crude oil
exporters, though the renewable energy sector stands to benefit alongside firms that
supply inputs into the decarbonization transition. Finally, more open US immigration
policy could mean more competition for skilled newcomers as reopening proceeds.
Chart 3
* See BCG’s Decoding Global Talent, Onsite and Virtual, which ranks Canada as the preferred work destination among foreign workers.
-8 -6 -4 -2 0
AB
NL
BC
ON
MB
SK
PE
NS
QC
NB
FY21
FY22
% of GDP
Budget Balance by Province*
* As of Mar. 10, 2021. Sources: Scotiabank Economics, Statistics Canada, Budget Doccuments.
Moody's S&P Fitch DBRS
Canada Aaa AAA AA+ AAA
NL A1 (-) A (-) -- AL (-)
PE Aa2 A -- A
NS Aa2 AA- -- AH
NB Aa2 A+ -- AH
QC Aa2 AA- AA- AAL
ON Aa3 A+ AA- AAL
MB Aa2 A+ -- AH
SK Aaa (-) AA -- AAL
AB Aa3 A+ (-) -- AAL (-)
BC Aaa AAA (-) AAA AAH
Table 1

March 15, 2021
GLOBAL ECONOMICS
| SCOTIABANK’S PROVINCIAL OUTLOOK
4 Visit our website at scotiabank.com/economics | Follow us on Twitter at @ScotiaEconomics | Contact us by email at [email protected]
Newfoundland and Labrador
CHALLENGING ROAD AHEAD DESPITE BETTER-THAN-EXPECTED 2020
• Although we foresee a strong rebound this year, Newfoundland and
Labrador’s medium-term prospects are limited by major project activity.
• Last year, virus containment, crude production, and gains in other
commodity prices kept the province’s decline in line with the national
average (chart NL1).
• Longstanding fiscal and demographic challenges remain.
What explains 2020’s results? Full-time employment recovered well in H2-2020, in
part due to earlier reopening from spring lockdowns. Production of key commodities
was also not as adversely impacted as in other natural resources economies.
Offshore oil benefited from ramp-up of the Hebron field, while iron ore production also
held up.
We anticipate a strong rebound in 2021, but one that is less pronounced than in
other provinces. Though it has eased, a large second pandemic wave gets 2021 off
to a slow start, having prompted stringent containment restrictions. Crude values have
surged to start 2021, but may not immediately translate into investment and
employment gains given the energy sector’s tilt towards large, long lead-time projects.
NL’s soft investment intentions versus the other oil-producers appear to reflect that
fact (chart). On that note, the West White Rose extension project—important for long-
run output at the offshore oil field of the same name—has received a pledge of
government support but work is delayed until at least 2022. Terra Nova field
operations remain suspended despite support from the Province.
Fiscal challenges remain. Pre-pandemic growth prospects were limited by an
uncertain oil and gas sector outlook and an aging and declining population; reining in
the province’s highest-in-the-nation net debt burden and eventually returning to
balance would have proved exigent. We are encouraged by federal support of $320
mn for the offshore energy industry and the contours of a deal with Ottawa for
payment assistance related to Muskrat Falls hydroelectricity project debt. In the
medium-term, it will be crucial for the province to safely restart immigration flows—the
only consistently positive contributor to its headcount over the last several years.
The search for a buyer for the Come By Chance refinery continues. Closed since
March 2020, it provided more than 400 high-wage jobs and was the sole fuel
upgrading facility in the province—in 2019, petroleum refinery shipments made up
over 20% of nominal exports. The shutdown was met with a surge in energy imports,
which eroded gains in other sectors of the economy. Provincial funding to keep the
refinery in idle mode and recent expressions of interest are positive developments.
Continued strength in key metals prices is also encouraging for export values
and mining sector activity. With iron ore prices hovering at post-2011 highs, the
Labrador Iron Ore Royalty Corp. expects output gains of up to 15% this year. Gold
remains well-supported by accommodative global monetary policy. Moreover, output
from the Voisey’s Bay nickel-cobalt mine may benefit from the coming
decarbonization shift.
Economic Forecast Details
annual % change except where noted
19 20E 21F 22F
Real GDP 4.0 -5.1 3.8 1.5
Nominal GDP 4.1 -6.8 9.0 4.5
Employment 1.1 -5.7 3.4 1.0
Unemployment Rate, % 12.3 14.1 13.0 12.2
Housing Starts, 000s 0.9 0.8 0.8 0.8
Total CPI 1.0 0.2 2.1 2.0
30
40
50
60
70
80
90
100
15 16 17 18 19 20p 21
NL*
SK
AB
mining, quarrying & oil & gas capital investment index, 2015 = 100
Investment Intentions Weaker in NL Than Among Other Oil-Producers
* 2019 value is Scotiabank Economics estimate. Sources:Scotiabank Economics, Statistics Canada.
Investment Intentions

March 15, 2021
GLOBAL ECONOMICS
| SCOTIABANK’S PROVINCIAL OUTLOOK
5 Visit our website at scotiabank.com/economics | Follow us on Twitter at @ScotiaEconomics | Contact us by email at [email protected]
Prince Edward Island
INDUSTRY MIX MAY HOLD BACK EVEN STRONGER RECOVERY
• Prince Edward Island’s success in containing COVID-19 sets up strong
growth this year, though challenges remain in some key sectors.
• Homebuilding, capital outlays in the manufacturing sector, and stepped-up
infrastructure spending are expected to bolster the recovery.
PEI has held the lowest per-capita COVID-19 caseload of any Canadian province
for much of the last year and has yet to report a COVID-19 death. As such,
lockdown measures have generally been among the least restrictive in Canada, and
mobility has improved more than in most other regions. This reflects a small
population and island status as well as early and decisive policy action.
Yet labour market results were mixed in 2020. PEI’s relatively subdued 3% full-
time jobs loss in 2020 largely reflected pre-pandemic momentum that carried into Q1;
the jobs recovery since late last summer has been among the softest of any province.
Ditto for hours worked, though some improvement in hiring since October looks to
have translated into Q4-2020 wage and retail sales gains stronger than the national
mean.
Challenges remain in some key sectors. Tourism plays an outsized role in the
Island economy; out-of-province visits are way down with travel restrictions in force.
Agriculture accounted for 6% of full-time jobs before COVID-19 versus just 2% across
Canada and has also held back hiring. The dairy sector—which last year made up
15% of farm cash receipts versus just 10% for Canada—is grappling with pandemic
storage issues, while weak potato yields were also reported amid inclement weather.
Finally, lockdown-resilient financial and technical services made up just 9% of 2019
full-time jobs versus a 16% national mean.
Capital spending trends are more auspicious. With a relatively sound fiscal
position—its latest projections included a deficit at just 2% of output and an easing
debt-to-GDP ratio—PEI raised its infrastructure budget by $45 mn in FY22 (chart).
Alongside housing market tightness, social housing initiatives likely contributed to the
expected 2021 capital outlay gains reported in Statistics Canada’s latest intentions
survey results. That dataset also implies solid business investment gains this year for
aerospace and chemicals manufacturing—two of the Island’s niche products—as well
as food processing. Demand for the latter held up well during lockdowns.
The Asia-Pacific region—especially China—held an important role in PEI’s pre-
pandemic trade profile. The pace of vaccination and recovery in said region should
continue to influence Island trade prospects, alongside any lockdown-related logistical
challenges—especially in the seafood industry.
The safe resumption of immigration flows is particularly important. PEI
experienced the strongest population growth of any province during 2015–19, and
newcomers accounted for three-quarters of those gains—a higher share than in any
other province. Downside risk with respect to our baseline forecast therefore has
potentially outsized negative consequences for the Island over the longer-run.
0
50
100
150
200
FY20 21 22 23 24 25 26
Nov. 2018
Nov. 2019
Nov. 2020
capital expenditures, CAD mn
Sources: Scotiabank Economics, PEI Finance.
PEI Capital BudgetIncreased Again
19 20E 21F 22F
Real GDP 5.1 -3.6 5.2 3.3
Nominal GDP 7.0 -1.7 7.5 5.7
Employment 3.3 -3.2 4.1 2.9
Unemployment Rate, % 8.7 10.4 9.0 7.4
Housing Starts, 000s 1.5 1.2 1.2 1.2
Total CPI 1.2 0.0 2.1 2.2
Economic Forecast Details
annual % change except where noted

March 15, 2021
GLOBAL ECONOMICS
| SCOTIABANK’S PROVINCIAL OUTLOOK
6 Visit our website at scotiabank.com/economics | Follow us on Twitter at @ScotiaEconomics | Contact us by email at [email protected]
Nova Scotia
WELL-POSITIONED AFTER STRONG SECOND HALF SHOWING
• Nova Scotia bounced back from a pronounced economic hit during the first
wave of the pandemic and is now positioned for very strong growth in 2021.
• The presence of high-wage services industries in Nova Scotia bodes well
for population growth and labour market gains.
Two key factors underpinned Nova Scotia’s outsized first half plunge. The first
was its concentration of wholesale and retail trade and accommodation and food
services jobs, which were disproportionately impacted by lockdowns. The second was
the pre-pandemic closure of the Northern Pulp mill in Pictou County, which weighed
heavily on nominal external shipments in the staple paper manufacturing industry.
Both factors appear to be easing, which contributed to a strong H2-2020
rebound. The mill’s closure is undoubtedly a blow to the community in which it
operated, but the drag will likely be diminished this year. Nova Scotia’s success in
limiting COVID-19’s spread—like PEI, it experienced fewer cases during the second
wave than during the first—has allowed life to continue with relatively few restrictions.
That, in turn, has enabled a significant labour market recovery. In January 2021, Nova
Scotia was one of only two provinces in which full-time employment had returned to
pre-pandemic February 2020 levels. It achieved that mark in November of last year—
earlier than any other province.
Nova Scotia’s status as Atlantic Canada’s high-wage services hub remains a
key advantage. Prior to COVID-19, inflows into the province from other Canadian
jurisdictions helped drive the steepest population gains in nearly 50 years, supporting
labour force growth and real estate activity. Net inflows have increased since the
pandemic began (chart), reflecting steady inflows and weaker outflows. Our
hypothesis is that this reflects: a) a light COVID-19 caseload, and b) the presence of
technology and professional and financial services that make Nova Scotia a draw to
workers in other jurisdictions. These sectors tend to be more remote-work-capable
and were key drivers of the province’s H2-2020 labour market rebound. Longer-run,
Federal shipbuilding contracts will support the manufacturing sector.
With healthy pre-pandemic books, Nova Scotia expects to avoid record deficits
and debt burdens in FY21. On the latter, it is well-positioned relative to most other
provinces. Infrastructure spending was increased almost 90% versus FY20.
International immigration prospects remain uncertain as in the rest of the
country. We noted the extent to which Nova Scotia has benefited from successful
attraction and integration of skilled newcomers in many of our previous Outlooks.
Trade with China is another important element of the province’s outlook. Nova
Scotia benefited significantly from foreign sales to the Middle Kingdom—especially in
the seafood industry—before COVID-19
-4
-3
-2
-1
0
1
2
14 15 16 17 18 19 20
Ontario
Quebec
Alberta, Sask.
Atlantic
Other
net interprovincial migration to Nova Scotia, 4Q moving sum, 000s
Rising Pandemic-Time Inflows Into NS a Sign of Things to Come?
Sources: Scotiabank Economics, Statistics Canada.
19 20E 21F 22F
Real GDP 2.4 -4.0 5.6 3.5
Nominal GDP 3.8 -2.1 8.0 5.8
Employment 2.3 -4.7 4.3 3.1
Unemployment Rate, % 7.4 9.8 8.2 6.6
Housing Starts, 000s 4.7 4.9 5.0 4.5
Total CPI 1.6 0.3 2.5 2.4
Economic Forecast Details
annual % change except where noted

March 15, 2021
GLOBAL ECONOMICS
| SCOTIABANK’S PROVINCIAL OUTLOOK
7 Visit our website at scotiabank.com/economics | Follow us on Twitter at @ScotiaEconomics | Contact us by email at [email protected]
New Brunswick
STRONG EXPANSION AFTER RELATIVELY MODEST CONTRACTION
• New Brunswick experienced one of the smallest contractions of any
province last year.
• Recovering fuel consumption and surging forestry prices should support
exports this year.
• A small budget deficit leaves room for more fiscal policy support if needed.
Most data suggest that New Brunswick experienced one of the smallest
contractions of any province last year. Full-time employment and hours worked fell
by less than in any other jurisdiction. Wages and salaries rose by 0.6%—with y/y
gains throughout H2-2020—versus a 1.5% national-level decline. Its business closure
rate was also among the lowest in Canada. This reflects both successful COVID-19
containment—in the first wave and a resurgence in the fall—and a relatively minor
level of exposure to industries most vulnerable to lockdowns.
We anticipate a strong expansion this year, though it may not reach the 6%
range forecast at the national level. That partly reflects growth off of a larger base
following the softer-than-average decline in 2020. As well, though a large second
pandemic wave has eased, but creates a relatively soft handoff into 2021.
More optimistically, capital expenditures now appear poised for solid gains. The
10% annual jump forecast in Statistics Canada’s latest investment intentions survey
was the second-highest of any province. Extremely tight supply-demand conditions in
the Saint John and Moncton housing markets look to be behind the surge of almost
30% penciled in for the real estate industry. Wind power projects also look to be
contributing to an expected surge in utilities industry investment.
New Brunswick is also carrying a very modest budget deficit. The Q3-FY21 fiscal
update projected a deficit of just $13 mn (0.03% of nominal GDP)—the smallest
output share reported by any province this year—and a still-manageable 37% net
debt-to-GDP ratio. Much of the result reflects a spending undershoot related to
“funding held centrally in the Supplementary Funding Provision, Investment in Climate
Change Initiatives, Gaming Revenue Sharing Agreements, and pensions.” It is
unclear whether these savings will persist in later years, but the province nonetheless
has fiscal room to address unexpected costs or bolster its recovery where necessary.
The latest capital budget raised planned outlays through FY26 (chart), with the bulk of
the increases allocated to highway, road, bridge, and building improvements.
Prospects for key commodities look solid. Rising industrial activity and fuel
demand south of the border should support refined crude shipments. Robust US
homebuilding activity and sky-high wood prices are also positive for New Brunswick’s
lumber industry, as are strong prices for Kraft pulp—used in tissue paper and
packaging and in high demand amid a pandemic-induced shift to e-commerce. The
orientation of provincial exports towards these commodities also limits potential
downside from “Buy American” provisions and reinforces our view that US fiscal
stimulus will outweigh any dampening impacts related to protectionist policy.
400
500
600
700
FY21 22 23 24 25 26
Cap. Budget 2020–21
2021–22*
New Brunswick Capital Budget outlays, CAD mn
* FY21 estimate as of Mid-Year Update. Sources: Scotiabank Economics, New Brunswick Finance.
Healthy Balance Sheet Enables New Infrastructure Spending
19 20E 21F 22F
Real GDP 1.2 -3.2 5.2 3.4
Nominal GDP 3.0 -1.3 7.4 5.8
Employment 0.8 -2.6 3.9 2.9
Unemployment Rate, % 8.1 10.0 8.9 7.2
Housing Starts, 000s 2.9 3.5 3.1 2.5
Total CPI 1.7 0.2 2.3 2.1
Economic Forecast Details
annual % change except where noted

March 15, 2021
GLOBAL ECONOMICS
| SCOTIABANK’S PROVINCIAL OUTLOOK
8 Visit our website at scotiabank.com/economics | Follow us on Twitter at @ScotiaEconomics | Contact us by email at [email protected]
Quebec
WAVE 1 REBOUND AND POLICY SUPPORT DRIVE QUEBEC GROWTH
• We expect Quebec’s economy to be among the top performers this year.
• Despite elevated COVID-19 caseloads and strict lockdowns in the first and
second waves, the province has thus far rebounded very strongly.
• Downside is limited by fiscal policy support.
Though Quebec held the highest absolute and per-capita COVID-19 caseload in
Canada for much of the last year, the economic data have also shown robust
rebounds from every period of contraction thus far. Earlier pandemic restrictions
led to output falling by more than the national mean in H1-2020, but the torrid 61% (q/
q ann.) gain reported in Q3 was more than 20 ppts higher than for Canada as a
whole. Similarly, Quebec’s November GDP rebound—second wave restrictions first
came into effect in October 2020—leave it closer to recouping its losses than most of
the rest of the country (chart). The arithmetic is such that that momentum pushes
annual growth in 2021 above the national mean, even with the softer Q1 built into our
forecast to reflect second wave restrictions.
Early capital spending intentions are strong and broad-based. The 7.5% increase
in private-sector outlays anticipated in Quebec in 2021 as of the latest investment
intentions survey trailed only Ontario; hefty gains were expected across mining,
transportation and warehousing, and financial services. Infrastructure outlay boosts
and pre-pandemic policy plans also look to be behind the healthy increases planned
in education, health, and public administration. Over the medium-term, Quebec’s tech
and financial services presence mean that its labour market is relatively able to
withstand lockdown- and remote work-related challenges.
We continue to anticipate that fiscal policy will help to reinforce the recovery as
vaccination efforts proceed. In addition to stepped-up infrastructure spending plans,
the Province will implement a range of workforce training measures that aim to
facilitate the hiring of workers as firms restart operations post-lockdown. It has also
built in sizeable contingency reserves throughout its planning horizon, which should
keep Quebec on track to reduce its debt load over the longer-term. This also leaves
room to address the costs and economic effects of any unexpected virus resurgence.
The hefty US expansion forecast for this year bodes well for Quebec exports,
even in the shadow of potential “Buy American” policies. Alongside the typical
demand impacts usually associated with US growth, a shared North American energy
system and vehicle supply chain may facilitate eventual resolution of any issues. We
also noted throughout negotiations with the Trump administration that the US relies
heavily on imports to meet its domestic needs for aluminum—a key export for
Quebec. Broadly, prospects for aerospace are limited so long as travel restrictions
remain in place.
75
80
85
90
95
100
20/01 20/03 20/05 20/07 20/09 20/11
Quebec
Canada
real GDP, index, Feb. 2020 = 100
Quebec's Recovery Continues to Outpace the National Average
Sources: Scotiabank Economics, Statistics Canada, Institut de la Statistique du Québec.
19 20E 21F 22F
Real GDP 2.7 -5.1 6.6 4.1
Nominal GDP 4.3 -3.9 9.1 9.1
Employment 2.0 -4.8 4.3 3.6
Unemployment Rate, % 5.1 8.9 7.3 5.1
Housing Starts, 000s 48 54 57 52
Total CPI 2.1 0.8 2.3 2.4
Economic Forecast Details
annual % change except where noted

March 15, 2021
GLOBAL ECONOMICS
| SCOTIABANK’S PROVINCIAL OUTLOOK
9 Visit our website at scotiabank.com/economics | Follow us on Twitter at @ScotiaEconomics | Contact us by email at [email protected]
Ontario
AUTOS, REMOTE-CAPABLE SERVICES SET UP STRONG GROWTH
• Ontario’s contraction paced the national mean last year, despite pandemic
lockdowns that lasted longer than in much of the rest of Canada.
• Our base case forecast assumes growth above 6% this year, with support
from remote work capacity and an export rebound.
• Persistently slow population growth represents an important downside risk.
Ontario grappled with longer and stricter COVID-19 restrictions that
disproportionately impacted the key auto manufacturing sector, but suffered a
dip in output only slightly worse than the national average. Two principal factors
explain that result. One is Ontario’s high concentration of industries such as finance,
technology, and professional, scientific and technical services (chart). More able to
adapt to remote work arrangements and deemed essential in some cases, these
sectors were resilient to lockdowns and have largely resumed their upward pre-
pandemic trajectories. Another, related, driver was the strong housing market, which
benefited from resilient high-wage employment, policy support, and apparent
pandemic-time desire for more space outside of the largest population centres.
We are optimistic about the province’s growth prospects this year, assuming
more progress on virus containment. Its high-wage services presence could again
mitigate the impacts of second wave lockdowns. Even flat automobile output this year
would remove the considerable drag related to last year’s 16% plunge, which weighed
heavily on Ontario exports. Metals—Ontario’s second-most important export by
value—should benefit from the strength expected for gold, silver, and base metals
prices this year. Broadly, the recovery in the US industrial sector can reasonably be
expected to bolster manufacturing activity, even in the event that “Buy American”
policies are widely adopted. Residential investment remains supported by low
borrowing costs and tight supply-demand balances.
The prospect of slowing population growth is especially pertinent to Ontario’s
outlook. The province had seen some of its strongest headcount gains in two
decades before the pandemic. Lockdowns and border restrictions have since resulted
in plunging immigrant and admissions, to the point that Ontario’s population declined
on a quarter-over-quarter basis late last year. In-migration from other Canadian
jurisdictions—another source of pre-pandemic headcount gains—also fell off
considerably towards the end of 2020, and international student arrivals remain well
below 2019 levels. We are cautiously optimistic that widespread vaccination, higher
national immigration targets, and the province’s status as a desirable destination for
workers will eventually lead to a recovery, but there is clearly uncertainty on this front.
Ontario’s 2020 Budget—released late last year—assumes sizeable deficits and
a rising debt load throughout the next three years. However, the plan built in
conservative economic forecasts and large contingency reserves that present upside
for budget balances and may help ease the pace of post-pandemic consolidation. Key
policy supports to boost long-run growth include energy cost reductions, support for
transit, and broadband infrastructure investments.
0 5 10 15 20
SK
AB
MB
NL
PE
NB
NS
BC
QC
ON
ICT*
Prof., Sci., Tech.,Fin. Services
% of GDP, 2019
Canada's High-Wage, Remote-Capable Services Capital
* Information & Communication technology.Sources: Scotiabank Economics, Statistics Canada.
19 20E 21F 22F
Real GDP 2.1 -5.7 6.3 4.2
Nominal GDP 3.8 -4.4 9.4 6.8
Employment 2.8 -4.8 4.3 3.8
Unemployment Rate, % 5.6 9.6 8.0 5.6
Housing Starts, 000s 69 81 80 76
Total CPI 1.9 0.6 2.3 2.5
Economic Forecast Details
annual % change except where noted

March 15, 2021
GLOBAL ECONOMICS
| SCOTIABANK’S PROVINCIAL OUTLOOK
10 Visit our website at scotiabank.com/economics | Follow us on Twitter at @ScotiaEconomics | Contact us by email at [email protected]
Manitoba
STEEP SECOND WAVE LOCKDOWNS ERODE EARLY 2020 SUCCESS
• A steep second pandemic wave provides a soft handoff for Manitoba in 2021.
• Virus control and a diversified economy blunted pandemic impacts last year.
• Agriculture and food manufacturing are key sources of strength.
Manitoba’s successful taming of the first wave of COVID-19 in 2020 contributed
to one of the smallest economic contractions of any province. Full-time jobs and
hours in nearly every large industry in Manitoba performed better than they did at the
national level in 2020, particularly in the summer and early fall months. Early
reopening supported better-than-average residential and non-residential building
outlays in the third quarter. Meanwhile, with strong price growth, decent output
increases for key crops such as wheat, soybeans, oats, and canola also lifted
agricultural merchandise export advances, while demand for processed foods was
firm during lockdowns. Generally, Manitoba’s economy is not especially exposed to
any one industry (chart), which helped blunt last year’s downturn and sets up steady
growth going forward.
The second wave was more severe, and led to more restrictive containment
measures than during the first wave. Many indicators suggest a sharper late-2020
slowdown than in much of the rest of the country. Manitoba was the only province to
shed full-time jobs in both November and December 2020—losses were tilted towards
accommodation and food services. Housing and business investment also performed
worse than the Canadian mean in Q4-2020. The good news is that infection rates and
some restrictions have since eased. Hiring bounced back in January 2021, with gains
reported across industries. Looking forward, in a rising metals price environment,
investment intentions in Manitoba’s mining industry are up over 30% versus 2020.
Agricultural prospects will continue to be impacted by Chinese actions. The
Middle Kingdom significantly increased its purchases of Canadian agricultural
products last year, though they remain below the heights of 2017–18 when soybean
imports surged. Chinese demand is also supporting agricultural prices.
Prospects are mixed for transportation equipment. The strong economic rebound
expected south of the border could reasonably be expected to drive a recovery in
related shipments. For aerospace, the outlook depends fundamentally on the extent
to which air travel returns from the pandemic-induced lockdown. More positively,
electric bus manufacturing—a niche industry in Manitoba—may benefit from the shift
towards decarbonization, especially Ottawa’s efforts to electrify mass transit.
Fiscal policy remains supportive. On a per-capita basis, Manitoba had offered the
third-largest package of COVID-19 support measures as of late last year. Federal
transfers will also help reduce the size of its FY21 deficit by roughly $900 mn versus
the projections released in September 2020. Eventual balance will likely involve
spending control—mean annual gains of just 1.4% were built into a pre-pandemic
FY21–24 plan to return to black ink by the latter year. For now, we support and
anticipate continued efforts to tackle the pandemic and bolster the economic recovery.
19 20E 21F 22F
Real GDP 0.6 -3.6 5.1 3.5
Nominal GDP 1.0 -1.6 7.2 6.0
Employment 1.0 -3.7 3.9 3.2
Unemployment Rate, % 5.3 8.0 6.8 5.0
Housing Starts, 000s 6.9 7.3 6.3 6.0
Total CPI 2.3 0.5 2.0 2.2
2 4 6 8 10 12
COVID-19-Vulnerable*
Mining, Oil &Gas
Prof., Sci.,Tech.
Agriculture
Finance
Construction
Mfrg.
Trade
Manitoba
10-Province Avg.
% of GDP, 2019
Manitoba's Broad Industry Base
* Accom., Food, Arts, Ent., Rec. Serv ices. Sources:Scotiabank Economics, Statistics Canada.
Economic Forecast Details
annual % change except where noted

March 15, 2021
GLOBAL ECONOMICS
| SCOTIABANK’S PROVINCIAL OUTLOOK
11 Visit our website at scotiabank.com/economics | Follow us on Twitter at @ScotiaEconomics | Contact us by email at [email protected]
Saskatchewan
MOMENTUM STALLS AFTER CHALLENGING SECOND WAVE
• Though Saskatchewan’s economy took a hit from energy sector weakness
last year, agriculture and other mining helped prevent a deeper contraction.
• Momentum stalled late last year, but improving commodity prices and
production should help reverse course.
• A low debt burden remains despite the pandemic hit to budget balances.
The blow to Saskatchewan’s oil and gas sector was significant last year. Crude
production fell by more than 10%—almost twice the plunge witnessed in any single
year during the last oil price downturn (chart)—and led to steep a drop in full-time
mining and oil & gas extraction employment. That, in turn, translated into weakness in
servicing industries such as manufacturing and construction, as experienced in past
downturns. The surge in second wave infections—after successful control in the first
round—was also an unfortunate development. Recent oil price gains should
eventually support a recovery in oil production and job creation in natural resources
and adjacent sectors, but the latest intentions survey suggests muted prospects for
capital outlays this year.
The good news is that other commodities have helped to mitigate oil and gas
weakness. Potash production rose 8% last year and is expected to enjoy further price
and output increases this year. The latest Scotiabank metals price forecast update
assumed that uranium production would restart and ramp up at the Cigar Lake mine
in the coming years.
For agriculture, hefty Chinese purchase volumes remain the dominant trend.
This has persisted since the autumn of 2020, to the extent that it has raised fears of
shortages, and boosted prices for staple crops wheat, canola, and lentils to multi-year
highs. The African swine fever’s impact on the domestic herd has also necessitated
greater meat imports by the Middle Kingdom. Whether the pace of recent gains
continues to support nominal export values and farm incomes in the face of Sino-
Canadian diplomatic tensions is the key question. Gains stalled somewhat to close
out 2020, which looks to be translating into agricultural employment weakness.
Early signs in the leadup to the April 6, 2021 budget are that a return to balance
may be delayed beyond FY25 as previously planned; Saskatchewan still
maintains a modest debt burden. Citing a still-fragile recovery from the pandemic,
the government has indicated that it may not embark on the outer-year spending
reductions that had been a key plank of the blueprint released in August 2020.
Promises outlined in last year’s election campaign—including electricity rate cuts
across the spectrum of users, small business tax reductions, and funding for more
health care sector hiring—will likely also be factored into the coming fiscal plan. In any
case, the Province will likely maintain a net debt-to-GDP ratio in the 20–25% range in
the coming years, having managed to reduce program spending from FY16 to FY20.
19 20E 21F 22F
Real GDP -0.7 -5.2 5.9 3.6
Nominal GDP 0.1 -7.5 10.7 7.4
Employment 1.9 -4.7 4.0 3.3
Unemployment Rate, % 5.6 8.4 7.0 5.1
Housing Starts, 000s 2.4 3.1 3.2 3.5
Total CPI 1.7 0.6 2.4 2.5
-30
-20
-10
0
10
20
08 10 12 14 16 18 20
SaskatchewanNewfoundland & LabradorAlberta
oil production, % change
Last Oil Price
Downturn
Production in Canada's Oil-Producing Provinces
Sources: Scotiabank Economics, C -NOLPB, Alberta Finance and Treasury Board, Sask.Ministry of Energy & Resources
GFC
COVID-19
Economic Forecast Details
annual % change except where noted
March 15, 2021
GLOBAL ECONOMICS
| SCOTIABANK’S PROVINCIAL OUTLOOK
12 Visit our website at scotiabank.com/economics | Follow us on Twitter at @ScotiaEconomics | Contact us by email at [email protected]
Alberta
LIFTED BY OIL PRICE GAINS
• Alberta experienced the deepest recession of any province last year as it
dealt with the effects of COVID-19 and a plunge in oil and gas activity.
• Rising crude values to begin this year bode well for a solid rebound in 2021,
but the pandemic extends recovery from the last downturn to eight years.
• For non-energy industries, petrochemicals and forestry face the best near-
term prospects, but full economic diversification remains a long-run goal.
Alberta was harder-hit than any other provincial economy in 2020, a result of its
oil and gas industry intensity. It witnessed the steepest drop in wages and salaries
last year, the second-largest reductions in hours worked and active businesses, and
as of January, its full-time workforce was further from its February 2020 peak than any
other jurisdiction. Crude production fell by 5%—more than in 2016 at the height of the
last commodity price correction—and drilling activity at one point reached an all-time
low, driving a 38% decline in oil and gas investment at the national level in 2020.
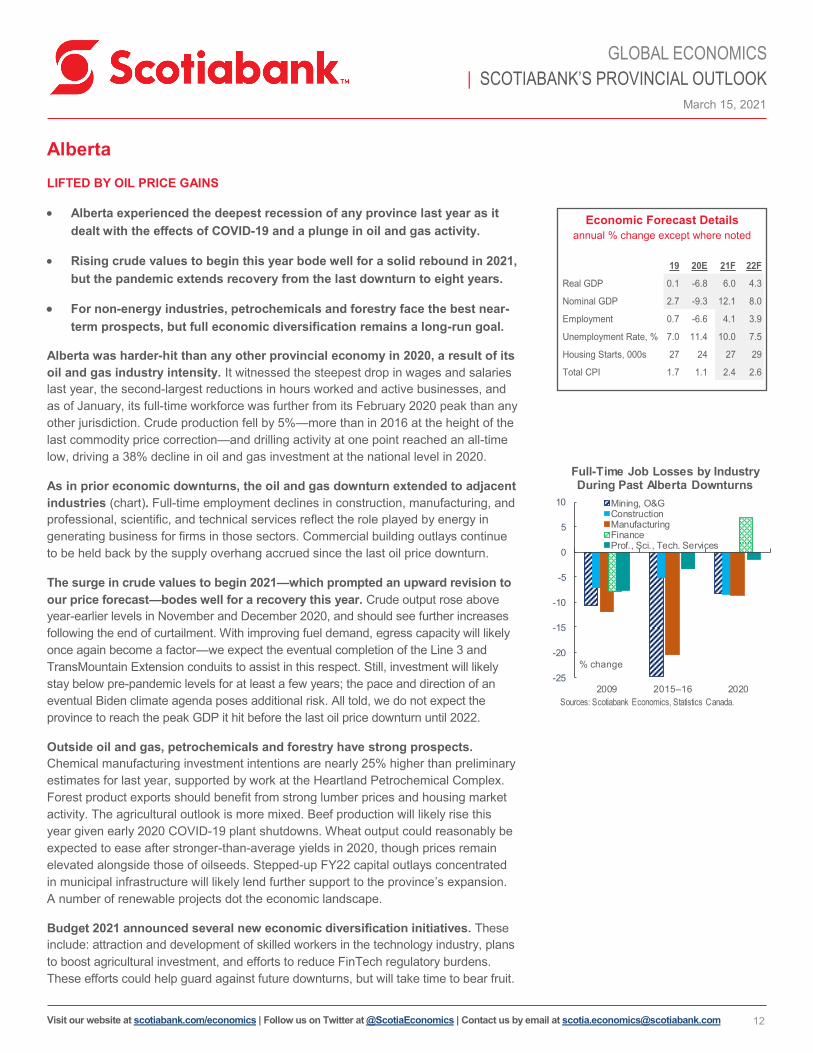
As in prior economic downturns, the oil and gas downturn extended to adjacent
industries (chart). Full-time employment declines in construction, manufacturing, and
professional, scientific, and technical services reflect the role played by energy in
generating business for firms in those sectors. Commercial building outlays continue
to be held back by the supply overhang accrued since the last oil price downturn.
The surge in crude values to begin 2021—which prompted an upward revision to
our price forecast—bodes well for a recovery this year. Crude output rose above
year-earlier levels in November and December 2020, and should see further increases
following the end of curtailment. With improving fuel demand, egress capacity will likely
once again become a factor—we expect the eventual completion of the Line 3 and
TransMountain Extension conduits to assist in this respect. Still, investment will likely
stay below pre-pandemic levels for at least a few years; the pace and direction of an
eventual Biden climate agenda poses additional risk. All told, we do not expect the
province to reach the peak GDP it hit before the last oil price downturn until 2022.
Outside oil and gas, petrochemicals and forestry have strong prospects.
Chemical manufacturing investment intentions are nearly 25% higher than preliminary
estimates for last year, supported by work at the Heartland Petrochemical Complex.
Forest product exports should benefit from strong lumber prices and housing market
activity. The agricultural outlook is more mixed. Beef production will likely rise this
year given early 2020 COVID-19 plant shutdowns. Wheat output could reasonably be
expected to ease after stronger-than-average yields in 2020, though prices remain
elevated alongside those of oilseeds. Stepped-up FY22 capital outlays concentrated
in municipal infrastructure will likely lend further support to the province’s expansion.
A number of renewable projects dot the economic landscape.
Budget 2021 announced several new economic diversification initiatives. These
include: attraction and development of skilled workers in the technology industry, plans
to boost agricultural investment, and efforts to reduce FinTech regulatory burdens.
These efforts could help guard against future downturns, but will take time to bear fruit.
19 20E 21F 22F
Real GDP 0.1 -6.8 6.0 4.3
Nominal GDP 2.7 -9.3 12.1 8.0
Employment 0.7 -6.6 4.1 3.9
Unemployment Rate, % 7.0 11.4 10.0 7.5
Housing Starts, 000s 27 24 27 29
Total CPI 1.7 1.1 2.4 2.6
-25
-20
-15
-10
-5
0
5
10
2009 2015–16 2020
Mining, O&GConstructionManufacturingFinanceProf., Sci., Tech. Services
% change
Full-Time Job Losses by Industry During Past Alberta Downturns
Sources: Scotiabank Economics, Statistics Canada.
Economic Forecast Details
annual % change except where noted
March 15, 2021
GLOBAL ECONOMICS
| SCOTIABANK’S PROVINCIAL OUTLOOK
13 Visit our website at scotiabank.com/economics | Follow us on Twitter at @ScotiaEconomics | Contact us by email at [email protected]
British Columbia
POSITIONED FOR STRONG RECOVERY DESPITE TOURISM
• BC’s economy was a mixed bag last year but carries momentum into 2021;
we expect it to continue to modestly outperform the Canadian average.
• Major projects, the tech sector, and a light virus caseload are advantages.
• Key questions surround tourism-oriented sectors.
We noted the outsized tourism industry share of BC’s economy in our last
Provincial Outlook; related challenges will likely hold back the province’s
rebound. Firms in the sector—and in adjacent ones such as accommodation and
food services, retail, and recreation—are unlikely to be able to operate at full capacity
while COVID-19 remains a threat and physical gathering restrictions stay in place.
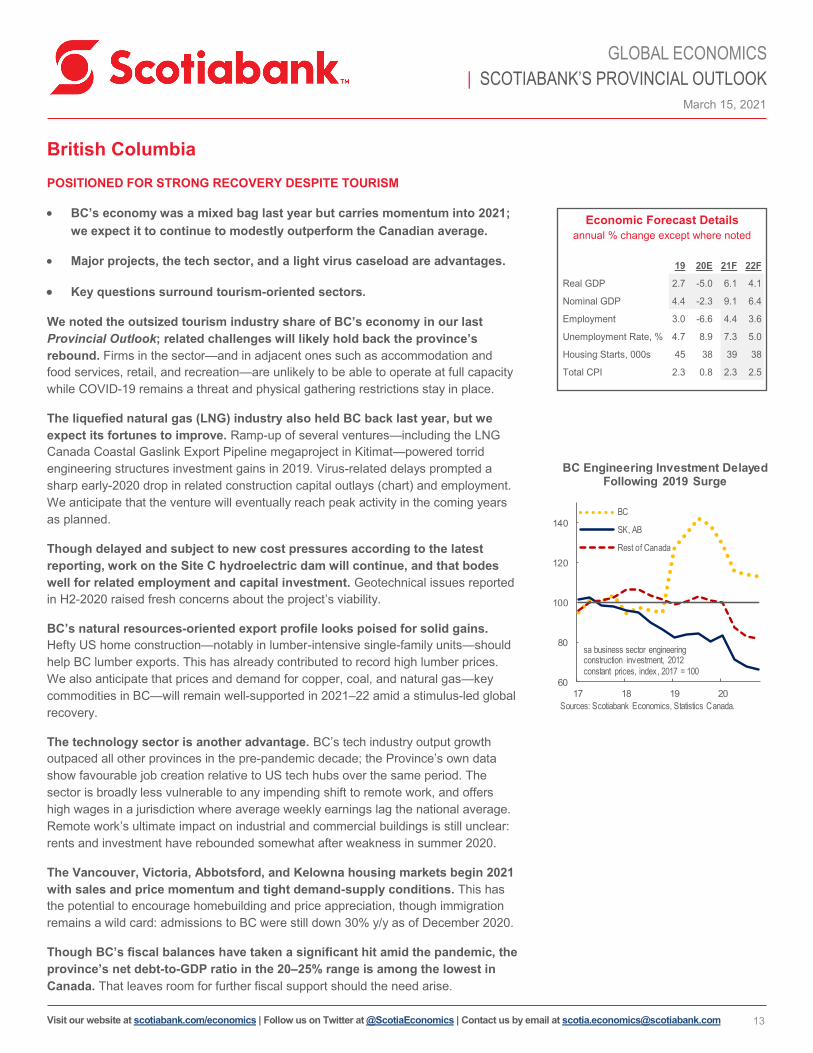
The liquefied natural gas (LNG) industry also held BC back last year, but we
expect its fortunes to improve. Ramp-up of several ventures—including the LNG
Canada Coastal Gaslink Export Pipeline megaproject in Kitimat—powered torrid
engineering structures investment gains in 2019. Virus-related delays prompted a
sharp early-2020 drop in related construction capital outlays (chart) and employment.
We anticipate that the venture will eventually reach peak activity in the coming years
as planned.
Though delayed and subject to new cost pressures according to the latest
reporting, work on the Site C hydroelectric dam will continue, and that bodes
well for related employment and capital investment. Geotechnical issues reported
in H2-2020 raised fresh concerns about the project’s viability.
BC’s natural resources-oriented export profile looks poised for solid gains.
Hefty US home construction—notably in lumber-intensive single-family units—should
help BC lumber exports. This has already contributed to record high lumber prices.
We also anticipate that prices and demand for copper, coal, and natural gas—key
commodities in BC—will remain well-supported in 2021–22 amid a stimulus-led global
recovery.
The technology sector is another advantage. BC’s tech industry output growth
outpaced all other provinces in the pre-pandemic decade; the Province’s own data
show favourable job creation relative to US tech hubs over the same period. The
sector is broadly less vulnerable to any impending shift to remote work, and offers
high wages in a jurisdiction where average weekly earnings lag the national average.
Remote work’s ultimate impact on industrial and commercial buildings is still unclear:
rents and investment have rebounded somewhat after weakness in summer 2020.
The Vancouver, Victoria, Abbotsford, and Kelowna housing markets begin 2021
with sales and price momentum and tight demand-supply conditions. This has
the potential to encourage homebuilding and price appreciation, though immigration
remains a wild card: admissions to BC were still down 30% y/y as of December 2020.
Though BC’s fiscal balances have taken a significant hit amid the pandemic, the
province’s net debt-to-GDP ratio in the 20–25% range is among the lowest in
Canada. That leaves room for further fiscal support should the need arise.
19 20E 21F 22F
Real GDP 2.7 -5.0 6.1 4.1
Nominal GDP 4.4 -2.3 9.1 6.4
Employment 3.0 -6.6 4.4 3.6
Unemployment Rate, % 4.7 8.9 7.3 5.0
Housing Starts, 000s 45 38 39 38
Total CPI 2.3 0.8 2.3 2.5
60
80
100
120
140
17 18 19 20
BC
SK, AB
Rest of Canada
sa business sector engineering construction investment, 2012 constant prices, index, 2017 = 100
Sources: Scotiabank Economics, Statistics Canada.
BC Engineering Investment Delayed Following 2019 Surge
Economic Forecast Details
annual % change except where noted
March 15, 2021
GLOBAL ECONOMICS
| SCOTIABANK’S PROVINCIAL OUTLOOK
14 Visit our website at scotiabank.com/economics | Follow us on Twitter at @ScotiaEconomics | Contact us by email at [email protected]
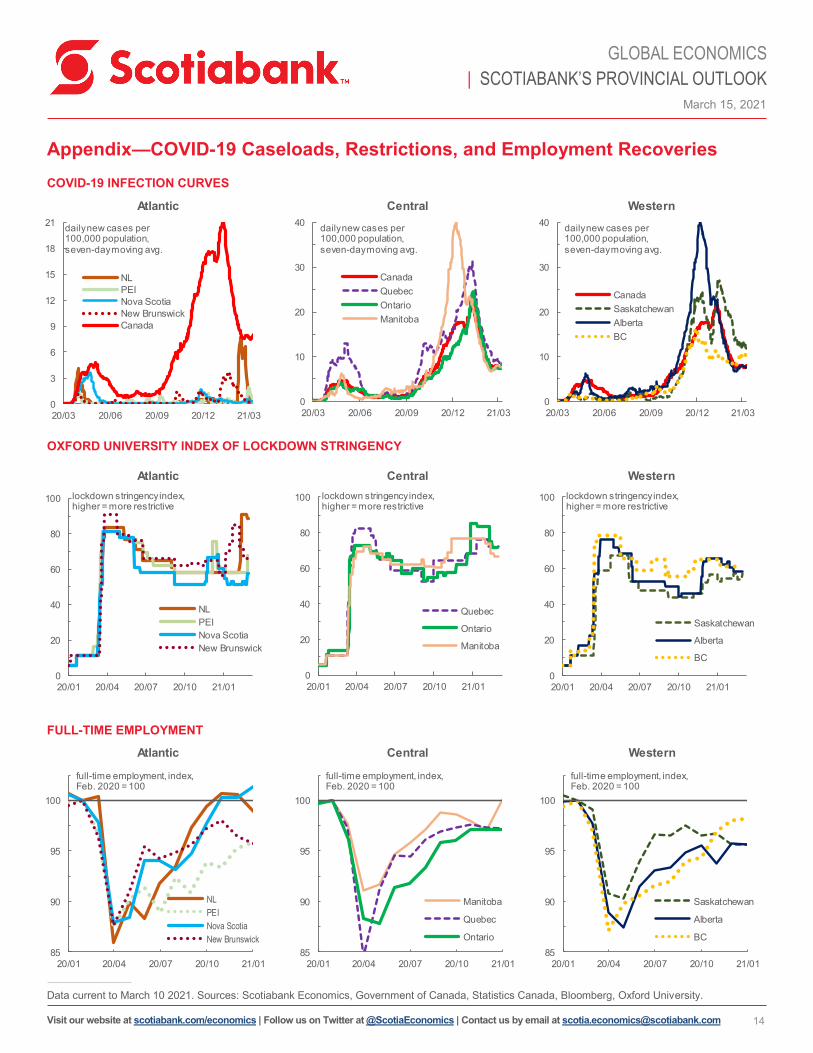
Appendix—COVID-19 Caseloads, Restrictions, and Employment Recoveries
COVID-19 INFECTION CURVES
OXFORD UNIVERSITY INDEX OF LOCKDOWN STRINGENCY
FULL-TIME EMPLOYMENT
Data current to March 10 2021. Sources: Scotiabank Economics, Government of Canada, Statistics Canada, Bloomberg, Oxford University.
0
10
20
30
40
20/03 20/06 20/09 20/12 21/03
Canada
Saskatchewan
Alberta
BC
daily new cases per 100,000 population, seven-daymoving avg.
Western
0
10
20
30
40
20/03 20/06 20/09 20/12 21/03
Canada
Quebec
Ontario
Manitoba
daily new cases per 100,000 population, seven-daymoving avg.
Central
0
3
6
9
12
15
18
21
20/03 20/06 20/09 20/12 21/03
NL
PEI
Nova Scotia
New Brunswick
Canada
daily new cases per 100,000 population, seven-day moving avg.
Atlantic
0
20
40
60
80
100
20/01 20/04 20/07 20/10 21/01
NL
PEI
Nova Scotia
New Brunswick
lockdown stringency index, higher = more restrictive
Atlantic
0
20
40
60
80
100
20/01 20/04 20/07 20/10 21/01
Quebec
Ontario
Manitoba
lockdown stringency index, higher = more restrictive
Central
0
20
40
60
80
100
20/01 20/04 20/07 20/10 21/01
Saskatchewan
Alberta
BC
lockdown stringency index, higher = more restrictive
Western
85
90
95
100
20/01 20/04 20/07 20/10 21/01
NL
PEI
Nova Scotia
New Brunswick
full-time employment, index, Feb. 2020 = 100
Atlantic
85
90
95
100
20/01 20/04 20/07 20/10 21/01
Manitoba
Quebec
Ontario
full-time employment, index, Feb. 2020 = 100
Central
85
90
95
100
20/01 20/04 20/07 20/10 21/01
Saskatchewan
Alberta
BC
full-time employment, index, Feb. 2020 = 100
Western

March 15, 2021
GLOBAL ECONOMICS
| SCOTIABANK’S PROVINCIAL OUTLOOK
15 Visit our website at scotiabank.com/economics | Follow us on Twitter at @ScotiaEconomics | Contact us by email at [email protected]
Real GDP CA NL PE NS NB QC ON MB SK AB BC
2010–19 2.2 1.0 2.3 1.1 0.7 1.9 2.3 2.1 2.2 2.6 2.8
2019 1.9 4.0 5.1 2.4 1.2 2.7 2.1 0.6 -0.7 0.1 2.7
2020e -5.4 -5.1 -3.6 -4.0 -3.2 -5.1 -5.7 -3.6 -5.2 -6.8 -5.0
2021f 6.2 3.8 5.2 5.6 5.2 6.6 6.3 5.1 5.9 6.0 6.1
2022f 4.0 1.5 3.3 3.5 3.4 4.1 4.2 3.5 3.6 4.3 4.1
Nominal GDP
2010–19 4.0 3.5 4.3 2.9 2.8 3.8 4.1 3.8 3.3 3.7 4.5
2019 3.6 4.1 7.0 3.8 3.0 4.3 3.8 1.0 0.1 2.7 4.4
2020e -4.6 -6.8 -1.7 -2.1 -1.3 -3.9 -4.4 -1.6 -7.5 -9.3 -2.3
2021f 9.7 9.0 7.5 8.0 7.4 9.1 9.4 7.2 10.7 12.1 9.1
2022f 6.9 4.5 5.7 5.8 5.8 6.8 6.8 6.0 7.4 8.0 6.4
Employment
2010–19 1.3 0.6 1.5 0.3 0.0 1.2 1.4 0.9 0.8 1.2 2.0
2019 2.2 1.1 3.3 2.3 0.8 2.0 2.8 1.0 1.9 0.7 3.0
2020 -5.1 -5.7 -3.2 -4.7 -2.6 -4.8 -4.8 -3.7 -4.7 -6.6 -6.6
2021f 4.2 3.4 4.1 4.3 3.9 4.3 4.3 3.9 4.0 4.1 4.4
2022f 3.6 1.0 2.9 3.1 2.9 3.6 3.8 3.2 3.3 3.9 3.6
Unemployment Rate (%)
2010–19 6.9 13.3 10.6 8.7 9.4 7.1 7.0 5.6 5.3 6.2 6.1
2019 5.7 12.3 8.7 7.4 8.1 5.1 5.6 5.3 5.6 7.0 4.7
2020 9.6 14.1 10.4 9.8 10.0 8.9 9.6 8.0 8.4 11.4 8.9
2021f 8.0 13.0 9.0 8.2 8.9 7.3 8.0 6.8 7.0 10.0 7.3
2022f 5.7 12.2 7.4 6.6 7.2 5.1 5.6 5.0 5.1 7.5 5.0
Housing Starts (units, 000s)
2010–19 201 2.2 0.8 4.2 2.7 44 70 6.6 6.0 31 34
2019 209 0.9 1.5 4.7 2.9 48 69 6.9 2.4 27 45
2020 219 0.8 1.0 4.9 3.7 55 81 7.3 3.1 24 38
2021f 222 0.8 1.2 5.0 3.1 57 80 6.3 3.2 27 39
2022f 214 0.8 1.2 4.5 2.5 52 76 6.0 3.5 29 38
Motor Vehicle Sales (units, 000s)
2010–19 1,819 33 7 51 41 432 715 55 53 237 194
2019 1,916 34 8 53 41 454 789 53 46 227 214
2020 1,569 28 7 44 34 376 612 46 40 186 180
2021f 1,790 31 8 50 38 439 712 52 45 211 206
2022f 1,920 32 8 52 40 472 769 54 47 225 221
Budget Balances, (CAD mn)
2019* -39,400 -1,383 22 2 98 4 -8,672 5 -319 -12,152 -321
2020e -381,600 -1,838 -178 -779 -13 -2,991 -38,468 -2,048 -2,045 -20,192 -13,643
2021f -141,200 -70 -8,250 -33,100 -1,350 -18,221
2022f -50,700 -38 -7,000 -28,150 -855 -10,982
(annual % change except where noted)
* NL budget balance in 2019 is net of one-time revenue boost via Atlantic Accord .
Sources: Scotiabank Economics, Statistics Canada, CMHC, Budget documents; Quebec budget balance figures are after Generations Fund and Stabilization Reserve transfers.
Provincial Forecast Summary

March 15, 2021
GLOBAL ECONOMICS
| SCOTIABANK’S PROVINCIAL OUTLOOK
This report has been prepared by Scotiabank Economics as a resource for the clients of Scotiabank. Opinions, estimates and projections
contained herein are our own as of the date hereof and are subject to change without notice. The information and opinions contained herein
have been compiled or arrived at from sources believed reliable but no representation or warranty, express or implied, is made as to their
accuracy or completeness. Neither Scotiabank nor any of its officers, directors, partners, employees or affiliates accepts any liability whatsoever
for any direct or consequential loss arising from any use of this report or its contents.
These reports are provided to you for informational purposes only. This report is not, and is not constructed as, an offer to sell or solicitation of
any offer to buy any financial instrument, nor shall this report be construed as an opinion as to whether you should enter into any swap or
trading strategy involving a swap or any other transaction. The information contained in this report is not intended to be, and does not
constitute, a recommendation of a swap or trading strategy involving a swap within the meaning of U.S. Commodity Futures Trading
Commission Regulation 23.434 and Appendix A thereto. This material is not intended to be individually tailored to your needs or characteristics
and should not be viewed as a “call to action” or suggestion that you enter into a swap or trading strategy involving a swap or any other
transaction. Scotiabank may engage in transactions in a manner inconsistent with the views discussed this report and may have positions, or
be in the process of acquiring or disposing of positions, referred to in this report.
Scotiabank, its affiliates and any of their respective officers, directors and employees may from time to time take positions in currencies, act as
managers, co-managers or underwriters of a public offering or act as principals or agents, deal in, own or act as market makers or advisors,
brokers or commercial and/or investment bankers in relation to securities or related derivatives. As a result of these actions, Scotiabank may
receive remuneration. All Scotiabank products and services are subject to the terms of applicable agreements and local regulations. Officers,
directors and employees of Scotiabank and its affiliates may serve as directors of corporations.
Any securities discussed in this report may not be suitable for all investors. Scotiabank recommends that investors independently evaluate any
issuer and security discussed in this report, and consult with any advisors they deem necessary prior to making any investment.
This report and all information, opinions and conclusions contained in it are protected by copyright. This information may not be
reproduced without the prior express written consent of Scotiabank.
™ Trademark of The Bank of Nova Scotia. Used under license, where applicable.
Scotiabank, together with “Global Banking and Markets”, is a marketing name for the global corporate and investment banking and capital
markets businesses of The Bank of Nova Scotia and certain of its affiliates in the countries where they operate, including, Scotiabanc Inc.;
Citadel Hill Advisors L.L.C.; The Bank of Nova Scotia Trust Company of New York; Scotiabank Europe plc; Scotiabank (Ireland) Limited;
Scotiabank Inverlat S.A., Institución de Banca Múltiple, Scotia Inverlat Casa de Bolsa S.A. de C.V., Scotia Inverlat Derivados S.A. de C.V. – all
members of the Scotiabank group and authorized users of the Scotiabank mark. The Bank of Nova Scotia is incorporated in Canada with
limited liability and is authorised and regulated by the Office of the Superintendent of Financial Institutions Canada. The Bank of Nova Scotia is
authorised by the UK Prudential Regulation Authority and is subject to regulation by the UK Financial Conduct Authority and l imited regulation
by the UK Prudential Regulation Authority. Details about the extent of The Bank of Nova Scotia's regulation by the UK Prudential Regulation
Authority are available from us on request. Scotiabank Europe plc is authorised by the UK Prudential Regulation Authority and regulated by the
UK Financial Conduct Authority and the UK Prudential Regulation Authority.
Scotiabank Inverlat, S.A., Scotia Inverlat Casa de Bolsa, S.A. de C.V., and Scotia Derivados, S.A. de C.V., are each authorized and regulated
by the Mexican financial authorities.
Not all products and services are offered in all jurisdictions. Services described are available in jurisdictions where permitted by law.
Visit our website at scotiabank.com/economics | Follow us on Twitter at @ScotiaEconomics | Contact us by email at [email protected]
Top Related