


Languages
Pages
Legal

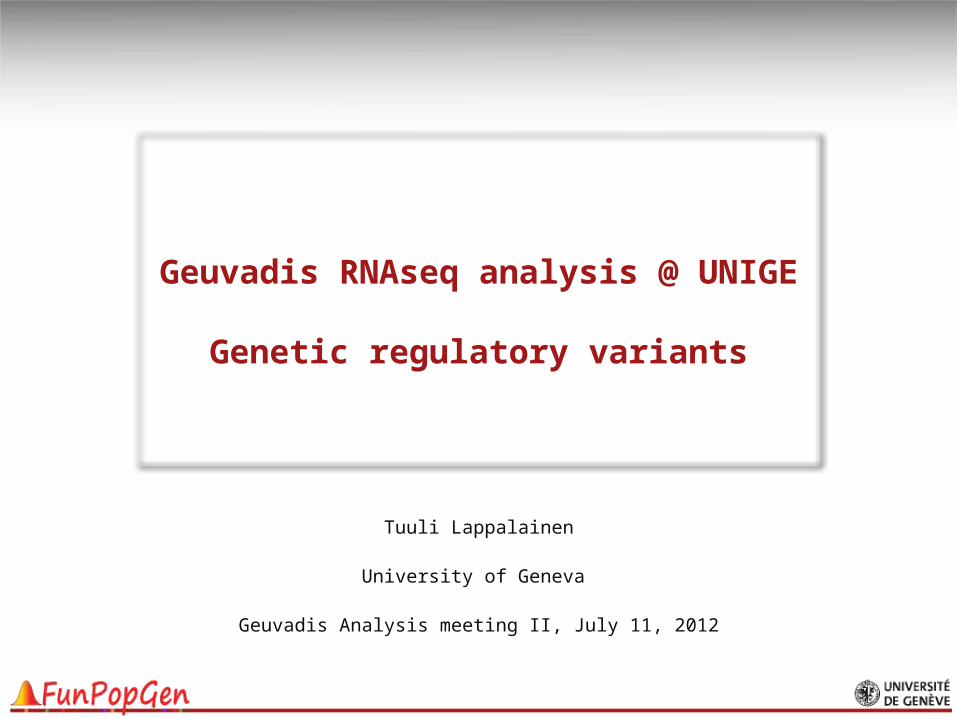
Geuvadis RNAseq analysis @ UNIGE
Genetic regulatory variants
Tuuli Lappalainen
University of Geneva
Geuvadis Analysis meeting II, July 11, 2012

Expression quantitative trait loci (eQTLs)
T
C
Genotypes
Expre
ssio
n
level
Works very well in cis. Difficult in trans
The same principle can be applied to any quantitative phenotype with a genomic locus
Statistical power only for common variants

QC – mRNA quantifications

miRNA QC
POP
LAB

eQTLs in Geuvadis
Pop N Genes with eQTL (FDR)
Best eQTL indel (null 8.9%)
CEU+GBR 161 2608 (5.1%) 375 (14.4%)
TSI 92 1748 (7.7%) 242 (13.8%)
FIN 89 1822 (7.3%) 255 (14.0%)
YRI 77 2138 (6.3%) 242 (11.3%)
EUR union 342 3898 NA
ALL union 419 4895 NA
TODO:Some methodological improvementsCombine Europeans with a PC correction of pop structureTest exon versus transcript quantification
Trans-analysis of large deletions didn’t yield much…

Splicing QTLs (sQTLs) in Geuvadis
Pop N Genes with sQTL – transcript ratio
Genes with sQTL – links
CEU+GBR 161 121 (FDR 9.1%) 1251 forward (FDR 5.6%)1077 reverse (FDR 6.6%)nonredundant: 1949
ALL union 419 274 NA
E1 E2 E3
FRE1-E2 = 5 (RE1-E2) / 5 (RE1-E2) + 3 (RE1-E3) = 0.625
FRE1-E3 = 3 (RE1-E3) / 5 (RE1-E2) + 3 (RE1-E3) = 0.375
ALTRANS method by Halit Ongen
links or junctions?counts or fractions?

Integrating transcriptome QTLs
eQTLs for mRNA and miRNA
exon/miRNA_quantification ~ snp + covariates
sQTLs
link/junction_ratio ~ snp + covariates
link/junction quantification ~ snp + exon_quantification + covariates
multiple tQTLs: for the same gene
exon_quantification ~ snp2 + exon_eQTL_snp1 + covariates
link/junction ratio ~ snp2 + exon_eQTL_snp1 + covariates
targeted trans analysis
exon quantification ~ mi(eQTL)_snp + covariates
link/junction_ratio ~ mieQTL_snp + covariates

Functional annotation of eQTLs
TODO:Direction of effectTF motifs, PWM scoresDifferent eQTL frequenciesOther tQTLsWhat’s the best way to tell if we have the causal variant or not? And how often do we seem to find it?

Allele specific expression
A C
G T
CC
TT
T TT
cis eQTL* coding SNP mRNA-sequencingStatistical testing for ASE
What is the allelic ratio? Significantly different from 50-50?
*or an epigenetic reason for higher expression of only one homolog in the studied cell population (e.g. imprinting)

Rare variants have higher effect sizes
0 0.5 1 derived allele frequency
pow
er
in e
QTL
analy
sis
eQTL analysis – expected result
ASE analysis
~ REGULATORY VARIANT FREQUENCY
Proper quantification of the effect?
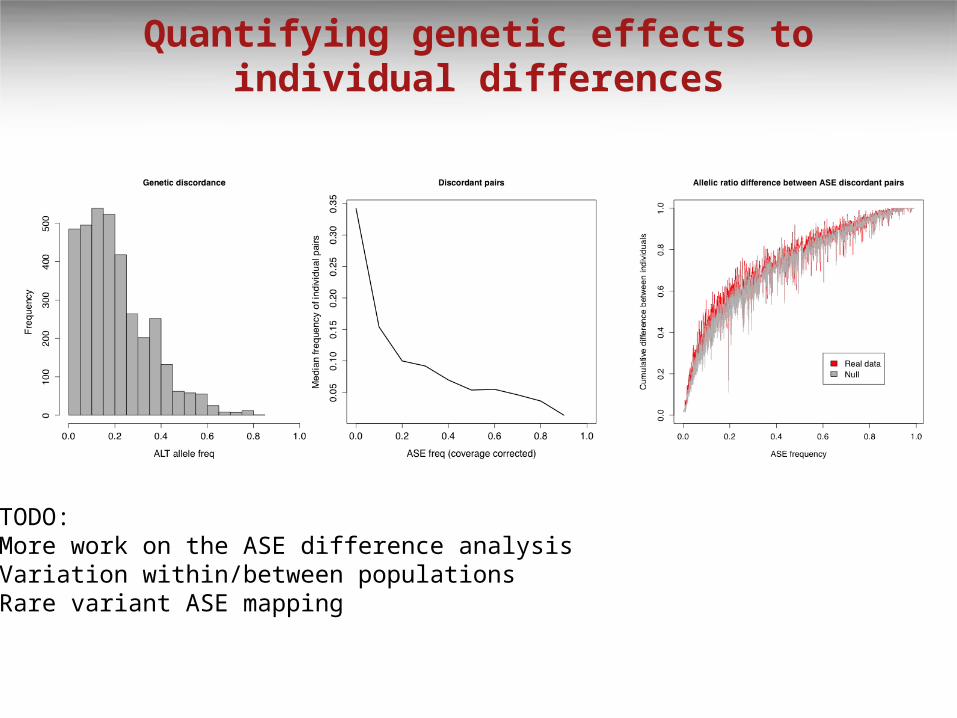
Quantifying genetic effects to individual differences
TODO:More work on the ASE difference analysisVariation within/between populationsRare variant ASE mapping

Can we predict functional effects of genetic variants?
How likely is an unknown variant to have regulatory effects based on known priors?
Gene expression ~ variant’s : distance from TSS + position in gene + functional annotation + allele frequency + conservation score + variant type…
“gene expression” could be e.g. exon quantification or link ratio
(Gaffney et al. 2012 Genome Biology)
Does anyone have good experience of this type of modeling?
Acknowledgements
The FunPopGen lab
Manolis Dermitzakis
AnalysisAlfonso BuilThomas GigerHalit Ongen
Data processingIsmael PadioleauAlisa Yurovsky
TechniciansDeborah BielsenEmilie FalconnetAlexandra PlanchonLuciana Romano
Stanford School of MedicineStephen Montgomery
The 1000 Genomes ConsortiumFunctional Interpretation Group
FUNDINGEuropean UnionNational Institute of HealthLouis-Jeantet FoundationAcademy of FinlandEmil Aaltonen FoundationSwiss National Science FoundationNCCR
Top Related