


Languages
Pages
Legal

ApplicationNews
No.M268
Gas Chromatography Mass Spectrometry
Analysis of Residual Solvents – Class 1, Class 2A, Class 2B – in Pharmaceuticals Using Headspace-GC/MS
LAAN-A-MS-E034
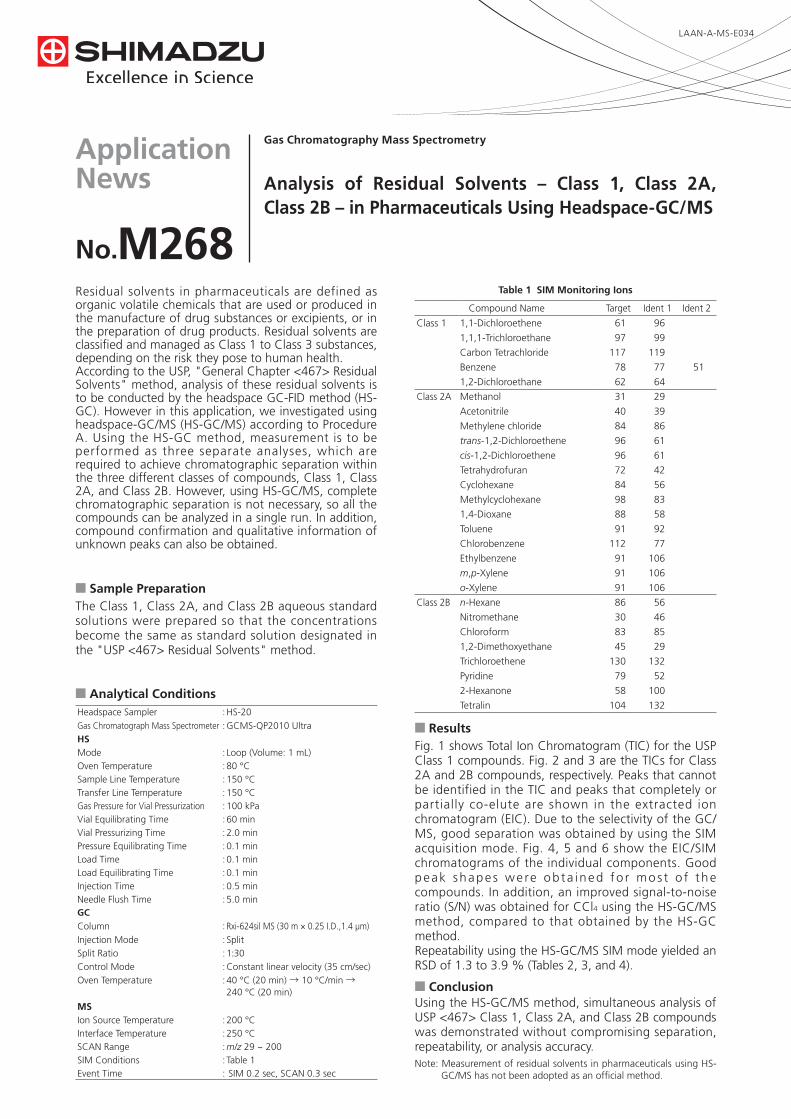
Residual solvents in pharmaceuticals are defined as organic volatile chemicals that are used or produced in the manufacture of drug substances or excipients, or in the preparation of drug products. Residual solvents are classified and managed as Class 1 to Class 3 substances, depending on the risk they pose to human health.According to the USP, "General Chapter <467> Residual Solvents" method, analysis of these residual solvents is to be conducted by the headspace GC-FID method (HS-GC). However in this application, we investigated using headspace-GC/MS (HS-GC/MS) according to Procedure A. Using the HS-GC method, measurement is to be performed as three separate analyses, which are required to achieve chromatographic separation within the three different classes of compounds, Class 1, Class 2A, and Class 2B. However, using HS-GC/MS, complete chromatographic separation is not necessary, so all the compounds can be analyzed in a single run. In addition, compound confirmation and qualitative information of unknown peaks can also be obtained.
n Sample PreparationThe Class 1, Class 2A, and Class 2B aqueous standard solutions were prepared so that the concentrations become the same as standard solution designated in the "USP <467> Residual Solvents" method.
Headspace Sampler : HS-20
Gas Chromatograph Mass Spectrometer : GCMS-QP2010 UltraHSMode : Loop (Volume: 1 mL)Oven Temperature : 80 °CSample Line Temperature : 150 °CTransfer Line Temperature : 150 °CGas Pressure for Vial Pressurization : 100 kPaVial Equilibrating Time :60 minVial Pressurizing Time :2.0 minPressure Equilibrating Time :0.1 minLoad Time :0.1 minLoad Equilibrating Time :0.1 minInjection Time :0.5 minNeedle Flush Time :5.0 minGC
Column : Rxi-624sil MS (30 m × 0.25 I.D.,1.4 µm)
Injection Mode :Split Split Ratio :1:30Control Mode :Constant linear velocity (35 cm/sec)Oven Temperature :40 °C (20 min) → 10 °C/min →
240 °C (20 min)
MSIon Source Temperature : 200 °CInterface Temperature : 250 °CSCAN Range :m/z 29 ~ 200SIM Conditions : Table 1Event Time : SIM 0.2 sec, SCAN 0.3 sec
Compound Name Target Ident 1 Ident 2
Class 1 1,1-Dichloroethene 61 96
1,1,1-Trichloroethane 97 99
Carbon Tetrachloride 117 119
Benzene 78 77 51
1,2-Dichloroethane 62 64
Class 2A Methanol 31 29
Acetonitrile 40 39
Methylene chloride 84 86
trans-1,2-Dichloroethene 96 61
cis-1,2-Dichloroethene 96 61
Tetrahydrofuran 72 42
Cyclohexane 84 56
Methylcyclohexane 98 83
1,4-Dioxane 88 58
Toluene 91 92
Chlorobenzene 112 77
Ethylbenzene 91 106
m,p-Xylene 91 106
o-Xylene 91 106
Class 2B n-Hexane 86 56
Nitromethane 30 46
Chloroform 83 85
1,2-Dimethoxyethane 45 29
Trichloroethene 130 132
Pyridine 79 52
2-Hexanone 58 100
Tetralin 104 132n Analytical Conditions
Table 1 SIM Monitoring Ions
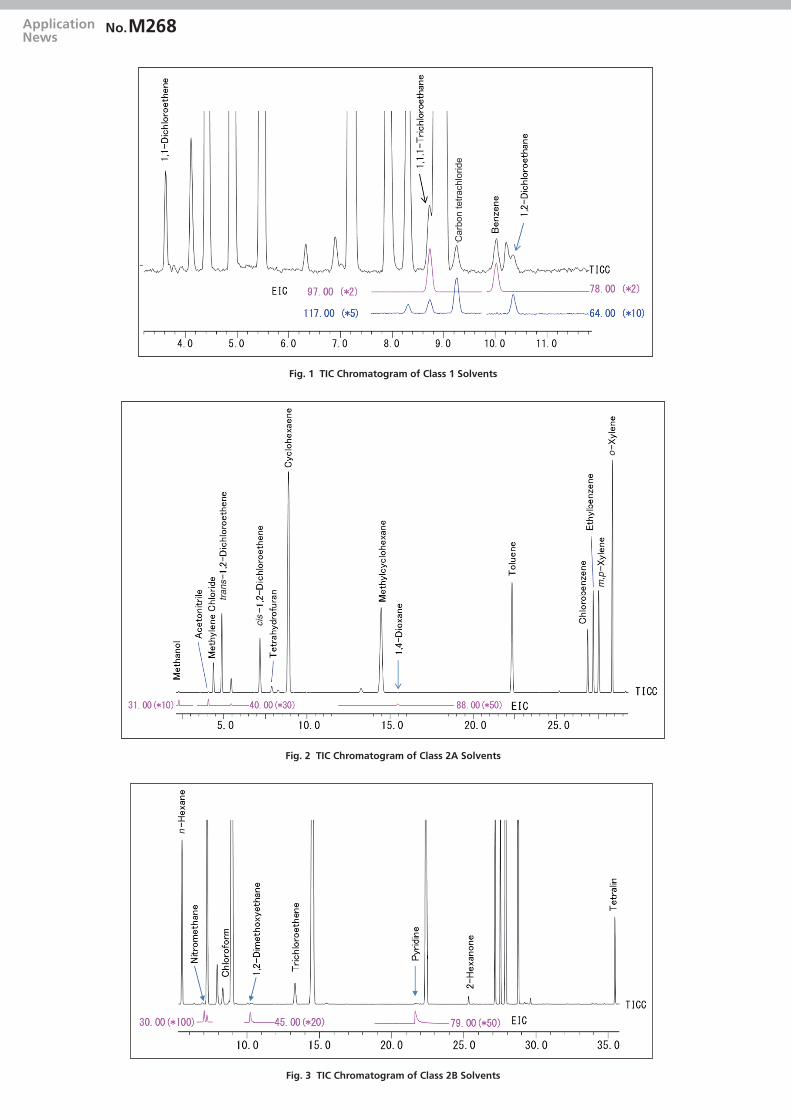
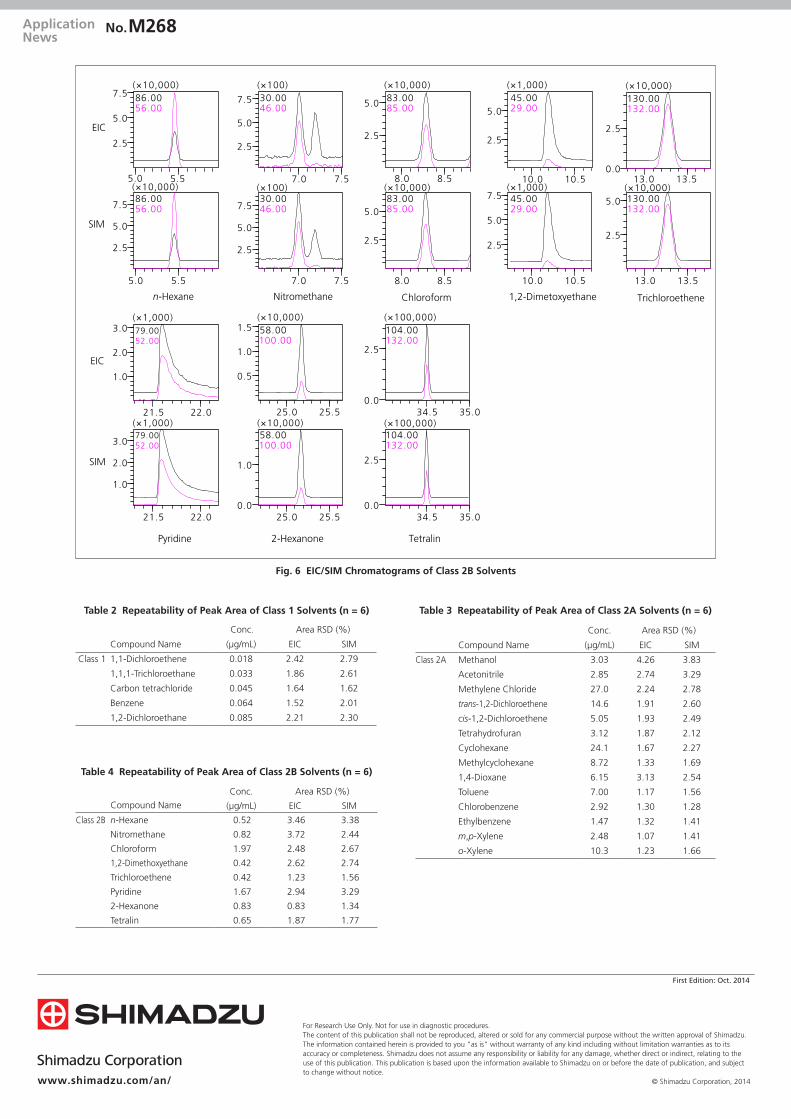
n ResultsFig. 1 shows Total Ion Chromatogram (TIC) for the USP Class 1 compounds. Fig. 2 and 3 are the TICs for Class 2A and 2B compounds, respectively. Peaks that cannot be identified in the TIC and peaks that completely or partially co-elute are shown in the extracted ion chromatogram (EIC). Due to the selectivity of the GC/MS, good separation was obtained by using the SIM acquisition mode. Fig. 4, 5 and 6 show the EIC/SIM chromatograms of the individual components. Good peak shapes we re ob ta ined fo r mos t o f the compounds. In addition, an improved signal-to-noise ratio (S/N) was obtained for CCl4 using the HS-GC/MS method, compared to that obtained by the HS-GC method. Repeatability using the HS-GC/MS SIM mode yielded an RSD of 1.3 to 3.9 % (Tables 2, 3, and 4).
n ConclusionUsing the HS-GC/MS method, simultaneous analysis of USP <467> Class 1, Class 2A, and Class 2B compounds was demonstrated without compromising separation, repeatability, or analysis accuracy.Note: Measurement of residual solvents in pharmaceuticals using HS-
GC/MS has not been adopted as an official method.
ApplicationNews
No.M268
Fig. 2 TIC Chromatogram of Class 2A Solvents
Fig. 3 TIC Chromatogram of Class 2B Solvents
Car
bon
tetra
chlo
ride
tran
s
cis
m,p
o
n
Fig. 1 TIC Chromatogram of Class 1 Solvents

ApplicationNews
No.M268
1,1-Dichloroethene 1,1,1-Trichloroethane Carbon tetrachloride Benzene 1,2-Dichloroethane
EIC
SIM
3.5 4.0
2.5
5.0
(×1,000)
61.0096.00
8.5 9.0
2.5
5.0
7.5(×1,000)
99.0097.00
9.0 9.5
1.0
2.0
(×1,000)
119.00117.00
10.0 10.5
2.5
5.0
(×1,000)
51.0077.0078.00
10.0 10.5
0.5
1.0
1.5(×1,000)
64.0062.00
3.5 4.0
2.5
5.0
7.5
(×1,000)
61.0096.00
8.5 9.0
2.5
5.0
7.5
(×1,000)
99.0097.00
9.0 9.5
1.0
2.0
3.0(×1,000)
119.00117.00
10.0 10.5
2.5
5.0
(×1,000)
51.0077.0078.00
10.0 10.5
0.5
1.0
1.5
(×1,000)
64.0062.00
4.0 4.5
2.5
0.0
(×100,000)
86.0084.00
4.5 5.0
0.5
1.0
(×1,000,000)
61.0096.00
7.0 7.5
2.5
5.0
7.5
(×100,000)
61.0096.00
8.5 9.0
1.0
2.0
(×1,000,000)
56.0084.00
14.5 15.0
2.5
5.0
7.5
(×100,000)
83.0098.00
15.5 16.0
1.0
2.0
(×1,000)
58.0088.00
22.0 22.5
1.0
2.0
(×1,000,000)
92.0091.00
27.0 27.5
1.0
2.0
(×1,000,000)
106.0091.00
27.5 28.0
1.0
2.0
(×1,000,000)
106.0091.00
4.0 4.5
2.5
0.0
(×10,000)
39.0040.0041.00
2.0 2.5
1.0
2.0
3.0(×10,000)
29.0031.00
7.5 8.0
0.5
1.0
(×100,000)
42.0072.00
EIC
EIC
SIM
SIM
Methanol
Toluene
Acetonitrile Dichloromethane trans -1,2-dichloroethene cis -1,2-dichloroethene
Tetrahydrofuran Cyclohexane
EIC
m,p-XyleneChlorobenzene Ethylbenzene o-Xylene
SIM
2.0 2.5
1.0
2.0
3.0(×10,000)
29.0031.00
4.0 4.5
0.5
1.0
(×10,000)
39.0040.00
4.0 4.5
2.5
0.0
(×100,000)
86.0084.00
4.5 5.0
0.5
1.0(×1,000,000)
61.0096.00
7.0 7.5
2.5
5.0
(×100,000)
61.0096.00
7.5 8.0
0.5
1.0(×100,000)
42.0072.00
8.5 9.0
1.0
2.0
(×1,000,000)
56.0084.00
14.5 15.0
2.5
5.0
7.5(×100,000)
83.0098.00
15.5 16.0
1.0
2.0
(×1,000)
58.0088.00
22.0 22.5
1.0
2.0
(×1,000,000)
92.0091.00
26.5 27.0
0.5
1.0
(×1,000,000)
77.00112.00
27.0 27.5
1.0
2.0(×1,000,000)
106.0091.00
27.5 28.0
1.0
2.0(×1,000,000)
106.0091.00
28.0 28.5
2.5
0.0
(×1,000,000)
106.0091.00
26.5 27.0
0.5
1.0
(×1,000,000)
77.00112.00
28.0 28.5
2.5
0.0
(×1,000,000)
106.0091.00
1,4-DioxaneMethylcyclohexane
Fig. 4 EIC/SIM Chromatograms of Class 1 Solvents
Fig. 5 EIC/SIM Chromatograms of Class 2A Solvents
ApplicationNews
No.
For Research Use Only. Not for use in diagnostic procedures.The content of this publication shall not be reproduced, altered or sold for any commercial purpose without the written approval of Shimadzu. The information contained herein is provided to you "as is" without warranty of any kind including without limitation warranties as to its accuracy or completeness. Shimadzu does not assume any responsibility or liability for any damage, whether direct or indirect, relating to the use of this publication. This publication is based upon the information available to Shimadzu on or before the date of publication, and subject to change without notice.
© Shimadzu Corporation, 2014www.shimadzu.com/an/
M268
First Edition: Oct. 2014
EIC
SIM
n-Hexane
Tetralin2-Hexanone
Nitromethane
Pyridine
5.0 5.5
2.5
5.0
7.5(×10,000)
56.0086.00
7.0 7.5
2.5
5.0
7.5
(×100)
46.0030.00
8.0 8.5
2.5
5.0
(×10,000)
85.0083.00
10.0 10.5
2.5
5.0
(×1,000)
29.0045.00
13.0 13.5
2.5
0.0
(×10,000)
132.00130.00
21.5 22.0
1.0
2.0
3.0(×1,000)
52.0079.00
25.0 25.5
0.5
1.0
1.5(×10,000)
100.0058.00
5.0 5.5
2.5
5.0
7.5
(×10,000)
56.0086.00
7.0 7.5
2.5
5.0
7.5
(×100)
46.0030.00
8.0 8.5
2.5
5.0
(×10,000)
85.0083.00
10.0 10.5
2.5
5.0
7.5(×1,000)
29.0045.00
13.0 13.5
2.5
5.0(×10,000)
132.00130.00
34.5 35.0
2.5
0.0
(×100,000)
132.00104.00
21.5 22.0
1.0
2.0
3.0
(×1,000)
52.0079.00
25.0 25.5
1.0
0.0
(×10,000)
100.0058.00
34.5 35.0
2.5
0.0
(×100,000)
132.00104.00
EIC
SIM
Trichloroethene1,2-DimetoxyethaneChloroform
Fig. 6 EIC/SIM Chromatograms of Class 2B Solvents
Conc. Area RSD (%)
Compound Name (µg/mL) EIC SIM
Class 1 1,1-Dichloroethene 0.018 2.42 2.79
1,1,1-Trichloroethane 0.033 1.86 2.61
Carbon tetrachloride 0.045 1.64 1.62
Benzene 0.064 1.52 2.01
1,2-Dichloroethane 0.085 2.21 2.30
Conc. Area RSD (%)
Compound Name (µg/mL) EIC SIM
Class 2B n-Hexane 0.52 3.46 3.38
Nitromethane 0.82 3.72 2.44
Chloroform 1.97 2.48 2.67
1,2-Dimethoxyethane 0.42 2.62 2.74
Trichloroethene 0.42 1.23 1.56
Pyridine 1.67 2.94 3.29
2-Hexanone 0.83 0.83 1.34
Tetralin 0.65 1.87 1.77
Conc. Area RSD (%)
Compound Name (µg/mL) EIC SIM
Class 2A Methanol 3.03 4.26 3.83
Acetonitrile 2.85 2.74 3.29
Methylene Chloride 27.0 2.24 2.78
trans-1,2-Dichloroethene 14.6 1.91 2.60
cis-1,2-Dichloroethene 5.05 1.93 2.49
Tetrahydrofuran 3.12 1.87 2.12
Cyclohexane 24.1 1.67 2.27
Methylcyclohexane 8.72 1.33 1.69
1,4-Dioxane 6.15 3.13 2.54
Toluene 7.00 1.17 1.56
Chlorobenzene 2.92 1.30 1.28
Ethylbenzene 1.47 1.32 1.41
m,p-Xylene 2.48 1.07 1.41
o-Xylene 10.3 1.23 1.66
Table 2 Repeatability of Peak Area of Class 1 Solvents (n = 6)
Table 4 Repeatability of Peak Area of Class 2B Solvents (n = 6)
Table 3 Repeatability of Peak Area of Class 2A Solvents (n = 6)
Top Related