


Languages
Pages
Legal

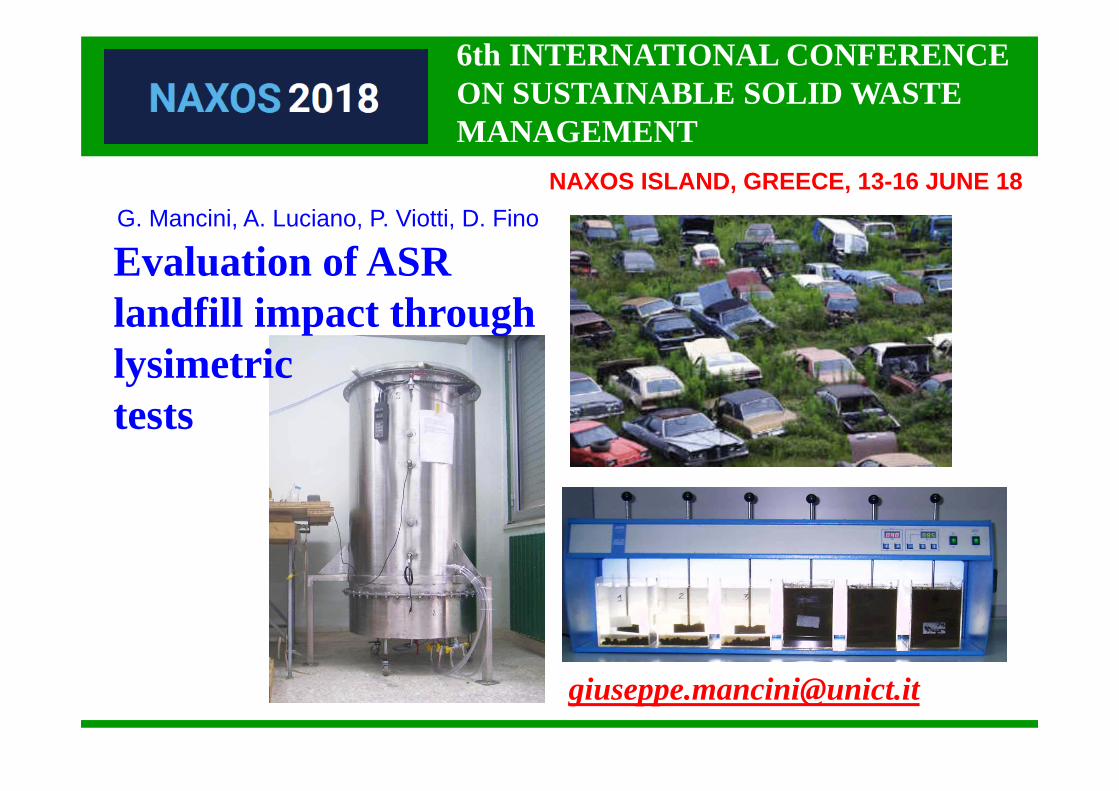
6th INTERNATIONAL CONFERENCE ON SUSTAINABLE SOLID WASTE MANAGEMENT
G. Mancini, A. Luciano, P. Viotti, D. Fino
NAXOS ISLAND, GREECE, 13-16 JUNE 18
Evaluation of ASR landfill impact through lysimetric tests

Number of passenger cars per 1000 inhabitants in Europe
308 775

Number of passenger cars per 1000 inhabitants

Average age of the EU car fleet
The mean age of vehicles has grown in the last decade as a consequence of the economic crisis..

Age classes of circulating vehicles in Italy

the gear shift
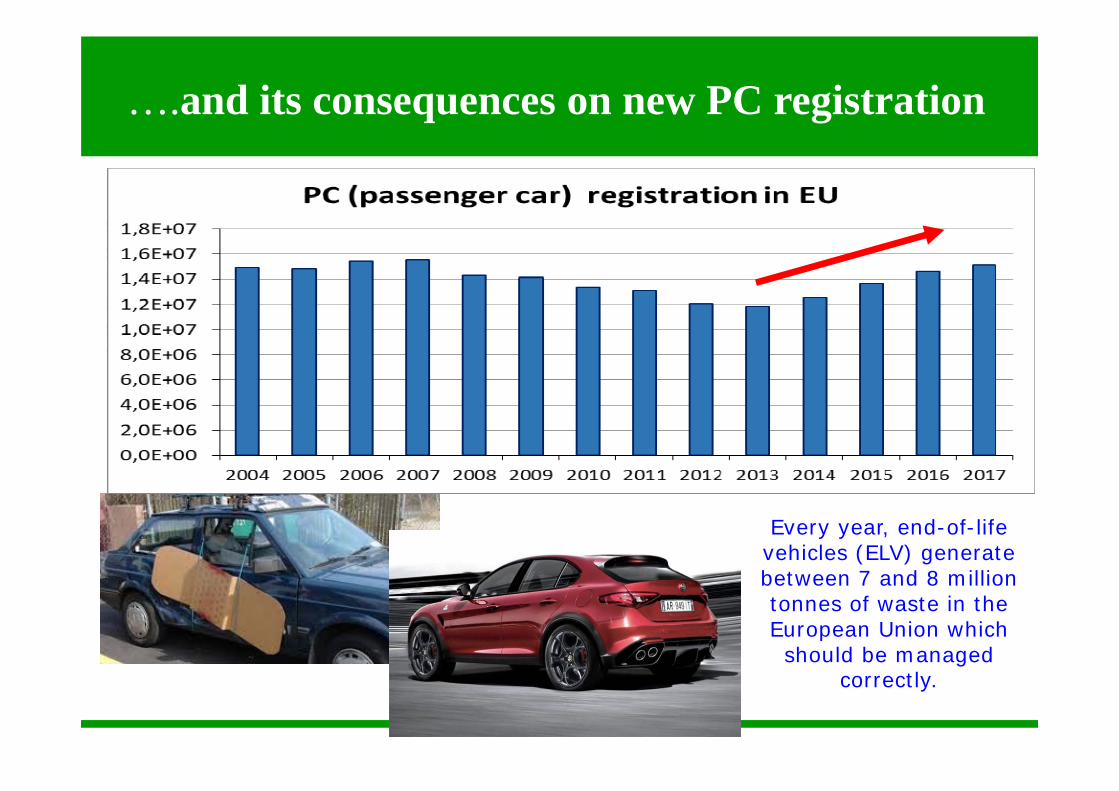
….and its consequences on new PC registration
Every year, end-of-life vehicles (ELV) generate between 7 and 8 million tonnes of waste in the European Union which should be managed
correctly.

Cause radiazioni autoveicoli
8
Con la fine della campagna d’incentivi governativi alla rottamazione, che obbligava i veicoli a essere demoliti in impianti autorizzati, si è assistito alla forte crescita del fenomeno dell’esportazione degli autoveicoli. Spesso accade che i veicoli vengano esportati non per essere utilizzati nei Paesi di destino, ma per essere, diversamente da quanto previsto dalla normativa comunitaria, demoliti, realizzando così una esportazione di rifiuti e non di beni e sottraendo materiale prezioso all’industria nazionale del riciclo e a quella siderurgica.
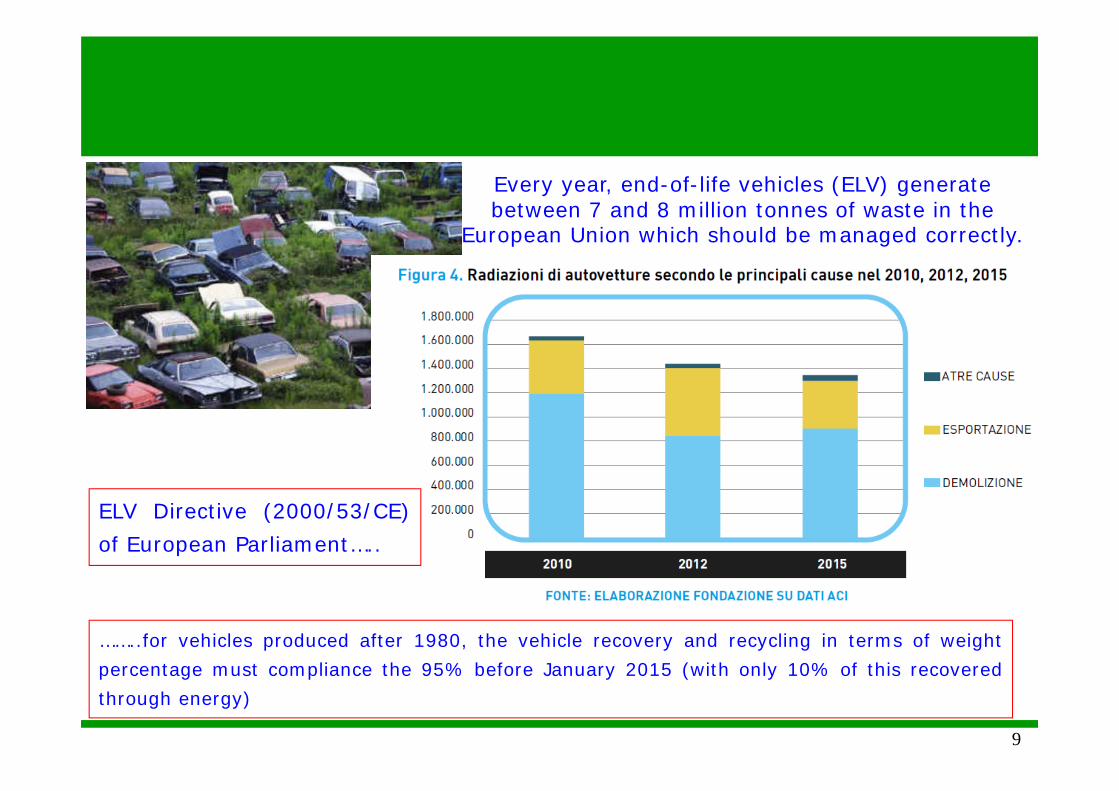
Every year, end-of-life vehicles (ELV) generate between 7 and 8 million tonnes of waste in the
European Union which should be managed correctly.
9
……..for vehicles produced after 1980, the vehicle recovery and recycling in terms of weightpercentage must compliance the 95% before January 2015 (with only 10% of this recoveredthrough energy)
ELV Directive (2000/53/CE)of European Parliament…..

Legislative Framework
The ultimate goal of ELV Directive (2000/53/CE) of European Parliament and ofthe Council of 18 September 2000 this directive is to put only 5% of ELVresidues (ASR) into landfills. It states:for vehicles produced after 1980, the vehicle recovery and recycling in terms ofweight percentage must compliance the 95% before January 2015 (with only10% of this recovered through energy) (Jalkanen, 2006). (Decreto legislativo209/2003.)
The EU Landfill Directive [1999/31/EC] requires reductions on allbiodegradable waste within 17 years to 35% of 1995 valuesmeanwhile forbidding further disposal in landfills of wastes with highcalorific values (higher than 13000 kJ/kg.).
ASR shows calorific values ranging from 14000 up to 30000 kJ/kg.
ALTERNATIVES TO LANDFILLING ARE COMPULSORY

How far from the targets we are?
11

How the targets are achieved?
12

ELVs Recovery and Reuse (Italy)
13

Gestione dei veicoli a fine vita

La gestione degli ELVs
The conventional routefor end-of-life vehiclerecovery and recycling isdetermined by standardpractices of metalrecycling.
The process steps include the pretreatment or de-pollution (e.g. removal of tires,the battery, lubricants and fuel), and shredding and sorting the vehicle to recovervaluable metals.

Metals are recovered by using magnetic separation, and constitutingabout 75% of the total weight of ELV’s they are recycled in iron andsteelmaking processes
Il residuo prodotto dal processodi demolizione costituisce circa il25% in peso di un’automobile estato, fino adesso, smaltito inmassima parte in discarica.
The remaining 25%, which is called auto shredder residues (ASR)
ELVs Management

Recovery routes of ELVs and Fluff

The management of automotive shredder residue (ASR) is considered anincreasingly problematic subject of worldwide concern
The pressure to achieve commercial processes to deal with such a complexwaste feedstock is growing year by year, also because it is increasinglyconsidered unsuitable for landfill disposal.
This is due its high fluctuating levels of TOC, PCB, sulphur, chlorine, heavymetals and contaminant oils arising from elastomers, PVC, metals and carfluids. Adding to these properties is the very high energy content.
La gestione dell’ASR

la disciplina europea dei veicoli fuori uso
La gestione dei veicoli fuori uso costituisce uno dei focus delle politiche europee sulla gestione dei rifiuti. Con la Direttiva 2000/53/CE è stato imposto agli stati membri di raggiungere entro il 2015 obiettivi minimi di riciclaggio (85%) e di recupero complessivo (95%).La direttiva ha individuato in capo ai produttori di vetture il compito di assicurare il raggiungimento di questi obiettivi. In altri termini ha introdotto il cosiddetto regime della responsabilità estesa del produttore nel settore automobilistico.

Legislative Framework
The ultimate goal of ELV Directive (2000/53/CE) of European Parliament and ofthe Council of 18 September 2000 this directive is to put only 5% of ELVresidues (ASR) into landfills. It states:for vehicles produced after 1980, the vehicle recovery and recycling in terms ofweight percentage must compliance the 95% before January 2015 (with only10% of this recovered through energy) (Jalkanen, 2006). (Decreto legislativo209/2003.)
The EU Landfill Directive [1999/31/EC] requires reductions on allbiodegradable waste within 17 years to 35% of 1995 valuesmeanwhile forbidding further disposal in landfills of wastes with highcalorific values (higher than 13000 kJ/kg.).
ASR shows calorific values ranging from 14000 up to 30000 kJ/kg.
ALTERNATIVES TO LANDFILLING ARE COMPULSORY

Tassi di recupero Vs obiettivi di legge- Europa
In Europa nel 2015 sono stati prodotti oltre 6 milioni di ELVs (dati Eurostat pubblicati a settembre2017). Per quanto riguarda gli obiettivi di riciclaggio, la media riscontrata nell’Unione europeanel suo complesso risulta in linea con il target 2015, attestandosi a 87,1%. Rispetto agli obiettividi recupero complessivo, però, il risultato ottenuto è pari a 93,4%, al di sotto del target del 95%disposto dalla Direttiva.

Tassi di recupero Vs obiettivi di legge- Italia
I dati pubblicati da Eurostat mostrano per il 2015 livelli di riciclaggio/recupero stabili rispetto a quelli rilevati nell’ultimo triennio. La percentuale di riciclaggio e reimpiego raggiunge l’84,6% del peso medio del veicolo, quasi in linea con il target dell’85% previsto per il 2015. Ampliando la lettura agli ultimi 9 anni si osserva, invece, come l’Italia non sia mai riuscita a centrare il target. La situazione peggiora se volgiamo l’attenzione agli obiettivi di recupero totale. L’Italia risulta decisamente lontano dal target del 95% previsto al 2015: i dati attestano una percentuale pari 84,7%.

Potential alternatives to Fluff landfilling
• Thermal treatment of ASR Injection of ASR into blast furnace,Fluidized-bed combustion, Citron’s process (heat, electric energy, gas(emission in the atmosphere), slag and ash (landfill disposal)
• Pyrolysis of fluff (fast, flash, conventional Catalytic, screw kiln pyrolysis,ultrapyrolysis) gas, oils, slag (metals recovery and landfill disposal)
• Material recovery recycled polymers (extraction with solvent, infraredseparation, density separation, Argon process)
• Microwave and plasma-arc thermal destruction processes• Other utilization (as a binder in asphalt, as filler in concrete, utilization in
composite applications, Thermo-bath process for recycling ASR)

Current issues
However, the physical nature of SR, cross contamination, unstable marketsfor recovered materials and the need for significant processing to meetmarket specifications, hamper significant recovery of materials fromASR.
This generates high risk for independent investments in specific processesand banks reluctance in providing financial support, thus causing afurther lack of stability of the market.
Numerous technical, legislative, commercial and financial drivers affect fluffmanagement. Under these circumstances therefore, it is scarcely surprisingthat not only very few processes currently undergo development, but itmoreover remains to be clarified which types of process are to be preferred.

Gasification plants
to evaluate the environmental impact of the fluff combustion(emission and deriving wastes composition).
ASR combustion tests were carried out on a full scale tyres incinerationplant (Anagni), specifically modified for the proper combustion of car andwaste-collection residues. Both tyres and fluff deriving from end of lifevehicles and white goods (WG) were alternatively burnt ASR in order:
to evaluate energy recovery
to evaluate fluff mass reduction

Gassification plants

Some really recent news in Italy…
Car Fluff can be now used for RDF (CSS) production


Recupero energetico e del riciclaggio presenta delle oscillazioni notevoli nelcorso degli ultimi anni segno di difficoltà legate a fattori quali la disponibilità diimpianti (pochi impianti autorizzati al recupero energetico di questa frazione – ocomunque a costi non competitivi con la discarica) o l’accessibilità/convenienzaeconomica. (->riluttanza delle banche a finanziare)
L’elevato potere calorifico inferiore (PCI), lo rende interessante per il recuperoenergetico sia in impianti dedicati, sia come combustibile solido secondario(CSS), da impiegare in impianti industriali, come nei cementifici, in parzialesostituzione dei combustibili tradizionali. (un’ottima performance energetica (altoPCI e scarsa umidità), ma necessità di ridurre la concentrazione del cloro e dialcuni metalli (ad esempio l’antimonio, utilizzato come anti fiamma nelle plastiche)che potrebbero rappresentare un problema per il processo e per il prodotto finale (ilcemento).
Necessaria una migliore vigilanza sulle operazioni di trattamento edemolizione (alti costi da sostenere e dal basso contributo economico offerto daiproduttori) scarsa efficacia delle funzioni di controllo e di vigilanza che dovrebberoessere esercitate dalle amministrazioni.
Le problematiche aperte

La strada italiana continua in salita…
Oggi in Italia, la sua destinazione prevalente è data dallo smaltimento in discarica: ilfluff viene individuato dai seguenti codici dell’Elenco Europeo dei rifiuti: CER191003* (frazioni leggere di frammentazione - light fluff- e polveri, contenentisostanze pericolose) e CER 191004 (frazioni leggere di frammentazione - light fluff -e polveri).

The management of end of life vehicles (ELVs)
Secondo gli ultimi dati pubblicati da Eurostat, nel 2015 il destino di gran parte dellequasi 180.000 t di car fluff prodotto in Italia è stato il conferimento in discarica (circal’87%) e il 13% avviato a riciclo.Nel 2014 invece, l’88% è stato conferito in discarica, l’11% è stato recuperato comeenergia e l’1% riciclato.

The current management of ELVs in Italy
87% landfilled13% recycled
88% landfilled1% recycled11% energy recovered

Current main disposal solution of ASR in Italy, Greece, ….

Current main disposal solution of ASR in Italy, Greece, ….

potential impacts?

Hazardous or not hazardous
waste???
Need for characterization
Which landfill???? Difficulties in fluff unique characterization due to the high heterogeneity and different origin
DOC (160 mg/l >>80 mg/l)PCB (9 – 91 mg/kg>10 mg/kg)Mineral Oils (1,54 – 2,37% > 0,1%)

The management of end of life vehicles (ELVs)
The interest in choosing the proper way of disposal forAutomotive Shredder Residues (ASR) has increased, atEuropean level, with the coming into force of the directive2000/53/EC on the end of life vehicles (ELV) and the directive1999/31/EC on landfills.With regards to European Waste Catalogue, Fluff can beclassified both as a hazardous or non hazardous wasteaccording to its hazardous properties Non
Hazardous waste landfill
Fluff
Hazardous waste landfill

The management of end of life vehicles (ELVs)
Obiettivi della direttiva
Possibili soluzioni di smaltimento
Individuazione della migliore anche tramite LCA,
Caratterizzazione delle diverse
La discarica è veramente la peggiore in termini disostenibilità?

Main Goals
Specific goals
•Fluff characterization (solid samples)
•Fluff characterization (traditional leaching tests)
•Landfill leaching process simulation through the use oflysimeter (comparison with a full scale landfill leachate)
ESTIMATING LANDFILLED FLUFF BEHAVIOR IN TERMS OF LEACHATE COMPOSITION: IS THE USE
OF STANDARD LEACHING TESTS EFFECTIVE?

Materials and methodsSolid samples characterization and leaching test
The marked heterogeneousness characteristics of the waste, at the small(laboratory) scale, gives rise to several difficulties in obtainingrepresentative and reproducible samples.
• Particle-size analysis and separation of the different fractions;
• Mechanical size reduction of each fraction;
• Sample reconstruction on the basis of mass percentages of eachfraction obtained from the particle-size analysis.
The following methodology has been proposed for solid wastecharacterization and leaching tests:

Landfill according to Delibera Interministeriale del 27/07/1984

Delibera Interministeriale del 27/07/1984 vs DLgs 13/03/2003 n° 36
Deliberazione Interministeriale 27 luglio 1984 DLgs 13/03/2003 n° 36
Discarica di 2a categoria
Tipo A Discarica per rifiuti inerti
Discarica di 1a categoria
Discarica per rifiuti non pericolosi Discarica di 2a categoria
Tipo B
Discarica di 2a categoria
Tipo C Discarica per rifiuti pericolosi
Discarica di 3a categoria

Materials and methodsLeaching tests operating conditions
Test (leaching solution) pH Contact
timeSample
characteristicsLiquid to
solid ratio Mixing
Acetic Acid pH = 5 ± 0,2 24 hours 100 gr.; f< 9,5 mm 16 Not
indicated
Carbonate water pH = 4,5 6 100 gr.; f < 9,5 mm 20 40 rpm
Demineral. water(UNI 10802)
NotControlled 24 hours 100 gr.; f < 4 mm 10 Not
Indicated

Lisimetric simulation Leaching tests are far from landfill
conditions where leachate retentiontime and solid/liquid contact, within thewaste heap, are sensibly different fromusual laboratory operating conditions.
A lysimeter was specifically designed tohave a sufficiently large volume withrespect to the waste characteristic size.
Design features
• Lysimeter, 100% steel made (inox 316),has a circular section (80 cm diameter)and it is equipped with temperature,pressure and humidity probes, as wellas with several valves for solutionextraction and biogas sampling

Lysimeter design featuresupper segment
•Upper segment allows the leaching solution input and uniform distribution aswell as the biogas sampling

Configurazione degli strati

Lysimeter design featurescentral segment
Central segment contains two layers, 40cm thick, of fluff separated by a sandcovering layer (10 cm thick). The firstlayer required about 150 kg of fluff (r=0,75ton/m3) while the second about 160(r=0,80 ton/m3).

Lysimeter design featureslower segment
• The lower segment is split into three annulus, hydraulically separated, all ofequal surface;
• The annulus were designed to highlight the possible non uniform behaviour, ofthe filtration process, in hydraulic terms as well as in pollutants migration ones;
• A central funnel was also included, with a surface of 1/10 of the centralannulus, from which leachate could be collected directly without going troughthe lower gravel filter.

Lisimetric simulationLeaching Solutions and analysis carried out
•Demineralised water with a pH of 7 (first 22 days);
Leachates Analysis
Volumes from each sector;•pH• Redox potential•Temperature•Electrical conductivity
Metals determinationsDioxins and PCB Chlorides, sulphides, nitrates, fluorides,;Ammonia, organic Nitrogen, free cyanides, COD, BOD5 and TOC
•CO2 saturated water (carbonate water) with a pH of 4 (22°-153° day);

Experimental ResultsSolid samples characterization
Element Letterature range results mg/kg max min
Pb 45000 8,2 3240 Fe 27000 23600 35333 Cu 25600 15 1896 Zn 6650 4250 7639 Cr 200 150 106 Ni 150 100 107 Cd 82 0 14 As 9,3 0 21
Metals contents are basically in line with the litterature ranges
Higher values for Fe, Zn;Lower values for Cr;

Experimental ResultsSolid samples characterization
Element Samples U.M. Element Samples U.M.
Lower calorific power 21688 kJ/kg 1.2.3.4.7.8 HxCDD < 0,02 ng/kg
Apparent density 0,41 g/cm3 1.2.3.6.7.8 HxCDD < 0,02 ng/kg
Free cyanides < 1 mg/kg 1.2.3.7.8.9 HxCDD < 0,02 ng/kg
Phenol < 5 mg/kg 1.2.3.4.6.7.8. HpCDD 578 ng/kg
4-Nitrophenol < 5 mg/kg 1.2.3.4.6.7.8.9 OCDD 4593 ng/kg
2-Chlorophenol < 5 mg/kg 2.3.7.8 TCDF 55,3 ng/kg
2,4-Dinitrophenol < 5 mg/kg 1.2.3.7.8 PeCDF 26 ng/kg
2-Nitrophenol < 5 mg/kg 2.3.4.7.8 PeCDF 22 ng/kg
2,4-Dimethylphenol < 5 mg/kg 1.2.3.4.7.8 HxCDF < 0,02 ng/kg
4-Chlorine-3-Methylphenol < 5 mg/kg 1.2.3.6.7.8. HxCDF < 0,02 ng/kg
2,4-Dichlorophenol < 5 mg/kg 2.3.4.6.7.8. HxCDF < 0,02 ng/kg
2-Methyl-4,6-dinitrophenol < 5 mg/kg 1.2.3.7.8.9. HxCDF < 0,02 ng/kg
2,4,6-Trichlorophenol < 5 mg/kg 1.2.3.4.6.7.8.HpCDF 60,6 ng/kg
Pentachlorophenol < 5 mg/kg 1.2.3.4.7.8.9. HpCDF 12,5 ng/kg
TOC 53800 mg/kg 1.2.3.4.6.7.8.9.OCDF 91,1 ng/kg
2.3.7.8 TCDD < 0,02 Ng/kg Sum PCDD/PCDF 29,5 Ng TE/kg
1.2.3.7.8 PeCDD < 0,02 Ng/kg PCB 1,83 mg/kg

ResultsLeaching tests results
Element (discharge limiti)
Landfill leachate(mg/l)
Leaching test (mg/l)H2O CO2 CH3COOH
Mean Mean Mean Mean
As (0,5) 0,0589 0,045 < 0,0001 0,000 < 0,0001 0,000 0,050 0,010Cd (0,02) 0,002 0,003 0,040 0,000 0,040 0,000 0,213 0,006
Cu (1) 0,082 0,120 0,027 0,006 0,050 0,010 0,177 0,021Fe (2) 9,771 14,867 0,190 0,070 2,153 0,146 14,20 2,272Ni (2) 0,825 1,184 0,001 0,000 0,010 0,000 0,227 0,021
Pb (0,2) 0,009 0,093 0,017 0,006 0,017 0,006 5,053 0,299Zn (0,5) 0,524 0,651 < 0,0002 0,000 0,002 0,000 115,3 4,726

ResultsLeaching tests results
Element
Landfill leachate(mg/l)
Leaching test (mg/l)H2O CO2 CH3COOH
Mean Mean Mean Mean
As 0,054 0,011 < 0,0001 0,000 < 0,0001 0,000 0,050 0,010Cd 0,007 0,006 0,040 0,000 0,040 0,000 0,213 0,006Cu 0,008 0,007 0,027 0,006 0,050 0,010 0,177 0,021Fe 2,662 2,164 0,190 0,070 2,153 0,146 14,20 2,272Ni 0,127 0,079 0,001 0,000 0,010 0,000 0,227 0,021Pb 0,040 0,009 0,017 0,006 0,017 0,006 5,053 0,299Zn 0,163 0,191 < 0,0002 0,000 0,002 0,000 115,3 4,726

Parameter U.M. Sample 1 Sample 2 Parameter U.M. Sample 1 Sample 2
pH 7,51 7,4 Chlorides mg/l 85 58eH S/cm 984 893 Fluorides mg/l < 1 < 1Ba mg/l 0,13 0,14 Cyanides mg/l < 0,1 < 0,1Cr totale mg/l < 0,050 < 0,050 COD mg/l 190 205Hg mg/l < 0,005 < 0,005 TDS mg/l 750* 726Mo mg/l < 0,050 0,07 Sulphides mg/l 261 286Sb mg/l < 0,050 < 0,050 T. Phosph Pesticides mg/l < D.L.* < D.L.*
Se mg/l < 0,030 < 0,030 Non Phosp.T.Pestic. Mg/l < D.L.* < D.L.*
Aromatic organic solventsBenzene mg/l < 0,1 < 0,1 o-Xilene mg/l < 0,1 < 0,1Toluene mg/l < 0,1 < 0,1 m-Xilene mg/l < 0,1 < 0,1Ethylbenzene mg/l < 0,1 < 0,1 p-Xilene mg/l < 0,1 < 0,1Nitrated organic solvents Acrilonitril mg/l < 0,1 < 0,1Pyridin3 mg/l < 0,1 < 0,1Chlorinated organic solvents1,1-Dichloroethylene mg/l < 0,01 < 0,01 dibromochloromethane mg/l < 0,01 < 0,01Dichloromethane mg/l < 0,01 < 0,01 1,1,2-trichloroethane mg/l < 0,01 < 0,011,1-Dichloroethane mg/l < 0,01 < 0,01 Tetrachloroethilene mg/l < 0,01 < 0,01Trichloromethane mg/l < 0,01 < 0,01 Chlorobenzene mg/l < 0,01 < 0,011,2-dichloropropane mg/l < 0,01 < 0,01 Bromodichlorometane mg/l < 0,01 < 0,01Tetrachlorometane mg/l < 0,01 < 0,01 Tribromomethane mg/l < 0,01 < 0,01Trichloroethilene mg/l < 0,01 < 0,01
Other Leaching tests results according to UNI10802 (demineralised water)

Experimental ResultsSolid samples characterization
Element(mg/kg)
Samples Element(mg/kg)
Samples
I II Mean I II Mean
Fe 35766 34900 35333 Co 20 15 18
Zn 8392 6886 7639 Cd 17 11 14
Pb 3557 2922 3240 Sulphides 149,57 173,91 161,74
Cu 1638 2153 1896 Chlorides 35,44 36,39 35,91
Ni 128 86 107 Nitrates 5,69 5,96 5,83
Cr 118 93 106 Ammonia 0,940 0,558 0,75
As 22 19 21 Fluorides 0,13 0,17 0,15

Lisimetric simulationoutput volumes

Lisimetric simulationpH, EC ORP

Experimental ResultsMetals concentrations in lysimeter leachate
0,00
0,40
0,80
1,20
1,60
2,00
2,40
0 32 64 96 128 160Time (d)
Cop
per (
mg/
l)
Sector 4 Sector 3 Sector 2 Funnel Mean
0,00
0,50
1,00
1,50
2,00
2,50
3,00
3,50
4,00
0 32 64 96 128 160Time (d)
Nic
kel (
mg/
l)
Sector 4 Sector 3 Sector 2 Funnel Mean
Nickel
Copper

Experimental ResultsMetals concentrations in lysimeter leachate
Cadmium
0,00
0,02
0,04
0,06
0,08
0,10
0 32 64 96 128 160Time (d)
Cad
miu
m (m
g/l)
Sector 4 Sector 3 Sector 2 Funnel Mean
Cobalt
0,00
0,10
0,20
0,30
0,40
0 32 64 96 128 160Time (d)
Cob
alt (
mg/
l)
Sector 4 Sector 3 Sector 2 Funnel Mean

Experimental ResultsMetals concentrations in lysimeter leachate
0,00
25,00
50,00
75,00
100,00
125,00
150,00
0 32 64 96 128 160Time (d)
Zinc
(mg/
l)
Sector 4 Sector 3 Sector 2 Funnel Mean
Zinc
0,00
0,30
0,60
0,90
1,20
1,50
0 32 64 96 128 160Time (d)
Lead
(mg/
l)
Sector 4 Sector 3 Sector 2 Funnel Mean
Lead

Experimental ResultsMetals concentrations in lysimeter leachate
0,00
0,03
0,06
0,09
0,12
0,15
0,18
0 32 64 96 128 160Time (d)
Ars
enic
(mg/
l)
Sector 4 Sector 3 Sector 2 Funnel Mean
Arsenic
Iron
0,00
25,00
50,00
75,00
100,00
125,00
150,00
175,00
0 32 64 96 128 160Time (d)
Iron
(mg/
l)
Sector 4 Sector 3 Sector 2 Funnel Mean

Experimental ResultsMetals cumulative release
0,000,050,100,150,200,250,300,350,400,45
3 3,5 6 7,5 16 22,5 27 44 71 84 100 113 126
Time (days)
Cum
ulat
ive
rele
ase
%
As Cd Co Cr Fe Ni Pb Cu Zn
Experimental ResultsCumulated metals released to the leachate
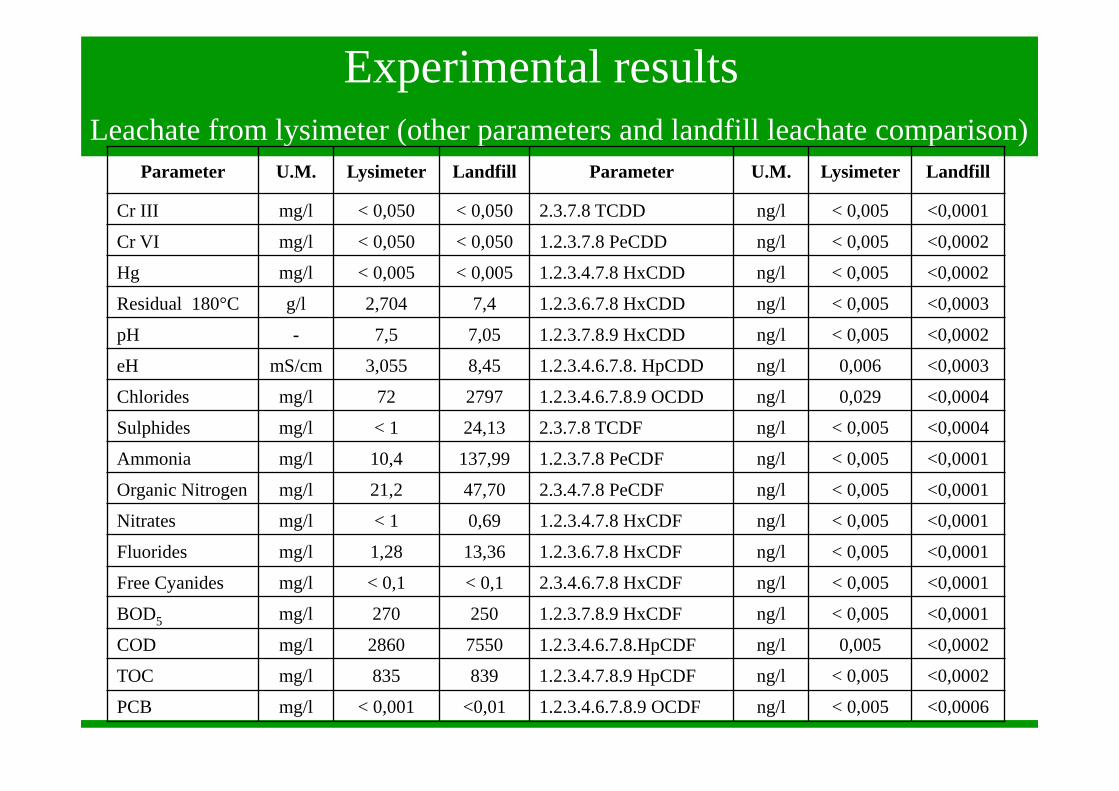
Experimental resultsLeachate from lysimeter (other parameters and landfill leachate comparison)
Parameter U.M. Lysimeter Landfill Parameter U.M. Lysimeter Landfill
Cr III mg/l < 0,050 < 0,050 2.3.7.8 TCDD ng/l < 0,005 <0,0001
Cr VI mg/l < 0,050 < 0,050 1.2.3.7.8 PeCDD ng/l < 0,005 <0,0002
Hg mg/l < 0,005 < 0,005 1.2.3.4.7.8 HxCDD ng/l < 0,005 <0,0002
Residual 180°C g/l 2,704 7,4 1.2.3.6.7.8 HxCDD ng/l < 0,005 <0,0003
pH - 7,5 7,05 1.2.3.7.8.9 HxCDD ng/l < 0,005 <0,0002
eH mS/cm 3,055 8,45 1.2.3.4.6.7.8. HpCDD ng/l 0,006 <0,0003
Chlorides mg/l 72 2797 1.2.3.4.6.7.8.9 OCDD ng/l 0,029 <0,0004
Sulphides mg/l < 1 24,13 2.3.7.8 TCDF ng/l < 0,005 <0,0004
Ammonia mg/l 10,4 137,99 1.2.3.7.8 PeCDF ng/l < 0,005 <0,0001
Organic Nitrogen mg/l 21,2 47,70 2.3.4.7.8 PeCDF ng/l < 0,005 <0,0001
Nitrates mg/l < 1 0,69 1.2.3.4.7.8 HxCDF ng/l < 0,005 <0,0001
Fluorides mg/l 1,28 13,36 1.2.3.6.7.8 HxCDF ng/l < 0,005 <0,0001
Free Cyanides mg/l < 0,1 < 0,1 2.3.4.6.7.8 HxCDF ng/l < 0,005 <0,0001
BOD5 mg/l 270 250 1.2.3.7.8.9 HxCDF ng/l < 0,005 <0,0001
COD mg/l 2860 7550 1.2.3.4.6.7.8.HpCDF ng/l 0,005 <0,0002
TOC mg/l 835 839 1.2.3.4.7.8.9 HpCDF ng/l < 0,005 <0,0002
PCB mg/l < 0,001 <0,01 1.2.3.4.6.7.8.9 OCDF ng/l < 0,005 <0,0006
Results discussion and Conclusions
Leaching testsIn the comparison between the different leaching tests, the acetic acidone determines the severest classification, causing (in the past), theattribution of hazardous waste, with all the economic implication indisposal terms
Leaching test with carbonated water appears to be more representativefor some parameters (Cd, Cu, Pb) giving concentrations similar to thosecharacterizing the landfill leachate.
Demineralised water test. All the parameters fall within the limits for wasteadmission in not hazardous waste landfills (with the exception of COD)but the test is not able to accurately represent the actual leachingbehavior in landfill

Result discussion and Conclusions
Lysimeter simulationIn the comparison with fluff landfill leachate, leachate from the Lysimeter showsimilar distribution of metals mass ratios, close values for both BOD5 and COD, aswell as the absence, in both the fluids, of organochlorinated compounds.
In contrast with leaching tests results, the two metals showing higherconcentrations were Fe and Zn both in the Lysimeter and in the landfill leachate.
Relevant releases of Cadmium and Lead (tests with acetic acid) were instead notdetected in lysimeter and landfill leachate. Current leaching tests did not showappreciable iron concentration, while this element was largely found both in thelandfill and lysimeter leachate.
Lisimetric tests thus appear to be more realistic in the simulation of this wastebehavior, making allowance for the time evolution of the phenomena, the contactcondition and the low liquid to solid ratio

LCA Results: Comparison of the relative weights of all the impacts between the different scenarios

6th INTERNATIONAL CONFERENCE ON SUSTAINABLE SOLID WASTE MANAGEMENT
G. Mancini, A. Luciano, P. Viotti, D. Fino
NAXOS ISLAND, GREECE, 13-16 JUNE 18
THANK YOU FOR YOUR ATTENTION