


Languages
Pages
Legal

Generali Worldwide
International Fund Performance July 2018
generali-worldwide.com
International Fund Performance
As our client, you have the opportunity to access an extensive range of top quality investment options, hand-picked to maximise your investment opportunities. Most offer exciting potential for tax-efficient growth from a stable international location and each is managed by world-class professional asset managers. These investment options range from the secure to those offering capital protection through to those aimed at the more adventurous client. In addition, each has been risk-rated to help you select the investment options that most closely match your investment aims. A summary of each risk category is shown here. These investment options are related to our full fund range of investment-linked assurance schemes and further details are available in our Investment Options Brochure.
Past performance is not indicative of future performance. Investment decisons are the sole responsibility of the planholder(s) and any choice of investment options is entirely at their own risk. It is strongly recommended that planholders should seek independent investment advice that is tailored to their individual circumstances and obtained from a suitably qualified and regulated investment adviser. Please note that your capital is at risk and the value of your plan and your selected investment options may go down as well as up meaning that you may recieve back from your plan less than you have contibuted. The performance figures are net of all fund charges but do not take account of any initial charge.
These performance figures should be read in conjunction with the relevant principal brochure, as fees and charges will impact negatively on individual investment returns.
Synthetic Risk and Reward Profile
Industry Standard
To help you select the investment options that best fit with your approach to risk, Generali Worldwide use the Synthetic Risk and Reward Indicator (SRRI)^.
The indicator is calculated based on the volatility of the investment option for the past five years and the values obtained are translated into one of the seven risk categories available based on pre-defined volatility intervals.
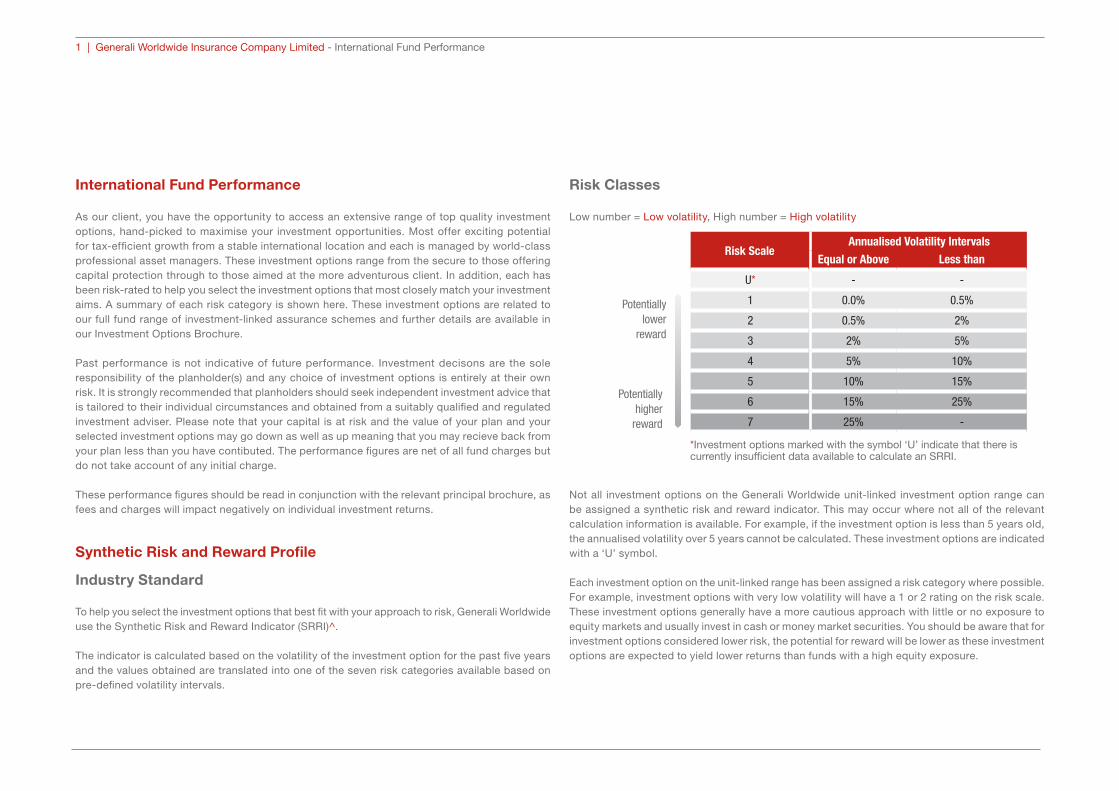
Risk Classes
Low number = Low volatility, High number = High volatility
Not all investment options on the Generali Worldwide unit-linked investment option range can be assigned a synthetic risk and reward indicator. This may occur where not all of the relevant calculation information is available. For example, if the investment option is less than 5 years old, the annualised volatility over 5 years cannot be calculated. These investment options are indicated with a ‘U’ symbol.
Each investment option on the unit-linked range has been assigned a risk category where possible. For example, investment options with very low volatility will have a 1 or 2 rating on the risk scale. These investment options generally have a more cautious approach with little or no exposure to equity markets and usually invest in cash or money market securities. You should be aware that for investment options considered lower risk, the potential for reward will be lower as these investment options are expected to yield lower returns than funds with a high equity exposure.
Potentially lower
reward
Risk ScaleAnnualised Volatility Intervals
Equal or Above Less than
U* - -
1 0.0% 0.5%
2 0.5% 2%
3 2% 5%
4 5% 10%
5 10% 15%
6 15% 25%
7 25% -
*Investment options marked with the symbol ‘U’ indicate that there iscurrently insufficient data available to calculate an SRRI.
Potentially higher
reward
1 | Generali Worldwide Insurance Company Limited - International Fund Performance
Funds with high volatility will have a 6 or 7 rating on the risk scale. These funds tend to have a high exposure to less developed, emerging equity markets or use high risk alternative assets within their investment strategy. Over the long term, exposure to equity markets could provide the opportunity for higher investment returns however it also brings a higher degree of investment risk. Although investment gains could be made when markets are buoyant, losses can quickly occur when markets take a downturn. You must therefore be prepared not only for the potential for higher returns but also the potential for higher losses when investing in these types of funds.
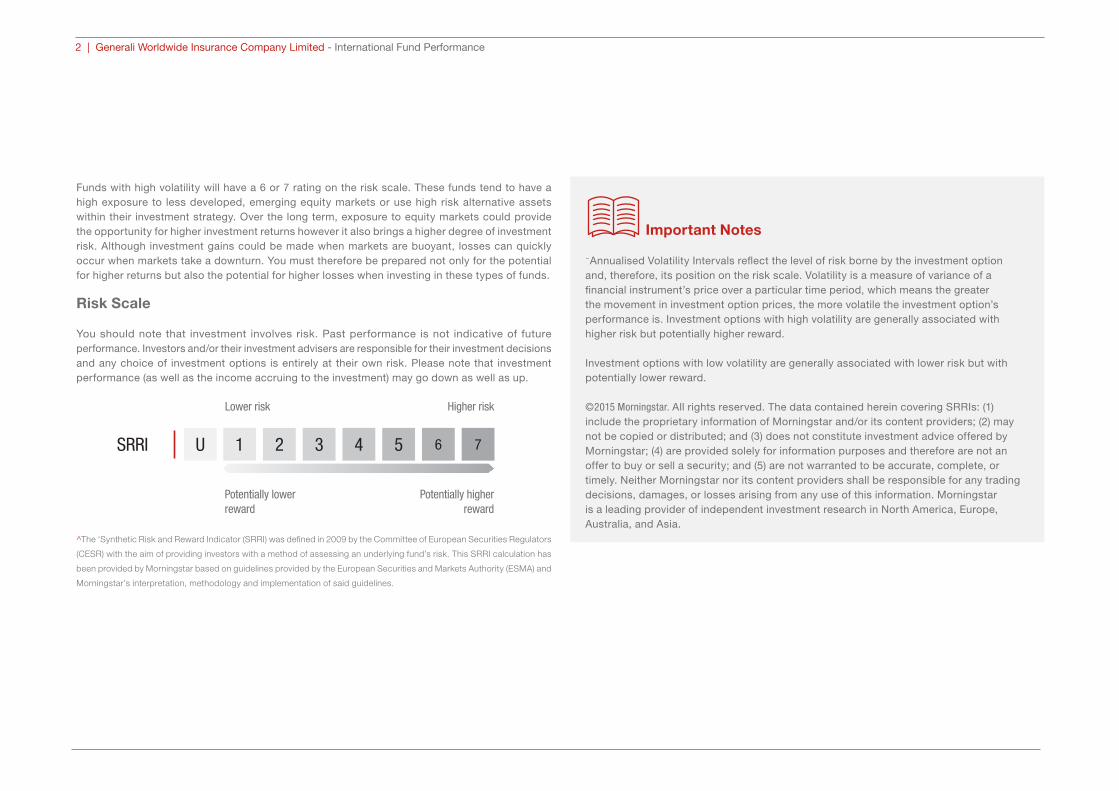
Risk Scale
You should note that investment involves risk. Past performance is not indicative of future performance. Investors and/or their investment advisers are responsible for their investment decisions and any choice of investment options is entirely at their own risk. Please note that investment performance (as well as the income accruing to the investment) may go down as well as up.
^The ‘Synthetic Risk and Reward Indicator (SRRI) was defined in 2009 by the Committee of European Securities Regulators
(CESR) with the aim of providing investors with a method of assessing an underlying fund’s risk. This SRRI calculation has
been provided by Morningstar based on guidelines provided by the European Securities and Markets Authority (ESMA) and
Morningstar’s interpretation, methodology and implementation of said guidelines.
Important Notes
~Annualised Volatility Intervals reflect the level of risk borne by the investment option and, therefore, its position on the risk scale. Volatility is a measure of variance of a financial instrument’s price over a particular time period, which means the greater the movement in investment option prices, the more volatile the investment option’s performance is. Investment options with high volatility are generally associated with higher risk but potentially higher reward.
Investment options with low volatility are generally associated with lower risk but with potentially lower reward.
©2015 Morningstar. All rights reserved. The data contained herein covering SRRIs: (1) include the proprietary information of Morningstar and/or its content providers; (2) may not be copied or distributed; and (3) does not constitute investment advice offered by Morningstar; (4) are provided solely for information purposes and therefore are not an offer to buy or sell a security; and (5) are not warranted to be accurate, complete, or timely. Neither Morningstar nor its content providers shall be responsible for any trading decisions, damages, or losses arising from any use of this information. Morningstar is a leading provider of independent investment research in North America, Europe, Australia, and Asia.
1 2 3 4 5 6
Potentially lower reward
Lower risk
Potentially higher reward
Higher risk
SRRI 7U
2 | Generali Worldwide Insurance Company Limited - International Fund Performance
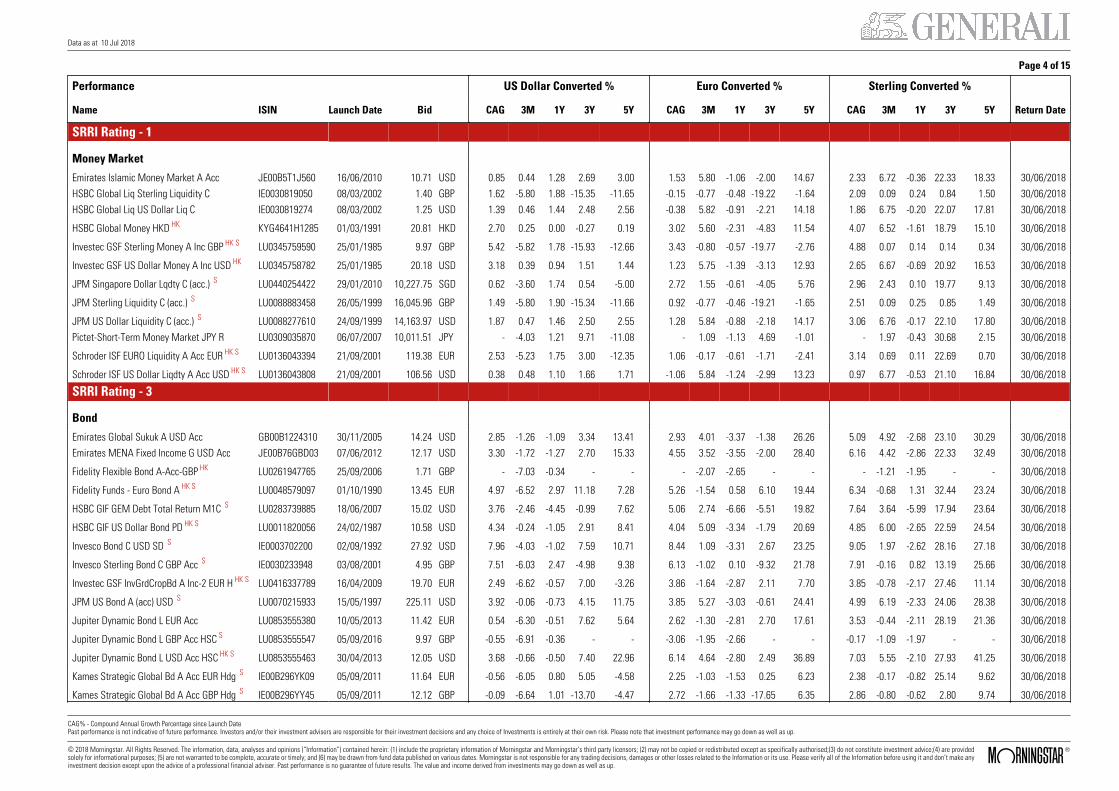
Data as at 10 Jul 2018
Page 4 of 15
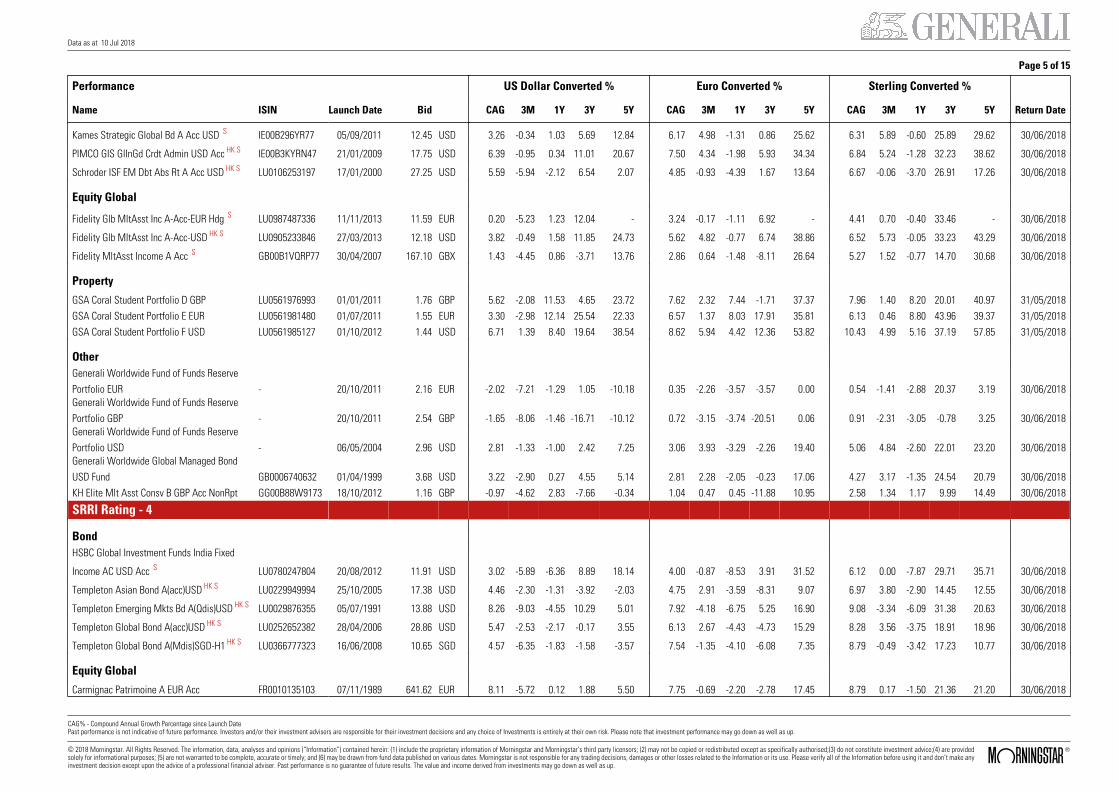
Performance US Dollar Converted % Euro Converted % Sterling Converted %
Name ISIN Launch Date Bid CAG 3M 1Y 3Y 5Y CAG 3M 1Y 3Y 5Y CAG 3M 1Y 3Y 5Y Return Date
SRRI Rating - 1
Money Market
Emirates Islamic Money Market A Acc JE00B5T1J560 16/06/2010 10.71 USD 0.85 0.44 1.28 2.69 3.00 1.53 5.80 -1.06 -2.00 14.67 2.33 6.72 -0.36 22.33 18.33 30/06/2018HSBC Global Liq Sterling Liquidity C IE0030819050 08/03/2002 1.40 GBP 1.62 -5.80 1.88 -15.35 -11.65 -0.15 -0.77 -0.48 -19.22 -1.64 2.09 0.09 0.24 0.84 1.50 30/06/2018HSBC Global Liq US Dollar Liq C IE0030819274 08/03/2002 1.25 USD 1.39 0.46 1.44 2.48 2.56 -0.38 5.82 -0.91 -2.21 14.18 1.86 6.75 -0.20 22.07 17.81 30/06/2018
HSBC Global Money HKD HK KYG4641H1285 01/03/1991 20.81 HKD 2.70 0.25 0.00 -0.27 0.19 3.02 5.60 -2.31 -4.83 11.54 4.07 6.52 -1.61 18.79 15.10 30/06/2018
Investec GSF Sterling Money A Inc GBP HK S LU0345759590 25/01/1985 9.97 GBP 5.42 -5.82 1.78 -15.93 -12.66 3.43 -0.80 -0.57 -19.77 -2.76 4.88 0.07 0.14 0.14 0.34 30/06/2018
Investec GSF US Dollar Money A Inc USD HK LU0345758782 25/01/1985 20.18 USD 3.18 0.39 0.94 1.51 1.44 1.23 5.75 -1.39 -3.13 12.93 2.65 6.67 -0.69 20.92 16.53 30/06/2018
JPM Singapore Dollar Lqdty C (acc.) S LU0440254422 29/01/2010 10,227.75 SGD 0.62 -3.60 1.74 0.54 -5.00 2.72 1.55 -0.61 -4.05 5.76 2.96 2.43 0.10 19.77 9.13 30/06/2018
JPM Sterling Liquidity C (acc.) S LU0088883458 26/05/1999 16,045.96 GBP 1.49 -5.80 1.90 -15.34 -11.66 0.92 -0.77 -0.46 -19.21 -1.65 2.51 0.09 0.25 0.85 1.49 30/06/2018
JPM US Dollar Liquidity C (acc.) S LU0088277610 24/09/1999 14,163.97 USD 1.87 0.47 1.46 2.50 2.55 1.28 5.84 -0.88 -2.18 14.17 3.06 6.76 -0.17 22.10 17.80 30/06/2018Pictet-Short-Term Money Market JPY R LU0309035870 06/07/2007 10,011.51 JPY - -4.03 1.21 9.71 -11.08 - 1.09 -1.13 4.69 -1.01 - 1.97 -0.43 30.68 2.15 30/06/2018
Schroder ISF EURO Liquidity A Acc EUR HK S LU0136043394 21/09/2001 119.38 EUR 2.53 -5.23 1.75 3.00 -12.35 1.06 -0.17 -0.61 -1.71 -2.41 3.14 0.69 0.11 22.69 0.70 30/06/2018
Schroder ISF US Dollar Liqdty A Acc USD HK S LU0136043808 21/09/2001 106.56 USD 0.38 0.48 1.10 1.66 1.71 -1.06 5.84 -1.24 -2.99 13.23 0.97 6.77 -0.53 21.10 16.84 30/06/2018
SRRI Rating - 3
Bond
Emirates Global Sukuk A USD Acc GB00B1224310 30/11/2005 14.24 USD 2.85 -1.26 -1.09 3.34 13.41 2.93 4.01 -3.37 -1.38 26.26 5.09 4.92 -2.68 23.10 30.29 30/06/2018Emirates MENA Fixed Income G USD Acc JE00B76GBD03 07/06/2012 12.17 USD 3.30 -1.72 -1.27 2.70 15.33 4.55 3.52 -3.55 -2.00 28.40 6.16 4.42 -2.86 22.33 32.49 30/06/2018
Fidelity Flexible Bond A-Acc-GBP HK LU0261947765 25/09/2006 1.71 GBP - -7.03 -0.34 - - - -2.07 -2.65 - - - -1.21 -1.95 - - 30/06/2018
Fidelity Funds - Euro Bond A HK S LU0048579097 01/10/1990 13.45 EUR 4.97 -6.52 2.97 11.18 7.28 5.26 -1.54 0.58 6.10 19.44 6.34 -0.68 1.31 32.44 23.24 30/06/2018
HSBC GIF GEM Debt Total Return M1C S LU0283739885 18/06/2007 15.02 USD 3.76 -2.46 -4.45 -0.99 7.62 5.06 2.74 -6.66 -5.51 19.82 7.64 3.64 -5.99 17.94 23.64 30/06/2018
HSBC GIF US Dollar Bond PD HK S LU0011820056 24/02/1987 10.58 USD 4.34 -0.24 -1.05 2.91 8.41 4.04 5.09 -3.34 -1.79 20.69 4.85 6.00 -2.65 22.59 24.54 30/06/2018
Invesco Bond C USD SD S IE0003702200 02/09/1992 27.92 USD 7.96 -4.03 -1.02 7.59 10.71 8.44 1.09 -3.31 2.67 23.25 9.05 1.97 -2.62 28.16 27.18 30/06/2018
Invesco Sterling Bond C GBP Acc S IE0030233948 03/08/2001 4.95 GBP 7.51 -6.03 2.47 -4.98 9.38 6.13 -1.02 0.10 -9.32 21.78 7.91 -0.16 0.82 13.19 25.66 30/06/2018
LU0416337789 16/04/2009 19.70 EUR 2.49 -6.62 -0.57 7.00 -3.26 3.86 -1.64 -2.87 2.11 7.70 3.85 -0.78 -2.17 27.46 11.14 30/06/2018
LU0070215933 15/05/1997 225.11 USD 3.92 -0.06 -0.73 4.15 11.75 3.85 5.27 -3.03 -0.61 24.41 4.99 6.19 -2.33 24.06 28.38 30/06/2018
LU0853555380 10/05/2013 11.42 EUR 0.54 -6.30 -0.51 7.62 5.64 2.62 -1.30 -2.81 2.70 17.61 3.53 -0.44 -2.11 28.19 21.36 30/06/2018
LU0853555547 05/09/2016 9.97 GBP -0.55 -6.91 -0.36 - - -3.06 -1.95 -2.66 - - -0.17 -1.09 -1.97 - - 30/06/2018
Investec GSF InvGrdCropBd A Inc-2 EUR H HK S
JPM US Bond A (acc) USD S
Jupiter Dynamic Bond L EUR Acc
Jupiter Dynamic Bond L GBP Acc HSC S
Jupiter Dynamic Bond L USD Acc HSC HK S LU0853555463 30/04/2013 12.05 USD 3.68 -0.66 -0.50 7.40 22.96 6.14 4.64 -2.80 2.49 36.89 7.03 5.55 -2.10 27.93 41.25 30/06/2018
Kames Strategic Global Bd A Acc EUR Hdg S IE00B296YK09 05/09/2011 11.64 EUR -0.56 -6.05 0.80 5.05 -4.58 2.25 -1.03 -1.53 0.25 6.23 2.38 -0.17 -0.82 25.14 9.62 30/06/2018
Kames Strategic Global Bd A Acc GBP Hdg S IE00B296YY45 05/09/2011 12.12 GBP -0.09 -6.64 1.01 -13.70 -4.47 2.72 -1.66 -1.33 -17.65 6.35 2.86 -0.80 -0.62 2.80 9.74 30/06/2018
CAG% - Compound Annual Growth Percentage since Launch DatePast performance is not indicative of future performance. Investors and/or their investment advisers are responsible for their investment decisions and any choice of Investments is entirely at their own risk. Please note that investment performance may go down as well as up.
© 2018 Morningstar. All Rights Reserved. The information, data, analyses and opinions (“Information”) contained herein: (1) include the proprietary information of Morningstar and Morningstar’s third party licensors; (2) may not be copied or redistributed except as specifically authorised;(3) do not constitute investment advice;(4) are providedsolely for informational purposes; (5) are not warranted to be complete, accurate or timely; and (6) may be drawn from fund data published on various dates. Morningstar is not responsible for any trading decisions, damages or other losses related to the Information or its use. Please verify all of the Information before using it and don’t make anyinvestment decision except upon the advice of a professional financial adviser. Past performance is no guarantee of future results. The value and income derived from investments may go down as well as up.
ß®
Data as at 10 Jul 2018
Page 5 of 15
Performance US Dollar Converted % Euro Converted % Sterling Converted %
Name ISIN Launch Date Bid CAG 3M 1Y 3Y 5Y CAG 3M 1Y 3Y 5Y CAG 3M 1Y 3Y 5Y Return Date
Kames Strategic Global Bd A Acc USD S IE00B296YR77 05/09/2011 12.45 USD 3.26 -0.34 1.03 5.69 12.84 6.17 4.98 -1.31 0.86 25.62 6.31 5.89 -0.60 25.89 29.62 30/06/2018
PIMCO GIS GlInGd Crdt Admin USD Acc HK S IE00B3KYRN47 21/01/2009 17.75 USD 6.39 -0.95 0.34 11.01 20.67 7.50 4.34 -1.98 5.93 34.34 6.84 5.24 -1.28 32.23 38.62 30/06/2018
Schroder ISF EM Dbt Abs Rt A Acc USD HK S LU0106253197 17/01/2000 27.25 USD 5.59 -5.94 -2.12 6.54 2.07 4.85 -0.93 -4.39 1.67 13.64 6.67 -0.06 -3.70 26.91 17.26 30/06/2018
Equity Global
Fidelity Glb MltAsst Inc A-Acc-EUR Hdg S LU0987487336 11/11/2013 11.59 EUR 0.20 -5.23 1.23 12.04 - 3.24 -0.17 -1.11 6.92 - 4.41 0.70 -0.40 33.46 - 30/06/2018
Fidelity Glb MltAsst Inc A-Acc-USD HK S LU0905233846 27/03/2013 12.18 USD 3.82 -0.49 1.58 11.85 24.73 5.62 4.82 -0.77 6.74 38.86 6.52 5.73 -0.05 33.23 43.29 30/06/2018
Fidelity MltAsst Income A Acc S GB00B1VQRP77 30/04/2007 167.10 GBX 1.43 -4.45 0.86 -3.71 13.76 2.86 0.64 -1.48 -8.11 26.64 5.27 1.52 -0.77 14.70 30.68 30/06/2018
Property
GSA Coral Student Portfolio D GBP LU0561976993 01/01/2011 1.76 GBP 5.62 -2.08 11.53 4.65 23.72 7.62 2.32 7.44 -1.71 37.37 7.96 1.40 8.20 20.01 40.97 31/05/2018GSA Coral Student Portfolio E EUR LU0561981480 01/07/2011 1.55 EUR 3.30 -2.98 12.14 25.54 22.33 6.57 1.37 8.03 17.91 35.81 6.13 0.46 8.80 43.96 39.37 31/05/2018GSA Coral Student Portfolio F USD LU0561985127 01/10/2012 1.44 USD 6.71 1.39 8.40 19.64 38.54 8.62 5.94 4.42 12.36 53.82 10.43 4.99 5.16 37.19 57.85 31/05/2018
OtherGenerali Worldwide Fund of Funds ReservePortfolio EUR - 20/10/2011 2.16 EUR -2.02 -7.21 -1.29 1.05 -10.18 0.35 -2.26 -3.57 -3.57 0.00 0.54 -1.41 -2.88 20.37 3.19 30/06/2018Generali Worldwide Fund of Funds ReservePortfolio GBP - 20/10/2011 2.54 GBP -1.65 -8.06 -1.46 -16.71 -10.12 0.72 -3.15 -3.74 -20.51 0.06 0.91 -2.31 -3.05 -0.78 3.25 30/06/2018Generali Worldwide Fund of Funds ReservePortfolio USD - 06/05/2004 2.96 USD 2.81 -1.33 -1.00 2.42 7.25 3.06 3.93 -3.29 -2.26 19.40 5.06 4.84 -2.60 22.01 23.20 30/06/2018Generali Worldwide Global Managed BondUSD Fund GB0006740632 01/04/1999 3.68 USD 3.22 -2.90 0.27 4.55 5.14 2.81 2.28 -2.05 -0.23 17.06 4.27 3.17 -1.35 24.54 20.79 30/06/2018KH Elite Mlt Asst Consv B GBP Acc NonRpt GG00B88W9173 18/10/2012 1.16 GBP -0.97 -4.62 2.83 -7.66 -0.34 1.04 0.47 0.45 -11.88 10.95 2.58 1.34 1.17 9.99 14.49 30/06/2018
SRRI Rating - 4
BondHSBC Global Investment Funds India Fixed
Income AC USD Acc S LU0780247804 20/08/2012 11.91 USD 3.02 -5.89 -6.36 8.89 18.14 4.00 -0.87 -8.53 3.91 31.52 6.12 0.00 -7.87 29.71 35.71 30/06/2018
Templeton Asian Bond A(acc)USD HK S LU0229949994 25/10/2005 17.38 USD 4.46 -2.30 -1.31 -3.92 -2.03 4.75 2.91 -3.59 -8.31 9.07 6.97 3.80 -2.90 14.45 12.55 30/06/2018
Templeton Emerging Mkts Bd A(Qdis)USD HK S LU0029876355 05/07/1991 13.88 USD 8.26 -9.03 -4.55 10.29 5.01 7.92 -4.18 -6.75 5.25 16.90 9.08 -3.34 -6.09 31.38 20.63 30/06/2018
Templeton Global Bond A(acc)USD HK S LU0252652382 28/04/2006 28.86 USD 5.47 -2.53 -2.17 -0.17 3.55 6.13 2.67 -4.43 -4.73 15.29 8.28 3.56 -3.75 18.91 18.96 30/06/2018
Templeton Global Bond A(Mdis)SGD-H1 HK S LU0366777323 16/06/2008 10.65 SGD 4.57 -6.35 -1.83 -1.58 -3.57 7.54 -1.35 -4.10 -6.08 7.35 8.79 -0.49 -3.42 17.23 10.77 30/06/2018
Equity Global
Carmignac Patrimoine A EUR Acc FR0010135103 07/11/1989 641.62 EUR 8.11 -5.72 0.12 1.88 5.50 7.75 -0.69 -2.20 -2.78 17.45 8.79 0.17 -1.50 21.36 21.20 30/06/2018
CAG% - Compound Annual Growth Percentage since Launch DatePast performance is not indicative of future performance. Investors and/or their investment advisers are responsible for their investment decisions and any choice of Investments is entirely at their own risk. Please note that investment performance may go down as well as up.
© 2018 Morningstar. All Rights Reserved. The information, data, analyses and opinions (“Information”) contained herein: (1) include the proprietary information of Morningstar and Morningstar’s third party licensors; (2) may not be copied or redistributed except as specifically authorised;(3) do not constitute investment advice;(4) are providedsolely for informational purposes; (5) are not warranted to be complete, accurate or timely; and (6) may be drawn from fund data published on various dates. Morningstar is not responsible for any trading decisions, damages or other losses related to the Information or its use. Please verify all of the Information before using it and don’t make anyinvestment decision except upon the advice of a professional financial adviser. Past performance is no guarantee of future results. The value and income derived from investments may go down as well as up.
ß®
Data as at 10 Jul 2018
Page 6 of 15
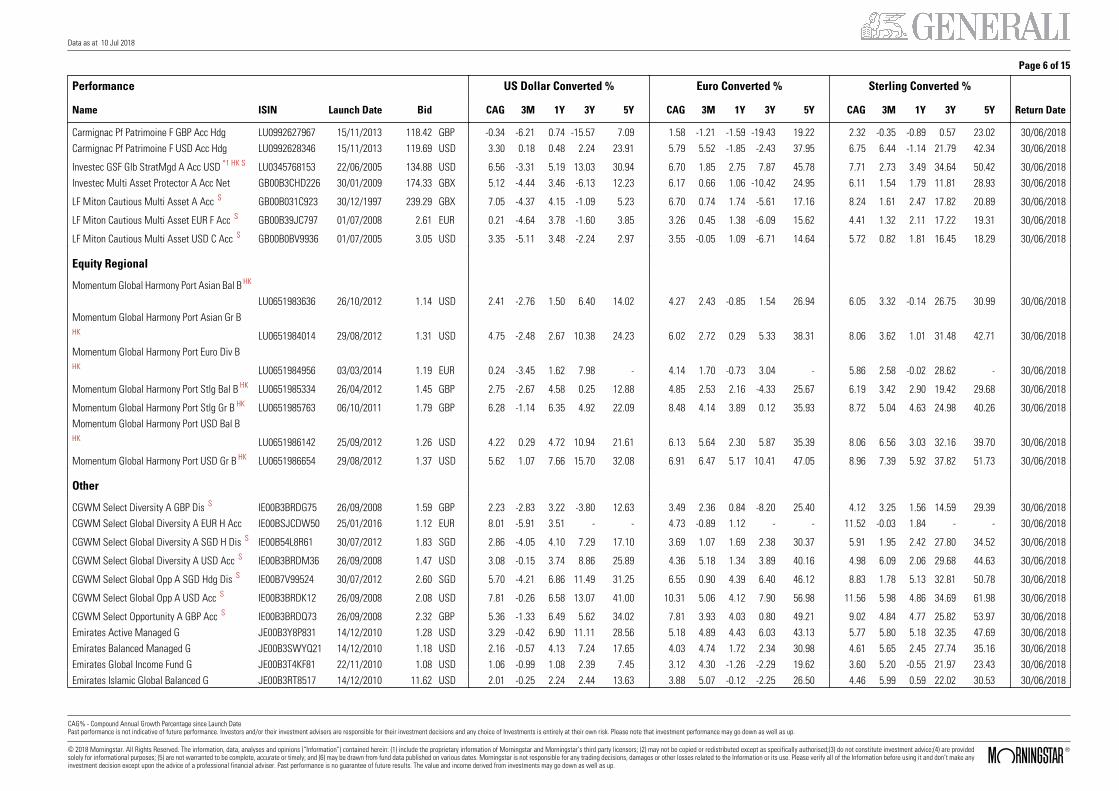
Performance US Dollar Converted % Euro Converted % Sterling Converted %
Name ISIN Launch Date Bid CAG 3M 1Y 3Y 5Y CAG 3M 1Y 3Y 5Y CAG 3M 1Y 3Y 5Y Return Date
Carmignac Pf Patrimoine F GBP Acc Hdg LU0992627967 15/11/2013 118.42 GBP -0.34 -6.21 0.74 -15.57 7.09 1.58 -1.21 -1.59 -19.43 19.22 2.32 -0.35 -0.89 0.57 23.02 30/06/2018Carmignac Pf Patrimoine F USD Acc Hdg LU0992628346 15/11/2013 119.69 USD 3.30 0.18 0.48 2.24 23.91 5.79 5.52 -1.85 -2.43 37.95 6.75 6.44 -1.14 21.79 42.34 30/06/2018
Investec GSF Glb StratMgd A Acc USD *1 HK S LU0345768153 22/06/2005 134.88 USD 6.56 -3.31 5.19 13.03 30.94 6.70 1.85 2.75 7.87 45.78 7.71 2.73 3.49 34.64 50.42 30/06/2018
Investec Multi Asset Protector A Acc Net GB00B3CHD226 30/01/2009 174.33 GBX 5.12 -4.44 3.46 -6.13 12.23 6.17 0.66 1.06 -10.42 24.95 6.11 1.54 1.79 11.81 28.93 30/06/2018
LF Miton Cautious Multi Asset A Acc S GB00B031C923 30/12/1997 239.29 GBX 7.05 -4.37 4.15 -1.09 5.23 6.70 0.74 1.74 -5.61 17.16 8.24 1.61 2.47 17.82 20.89 30/06/2018
LF Miton Cautious Multi Asset EUR F Acc S GB00B39JC797 01/07/2008 2.61 EUR 0.21 -4.64 3.78 -1.60 3.85 3.26 0.45 1.38 -6.09 15.62 4.41 1.32 2.11 17.22 19.31 30/06/2018
LF Miton Cautious Multi Asset USD C Acc S GB00B0BV9936 01/07/2005 3.05 USD 3.35 -5.11 3.48 -2.24 2.97 3.55 -0.05 1.09 -6.71 14.64 5.72 0.82 1.81 16.45 18.29 30/06/2018 Equity Regional
Momentum Global Harmony Port Asian Bal B HK
LU0651983636 26/10/2012 1.14 USD 2.41 -2.76 1.50 6.40 14.02 4.27 2.43 -0.85 1.54 26.94 6.05 3.32 -0.14 26.75 30.99 30/06/2018Momentum Global Harmony Port Asian Gr BHK LU0651984014 29/08/2012 1.31 USD 4.75 -2.48 2.67 10.38 24.23 6.02 2.72 0.29 5.33 38.31 8.06 3.62 1.01 31.48 42.71 30/06/2018Momentum Global Harmony Port Euro Div BHK LU0651984956 03/03/2014 1.19 EUR 0.24 -3.45 1.62 7.98 - 4.14 1.70 -0.73 3.04 - 5.86 2.58 -0.02 28.62 - 30/06/2018
Momentum Global Harmony Port Stlg Bal B HK LU0651985334 26/04/2012 1.45 GBP 2.75 -2.67 4.58 0.25 12.88 4.85 2.53 2.16 -4.33 25.67 6.19 3.42 2.90 19.42 29.68 30/06/2018
Momentum Global Harmony Port Stlg Gr B HK LU0651985763 06/10/2011 1.79 GBP 6.28 -1.14 6.35 4.92 22.09 8.48 4.14 3.89 0.12 35.93 8.72 5.04 4.63 24.98 40.26 30/06/2018Momentum Global Harmony Port USD Bal BHK LU0651986142 25/09/2012 1.26 USD 4.22 0.29 4.72 10.94 21.61 6.13 5.64 2.30 5.87 35.39 8.06 6.56 3.03 32.16 39.70 30/06/2018
Momentum Global Harmony Port USD Gr B HK LU0651986654 29/08/2012 1.37 USD 5.62 1.07 7.66 15.70 32.08 6.91 6.47 5.17 10.41 47.05 8.96 7.39 5.92 37.82 51.73 30/06/2018 Other
CGWM Select Diversity A GBP Dis S IE00B3BRDG75 26/09/2008 1.59 GBP 2.23 -2.83 3.22 -3.80 12.63 3.49 2.36 0.84 -8.20 25.40 4.12 3.25 1.56 14.59 29.39 30/06/2018CGWM Select Global Diversity A EUR H Acc IE00BSJCDW50 25/01/2016 1.12 EUR 8.01 -5.91 3.51 - - 4.73 -0.89 1.12 - - 11.52 -0.03 1.84 - - 30/06/2018
CGWM Select Global Diversity A SGD H Dis S IE00B54L8R61 30/07/2012 1.83 SGD 2.86 -4.05 4.10 7.29 17.10 3.69 1.07 1.69 2.38 30.37 5.91 1.95 2.42 27.80 34.52 30/06/2018
CGWM Select Global Diversity A USD Acc S IE00B3BRDM36 26/09/2008 1.47 USD 3.08 -0.15 3.74 8.86 25.89 4.36 5.18 1.34 3.89 40.16 4.98 6.09 2.06 29.68 44.63 30/06/2018
CGWM Select Global Opp A SGD Hdg Dis S IE00B7V99524 30/07/2012 2.60 SGD 5.70 -4.21 6.86 11.49 31.25 6.55 0.90 4.39 6.40 46.12 8.83 1.78 5.13 32.81 50.78 30/06/2018
CGWM Select Global Opp A USD Acc S IE00B3BRDK12 26/09/2008 2.08 USD 7.81 -0.26 6.58 13.07 41.00 10.31 5.06 4.12 7.90 56.98 11.56 5.98 4.86 34.69 61.98 30/06/2018
CGWM Select Opportunity A GBP Acc S IE00B3BRDQ73 26/09/2008 2.32 GBP 5.36 -1.33 6.49 5.62 34.02 7.81 3.93 4.03 0.80 49.21 9.02 4.84 4.77 25.82 53.97 30/06/2018Emirates Active Managed G JE00B3Y8P831 14/12/2010 1.28 USD 3.29 -0.42 6.90 11.11 28.56 5.18 4.89 4.43 6.03 43.13 5.77 5.80 5.18 32.35 47.69 30/06/2018Emirates Balanced Managed G JE00B3SWYQ21 14/12/2010 1.18 USD 2.16 -0.57 4.13 7.24 17.65 4.03 4.74 1.72 2.34 30.98 4.61 5.65 2.45 27.74 35.16 30/06/2018Emirates Global Income Fund G JE00B3T4KF81 22/11/2010 1.08 USD 1.06 -0.99 1.08 2.39 7.45 3.12 4.30 -1.26 -2.29 19.62 3.60 5.20 -0.55 21.97 23.43 30/06/2018Emirates Islamic Global Balanced G JE00B3RT8517 14/12/2010 11.62 USD 2.01 -0.25 2.24 2.44 13.63 3.88 5.07 -0.12 -2.25 26.50 4.46 5.99 0.59 22.02 30.53 30/06/2018
CAG% - Compound Annual Growth Percentage since Launch DatePast performance is not indicative of future performance. Investors and/or their investment advisers are responsible for their investment decisions and any choice of Investments is entirely at their own risk. Please note that investment performance may go down as well as up. © 2018 Morningstar. All Rights Reserved. The information, data, analyses and opinions (“Information”) contained herein: (1) include the proprietary information of Morningstar and Morningstar’s third party licensors; (2) may not be copied or redistributed except as specifically authorised;(3) do not constitute investment advice;(4) are providedsolely for informational purposes; (5) are not warranted to be complete, accurate or timely; and (6) may be drawn from fund data published on various dates. Morningstar is not responsible for any trading decisions, damages or other losses related to the Information or its use. Please verify all of the Information before using it and don’t make anyinvestment decision except upon the advice of a professional financial adviser. Past performance is no guarantee of future results. The value and income derived from investments may go down as well as up.
ß®
Data as at 10 Jul 2018
Page 7 of 15
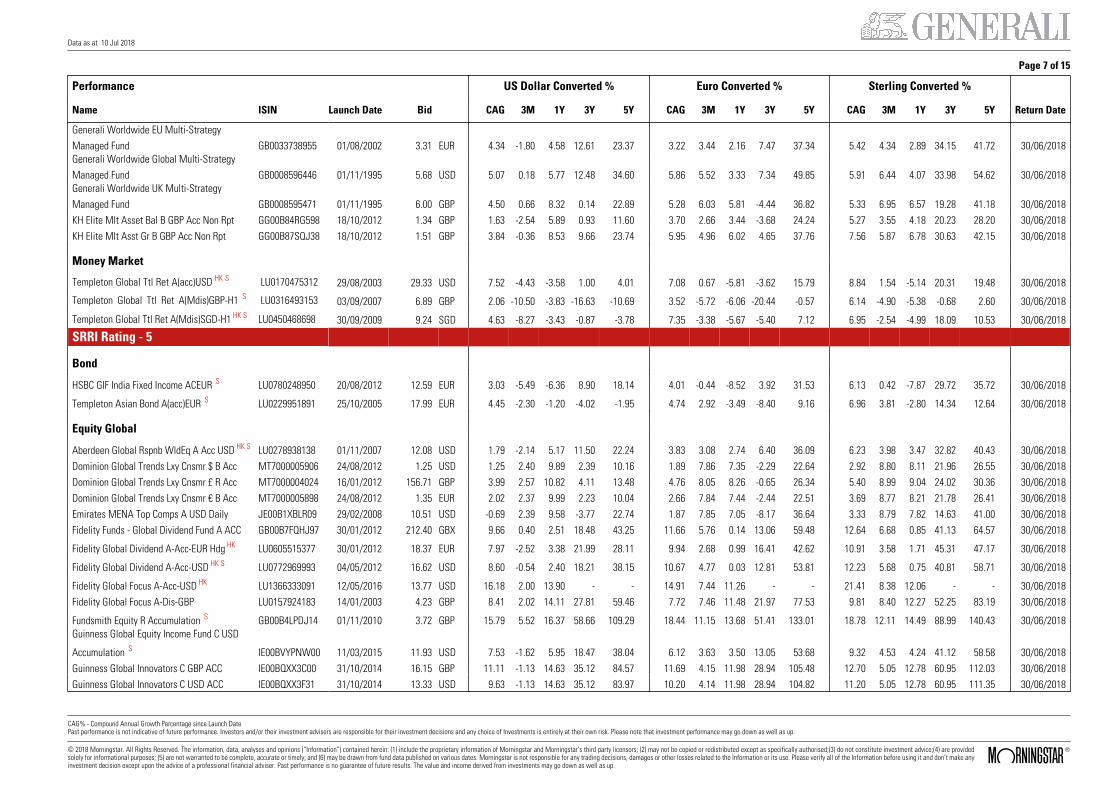
Performance US Dollar Converted % Euro Converted % Sterling Converted %
Name ISIN Launch Date Bid CAG 3M 1Y 3Y 5Y CAG 3M 1Y 3Y 5Y CAG 3M 1Y 3Y 5Y Return Date
Generali Worldwide EU Multi-StrategyManaged Fund GB0033738955 01/08/2002 3.31 EUR 4.34 -1.80 4.58 12.61 23.37 3.22 3.44 2.16 7.47 37.34 5.42 4.34 2.89 34.15 41.72 30/06/2018Generali Worldwide Global Multi-StrategyManaged Fund GB0008596446 01/11/1995 5.68 USD 5.07 0.18 5.77 12.48 34.60 5.86 5.52 3.33 7.34 49.85 5.91 6.44 4.07 33.98 54.62 30/06/2018Generali Worldwide UK Multi-StrategyManaged Fund GB0008595471 01/11/1995 6.00 GBP 4.50 0.66 8.32 0.14 22.89 5.28 6.03 5.81 -4.44 36.82 5.33 6.95 6.57 19.28 41.18 30/06/2018KH Elite Mlt Asset Bal B GBP Acc Non Rpt GG00B84RG598 18/10/2012 1.34 GBP 1.63 -2.54 5.89 0.93 11.60 3.70 2.66 3.44 -3.68 24.24 5.27 3.55 4.18 20.23 28.20 30/06/2018KH Elite Mlt Asst Gr B GBP Acc Non Rpt GG00B87SQJ38 18/10/2012 1.51 GBP 3.84 -0.36 8.53 9.66 23.74 5.95 4.96 6.02 4.65 37.76 7.56 5.87 6.78 30.63 42.15 30/06/2018
Money Market
29/08/2003 29.33 USD 7.52 -4.43 -3.58 1.00 4.01 7.08 0.67 -5.81 -3.62 15.79 8.84 1.54 -5.14 20.31 19.48 30/06/2018
03/09/2007 6.89 GBP 2.06 -10.50 -3.83 -16.63 -10.69 3.52 -5.72 -6.06 -20.44 -0.57 6.14 -4.90 -5.38 -0.68 2.60 30/06/2018
Templeton Global Ttl Ret A(acc)USD HK S LU0170475312
Templeton Global Ttl Ret A(Mdis)GBP-H1 S LU0316493153
Templeton Global Ttl Ret A(Mdis)SGD-H1 HK S LU0450468698 30/09/2009 9.24 SGD 4.63 -8.27 -3.43 -0.87 -3.78 7.35 -3.38 -5.67 -5.40 7.12 6.95 -2.54 -4.99 18.09 10.53 30/06/2018
SRRI Rating - 5
Bond
HSBC GIF India Fixed Income ACEUR S LU0780248950 20/08/2012 12.59 EUR 3.03 -5.49 -6.36 8.90 18.14 4.01 -0.44 -8.52 3.92 31.53 6.13 0.42 -7.87 29.72 35.72 30/06/2018
Templeton Asian Bond A(acc)EUR S LU0229951891 25/10/2005 17.99 EUR 4.45 -2.30 -1.20 -4.02 -1.95 4.74 2.92 -3.49 -8.40 9.16 6.96 3.81 -2.80 14.34 12.64 30/06/2018
Equity Global
Aberdeen Global Rspnb WldEq A Acc USD HK S LU0278938138 01/11/2007 12.08 USD 1.79 -2.14 5.17 11.50 22.24 3.83 3.08 2.74 6.40 36.09 6.23 3.98 3.47 32.82 40.43 30/06/2018Dominion Global Trends Lxy Cnsmr $ B Acc MT7000005906 24/08/2012 1.25 USD 1.25 2.40 9.89 2.39 10.16 1.89 7.86 7.35 -2.29 22.64 2.92 8.80 8.11 21.96 26.55 30/06/2018Dominion Global Trends Lxy Cnsmr £ R Acc MT7000004024 16/01/2012 156.71 GBP 3.99 2.57 10.82 4.11 13.48 4.76 8.05 8.26 -0.65 26.34 5.40 8.99 9.04 24.02 30.36 30/06/2018Dominion Global Trends Lxy Cnsmr € B Acc MT7000005898 24/08/2012 1.35 EUR 2.02 2.37 9.99 2.23 10.04 2.66 7.84 7.44 -2.44 22.51 3.69 8.77 8.21 21.78 26.41 30/06/2018Emirates MENA Top Comps A USD Daily JE00B1XBLR09 29/02/2008 10.51 USD -0.69 2.39 9.58 -3.77 22.74 1.87 7.85 7.05 -8.17 36.64 3.33 8.79 7.82 14.63 41.00 30/06/2018Fidelity Funds - Global Dividend Fund A ACC GB00B7FQHJ97 30/01/2012 212.40 GBX 9.66 0.40 2.51 18.48 43.25 11.66 5.76 0.14 13.06 59.48 12.64 6.68 0.85 41.13 64.57 30/06/2018
Fidelity Global Dividend A-Acc-EUR Hdg HK LU0605515377 30/01/2012 18.37 EUR 7.97 -2.52 3.38 21.99 28.11 9.94 2.68 0.99 16.41 42.62 10.91 3.58 1.71 45.31 47.17 30/06/2018
Fidelity Global Dividend A-Acc-USD HK S LU0772969993 04/05/2012 16.62 USD 8.60 -0.54 2.40 18.21 38.15 10.67 4.77 0.03 12.81 53.81 12.23 5.68 0.75 40.81 58.71 30/06/2018
Fidelity Global Focus A-Acc-USD HK LU1366333091 12/05/2016 13.77 USD 16.18 2.00 13.90 - - 14.91 7.44 11.26 - - 21.41 8.38 12.06 - - 30/06/2018Fidelity Global Focus A-Dis-GBP LU0157924183 14/01/2003 4.23 GBP 8.41 2.02 14.11 27.81 59.46 7.72 7.46 11.48 21.97 77.53 9.81 8.40 12.27 52.25 83.19 30/06/2018
Fundsmith Equity R Accumulation S GB00B4LPDJ14 01/11/2010 3.72 GBP 15.79 5.52 16.37 58.66 109.29 18.44 11.15 13.68 51.41 133.01 18.78 12.11 14.49 88.99 140.43 30/06/2018Guinness Global Equity Income Fund C USD
Accumulation S IE00BVYPNW00 11/03/2015 11.93 USD 7.53 -1.62 5.95 18.47 38.04 6.12 3.63 3.50 13.05 53.68 9.32 4.53 4.24 41.12 58.58 30/06/2018Guinness Global Innovators C GBP ACC IE00BQXX3C00 31/10/2014 16.15 GBP 11.11 -1.13 14.63 35.12 84.57 11.69 4.15 11.98 28.94 105.48 12.70 5.05 12.78 60.95 112.03 30/06/2018Guinness Global Innovators C USD ACC IE00BQXX3F31 31/10/2014 13.33 USD 9.63 -1.13 14.63 35.12 83.97 10.20 4.14 11.98 28.94 104.82 11.20 5.05 12.78 60.95 111.35 30/06/2018
CAG% - Compound Annual Growth Percentage since Launch DatePast performance is not indicative of future performance. Investors and/or their investment advisers are responsible for their investment decisions and any choice of Investments is entirely at their own risk. Please note that investment performance may go down as well as up.
© 2018 Morningstar. All Rights Reserved. The information, data, analyses and opinions (“Information”) contained herein: (1) include the proprietary information of Morningstar and Morningstar’s third party licensors; (2) may not be copied or redistributed except as specifically authorised;(3) do not constitute investment advice;(4) are providedsolely for informational purposes; (5) are not warranted to be complete, accurate or timely; and (6) may be drawn from fund data published on various dates. Morningstar is not responsible for any trading decisions, damages or other losses related to the Information or its use. Please verify all of the Information before using it and don’t make anyinvestment decision except upon the advice of a professional financial adviser. Past performance is no guarantee of future results. The value and income derived from investments may go down as well as up.
ß®
Data as at 10 Jul 2018
Page 8 of 15
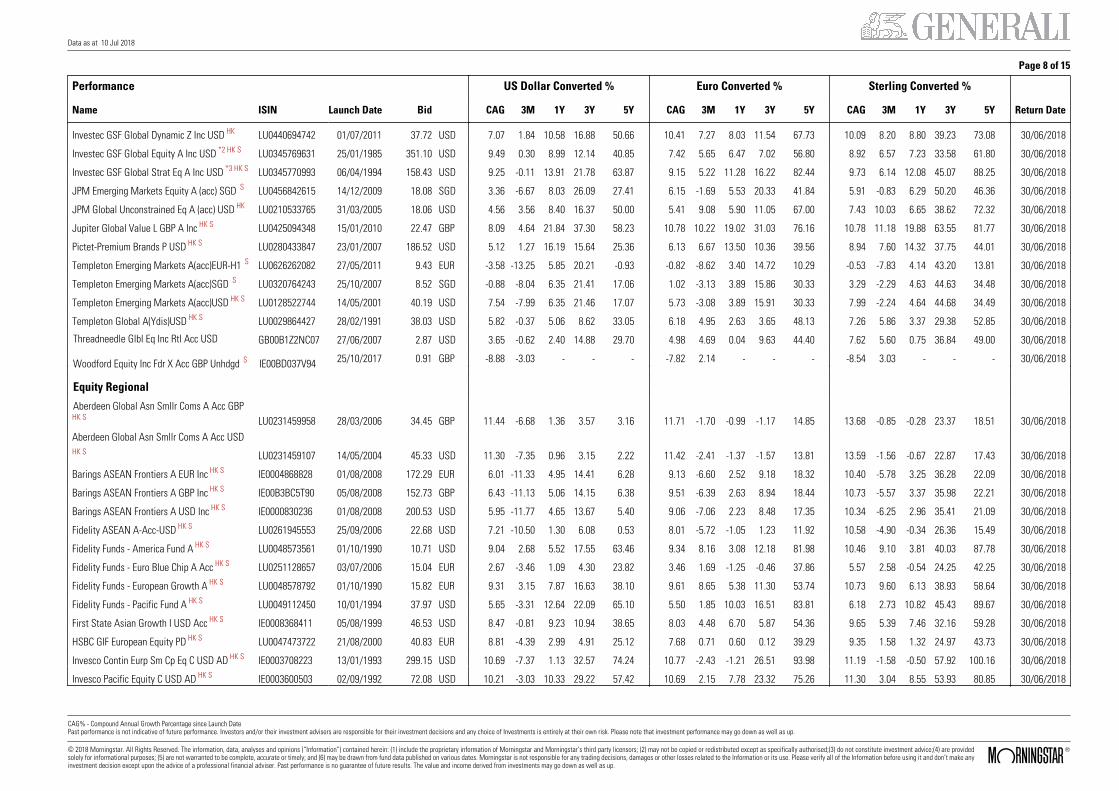
Performance US Dollar Converted % Euro Converted % Sterling Converted %
Name ISIN Launch Date Bid CAG 3M 1Y 3Y 5Y CAG 3M 1Y 3Y 5Y CAG 3M 1Y 3Y 5Y Return Date
Investec GSF Global Dynamic Z Inc USD HK LU0440694742 01/07/2011 37.72 USD 7.07 1.84 10.58 16.88 50.66 10.41 7.27 8.03 11.54 67.73 10.09 8.20 8.80 39.23 73.08 30/06/2018
Investec GSF Global Equity A Inc USD *2 HK S LU0345769631 25/01/1985 351.10 USD 9.49 0.30 8.99 12.14 40.85 7.42 5.65 6.47 7.02 56.80 8.92 6.57 7.23 33.58 61.80 30/06/2018
Investec GSF Global Strat Eq A Inc USD *3 HK S LU0345770993 06/04/1994 158.43 USD 9.25 -0.11 13.91 21.78 63.87 9.15 5.22 11.28 16.22 82.44 9.73 6.14 12.08 45.07 88.25 30/06/2018
JPM Emerging Markets Equity A (acc) SGD S LU0456842615 14/12/2009 18.08 SGD 3.36 -6.67 8.03 26.09 27.41 6.15 -1.69 5.53 20.33 41.84 5.91 -0.83 6.29 50.20 46.36 30/06/2018
JPM Global Unconstrained Eq A (acc) USD HK LU0210533765 31/03/2005 18.06 USD 4.56 3.56 8.40 16.37 50.00 5.41 9.08 5.90 11.05 67.00 7.43 10.03 6.65 38.62 72.32 30/06/2018
Jupiter Global Value L GBP A Inc HK S LU0425094348 15/01/2010 22.47 GBP 8.09 4.64 21.84 37.30 58.23 10.78 10.22 19.02 31.03 76.16 10.78 11.18 19.88 63.55 81.77 30/06/2018
Pictet-Premium Brands P USD HK S LU0280433847 23/01/2007 186.52 USD 5.12 1.27 16.19 15.64 25.36 6.13 6.67 13.50 10.36 39.56 8.94 7.60 14.32 37.75 44.01 30/06/2018
Templeton Emerging Markets A(acc)EUR-H1 S LU0626262082 27/05/2011 9.43 EUR -3.58 -13.25 5.85 20.21 -0.93 -0.82 -8.62 3.40 14.72 10.29 -0.53 -7.83 4.14 43.20 13.81 30/06/2018
Templeton Emerging Markets A(acc)SGD S LU0320764243 25/10/2007 8.52 SGD -0.88 -8.04 6.35 21.41 17.06 1.02 -3.13 3.89 15.86 30.33 3.29 -2.29 4.63 44.63 34.48 30/06/2018
Templeton Emerging Markets A(acc)USD HK S LU0128522744 14/05/2001 40.19 USD 7.54 -7.99 6.35 21.46 17.07 5.73 -3.08 3.89 15.91 30.33 7.99 -2.24 4.64 44.68 34.49 30/06/2018
Templeton Global A(Ydis)USD HK S LU0029864427 28/02/1991 38.03 USD 5.82 -0.37 5.06 8.62 33.05 6.18 4.95 2.63 3.65 48.13 7.26 5.86 3.37 29.38 52.85 30/06/2018
Threadneedle Glbl Eq Inc Rtl Acc USD GB00B1Z2NC07 27/06/2007 2.87 USD 3.65 -0.62 2.40 14.88 29.70 4.98 4.69 0.04 9.63 44.40 7.62 5.60 0.75 36.84 49.00 30/06/2018
25/10/2017 0.91 GBP -8.88 -3.03 - - - -7.82 2.14 - - - -8.54 3.03 - - - 30/06/2018Woodford Equity Inc Fdr X Acc GBP Unhdgd S IE00BD037V94
Equity Regional
Aberdeen Global Asn Smllr Coms A Acc GBPHK S LU0231459958 28/03/2006 34.45 GBP 11.44 -6.68 1.36 3.57 3.16 11.71 -1.70 -0.99 -1.17 14.85 13.68 -0.85 -0.28 23.37 18.51 30/06/2018Aberdeen Global Asn Smllr Coms A Acc USDHK S LU0231459107 14/05/2004 45.33 USD 11.30 -7.35 0.96 3.15 2.22 11.42 -2.41 -1.37 -1.57 13.81 13.59 -1.56 -0.67 22.87 17.43 30/06/2018
Barings ASEAN Frontiers A EUR Inc HK S IE0004868828 01/08/2008 172.29 EUR 6.01 -11.33 4.95 14.41 6.28 9.13 -6.60 2.52 9.18 18.32 10.40 -5.78 3.25 36.28 22.09 30/06/2018
Barings ASEAN Frontiers A GBP Inc HK S IE00B3BC5T90 05/08/2008 152.73 GBP 6.43 -11.13 5.06 14.15 6.38 9.51 -6.39 2.63 8.94 18.44 10.73 -5.57 3.37 35.98 22.21 30/06/2018
Barings ASEAN Frontiers A USD Inc HK S IE0000830236 01/08/2008 200.53 USD 5.95 -11.77 4.65 13.67 5.40 9.06 -7.06 2.23 8.48 17.35 10.34 -6.25 2.96 35.41 21.09 30/06/2018
Fidelity ASEAN A-Acc-USD HK S LU0261945553 25/09/2006 22.68 USD 7.21 -10.50 1.30 6.08 0.53 8.01 -5.72 -1.05 1.23 11.92 10.58 -4.90 -0.34 26.36 15.49 30/06/2018
Fidelity Funds - America Fund A HK S LU0048573561 01/10/1990 10.71 USD 9.04 2.68 5.52 17.55 63.46 9.34 8.16 3.08 12.18 81.98 10.46 9.10 3.81 40.03 87.78 30/06/2018
Fidelity Funds - Euro Blue Chip A Acc HK S LU0251128657 03/07/2006 15.04 EUR 2.67 -3.46 1.09 4.30 23.82 3.46 1.69 -1.25 -0.46 37.86 5.57 2.58 -0.54 24.25 42.25 30/06/2018
Fidelity Funds - European Growth A HK S LU0048578792 01/10/1990 15.82 EUR 9.31 3.15 7.87 16.63 38.10 9.61 8.65 5.38 11.30 53.74 10.73 9.60 6.13 38.93 58.64 30/06/2018
Fidelity Funds - Pacific Fund A HK S LU0049112450 10/01/1994 37.97 USD 5.65 -3.31 12.64 22.09 65.10 5.50 1.85 10.03 16.51 83.81 6.18 2.73 10.82 45.43 89.67 30/06/2018
First State Asian Growth I USD Acc HK S IE0008368411 05/08/1999 46.53 USD 8.47 -0.81 9.23 10.94 38.65 8.03 4.48 6.70 5.87 54.36 9.65 5.39 7.46 32.16 59.28 30/06/2018
HSBC GIF European Equity PD HK S LU0047473722 21/08/2000 40.83 EUR 8.81 -4.39 2.99 4.91 25.12 7.68 0.71 0.60 0.12 39.29 9.35 1.58 1.32 24.97 43.73 30/06/2018
Invesco Contin Eurp Sm Cp Eq C USD AD HK S IE0003708223 13/01/1993 299.15 USD 10.69 -7.37 1.13 32.57 74.24 10.77 -2.43 -1.21 26.51 93.98 11.19 -1.58 -0.50 57.92 100.16 30/06/2018
Invesco Pacific Equity C USD AD HK S IE0003600503 02/09/1992 72.08 USD 10.21 -3.03 10.33 29.22 57.42 10.69 2.15 7.78 23.32 75.26 11.30 3.04 8.55 53.93 80.85 30/06/2018
CAG% - Compound Annual Growth Percentage since Launch DatePast performance is not indicative of future performance. Investors and/or their investment advisers are responsible for their investment decisions and any choice of Investments is entirely at their own risk. Please note that investment performance may go down as well as up.
© 2018 Morningstar. All Rights Reserved. The information, data, analyses and opinions (“Information”) contained herein: (1) include the proprietary information of Morningstar and Morningstar’s third party licensors; (2) may not be copied or redistributed except as specifically authorised;(3) do not constitute investment advice;(4) are providedsolely for informational purposes; (5) are not warranted to be complete, accurate or timely; and (6) may be drawn from fund data published on various dates. Morningstar is not responsible for any trading decisions, damages or other losses related to the Information or its use. Please verify all of the Information before using it and don’t make anyinvestment decision except upon the advice of a professional financial adviser. Past performance is no guarantee of future results. The value and income derived from investments may go down as well as up.
ß®
Data as at 10 Jul 2018
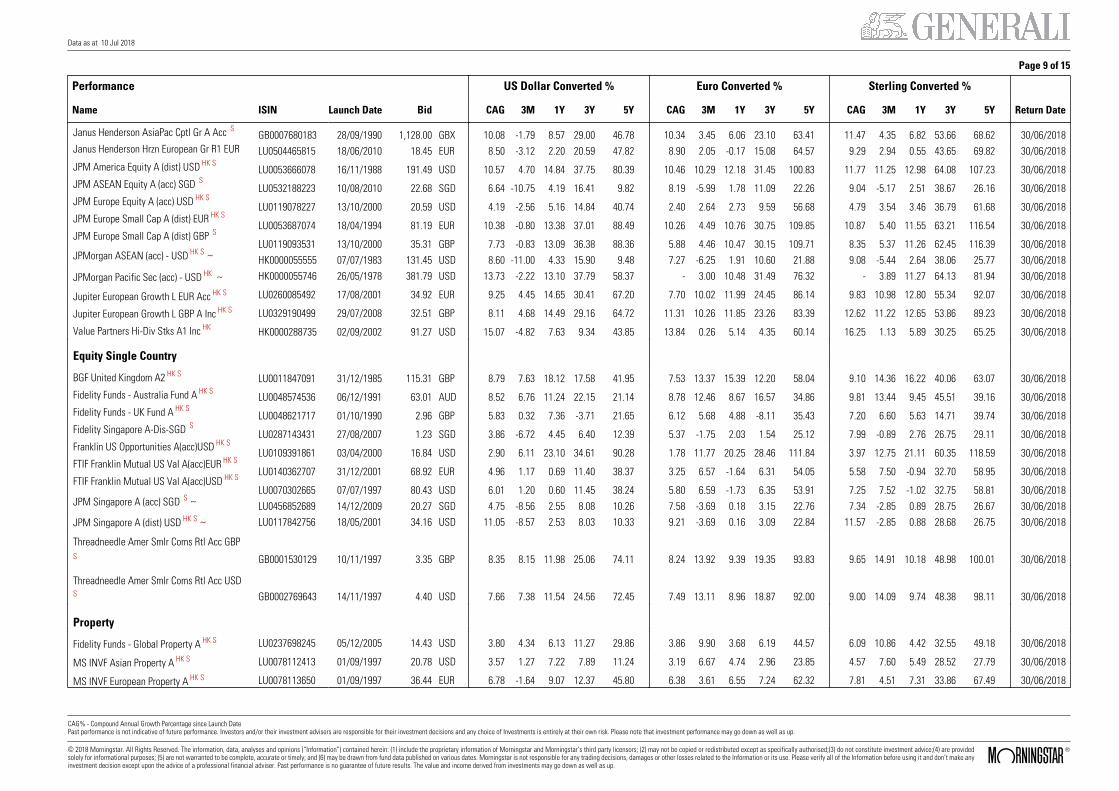
Page 9 of 15
Performance US Dollar Converted % Euro Converted % Sterling Converted %
Name ISIN Launch Date Bid CAG 3M 1Y 3Y 5Y CAG 3M 1Y 3Y 5Y CAG 3M 1Y 3Y 5Y Return Date
GB0007680183 28/09/1990 1,128.00 GBX 10.08 -1.79 8.57 29.00 46.78 10.34 3.45 6.06 23.10 63.41 11.47 4.35 6.82 53.66 68.62 30/06/2018LU0504465815 18/06/2010 18.45 EUR 8.50 -3.12 2.20 20.59 47.82 8.90 2.05 -0.17 15.08 64.57 9.29 2.94 0.55 43.65 69.82 30/06/2018
LU0053666078 16/11/1988 191.49 USD 10.57 4.70 14.84 37.75 80.39 10.46 10.29 12.18 31.45 100.83 11.77 11.25 12.98 64.08 107.23 30/06/2018
LU0532188223 10/08/2010 22.68 SGD 6.64 -10.75 4.19 16.41 9.82 8.19 -5.99 1.78 11.09 22.26 9.04 -5.17 2.51 38.67 26.16 30/06/2018
LU0119078227 13/10/2000 20.59 USD 4.19 -2.56 5.16 14.84 40.74 2.40 2.64 2.73 9.59 56.68 4.79 3.54 3.46 36.79 61.68 30/06/2018
LU0053687074 18/04/1994 81.19 EUR 10.38 -0.80 13.38 37.01 88.49 10.26 4.49 10.76 30.75 109.85 10.87 5.40 11.55 63.21 116.54 30/06/2018
LU0119093531 13/10/2000 35.31 GBP 7.73 -0.83 13.09 36.38 88.36 5.88 4.46 10.47 30.15 109.71 8.35 5.37 11.26 62.45 116.39 30/06/2018HK0000055555 07/07/1983 131.45 USD 8.60 -11.00 4.33 15.90 9.48 7.27 -6.25 1.91 10.60 21.88 9.08 -5.44 2.64 38.06 25.77 30/06/2018HK0000055746 26/05/1978 381.79 USD 13.73 -2.22 13.10 37.79 58.37 - 3.00 10.48 31.49 76.32 - 3.89 11.27 64.13 81.94 30/06/2018
LU0260085492 17/08/2001 34.92 EUR 9.25 4.45 14.65 30.41 67.20 7.70 10.02 11.99 24.45 86.14 9.83 10.98 12.80 55.34 92.07 30/06/2018
LU0329190499 29/07/2008 32.51 GBP 8.11 4.68 14.49 29.16 64.72 11.31 10.26 11.85 23.26 83.39 12.62 11.22 12.65 53.86 89.23 30/06/2018
HK0000288735 02/09/2002 91.27 USD 15.07 -4.82 7.63 9.34 43.85 13.84 0.26 5.14 4.35 60.14 16.25 1.13 5.89 30.25 65.25 30/06/2018
LU0011847091 31/12/1985 115.31 GBP 8.79 7.63 18.12 17.58 41.95 7.53 13.37 15.39 12.20 58.04 9.10 14.36 16.22 40.06 63.07 30/06/2018
LU0048574536 06/12/1991 63.01 AUD 8.52 6.76 11.24 22.15 21.14 8.78 12.46 8.67 16.57 34.86 9.81 13.44 9.45 45.51 39.16 30/06/2018
LU0048621717 01/10/1990 2.96 GBP 5.83 0.32 7.36 -3.71 21.65 6.12 5.68 4.88 -8.11 35.43 7.20 6.60 5.63 14.71 39.74 30/06/2018
LU0287143431 27/08/2007 1.23 SGD 3.86 -6.72 4.45 6.40 12.39 5.37 -1.75 2.03 1.54 25.12 7.99 -0.89 2.76 26.75 29.11 30/06/2018
LU0109391861 03/04/2000 16.84 USD 2.90 6.11 23.10 34.61 90.28 1.78 11.77 20.25 28.46 111.84 3.97 12.75 21.11 60.35 118.59 30/06/2018
LU0140362707 31/12/2001 68.92 EUR 4.96 1.17 0.69 11.40 38.37 3.25 6.57 -1.64 6.31 54.05 5.58 7.50 -0.94 32.70 58.95 30/06/2018
LU0070302665 07/07/1997 80.43 USD 6.01 1.20 0.60 11.45 38.24 5.80 6.59 -1.73 6.35 53.91 7.25 7.52 -1.02 32.75 58.81 30/06/2018LU0456852689 14/12/2009 20.27 SGD 4.75 -8.56 2.55 8.08 10.26 7.58 -3.69 0.18 3.15 22.76 7.34 -2.85 0.89 28.75 26.67 30/06/2018LU0117842756 18/05/2001 34.16 USD 11.05 -8.57 2.53 8.03 10.33 9.21 -3.69 0.16 3.09 22.84 11.57 -2.85 0.88 28.68 26.75 30/06/2018
GB0001530129 10/11/1997 3.35 GBP 8.35 8.15 11.98 25.06 74.11 8.24 13.92 9.39 19.35 93.83 9.65 14.91 10.18 48.98 100.01 30/06/2018
GB0002769643 14/11/1997 4.40 USD 7.66 7.38 11.54 24.56 72.45 7.49 13.11 8.96 18.87 92.00 9.00 14.09 9.74 48.38 98.11 30/06/2018
LU0237698245 05/12/2005 14.43 USD 3.80 4.34 6.13 11.27 29.86 3.86 9.90 3.68 6.19 44.57 6.09 10.86 4.42 32.55 49.18 30/06/2018
LU0078112413 01/09/1997 20.78 USD 3.57 1.27 7.22 7.89 11.24 3.19 6.67 4.74 2.96 23.85 4.57 7.60 5.49 28.52 27.79 30/06/2018
Janus Henderson AsiaPac Cptl Gr A Acc S
Janus Henderson Hrzn European Gr R1 EUR
JPM America Equity A (dist) USD HK S
JPM ASEAN Equity A (acc) SGD S
JPM Europe Equity A (acc) USD HK S
JPM Europe Small Cap A (dist) EUR HK S
JPM Europe Small Cap A (dist) GBP S
JPMorgan ASEAN (acc) - USD HK S ~
JPMorgan Pacific Sec (acc) - USD HK ~ Jupiter European Growth L EUR Acc HK S
Jupiter European Growth L GBP A Inc HK S
Value Partners Hi-Div Stks A1 Inc HK
Equity Single Country
BGF United Kingdom A2 HK S
Fidelity Funds - Australia Fund A HK S
Fidelity Funds - UK Fund A HK S
Fidelity Singapore A-Dis-SGD S
Franklin US Opportunities A(acc)USD HK S
FTIF Franklin Mutual US Val A(acc)EUR HK S
FTIF Franklin Mutual US Val A(acc)USD HK S
JPM Singapore A (acc) SGD S ~
JPM Singapore A (dist) USD HK S ~ Threadneedle Amer Smlr Coms Rtl Acc GBP
S
Threadneedle Amer Smlr Coms Rtl Acc USD
S
Property
Fidelity Funds - Global Property A HK S
MS INVF Asian Property A HK S
MS INVF European Property A HK S LU0078113650 01/09/1997 36.44 EUR 6.78 -1.64 9.07 12.37 45.80 6.38 3.61 6.55 7.24 62.32 7.81 4.51 7.31 33.86 67.49 30/06/2018
CAG% - Compound Annual Growth Percentage since Launch DatePast performance is not indicative of future performance. Investors and/or their investment advisers are responsible for their investment decisions and any choice of Investments is entirely at their own risk. Please note that investment performance may go down as well as up.
© 2018 Morningstar. All Rights Reserved. The information, data, analyses and opinions (“Information”) contained herein: (1) include the proprietary information of Morningstar and Morningstar’s third party licensors; (2) may not be copied or redistributed except as specifically authorised;(3) do not constitute investment advice;(4) are providedsolely for informational purposes; (5) are not warranted to be complete, accurate or timely; and (6) may be drawn from fund data published on various dates. Morningstar is not responsible for any trading decisions, damages or other losses related to the Information or its use. Please verify all of the Information before using it and don’t make anyinvestment decision except upon the advice of a professional financial adviser. Past performance is no guarantee of future results. The value and income derived from investments may go down as well as up.
ß®
Data as at 10 Jul 2018
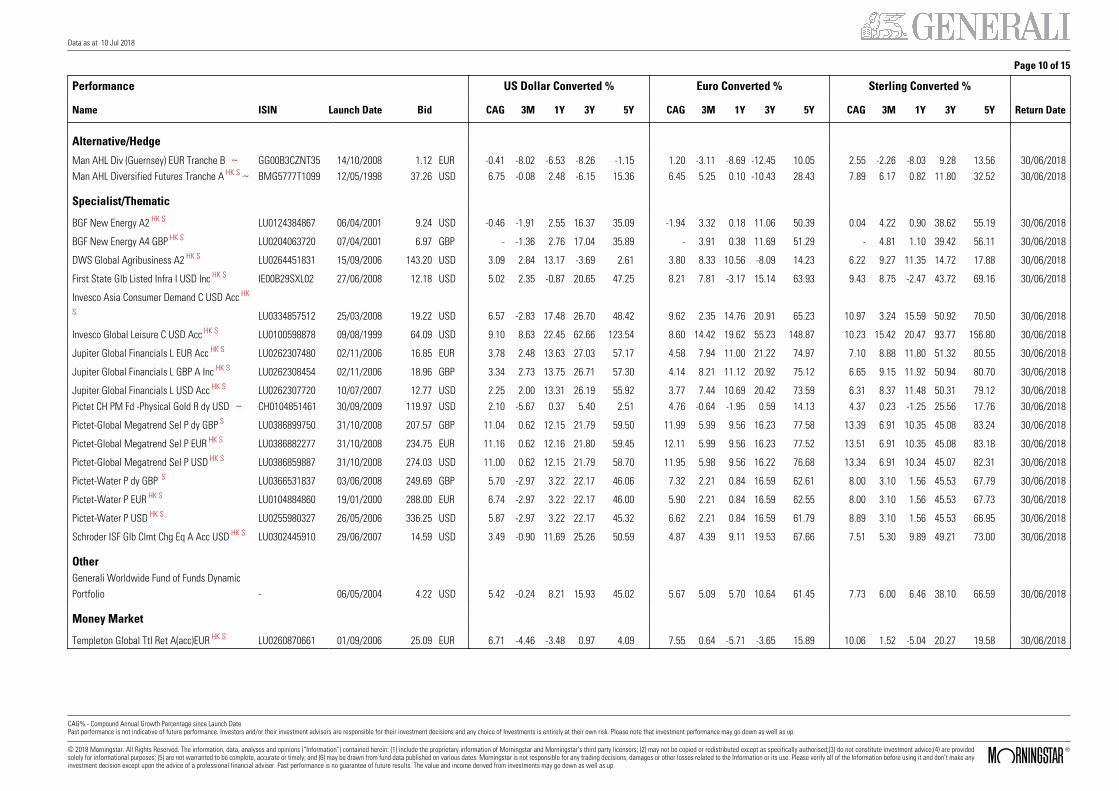
Page 10 of 15
Performance US Dollar Converted % Euro Converted % Sterling Converted %
Name ISIN Launch Date Bid CAG 3M 1Y 3Y 5Y CAG 3M 1Y 3Y 5Y CAG 3M 1Y 3Y 5Y Return Date
Alternative/Hedge Man AHL Div (Guernsey) EUR Tranche B ~ GG00B3CZNT35 14/10/2008 1.12 EUR -0.41 -8.02 -6.53 -8.26 -1.15 1.20 -3.11 -8.69 -12.45 10.05 2.55 -2.26 -8.03 9.28 13.56 30/06/2018Man AHL Diversified Futures Tranche A HK S ~ BMG5777T1099 12/05/1998 37.26 USD 6.75 -0.08 2.48 -6.15 15.36 6.45 5.25 0.10 -10.43 28.43 7.89 6.17 0.82 11.80 32.52 30/06/2018
Specialist/Thematic
BGF New Energy A2 HK S LU0124384867 06/04/2001 9.24 USD -0.46 -1.91 2.55 16.37 35.09 -1.94 3.32 0.18 11.06 50.39 0.04 4.22 0.90 38.62 55.19 30/06/2018
BGF New Energy A4 GBP HK S LU0204063720 07/04/2001 6.97 GBP - -1.36 2.76 17.04 35.89 - 3.91 0.38 11.69 51.29 - 4.81 1.10 39.42 56.11 30/06/2018
DWS Global Agribusiness A2 HK S LU0264451831 15/09/2006 143.20 USD 3.09 2.84 13.17 -3.69 2.61 3.80 8.33 10.56 -8.09 14.23 6.22 9.27 11.35 14.72 17.88 30/06/2018
First State Glb Listed Infra I USD Inc HK S IE00B29SXL02 27/06/2008 12.18 USD 5.02 2.35 -0.87 20.65 47.25 8.21 7.81 -3.17 15.14 63.93 9.43 8.75 -2.47 43.72 69.16 30/06/2018
Invesco Asia Consumer Demand C USD Acc HK
S LU0334857512 25/03/2008 19.22 USD 6.57 -2.83 17.48 26.70 48.42 9.62 2.35 14.76 20.91 65.23 10.97 3.24 15.59 50.92 70.50 30/06/2018
Invesco Global Leisure C USD Acc HK S LU0100598878 09/08/1999 64.09 USD 9.10 8.63 22.45 62.66 123.54 8.60 14.42 19.62 55.23 148.87 10.23 15.42 20.47 93.77 156.80 30/06/2018
Jupiter Global Financials L EUR Acc HK S LU0262307480 02/11/2006 16.85 EUR 3.78 2.48 13.63 27.03 57.17 4.58 7.94 11.00 21.22 74.97 7.10 8.88 11.80 51.32 80.55 30/06/2018
Jupiter Global Financials L GBP A Inc HK S LU0262308454 02/11/2006 18.96 GBP 3.34 2.73 13.75 26.71 57.30 4.14 8.21 11.12 20.92 75.12 6.65 9.15 11.92 50.94 80.70 30/06/2018
Jupiter Global Financials L USD Acc HK S LU0262307720 10/07/2007 12.77 USD 2.25 2.00 13.31 26.19 55.92 3.77 7.44 10.69 20.42 73.59 6.31 8.37 11.48 50.31 79.12 30/06/2018Pictet CH PM Fd -Physical Gold R dy USD ~ CH0104851461 30/09/2009 119.97 USD 2.10 -5.67 0.37 5.40 2.51 4.76 -0.64 -1.95 0.59 14.13 4.37 0.23 -1.25 25.56 17.76 30/06/2018
LU0386899750 31/10/2008 207.57 GBP 11.04 0.62 12.15 21.79 59.50 11.99 5.99 9.56 16.23 77.58 13.39 6.91 10.35 45.08 83.24 30/06/2018
LU0386882277 31/10/2008 234.75 EUR 11.16 0.62 12.16 21.80 59.45 12.11 5.99 9.56 16.23 77.52 13.51 6.91 10.35 45.08 83.18 30/06/2018
LU0386859887 31/10/2008 274.03 USD 11.00 0.62 12.15 21.79 58.70 11.95 5.98 9.56 16.22 76.68 13.34 6.91 10.34 45.07 82.31 30/06/2018
LU0366531837 03/06/2008 249.69 GBP 5.70 -2.97 3.22 22.17 46.06 7.32 2.21 0.84 16.59 62.61 8.00 3.10 1.56 45.53 67.79 30/06/2018
LU0104884860 19/01/2000 288.00 EUR 6.74 -2.97 3.22 22.17 46.00 5.90 2.21 0.84 16.59 62.55 8.00 3.10 1.56 45.53 67.73 30/06/2018
Pictet-Global Megatrend Sel P dy GBP S
Pictet-Global Megatrend Sel P EUR HK S
Pictet-Global Megatrend Sel P USD HK S
Pictet-Water P dy GBP S
Pictet-Water P EUR HK S
Pictet-Water P USD HK S LU0255980327 26/05/2006 336.25 USD 5.87 -2.97 3.22 22.17 45.32 6.62 2.21 0.84 16.59 61.79 8.89 3.10 1.56 45.53 66.95 30/06/2018
Schroder ISF Glb Clmt Chg Eq A Acc USD HK S LU0302445910 29/06/2007 14.59 USD 3.49 -0.90 11.69 25.26 50.59 4.87 4.39 9.11 19.53 67.66 7.51 5.30 9.89 49.21 73.00 30/06/2018
OtherGenerali Worldwide Fund of Funds DynamicPortfolio - 06/05/2004 4.22 USD 5.42 -0.24 8.21 15.93 45.02 5.67 5.09 5.70 10.64 61.45 7.73 6.00 6.46 38.10 66.59 30/06/2018
Money Market
Templeton Global Ttl Ret A(acc)EUR HK S LU0260870661 01/09/2006 25.09 EUR 6.71 -4.46 -3.48 0.97 4.09 7.55 0.64 -5.71 -3.65 15.89 10.06 1.52 -5.04 20.27 19.58 30/06/2018
CAG% - Compound Annual Growth Percentage since Launch DatePast performance is not indicative of future performance. Investors and/or their investment advisers are responsible for their investment decisions and any choice of Investments is entirely at their own risk. Please note that investment performance may go down as well as up.
© 2018 Morningstar. All Rights Reserved. The information, data, analyses and opinions (“Information”) contained herein: (1) include the proprietary information of Morningstar and Morningstar’s third party licensors; (2) may not be copied or redistributed except as specifically authorised;(3) do not constitute investment advice;(4) are providedsolely for informational purposes; (5) are not warranted to be complete, accurate or timely; and (6) may be drawn from fund data published on various dates. Morningstar is not responsible for any trading decisions, damages or other losses related to the Information or its use. Please verify all of the Information before using it and don’t make anyinvestment decision except upon the advice of a professional financial adviser. Past performance is no guarantee of future results. The value and income derived from investments may go down as well as up.
ß®
Data as at 10 Jul 2018
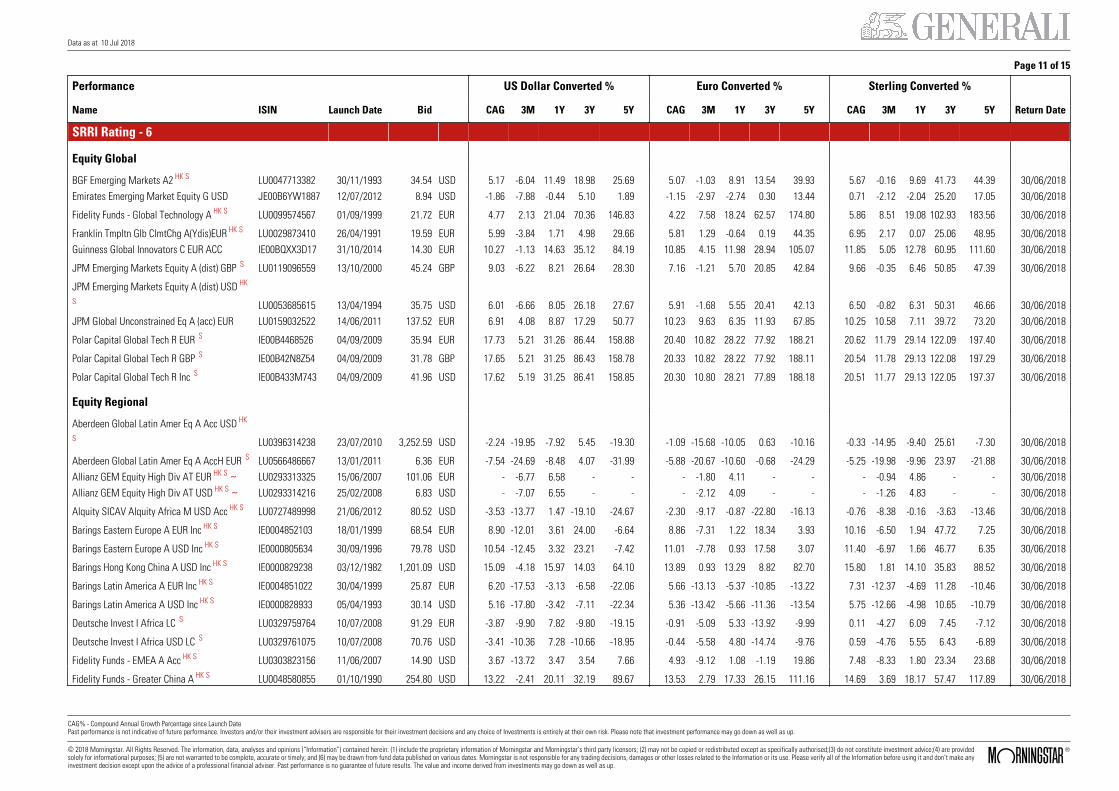
Page 11 of 15
Performance US Dollar Converted % Euro Converted % Sterling Converted %
Name ISIN Launch Date Bid CAG 3M 1Y 3Y 5Y CAG 3M 1Y 3Y 5Y CAG 3M 1Y 3Y 5Y Return Date
SRRI Rating - 6 Equity Global
BGF Emerging Markets A2 HK S LU0047713382 30/11/1993 34.54 USD 5.17 -6.04 11.49 18.98 25.69 5.07 -1.03 8.91 13.54 39.93 5.67 -0.16 9.69 41.73 44.39 30/06/2018Emirates Emerging Market Equity G USD JE00B6YW1887 12/07/2012 8.94 USD -1.86 -7.88 -0.44 5.10 1.89 -1.15 -2.97 -2.74 0.30 13.44 0.71 -2.12 -2.04 25.20 17.05 30/06/2018
Fidelity Funds - Global Technology A HK S LU0099574567 01/09/1999 21.72 EUR 4.77 2.13 21.04 70.36 146.83 4.22 7.58 18.24 62.57 174.80 5.86 8.51 19.08 102.93 183.56 30/06/2018
Franklin Tmpltn Glb ClmtChg A(Ydis)EUR HK S LU0029873410 26/04/1991 19.59 EUR 5.99 -3.84 1.71 4.98 29.66 5.81 1.29 -0.64 0.19 44.35 6.95 2.17 0.07 25.06 48.95 30/06/2018Guinness Global Innovators C EUR ACC IE00BQXX3D17 31/10/2014 14.30 EUR 10.27 -1.13 14.63 35.12 84.19 10.85 4.15 11.98 28.94 105.07 11.85 5.05 12.78 60.95 111.60 30/06/2018
JPM Emerging Markets Equity A (dist) GBP S LU0119096559 13/10/2000 45.24 GBP 9.03 -6.22 8.21 26.64 28.30 7.16 -1.21 5.70 20.85 42.84 9.66 -0.35 6.46 50.85 47.39 30/06/2018
JPM Emerging Markets Equity A (dist) USD HK
S LU0053685615 13/04/1994 35.75 USD 6.01 -6.66 8.05 26.18 27.67 5.91 -1.68 5.55 20.41 42.13 6.50 -0.82 6.31 50.31 46.66 30/06/2018JPM Global Unconstrained Eq A (acc) EUR LU0159032522 14/06/2011 137.52 EUR 6.91 4.08 8.87 17.29 50.77 10.23 9.63 6.35 11.93 67.85 10.25 10.58 7.11 39.72 73.20 30/06/2018
Polar Capital Global Tech R EUR S IE00B4468526 04/09/2009 35.94 EUR 17.73 5.21 31.26 86.44 158.88 20.40 10.82 28.22 77.92 188.21 20.62 11.79 29.14 122.09 197.40 30/06/2018
Polar Capital Global Tech R GBP S IE00B42N8Z54 04/09/2009 31.78 GBP 17.65 5.21 31.25 86.43 158.78 20.33 10.82 28.22 77.92 188.11 20.54 11.78 29.13 122.08 197.29 30/06/2018
Polar Capital Global Tech R Inc S IE00B433M743 04/09/2009 41.96 USD 17.62 5.19 31.25 86.41 158.85 20.30 10.80 28.21 77.89 188.18 20.51 11.77 29.13 122.05 197.37 30/06/2018 Equity Regional
Aberdeen Global Latin Amer Eq A Acc USD HK
S LU0396314238 23/07/2010 3,252.59 USD -2.24 -19.95 -7.92 5.45 -19.30 -1.09 -15.68 -10.05 0.63 -10.16 -0.33 -14.95 -9.40 25.61 -7.30 30/06/2018
Aberdeen Global Latin Amer Eq A AccH EUR S LU0566486667 13/01/2011 6.36 EUR -7.54 -24.69 -8.48 4.07 -31.99 -5.88 -20.67 -10.60 -0.68 -24.29 -5.25 -19.98 -9.96 23.97 -21.88 30/06/2018Allianz GEM Equity High Div AT EUR HK S ~ LU0293313325 15/06/2007 101.06 EUR - -6.77 6.58 - - - -1.80 4.11 - - - -0.94 4.86 - - 30/06/2018Allianz GEM Equity High Div AT USD HK S ~ LU0293314216 25/02/2008 6.83 USD - -7.07 6.55 - - - -2.12 4.09 - - - -1.26 4.83 - - 30/06/2018
Alquity SICAV Alquity Africa M USD Acc HK S LU0727489998 21/06/2012 80.52 USD -3.53 -13.77 1.47 -19.10 -24.67 -2.30 -9.17 -0.87 -22.80 -16.13 -0.76 -8.38 -0.16 -3.63 -13.46 30/06/2018
Barings Eastern Europe A EUR Inc HK S IE0004852103 18/01/1999 68.54 EUR 8.90 -12.01 3.61 24.00 -6.64 8.86 -7.31 1.22 18.34 3.93 10.16 -6.50 1.94 47.72 7.25 30/06/2018
Barings Eastern Europe A USD Inc HK S IE0000805634 30/09/1996 79.78 USD 10.54 -12.45 3.32 23.21 -7.42 11.01 -7.78 0.93 17.58 3.07 11.40 -6.97 1.66 46.77 6.35 30/06/2018
Barings Hong Kong China A USD Inc HK S IE0000829238 03/12/1982 1,201.09 USD 15.09 -4.18 15.97 14.03 64.10 13.89 0.93 13.29 8.82 82.70 15.80 1.81 14.10 35.83 88.52 30/06/2018
Barings Latin America A EUR Inc HK S IE0004851022 30/04/1999 25.87 EUR 6.20 -17.53 -3.13 -6.58 -22.06 5.66 -13.13 -5.37 -10.85 -13.22 7.31 -12.37 -4.69 11.28 -10.46 30/06/2018
Barings Latin America A USD Inc HK S IE0000828933 05/04/1993 30.14 USD 5.16 -17.80 -3.42 -7.11 -22.34 5.36 -13.42 -5.66 -11.36 -13.54 5.75 -12.66 -4.98 10.65 -10.79 30/06/2018
Deutsche Invest I Africa LC S LU0329759764 10/07/2008 91.29 EUR -3.87 -9.90 7.82 -9.80 -19.15 -0.91 -5.09 5.33 -13.92 -9.99 0.11 -4.27 6.09 7.45 -7.12 30/06/2018
Deutsche Invest I Africa USD LC S LU0329761075 10/07/2008 70.76 USD -3.41 -10.36 7.28 -10.66 -18.95 -0.44 -5.58 4.80 -14.74 -9.76 0.59 -4.76 5.55 6.43 -6.89 30/06/2018
Fidelity Funds - EMEA A Acc HK S LU0303823156 11/06/2007 14.90 USD 3.67 -13.72 3.47 3.54 7.66 4.93 -9.12 1.08 -1.19 19.86 7.48 -8.33 1.80 23.34 23.68 30/06/2018
Fidelity Funds - Greater China A HK S LU0048580855 01/10/1990 254.80 USD 13.22 -2.41 20.11 32.19 89.67 13.53 2.79 17.33 26.15 111.16 14.69 3.69 18.17 57.47 117.89 30/06/2018
CAG% - Compound Annual Growth Percentage since Launch DatePast performance is not indicative of future performance. Investors and/or their investment advisers are responsible for their investment decisions and any choice of Investments is entirely at their own risk. Please note that investment performance may go down as well as up. © 2018 Morningstar. All Rights Reserved. The information, data, analyses and opinions (“Information”) contained herein: (1) include the proprietary information of Morningstar and Morningstar’s third party licensors; (2) may not be copied or redistributed except as specifically authorised;(3) do not constitute investment advice;(4) are providedsolely for informational purposes; (5) are not warranted to be complete, accurate or timely; and (6) may be drawn from fund data published on various dates. Morningstar is not responsible for any trading decisions, damages or other losses related to the Information or its use. Please verify all of the Information before using it and don’t make anyinvestment decision except upon the advice of a professional financial adviser. Past performance is no guarantee of future results. The value and income derived from investments may go down as well as up.
ß®
Data as at 10 Jul 2018
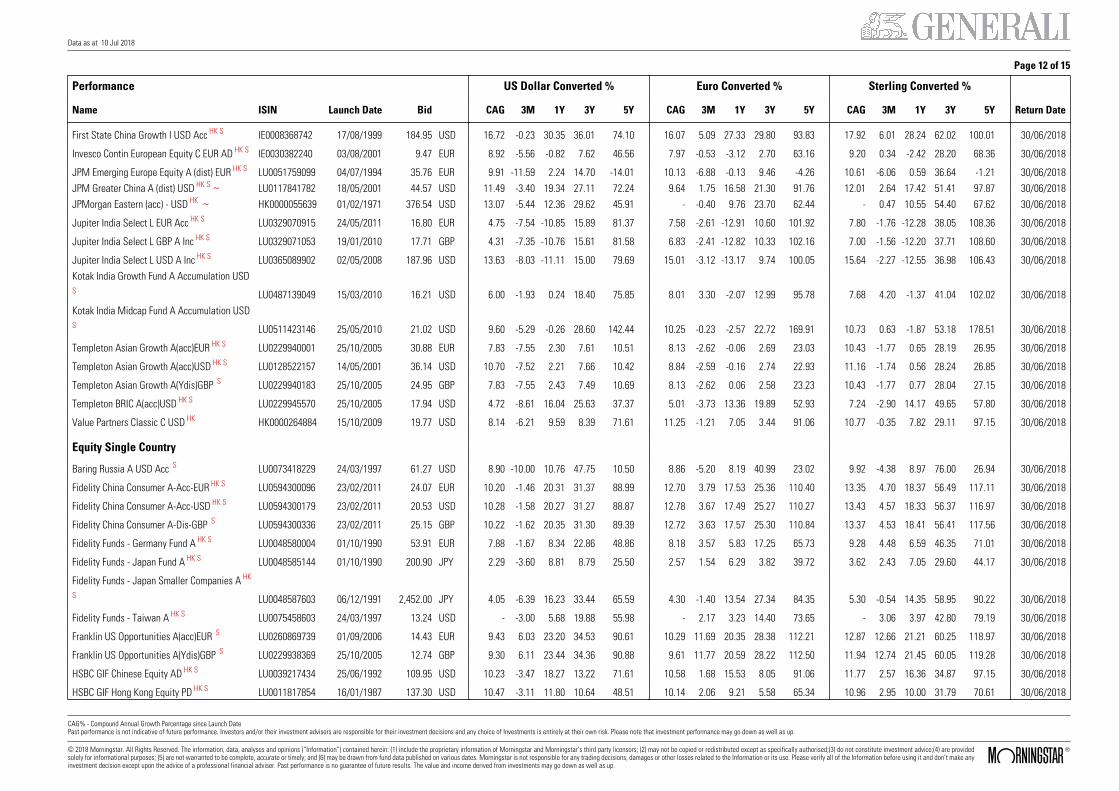
Page 12 of 15
Performance US Dollar Converted % Euro Converted % Sterling Converted %
Name ISIN Launch Date Bid CAG 3M 1Y 3Y 5Y CAG 3M 1Y 3Y 5Y CAG 3M 1Y 3Y 5Y Return Date
First State China Growth I USD Acc HK S IE0008368742 17/08/1999 184.95 USD 16.72 -0.23 30.35 36.01 74.10 16.07 5.09 27.33 29.80 93.83 17.92 6.01 28.24 62.02 100.01 30/06/2018
Invesco Contin European Equity C EUR AD HK S IE0030382240 03/08/2001 9.47 EUR 8.92 -5.56 -0.82 7.62 46.56 7.97 -0.53 -3.12 2.70 63.16 9.20 0.34 -2.42 28.20 68.36 30/06/2018
JPM Emerging Europe Equity A (dist) EUR HK S LU0051759099 04/07/1994 35.76 EUR 9.91 -11.59 2.24 14.70 -14.01 10.13 -6.88 -0.13 9.46 -4.26 10.61 -6.06 0.59 36.64 -1.21 30/06/2018JPM Greater China A (dist) USD HK S ~ LU0117841782 18/05/2001 44.57 USD 11.49 -3.40 19.34 27.11 72.24 9.64 1.75 16.58 21.30 91.76 12.01 2.64 17.42 51.41 97.87 30/06/2018JPMorgan Eastern (acc) - USD HK ~ HK0000055639 01/02/1971 376.54 USD 13.07 -5.44 12.36 29.62 45.91 - -0.40 9.76 23.70 62.44 - 0.47 10.55 54.40 67.62 30/06/2018
Jupiter India Select L EUR Acc HK S LU0329070915 24/05/2011 16.80 EUR 4.75 -7.54 -10.85 15.89 81.37 7.58 -2.61 -12.91 10.60 101.92 7.80 -1.76 -12.28 38.05 108.36 30/06/2018
Jupiter India Select L GBP A Inc HK S LU0329071053 19/01/2010 17.71 GBP 4.31 -7.35 -10.76 15.61 81.58 6.83 -2.41 -12.82 10.33 102.16 7.00 -1.56 -12.20 37.71 108.60 30/06/2018
Jupiter India Select L USD A Inc HK S LU0365089902 02/05/2008 187.96 USD 13.63 -8.03 -11.11 15.00 79.69 15.01 -3.12 -13.17 9.74 100.05 15.64 -2.27 -12.55 36.98 106.43 30/06/2018Kotak India Growth Fund A Accumulation USDS LU0487139049 15/03/2010 16.21 USD 6.00 -1.93 0.24 18.40 75.85 8.01 3.30 -2.07 12.99 95.78 7.68 4.20 -1.37 41.04 102.02 30/06/2018Kotak India Midcap Fund A Accumulation USDS LU0511423146 25/05/2010 21.02 USD 9.60 -5.29 -0.26 28.60 142.44 10.25 -0.23 -2.57 22.72 169.91 10.73 0.63 -1.87 53.18 178.51 30/06/2018
Templeton Asian Growth A(acc)EUR HK S LU0229940001 25/10/2005 30.88 EUR 7.83 -7.55 2.30 7.61 10.51 8.13 -2.62 -0.06 2.69 23.03 10.43 -1.77 0.65 28.19 26.95 30/06/2018
Templeton Asian Growth A(acc)USD HK S LU0128522157 14/05/2001 36.14 USD 10.70 -7.52 2.21 7.66 10.42 8.84 -2.59 -0.16 2.74 22.93 11.16 -1.74 0.56 28.24 26.85 30/06/2018
Templeton Asian Growth A(Ydis)GBP S LU0229940183 25/10/2005 24.95 GBP 7.83 -7.55 2.43 7.49 10.69 8.13 -2.62 0.06 2.58 23.23 10.43 -1.77 0.77 28.04 27.15 30/06/2018
Templeton BRIC A(acc)USD HK S LU0229945570 25/10/2005 17.94 USD 4.72 -8.61 16.04 25.63 37.37 5.01 -3.73 13.36 19.89 52.93 7.24 -2.90 14.17 49.65 57.80 30/06/2018
Value Partners Classic C USD HK HK0000264884 15/10/2009 19.77 USD 8.14 -6.21 9.59 8.39 71.61 11.25 -1.21 7.05 3.44 91.06 10.77 -0.35 7.82 29.11 97.15 30/06/2018 Equity Single Country
Baring Russia A USD Acc S LU0073418229 24/03/1997 61.27 USD 8.90 -10.00 10.76 47.75 10.50 8.86 -5.20 8.19 40.99 23.02 9.92 -4.38 8.97 76.00 26.94 30/06/2018
Fidelity China Consumer A-Acc-EUR HK S LU0594300096 23/02/2011 24.07 EUR 10.20 -1.46 20.31 31.37 88.99 12.70 3.79 17.53 25.36 110.40 13.35 4.70 18.37 56.49 117.11 30/06/2018
Fidelity China Consumer A-Acc-USD HK S LU0594300179 23/02/2011 20.53 USD 10.28 -1.58 20.27 31.27 88.87 12.78 3.67 17.49 25.27 110.27 13.43 4.57 18.33 56.37 116.97 30/06/2018
Fidelity China Consumer A-Dis-GBP S LU0594300336 23/02/2011 25.15 GBP 10.22 -1.62 20.35 31.30 89.39 12.72 3.63 17.57 25.30 110.84 13.37 4.53 18.41 56.41 117.56 30/06/2018
Fidelity Funds - Germany Fund A HK S LU0048580004 01/10/1990 53.91 EUR 7.88 -1.67 8.34 22.86 48.86 8.18 3.57 5.83 17.25 65.73 9.28 4.48 6.59 46.35 71.01 30/06/2018
Fidelity Funds - Japan Fund A HK S LU0048585144 01/10/1990 200.90 JPY 2.29 -3.60 8.81 8.79 25.50 2.57 1.54 6.29 3.82 39.72 3.62 2.43 7.05 29.60 44.17 30/06/2018
Fidelity Funds - Japan Smaller Companies A HK
S LU0048587603 06/12/1991 2,452.00 JPY 4.05 -6.39 16.23 33.44 65.59 4.30 -1.40 13.54 27.34 84.35 5.30 -0.54 14.35 58.95 90.22 30/06/2018
Fidelity Funds - Taiwan A HK S LU0075458603 24/03/1997 13.24 USD - -3.00 5.68 19.88 55.98 - 2.17 3.23 14.40 73.65 - 3.06 3.97 42.80 79.19 30/06/2018
Franklin US Opportunities A(acc)EUR S LU0260869739 01/09/2006 14.43 EUR 9.43 6.03 23.20 34.53 90.61 10.29 11.69 20.35 28.38 112.21 12.87 12.66 21.21 60.25 118.97 30/06/2018
Franklin US Opportunities A(Ydis)GBP S LU0229938369 25/10/2005 12.74 GBP 9.30 6.11 23.44 34.36 90.88 9.61 11.77 20.59 28.22 112.50 11.94 12.74 21.45 60.05 119.28 30/06/2018
HSBC GIF Chinese Equity AD HK S LU0039217434 25/06/1992 109.95 USD 10.23 -3.47 18.27 13.22 71.61 10.58 1.68 15.53 8.05 91.06 11.77 2.57 16.36 34.87 97.15 30/06/2018
HSBC GIF Hong Kong Equity PD HK S LU0011817854 16/01/1987 137.30 USD 10.47 -3.11 11.80 10.64 48.51 10.14 2.06 9.21 5.58 65.34 10.96 2.95 10.00 31.79 70.61 30/06/2018
CAG% - Compound Annual Growth Percentage since Launch DatePast performance is not indicative of future performance. Investors and/or their investment advisers are responsible for their investment decisions and any choice of Investments is entirely at their own risk. Please note that investment performance may go down as well as up. © 2018 Morningstar. All Rights Reserved. The information, data, analyses and opinions (“Information”) contained herein: (1) include the proprietary information of Morningstar and Morningstar’s third party licensors; (2) may not be copied or redistributed except as specifically authorised;(3) do not constitute investment advice;(4) are providedsolely for informational purposes; (5) are not warranted to be complete, accurate or timely; and (6) may be drawn from fund data published on various dates. Morningstar is not responsible for any trading decisions, damages or other losses related to the Information or its use. Please verify all of the Information before using it and don’t make anyinvestment decision except upon the advice of a professional financial adviser. Past performance is no guarantee of future results. The value and income derived from investments may go down as well as up.
ß®
Data as at 10 Jul 2018
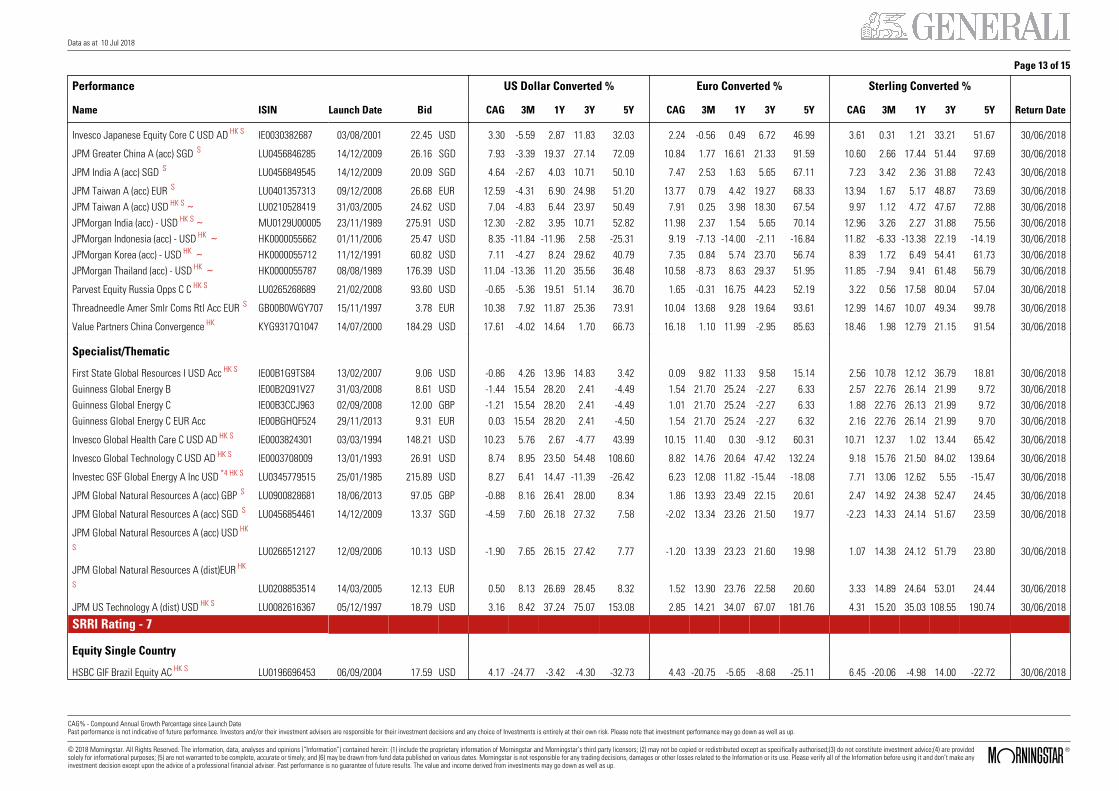
Page 13 of 15
Performance US Dollar Converted % Euro Converted % Sterling Converted %
Name ISIN Launch Date Bid CAG 3M 1Y 3Y 5Y CAG 3M 1Y 3Y 5Y CAG 3M 1Y 3Y 5Y Return Date
Invesco Japanese Equity Core C USD AD HK S IE0030382687 03/08/2001 22.45 USD 3.30 -5.59 2.87 11.83 32.03 2.24 -0.56 0.49 6.72 46.99 3.61 0.31 1.21 33.21 51.67 30/06/2018
JPM Greater China A (acc) SGD S LU0456846285 14/12/2009 26.16 SGD 7.93 -3.39 19.37 27.14 72.09 10.84 1.77 16.61 21.33 91.59 10.60 2.66 17.44 51.44 97.69 30/06/2018
JPM India A (acc) SGD S LU0456849545 14/12/2009 20.09 SGD 4.64 -2.67 4.03 10.71 50.10 7.47 2.53 1.63 5.65 67.11 7.23 3.42 2.36 31.88 72.43 30/06/2018
JPM Taiwan A (acc) EUR S LU0401357313 09/12/2008 26.68 EUR 12.59 -4.31 6.90 24.98 51.20 13.77 0.79 4.42 19.27 68.33 13.94 1.67 5.17 48.87 73.69 30/06/2018JPM Taiwan A (acc) USD HK S ~ LU0210528419 31/03/2005 24.62 USD 7.04 -4.83 6.44 23.97 50.49 7.91 0.25 3.98 18.30 67.54 9.97 1.12 4.72 47.67 72.88 30/06/2018JPMorgan India (acc) - USD HK S ~ MU0129U00005 23/11/1989 275.91 USD 12.30 -2.82 3.95 10.71 52.82 11.98 2.37 1.54 5.65 70.14 12.96 3.26 2.27 31.88 75.56 30/06/2018JPMorgan Indonesia (acc) - USD HK ~ HK0000055662 01/11/2006 25.47 USD 8.35 -11.84 -11.96 2.58 -25.31 9.19 -7.13 -14.00 -2.11 -16.84 11.82 -6.33 -13.38 22.19 -14.19 30/06/2018JPMorgan Korea (acc) - USD HK ~ HK0000055712 11/12/1991 60.82 USD 7.11 -4.27 8.24 29.62 40.79 7.35 0.84 5.74 23.70 56.74 8.39 1.72 6.49 54.41 61.73 30/06/2018JPMorgan Thailand (acc) - USD HK ~ HK0000055787 08/08/1989 176.39 USD 11.04 -13.36 11.20 35.56 36.48 10.58 -8.73 8.63 29.37 51.95 11.85 -7.94 9.41 61.48 56.79 30/06/2018
Parvest Equity Russia Opps C C HK S LU0265268689 21/02/2008 93.60 USD -0.65 -5.36 19.51 51.14 36.70 1.65 -0.31 16.75 44.23 52.19 3.22 0.56 17.58 80.04 57.04 30/06/2018
Threadneedle Amer Smlr Coms Rtl Acc EUR S GB00B0WGY707 15/11/1997 3.78 EUR 10.38 7.92 11.87 25.36 73.91 10.04 13.68 9.28 19.64 93.61 12.99 14.67 10.07 49.34 99.78 30/06/2018
Value Partners China Convergence HK KYG9317Q1047 14/07/2000 184.29 USD 17.61 -4.02 14.64 1.70 66.73 16.18 1.10 11.99 -2.95 85.63 18.46 1.98 12.79 21.15 91.54 30/06/2018
Specialist/Thematic
First State Global Resources I USD Acc HK S IE00B1G9TS84 13/02/2007 9.06 USD -0.86 4.26 13.96 14.83 3.42 0.09 9.82 11.33 9.58 15.14 2.56 10.78 12.12 36.79 18.81 30/06/2018Guinness Global Energy B IE00B2Q91V27 31/03/2008 8.61 USD -1.44 15.54 28.20 2.41 -4.49 1.54 21.70 25.24 -2.27 6.33 2.57 22.76 26.14 21.99 9.72 30/06/2018Guinness Global Energy C IE00B3CCJ963 02/09/2008 12.00 GBP -1.21 15.54 28.20 2.41 -4.49 1.01 21.70 25.24 -2.27 6.33 1.88 22.76 26.13 21.99 9.72 30/06/2018Guinness Global Energy C EUR Acc IE00BGHQF524 29/11/2013 9.31 EUR 0.03 15.54 28.20 2.41 -4.50 1.54 21.70 25.24 -2.27 6.32 2.16 22.76 26.14 21.99 9.70 30/06/2018
Invesco Global Health Care C USD AD HK S IE0003824301 03/03/1994 148.21 USD 10.23 5.76 2.67 -4.77 43.99 10.15 11.40 0.30 -9.12 60.31 10.71 12.37 1.02 13.44 65.42 30/06/2018
Invesco Global Technology C USD AD HK S IE0003708009 13/01/1993 26.91 USD 8.74 8.95 23.50 54.48 108.60 8.82 14.76 20.64 47.42 132.24 9.18 15.76 21.50 84.02 139.64 30/06/2018
Investec GSF Global Energy A Inc USD *4 HK S LU0345779515 25/01/1985 215.89 USD 8.27 6.41 14.47 -11.39 -26.42 6.23 12.08 11.82 -15.44 -18.08 7.71 13.06 12.62 5.55 -15.47 30/06/2018
JPM Global Natural Resources A (acc) GBP S LU0900828681 18/06/2013 97.05 GBP -0.88 8.16 26.41 28.00 8.34 1.86 13.93 23.49 22.15 20.61 2.47 14.92 24.38 52.47 24.45 30/06/2018
JPM Global Natural Resources A (acc) SGD S LU0456854461 14/12/2009 13.37 SGD -4.59 7.60 26.18 27.32 7.58 -2.02 13.34 23.26 21.50 19.77 -2.23 14.33 24.14 51.67 23.59 30/06/2018
JPM Global Natural Resources A (acc) USD HK
S LU0266512127 12/09/2006 10.13 USD -1.90 7.65 26.15 27.42 7.77 -1.20 13.39 23.23 21.60 19.98 1.07 14.38 24.12 51.79 23.80 30/06/2018
JPM Global Natural Resources A (dist)EUR HK
S LU0208853514 14/03/2005 12.13 EUR 0.50 8.13 26.69 28.45 8.32 1.52 13.90 23.76 22.58 20.60 3.33 14.89 24.64 53.01 24.44 30/06/2018
JPM US Technology A (dist) USD HK S LU0082616367 05/12/1997 18.79 USD 3.16 8.42 37.24 75.07 153.08 2.85 14.21 34.07 67.07 181.76 4.31 15.20 35.03 108.55 190.74 30/06/2018
SRRI Rating - 7
Equity Single Country
HSBC GIF Brazil Equity AC HK S LU0196696453 06/09/2004 17.59 USD 4.17 -24.77 -3.42 -4.30 -32.73 4.43 -20.75 -5.65 -8.68 -25.11 6.45 -20.06 -4.98 14.00 -22.72 30/06/2018
CAG% - Compound Annual Growth Percentage since Launch DatePast performance is not indicative of future performance. Investors and/or their investment advisers are responsible for their investment decisions and any choice of Investments is entirely at their own risk. Please note that investment performance may go down as well as up.
© 2018 Morningstar. All Rights Reserved. The information, data, analyses and opinions (“Information”) contained herein: (1) include the proprietary information of Morningstar and Morningstar’s third party licensors; (2) may not be copied or redistributed except as specifically authorised;(3) do not constitute investment advice;(4) are providedsolely for informational purposes; (5) are not warranted to be complete, accurate or timely; and (6) may be drawn from fund data published on various dates. Morningstar is not responsible for any trading decisions, damages or other losses related to the Information or its use. Please verify all of the Information before using it and don’t make anyinvestment decision except upon the advice of a professional financial adviser. Past performance is no guarantee of future results. The value and income derived from investments may go down as well as up.
ß®
Data as at 10 Jul 2018
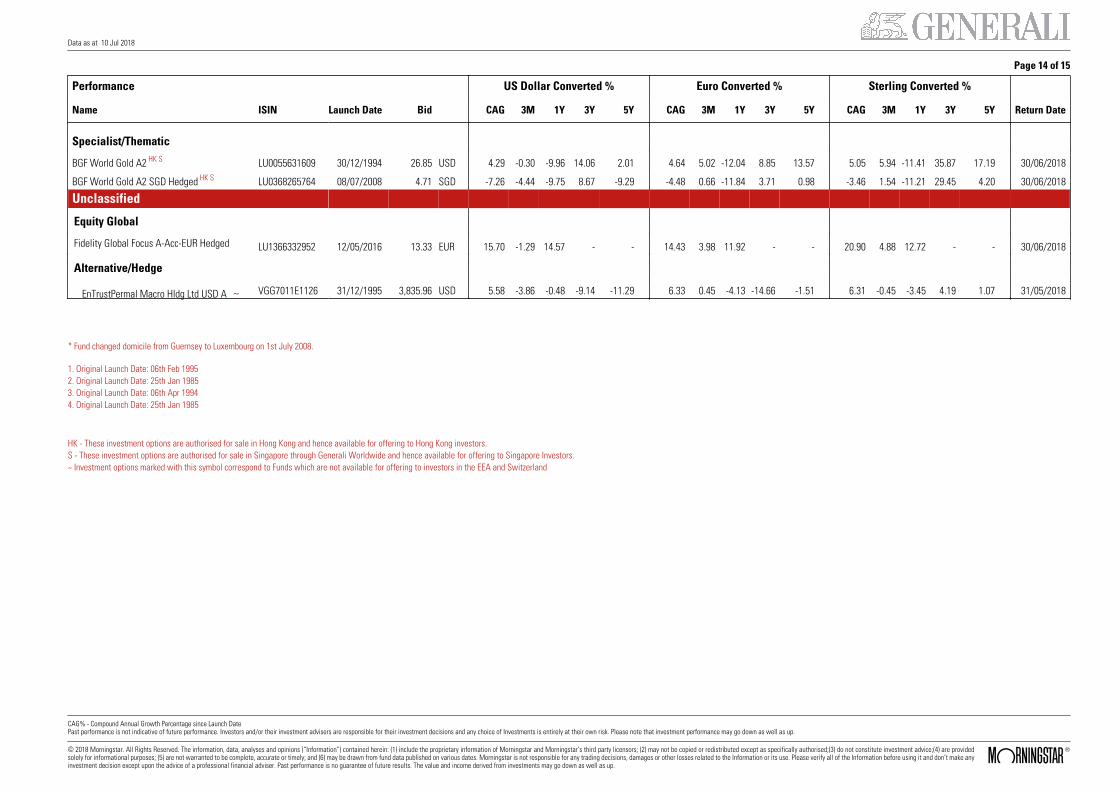
Page 14 of 15
Performance US Dollar Converted % Euro Converted % Sterling Converted %
Name ISIN Launch Date Bid CAG 3M 1Y 3Y 5Y CAG 3M 1Y 3Y 5Y CAG 3M 1Y 3Y 5Y Return Date
Specialist/Thematic
BGF World Gold A2 HK S LU0055631609 30/12/1994 26.85 USD 4.29 -0.30 -9.96 14.06 2.01 4.64 5.02 -12.04 8.85 13.57 5.05 5.94 -11.41 35.87 17.19 30/06/2018
BGF World Gold A2 SGD Hedged HK S LU0368265764 08/07/2008 4.71 SGD -7.26 -4.44 -9.75 8.67 -9.29 -4.48 0.66 -11.84 3.71 0.98 -3.46 1.54 -11.21 29.45 4.20 30/06/2018
Unclassified
LU1366332952 12/05/2016 13.33 EUR 15.70 -1.29 14.57 - - 14.43 3.98 11.92 - - 20.90 4.88 12.72 - - 30/06/2018
Equity Global
Fidelity Global Focus A-Acc-EUR Hedged
Alternative/Hedge EnTrustPermal Macro Hldg Ltd USD A ~ VGG7011E1126 31/12/1995 3,835.96 USD 5.58 -3.86 -0.48 -9.14 -11.29 6.33 0.45 -4.13 -14.66 -1.51 6.31 -0.45 -3.45 4.19 1.07 31/05/2018
* Fund changed domicile from Guernsey to Luxembourg on 1st July 2008.
1. Original Launch Date: 06th Feb 19952. Original Launch Date: 25th Jan 19853. Original Launch Date: 06th Apr 19944. Original Launch Date: 25th Jan 1985
HK - These investment options are authorised for sale in Hong Kong and hence available for offering to Hong Kong investors.S - These investment options are authorised for sale in Singapore through Generali Worldwide and hence available for offering to Singapore Investors.~ Investment options marked with this symbol correspond to Funds which are not available for offering to investors in the EEA and Switzerland
CAG% - Compound Annual Growth Percentage since Launch DatePast performance is not indicative of future performance. Investors and/or their investment advisers are responsible for their investment decisions and any choice of Investments is entirely at their own risk. Please note that investment performance may go down as well as up.
© 2018 Morningstar. All Rights Reserved. The information, data, analyses and opinions (“Information”) contained herein: (1) include the proprietary information of Morningstar and Morningstar’s third party licensors; (2) may not be copied or redistributed except as specifically authorised;(3) do not constitute investment advice;(4) are providedsolely for informational purposes; (5) are not warranted to be complete, accurate or timely; and (6) may be drawn from fund data published on various dates. Morningstar is not responsible for any trading decisions, damages or other losses related to the Information or its use. Please verify all of the Information before using it and don’t make anyinvestment decision except upon the advice of a professional financial adviser. Past performance is no guarantee of future results. The value and income derived from investments may go down as well as up.
ß®
Registered Head Office address: Generali Worldwide Insurance Company Limited, Generali House, Hirzel Street, St Peter Port, Guernsey, Channel Islands GY1 4PA.Incorporated in Guernsey under Company Registration No. 27151.
T +44 (0) 1481 714 108 F +44 (0) 1481 712 424 [email protected]
generali-worldwide.com
Regulated in Guernsey as a licensed Insurer by the Guernsey Financial Services Commission under the Insurance Business (Bailiwick of Guernsey) Law, 2002 (as amended).Generali Worldwide Insurance Company Limited is part of the Generali Group, listed in the Italian Insurance Group Register under number 026.
Websites may make reference to products that are not authorised or regulated and/or are not available for offering to planholders in certain jurisdictions.
Please note that investment involves risks.The value of your investment is not guaranteed and can go down as well as up. JU
LY'1
8
Top Related