


Languages
Pages
Legal

American Association of Individual Investors
presents
Financial Planning Workshop
Fundamentals of Investing
Fred Smith
Email: [email protected]
Webcast details at www.siliconvalleyaaii.org
Financial Planning Workshops
>>> Fundamentals of Investing
• Building a Diversified Portfolio
• Introduction to Computerized Investing
• Active versus Passive Investment Strategies
• Retirement Planning
• Managing your Cash Flow in Retirement
• Safe Withdrawal Rates from your Retirement Portfolio
• Social Security and Medicare
• Estate Planning
2
Topics Covered Today
Your Personal Investor Profile, PIP
Measuring the return on investment
Sources of risk and its measurement
Techniques to control risk
Investment vehicles
3
Personal Investor Profile, PIP
First know thyself!
“If you don’t know who you really are,
the stock market is an expensive place to find
out”
Adam Smith (1723 – 1790)
4
PIP: Personal Data Age , marital status, spouse’s age
Employment, income
Retired or planned date to retire
Children, college education
Home ownership, mortgage paid off
Hopes and dreams
Fears, nightmares, etc.
5
PIP: Time Horizon
Short-term goals
New car
Vacation, etc. etc.
Long-term goals
College education
Home purchase
Retirement
Legacy, etc. etc.
6
PIP: Risk Tolerance
Eat well versus sleep well decision
Subjective choice
No right or wrong answer
Wrong choice can be disastrous
Most people overestimate their tolerance
Risk tolerance questionnaires
Schwab, Vanguard, Fidelity, etc.
7
PIP: Income Needs
Do you need to generate income
to cover daily expenses?
Or are you investing for capital gains?
8

PIP: Tax Status
Federal and State Income Tax Brackets
How much of your gains will you give up to taxes?
Or are your investments in tax-sheltered accounts?
Alternative Minimum Tax, AMT
Can affect even some “tax-free” gains
9
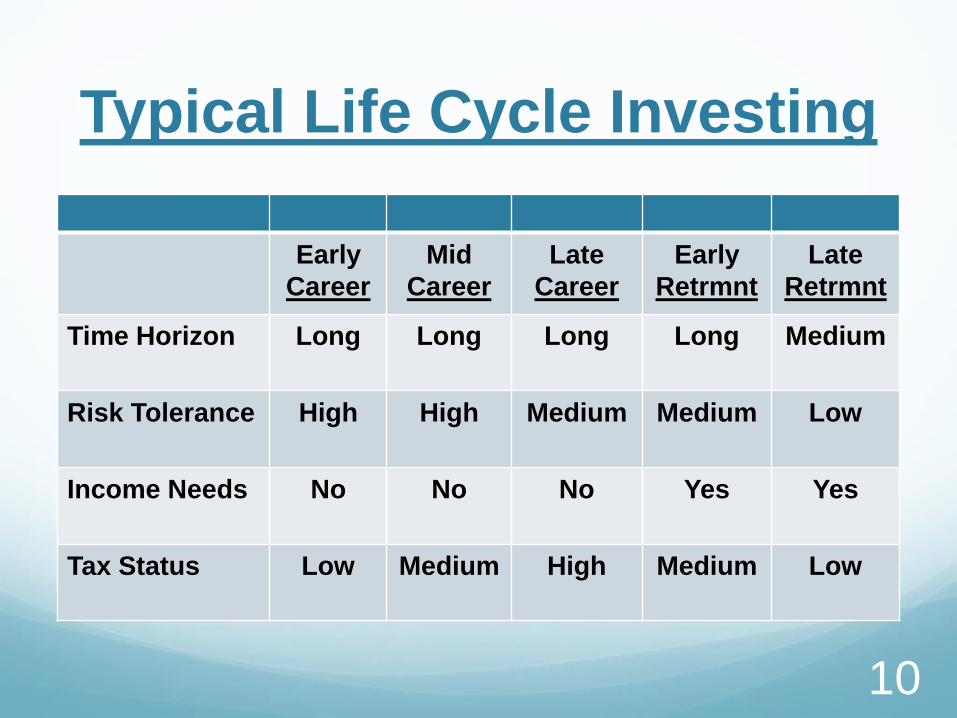
Typical Life Cycle Investing
Early
Career
Mid
Career
Late
Career
Early
Retrmnt
Late
Retrmnt
Time Horizon Long Long Long Long Medium
Risk Tolerance High High Medium Medium Low
Income Needs No No No Yes Yes
Tax Status Low Medium High Medium Low
10

Topics Covered Today
Your Personal Investor Profile, PIP
>>> Measuring the return on investment
Sources of risk and its measurement
Techniques to control risk
Investment vehicles
11
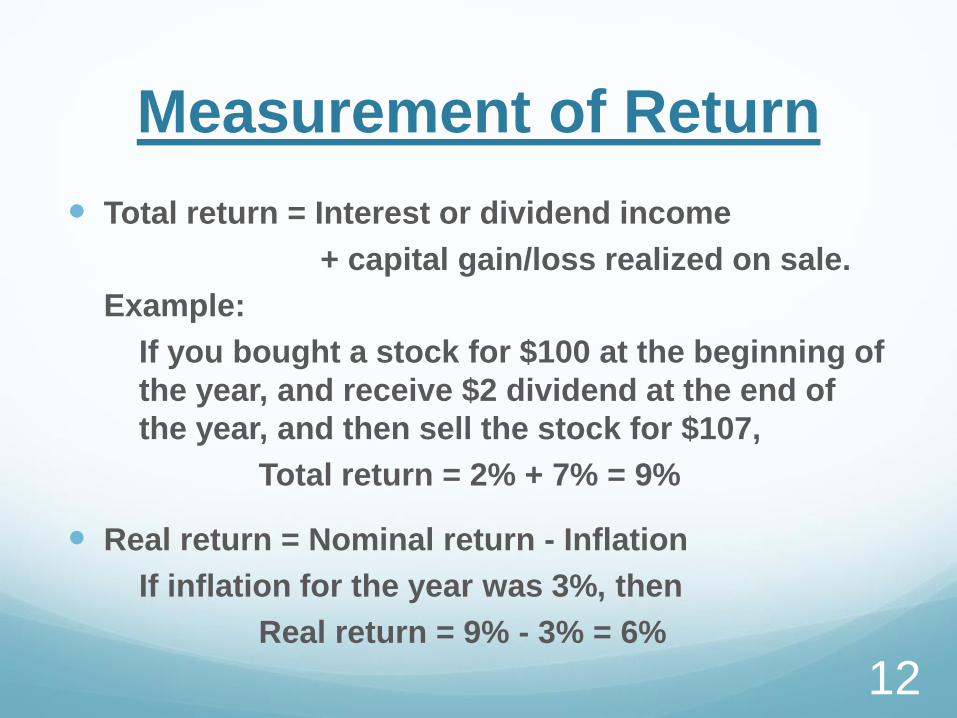
Measurement of Return
Total return = Interest or dividend income
+ capital gain/loss realized on sale.
Example:
If you bought a stock for $100 at the beginning of
the year, and receive $2 dividend at the end of
the year, and then sell the stock for $107,
Total return = 2% + 7% = 9%
Real return = Nominal return - Inflation
If inflation for the year was 3%, then
Real return = 9% - 3% = 6%
12

Time Value of Money
A $ in hand today is worth more than
the promise of a $ tomorrow
FV = PV x (1 + r)^n
or PV = FV / (1 + r)^n
where PV = Present value
FV = Future Value
r = Rate of return/period
n = Number of periods
13

Return over Multiple Years
Suppose you had an investment with total returns of 9%, -5%, and 14% over three consecutive years.
How well did you do over the three year period?
The arithmetic mean gives
(9% - 5% + 14%)/3 = 6% per annum
Good approximation for short time periods but it ignores compounding.
The geometric mean gives a more useful answer.
14

Geometric Mean Geometric mean
= {(1+9%) x (1-5%) x (1+14%)} ^ (1/3) - 1
= {1.09 x 0.95 x 1.14} ^ 0.333 - 1
= 1.18 ^ 0.333 - 1
= 1.0569 -1
= 5.69% per annum
This is the Compound Annual Growth Rate, CAGR
Also called the time-weighted return.
15
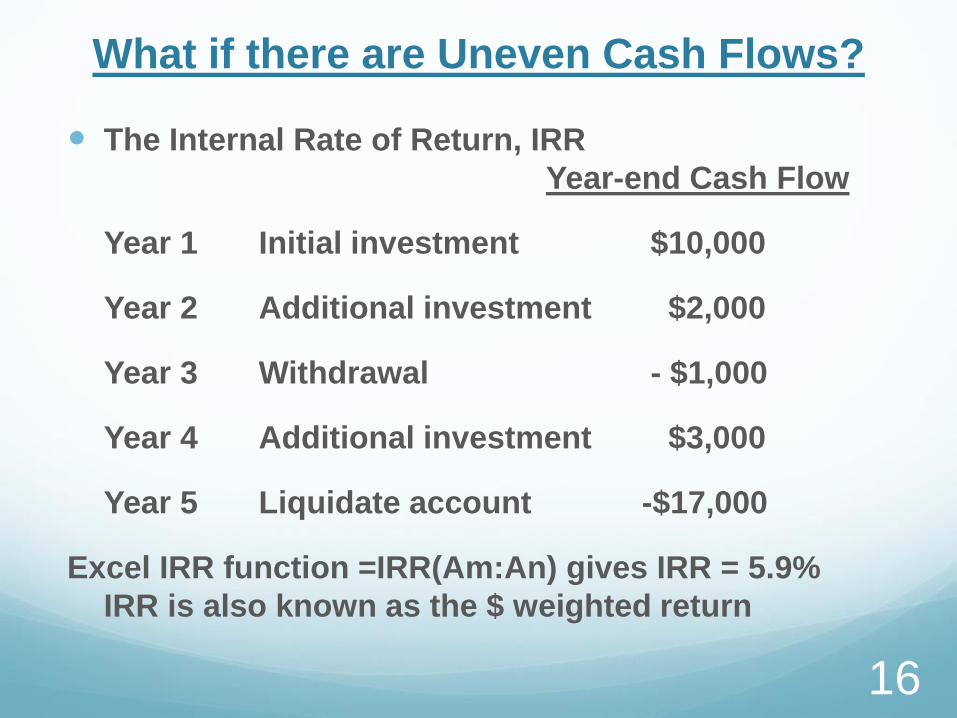
What if there are Uneven Cash Flows?
The Internal Rate of Return, IRR
Year-end Cash Flow
Year 1 Initial investment $10,000
Year 2 Additional investment $2,000
Year 3 Withdrawal - $1,000
Year 4 Additional investment $3,000
Year 5 Liquidate account -$17,000
Excel IRR function =IRR(Am:An) gives IRR = 5.9%
IRR is also known as the $ weighted return
16

A Quick Approximation
Suppose you invest $10,000 at the beginning of the year and $100 every month. If the account is worth $12,000 at the end of the year, what is your return?
Return ~ (FV – CF/2)/(PV + CF/2) -1 where CF = cash flow
= ($12,000 - $600) / ($10,000 + $600) - 1
= $11,400 / $10,600 – 1
=7.55% pa
IRR = 0.61% per month = 7.59% pa
17
Arithmetic Mean
versus Geometric Mean
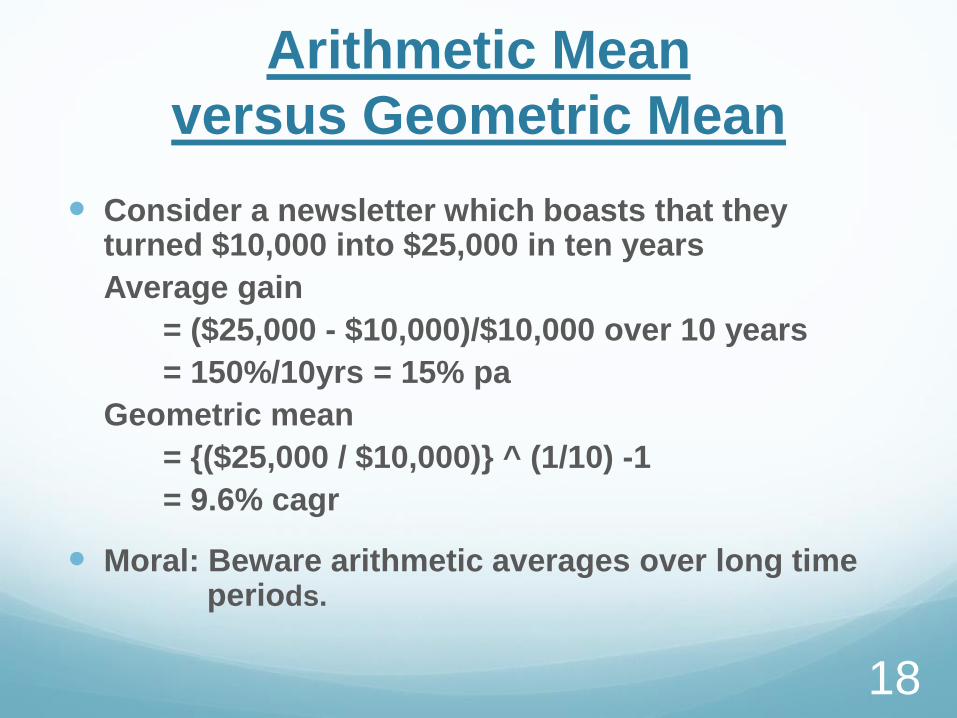
Consider a newsletter which boasts that they turned $10,000 into $25,000 in ten years
Average gain
= ($25,000 - $10,000)/$10,000 over 10 years
= 150%/10yrs = 15% pa
Geometric mean
= {($25,000 / $10,000)} ^ (1/10) -1
= 9.6% cagr
Moral: Beware arithmetic averages over long time periods.
18

Rule of 72
For an investment with an annual rate of return, r,
the number of years, n, required to double the
investment is given by:
n = 72/r
i.e. r x n = 72 approximately
For example, if r = 6% pa
the investment will double every 12 years
For additional credit
Derive this rule from first principles !
19
Topics Covered Today
Your Personal Investor Profile, PIP
Measuring the return on investment
>>> Sources of risk and its measurement
Techniques to control risk
Investment vehicles
20
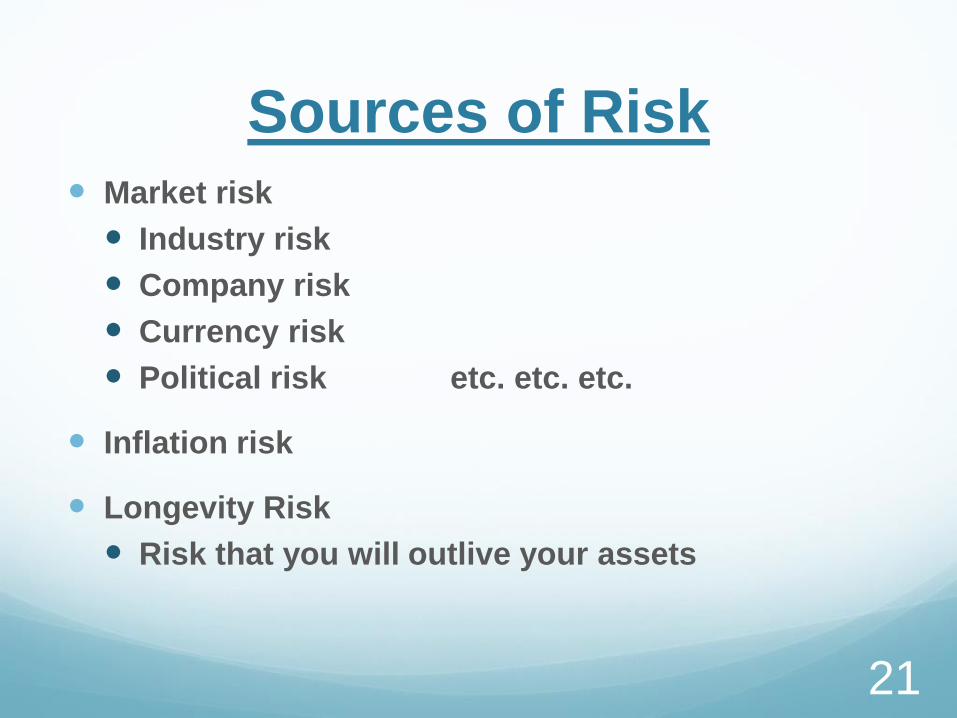
Sources of Risk Market risk
Industry risk
Company risk
Currency risk
Political risk etc. etc. etc.
Inflation risk
Longevity Risk
Risk that you will outlive your assets
21
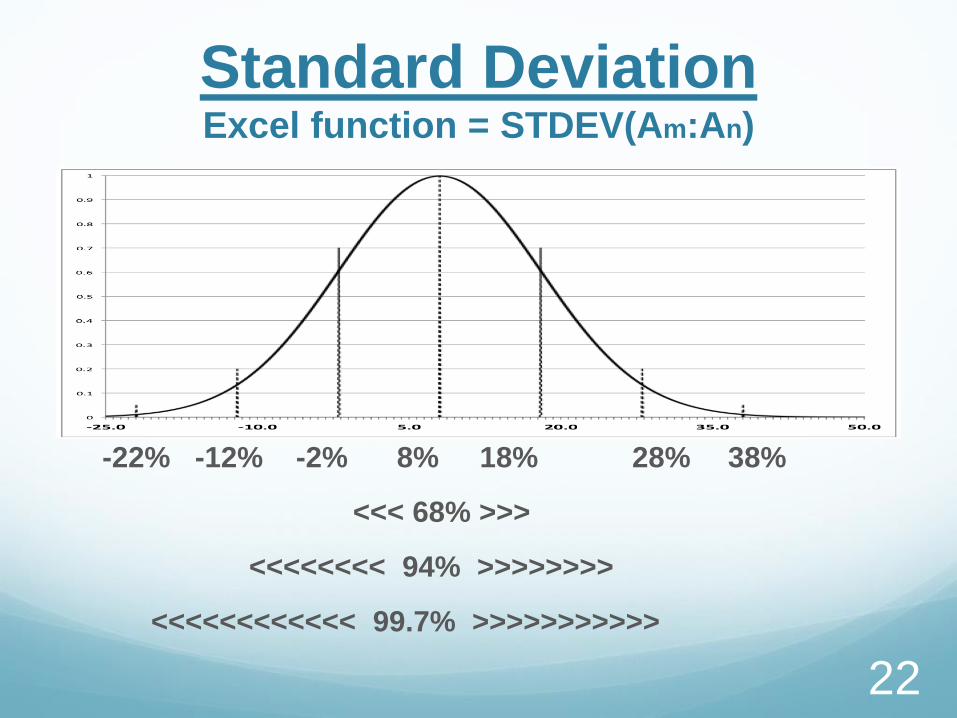
Standard DeviationExcel function = STDEV(Am:An)
-22% -12% -2% 8% 18% 28% 38%
<<< 68% >>>
<<<<<<<< 94% >>>>>>>>
<<<<<<<<<<<< 99.7% >>>>>>>>>>>
22
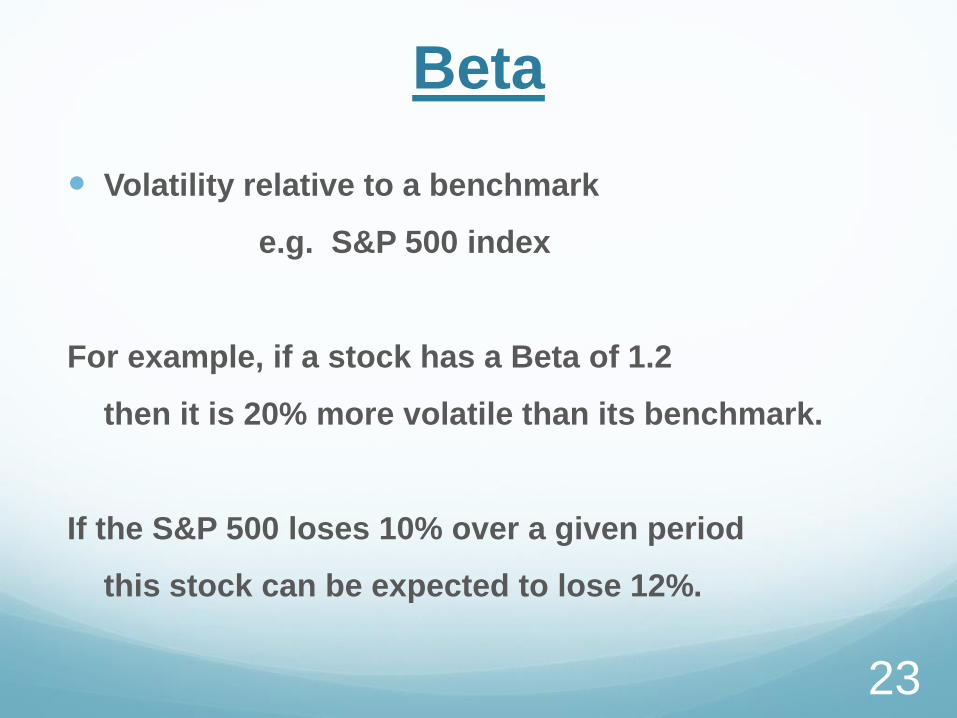
Beta
Volatility relative to a benchmark
e.g. S&P 500 index
For example, if a stock has a Beta of 1.2
then it is 20% more volatile than its benchmark.
If the S&P 500 loses 10% over a given period
this stock can be expected to lose 12%.
23
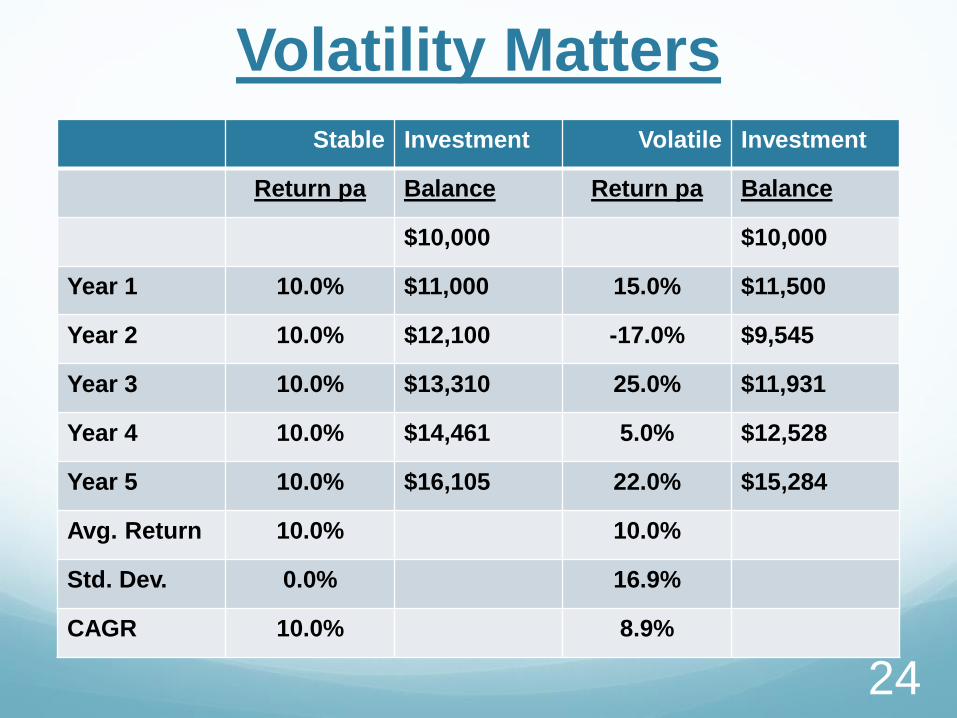
Volatility Matters
Stable Investment Volatile Investment
Return pa Balance Return pa Balance
$10,000 $10,000
Year 1 10.0% $11,000 15.0% $11,500
Year 2 10.0% $12,100 -17.0% $9,545
Year 3 10.0% $13,310 25.0% $11,931
Year 4 10.0% $14,461 5.0% $12,528
Year 5 10.0% $16,105 22.0% $15,284
Avg. Return 10.0% 10.0%
Std. Dev. 0.0% 16.9%
CAGR 10.0% 8.9%
24
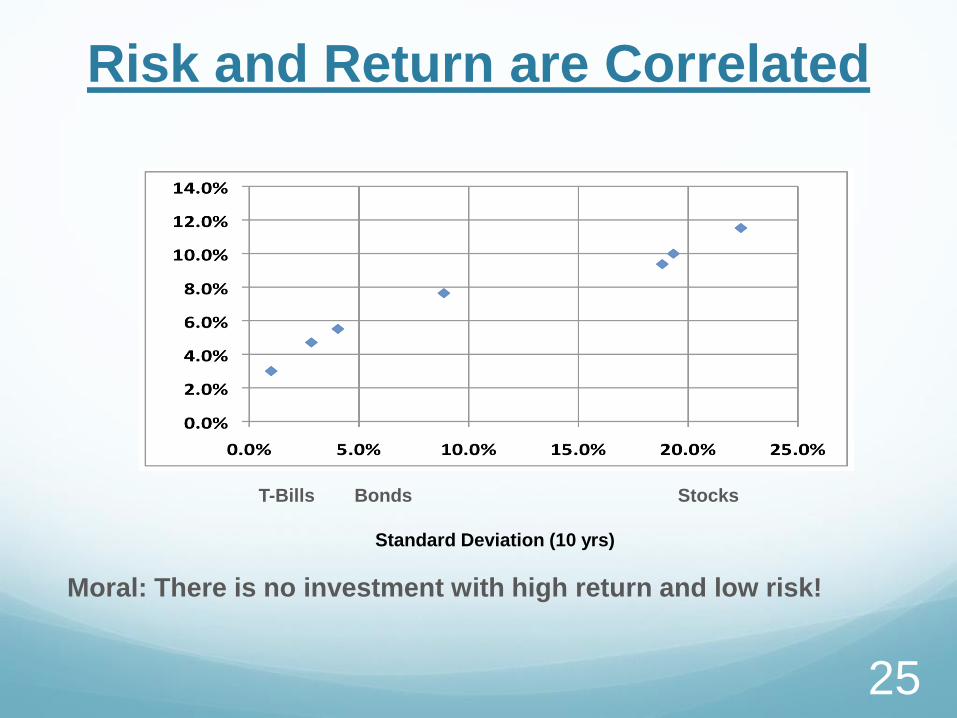
Risk and Return are Correlated
R
e
t
u
r
n
T-Bills Bonds Stocks
Standard Deviation (10 yrs)
Moral: There is no investment with high return and low risk!
25
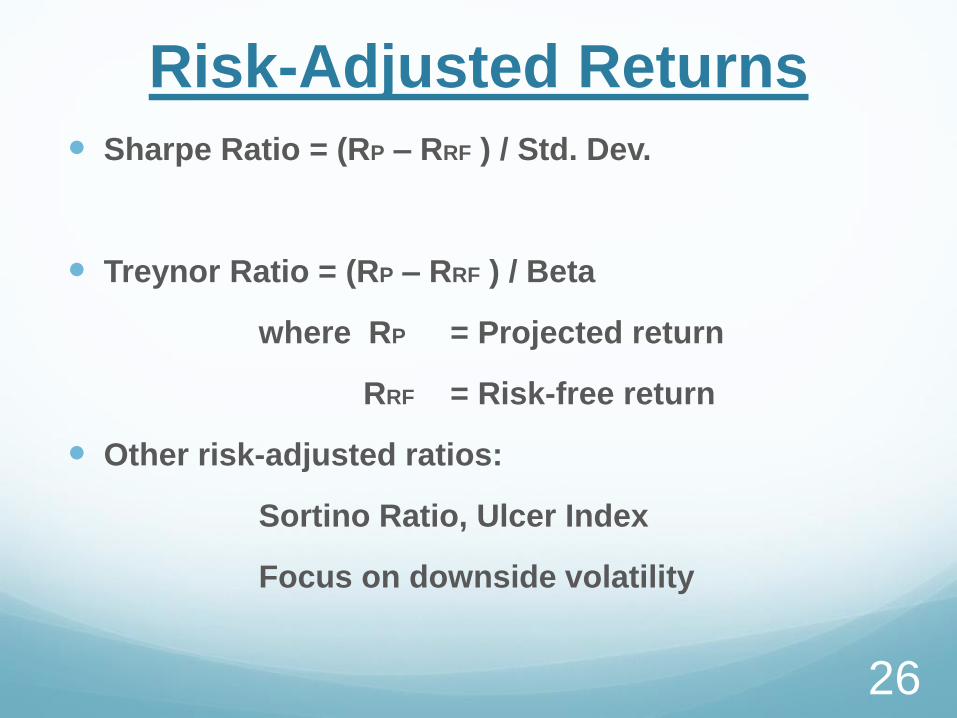
Risk-Adjusted Returns
Sharpe Ratio = (RP – RRF ) / Std. Dev.
Treynor Ratio = (RP – RRF ) / Beta
where RP = Projected return
RRF = Risk-free return
Other risk-adjusted ratios:
Sortino Ratio, Ulcer Index
Focus on downside volatility
26
Topics Covered Today
Your Personal Investor Profile, PIP
Measuring the return on investment
Sources of risk and its measurement
>>> Techniques to control risk
Investment vehicles
27

Techniques to Control Risk
Diversification of asset classes
Cash / Bonds / Stocks
Domestic / International
Tax diversification
Taxable, tax-deferred and tax-free accounts
Time diversification
Dollar cost averaging
Value averaging
28

Dollar Cost Averaging Invest a fixed $ amount at equal periods
Month $Amt SharePr #Shares TotalSh TotalVal
1 $1000 $10 100 100 $1000
2 $1000 $9 111 211 $1899
3 $1000 $8 125 337 $2696
4 $1000 $10 100 437 $4370
5 $1000 $12 83 520 $6240
6 $1000 $11 91 611 $6721
Total $6000 $10.00 611
Average cost of purchased shares = $6000/611 = $9.83
29

Value Averaging Adjust balance each period to target value
Month $Amt SharePr #Shares TotalSh TotalVal
1 $1000 $10 100 100 $1000
2 $1100 $9 122 222 $2000
3 $1224 $8 153 375 $3000
4 $250 $10 25 400 $4000
5 $200 $12 17 417 $5000
6 $1413 $11 128 545 $6000
Total $5187 $10.00 545
Average cost of purchased shares = $5187 / 545 = $9.52
30
Topics Covered Today
Your Personal Investor Profile, PIP
Measuring the return on investment
Sources of risk and its measurement
Techniques to control risk
>>> Investment vehicles
31

Investment Vehicles
Cash and equivalents
Individual stocks and bonds
Mutual funds
Closed-end funds
Exchange traded funds, ETFs
Exchange traded notes, ETNs
Real Estate Investment Trusts, REITs
Other: Commodities, MLPs, Hedge Funds, etc.
32
Cash and Cash Equivalents
Checking and savings accounts
Money market funds
Certificate of deposit, CDs
Treasury bills, etc.
Characteristics:
Stable value
Low return
May not keep up with inflation after taxes
33
Individual Bonds
Investor lends $ to a company or agency
and receives periodic interest payments
Traded through a broker
Need numerous bonds to build a diversified
portfolio
Least principle risk if held to maturity
Valuation is complex and time-consuming
34
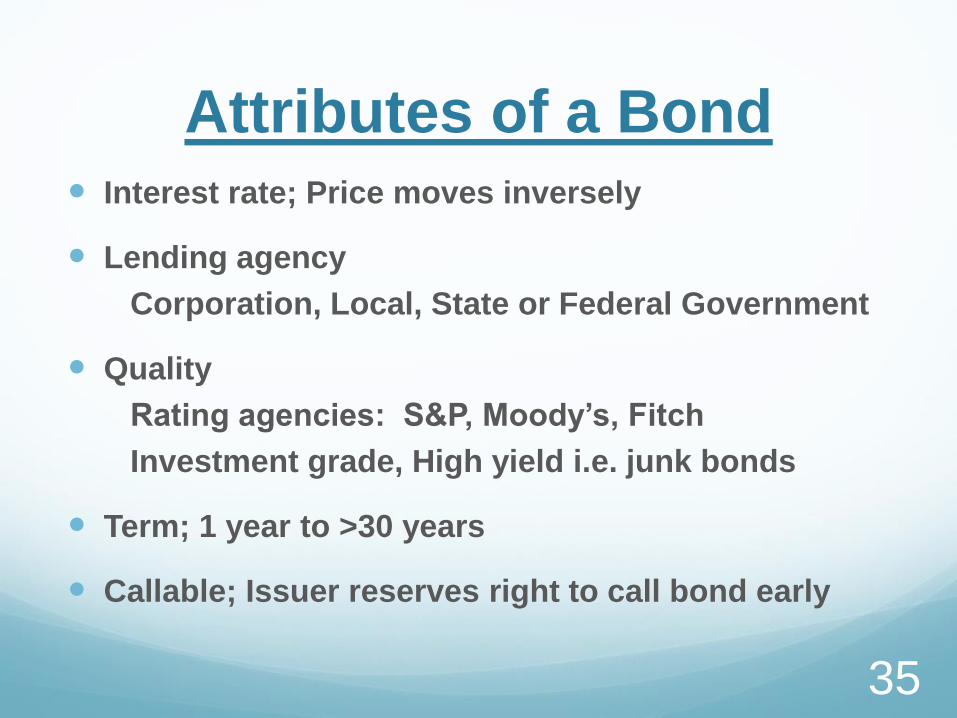
Attributes of a Bond Interest rate; Price moves inversely
Lending agency
Corporation, Local, State or Federal Government
Quality
Rating agencies: S&P, Moody’s, Fitch
Investment grade, High yield i.e. junk bonds
Term; 1 year to >30 years
Callable; Issuer reserves right to call bond early
35

Individual Stocks
Investor owns small fraction of a company
along with its gains/losses, dividends
Traded through a stock broker
throughout the day, for a commission
Need at least 20 stocks in different sectors
to build a diversified portfolio
Valuation is complex and time-consuming
36
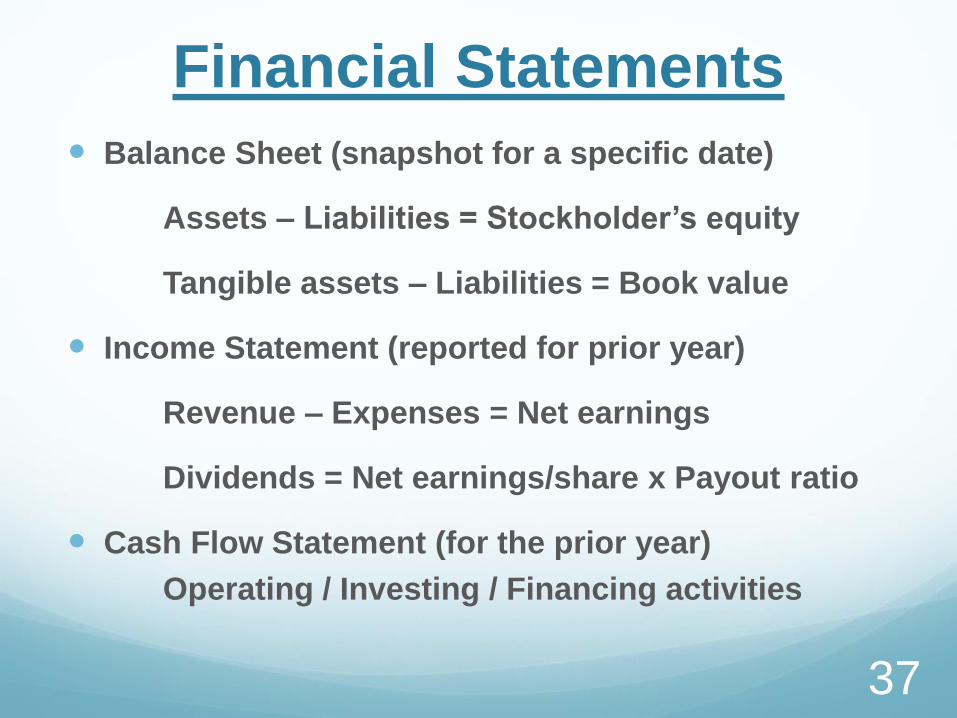
Financial Statements
Balance Sheet (snapshot for a specific date)
Assets – Liabilities = Stockholder’s equity
Tangible assets – Liabilities = Book value
Income Statement (reported for prior year)
Revenue – Expenses = Net earnings
Dividends = Net earnings/share x Payout ratio
Cash Flow Statement (for the prior year)
Operating / Investing / Financing activities
37
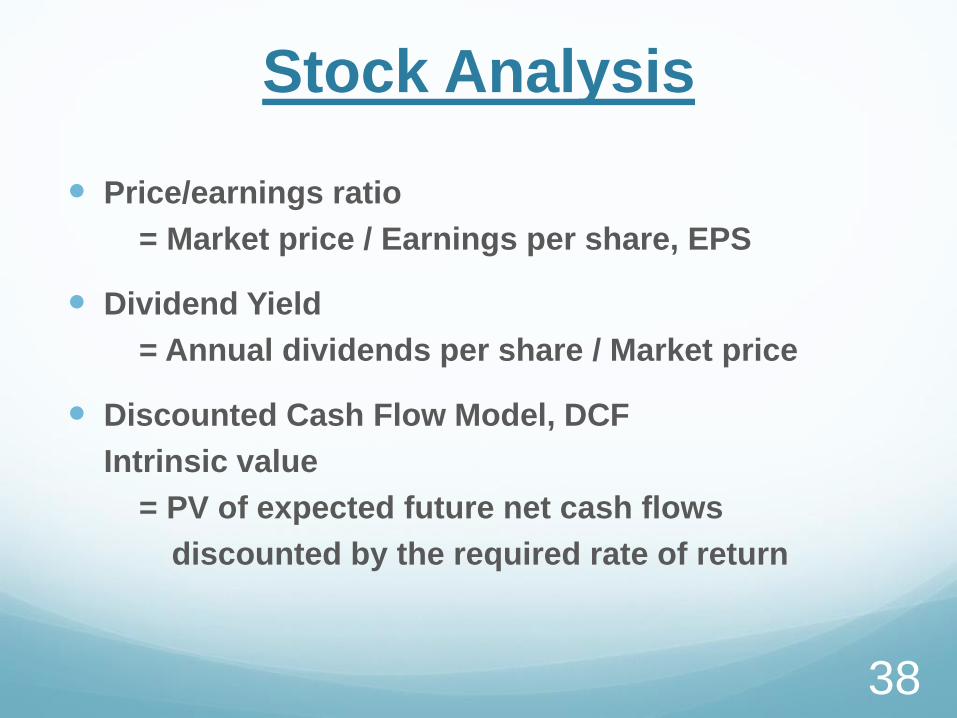
Stock Analysis
Price/earnings ratio
= Market price / Earnings per share, EPS
Dividend Yield
= Annual dividends per share / Market price
Discounted Cash Flow Model, DCF
Intrinsic value
= PV of expected future net cash flows
discounted by the required rate of return
38
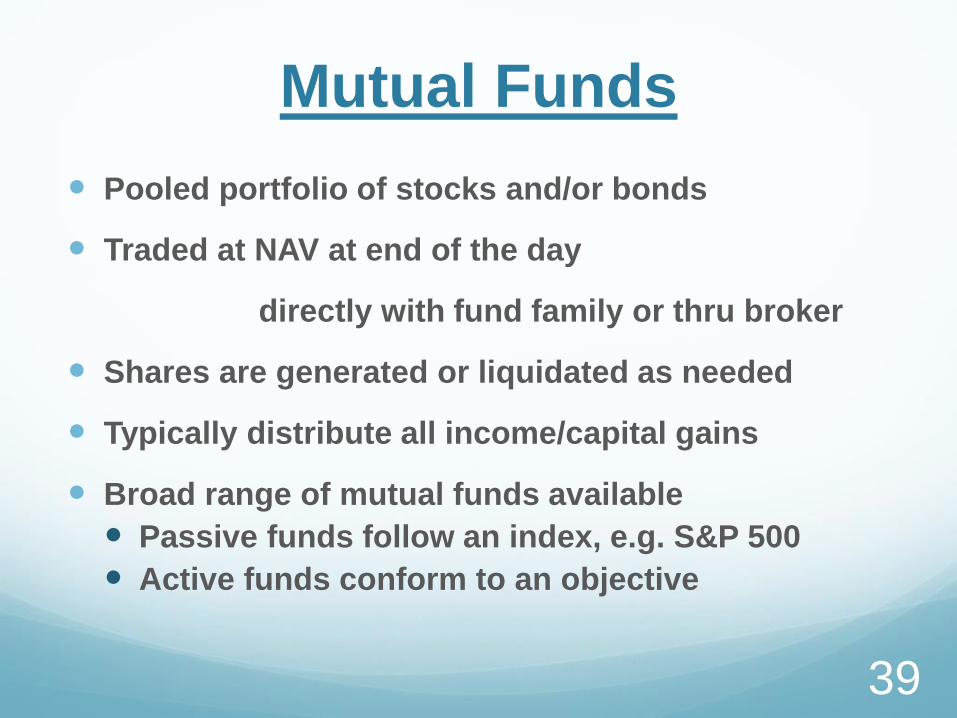
Mutual Funds
Pooled portfolio of stocks and/or bonds
Traded at NAV at end of the day
directly with fund family or thru broker
Shares are generated or liquidated as needed
Typically distribute all income/capital gains
Broad range of mutual funds available
Passive funds follow an index, e.g. S&P 500
Active funds conform to an objective
39

Mutual Fund Fees
Load to purchase or sell shares
Front-end load, can be as high as 5.75%, (8.5%)
Back-end load, declines each year; 5% 0%
No load funds
Expense ratio covers operating expenses
Management fee; Ranges from <0.1% to >2%
12b-1 fees for marketing the fund; 0% to 1%
40
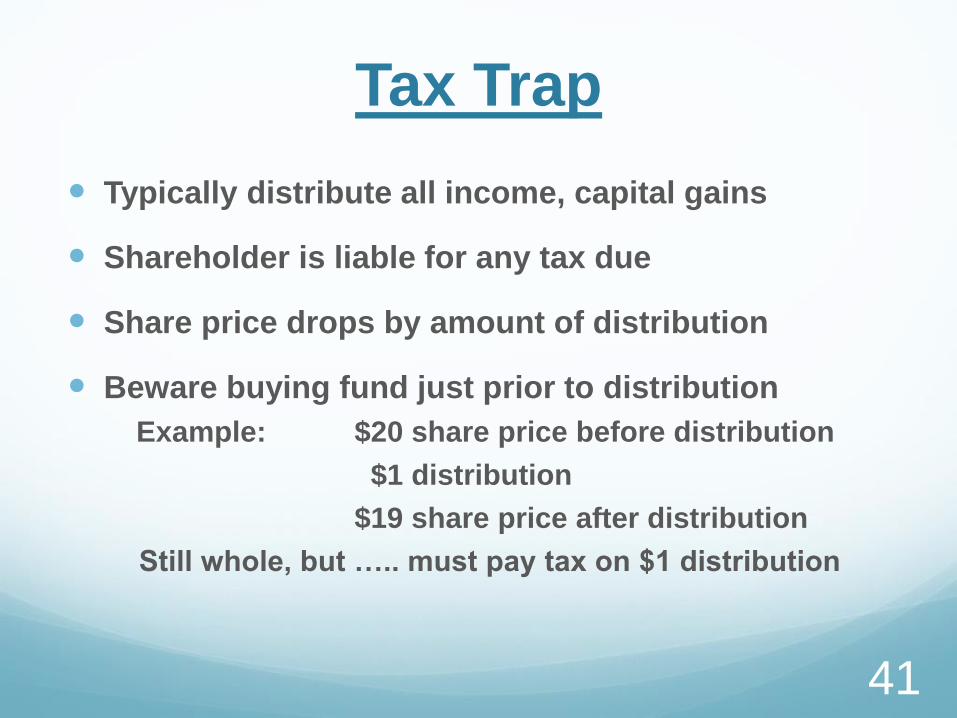
Tax Trap
Typically distribute all income, capital gains
Shareholder is liable for any tax due
Share price drops by amount of distribution
Beware buying fund just prior to distribution
Example: $20 share price before distribution
$1 distribution
$19 share price after distribution
Still whole, but ….. must pay tax on $1 distribution
41

Closed-End Funds
Similar to open mutual funds except …
Shares limited to initial offering
Traded only thru a broker (similar to a stock)
Can trade at a premium or discount to NAV
i.e. not valued at end of day
Relatively low press coverage
May provide inefficient market opportunity
42
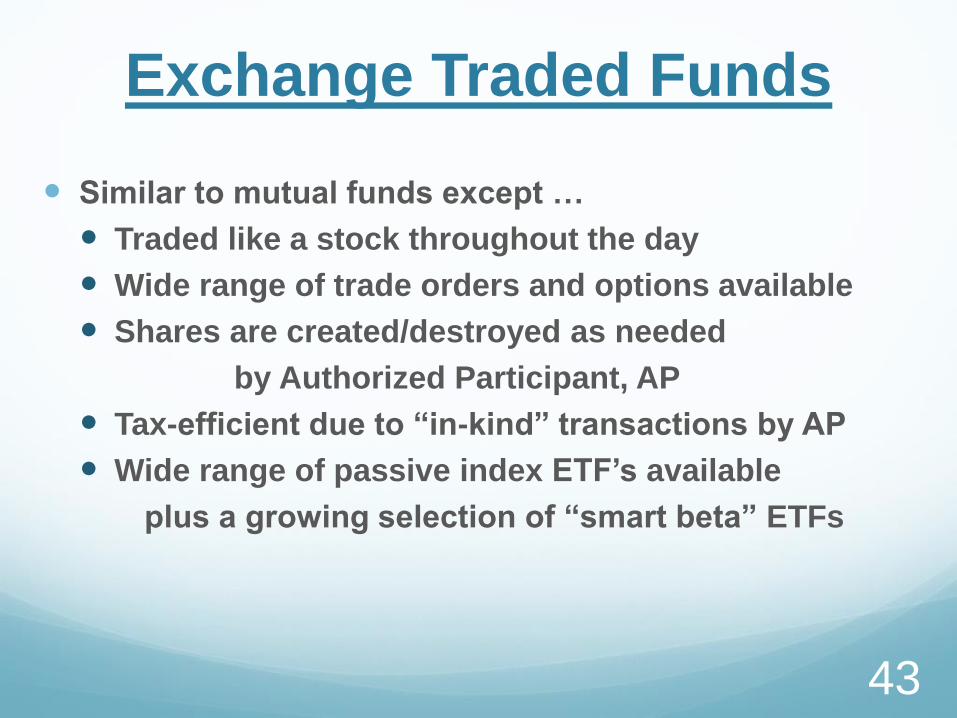
Exchange Traded Funds
Similar to mutual funds except …
Traded like a stock throughout the day
Wide range of trade orders and options available
Shares are created/destroyed as needed
by Authorized Participant, AP
Tax-efficient due to “in-kind” transactions by AP
Wide range of passive index ETF’s available
plus a growing selection of “smart beta” ETFs
43

Expenses for ETFs
Trade commission for broker
Very often waived for broker’s own ETFs
Bid/ask spread
Covers the market maker’s costs
Expense ratio
Covers the ongoing costs of managing the fund
Often slightly lower than equivalent mutual fund
May not be suitable for dollar cost averaging
44
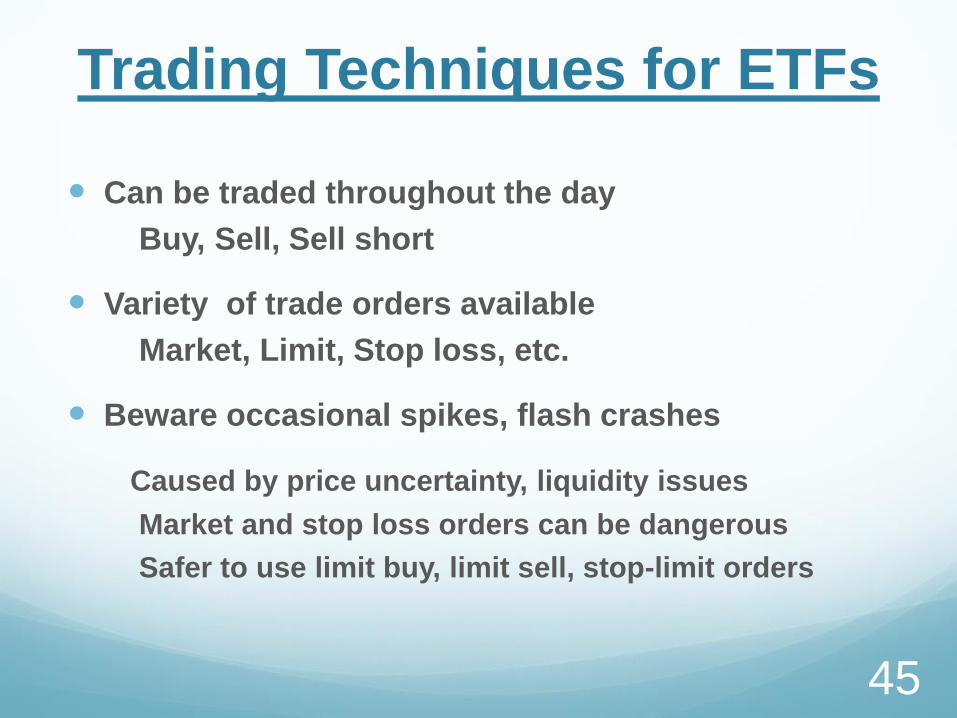
Trading Techniques for ETFs
Can be traded throughout the day
Buy, Sell, Sell short
Variety of trade orders available
Market, Limit, Stop loss, etc.
Beware occasional spikes, flash crashes
Caused by price uncertainty, liquidity issues
Market and stop loss orders can be dangerous
Safer to use limit buy, limit sell, stop-limit orders
45
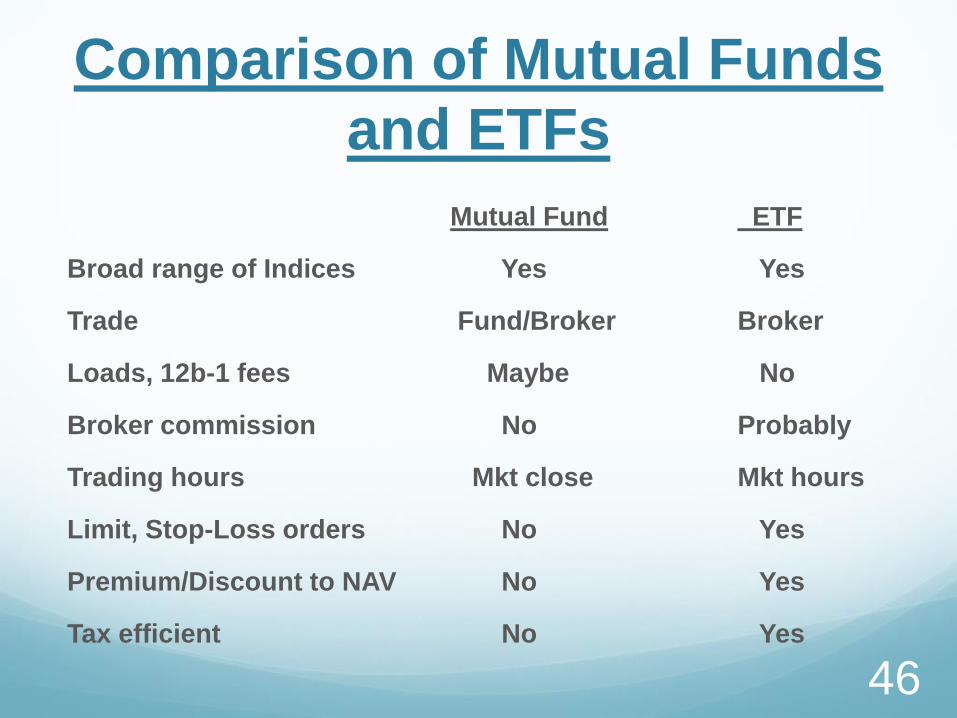
Comparison of Mutual Funds
and ETFs
Mutual Fund ETF
Broad range of Indices Yes Yes
Trade Fund/Broker Broker
Loads, 12b-1 fees Maybe No
Broker commission No Probably
Trading hours Mkt close Mkt hours
Limit, Stop-Loss orders No Yes
Premium/Discount to NAV No Yes
Tax efficient No Yes
46
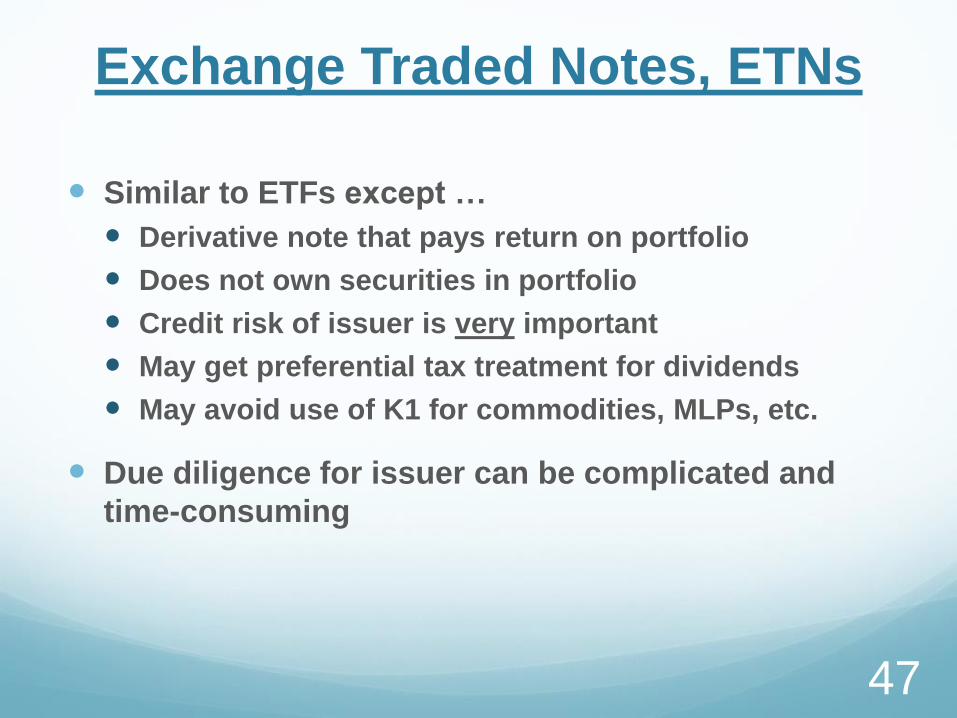
Exchange Traded Notes, ETNs
Similar to ETFs except …
Derivative note that pays return on portfolio
Does not own securities in portfolio
Credit risk of issuer is very important
May get preferential tax treatment for dividends
May avoid use of K1 for commodities, MLPs, etc.
Due diligence for issuer can be complicated and
time-consuming
47

Real Estate Investment Trusts
Mortgage REIT; Interest from pool of mortgages
Equity REIT
Invests in income producing real estate
apartments, shopping centers, offices, hotels
Must distribute at least 90% of taxable income
REIT can deduct div pmts from taxable income
Relatively low correlation with stock market
Numerous REIT mutual funds and ETFs
48

Alternative Investments
Commodity mutual funds and ETFs available
Master Limited Partnerships, MLPs
General partner, 5% - 10% + share of profits
Hedge funds
Go anywhere, absolute return
Usually charge 2% pa exp. ratio + 20% of profit
Private equity
For high net-worth investors
49
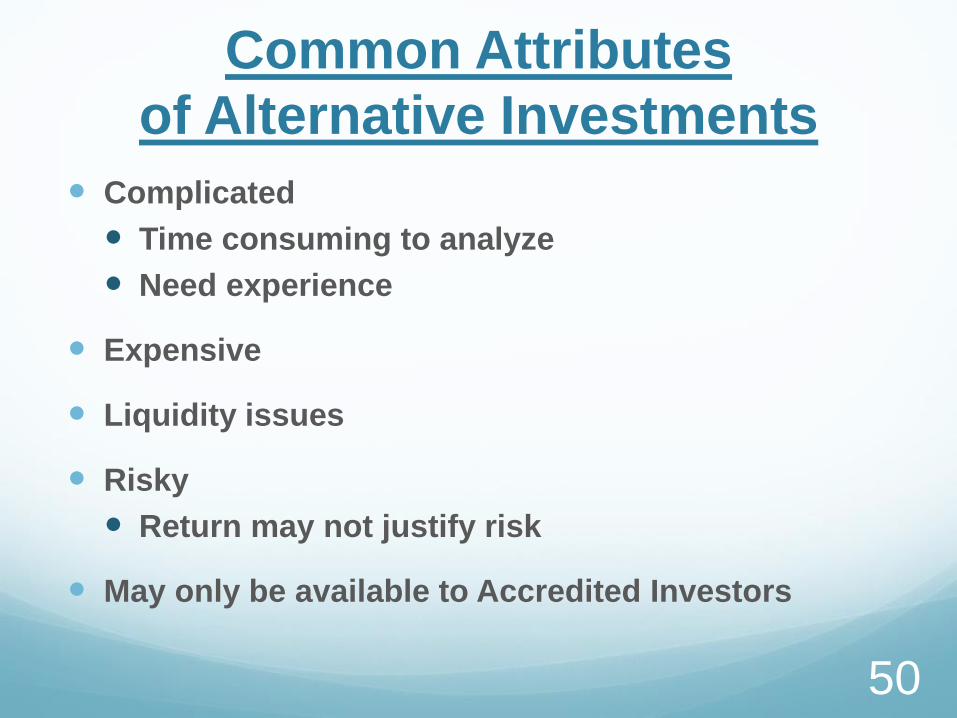
Common Attributes
of Alternative Investments
Complicated
Time consuming to analyze
Need experience
Expensive
Liquidity issues
Risky
Return may not justify risk
May only be available to Accredited Investors
50

In Summary
Today we have covered …
Your Personal Investor Profile, PIP
Risk and return measurements
Techniques to control risk
Investment vehicles
51
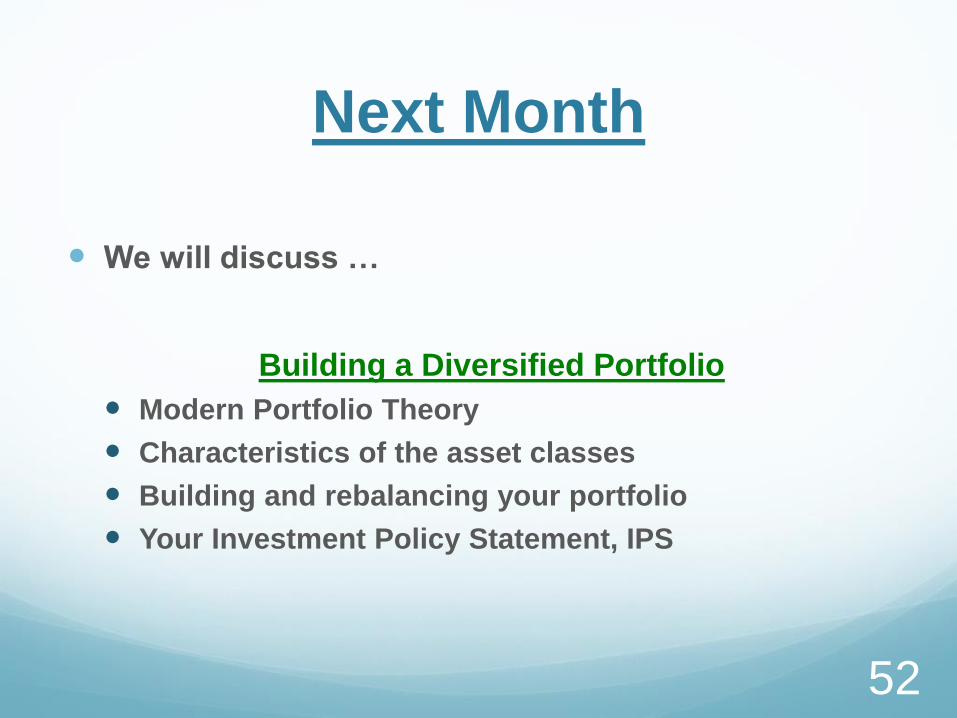
Next Month
We will discuss …
Building a Diversified Portfolio
Modern Portfolio Theory
Characteristics of the asset classes
Building and rebalancing your portfolio
Your Investment Policy Statement, IPS
52
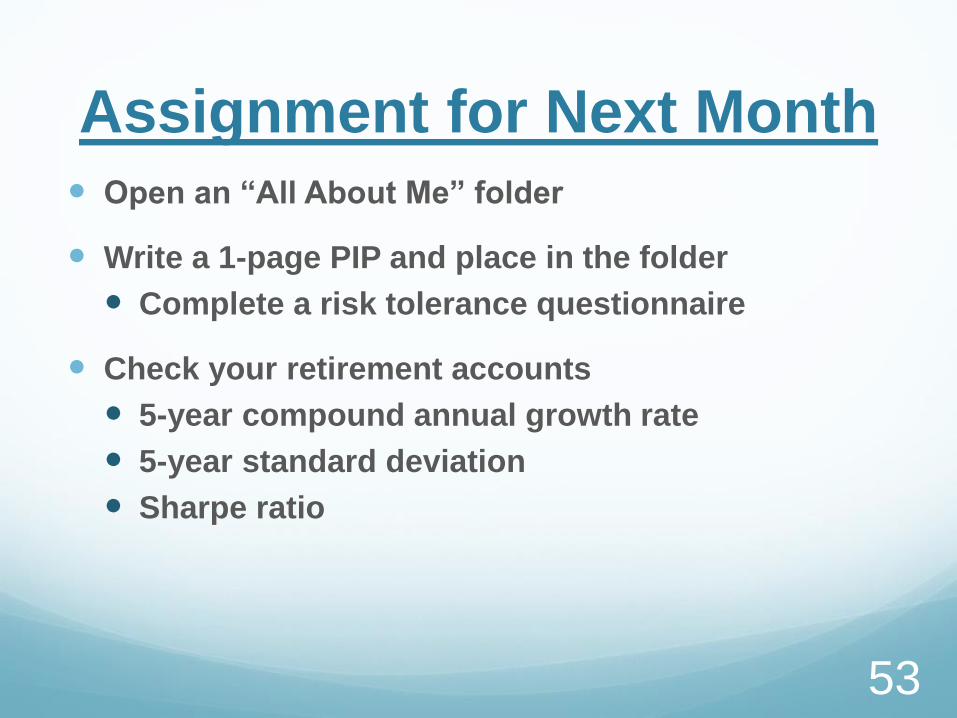
Assignment for Next Month Open an “All About Me” folder
Write a 1-page PIP and place in the folder
Complete a risk tolerance questionnaire
Check your retirement accounts
5-year compound annual growth rate
5-year standard deviation
Sharpe ratio
53
To probe further Money Funds and the Regulators, Mike Krasner, AAII Journal, June 2013
Intro to Financial Statement Analysis, Joe Lan, AAII Journal, Jan 2012
16 Financial Ratios for Analyzing a Company’s Strengths and Weaknesses,
Joe Lan, AAII Journal, September 2012
Quantitative Strategies for Selecting Stocks,
Richard Tortoriello, AAII Journal, May 2010
The Problem with Stop Loss Orders, Michael Kitces blog www.kitces.com
The Role of REITS for Long-Term Investors, Brad Case, AAII Journal, Jan 2012
Bogle on Mutual Funds, John Bogle, Irwin Professional Publishing
A Random Walk Down Wall Street, Burton Malkiel, W.W. Norton & Co.
Fire Your Stock Analyst!, Harry Domash, Prentice Hall
Winning The Loser’s Game, Charles D. Ellis, McGraw Hill
54

Useful Websites www.aaii.com Broad selection of investing material
www.santaclaracountylib.org /Adults/Business & Money/
Morningstar Investment Research Center } Stocks
Standard & Poors NetAdvantage } + Mutual funds
Value Line } + ETFs, etc.
www.bogleheads.org www.investopedia.com
www.schwab.com www.tdameritrade.com
www.vanguard.com www.fidelity.com
www.etf.com www.troweprice.com
www.etfdb.com www.etftrends.com
www.reit.com NAREIT’s home for all things REIT !
www.siliconvalleyaaii.org Previous presentations on various topics
55

56
Top Related