


Languages
Pages
Legal

Full-Scale Crash Test of an MD-500 Helicopter
Justin Littell
ATK Space Systems
NASA Langley Research Center
12 W. Bush Rd
Hampton Virginia, 236881
Abstract
A full-scale crash test was successfully conducted in March 2010 of an MD-500 helicopter at NASA Langley
Research Center’s Landing and Impact Research Facility. The reasons for conducting this test were threefold: 1 –
To generate data to be used with finite element computer modeling efforts, 2 – To study the crashworthiness features
typically associated with a small representative helicopter, and 3 – To compare aircraft response to data collected
from a previously conducted MD-500 crash test, which included an externally deployable energy absorbing (DEA)
concept. Instrumentation on the airframe included accelerometers on various structural components of the airframe;
and strain gages on keel beams, skid gear and portions of the skin. Three Anthropomorphic Test Devices and a
specialized Human Surrogate Torso Model were also onboard to collect occupant loads for evaluation with common
injury risk criteria. This paper presents background and results from this crash test conducted without the DEA
concept. These results showed accelerations of approximately 30 to 50 g on the airframe at various locations, little
energy attenuation through the airframe, and moderate to high probability of occupant injury for a variety of injury
criteria.
Introduction
The Landing and Impact Research (LandIR) Facility at
NASA Langley Research Center (LaRC) has a long
history of testing aircraft, rotorcraft and spacecraft. It was
originally built as the Lunar Landing Research Facility
[1], where Apollo astronauts trained to fly in a simulated
lunar landing environment. At the end of the Apollo
program, it was converted into a full-scale crash test
facility for investigating general aviation (GA) aircraft
crashworthiness. Since 1974, over 100 tests have been
completed on GA aircraft, helicopters, and fuselage
subsections. More recently, the facility supports NASA’s
Constellation Research Program for Orion crew module
landing. The LandIR is shown in Figure 1.
_____________________________________________
Presented at the American Helicopter Society 67th
Annual Forum, Virginia Beach, VA, May 3-5, 2011.
Copyright © 2011 by the American Helicopter Society
International, Inc. All rights reserved. This is a work of
the U.S. Government and is not subject to copyright
protection in the U.S.
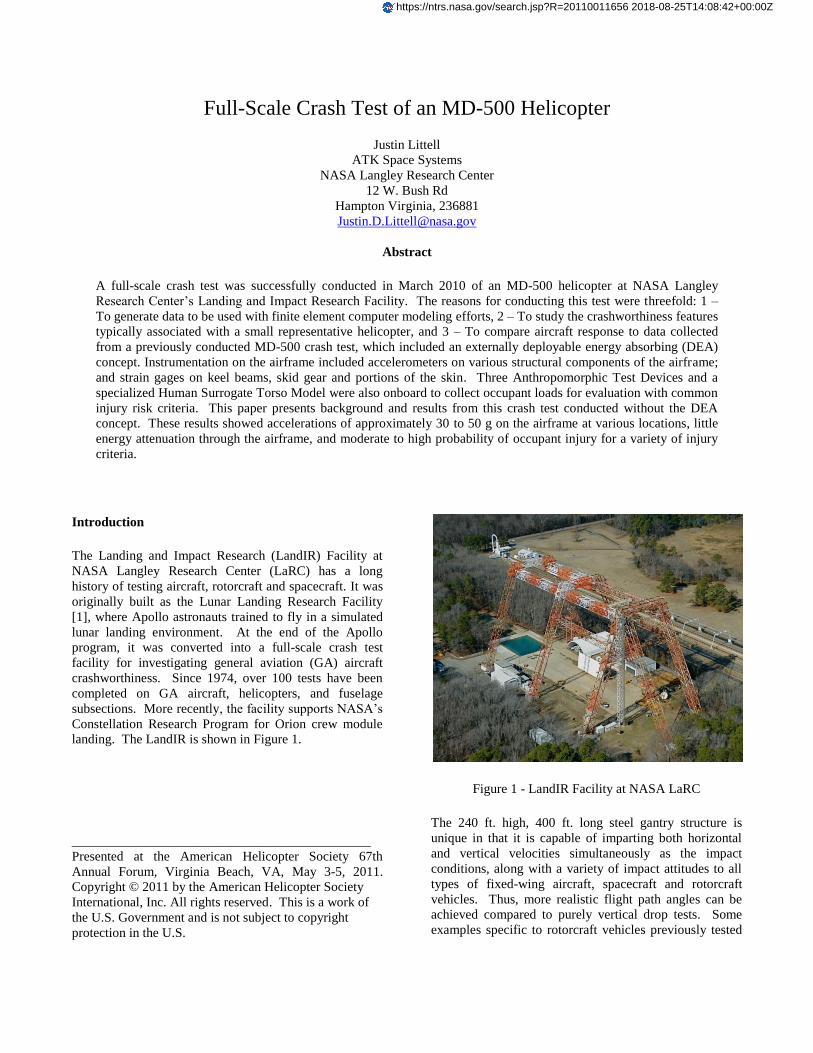
Figure 1 - LandIR Facility at NASA LaRC
The 240 ft. high, 400 ft. long steel gantry structure is
unique in that it is capable of imparting both horizontal
and vertical velocities simultaneously as the impact
conditions, along with a variety of impact attitudes to all
types of fixed-wing aircraft, spacecraft and rotorcraft
vehicles. Thus, more realistic flight path angles can be
achieved compared to purely vertical drop tests. Some
examples specific to rotorcraft vehicles previously tested
https://ntrs.nasa.gov/search.jsp?R=20110011656 2018-08-25T14:08:42+00:00Z
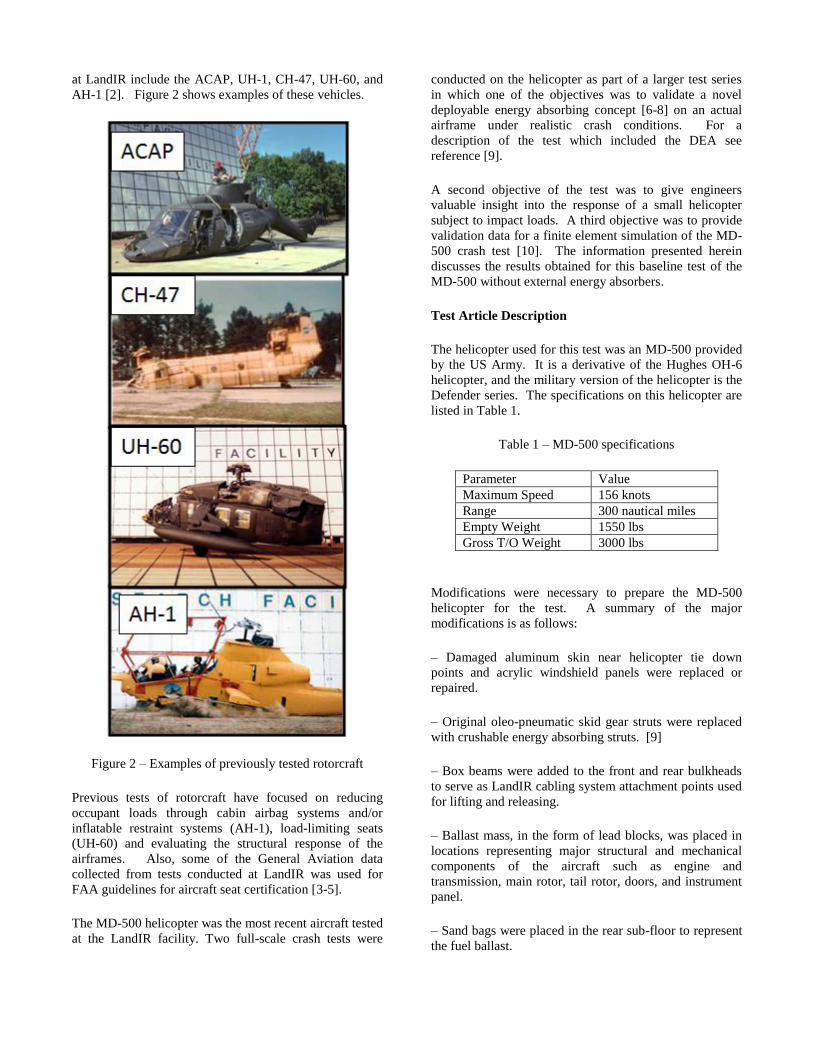
at LandIR include the ACAP, UH-1, CH-47, UH-60, and
AH-1 [2]. Figure 2 shows examples of these vehicles.
Figure 2 – Examples of previously tested rotorcraft
Previous tests of rotorcraft have focused on reducing
occupant loads through cabin airbag systems and/or
inflatable restraint systems (AH-1), load-limiting seats
(UH-60) and evaluating the structural response of the
airframes. Also, some of the General Aviation data
collected from tests conducted at LandIR was used for
FAA guidelines for aircraft seat certification [3-5].
The MD-500 helicopter was the most recent aircraft tested
at the LandIR facility. Two full-scale crash tests were
conducted on the helicopter as part of a larger test series
in which one of the objectives was to validate a novel
deployable energy absorbing concept [6-8] on an actual
airframe under realistic crash conditions. For a
description of the test which included the DEA see
reference [9].
A second objective of the test was to give engineers
valuable insight into the response of a small helicopter
subject to impact loads. A third objective was to provide
validation data for a finite element simulation of the MD-
500 crash test [10]. The information presented herein
discusses the results obtained for this baseline test of the
MD-500 without external energy absorbers.
Test Article Description
The helicopter used for this test was an MD-500 provided
by the US Army. It is a derivative of the Hughes OH-6
helicopter, and the military version of the helicopter is the
Defender series. The specifications on this helicopter are
listed in Table 1.
Table 1 – MD-500 specifications
Parameter Value
Maximum Speed 156 knots
Range 300 nautical miles
Empty Weight 1550 lbs
Gross T/O Weight 3000 lbs
Modifications were necessary to prepare the MD-500
helicopter for the test. A summary of the major
modifications is as follows:
– Damaged aluminum skin near helicopter tie down
points and acrylic windshield panels were replaced or
repaired.
– Original oleo-pneumatic skid gear struts were replaced
with crushable energy absorbing struts. [9]
– Box beams were added to the front and rear bulkheads
to serve as LandIR cabling system attachment points used
for lifting and releasing.
– Ballast mass, in the form of lead blocks, was placed in
locations representing major structural and mechanical
components of the aircraft such as engine and
transmission, main rotor, tail rotor, doors, and instrument
panel.
– Sand bags were placed in the rear sub-floor to represent
the fuel ballast.

– New skid gear was installed.
– New front bucket and rear bench seats were installed.
Minor damage on the skin and front subfloor sustained
from the previous test was repaired. The minor damage
was caused from the belly skin reacting against the DEA
crush during impact. Figure 3 illustrates the damage
repaired from the previous testing.
Figure 3 – Damaged areas from first MD-500 test
Figure 3, top, looks into the pilot floor showing the extent
of the damage from the previous test. The bent frame was
due to the MD-500 belly crushing, shown in figure 3,
bottom. Figure 3, bottom, shows damaged belly skin
which peeled and separated from the nose. New
aluminum sheet metal was fabricated and reinstalled in
place of the bent front frame and belly. Note that even
though the peeled skin occurred in the nose of the
helicopter, the peeling was actually from a doubler
material added for the previous test. The doubler material
was placed from the nose to the rear bulkhead, and its
removal for this test required that parts of the skin also be
replaced. Thus skin was replaced for the entire belly.
Figure 4 shows the repairs made.
Figure 4 – Repaired regions on MD-500 helicopter
The MD-500 test article weighed 2906 lbs. It was
instrumented to collect strain, acceleration, load and
Anthropomorphic Test Device (ATD) occupant response
data. Accelerometers were located on structural
components of the airframe, added ballast locations and
floors, while strain gages were placed on the bulkheads,
keel beam, and skid gear. Four ATD occupants were
placed onboard. The pilot (front left) was a Hybrid III
50th
percentile ATD containing a FAA approved straight
spinal column [11]. The co-pilot (front right) and rear
passenger (rear right) were standard Hybrid II 50th
percentile ATDs. The left rear passenger (rear left) was a
specialized human surrogate torso model (HSTM),
designed to measure the soft tissue injury on a human
torso [12]. The HSTM was an upper body test device
only and attached to a standard Hybrid III pelvis. The
front pilot and co-pilot were seated in standard mesh cloth
bucket seats and restrained with 5-point harnesses. The
rear occupants sat on a standard mesh bench seat and
restrained with lap and shoulder harnesses only. Figure 5
shows the pre-test configuration of the MD-500 at the
LandIR Facility.
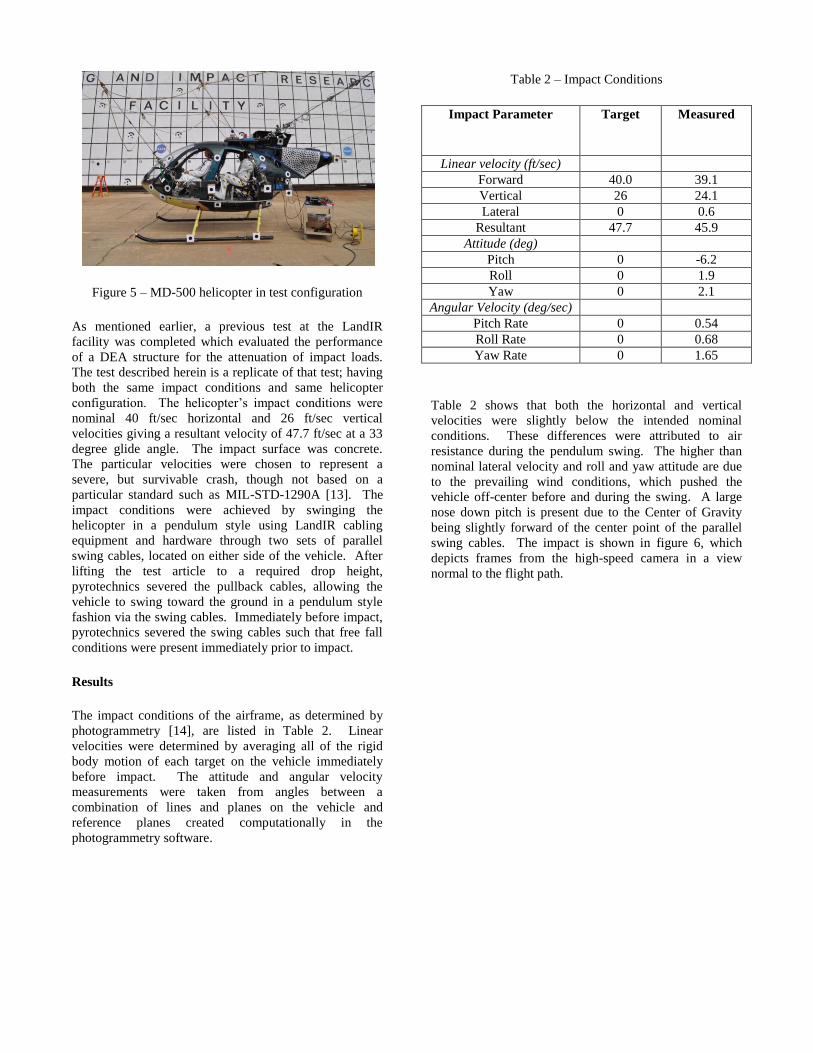
Figure 5 – MD-500 helicopter in test configuration
As mentioned earlier, a previous test at the LandIR
facility was completed which evaluated the performance
of a DEA structure for the attenuation of impact loads.
The test described herein is a replicate of that test; having
both the same impact conditions and same helicopter
configuration. The helicopter’s impact conditions were
nominal 40 ft/sec horizontal and 26 ft/sec vertical
velocities giving a resultant velocity of 47.7 ft/sec at a 33
degree glide angle. The impact surface was concrete.
The particular velocities were chosen to represent a
severe, but survivable crash, though not based on a
particular standard such as MIL-STD-1290A [13]. The
impact conditions were achieved by swinging the
helicopter in a pendulum style using LandIR cabling
equipment and hardware through two sets of parallel
swing cables, located on either side of the vehicle. After
lifting the test article to a required drop height,
pyrotechnics severed the pullback cables, allowing the
vehicle to swing toward the ground in a pendulum style
fashion via the swing cables. Immediately before impact,
pyrotechnics severed the swing cables such that free fall
conditions were present immediately prior to impact.
Results
The impact conditions of the airframe, as determined by
photogrammetry [14], are listed in Table 2. Linear
velocities were determined by averaging all of the rigid
body motion of each target on the vehicle immediately
before impact. The attitude and angular velocity
measurements were taken from angles between a
combination of lines and planes on the vehicle and
reference planes created computationally in the
photogrammetry software.
Table 2 – Impact Conditions
Impact Parameter
Target Measured
Linear velocity (ft/sec)
Forward 40.0 39.1
Vertical 26 24.1
Lateral 0 0.6
Resultant 47.7 45.9
Attitude (deg)
Pitch 0 -6.2
Roll 0 1.9
Yaw 0 2.1
Angular Velocity (deg/sec)
Pitch Rate 0 0.54
Roll Rate 0 0.68
Yaw Rate 0 1.65
Table 2 shows that both the horizontal and vertical
velocities were slightly below the intended nominal
conditions. These differences were attributed to air
resistance during the pendulum swing. The higher than
nominal lateral velocity and roll and yaw attitude are due
to the prevailing wind conditions, which pushed the
vehicle off-center before and during the swing. A large
nose down pitch is present due to the Center of Gravity
being slightly forward of the center point of the parallel
swing cables. The impact is shown in figure 6, which
depicts frames from the high-speed camera in a view
normal to the flight path.
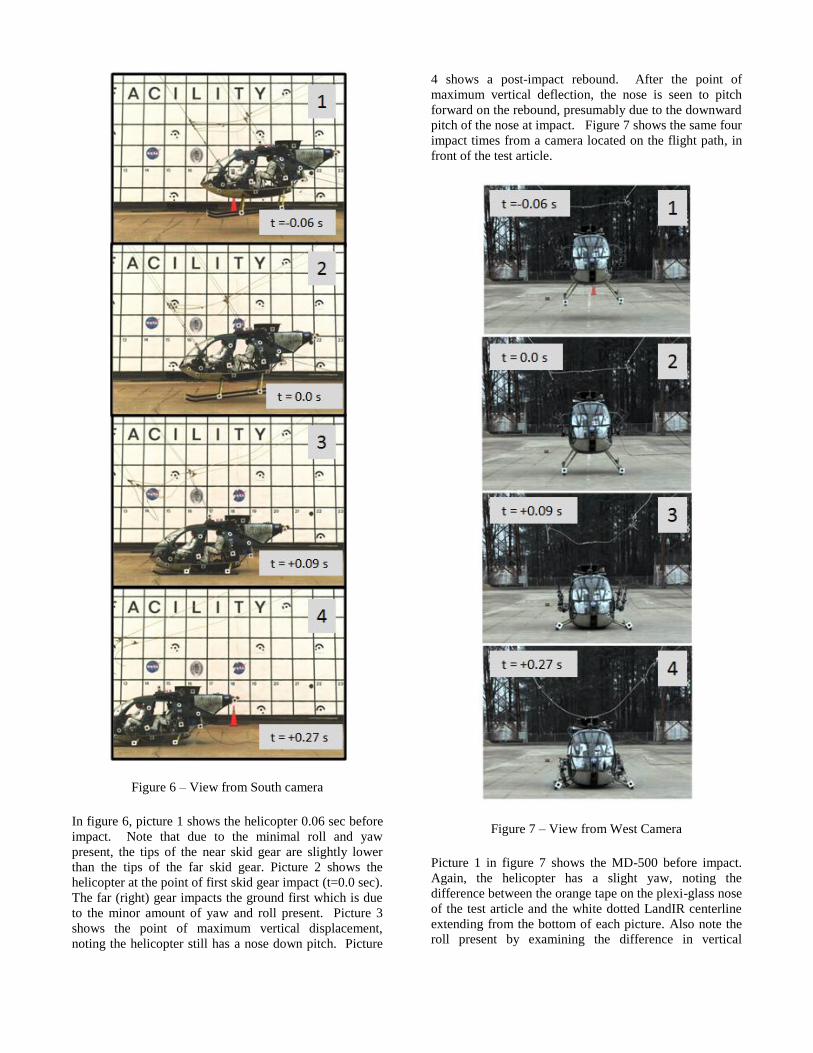
Figure 6 – View from South camera
In figure 6, picture 1 shows the helicopter 0.06 sec before
impact. Note that due to the minimal roll and yaw
present, the tips of the near skid gear are slightly lower
than the tips of the far skid gear. Picture 2 shows the
helicopter at the point of first skid gear impact (t=0.0 sec).
The far (right) gear impacts the ground first which is due
to the minor amount of yaw and roll present. Picture 3
shows the point of maximum vertical displacement,
noting the helicopter still has a nose down pitch. Picture
4 shows a post-impact rebound. After the point of
maximum vertical deflection, the nose is seen to pitch
forward on the rebound, presumably due to the downward
pitch of the nose at impact. Figure 7 shows the same four
impact times from a camera located on the flight path, in
front of the test article.
Figure 7 – View from West Camera
Picture 1 in figure 7 shows the MD-500 before impact.
Again, the helicopter has a slight yaw, noting the
difference between the orange tape on the plexi-glass nose
of the test article and the white dotted LandIR centerline
extending from the bottom of each picture. Also note the
roll present by examining the difference in vertical
position between the left and right skid gear tips. Picture
2 shows skid gear contact with the right gear contacting
the ground shortly before the left gear. Picture 3 shows
the maximum vertical deflection of the helicopter, while
picture 4 shows the helicopter post-impact rebound,
where it has pitched down. Ripples in the nose on the
pilot side can be seen in pictures 3 and 4, suggesting that
parts of the nose structure have failed. Figure 8 shows the
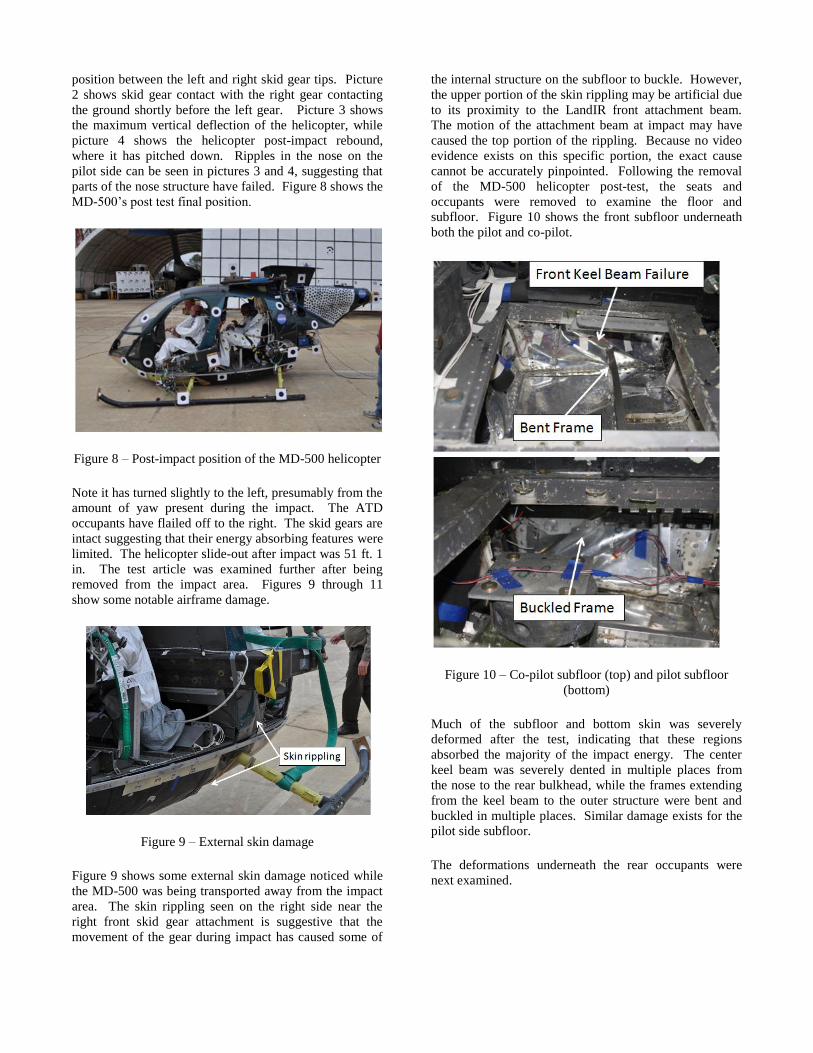
MD-500’s post test final position.
Figure 8 – Post-impact position of the MD-500 helicopter
Note it has turned slightly to the left, presumably from the
amount of yaw present during the impact. The ATD
occupants have flailed off to the right. The skid gears are
intact suggesting that their energy absorbing features were
limited. The helicopter slide-out after impact was 51 ft. 1
in. The test article was examined further after being
removed from the impact area. Figures 9 through 11
show some notable airframe damage.
Figure 9 – External skin damage
Figure 9 shows some external skin damage noticed while
the MD-500 was being transported away from the impact
area. The skin rippling seen on the right side near the
right front skid gear attachment is suggestive that the
movement of the gear during impact has caused some of
the internal structure on the subfloor to buckle. However,
the upper portion of the skin rippling may be artificial due
to its proximity to the LandIR front attachment beam.
The motion of the attachment beam at impact may have
caused the top portion of the rippling. Because no video
evidence exists on this specific portion, the exact cause
cannot be accurately pinpointed. Following the removal
of the MD-500 helicopter post-test, the seats and
occupants were removed to examine the floor and
subfloor. Figure 10 shows the front subfloor underneath
both the pilot and co-pilot.
Figure 10 – Co-pilot subfloor (top) and pilot subfloor
(bottom)
Much of the subfloor and bottom skin was severely
deformed after the test, indicating that these regions
absorbed the majority of the impact energy. The center
keel beam was severely dented in multiple places from
the nose to the rear bulkhead, while the frames extending
from the keel beam to the outer structure were bent and
buckled in multiple places. Similar damage exists for the
pilot side subfloor.
The deformations underneath the rear occupants were
next examined.
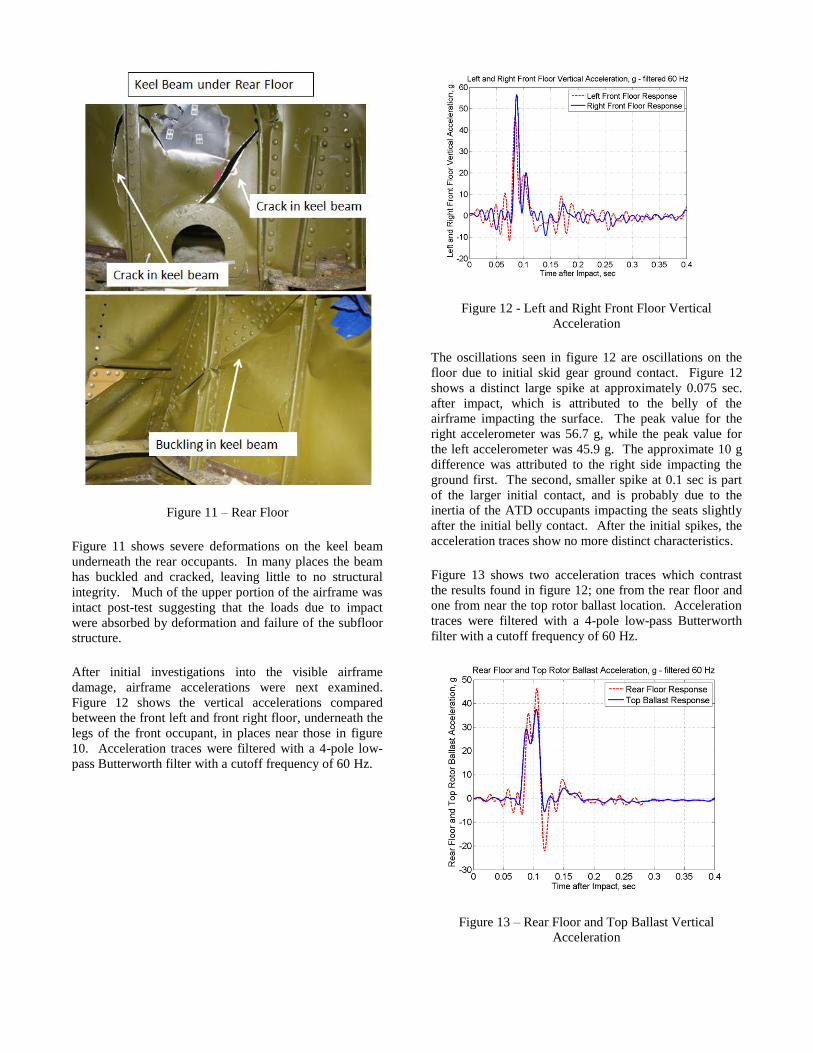
Figure 11 – Rear Floor
Figure 11 shows severe deformations on the keel beam
underneath the rear occupants. In many places the beam
has buckled and cracked, leaving little to no structural
integrity. Much of the upper portion of the airframe was
intact post-test suggesting that the loads due to impact
were absorbed by deformation and failure of the subfloor
structure.
After initial investigations into the visible airframe
damage, airframe accelerations were next examined.
Figure 12 shows the vertical accelerations compared
between the front left and front right floor, underneath the
legs of the front occupant, in places near those in figure
10. Acceleration traces were filtered with a 4-pole low-
pass Butterworth filter with a cutoff frequency of 60 Hz.
Figure 12 - Left and Right Front Floor Vertical
Acceleration
The oscillations seen in figure 12 are oscillations on the
floor due to initial skid gear ground contact. Figure 12
shows a distinct large spike at approximately 0.075 sec.
after impact, which is attributed to the belly of the
airframe impacting the surface. The peak value for the
right accelerometer was 56.7 g, while the peak value for
the left accelerometer was 45.9 g. The approximate 10 g
difference was attributed to the right side impacting the
ground first. The second, smaller spike at 0.1 sec is part
of the larger initial contact, and is probably due to the
inertia of the ATD occupants impacting the seats slightly
after the initial belly contact. After the initial spikes, the
acceleration traces show no more distinct characteristics.
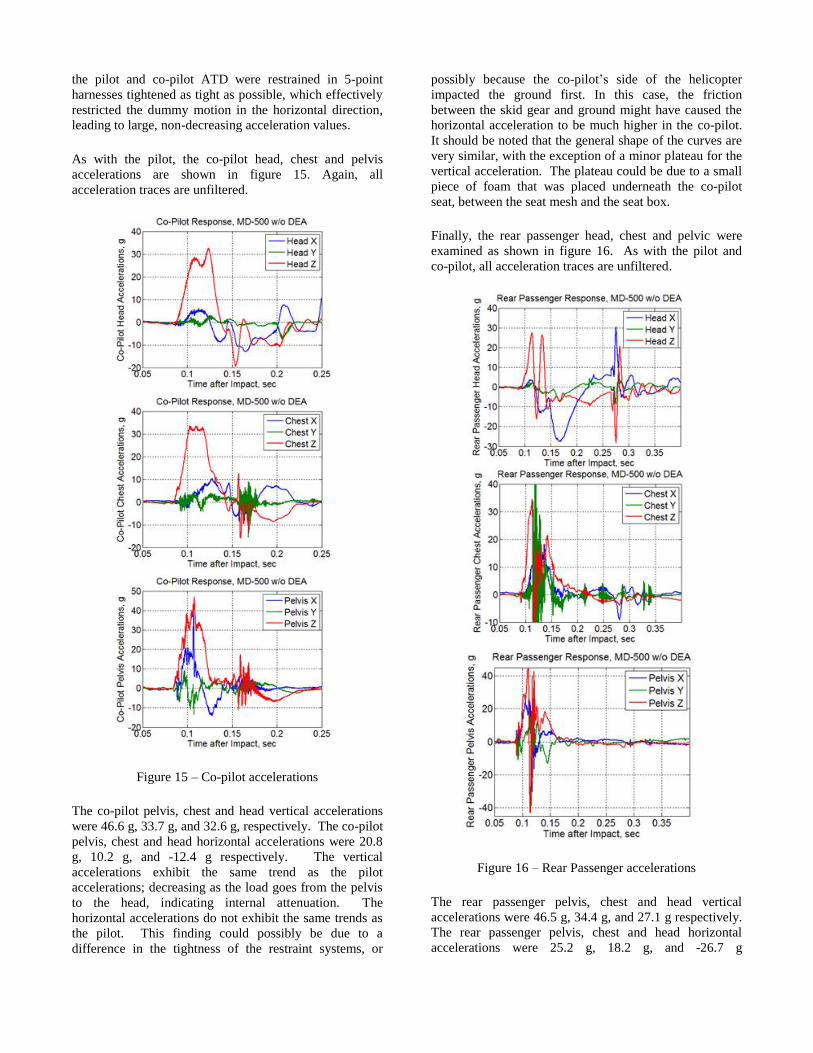
Figure 13 shows two acceleration traces which contrast
the results found in figure 12; one from the rear floor and
one from near the top rotor ballast location. Acceleration
traces were filtered with a 4-pole low-pass Butterworth
filter with a cutoff frequency of 60 Hz.
Figure 13 – Rear Floor and Top Ballast Vertical
Acceleration
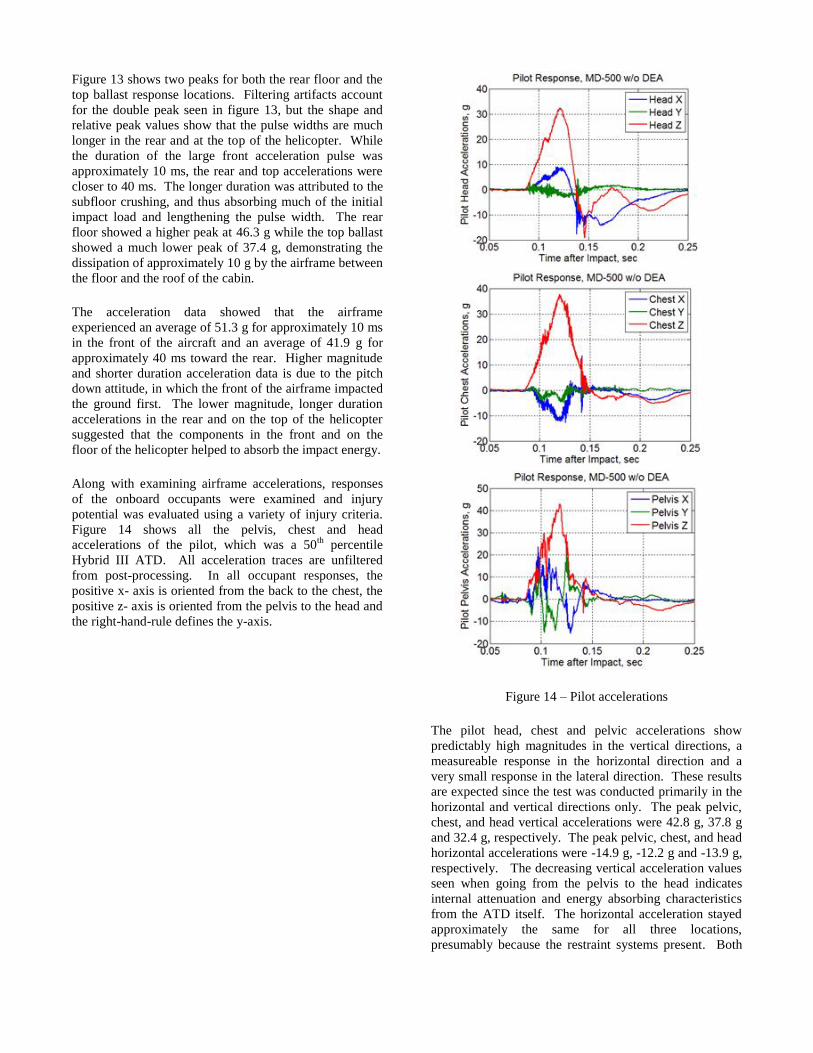
Figure 13 shows two peaks for both the rear floor and the
top ballast response locations. Filtering artifacts account
for the double peak seen in figure 13, but the shape and
relative peak values show that the pulse widths are much
longer in the rear and at the top of the helicopter. While
the duration of the large front acceleration pulse was
approximately 10 ms, the rear and top accelerations were
closer to 40 ms. The longer duration was attributed to the
subfloor crushing, and thus absorbing much of the initial
impact load and lengthening the pulse width. The rear
floor showed a higher peak at 46.3 g while the top ballast
showed a much lower peak of 37.4 g, demonstrating the
dissipation of approximately 10 g by the airframe between
the floor and the roof of the cabin.
The acceleration data showed that the airframe
experienced an average of 51.3 g for approximately 10 ms
in the front of the aircraft and an average of 41.9 g for
approximately 40 ms toward the rear. Higher magnitude
and shorter duration acceleration data is due to the pitch
down attitude, in which the front of the airframe impacted
the ground first. The lower magnitude, longer duration
accelerations in the rear and on the top of the helicopter
suggested that the components in the front and on the
floor of the helicopter helped to absorb the impact energy.
Along with examining airframe accelerations, responses
of the onboard occupants were examined and injury
potential was evaluated using a variety of injury criteria.
Figure 14 shows all the pelvis, chest and head
accelerations of the pilot, which was a 50th
percentile
Hybrid III ATD. All acceleration traces are unfiltered
from post-processing. In all occupant responses, the
positive x- axis is oriented from the back to the chest, the
positive z- axis is oriented from the pelvis to the head and
the right-hand-rule defines the y-axis.
Figure 14 – Pilot accelerations
The pilot head, chest and pelvic accelerations show
predictably high magnitudes in the vertical directions, a
measureable response in the horizontal direction and a
very small response in the lateral direction. These results
are expected since the test was conducted primarily in the
horizontal and vertical directions only. The peak pelvic,
chest, and head vertical accelerations were 42.8 g, 37.8 g
and 32.4 g, respectively. The peak pelvic, chest, and head
horizontal accelerations were -14.9 g, -12.2 g and -13.9 g,
respectively. The decreasing vertical acceleration values
seen when going from the pelvis to the head indicates
internal attenuation and energy absorbing characteristics
from the ATD itself. The horizontal acceleration stayed
approximately the same for all three locations,
presumably because the restraint systems present. Both
the pilot and co-pilot ATD were restrained in 5-point
harnesses tightened as tight as possible, which effectively
restricted the dummy motion in the horizontal direction,
leading to large, non-decreasing acceleration values.
As with the pilot, the co-pilot head, chest and pelvis
accelerations are shown in figure 15. Again, all
acceleration traces are unfiltered.
Figure 15 – Co-pilot accelerations
The co-pilot pelvis, chest and head vertical accelerations
were 46.6 g, 33.7 g, and 32.6 g, respectively. The co-pilot
pelvis, chest and head horizontal accelerations were 20.8
g, 10.2 g, and -12.4 g respectively. The vertical
accelerations exhibit the same trend as the pilot
accelerations; decreasing as the load goes from the pelvis
to the head, indicating internal attenuation. The
horizontal accelerations do not exhibit the same trends as
the pilot. This finding could possibly be due to a
difference in the tightness of the restraint systems, or
possibly because the co-pilot’s side of the helicopter
impacted the ground first. In this case, the friction
between the skid gear and ground might have caused the
horizontal acceleration to be much higher in the co-pilot.
It should be noted that the general shape of the curves are
very similar, with the exception of a minor plateau for the
vertical acceleration. The plateau could be due to a small
piece of foam that was placed underneath the co-pilot
seat, between the seat mesh and the seat box.
Finally, the rear passenger head, chest and pelvic were
examined as shown in figure 16. As with the pilot and
co-pilot, all acceleration traces are unfiltered.
Figure 16 – Rear Passenger accelerations
The rear passenger pelvis, chest and head vertical
accelerations were 46.5 g, 34.4 g, and 27.1 g respectively.
The rear passenger pelvis, chest and head horizontal
accelerations were 25.2 g, 18.2 g, and -26.7 g
respectively. As seen with the other two occupants,
generally, the trends matched in the vertical direction.
Attenuation between the pelvis and head was seen,
however the shape of the vertical acceleration curves was
different. This difference was presumably from the fact
that the rear ATD was seated on a different (bench) seat.
A trend could not be seen in the horizontal accelerations,
as the data was scattered between the head, chest and
pelvis. One possible reason for this scatter is the restraint
system. Instead of having a 5-point harness restraint
system which fully constrained the front ATDs, the rear
ATD had only a lap and shoulder belt, much like the
seatbelts found in automobiles. The lack of reaction force
from a full restraint probably attributed to the
discrepancies seen.
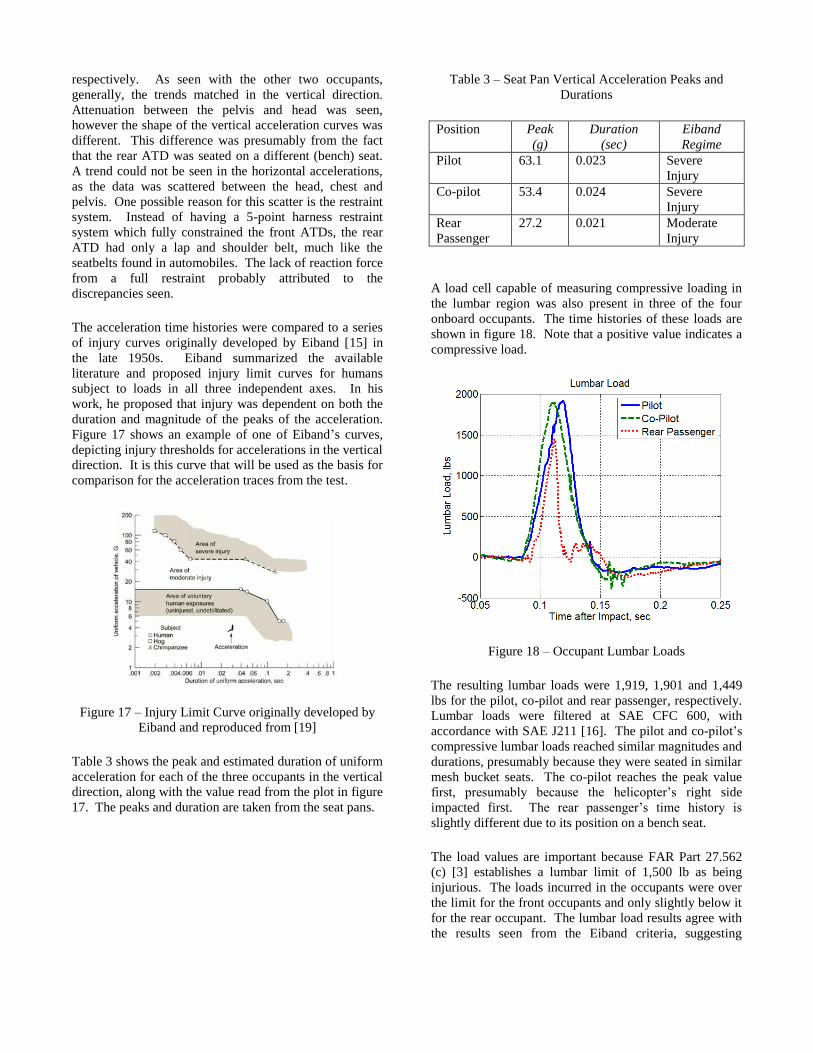
The acceleration time histories were compared to a series
of injury curves originally developed by Eiband [15] in
the late 1950s. Eiband summarized the available
literature and proposed injury limit curves for humans
subject to loads in all three independent axes. In his
work, he proposed that injury was dependent on both the
duration and magnitude of the peaks of the acceleration.
Figure 17 shows an example of one of Eiband’s curves,
depicting injury thresholds for accelerations in the vertical
direction. It is this curve that will be used as the basis for
comparison for the acceleration traces from the test.
Figure 17 – Injury Limit Curve originally developed by
Eiband and reproduced from [19]
Table 3 shows the peak and estimated duration of uniform
acceleration for each of the three occupants in the vertical
direction, along with the value read from the plot in figure
17. The peaks and duration are taken from the seat pans.
Table 3 – Seat Pan Vertical Acceleration Peaks and
Durations
Position Peak
(g)
Duration
(sec)
Eiband
Regime
Pilot 63.1 0.023 Severe
Injury
Co-pilot 53.4 0.024 Severe
Injury
Rear
Passenger
27.2 0.021 Moderate
Injury
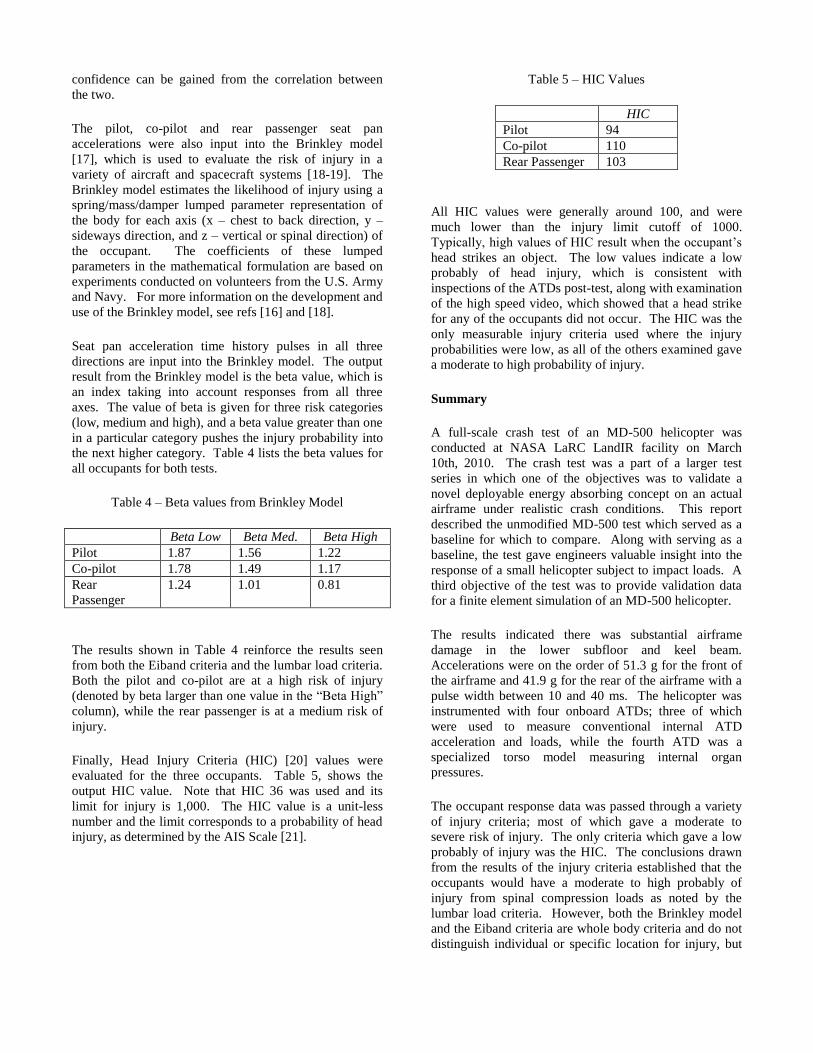
A load cell capable of measuring compressive loading in
the lumbar region was also present in three of the four
onboard occupants. The time histories of these loads are
shown in figure 18. Note that a positive value indicates a
compressive load.
Figure 18 – Occupant Lumbar Loads
The resulting lumbar loads were 1,919, 1,901 and 1,449
lbs for the pilot, co-pilot and rear passenger, respectively.
Lumbar loads were filtered at SAE CFC 600, with
accordance with SAE J211 [16]. The pilot and co-pilot’s
compressive lumbar loads reached similar magnitudes and
durations, presumably because they were seated in similar
mesh bucket seats. The co-pilot reaches the peak value
first, presumably because the helicopter’s right side
impacted first. The rear passenger’s time history is
slightly different due to its position on a bench seat.
The load values are important because FAR Part 27.562
(c) [3] establishes a lumbar limit of 1,500 lb as being
injurious. The loads incurred in the occupants were over
the limit for the front occupants and only slightly below it
for the rear occupant. The lumbar load results agree with
the results seen from the Eiband criteria, suggesting
confidence can be gained from the correlation between
the two.
The pilot, co-pilot and rear passenger seat pan
accelerations were also input into the Brinkley model
[17], which is used to evaluate the risk of injury in a
variety of aircraft and spacecraft systems [18-19]. The
Brinkley model estimates the likelihood of injury using a
spring/mass/damper lumped parameter representation of
the body for each axis (x – chest to back direction, y –
sideways direction, and z – vertical or spinal direction) of
the occupant. The coefficients of these lumped
parameters in the mathematical formulation are based on
experiments conducted on volunteers from the U.S. Army
and Navy. For more information on the development and
use of the Brinkley model, see refs [16] and [18].
Seat pan acceleration time history pulses in all three
directions are input into the Brinkley model. The output
result from the Brinkley model is the beta value, which is
an index taking into account responses from all three
axes. The value of beta is given for three risk categories
(low, medium and high), and a beta value greater than one
in a particular category pushes the injury probability into
the next higher category. Table 4 lists the beta values for
all occupants for both tests.
Table 4 – Beta values from Brinkley Model
Beta Low Beta Med. Beta High
Pilot 1.87 1.56 1.22
Co-pilot 1.78 1.49 1.17
Rear
Passenger
1.24 1.01 0.81
The results shown in Table 4 reinforce the results seen
from both the Eiband criteria and the lumbar load criteria.
Both the pilot and co-pilot are at a high risk of injury
(denoted by beta larger than one value in the “Beta High”
column), while the rear passenger is at a medium risk of
injury.
Finally, Head Injury Criteria (HIC) [20] values were
evaluated for the three occupants. Table 5, shows the
output HIC value. Note that HIC 36 was used and its
limit for injury is 1,000. The HIC value is a unit-less
number and the limit corresponds to a probability of head
injury, as determined by the AIS Scale [21].
Table 5 – HIC Values
HIC
Pilot 94
Co-pilot 110
Rear Passenger 103
All HIC values were generally around 100, and were
much lower than the injury limit cutoff of 1000.
Typically, high values of HIC result when the occupant’s
head strikes an object. The low values indicate a low
probably of head injury, which is consistent with
inspections of the ATDs post-test, along with examination
of the high speed video, which showed that a head strike
for any of the occupants did not occur. The HIC was the
only measurable injury criteria used where the injury
probabilities were low, as all of the others examined gave
a moderate to high probability of injury.
Summary
A full-scale crash test of an MD-500 helicopter was
conducted at NASA LaRC LandIR facility on March
10th, 2010. The crash test was a part of a larger test
series in which one of the objectives was to validate a
novel deployable energy absorbing concept on an actual
airframe under realistic crash conditions. This report
described the unmodified MD-500 test which served as a
baseline for which to compare. Along with serving as a
baseline, the test gave engineers valuable insight into the
response of a small helicopter subject to impact loads. A
third objective of the test was to provide validation data
for a finite element simulation of an MD-500 helicopter.
The results indicated there was substantial airframe
damage in the lower subfloor and keel beam.
Accelerations were on the order of 51.3 g for the front of
the airframe and 41.9 g for the rear of the airframe with a
pulse width between 10 and 40 ms. The helicopter was
instrumented with four onboard ATDs; three of which
were used to measure conventional internal ATD
acceleration and loads, while the fourth ATD was a
specialized torso model measuring internal organ
pressures.
The occupant response data was passed through a variety
of injury criteria; most of which gave a moderate to
severe risk of injury. The only criteria which gave a low
probably of injury was the HIC. The conclusions drawn
from the results of the injury criteria established that the
occupants would have a moderate to high probably of
injury from spinal compression loads as noted by the
lumbar load criteria. However, both the Brinkley model
and the Eiband criteria are whole body criteria and do not
distinguish individual or specific location for injury, but

suggest that the probability of injury to an occupant is
moderate to high.
Full-scale crash testing can further understanding of
events seen during the impact process. It can also provide
valuable data for the evaluation of injury and insights into
vehicle dynamics for use in the future.
References
[1] O'Bryan, T. C., and Hewes, D. E., "Operational
Features of the Langley Lunar Landing Research
Facility," NASA TN D-3828, February 1967.
[2] Jackson, K.E. et al. “A History of Full-Scale
Aircraft and Rotorcraft Crash Testing and
Simulator at NASA Langley Research
Center.” NASA TM 2004-178862. 2004.
[3] Code of Federal Regulations. Federal Aviation
Regulations for Aviation Maintenance
Technicians FAR AMT, Part 27 Airworthiness
Standard: Normal Category Rotorcraft, 27.562
Emergency Landing Dynamics.
[4] Code of Federal Regulations. Federal Aviation
Regulations for Aviation Maintenance
Technicians FAR AMT, Part 29 Airworthiness
Standard: Transport Category Rotorcraft,
29.562 Emergency Landing Dynamics.
[5] Society of Automotive Engineers.
“Performance Standard for Seats in Civil
Rotorcraft, Transport Aircraft, and General
Aviation.” SAE AS8049a. July 1990.
[6] Kellas S., “Deployable Rigid System for Crash
Energy Management,” US Patents 6,755,453,
June 29, 2004, 6,976,729 December 20, 2005,
and 7,040,658 May 9 2006.
[7] Kellas S. and Jackson K. E., “Deployable
System for Crash-Load Attenuation,”
Proceedings of the 63rd AHS Annual Forum,
Virginia Beach, VA. May 1-3, 2007.
[8] Kellas S. and Jackson K.E., “Multi-Terrain
Vertical Drop Tests of A Composite Fuselage
Section.” Proceedings of the 64th
Annual AHS
Forum, Montreal, Canada. April 29-May 1,
2008.
[9] Kellas, S., Jackson, K., and Littell, J., "Full
Scale Crash Test of a MD 500 Helicopter with
Deployable Energy Absorbers," Proceedings
of the 66th AHS Annual Forum, Phoenix, AZ,
May 11-13, 2010.
[10] Annett, M. S., Polanco, M. A., “System-
Integrated Finite Element Analysis of a Full-
Scale Helicopter Crash Test with Deployable
Energy Absorbers,” Proceedings of the
American Helicopter Society 66th
Annual
Forum, Phoenix, AZ, 11-13 May, 2010.
[11] Gowdy, V. et al. “A Lumbar Spine
Modification to the Hybrid III ATD for
Aircraft Seat Tests”. SAE 1999-01-1609.
1999.
[12] Roberts, J., et al., “Computational and
Experimental Models of the Human Torso for
Non Penetrating Ballistic Impact.” Journal of
Biomechanics, Vol. 40, pp. 125-136, 2007.
[13] Military Standard, MIL-STD-1290A (AV),
Light Fixed- and Rotary-Wing Aircraft Crash
Resistance, Department of Defense,
Washington DC, 20301, 26 September 1988.
[14] Littell, J.D. “Large Field Photogrammetry
Techniques in Aircraft and Spacecraft Impact
Testing” Proceedings from the Society of
Experimental Mechanics Annual Conference.
Indianapolis IN. June 7-10, 2010.
[15] Eiband, A.M. “Human Tolerance to Rapidly
Applied Accelerations: A summary of the
Literature,” NASA Memorandum 5-19-59E.
1959.
[16] Society of Automotive Engineers. “Surface
Vehicle Recommended Practice:
Instrumentation for Impact Test-Part 1-
Electronic Instrumentation”. SAE J211-1,
July 2007.
[17] Brinkley, J.W., Specker, L.J., and Mosher,
S.E., “Development of Acceleration Exposure
Limits for Advanced Escape Systems.”
NATO AGARD Proceedings, AGARD-CP-
472, February 1990.
[18] Jackson K. E. et al. “Occupant Responses in a
Full-Scale Crash Test of the Sikorsky ACAP
Helicopter”. Journal of the American
Helicopter Society, Vol 49, No. 2. April 2004.
[19] Lawrence C. et al. “The Use of Vehicle
Acceleration Exposure Limit Model and a
Finite Element Crash Test Dummy Model to
Evaluate the Risk of Injuries During Orion
Crew Module Landings”. NASA TM 2008-
215198. 2008.
[20] U.S. Department of Transportation. “Federal
Motor Vehicle Safety Part 571, Standard 208 –
Occupant Crash Protection.”
www.fmcsa.dot.gov. Accessed 11-12-10.
[21] States, J.D. “The Abbreviated and the
Comprehensive Research Injury Scales”.
SAE 690810. 1969.
Top Related