


Languages
Pages
Legal


Disclaimer & Disclosures: This report must be read with the disclosures and the analyst certifications in the Disclosure appendix, and with the Disclaimer, which forms part of it
https://www.research.hsbc.com
Play interview with Ashim Paun
Fragile PlanetScoring climate risks around the world
We rank 67 countries for their vulnerability to climate change
India and other South and South-East Asian countries are most at risk…while Nordic countries are best placed
We highlight the risks for investors as countries move towards a lower carbon future
CLIMATE CHANGEGLOBALMarch 2018
By: Ashim Paun, Lucy Acton and Wai-Shin Chan

1
CLIMATE CHANGE ● GLOBAL
March 2018
We rank 67 developed, emerging, and frontier market countries for
their vulnerability to climate change risks
Physical impacts, transition to low-carbon economies and the funds
to respond to climate change are all key to this analysis
India and other South and South-East Asian states are the most
vulnerable to climate risks overall
Climate risk exposure
All countries are being impacted by climate change but some are facing much more acute
challenges than others. So we are returning to a theme we have addressed before: identifying
and scoring the countries that are most exposed to climate change risks, as well as those best
placed to respond to them.
Climate change manifests through rising temperatures, can alter hydrological (water) cycles and
exacerbates extreme weather events. In turn this means higher risks to energy, food and water
systems, populations and the global economy. Over 2030 to 2050, the World Health
Organisation (WHO) expects 250,000 additional deaths per year due to climate change.
Furthermore, as the world seeks to limit climate change, we believe a combination of climate
policy and disruptive cleaner technologies, which do not use fossil fuels (particularly in the
power and transport sectors), mean that the peak for fossil fuel demand may arrive in the
coming years. In this report, we look at which countries are most vulnerable to climate change –
in terms of both the physical impacts and the associated energy transition risks – and which are
better placed to respond to these pressures.
Our key findings are as follows: India, followed by Pakistan and the Philippines, are the
most vulnerable countries to climate change. South and South-East Asian countries
account for five of the ten most vulnerable countries. Countries from the Middle East,
Latin America and Africa are also in this group. The full rankings can be found on page 5.
Developed market countries in general rank better, with Israel (12th) the most vulnerable
DM country and Australia next at 29th. Finland, Sweden and Norway, followed by Estonia
and New Zealand, are the five least vulnerable countries. The world map on page 2 picks
out more of our key findings.
What we’ve done in this report
This is our most comprehensive assessment yet. In our last analysis, Scoring Climate Risk, 23
March 2016, we only looked at the G20 countries. This time, in response to client demand, we
have broadened our coverage to all countries in the MSCI Developed, Emerging and Frontier
Market definitions (except for Hong Kong and Taiwan, where some key data gaps would have
skewed our rankings). The 67 countries now captured represent almost one-third of the
world’s nation states, but 80% of the global population and 94% of global GDP.
Executive Summary
From physical factors to
socio-economic risks
South and SE Asian
countries are most
vulnerable overall
67 countries covered
14 March – 27 April
If you value our service and insight,vote for HSBC
Click here to vote
Vote in Extel 2018
2
CL
IMA
TE
CH
AN
GE
● G
LO
BA
L
Ma
rch 2
018
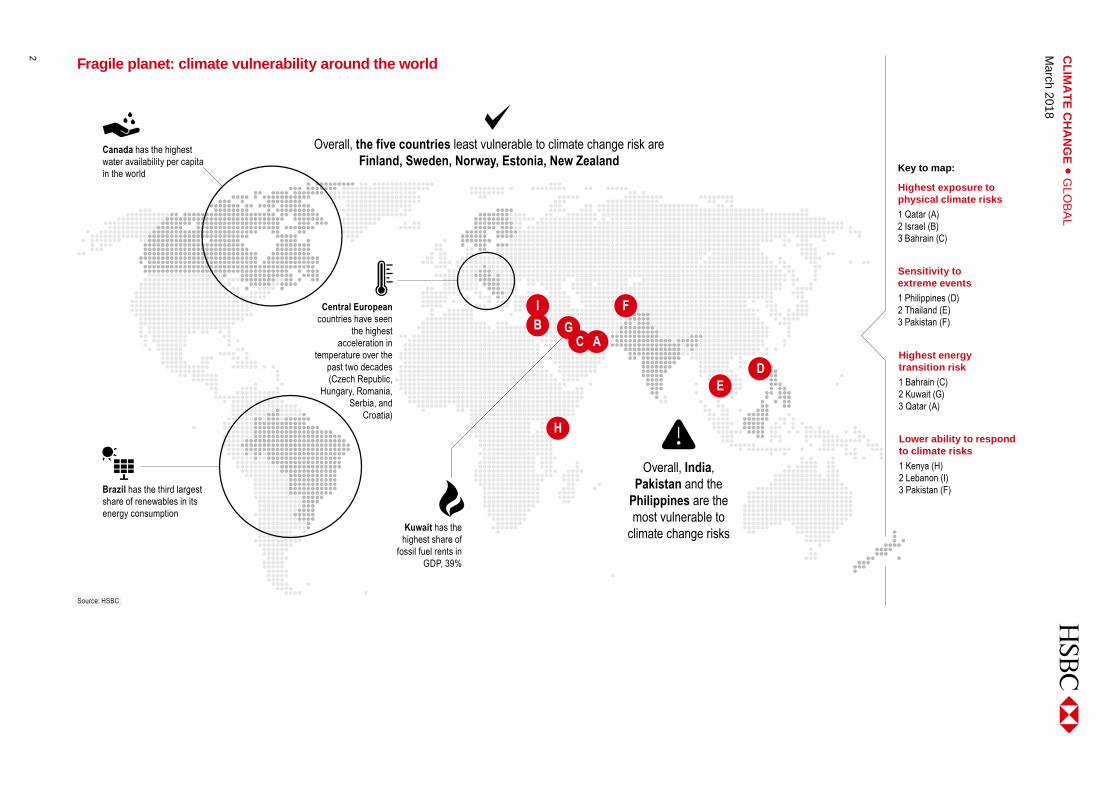
Fragile planet: climate vulnerability around the world
Source: HSBC
Canada has the highest
water availability per capita
in the world
Central European
countries have seen
the highest
acceleration in
temperature over the
past two decades
(Czech Republic,
Hungary, Romania,
Serbia, and
Croatia)
Brazil has the third largest
share of renewables in its
energy consumption
Overall, the five countries least vulnerable to climate change risk are
Finland, Sweden, Norway, Estonia, New Zealand
Overall, India,
Pakistan and the
Philippines are the
most vulnerable to
climate change risksKuwait has the
highest share of
fossil fuel rents in
GDP, 39%
I
H
D
E
F
CG
AHighest energy
transition risk
1 Bahrain (C)
2 Kuwait (G)
3 Qatar (A)
Lower ability to respond
to climate risks
1 Kenya (H)
2 Lebanon (I)
3 Pakistan (F)
Highest exposure to
physical climate risks
1 Qatar (A)
2 Israel (B)
3 Bahrain (C)
Sensitivity to
extreme events
1 Philippines (D)
2 Thailand (E)
3 Pakistan (F)B
Key to map:

3
CLIMATE CHANGE ● GLOBAL
March 2018
The other big change is in our methodology. We calculate a country’s overall vulnerability by
assigning equal weights (25%) to each of four indicators: (1) physical impacts; (2) sensitivity to
extreme weather events; (3) energy transition risks; and (4) a country’s potential to respond to
climate change, covering financial resources and national governance indicators (see Figure below).
The main addition from last time is transition risk – the challenges faced by countries around the
world as they attempt to mitigate climate change risks and move towards a lower carbon
economy. We attempt to gauge this by looking at the diversification of the economy, energy
consumption and exports away from carbon and towards clean energy forms.
To conclude this work we want to understand which countries are most vulnerable to
climate change overall. We have assigned each country a score under each of the four
indicators. We pull all our findings together to provide an overall climate vulnerability ranking,
which can be found in Table 1 on page 51. The full methodology is discussed in detail in
Appendix 1, with a full set of indicators in Appendix 3.
An analysis to complement global climate initiatives
We believe this work will aid understanding of climate risk profiles in light of the Paris Agreement
adopted in December 2015 by Parties to the UNFCCC and ratified in 2016. The Agreement aims
to strengthen the global response to the threat of climate change, including by: holding the
increase in global average temperature to well below 2°C above pre-industrial levels (in 2100);
______________________________________ 1 A lower score implies a higher vulnerability for any indicator. For the overall score, we have weighted the
four categories of scores equally, and added them together, to arrive at a final vulnerability score for each of the 67 countries. This enables us to rank the countries from most to least vulnerable.
Four categories for our factor
analysis
HSBC methodology for scoring climate vulnerability
Source: HSBC
An overall ranking
Commonality with the Paris
Agreement

CLIMATE CHANGE ● GLOBAL
March 2018
4
increasing the ability to adapt to the adverse impacts of climate change and foster climate
resilience, and; making finance flows consistent with a pathway towards low greenhouse gas
emissions and climate resilient development. Our analysis covers these three core pillars.
The Intergovernmental Panel on Climate Change (IPCC) characterises climate vulnerability as a
function of exposure to climate impacts and sensitivity to these, as well as the capacity to adapt.
Meanwhile, the Financial Stability Board Task Force on Climate-related Financial Disclosures
(TCFD), established to develop climate-related financial risk disclosures, considers physical and
transition risks (as well as liability risks) associated with climate change. We believe our analysis
captures the essence of these definitions and therefore allows an understanding of broad national
climate vulnerability, which is aligned with the focus of these important institutions.
We therefore believe this analysis will be useful for investors, highlighting the challenges which
lie ahead for countries in transitioning economies onto lower-carbon trajectories and adapting to
the physical impacts of climate change. In our view, investors can use our analysis to gain a
fuller understanding of national risk profiles, potential for disruption to supply and demand, risks
to operations, capital expenditure, supply chains and customers, and broadly the challenges to
the long-term sustainable development of countries and protection of their people, environment
and economies.
A valuable analysis for
investors

5
CLIMATE CHANGE ● GLOBAL
March 2018
Table 1: Overall climate vulnerability (lower score = higher vulnerability) Physical impacts Sensitivity to extreme
events Energy transition risk Potential to respond to
climate risks Overall climate vulnerability
Country Score Rank Score Rank Score Rank Score Rank Score Rank Market
Weights 25% 25% 25% 25%
India 3.84 17 1.67 7 4.34 20 2.54 10 3.10 1 EM Pakistan 3.55 13 0.93 3 6.43 58 1.87 3 3.19 2 EM Philippines 3.64 15 0.37 1 6.17 52 2.63 11 3.20 3 EM Bangladesh 4.49 24 1.16 5 5.17 34 2.48 8 3.33 4 FM Oman 2.89 7 2.09 9 2.85 4 5.62 45 3.36 5 FM Sri Lanka 3.99 19 1.04 4 6.42 57 2.03 4 3.37 6 FM Colombia 6.11 49 2.16 10 3.05 8 2.72 16 3.51 7 EM Mexico 4.43 23 3.10 15 4.38 22 2.37 7 3.57 8 EM Kenya 2.90 8 3.15 16 6.63 61 1.74 1 3.60 9 FM S Africa 3.80 16 4.39 29 3.90 14 2.63 12 3.68 10 EM Thailand 5.43 37 0.82 2 5.37 40 3.36 22 3.74 11 EM Israel 2.23 2 3.94 27 4.18 16 4.66 35 3.75 12 DM Lebanon 3.30 12 6.06 44 3.86 13 1.81 2 3.76 13 FM Vietnam 5.10 31 1.34 6 5.47 44 3.25 20 3.79 14 FM Nigeria 3.01 9 5.25 38 5.09 32 2.54 9 3.97 15 FM Morocco 4.02 21 4.67 33 5.07 30 2.69 14 4.11 16 FM Indonesia 5.10 30 3.84 25 4.98 29 2.69 14 4.15 17 EM Egypt 3.09 10 7.13 53 4.41 23 2.13 5 4.19 18 EM Brazil 6.03 47 3.54 20 5.09 31 2.16 6 4.21 19 EM Serbia 6.07 48 2.37 13 5.44 43 3.30 21 4.30 20 FM Malaysia 5.10 32 4.72 34 3.00 7 4.44 31 4.32 21 EM Peru 6.37 55 3.90 26 4.30 19 2.97 17 4.38 22 EM Bahrain 2.31 3 8.52 61 1.84 1 5.02 37 4.42 23 FM S Arabia 2.81 6 5.51 39 2.87 5 6.51 52 4.42 24 EM Greece 5.59 40 4.54 30 4.21 17 3.38 23 4.43 25 EM China 6.48 56 1.96 8 5.14 33 4.25 30 4.46 26 EM Tunisia 4.05 22 7.13 53 4.11 15 2.65 13 4.49 27 FM Argentina 6.15 50 4.58 32 5.26 37 3.00 19 4.75 28 FM Australia 5.72 41 2.28 12 3.12 9 7.93 65 4.76 29 DM Mauritius 4.00 20 6.67 48 4.81 27 3.84 25 4.83 30 FM UK 4.95 29 3.66 23 5.37 41 5.43 41 4.85 31 DM Poland 5.38 36 3.58 21 5.24 36 5.22 40 4.86 32 EM Qatar 2.06 1 8.52 61 2.74 3 6.14 49 4.86 33 EM Czech Rep. 3.92 18 3.28 18 6.37 55 5.97 46 4.88 34 EM Russia 7.78 66 3.70 24 3.70 12 4.44 31 4.90 35 EM Portugal 5.99 46 4.54 31 5.17 35 4.01 27 4.93 36 DM Kuwait 2.51 4 8.52 61 2.50 2 6.34 50 4.97 37 FM Jordan 3.24 11 8.52 61 5.32 38 2.97 18 5.01 38 FM USA 6.78 58 2.18 11 4.58 24 6.60 54 5.04 39 DM Belgium 4.51 25 5.21 37 4.76 26 5.97 46 5.11 40 DM Kazakhstan 6.31 54 6.04 43 2.97 6 5.13 38 5.11 41 FM Japan 5.93 45 5.03 36 4.36 21 5.15 39 5.12 42 DM France 4.84 28 3.21 17 7.05 66 5.47 42 5.14 43 DM Hungary 6.15 50 3.61 22 6.73 62 4.16 29 5.16 44 EM Romania 6.30 52 4.03 28 6.17 53 4.57 33 5.27 45 FM Slovenia 5.81 43 3.52 19 6.17 51 5.58 44 5.27 46 FM Italy 5.24 33 6.30 46 5.95 48 3.71 24 5.30 47 DM Turkey 4.53 26 7.01 52 5.62 45 4.05 28 5.30 48 EM UAE 2.57 5 8.52 61 3.32 10 6.94 57 5.34 49 EM Croatia 6.30 52 6.07 45 5.67 46 3.99 26 5.51 50 FM Chile 7.50 64 2.82 14 6.57 59 5.54 43 5.61 51 EM Singapore 3.56 14 8.52 61 4.21 17 7.20 60 5.87 52 DM Spain 5.93 44 6.84 50 6.19 54 4.57 34 5.88 53 DM Germany 5.57 38 5.69 40 5.97 49 6.40 51 5.91 54 DM Lithuania 6.76 57 6.73 49 5.41 42 4.98 36 5.97 55 FM Netherlands 5.58 39 7.78 56 3.63 11 6.92 56 5.98 56 DM S Korea 5.28 35 6.46 47 4.98 28 7.44 64 6.04 57 EM Austria 5.73 42 6.03 42 6.75 63 6.53 53 6.26 58 DM Canada 8.22 67 4.91 35 5.32 39 6.96 58 6.35 59 DM Switzerland 5.25 34 6.94 51 7.18 67 6.75 55 6.53 60 DM Denmark 4.57 27 8.36 59 6.58 60 7.41 63 6.73 61 DM Ireland 6.78 58 7.48 55 6.04 50 7.28 62 6.89 62 DM New Zealand 7.07 60 5.69 40 6.78 64 8.19 66 6.93 63 DM Estonia 7.24 63 8.34 58 6.80 65 5.97 48 7.09 64 FM Norway 7.12 61 8.03 57 4.68 25 9.03 67 7.21 65 DM Sweden 7.18 62 8.39 60 6.38 56 7.18 59 7.28 66 DM Finland 7.50 64 8.52 61 5.94 47 7.26 61 7.30 67 DM
Source: HSBC; Note: DM= developed market, EM= emerging market, FM= frontier market

CLIMATE CHANGE ● GLOBAL
March 2018
6
Why is this important to investors? 7
Physical impacts 8
Exposure to higher temperatures 9
Water availability 11
Extreme weather events 14
Sensitivity to extreme events 17
Economic costs associated with extreme weather events 17
People affected and fatalities 18
Flooding events dominant again in 2017 19
Energy transition risks 22
Fossil fuels and the Paris Agreement 22
Looking forward – energy growth, but fossils contraction? 23
Diversification as a response 27
Potential to respond to climate risks 35
Who can fund climate ambition? 35
Institutional quality metrics to gauge national governance potential 37
Who has the potential to respond to climate change? 38
Vulnerability – final thoughts 40
Wider features of the global climate response 40
Final thoughts: why countries must transition and adapt now 41
References 43
Appendix 1 − Methodology 44
Appendix 2 – notes 49
Appendix 3 – vulnerability indicators 50
Appendix 4 – MSCI market classifications 51
Appendix 5 – Country INDCs 52
Appendix 6 – full datasets 56
Disclosure appendix 61
Disclaimer 64
Contents
We acknowledge the contribution of Abhishek Kumar, Associate, Bangalore in the preparation of this report

7
CLIMATE CHANGE ● GLOBAL
March 2018
Why is this important to
investors?
Monitoring individual country vulnerability to climate change factors is, in our view, important to
investors for reasons including:
Inflation: Climate effects could impact food or energy output, driving up prices (see Less
bread for your dough, August 2012).
Attractiveness of foreign direct investment (FDI): Smarter globalised companies are
incorporating climate factors into operational growth strategies. Regions with low
vulnerability to extreme events driven by climate change carry less risk.
Balance of payments: Countries with high exposure to climate factors could face higher
trade deficits as companies choose to source goods from other countries where climate
risks are lower to mitigate supply chain disruption.
Short-run growth: Damage costs from extreme climate events are a drag on economic
growth, and create extra growth volatility. According to EMDAT, damage costs relating to
extreme events in the G20 totalled USD309bn in the decade to 2014, up from USD260bn in
the decade to 2012.
Long-run growth: The depletion of natural capital hurts overall productivity (e.g. water
depletion can increase the cost of energy), translating into the ability of generating long-
term sustainable growth.
Supply chain disruption: Provision of goods and services may be disrupted, putting
pressure further along production chains. One such example we looked at was how water
scarcity can disrupt production of soft commodities, specifically cotton (see Cotton &
Climate, 19 June 2016).
Infrastructure investment requirements: Countries will need to invest in power, transport,
waste and buildings infrastructure to be resilient to high probability extreme weather events and
slow-onset climate-driven physical factors. Water infrastructure is also very important. The
consequences of ‘water stress’ depend to a great extent on how efficiently the resource is
managed (see Appendix 2). HSBC economists have written about the need for an “infrastructure
revolution” under a global low carbon transition in Re-energising the world, 8 January 2018.
Social risks: Climate change has been given as one factor behind incidences of large-
scale migration and conflict, such as in Syria and Mali, highlighting the requirements to
understand the nature of exposure to countries where social impacts occur.
Inequality: The poorer regions of the world, concentrated in the tropics, are more
susceptible to climate impacts. Poorer populations within countries are also likely to be less
able to adapt. Evidence also shows that women are often more affected by climate impacts
in many developing nations.
Health issues: Higher temperatures and changing water patterns increase the public
health risk (see Climate adaptation, 4 October 2016).
Understanding climate risks
is important in understanding
a raft of socio-economic
country factors

CLIMATE CHANGE ● GLOBAL
March 2018
8
The impacts of climate change are no longer a future risk – they’re happening here and now.
This is reflected in scientific evidence, which shows rising temperatures in a majority of
countries, changes to the hydrological cycle leading to water scarcity, and increasing severity
and likely also frequency of natural events. We have observed that the rise in impacts and the
need to adapt to these has become more prevalent on the global climate policy agenda. A key
pillar of the Paris Agreement captures this:
Increasing the ability to adapt to the adverse impacts of climate change and foster
climate resilience and low greenhouse gas emissions development, in a manner that does
not threaten food production
In this section we look at the countries which are most exposed to the impact of rising
temperatures, changes to the hydrological cycle leading to water scarcity, and increases in the
severity and frequency of natural events.
METHODOLOGY: We have based our scoring of physical climate impacts on three main
parameters: temperature levels (35% of the score), water availability (50%) and extreme
weather events (15%). We have assigned a higher weight to water as the impact of climate
change on water resource will be experienced by almost every region. Our methodology is
described in greater detail in Appendix 1.
FINDINGS: Qatar is most exposed to physical impacts overall, followed by Israel, and
then Bahrain, with the seven most exposed all in the MENA region. We find that the least
exposed country is Canada, followed by Russia and then neighbouring Finland. Table 3 gives
the indicators and overall rankings for physical risk exposure. (Overall physical risk data is
captured in Appendix 6.)
Physical impacts
Climate change manifests through rising temperatures, can alter
water cycles and exacerbates extreme weather events
For the majority of countries, these metrics are worsening
We find Qatar to be most exposed and a similar trend across the
MENA region
Scientific and policy focus on
the impacts of climate
change

9
CLIMATE CHANGE ● GLOBAL
March 2018
Exposure to higher temperatures
METHODOLOGY: We’ve incorporated two metrics in our analysis – the average absolute
temperature in the decade 2006-2015 and the change in average temperatures between 1996-
2005 and 2006-2015. We have used country level temperature data provided by the World
Bank which averages values recorded at multiple stations.
Absolute temperature levels: As described in the methodology section (Appendix 1), for the
purpose of scoring in this report, we have considered higher average temperatures as an
indicator of higher climate exposure. Chart 1 shows absolute average temperature levels of
sample countries recorded during 2006-2015. High temperatures mean higher risks. Qatar and
Bahrain experienced the highest average annual temperatures from our sample at 28.2ºC,
with Singapore third at 27.9ºC.
There are several reasons to consider countries in hotter regions to be more exposed than
those in colder regions, in our view. Countries in the tropics experience a lower seasonal
variation in temperature than those in temperate (colder) regions. There are a number of
associated impacts. Warmer temperatures and wetter conditions can drive the spread of
diseases, including insect-borne diseases like malaria and dengue fever, tick-borne Lyme’s
disease and a number of waterborne parasites (we described and discussed climate-
exacerbated health risks in Climate adaptation, 4 October 2016).
Large-scale subsistence farming in the tropics, where many EM and FM countries are, means
larger populations are exposed to climate impacts on agriculture. We think that even though the
cost of climate change will vary between the regions, it will be disproportionately high for
countries in the tropics, many of which are classified emerging and frontier. According to the UN
Intergovernmental Panel on Climate Change (IPCC), crop yields could decline as much as 50%
in such countries in the next 30-35 years. (Conversely, warmer conditions in cold countries
mean crop growing seasons can be longer, a potential benefit.) As the weather in temperate
regions rises, energy demand for heating may decline, but extreme heat in more populous
regions closer to the equator may see energy demand for cooling soar.
Higher temperatures bring
associated health risks
Chart 1: Average temperature over 2006-2015
Source: World Bank
-6
0
6
12
18
24
30
Sin
gapo
reA
ustr
alia
Isra
elU
KP
ortu
gal
Spa
inIta
lyF
ranc
eJa
pan
Bel
gium
Net
herla
nds
New
Zea
land
Ger
man
yIr
elan
dD
enm
ark
US
AS
witz
erla
ndA
ustr
iaS
wed
enF
inla
ndN
orw
ayC
anad
aQ
atar
UA
ET
haila
ndIn
done
sia
Phi
lippi
nes
Mal
aysi
aS
Ara
bia
Bra
zil
Indi
aC
olom
bia
Egy
ptM
exic
oP
akis
tan
Per
uS
Afr
ica
Cze
ch R
ep.
Gre
ece
Tur
key
Kor
eaH
unga
ryP
olan
dC
hile
Chi
naR
ussi
aB
ahra
inN
iger
iaS
Lan
kaK
uwai
tO
man
Ban
glad
esh
Ken
yaV
ietn
amM
aurit
ius
Tun
isia
Jord
anM
oroc
coLe
bano
nA
rgen
tina
Cro
atia
Ser
bia
Rom
ania
Slo
veni
aLi
thua
nia
Kaz
akhs
tan
Est
onia
DM EM FMoC

CLIMATE CHANGE ● GLOBAL
March 2018
10
Temperature change between decades: Among the countries analysed, 57 witnessed an
increase in the average temperature during the 2006-15 period over previous decade while 10
saw a decline during the time period (chart 3). Temperature declines were smaller in magnitude
than temperature rises. Across the countries analysed here, the change in temperature
was the highest in Czech Republic at 1.4oC and the lowest in Ireland at -0.2oC.
If a country experiences high temperatures, this requires an adaptive response. If it is getting
hotter, then this presents an adaptation challenge as the country must be prepared for
conditions which are changing and associated factors are also increased. Chart 2 shows
temperatures rising over time since the late 19th century.
The global temperature is making new highs almost every
year − eight of the 10 highest global average temperature
records were registered over 2007-2016.
Chart 2: Average global temperature
Source: NOAA
Eight of the ten hottest years were in the past decade, although the rate of increase is lower during
2007-2016 at 0.15oC compared to 0.21oC during 1997-2006. For most of our sample countries,
the average temperature is on an upward trajectory that aligns closely with the global trend shown
in Chart 2. Chart 3 captures the change in temperature for countries in our sample, as well as the
momentum. If the rate at which it is getting hotter is increasing, this will present an even bigger
challenge for systems, structures and planning. The highest acceleration was observed in Central
European countries − Czech Republic, Hungary, Austria, Serbia and Croatia are the top five
where the temperature increase sped up the most, i.e. the momentum was greatest, in the range
of 0.2-0.4oC. Overall temperature data is captured in Table i in Appendix 6.
13.5
13.7
13.9
14.1
14.3
14.5
14.7
14.9
1886
1896
1906
1916
1926
1936
1946
1956
1966
1976
1986
1996
2006
2016
Absolute temperature Decadal averageoC
High temperatures present a
challenge, rising
temperatures exacerbate this
Getting hotter… 57 countries
recorded a decadal rise in
temperature, 10 saw a decline
Highest acceleration in
temperatures seen in Central
and Eastern Europe

11
CLIMATE CHANGE ● GLOBAL
March 2018
Chart 3: Temperature − change vs. momentum
Source: World Bank; Note: not all countries are labelled here. Change related to % changed in decadal averages (1996-2005 and 2006-2015).
Water availability
METHODOLOGY: This report measures exposure to water stress by evaluating the amount of
water resources available per person. The impact of climate change on water resource availability
will be felt through a change in the water-cycle that will be experienced by almost every region.
Consequently we have assigned a higher weight to water than the temperature metrics or
extreme events. Data is taken from the Food & Agriculture Organisation (FAO). We use two
indicators in scoring: annual renewable water resource available per capita in 2016, and; an
assessment of the change in water resources between decades.
The impact of climate change on water resource availability will be felt through a change in the
water-cycle that will be experienced by almost every region. We believe water availability is key
to economic growth, social stability and the preservation of natural capital like flora and fauna.
The impacts of water supply disruption are felt quickly by societies, through impairment of
subsistence agriculture and economic activity. Availability of water resources forms an important
part of our assessment – we believe it is harder to adapt to lack of water than to inclement
temperatures, at least in a shorter timeframe, although of course the two are linked.
We have measured ‘water stress’ by the amount of water resources available per person. The
UN classifies the regions having annual water availability below 1,700m3 per person as water
stressed, below 1,000m3 per person as facing water scarcity and below 500m3 as facing
‘absolute scarcity’.
700m Population experiencing water scarcity,
projected to hit 1.8bn by 2025
Singapore
Australia
UK France
Japan
Netherlands
Germany
Ireland
DenmarkUSA
Austria
Finland
DM average
Qatar
IndonesiaMalaysia
India
Mexico
Czech Rep.
Greece
Turkey
Hungary
Poland
ChinaRussia
EM average
Mauritius
Croatia Serbia
RomaniaSlovenia
Lithuania
FM average
-0.2
-0.1
0.0
0.1
0.2
0.3
0.4
-0.2 0.0 0.2 0.4 0.6 0.8 1.0 1.2 1.4
DM EM FMMomentum (oC)
Change (oC)
Higher weighting for water –
it’s fundamental for growth
and stability

CLIMATE CHANGE ● GLOBAL
March 2018
12
Around 700m people currently suffer from water scarcity (UN2) – estimates suggest that, by
2025, 1.8bn people will suffer from scarcity, while two-thirds of the world’s population will be
under water-stressed conditions. The UN has stated that climate change means almost half the
world's population will be living in areas of high water stress by 2030. Sub-Saharan Africa has
the largest number of water-stressed countries of any region.
We score exposure to water stress by evaluating two factors: level of annual renewable water
resource available per capita and the change over time. Chart 4 gives a detailed analysis of
water resources per capita, their changes and the rates of change.
(1) Water availability per capita
Kuwait is the country in our sample with the lowest water-availability per capita, with a
value of 5m3/person/year. Among the developed and emerging markets Singapore
(107m3/person/yr) and the UAE (16m3/person/yr) respectively have the lowest per capita
water availability. Water availability can change because of demand or supply variation. On
the demand side, this can be due to a growing population and/or a population with higher water
use (for instance a more affluent country). In terms of supply, droughts and changing
hydrological patterns can limit supply, while investment in water infrastructure, changes in
economic activity and higher rainfall can increase supply (see Note 1 in Appendix 2).
The 67 countries analysed here had an average decline in per person water availability of 10%
between 2006 and 2016. Overall, levels were 2% below the 2014 value we reported in our 2016
Scoring Climate Risk report. Overall water availability is captured in Chart 5 and further data is
in Table ii in Appendix 6.
______________________________________ 2 International Decade for Action ‘ Water for Life’ 2005-2015, UNDESA, Weblink: http://www.un.org/waterforlifedecade/scarcity.shtml; accessed on 30 January 2018
Soaring number of people
expected to face water
shortages globally
Chart 4: Water availability − change vs. momentum
Source: Aquastat, FAO, World Bank.
Singapore
Australia
UK
Germany
USA
DM average
Qatar
UAE
IndonesiaS Arabia BrazilIndia
EgyptPakistan
S Africa
Greece
China
Russia
EM average
Bahrain
Kuwait
Oman
KenyaJordan Lebanon
Croatia
LithuaniaEstonia
FM average
-6
-4
-2
0
2
4
6
8
10
12
14
-70 -60 -50 -40 -30 -20 -10 0 10 20
DM EM FMMomentum (%)
Change (%)

13
CLIMATE CHANGE ● GLOBAL
March 2018
(2) Change of water availability per capita
Eight of the ten countries that saw the highest decline in water availability over the last
decade are located in the Middle East, as denoted by the pink circle in chart 4. Kuwait’s
renewable water availability is ~5m3/capita/year, and yet its people consume 34 times this
amount. These countries witnessed a c20-60% decline in available resources over the past
decade, due mostly to rapid increases in their population. Several countries have water
abundance of over 5,000 m3 per capita (which the vertical Y axis on the chart goes up to). For
example, Canada has the most water resources, at c.80,000 m3 per capita, 978 times more
than in Saudi Arabia and 16,000 times more than Kuwait3. Such countries’ very high levels of
water scarcity mean they need to make greater efforts to increase water availability, conserve it
and use it more efficiently. Kuwait largely secures its requirement of potable water through
desalination. Saudi Arabia has also increased its desalination capacity greatly over the past
decade (see Scoring Climate Risk 2013). Table ii in Appendix 6 gives data water availability
based on the 2016 and 2018 results.
Globally, the population is projected by the United Nations to continue to increase for the rest of
this century, exacerbating pressures on global per capita water availability.
16,200x Canada’s renewable water resources per
capita vs Kuwait’s
Country level water statistics, which show water availability per capita on a country basis, are
important for gauging broad structural risks faced. In many cases, centralised policy-making will
indeed provide remedies to scarcity, in our view. However, we think the distribution of water
resources within a country, and crucially whether water is located in the regions with high water
demand from competing sectors, poses specific risks to local communities and economic
activity. We think understanding localised operating risks and reputational risks associated with
______________________________________ 3 Internal Renewable Water Resources (IRWR): Long-term average annual flow of rivers and recharge of aquifers generated from endogenous precipitation. Double counting of surface water and groundwater resources is avoided by deducting the overlap from the sum of the surface water and groundwater resources.
Chart 5: Water availability per capita
Source: Aquastat, FAO, World Bank; Note: the y-axis values are shown between 0-5,000m3/person/yr. The actual values for several countries are higher than the upper limit shown in the chart
Worsening MENA water
scarcity
Water pressures can play out
at the sub-national level
0
1,000
2,000
3,000
4,000
5,000
Can
ada
Nor
way
New
Zea
land
Aus
tral
iaF
inla
ndS
wed
enIr
elan
dU
SA
Aus
tria
Por
tuga
lS
witz
erla
ndN
ethe
rland
sJa
pan
Italy
Fra
nce
Spa
inU
KG
erm
any
Bel
gium
Den
mar
kIs
rael
Sin
gapo
reP
eru
Chi
leC
olom
bia
Bra
zil
Rus
sia
Mal
aysi
aH
unga
ryIn
done
sia
Tha
iland
Gre
ece
Phi
lippi
nes
Mex
ico
Tur
key
Chi
naP
olan
dIn
dia
Kor
eaP
akis
tan
Cze
ch R
ep.
S A
fric
aE
gypt
S A
rabi
aQ
atar
UA
EC
roat
iaS
erbi
aA
rgen
tina
Slo
veni
aR
oman
iaE
ston
iaV
ietn
amLi
thua
nia
Ban
glad
esh
Kaz
akhs
tan
S L
anka
Mau
ritiu
sN
iger
iaM
oroc
coLe
bano
nK
enya
Tun
isia
Om
anJo
rdan
Bah
rain
Kuw
ait
DM EM FMm3/person/yr.At least 5000 . At least 5000 . At least 5000 .
CLIMATE CHANGE ● GLOBAL
March 2018
14
companies is crucial for investors, especially where companies are using scarce water
resources in operations, as well as measures taken by companies to manage their water-related
risks. We discussed water supply and demand dynamics in No water, more trade-offs, 24
August 2015, and also looked at the pressures of sub-national water availability on cotton
production in India and China in Cotton and climate, 19 July 2016.
Extreme weather events
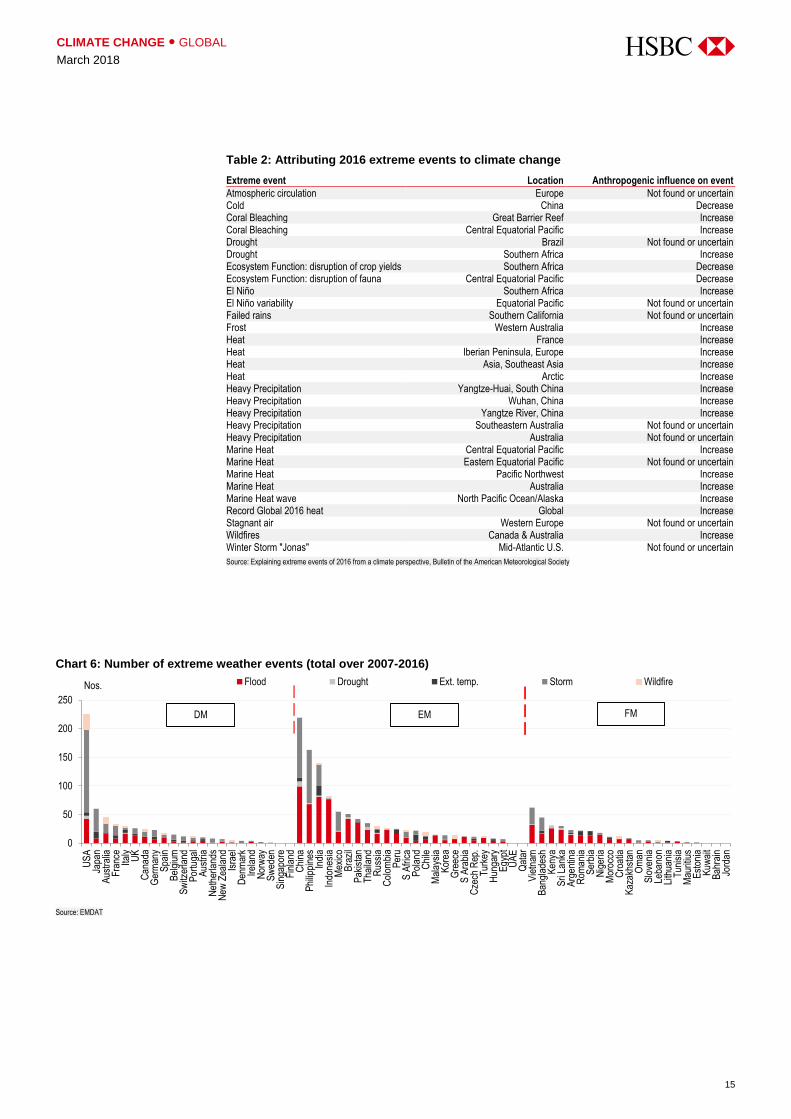
METHODOLOGY: We look at the frequency of extreme weather events for our scoring analysis.
For our analysis, we have observed the number of extreme events over a ten-year period,
defined as droughts, floods, extreme temperatures, storms and wildfires, normalised by
adjusting for land mass. Overall numbers per country can be seen in Chart 6.
Scientists are increasingly studying evidence for the growing anthropogenic influence on
extreme weather events (rather than that of natural factors). A paper from the American
Meteorological Society shows that of 30 events examined in 2016, 21 (70%) were found to have
had anthropogenic influence, of which 18 had were more likely to have occurred as a result of
climate change – see table 2 on page 15. The increasing severity of climate-related events is
pushing physical impacts up the global agenda, in our view.
556x… …more extreme events in Mauritius (per
sq km) over the past decade than Russia
Climate change can increase the probability of specific extreme weather related events, as
discussed in detail in the IPCC Synthesis Report 20144. For example, it is likely (probability
>66%) that the frequency of heat waves has increased in large parts of Europe, Asia and
Australia and that human influence on the climate (i.e. via GHG emissions) has doubled the
probability of its occurrence in some locations. The report also highlights that there are likely
more land regions where the number of heavy precipitation events has increased more than
where it has decreased. Mauritius suffers the highest number of extreme events among
the countries analysed here, followed by the Philippines (see Table iii in Appendix 6). We
think this highlights the greater requirements for building resilience in small island nations.
______________________________________ 4 Intergovernmental Panel on Climate Change (IPCC)Climate Change 2014, Synthesis Report, Summary for Policymakers
Frequency of extreme events
likely to be increasing with
climate change
15
CLIMATE CHANGE ● GLOBAL
March 2018
Table 2: Attributing 2016 extreme events to climate change
Extreme event Location Anthropogenic influence on event
Atmospheric circulation Europe Not found or uncertain Cold China Decrease Coral Bleaching Great Barrier Reef Increase Coral Bleaching Central Equatorial Pacific Increase Drought Brazil Not found or uncertain Drought Southern Africa Increase Ecosystem Function: disruption of crop yields Southern Africa Decrease Ecosystem Function: disruption of fauna Central Equatorial Pacific Decrease El Niño Southern Africa Increase El Niño variability Equatorial Pacific Not found or uncertain Failed rains Southern California Not found or uncertain Frost Western Australia Increase Heat France Increase Heat Iberian Peninsula, Europe Increase Heat Asia, Southeast Asia Increase Heat Arctic Increase Heavy Precipitation Yangtze-Huai, South China Increase Heavy Precipitation Wuhan, China Increase Heavy Precipitation Yangtze River, China Increase Heavy Precipitation Southeastern Australia Not found or uncertain Heavy Precipitation Australia Not found or uncertain Marine Heat Central Equatorial Pacific Increase Marine Heat Eastern Equatorial Pacific Not found or uncertain Marine Heat Pacific Northwest Increase Marine Heat Australia Increase Marine Heat wave North Pacific Ocean/Alaska Increase Record Global 2016 heat Global Increase Stagnant air Western Europe Not found or uncertain Wildfires Canada & Australia Increase Winter Storm "Jonas" Mid-Atlantic U.S. Not found or uncertain
Source: Explaining extreme events of 2016 from a climate perspective, Bulletin of the American Meteorological Society
Chart 6: Number of extreme weather events (total over 2007-2016)
Source: EMDAT
0
50
100
150
200
250
US
AJa
pan
Aus
tral
iaF
ranc
eIta
lyU
KC
anad
aG
erm
any
Spa
inB
elgi
umS
witz
erla
ndP
ortu
gal
Aus
tria
Net
herla
nds
New
Zea
land
Isra
elD
enm
ark
Irel
and
Nor
way
Sw
eden
Sin
gapo
reF
inla
ndC
hina
Phi
lippi
nes
Indi
aIn
done
sia
Mex
ico
Bra
zil
Pak
ista
nT
haila
ndR
ussi
aC
olom
bia
Per
uS
Afr
ica
Pol
and
Chi
leM
alay
sia
Kor
eaG
reec
eS
Ara
bia
Cze
ch R
ep.
Tur
key
Hun
gary
Egy
ptU
AE
Qat
arV
ietn
amB
angl
ades
hK
enya
Sri
Lank
aA
rgen
tina
Rom
ania
Ser
bia
Nig
eria
Mor
occo
Cro
atia
Kaz
akhs
tan
Om
anS
love
nia
Leba
non
Lith
uani
aT
unis
iaM
aurit
ius
Est
onia
Kuw
ait
Bah
rain
Jord
an
Flood Drought Ext. temp. Storm Wildfire|||
|||
Nos.
DM EM FM

CLIMATE CHANGE ● GLOBAL
March 2018
16
Overall exposure to physical impacts of climate change
Overall, our modelling of physical risk exposure via absolute levels and change indicators for
temperature, water availability and extreme events, ranks Qatar as most vulnerable, as
discussed at the beginning of the chapter. Table 3 gives rankings for each indicator, and
overall rankings, for physical risk exposure. (Underlying data on physical impacts is captured in
Table ii in Appendix 6.)
The occurrence of an extreme weather event in one part of the world will not have the same
social and economic ramifications as a similar event elsewhere. In the next section, we build on
our analysis of extreme weather events and look at the sensitivity of countries to these.
Table 3: Exposure to physical risk: ranking and overall scores (lower score = higher exposure)
Temperature Water availability
Ext. events
Temperature Water availability
Ext. events
Country Abs. Change Abs. Change Freq. Overall score
Overall rank
Markets Country Abs. Change Abs. Change Freq. Overall score
Overall rank
Markets
Weights 20% 15% 25% 25% 15% Weights 20% 15% 25% 25% 15%
Qatar 1 23 3 1 61 2.06 1 EM S Korea 43 60 19 43 15 5.28 35 EM Israel 24 20 8 14 11 2.23 2 DM Poland 54 10 22 58 25 5.38 36 EM Bahrain 2 21 5 6 61 2.31 3 FM Thailand 7 62 39 48 26 5.43 37 EM Kuwait 8 32 1 4 61 2.51 4 FM Germany 51 19 24 57 27 5.57 38 DM UAE 4 42 2 2 61 2.57 5 EM Netherlands 47 30 36 52 10 5.58 39 DM S Arabia 13 33 4 8 55 2.81 6 EM Greece 36 15 38 62 20 5.59 40 EM Oman 9 48 9 3 49 2.89 7 FM Australia 22 49 57 17 54 5.72 41 DM Kenya 16 41 12 9 32 2.90 8 FM Austria 59 11 45 44 18 5.73 42 DM Nigeria 5 31 21 10 45 3.01 9 FM Slovenia 50 8 52 54 8 5.81 43 FM Egypt 21 18 11 13 52 3.09 10 EM Spain 37 51 28 49 36 5.93 44 DM Jordan 28 28 6 5 61 3.24 11 FM Japan 44 39 33 59 14 5.93 45 DM Lebanon 33 65 13 7 5 3.30 12 FM Portugal 34 37 41 60 17 5.99 46 DM Pakistan 26 43 18 12 31 3.55 13 EM Brazil 14 36 61 36 53 6.03 47 EM Singapore 3 64 7 11 61 3.56 14 DM Serbia 42 3 58 64 9 6.07 48 FM Philippines 11 61 35 16 2 3.64 15 EM Colombia 18 46 62 34 43 6.11 49 EM S Africa 30 25 15 19 48 3.80 16 EM Argentina 35 27 55 35 51 6.15 50 FM India 17 44 20 23 33 3.84 17 EM Hungary 45 4 49 63 24 6.15 50 EM Czech Rep. 31 1 17 53 16 3.92 18 EM Croatia 41 7 59 65 13 6.30 52 FM Sri Lanka 6 53 29 39 4 3.99 19 FM Romania 48 2 50 66 22 6.30 52 FM Mauritius 20 16 26 55 1 4.00 20 FM Kazakhstan 61 52 37 18 57 6.31 54 FM Morocco 32 38 14 22 39 4.02 21 FM Peru 27 56 64 24 46 6.37 55 EM Tunisia 25 34 10 30 47 4.05 22 FM China 60 47 25 46 44 6.48 56 EM Mexico 23 40 34 20 37 4.43 23 EM Lithuania 57 13 44 67 28 6.76 57 FM Bangladesh 15 58 42 28 6 4.49 24 FM Ireland 52 67 51 31 30 6.78 58 DM Belgium 46 29 23 42 3 4.51 25 DM USA 56 45 46 40 40 6.78 58 DM Turkey 40 14 30 21 50 4.53 26 EM New Zealand 49 59 65 27 38 7.07 60 DM Denmark 53 9 16 45 23 4.57 27 DM Norway 65 22 66 26 56 7.12 61 DM France 39 5 31 47 29 4.84 28 DM Sweden 63 26 53 38 59 7.18 62 DM UK 29 50 27 41 19 4.95 29 DM Estonia 62 17 48 61 42 7.24 63 FM Indonesia 10 66 43 25 35 5.10 30 EM Chile 55 54 63 37 41 7.50 64 EM Vietnam 19 57 47 33 12 5.10 31 FM Finland 64 12 56 50 61 7.50 64 DM Malaysia 12 63 54 15 34 5.10 32 EM Russia 66 6 60 56 60 7.78 66 EM Italy 38 24 32 51 21 5.24 33 DM Canada 67 55 67 32 58 8.22 67 DM Switzerland 58 35 40 29 7 5.25 34 DM
Source: HSBC; Note: DM= developed market, EM= emerging market, FM= frontier market; scores are between 0-10

17
CLIMATE CHANGE ● GLOBAL
March 2018
Sensitivity to extreme events
Socio-economic effects of extreme weather events include deaths,
loss of livelihoods and post-event rebuild costs
The Philippines has the highest sensitivity followed by
neighbouring Asian countries
The US saw a significant increase in people affected by extreme
weather events and is the most sensitive DM country overall
Previously, we examined the physical impacts of climate change and occurrence of extreme
weather events. Events such as these will not have the same social and economic ramifications
in some areas as similar events which strike elsewhere. To capture this, we now measure
sensitivity to physical impacts by examining impacts on people, in terms of economic costs,
lives lost and livelihoods affected.
METHODOLOGY: We define sensitivity as the impacts felt by society and the economy,
specifically to extreme weather events which are linked to climate change − droughts, floods,
extreme temperatures, storms and wildfires. We combine three factors: cost of damage (40%
weighting), number of deaths (30%) and number of people affected (30%). Our
methodology is described in greater detail in Appendix 1.
FINDINGS: We find that the Philippines has the highest sensitivity, followed by Thailand
and Pakistan, as South and South-East Asian countries take all the eight most vulnerable
places in this category. The US is the highest ranking DM in terms of sensitivity.
Economic costs associated with extreme weather events
The frequency of natural extreme weather events has been increasing (Chart 7 captures a
broad rise, particularly this century).
Chart 7: Global occurrences of extreme weather events
Source: EM-DAT: The CRED/OFDA International Disaster Database
0
50
100
150
200
250
300
350
400
450
1950 1956 1962 1968 1974 1980 1986 1992 1998 2004 2010 2016
Flood Drought Extreme temperature Storm WildfireNos.

CLIMATE CHANGE ● GLOBAL
March 2018
18
Average annual costs incurred globally, attributable to climate-related weather events, amounted to
0.14% of GDP during 2007-2016, an increase of 7% above the level experienced in the previous
decade. Annual costs are highest in Thailand, Pakistan, Vietnam, Philippines and Oman,
averaging about 1% of GDP over the 2007-2016 period. The increase in costs vs 1997-2006 has
also been higher in these countries (see Table iii, Appendix 6). In large economies like China, India
and the US, costs range between 0.2% and 0.3% of total GDP.
People affected and fatalities
The Philippines, Thailand, China, Sri Lanka and Kenya saw the highest share of their
population affected annually by disaster events on average over 2007-2016. In the
Philippines, the figure is highest at 102 people per 1,000 population. Next is Thailand at
83/1,000 and China at 63/1,000. It is worth noting that there may be double counting in these
numbers if the same group of people is affected by two different extreme weather events, and
so the actual number of people impacted could be smaller. But irrespective of this, it does give a
strong indication of the adaptation challenge faced by certain countries.
The trend is worsening in some countries. For example, in the Philippines the average annual
number of people affected jumped from 46 during 1997-2006 to 102 during 2007-2016.
Additionally, the country also saw the highest absolute increase. Chart 8 captures the higher
levels of Asian sensitivity to extreme weather events, with Thailand, the Philippines, Vietnam
and Pakistan all stand-out examples in terms of both the number of people affected and the
costs. The US also saw a significant jump to 32 people per 1,000 population during the last
decade compared to 3.6 in the previous decade, which we believe highlights that climate
change affects economies of all size and affluence.
9x Decadal increase in proportion of US
population affected by extreme weather events
Chart 8: Extreme weather events − average cost vs. people affected over 2007-2016
Source: EMDAT, World Bank; Note: some sample countries are not named
USA
Australia
Israel
DM average
Thailand
Pakistan
Philippines
China
India
MexicoCzech Rep.
Brazil
EM average
Vietnam
OmanSerbia
Sri Lanka
Bangladesh
Kenya
FM average
0
20
40
60
80
100
120
0.0 2.0 4.0 6.0 8.0 10.0 12.0 14.0
DM EM FMPeople affected per 1000 population
Cost (USD per 1000USD)
Asian countries have higher
sensitivity to weather events
19
CLIMATE CHANGE ● GLOBAL
March 2018
The number of deaths associated with extreme weather events over 2007-16 was highest
in Russia, followed by the Philippines and then Peru. We think this again highlights the fact
that events have high impacts in geographically disparate regions.
Flooding events dominant again in 2017
It is likely that the severity of future storms, and their impacts, will have been magnified
because of climate change.
The second half of 2017 was marked by a series of hurricanes in the Atlantic. Climate change
can increase the severity of storms and act as a threat multiplier. It does this in two main ways:
first, rising sea levels mean there is more storm surge; secondly, higher temperatures (on land
and at sea) cause more evaporation and increase the ability of the air to hold water – so there is
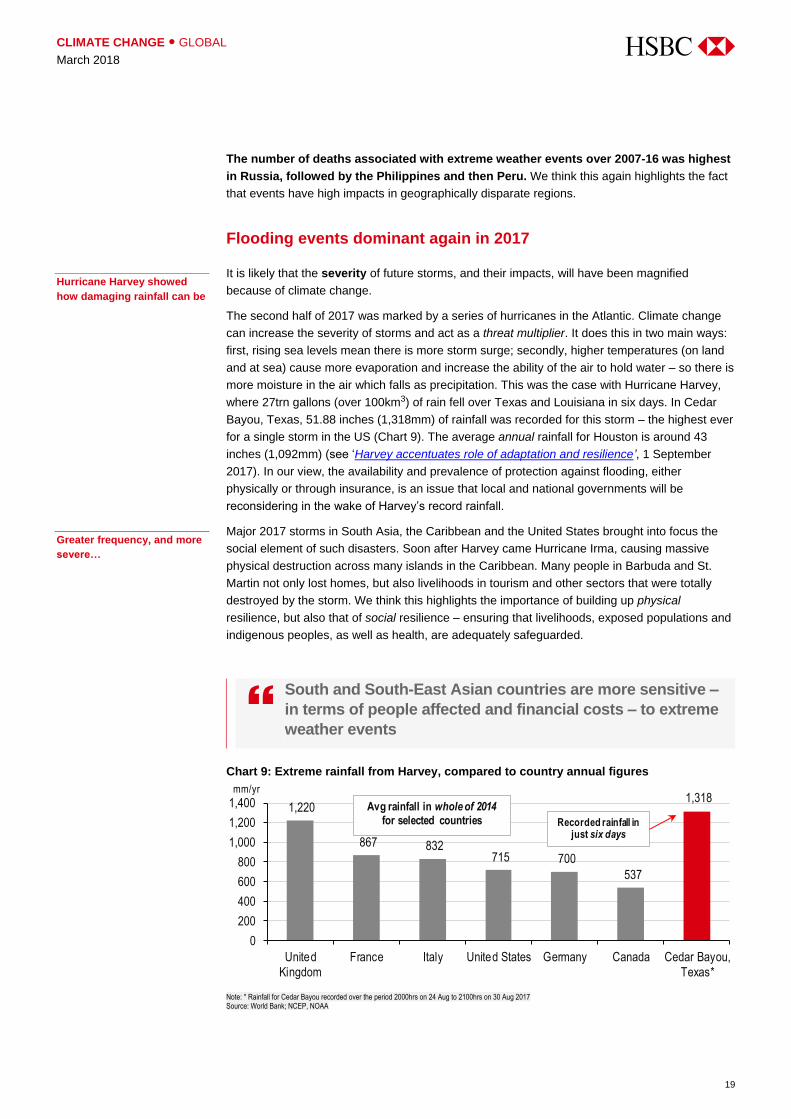
more moisture in the air which falls as precipitation. This was the case with Hurricane Harvey,
where 27trn gallons (over 100km3) of rain fell over Texas and Louisiana in six days. In Cedar
Bayou, Texas, 51.88 inches (1,318mm) of rainfall was recorded for this storm – the highest ever
for a single storm in the US (Chart 9). The average annual rainfall for Houston is around 43
inches (1,092mm) (see ‘Harvey accentuates role of adaptation and resilience’, 1 September
2017). In our view, the availability and prevalence of protection against flooding, either
physically or through insurance, is an issue that local and national governments will be
reconsidering in the wake of Harvey’s record rainfall.
Major 2017 storms in South Asia, the Caribbean and the United States brought into focus the
social element of such disasters. Soon after Harvey came Hurricane Irma, causing massive
physical destruction across many islands in the Caribbean. Many people in Barbuda and St.
Martin not only lost homes, but also livelihoods in tourism and other sectors that were totally
destroyed by the storm. We think this highlights the importance of building up physical
resilience, but also that of social resilience – ensuring that livelihoods, exposed populations and
indigenous peoples, as well as health, are adequately safeguarded.
South and South-East Asian countries are more sensitive –
in terms of people affected and financial costs – to extreme
weather events
Chart 9: Extreme rainfall from Harvey, compared to country annual figures
Note: * Rainfall for Cedar Bayou recorded over the period 2000hrs on 24 Aug to 2100hrs on 30 Aug 2017 Source: World Bank; NCEP, NOAA
1,220
867 832 715 700
537
1,318
0
200
400
600
800
1,000
1,200
1,400
United
Kingdom
France Italy United States Germany Canada Cedar Bayou,
Texas*
mm/yr
Avg rainfall in whole of 2014for selected countries Recorded rainfall in
just six days
Hurricane Harvey showed
how damaging rainfall can be
Greater frequency, and more
severe…

CLIMATE CHANGE ● GLOBAL
March 2018
20
The rise in floods globally has been marked over recent decades. Chart 10 shows how this
correlates with the rise in global temperatures.
Chart 10: Rise in floods closely correlated with rise in temperature
Source: UK MET; EM-DAT; HSBC
There were also many other floods across the world in 2017, particularly in south Asia. Many areas
saw significant loss of life as well as severe damage to property and assets. Hundreds of casualties
were reported in Sri Lanka, and over 10m people were affected by floods in India alone. Developed
markets are not immune − in Switzerland, a 2017 mudslide event caused major damage as well as
loss of life, and the Federal Office for Environment stated that permafrost weakening because of
average temperature increases, caused rocks to topple and the resulting mudslide. More recently, in
January this year California suffered severe mudslides with 21 confirmed deaths.
Globally, the population is projected by the United Nations to continue to increase (Chart 11) for the
rest of this century (albeit with slowing momentum), exacerbating pressures on populations as
global per capita water availability goes down and more people face higher temperatures and must
adapt to extreme weather events. We think such pressures will be felt more acutely by the elderly
and the young, as well as the poor and disenfranchised communities around the world.
Chart 11: World population trend
Source: HSBC, UN Population Division
-0.6
-0.2
0.2
0.6
1.0
1.4
0
50
100
150
200
250
1951
1953
1955
1957
1959
1961
1963
1965
1967
1969
1971
1973
1975
1977
1979
1981
1983
1985
1987
1989
1991
1993
1995
1997
1999
2001
2003
2005
2007
2009
2011
2013
2015
2017
Occurences Temp. anomaly (RHS)Count °C
0
2
4
6
8
10
12
1950 1960 1970 1980 1990 2000 2010 2020 2030 2040 2050 2060 2070 2080 2090 2100
BillionDM EM World
…as flooding events
continue globally

21
CLIMATE CHANGE ● GLOBAL
March 2018
In geographic terms, climate change vulnerability on both exposure and sensitivity
indicators is spread around the world. Countries in Eastern Europe, South and South
East Asia, North and Sub-Saharan Africa and the Middle East are all within the top half of
most vulnerable countries in both the categories. Table 4 gives rankings for each indicator,
and overall rankings, for physical risk exposure. (Underlying data on sensitivity to extreme
weather events is captured in Table iii in Appendix 6.)
Next, we think about which countries are more at risk as the world moves to limit climate change
and global warming. Fossil fuels produce greenhouse gas emissions when burned for energy and
so mitigating climate change requires a transition away from their use. In the next section, we look
at which countries have energy systems and economies that are more dependent on fossil fuels.
Table 4: Sensitivity to physical risk: ranking and overall scores (lower score = higher sensitivity)
_____ Extreme events ____ _____ Extreme events ____ Country Cost No. of
deaths People
effected Overall
score Overall
rank Markets Country Cost No. of
deaths People
effected Overall
score Overall
rank Markets
Weights 40% 30% 30% Weights 40% 30% 30%
Philippines 4 2 1 0.37 1 EM Canada 17 55 32 4.91 35 DM Thailand 1 15 2 0.82 2 EM Japan 40 25 34 5.03 36 DM Pakistan 2 8 10 0.93 3 EM Belgium 43 7 52 5.21 37 DM Sri Lanka 7 10 4 1.04 4 FM Nigeria 46 36 20 5.25 38 FM Bangladesh 9 6 8 1.16 5 FM S Arabia 42 23 44 5.51 39 EM Vietnam 3 14 12 1.34 6 FM Germany 18 52 51 5.69 40 DM India 10 18 6 1.67 7 EM New Zealand 21 53 46 5.69 40 DM China 8 30 3 1.96 8 EM Austria 26 46 54 6.03 42 DM Oman 5 11 29 2.09 9 FM Kazakhstan 45 42 33 6.04 43 FM Colombia 16 13 14 2.16 10 EM Lebanon 55 51 11 6.06 44 FM USA 11 27 7 2.18 11 DM Croatia 47 38 35 6.07 45 FM Australia 12 9 26 2.28 12 DM Italy 38 43 47 6.30 46 DM Serbia 6 22 23 2.37 13 FM S Korea 49 41 38 6.46 47 EM Chile 15 19 24 2.82 14 EM Mauritius 54 24 53 6.67 48 FM Mexico 13 34 18 3.10 15 EM Lithuania 55 21 56 6.73 49 FM Kenya 37 16 5 3.15 16 FM Spain 41 50 48 6.84 50 DM France 29 5 28 3.21 17 DM Switzerland 39 48 55 6.94 51 DM Czech Rep. 22 29 15 3.28 18 EM Turkey 50 49 41 7.01 52 EM Slovenia 14 39 21 3.52 19 FM Egypt 52 45 45 7.13 53 EM Brazil 30 26 13 3.54 20 EM Tunisia 55 44 42 7.13 53 FM Poland 24 12 36 3.58 21 EM Ireland 48 54 49 7.48 55 DM Hungary 35 4 30 3.61 22 EM Netherlands 44 59 56 7.78 56 DM UK 23 20 31 3.66 23 DM Norway 55 56 50 8.03 57 DM Russia 32 1 39 3.70 24 EM Estonia 55 57 56 8.34 58 FM Indonesia 20 32 27 3.84 25 EM Denmark 53 60 56 8.36 59 DM Peru 51 3 16 3.90 26 EM Sweden 55 58 56 8.39 60 DM Israel 36 31 9 3.94 27 DM Qatar 55 61 56 8.52 61 EM Romania 27 17 37 4.03 28 FM Bahrain 55 61 56 8.52 61 FM S Africa 33 35 19 4.39 29 EM Kuwait 55 61 56 8.52 61 FM Greece 25 28 40 4.54 30 EM UAE 55 61 56 8.52 61 EM Portugal 19 33 43 4.54 31 DM Jordan 55 61 56 8.52 61 FM Argentina 28 40 25 4.58 32 FM Singapore 55 61 56 8.52 61 DM Morocco 34 37 22 4.67 33 FM Finland 55 61 56 8.52 61 DM Malaysia 31 47 17 4.72 34 EM
Source: HSBC; Note: DM= developed market, EM= emerging market, FM= frontier market; scores are between 0 and 10

CLIMATE CHANGE ● GLOBAL
March 2018
22
In this chapter, we move from looking at physical impacts to looking at the energy transition
risks which countries face as they attempt to decarbonise their economies and combat the
cause of climate change. We focus particularly on major fossil-fuel producing countries, as we
believe the transition risks to such countries are higher.
METHODOLOGY: We have modelled to capture overall exposure to the transition risks of
climate change by looking at diversification of exports, energy and GDP away from fossil fuels.
We consider the level and change over the past ten years for the following indicators: fossil
rents (economic profit) as a percentage of GDP (one-third weighting), share of fossil
fuels in exports (one-third) and share of fossil fuels in primary energy use (one-third). We
rank countries based on these indicators – essentially setting out which face greater transition
risk. Our methodology is described in greater detail in Appendix 1.
FINDINGS: Bahrain comes out as most vulnerable on our energy transition indicators,
followed by neighbouring MENA countries. Unsurprisingly, other fossil fuel-producing states
from around the world complete the top ten, including Colombia, UAE, Kazakhstan and
Malaysia. Australia (9th place) is the DM country with highest transition risk, according to
our modelling, and the Netherlands is the next most vulnerable DM in 11th place.
Fossil fuels and the Paris Agreement
To further progress on mitigating climate change, the world must lower its greenhouse gas
emissions. The main way of achieving this is by lowering emissions from the energy system.
The transition to a new energy system aligned with climate goals means using less fossil fuels.
The headline goal of the Paris Agreement, in our view, is as follows:
Holding the increase in global average temperature to well below 2°C above pre-
industrial levels (in 2100) and to pursue efforts to limit the temperature increase to 1.5°C
above pre-industrial levels, recognising that this would significantly reduce the risks and
impacts of climate change;
To achieve this, virtually all countries around the world will need to remove carbon from their
energy systems and broader economies. The Paris Agreement includes text which outlines the
need to move to net zero emissions – i.e. a balance between anthropogenic emissions and the
amount absorbed by ‘sinks’ such as forests – by the second half of the 21st century. All
Energy transition risks
Fossil fuels still underlie most energy consumption – c.85% – but
this needs to change if Paris Agreement goals are to be achieved
Some countries remain heavily dependent on this ‘old energy
economy’, with high coal, oil and gas consumption and revenues
To gauge transition risks, we consider energy, export and GDP
diversification – Bahrain and MENA states are least diversified

23
CLIMATE CHANGE ● GLOBAL
March 2018
countries consume energy, for use in homes, services, industry and transport. A high proportion
– over 85% – of energy consumed comes from burning fossil fuels coal, gas and oil. Moving
away from energy and economic systems underpinned by abundant fossil fuels is where the
idea of transition risk resides. HSBC’s Senior Economic Advisor, Stephen King, has written on
the economics of this transition in Re-energising the world, 8 January 2018.
Fossil fuels have brought great wealth opportunities to many countries. Some countries have
fossil fuels in abundance and can produce enough domestically to cover their energy
requirements. Many states have an excess of commercially viable reserves – i.e. they can
supply more fossil fuels at current market prices than needed to meet domestic demand – and
therefore export to countries which do not produce enough to meet their needs. 15 of our
sample of 67 countries are net exporters of hydrocarbons, in economic terms.
In some cases, broad development off the back of these energy resources has also been
strong, with Norway an oft-cited example of successful stewardship of natural resources.
However, there are challenges to managing commodity-wealth with evidence showing what
commentators have called the ‘resource curse’: relative underperformance by commodity-rich
economies. A further challenge comes from the risk of a decline in fossil fuel demand, which
some energy system scenarios now project. We believe the challenges to fossil fuel producing
countries are particularly acute – they face higher transition risks.
Looking forward – energy growth, but fossils contraction?
Most projections see total energy demand rising in coming decades, as the global population
increases and affluence levels broadly rise. We looked at eight scenarios from energy
companies, as well as the International Energy Agency, through to 2040, and see projections
for rising total energy demand over the same period, in seven of eight scenarios (Chart 12)5.
Chart 12: Global energy consumption (Index 2015 = 100)
Source: various providers, HSBC. Note: STL = Statoil, XOM = Exxon, IEA NP = International Energy Agency New Policies, IEA 450 = International Energy Agency 450 scenario, EIA = US Energy Information Administration. Original data in mtoe.
Peak oil – demand not supply
Although most scenarios include the idea that energy use will rise, there is much more of a
question mark over fossil fuels.
______________________________________ 5 In the case of the outlier, the Statoil Renewal scenario, the pathway is consistent with the 2°C target for global warming, with emphasis on green technology development and deployment, which ensures faster energy efficiency improvements and an unprecedented pace of decline in energy intensity of GDP.
90
100
110
120
130
140
150
2015 2020 2025 2030 2035 2040
BP STL Reform STL Renewal XOMOPEC IEA NP IEA 450 EIA
A natural resource dividend
Development challenges and
peak demand
Near-consensus opinion on
rising total energy demand
through 2040

CLIMATE CHANGE ● GLOBAL
March 2018
24
A perceived challenge to the development of states where the production and export of fossil
fuels forms a large part of GDP has historically been identified via concerns around supply. In
other words, sustainability in economic development is challenged by a point when the
commercially extractable stock will be much less, even zero. This has been particularly the case
in relation to oil. Within a paradigm of peak oil supply risk, producing countries would be
expected to prepare for when the oil runs out, considering how to use oil wealth prudently, and
how to allocate wealth across generations. Indeed for some producers, commercially
extractable reserves have declined notably.
Rising affluence and growing populations, in emerging and frontier markets in particular, have
meant for many commodity market participants, commentators and investors, a common
expectation, in our view, that demand for fossil fuels would continue to rise. However, energy
system models are, with certain input constraints, now generating scenarios in which a peak-
and-decline in global oil and coal demand is a core feature. This would mark a major change in
the energy system and requires an understanding of which countries are more exposed to these
downside peak fossil fuel demand risks. Chart 13 shows liquids (crude oil and natural gas
liquids) demand trajectories under eight scenarios from energy companies, as well as the
International Energy Agency, through to 2040, with three in decline by 2030. Of these three,
both the Statoil Renewal and the IEA Sustainable Development scenario assume the world
moves to limit warming to 2ºC at century-end, while the Statoil Reform scenario sees high
electric vehicle penetration post-2030.
Chart 13: Global liquids demand, 2014-2040e, mbd
Source: various providers, HSBC. Note: STL = Statoil, XOM = Exxon, IEA NP = International Energy Agency New Policies, IEA SD = International Energy Agency sustainable development, EIA = US Energy Information Administration. Original data in mtoe
The dominance of fossil fuels is at greater risk than absolute levels of demand, in our view.
Chart 14, meanwhile, shows how liquids’ share of total energy demand is forecast to fall under
all eight scenarios.
70
80
90
100
110
120
2014 2015 2020 2025 2030 2035 2040
BP STL Reform STL Renewal XOM
OPEC IEA NP IEA SD EIA
Concerns about peak oil
supply have receded…
…and been replaced by
projections of peak demand

25
CLIMATE CHANGE ● GLOBAL
March 2018
Chart 14: Liquids share of total energy demand
Source: various providers, HSBC. Note: STL = Statoil, XOM = Exxon, IEA NP = International Energy Agency New Policies, IEA 450 = International Energy Agency 450 scenario, EIA = US Energy Information Administration. Original data in mtoe
Similarly, coal’s share is predicted to decline in all scenarios (Chart 15). In absolute terms, some
scenarios see consumption down by over half over this period, while in our 2ºC-aligned scenario
analysis in A Global Energy Vision for a 2ºC World, 7 February 2017, we see a decline of
around four-fifths by 2050. This occurs as alternative power generation technologies become
cheaper and the sector is increasingly the focus of decarbonisation actions. This small but
arguably meaningful consensus highlights the importance of alternatives to coal, in our view.
Chart 15: Coal’s share of total energy demand
Source: various providers, HSBC. Note: STL = Statoil, XOM = Exxon, IEA NP = International Energy Agency New Policies, IEA 450 = International Energy Agency 450 scenario, EIA = US Energy Information Administration. Original data in mtoe
The drivers underlying such scenarios include technological development in road transport
increasing efficiency and moving fuel away from oil derivatives, increasing climate and
environmental policy and cheaper low carbon alternative energy sources, as well as concerns
around localised pollution and associated public health concerns. Under such scenarios, long-
term lower demand means lower prices could therefore also be expected, and so for some high-
production-cost nations, this may mean leaving resources and reserves untapped.
The resource curse
A peak in fossil fuel demand is one challenge. But successfully managing fossil fuel wealth is
another. The resource curse is the term used to describe the phenomenon of natural resource
economies growing slower over time than comparable economies that are less natural
resource-intensive. We believe the challenges associated with the resource curse are a strong
economic reason for many countries to embrace a move away from them.
20%
22%
24%
26%
28%
30%
32%
34%
36%
2014 2015 2020 2025 2030 2035 2040
BP Statoil Reform Statoil Renewal XOM
OPEC IEA NP IEA 450 EIA
0%
5%
10%
15%
20%
25%
30%
35%
2014 2015 2020 2025 2030 2035 2040
BP Statoil Reform Statoil Renewal XOM
OPEC IEA NP IEA 450 EIA
Coal’s share of energy
demand looks set to fall
further
Technological advances and
policy drivers
Shouldn’t mineral resources
be a good thing?

CLIMATE CHANGE ● GLOBAL
March 2018
26
The resource curse can appear at first glance to be a counter-intuitive relationship – ‘owning’ a
monetisable asset base would seem to be preferable to not owning one – though many
empirical studies have found in favour of its existence6. There are a number of factors:
Government investment and expenditure: Mineral wealth, if properly managed, affords a country
the luxury of being able to sustain a potentially sizable primary non-fossil budget deficit but its market
price has a profound influence on investment and economic development. Hence, compounding
slower growth is the volatility dynamic – many academic studies have found that natural resource
abundance also allows countries to engage in unsustainable consumption, meaning a fall in welfare
when resources become scarce7. Chart 16 shows fossil commodity price volatility.
Chart 16: Volatile times
Source: Thomson Reuters Datastream, Bloomberg, HSBC. Annualised volatility: annualised 3mo rolling standard deviation of daily movements Note: spot prices, Henry hub natural gas (USD per m Btu), Bloomberg generic coal (USD per m tonne), Brent crude oil (USD per BBL)
Managing price volatility is difficult, particularly so for countries that are price takers in a market
and dependent on natural resources as a major source of income and foreign exchange.
Governments are predisposed to increase expenditure rapidly in line with revenue during a
resource-driven boom. However, once underway, expenditure can be difficult to reverse,
resulting in heavy fiscal deficits and associated problems, when resource prices collapse.
There is a large body of academic evidence linking natural resource wealth to lower levels of
government accountability and democracy. Simply put, where governments rely on economic
rents from natural resources for state expenditure, rather than fiscal take from the general
population, they are less accountable to the population than in a state where people demand to
certain outcomes from their taxes.
Furthermore, there is evidence of greater conflict risk in countries with high resource wealth.
One study by Paul Collier8 examined the likelihood of civil war in African countries that have
resource wealth. The paper found that, in any given five-year period, countries without resource
wealth have less than a 15% probability of civil war, which compares starkly with countries that
have resource wealth, where the probability of civil war rises to nearly 25%.
Trade dynamics: Resource-rich countries are also more prone than resource-abundant countries
to ‘Dutch disease’, whereby periods of booming commodity revenues leading to higher domestic
foreign exchange rates, diminishing the value of other tradable/exportable goods and services.
Furthermore, oil is a capital-intensive industry and when it provides a sizeable part of national
income, this can be to the detriment of employment levels and also of overall skill levels – another
Dutch Disease symptom – leading to greater dependence on hydrocarbon revenues and reducing
the exports that contribute to long-term, sustainable growth.
______________________________________ 6 Ranis and Mahmood 1991, Lal and Myint 1996, Luong and Weinthal 2001, Auty 2001a 7 Rodriguez and Sachs (1999) and Atkinson and Hamilton (2003) (El Serafy 1996) 8 Collier and Hoeffler (2004)
0
50
100
150
200
250
0
50
100
150
200
250
Jan-13 Jun-13 Nov-13 Apr-14 Sep-14 Feb-15 Jul-15 Dec-15 May-16 Oct-16 Mar-17 Aug-17 Jan-18
Henry Hub natural gas, LHS Bloomberg generic coal, LHS Brent crude oil, LHS
Henry Hub annualised vol, RHS Coal annualised vol, RHS Brent crude annualised vol, RHS
Fossil commodity prices and annualised volatility of daily movements %Index (Jan 2013=100)
Volatility…
…unemployment…
…lower FDI and conflict…
…specialisation…

27
CLIMATE CHANGE ● GLOBAL
March 2018
Skills imbalances can also result in economies experiencing spikes in revenues associated with
natural resources during periods of commodity booms. The workforce can specialise in resource
sectors when highly profitable, but then lose employment during the down-cycle. Shortages in
skilled workers in other areas which could fill the gap are likely as they have trained in the
resource-related area, limiting the potential for offsetting declines.
A ‘gold rush’ towards commodity wealth can mean local economic activities diminishing. This
can include commercial and subsistence agriculture. Imported foods then cost more and
become less affordable when the commodity boom is over. However, the ability to return to food
production may take some time. Other effects can include lower levels of private sector
investment, where a country is more dependent on state-controlled natural resources. Coupled
with weaker national institutions, this has been shown to mean lower levels of foreign direct
investment in non-resource sectors.
Diversification as a response
In view of the demand declines and broad resource curse risks facing fossil producers,
managing the transition to a lower carbon economy is key to mitigating downside risks. We think
achieving diversification is key and look here at the extent to which the 67 countries under
consideration are diversified in relation to fossil fuels in their energy, their exports and their
economic production. Overall, emerging and frontier market countries are on average notably
more exposed to fossils. Chart 17 shows emerging and frontier markets with positive net fossil
fuel exports in dollar terms on average. Fossil fuel exports make up 3.7% of GDP in emerging
and frontier market countries on average, compared to 2.4% in developed market countries. On
average, fossil fuel exports make up nearly 17% (16.6%) of total export revenues in emerging
and frontier markets. In developed markets, it is less than half of that number, with only 7.8% of
total exports coming from fossils.
Chart 17: Developed markets are less exposed to fossils in exports and GDP
Source: World Bank, UNCTAD, HSBC Note: Fossil rents as % GDP is 2015 data, all else 2016
Amongst the net fossil fuel exporters, the largest dollar flows (red bars on Chart 18) are to EM
countries, with Russia, Saudi Arabia, UAE and Qatar higher than any DM or FM countries. In
terms of economic dependence on fossil revenues, the grey bars show rents relative to the size
of the economy, with MENA hydrocarbon states highest – Kuwait (39.1% of GDP), Oman
(22.9%), Saudi Arabia (23.3%), UAE (12.0%) and Qatar (11.3%).
-15
-10
-5
0
5
10
15
20
-15
-10
-5
0
5
10
15
20
Developed Markets Emerging Markets Frontier Markets
Net fossil exports (USDbn) Fossil rents, (% GDP) Fossils exports (% total exports) Fossil exports (% GDP)
…and reduced self-
sufficiency

CLIMATE CHANGE ● GLOBAL
March 2018
28
39% Fossil fuel rents in Kuwait’s GDP, the
highest in our sample
Chart 18: Export and economic dependence amongst the fossil exporters
Source: World Bank, UNCTAD, HSBC. *United Arab Emirates
Note: Fossil rents as % GDP is 2015 data, all else 2016. Bahrain and Oman GDP numbers use 2015 data and HSBC estimates for 2016
Another way to think about which countries are better placed in terms of diversification versus
fossil-dependence, and therefore in relation to their energy transition risk, is to consider the
extent to which national fossil production is surplus to domestic consumption. The argument
here is that the greater the surplus, the bigger the risk that the country in question is overly
dependent on fossil fuel production and not sufficiently diversified, and thus facing greater
transition risk.
The biggest fossil fuel producers worldwide are China (mostly coal), and then the US (a mixture
of oil, gas and coal), as shown in Table 5 in million tonnes of oil equivalent (MTOE). The
advantage of considering this in pure energy terms is that it cuts out market price fluctuations
and FX impacts, and shows more ‘purely’ the dependence on fossil energy. This table captures
40 of our sample list of 67 countries, where data is available. With the largest economies and
large populations, China and the US consume more than they produce – i.e. they’re net
importers – suggesting relatively economic and trade diversification. On the other hand, as net
consumers these countries are more exposed to global commodity price dynamics and have
lower energy security – greater renewables deployment and efficiency would help mitigate
these two areas of risk.
After China and the US, the next largest producer is Russia, which in contrast to these two
countries produces more than twice what it consumes. Other countries have a much higher ratio
here – Norway produces over 12 times more fossils than it consumes. Declining global
dependency on fossil fuels, and resultant price drops, would hurt such countries’ trade
economics, but over the medium term would also reduce some of the challenges caused by
resource abundance.
0
6
12
18
24
30
36
42
0
20
40
60
80
100
120
140
Nor
way
Can
ada
Aus
tral
ia
Rus
sia
Sau
di A
rabi
a
UA
E*
Qat
ar
Col
ombi
a
Indo
nesi
a
Mal
aysi
a
Kuw
ait
Nig
eria
Kaz
akhs
tan
Om
an
Bah
rain
Net fossil exports (USDbn, LHS) Fossil rents (%GDP, RHS)
Fossils exports (% total exports, LHS) Fossil exports (%GDP, RHS)
Net fossil fuel exporters
Developed Markets Emerging Markets Frontier Markets
Net production or
consumption: who is more
dependent?
China and US produce most
fossil energy but remain net
importers
Russia is the next largest
producer and exports more
than half of its fossil energy

29
CLIMATE CHANGE ● GLOBAL
March 2018
The drop in oil and gas prices has refocused attention on
how exporters of these resources can transition to more
diversified, resilient economies
C.S.Hendrix, International Review of Applied Economics
What about natural gas?
In the shorter term, gas demand is forecast to grow by all scenarios we’ve considered.
However, in the longer term, we believe gas production is at risk in an energy system which
transitions to meet the 2ºC warming target at the core of the Paris Agreement. In our modelling
with University College London for the A Global Energy Vision for a 2ºC World, we found a peak
in gas consumption in around 2035, with the 2050 level some 8% lower. Similarly the IEA World
Economic Outlook’s 450-scenario sees gas demand peaking at some point in the 2030s. Chart
19 shows that for the eight mainstream scenarios, two see the peak around 2030.
Chart 19: Total energy demand for gas (mtoe)
Source: various providers, HSBC. Note: STL = Statoil, XOM = Exxon, IEA = International Energy Agency, EIA = US Energy Information Administration. Original data in mtoe
We think those countries which are substantial gas producers – such as Norway, Qatar and
Russia – are better placed amongst the net fossil producers in the short to medium term. This is
particular the case when compared with those more focused on coal, such as China, Australia,
Indonesia and South Africa, and on oil, such as Kuwait and the UAE.
The countries with a 2016 production and consumption ratio >1, i.e. they run a fossil fuel
production surplus in energy terms, are Kuwait, Saudi Arabia, UAE and Malaysia, which
have decreased their production/consumption ratio over the past two decades. However,
some countries running a surplus have become more dependent on fossil fuels: Qatar,
Colombia, Australia, Russia, Indonesia and Canada.
Such high production and consumption ratios can, in part, be explained by relatively lower fossil
consumption numbers. In Norway’s case, a large share of the primary energy mix comes from
renewable energy, reducing the need for fossil consumption. Of the 40 countries in the table,
Norway has the largest share of renewables in its primary energy mix, at 68%; no other country has
over a 50% share. New Zealand, Brazil and Canada have the next largest shares of renewables in
energy (39%, 37% and 37% respectively). This lessens transition risks to some extent.
2,000
2,500
3,000
3,500
4,000
4,500
5,000
2014 2015 2020 2025 2030 2035 2040
BP Statoil Reform Statoil Renewal XOM
OPEC IEA New Policies IEA 450 EIA
mtoe
Norway is a significant
producer of fossils and
consumer of renewables

CLIMATE CHANGE ● GLOBAL
March 2018
30
Although a high renewables share is positive, it is also important to highlight those countries
making efforts to improve from a lower renewables share, as momentum towards a lower
carbon economy bodes well for avoiding transition risks in future. Just over three-quarters of the
40 countries increased their share of green energy with positive average year-on-year growth
between 2006 and 2016. Poland, Greece and Italy have demonstrated higher momentum (17%,
14% and 10% average rates-of-change respectively).
The MENA oil-producing states have the lowest share of renewables in their economies currently:
UAE, Kuwait, Saudi Arabia and Qatar all have under 1% renewables in their energy systems,
consuming almost entirely fossil fuels. Further, these counties have extremely low rates of growth in
capacity build-out, suggesting low momentum to date towards renewables in the energy mix either
(see table 5). However, on a more positive note, policy catalysts are being introduced in many MENA
countries (see MENA: Hydrocarbon giants prepare for low-carbon future, 4 September 2017).
Table 5: Who’s producing fossils, and who’s in surplus
Country Production by country (2016, MTOE) Consumption (2016, MTOE)
Product/Cons ratio 1996
Product/Cons ratio 2006
Product/Cons ratio 2016
% REN* in prim energy (2016)
Av y-o-y chg (2006-2016)
Oil Gas Coal Total
Norway 90.4 105.0 - 195.4 15.6 13.8 13.9 12.5 67.9 0.1 Qatar 79.4 163.1 - 242.6 49.2 2.8 4.7 4.9 0.0 0.0 Kuwait 152.7 15.4 - 168.1 41.7 7.4 5.0 4.0 0.0 0.0 Colombia 48.8 9.4 62.5 120.6 30.0 2.9 3.8 4.0 27.0 -1.6 Australia 15.5 82.0 299.3 396.9 128.6 1.8 2.4 3.1 6.8 5.6 Saudi Arabia 585.7 98.4 - 684.1 266.5 4.8 3.5 2.6 0.0 - Kazakhstan 79.3 17.9 44.1 141.3 60.8 1.3 2.6 2.3 3.5 -0.9 Russia 554.3 521.5 192.8 1268.6 587.1 1.6 1.9 2.2 12.9 1.3 Indonesia 43.0 62.7 255.7 361.4 169.2 1.7 1.9 2.1 3.3 1.0 UAE 182.4 55.7 - 238.0 113.7 3.3 2.8 2.1 0.1 - Canada 218.2 136.8 31.4 386.4 209.5 1.6 1.6 1.8 36.5 1.1 South Africa - - 142.4 142.4 116.7 1.1 1.3 1.2 4.6 5.9 Malaysia 32.7 66.5 - 99.1 94.9 1.6 1.3 1.0 4.6 8.2
Mexico 121.4 42.5 4.5 168.3 173.2 1.7 1.5 1.0 7.1 1.8 Peru 5.6 12.6 - 18.2 19.3 0.8 0.8 0.9 23.5 -2.2 Vietnam 16.0 9.6 22.0 47.7 51.0 1.3 1.9 0.9 21.2 6.3 Brazil 136.7 21.1 3.5 161.3 188.3 0.5 0.8 0.9 36.8 -0.3 Denmark 6.9 4.0 - 11.0 13.0 0.8 1.3 0.8 23.8 7.5 USA 543.0 690.8 364.8 1598.7 1937.9 0.7 0.7 0.8 14.7 2.4 Egypt 33.8 37.6 - 71.5 87.2 1.5 1.3 0.8 4.1 -1.1 Argentina 28.8 34.4 - 63.2 77.6 1.3 1.3 0.8 12.7 -1.6 Bangladesh - 24.8 - 24.8 32.2 0.7 0.8 0.8 0.8 2.5 China 199.7 124.6 1685.7 2009.9 2655.5 0.5 0.8 0.8 13.0 8.1 Romania 3.8 8.2 4.3 16.3 24.4 0.7 0.6 0.7 26.1 5.9 Poland - 3.6 52.3 55.9 91.6 1.1 0.8 0.6 5.3 17.4 UK 47.5 36.9 2.6 87.1 153.1 1.2 0.8 0.6 18.6 6.9 Pakistan - 37.4 1.8 39.2 73.8 0.5 0.7 0.5 11.3 -0.5 India 40.2 24.9 288.5 353.6 669.7 0.6 0.7 0.5 7.5 0.7 Czech Rep. - - 16.3 16.3 32.3 0.7 0.6 0.5 19.0 2.8 Thailand 17.6 34.7 4.3 56.6 120.2 0.4 0.5 0.5 2.9 4.7 Netherlands - 36.1 - 36.1 80.4 0.8 0.6 0.4 4.8 5.7 Greece - - 4.1 4.1 22.6 0.3 0.3 0.2 12.7 13.9 Germany - 6.0 39.9 45.9 260.7 0.3 0.2 0.2 19.2 2.1 New Zealand - - 1.7 1.7 13.1 0.2 0.3 0.1 38.9 1.5 Turkey - - 15.2 15.2 117.5 0.2 0.2 0.1 14.8 5.2 Hungary - - 1.5 1.5 17.4 0.2 0.1 0.1 20.4 3.9 Italy 3.8 4.7 - 8.5 127.0 0.1 0.1 0.1 16.0 9.8 Spain - - 0.7 0.7 98.1 0.1 0.0 0.0 27.3 6.1 S Korea - - 0.8 0.8 244.7 0.0 0.0 0.0 14.5 -0.4 Japan - - 0.7 0.7 404.3 0.0 0.0 0.0 9.2 -2.7
Source: BP Statistical Review, HSBC. Note: excludes some countries due to lack of data. *REN: renewable energy, includes nuclear
MENA states have low
renewables levels and build-
out momentum
Po
sitive fossil p
rod
uctio
n to
co
nsu
mp
tion
ratio

31
CLIMATE CHANGE ● GLOBAL
March 2018
Diversifying into what?
The type of diversification achieved is also important. An academic paper9 looked at Bahrain’s
historical attempts to diversify the risks of its oil production by entering a joint venture in Saudi
Arabia’s oil, as well as by opening a refinery and by beginning producing natural gas.
Diversifying within oil production gives some protection against local cost and depletion factors.
Natural gas production gives diversification within fossil energy supply. Meanwhile, refining
gives diversification along the value chain and broadens commodity price volatility exposure.
However, there is still residual risk, in this example, to some of the flows of the transition
underway in the energy system. In a future where oil demand from the transport sector is
negatively catalysed by new technologies – particularly electrification of road transport – then oil
production in different geographies and refining businesses are all exposed to this trend.
Natural gas reserves are also at risk from climate change policy. However, most scenarios see
growth in demand, even where there is 2-degree alignment, so this could be broadly diversifying for
the transition. Further exposure for countries within the oil value chain would be into
petrochemicals, where there is currently projected to be growth in demand in all scenarios. Greater
diversification, with minimal correlation, would see growth in manufacturing and other economic
sectors in relation to both the economy and to exports, as well as growth in low-carbon energy.
Some studies have also found that diversification has helped economies where there has been
growth in the trade in parts and components (otherwise known as global production sharing).
One paper looked at the current growth success stories of South-East Asia as underpinned by
the successful exploitation of these trade networks. We think any viable diversification strategy
for an energy-rich state based on industrialisation and sustainable development should include
effective participation in the global production sharing network10.
Chart 20: Fossil fuel exports as % of GDP Chart 21: Fossil fuel exports as % of total exports
Source: World Bank, UNCTAD Source: World Bank, UNCTAD
Fossil fuels in GDP: Kuwait, Saudi Arabia and Oman are the top three countries in terms of
earnings from fossil production, oil in these cases. However, these three countries have also
seen among the greatest relative decline in fossil rents in the last ten years (Chart 22).
______________________________________ 9 Preparations for income after oil: Bahrain’s example, JS Birks and CA Sinclair, British Society for Middle Eastern Studies, 1979
10 Hydrocarbon, trade networks and the road to economic diversification, Yeats (1998) and Yi (2003)
-20 -10 0 10 20 30
RussiaS. Arabia
UAEQatar
NorwayKuwait
CanadaAustralia
NigeriaKazakhstan
OmanColombiaIndonesiaMalaysiaBahrain
% change 1996-2006 % change 2006-16
-40 -20 0 20 40
RussiaS. Arabia
UAEQatar
NorwayKuwait
CanadaAustralia
NigeriaKazakhstan
OmanColombiaIndonesiaMalaysiaBahrain
% change 1996-2006 % change 2006-16
Diversifying within fossil
fuels is an imperfect hedge,
in our view
Trade in parts and
components behind South
East Asian diversification
success
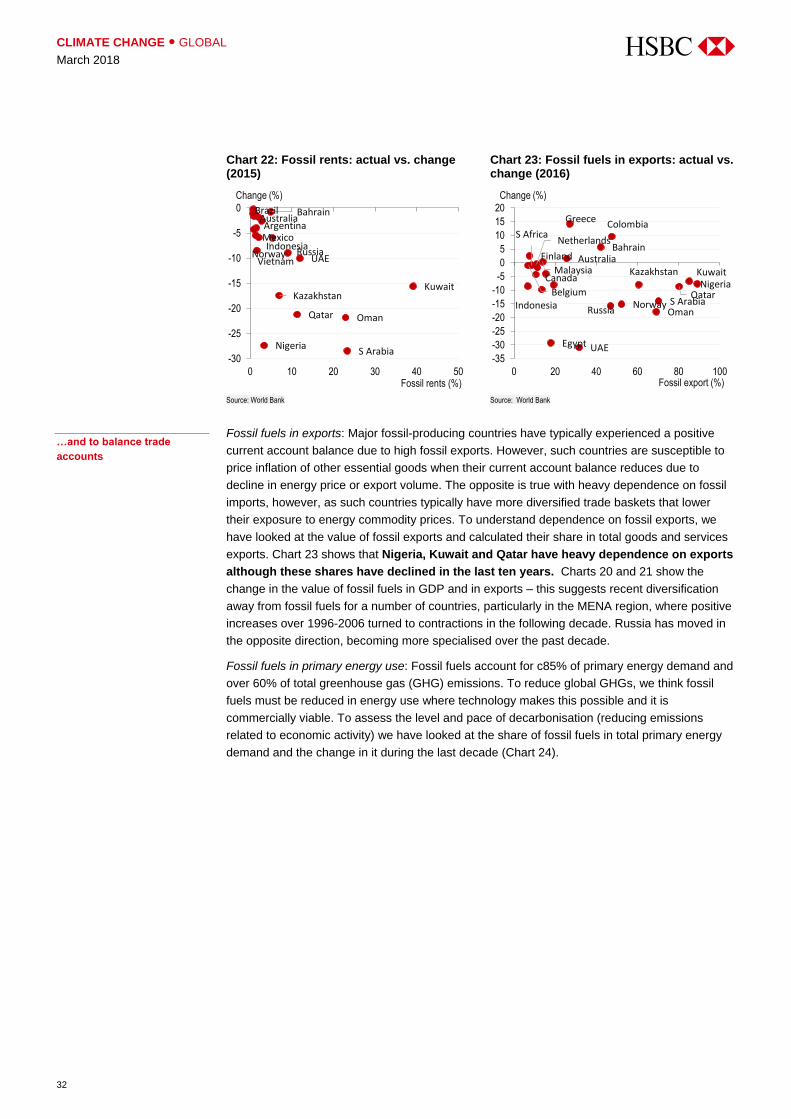
CLIMATE CHANGE ● GLOBAL
March 2018
32
Chart 22: Fossil rents: actual vs. change (2015)
Chart 23: Fossil fuels in exports: actual vs. change (2016)
Source: World Bank Source: World Bank
Fossil fuels in exports: Major fossil-producing countries have typically experienced a positive
current account balance due to high fossil exports. However, such countries are susceptible to
price inflation of other essential goods when their current account balance reduces due to
decline in energy price or export volume. The opposite is true with heavy dependence on fossil
imports, however, as such countries typically have more diversified trade baskets that lower
their exposure to energy commodity prices. To understand dependence on fossil exports, we
have looked at the value of fossil exports and calculated their share in total goods and services
exports. Chart 23 shows that Nigeria, Kuwait and Qatar have heavy dependence on exports
although these shares have declined in the last ten years. Charts 20 and 21 show the
change in the value of fossil fuels in GDP and in exports – this suggests recent diversification
away from fossil fuels for a number of countries, particularly in the MENA region, where positive
increases over 1996-2006 turned to contractions in the following decade. Russia has moved in
the opposite direction, becoming more specialised over the past decade.
Fossil fuels in primary energy use: Fossil fuels account for c85% of primary energy demand and
over 60% of total greenhouse gas (GHG) emissions. To reduce global GHGs, we think fossil
fuels must be reduced in energy use where technology makes this possible and it is
commercially viable. To assess the level and pace of decarbonisation (reducing emissions
related to economic activity) we have looked at the share of fossil fuels in total primary energy
demand and the change in it during the last decade (Chart 24).
Kuwait
S Arabia
Oman
UAE
Qatar
Russia
Kazakhstan
Norway
Bahrain
Nigeria
Vietnam
MexicoIndonesia
BrazilAustraliaArgentina
-30
-25
-20
-15
-10
-5
0
0 10 20 30 40 50Fossil rents (%)
Change (%)
NigeriaKuwait
QatarS ArabiaOman
Kazakhstan
Norway
Colombia
Russia
Bahrain
UAE
Greece
Australia
Indonesia
Egypt
CanadaMalaysia
NetherlandsS Africa
Finland
Belgium
-35
-30
-25
-20
-15
-10
-5
0
5
10
15
20
0 20 40 60 80 100Fossil export (%)
Change (%)
…and to balance trade
accounts

33
CLIMATE CHANGE ● GLOBAL
March 2018
Transition risks findings – MENA states most vulnerable
Bahrain comes out as most vulnerable on our energy transition indicators, as discussed at
the beginning of this chapter. Table 6 gives rankings for each indicator, and overall rankings, for
energy transition risk. (Underlying data on physical impacts are captured in Table iv in Appendix 6.)
Resource curse characteristics are not universally applicable to all fossil states, as some may
find resource-abundance to be a blessing. So for those countries that have used oil production
positively, resilience to peak demand becomes about managing the transition risk. In the next
section, we analyse which countries are best placed to respond, i.e. with the resources to
address both their energy transition and physical impacts.
Chart 24: Fossil fuel share in primary energy (value in 2016 and change over 2006-2016)
Source: World Bank
For countries which have
used fossil wealth more
prudently, the focus turns to
managing transition risks
-25
-20
-15
-10
-5
0
5
10
15
0
20
40
60
80
100
Sin
gapo
reIs
rael
Japa
nA
ustr
alia
Net
herla
nds
Irel
and
US
AU
KG
erm
any
Italy
Por
tuga
lB
elgi
umC
anad
aS
pain
Aus
tria
Den
mar
kN
ew Z
eala
ndN
orw
ayS
witz
erla
ndF
ranc
eF
inla
ndS
wed
enQ
atar
S A
rabi
aU
AE
Mal
aysi
aE
gypt
Mex
ico
Rus
sia
Pol
and
Tur
key
Chi
naS
outh
Afr
ica
Gre
ece
Kor
eaT
haila
ndP
eru
Col
ombi
aC
zech
Rep
.In
dia
Chi
leH
unga
ryIn
done
sia
Phi
lippi
nes
Pak
ista
nB
razi
lO
man
Kuw
ait
Bah
rain
Kaz
akhs
tan
Leba
non
Jord
anA
rgen
tina
Mor
occo
Tun
isia
Mau
ritiu
sS
erbi
aB
angl
ades
hR
oman
iaC
roat
iaV
ietn
amLi
thua
nia
Slo
veni
aS
Lan
kaN
iger
iaK
enya
Est
onia
Share- DM Share- EM Share- FM Change (RHS)% %
Global share of fossil use
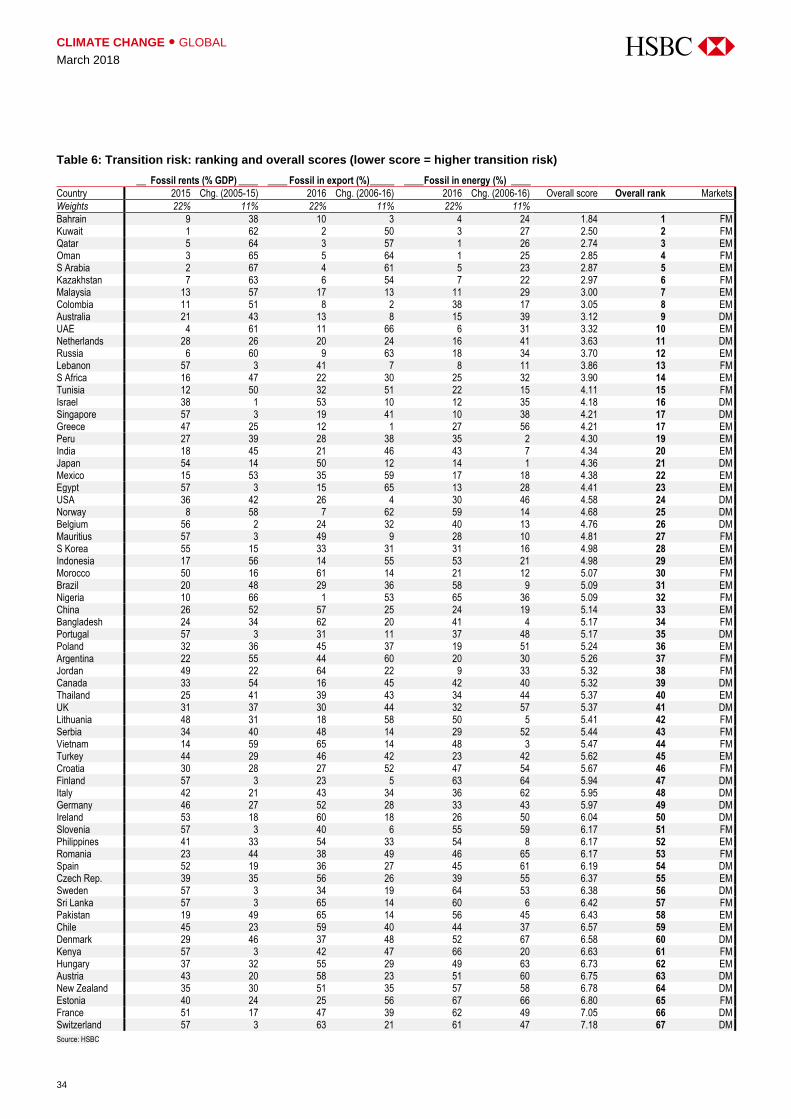
CLIMATE CHANGE ● GLOBAL
March 2018
34
Table 6: Transition risk: ranking and overall scores (lower score = higher transition risk)
__ Fossil rents (% GDP) ____ ____ Fossil in export (%) _____ ____ Fossil in energy (%) ____
Country 2015 Chg. (2005-15) 2016 Chg. (2006-16) 2016 Chg. (2006-16) Overall score Overall rank Markets
Weights 22% 11% 22% 11% 22% 11%
Bahrain 9 38 10 3 4 24 1.84 1 FM Kuwait 1 62 2 50 3 27 2.50 2 FM Qatar 5 64 3 57 1 26 2.74 3 EM Oman 3 65 5 64 1 25 2.85 4 FM S Arabia 2 67 4 61 5 23 2.87 5 EM Kazakhstan 7 63 6 54 7 22 2.97 6 FM Malaysia 13 57 17 13 11 29 3.00 7 EM Colombia 11 51 8 2 38 17 3.05 8 EM Australia 21 43 13 8 15 39 3.12 9 DM UAE 4 61 11 66 6 31 3.32 10 EM Netherlands 28 26 20 24 16 41 3.63 11 DM Russia 6 60 9 63 18 34 3.70 12 EM Lebanon 57 3 41 7 8 11 3.86 13 FM S Africa 16 47 22 30 25 32 3.90 14 EM Tunisia 12 50 32 51 22 15 4.11 15 FM Israel 38 1 53 10 12 35 4.18 16 DM Singapore 57 3 19 41 10 38 4.21 17 DM Greece 47 25 12 1 27 56 4.21 17 EM Peru 27 39 28 38 35 2 4.30 19 EM India 18 45 21 46 43 7 4.34 20 EM Japan 54 14 50 12 14 1 4.36 21 DM Mexico 15 53 35 59 17 18 4.38 22 EM Egypt 57 3 15 65 13 28 4.41 23 EM USA 36 42 26 4 30 46 4.58 24 DM Norway 8 58 7 62 59 14 4.68 25 DM Belgium 56 2 24 32 40 13 4.76 26 DM Mauritius 57 3 49 9 28 10 4.81 27 FM S Korea 55 15 33 31 31 16 4.98 28 EM Indonesia 17 56 14 55 53 21 4.98 29 EM Morocco 50 16 61 14 21 12 5.07 30 FM Brazil 20 48 29 36 58 9 5.09 31 EM Nigeria 10 66 1 53 65 36 5.09 32 FM China 26 52 57 25 24 19 5.14 33 EM Bangladesh 24 34 62 20 41 4 5.17 34 FM Portugal 57 3 31 11 37 48 5.17 35 DM Poland 32 36 45 37 19 51 5.24 36 EM Argentina 22 55 44 60 20 30 5.26 37 FM Jordan 49 22 64 22 9 33 5.32 38 FM Canada 33 54 16 45 42 40 5.32 39 DM Thailand 25 41 39 43 34 44 5.37 40 EM UK 31 37 30 44 32 57 5.37 41 DM Lithuania 48 31 18 58 50 5 5.41 42 FM Serbia 34 40 48 14 29 52 5.44 43 FM Vietnam 14 59 65 14 48 3 5.47 44 FM Turkey 44 29 46 42 23 42 5.62 45 EM Croatia 30 28 27 52 47 54 5.67 46 FM Finland 57 3 23 5 63 64 5.94 47 DM Italy 42 21 43 34 36 62 5.95 48 DM Germany 46 27 52 28 33 43 5.97 49 DM Ireland 53 18 60 18 26 50 6.04 50 DM Slovenia 57 3 40 6 55 59 6.17 51 FM Philippines 41 33 54 33 54 8 6.17 52 EM Romania 23 44 38 49 46 65 6.17 53 FM Spain 52 19 36 27 45 61 6.19 54 DM Czech Rep. 39 35 56 26 39 55 6.37 55 EM Sweden 57 3 34 19 64 53 6.38 56 DM Sri Lanka 57 3 65 14 60 6 6.42 57 FM Pakistan 19 49 65 14 56 45 6.43 58 EM Chile 45 23 59 40 44 37 6.57 59 EM Denmark 29 46 37 48 52 67 6.58 60 DM Kenya 57 3 42 47 66 20 6.63 61 FM Hungary 37 32 55 29 49 63 6.73 62 EM Austria 43 20 58 23 51 60 6.75 63 DM New Zealand 35 30 51 35 57 58 6.78 64 DM Estonia 40 24 25 56 67 66 6.80 65 FM France 51 17 47 39 62 49 7.05 66 DM Switzerland 57 3 63 21 61 47 7.18 67 DM
Source: HSBC

35
CLIMATE CHANGE ● GLOBAL
March 2018
In the first section, we considered exposure to physical climate risks, including extreme weather
events. In the second section, we examined sensitivity to these events, in terms of people
affected, lives lost and dollar costs. Next, we considered energy transition risks, identifying
countries that are highly dependent on fossil fuels for their economy and energy use.
Now we think about which countries are better placed to respond to the aforementioned
physical and transition risks. We do this by looking at capital available, and at which countries
are stronger on governance and social indicators as a guide to being well placed to use this
capital.
METHODOLOGY: We have used metrics to capture financial well-being (50% weight, including:
GDP per capita at PPP, public debt, sovereign wealth funds, cost of capital) and the strength of
institutions (50%, including: rule of law, corruption, inequality and tertiary education.) Our
methodology is described in greater detail in Appendix 1.
FINDINGS: We find the most vulnerable countries here are Kenya, Lebanon and Pakistan.
FM and EM countries from around the world dominate here. We find the best-placed countries
are Norway, New Zealand and Australia. The best placed EM or FM countries are South Korea
(4th best), the UAE (11th), Saudi Arabia (16th), Kuwait (18th), and Qatar (19th). The hydrocarbon
states amongst these have strong financial indicators that offset any relatively lower scores in
national governance metrics.
Who can fund climate ambition?
We’ve previously talked about climate finance, or “2ºC finance”, as the third pillar of addressing
climate change. We defined 2ºC finance as the allocation of capital for the development and
provision of a low-carbon economy that minimises and is resilient to the impacts of
climate change (Keeping it cool – Financing a 2ºC world, September 2014). A goal of the Paris
Agreement is:
Making finance flows consistent with a pathway towards low greenhouse gas emissions
and climate resilient development
Potential to respond to climate
risks
Capital available is an important part of the response – we look at
income, debt, sovereign wealth funds and cost-of-capital
But money isn’t everything…we consider corruption, equality, law,
education – as indicators of countries being equipped to use funds
We find Kenya, Lebanon and Pakistan to be least well equipped to
respond to climate risks
Which countries are better
placed to respond?
CLIMATE CHANGE ● GLOBAL
March 2018
36
Climate finance can come from a number of capital sources, including capital markets, asset
owners, private wealth, corporate cash flows, and can be raised through many instruments
including grants and loans, project finance and balance sheet financing. Here we focus on the
finance available to governments – public financing – as well as to companies, and the broader
level of wealth amongst the population, recognising that much of the climate response will be
bottom-up, particularly in terms of responding to the physical impacts. We utilise the following
metrics to look at financial resources in the 67 countries in our sample:
1. Gross domestic product per capita at purchasing power parity (PPP GDPpc) – This
is an indicator of the ability of the general population to respond to climate change. PPP
GDPpc gives an indication of the wealth of the country’s population; the rationale here is
that the less wealthy a country is, the less likely it will be able to channel available capital
specifically towards adaptation. We chose the ‘PPP version’ of this per capita indicator
given much adaptation spend would occur within the local economy. This is different to the
GDPpc indicator, which we considered in the section on transition risk. There we chose
the non-PPP version as we were concerned with energy and commodities in the economy
and these are therefore exposed to global pricing, rather than local factors.
2. Public debt – This is an indicator of the ability of governments to respond to climate
change. Debt requires payment of interest and repayment of capital. Hence if an entity
owes money, this limits the capital available to be deployed elsewhere, in this case in
investing to achieve climate adaptation and low carbon transition.
3. Sovereign Wealth Funds (SWFs) – This is also an indicator of the ability of governments to
respond to climate change. SWFs are established with variance in mandates – from shorter
term stabilisation of government finances during commodity revenue volatility (see note 2 in
Appendix 2 for examples), to ongoing contributions to public spending from dividends and
interest, and through to seeking to establish a base of wealth for the future (inter-
generational equity) – but typically act as a bank for excess commodity revenues until they
can be efficiently invested. We believe SWFs will increasingly be part of the equation for
countries in transitioning to lower carbon and adapting to climate. By investing outside the
domestic economy and by investing in non-fossil fuel companies, as some funds have
pledged to, SWFs effectively offer diversification. Here we look at SWFs on a per capita
basis – i.e. how much is theoretically available to spend on addressing climate change, per
person. However, we note that the mandates according to which SWFs are managed vary
from country-to-country. In our modelling we do not allow for variance of mandate and
instead assume funds could be made available for adaptation and energy system transition.
4. Cost-of-equity – This is primarily an indicator of the ability of companies to respond to
climate change. The cost of capital can be defined as the rate of return required to
persuade the investor to make a given investment, and that could have been earned by
financing a different investment with equal risk (the opportunity cost). Here we look at the
equity risk premium – the rate which investors expect above the risk-free rate, typically that
provided by a 10-year US Treasury Bond. A high equity risk premium means investors see
investments in a country as more risky and so they are less likely to commit capital to
projects which can include those which enable climate adaptation and mitigation.
(See the table in Appendix 6 for a full breakdown of data on these financial metrics.)
If mitigation efforts in aggregate are not enough to limit warming to 2°C, then the consequences
– the impacts for the environment, society and the global economy – are likely to be far more
severe. The IPCC, for instance, has stated that “losses accelerate with greater warming” –
however, the relationship is not linear because how events will play out at higher temperatures
(i.e. what the tail risk is) becomes less clear. More often than not, embedding extra resilience
(e.g. able to withstand 4°C vs 2°C) costs more, and the costs are borne upfront today.
There are many sources of
climate finance – here we
look at that available to
governments and the people
Greater resilience costs
more, but the losses
associated with more
warming are greater
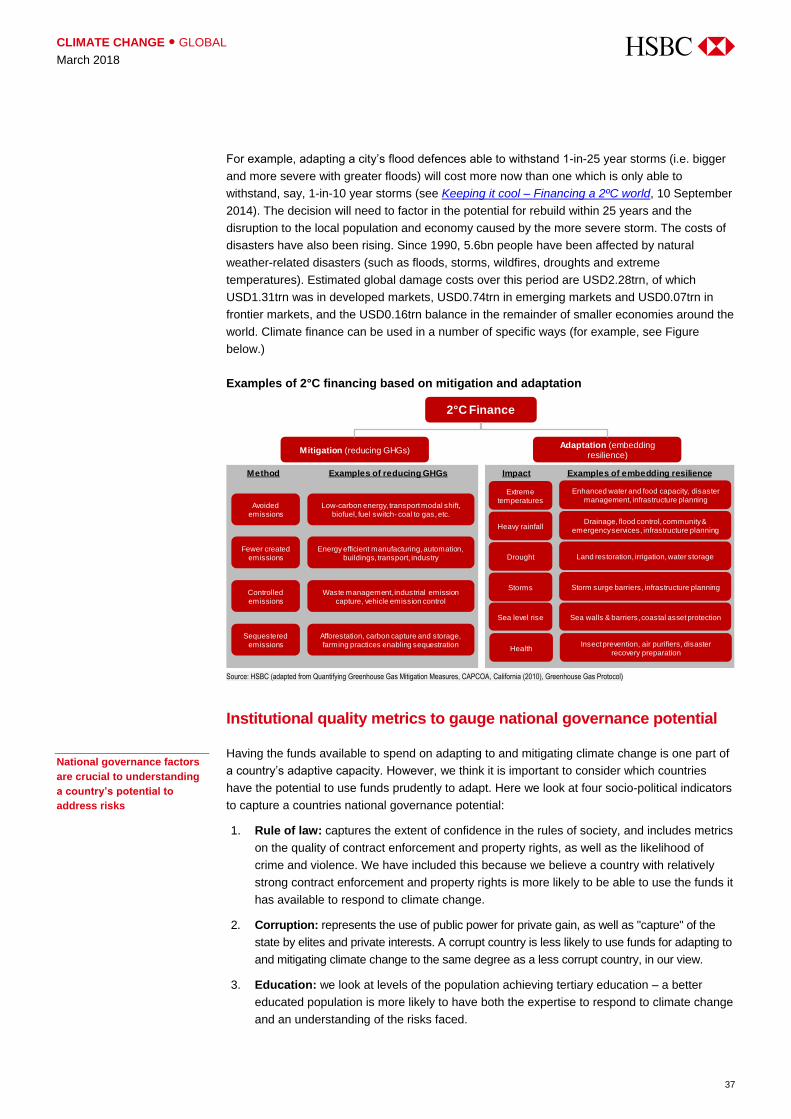
37
CLIMATE CHANGE ● GLOBAL
March 2018
For example, adapting a city’s flood defences able to withstand 1-in-25 year storms (i.e. bigger
and more severe with greater floods) will cost more now than one which is only able to
withstand, say, 1-in-10 year storms (see Keeping it cool – Financing a 2ºC world, 10 September
2014). The decision will need to factor in the potential for rebuild within 25 years and the
disruption to the local population and economy caused by the more severe storm. The costs of
disasters have also been rising. Since 1990, 5.6bn people have been affected by natural
weather-related disasters (such as floods, storms, wildfires, droughts and extreme
temperatures). Estimated global damage costs over this period are USD2.28trn, of which
USD1.31trn was in developed markets, USD0.74trn in emerging markets and USD0.07trn in
frontier markets, and the USD0.16trn balance in the remainder of smaller economies around the
world. Climate finance can be used in a number of specific ways (for example, see Figure
below.)
Examples of 2°C financing based on mitigation and adaptation
Source: HSBC (adapted from Quantifying Greenhouse Gas Mitigation Measures, CAPCOA, California (2010), Greenhouse Gas Protocol)
Institutional quality metrics to gauge national governance potential
Having the funds available to spend on adapting to and mitigating climate change is one part of
a country’s adaptive capacity. However, we think it is important to consider which countries
have the potential to use funds prudently to adapt. Here we look at four socio-political indicators
to capture a countries national governance potential:
1. Rule of law: captures the extent of confidence in the rules of society, and includes metrics
on the quality of contract enforcement and property rights, as well as the likelihood of
crime and violence. We have included this because we believe a country with relatively
strong contract enforcement and property rights is more likely to be able to use the funds it
has available to respond to climate change.
2. Corruption: represents the use of public power for private gain, as well as "capture" of the
state by elites and private interests. A corrupt country is less likely to use funds for adapting to
and mitigating climate change to the same degree as a less corrupt country, in our view.
3. Education: we look at levels of the population achieving tertiary education – a better
educated population is more likely to have both the expertise to respond to climate change
and an understanding of the risks faced.
Method Examples of reducing GHGs Impact Examples of embedding resilience
2°C Finance
Avoided emissions
Adaptation (embedding resilience)
Mitigation (reducing GHGs)
Sequestered emissions
Controlled emissions
Fewer created emissions
Extreme temperatures
Heavy rainfall
Drought
Sea level rise
Storms
Low-carbon energy, transport modal shift, biofuel, fuel switch- coal to gas, etc.
Energy efficient manufacturing, automation, buildings, transport, industry
Waste management, industrial emission capture, vehicle emission control
Afforestation, carbon capture and storage, farming practices enabling sequestration
Enhanced water and food capacity, disaster management, infrastructure planning
Drainage, flood control, community & emergency services, infrastructure planning
Land restoration, irrigation, water storage
Storm surge barriers, infrastructure planning
Sea walls & barriers, coastal asset protection
HealthInsect prevention, air purifiers, disaster
recovery preparation
National governance factors
are crucial to understanding
a country’s potential to
address risks

CLIMATE CHANGE ● GLOBAL
March 2018
38
4. Inequality: we look at the GINI Index, which measures the extent to which the distribution of
income within an economy deviates from a perfectly equal distribution. We believe that in a
more equal society, more of the population will be focused on the risks faced due to climate
change and these risks will be more evenly spread, meaning a larger part of the electorate
able to put pressure on governments to take action.
(See the table in Appendix 6 for a full breakdown of the underlying data for these national
governance metrics.)
Who has the potential to respond to climate change?
The countries scoring as most vulnerable in terms of their potential to respond to climate
change are Kenya, then Lebanon, followed by Pakistan, as FM and EM countries from
around the world dominate on this measure. Table 7 breaks this down. Italy is the most
vulnerable DM, ranked at 24 overall. At the other end of the spectrum, the best-placed
countries to respond to climate change are Norway, New Zealand and then Australia. The
best placed EM or FM countries are South Korea (4th best), the UAE (11th), Saudi Arabia
(16th), Kuwait (18th), and Qatar (19th). The hydrocarbon states amongst these have strong
financial indicators that offset any relatively lower scores in national governance metrics.
Emerging and frontier market countries, from around the
world, dominate the list of least well-equipped to respond
to climate change
In this fourth section, we’ve added an understanding of institutional and governance
quality in responding to climate change to the previous sections which considered
physical exposure, sensitivity to extreme weather events and transition risks. Table 7 gives
rankings for each indicator, and overall rankings, for the potential of countries to respond to
climate change. (Underlying data on financial and governance metrics are captured in Table v in
Appendix 6.) In the next section, we look at overall climate vulnerability, collating the
findings in each of these three sections.
Emerging and frontier market
countries are least well-
equipped to respond to
climate risks

39
CLIMATE CHANGE ● GLOBAL
March 2018
Table 7: Capacity to respond to climate change: ranking and overall scores (lower score = lower potential)
GDP PPP pc Pub. debt SWF pc Eq. risk prem. GINI ____ Governance _____ Education
Country 2016 % GDP USD (%) Control of corrpt. Rule of law School enrol, tert. Overall score Overall rank Markets
2015 (%)
Weights 12.5% 12.5% 12.5% 12.5% 12.5% 12.5% 12.5% 12.5%
Kenya 1 37 1 7 37 3 6 1 1.74 1 FM Lebanon 17 3 1 2 50 2 2 20 1.81 2 FM Pakistan 3 28 1 2 55 5 3 3 1.87 3 EM Sri Lanka 13 20 1 7 19 20 21 8 2.03 4 FM Egypt 10 14 1 2 50 9 10 18 2.13 5 EM Brazil 19 22 1 15 2 11 19 27 2.16 6 EM Mexico 22 35 1 35 4 8 7 15 2.37 7 EM Bangladesh 2 54 1 13 46 7 5 5 2.48 8 FM Nigeria 4 64 49 5 8 1 1 4 2.54 9 FM India 6 24 1 26 29 19 20 11 2.54 10 EM Philippines 7 52 1 26 17 10 11 17 2.63 11 EM S Africa 15 40 1 21 1 30 26 7 2.63 12 EM Tunisia 11 34 1 7 25 25 23 16 2.65 13 FM Indonesia 12 57 1 21 18 14 12 9 2.69 14 EM Morocco 8 27 1 17 37 24 17 13 2.69 14 FM Colombia 16 39 1 26 3 16 14 31 2.72 16 EM Peru 14 58 1 35 7 15 8 21 2.97 17 EM Jordan 9 11 1 7 42 35 30 24 2.97 18 FM Argentina 23 36 1 5 9 18 13 56 3.00 19 FM Vietnam 5 32 48 7 30 13 25 14 3.25 20 FM Serbia 18 19 1 13 57 17 18 34 3.30 21 FM Thailand 21 46 1 32 20 12 22 26 3.36 22 EM Greece 31 2 1 1 25 27 27 67 3.38 23 EM Italy 43 4 1 26 31 29 28 37 3.71 24 DM Mauritius 24 31 1 32 25 36 38 19 3.84 25 FM Croatia 27 15 1 15 45 33 32 46 3.99 26 FM Portugal 37 5 1 17 28 45 47 35 4.01 27 DM Turkey 29 53 1 17 12 23 16 66 4.05 28 EM Hungary 32 21 1 21 54 31 35 28 4.16 29 EM China 20 44 54 41 10 21 15 23 4.25 30 EM Malaysia 33 33 53 35 6 32 36 10 4.44 31 EM Russia 25 62 52 17 21 4 4 53 4.44 31 EM Romania 26 49 1 21 61 28 29 30 4.57 33 FM Spain 41 9 1 26 24 40 41 63 4.57 34 DM Israel 42 26 1 41 11 46 42 41 4.66 35 DM Lithuania 36 45 1 35 21 41 43 45 4.98 36 FM Bahrain 53 30 61 7 37 26 33 22 5.02 37 FM Kazakhstan 30 59 60 21 65 6 9 25 5.13 38 FM Japan 46 1 1 41 46 52 50 39 5.15 39 DM Poland 34 38 1 39 46 42 37 43 5.22 40 EM UK 48 13 1 50 34 58 55 32 5.43 41 DM France 45 10 1 50 44 51 52 40 5.47 42 DM Chile 28 61 1 47 5 47 46 62 5.54 43 EM Slovenia 38 17 1 32 67 43 44 57 5.58 44 FM Oman 47 63 58 26 37 37 31 2 5.62 45 FM Belgium 51 6 1 47 60 54 51 50 5.97 46 DM Czech Rep. 39 47 1 41 66 39 45 42 5.97 46 EM Estonia 35 66 1 41 33 48 49 47 5.97 48 FM Qatar 67 48 64 47 14 44 39 6 6.14 49 EM Kuwait 65 65 65 50 37 22 24 12 6.34 50 FM Germany 54 23 1 57 53 57 54 44 6.40 51 DM S Arabia 59 67 62 41 14 34 34 38 6.51 52 EM Austria 57 16 1 55 56 53 58 54 6.53 53 DM USA 60 7 51 57 13 50 56 60 6.60 54 DM Switzerland 62 41 1 57 43 61 64 33 6.75 55 DM Netherlands 58 25 1 57 58 59 61 52 6.92 56 DM UAE 64 60 66 50 14 49 40 29 6.94 57 EM Canada 50 12 50 57 36 60 60 48 6.96 58 DM Sweden 55 43 1 57 62 64 67 36 7.18 59 DM Singapore 66 8 63 57 23 62 59 48 7.20 60 DM Finland 49 29 1 55 63 66 65 61 7.26 61 DM Ireland 63 18 55 39 49 55 53 58 7.28 62 DM Denmark 56 42 1 57 59 65 62 55 7.41 63 DM S Korea 40 50 56 50 52 38 48 65 7.44 64 EM Australia 52 51 57 57 31 56 57 64 7.93 65 DM New Zealand 44 55 59 57 35 67 63 59 8.19 66 DM Norway 61 56 67 57 63 63 66 51 9.03 67 DM
Source: HSBC; Note: SWF value is assumed to be zero wherever it is unavailable and hence assigned rank of 1, implying low capacity for adaptive response

CLIMATE CHANGE ● GLOBAL
March 2018
40
Wider features of the global climate response
To recap, we’ve analysed overall vulnerability to climate change amongst the 67 countries in the
MSCI Developed, Emerging and Frontier Markets (ex- Hong Kong and Taiwan) as follows;
Physical impacts faced by countries – their exposure to these and sensitivity to extreme
weather events.
Sensitivity to extreme weather events – via costs, people affected and fatalities
Transition risks – how dependent countries are on the fossil fuel energy economy.
Potential to respond to climate change – capturing the financial resources available to
countries to spend on addressing their physical impacts and transition risks, as well as the
national governance indicators which indicate how well placed they are to build a response.
We believe our methodology provides a robust means of understanding country climate vulnerability.
Additionally, there are a number of other drivers and mechanisms to consider, which add to our
understanding of climate risk at the nation state level, in our view. These include:
Pledges to the Paris Agreement
All 197 Parties to the UN Framework Convention on Climate Change (UNFCCC) have now
either signed or ratified the Paris Agreement. These countries made pledges towards the
Paris Agreement. Known as Intended Nationally Determined Contributions, or INDCs,
these pledges described the country’s ambition for addressing climate change (see
Appendix 5). Many set emissions reduction targets requiring transition in the energy
system and plans for adapting to the impacts of climate change, while a large number also
discuss the financial requirements of meeting these targets.
Green Climate Fund
The Green Climate Fund (GCF) is a UNFCCC-governed fund designed to finance
adaptation and mitigation projects in developing countries. The GCF portfolio is currently
estimated to be worth c. USD9.15bn. In 2017, it was announced that USD2.65bn had been
approved for various climate change projects and programmes to be rolled out across 73
developing countries. Of the USD2.65bn, 31% will be allocated to climate adaptation, and
40% to mitigation, with 29% covering both.
Vulnerability – final thoughts
A holistic response to climate vulnerability means managing
physical and transition risks, enabled by the resources to do so
Vulnerability is addressed at many levels, via nation states,
international mechanisms, and by non-state actors
We think investors should study vulnerability as key to long-term
sustainable development of countries where they have exposure
International, national and
sub-national…

41
CLIMATE CHANGE ● GLOBAL
March 2018
UNFCCC Adaptation Committee
The UNFCCC’s Adaptation Committee is responsible for helping countries deliver on the
adaptation related pledges of the Paris Agreement (we estimate these feature in 127 of the
188 pledges submitted). This country level focus is in keeping with the pledges made
towards the Paris Agreement, but is also reflective of the localised nature of climate related
risks. In pledges towards the Paris Agreement, 56 countries requested financial support
which specifically included the need for adaptation spending, with specific provisions
requesting support towards adaptation coming to approximately USD 600bn.
Green bonds
Several EM governments have chosen to issue green bonds to fund emission reduction
and adaptation. These include Poland, which has issued two green bonds, Indonesia with a
green Sukuk, and Fiji and Nigeria, which have issued local currency green bonds. See
Green Bond Insights, So you want to set up a green bond fund, 1 March 2018.
Non-state actors
The United Nations Framework Convention on Climate Change (UNFCCC) is embracing
the actions of so-called non-state actors (NSAs) – cities, regions, companies, investors and
civil society – as a means to raise ambition levels for climate action. These efforts continue
to aggregate – the NAZCA (Non-State Actor Zone for Climate Action) portal, launched via
the 2014 Lima Paris Action Agenda, recorded 12,549 initiatives as of February 2018 (up
from 2,400 in March 2015).
We think this is extremely important because NSAs can move more quickly in implementing
climate change policies and measures, given: potential for faster decision-making; local
governance meaning greater accountability to one’s electorate for local decisions; and
control over specific budgets to prioritise important outlays for meeting local policy ambition.
We think city actions will be particularly relevant where domestic climate policy ambition
weakens. In the US, where President Trump has signed an executive order to pull the US
out of the Paris Agreement, it is encouraging from a climate standpoint that 93 US cities (as
well as 17 states and 3 counties) have pledged commitments to climate action through the
UN’s NAZCA portal.
Final thoughts: why countries must transition and adapt now
Climate impacts are already with us. But the thinking about adaptation is evolving as physical
impacts – warming and altered hydrological cycles – translate into social impacts, including
exacerbated health risks. Specific risks include heat stress, water-related illnesses, allergens,
vector borne diseases, exacerbated air pollution, food security. Over 2030 to 2050, the World
Health Organisation (WHO) expects 250,000 additional deaths per year due to climate change.
Furthermore, climate change is disrupting ecosystems and biodiversity, with unknown long-term
effects on the environment and society.
250,000 pa Additional deaths attributable to climate
change over 2030-2050 (WHO)
Social impacts are mounting

CLIMATE CHANGE ● GLOBAL
March 2018
42
Meanwhile, transitioning to a lower-carbon economy and energy system is also key for the
future prosperity of countries and the well-being of their citizens. Remaining invested in fossil
fuels where global demand falls risks economic challenges, as already seen in recent years
when volatile oil price benchmarks were lower over 2014 -16 in particular. Many countries and
other actors are at risk of seeing parts of their old energy economy becoming effectively
‘stranded assets’ – or economically non-viable – given climate and environmental policies, the
relative economics of alternatives and new breakthrough technologies.
Understanding climate change vulnerability is partly about interpreting data on physical impacts
relating to temperatures, water and extreme weather events, in our view. It is also about
understanding socio-economic sensitivity to such events. However, we believe that, for a fuller
understanding of vulnerability, as the world moves towards a lower carbon future, energy
transition risks must also be factored in. Lastly, having the funds available and the governance
structures in place to prudently use such funds is key to national responses. With this report,
we’ve brought these together to rank the world’s larger economies and further understanding of
country-level climate vulnerability.
We therefore believe this analysis will be useful for investors, highlighting challenges which lie
ahead for countries in transitioning economies onto lower-carbon trajectories and adapting to
the physical impacts of climate change. In our view, investors can use our analysis to gain a
fuller understanding of national risk profiles, potential for disruption to supply and demand, risks
to operations, capital expenditure, supply chains and customers, and broadly the challenges to
the long-term sustainable development of countries and protection of their people, environment
and economies.
Risks to the old energy
economy mean risks to
economies
We think an understanding of
climate vulnerability is
important to investors across
the economy

43
CLIMATE CHANGE ● GLOBAL
March 2018
References
Atkinson, G. and K. Hamilton (2003). "Savings, growth and the resource curse hypothesis."
World Development 31: 1793-1807.
Auty, R. E. (2001b). Resource abundance and economic development. Oxford, Oxford
University Press.
Auty, R. (2001a). "The political state and the management of mineral rents in capital-surplus
economies: Botswana and Saudi Arabia." Resources Policy 27(2): 77-86
El Serafy, S. (1996). "In defence of weak sustainability: a response to Beckerman."
Environmental values 5(1): 75-82.
Lal, D. and H. Myint (1996). The political economy of poverty, equity and growth. Oxford, Clarendon.
Luong, P. and E. Weinthal (2001). "Prelude to the resource curse: explaining oil and gas
development strategies in the Soviet successor states and beyond." Comparative political
studies, 34(4): 367-399.
Ranis, G. and S. Mahmood (1991). The political economy of development policy change.
Cambridge, Blackwell.
Rodriguez, F. and J. Sachs (1999). "Why do resource abundant economies grow more slowly? -
A new explanation and an application to Venezuela." Journal of economic growth 4: 277-303.
WCED (1987). Our Common Future. New York, Oxford University Press.
Hendrix, C. S. (2017). "Kicking a crude habit: diversifying away from oil and gas in the twenty-
first century." International Review of Applied Economics 1-21.
“Explaining Extreme Events of 2016 from a Climate Perspective.” Special supplement to the
Bulletin of American Meteorological Society Vol.99, No, 1, American Meteorological Society,
January 2018
Darwish et al (2008). “Energy and water in Kuwait Part I. A sustainability view point.” Elsevier
Darwish et al (2005). “The water problem in Kuwait.” Elsevier
Mukhopadhyay (2005). “Options for managing water resources in Kuwait.” Arabian Journal for
Science and Engineering
JS Birks and CA Sinclair (1979). “Preparations for income after oil: Bahrain’s example.” British
Society for Middle Eastern Studies
Yeats, A. (1998). “Just How Big is Global Production Sharing?”. World Bank Policy Research
Working Paper.
Yi, K. M. (2003). “Can Vertical Specialization Explain the Growth of World Trade?” Journal of
Political Economy, 111: 52-102.
Collier, P and Hoeffler, A (2004). “Greed and Grievance in Civil War.” Oxford Economic Papers

CLIMATE CHANGE ● GLOBAL
March 2018
44
Appendix 1 − Methodology
To gauge the vulnerability of countries to climate change risks, we use four sets of indicators.
We look at vulnerability to the physical impacts of climate change via two sets of indicators, one
to measure exposure to risks – i.e. metrics on temperature, water and extreme weather events
– and the other to measure sensitivity – how people and the economy are affected by extreme
weather events. Third, we consider how well countries are placed on transition risk in terms of
dependence on fossil fuels in their economy and energy system. Finally, a fourth set looks at
countries’ potential to respond to these physical and transition risks via indicators that capture
both economic strength to deploy funds and the national governance potential to prudently do
so. Individual metric scores are weighted and added to calculate a total score, per each set of
indicators. The Figure below captures the indicators used.
We have calculated overall vulnerability scores by assigning equal weights (25%) to each of
the four categories (exposure to physical risk, sensitivity to extreme weather events, energy
transition risk and potential to respond to climate change). We are thus able to rank countries
within categories and overall.
HSBC methodology for scoring climate vulnerability
Source: HSBC
45
CLIMATE CHANGE ● GLOBAL
March 2018
Measuring physical impacts
To understand exposure, we have based our scoring of physical climate impacts on three main
parameters, temperature levels (35% of the exposure score), water availability (50%) and
extreme weather events (15%), detailed here:
Temperature levels: Rise in atmospheric temperature is a direct manifestation of climate change.
However, local and global trends could vary greatly due to interaction of various elements of the
earth’s complex climate system11. We think, even though the cost of climate change will vary
between the regions, it will be disproportionately high for countries in the tropics, many of which are
classified as emerging and frontier. For the purpose of scoring in this report, we have considered
higher average temperatures as an indicator of higher climate exposure. Data is taken from the
World Bank. In this report, our analysis of exposure to temperature rise hinges on two factors:
1. Level: Average temperature in the decade 2006-2015
2. Change in average temperatures between 1996-2005 and 2006-2015
We have used country level temperature data provided by the World Bank which averages
values recorded at multiple stations (Note 3 in Appendix 2 gives more detail).
Water availability: This report measures exposure to water stress by evaluating the amount of water
resources available per person. The impact of climate change on water resource availability will be felt
through a change in the water-cycle that will be experienced by almost every region. And so we have
assigned a higher weight to water than the temperature metrics or extreme events. Data is
taken from the Food & Agriculture Organisation (FAO). We use the following two indicators in scoring:
1. Level: Annual renewable water resource available per capita in 2016.
2. Change: An assessment of the change in water resources over the decades
Extreme events: We attribute a lower 15% for frequency of extreme events in scoring physical
risk exposure because such events are also captured in the following section, where we look at
sensitivity to storms, floods, droughts, wildfires and extreme temperatures. Data is taken from
the EMDAT database.
Total exposure ranking: We have normalised indicators where needed to allow comparison −
damage costs have been normalised with GDP, number of events with the country land area, and
number of deaths and lives affected with the size of the population. Overall, scores are scaled to a
decimalised value between 0 and 10 and all countries in our sample are then ranked.
Measuring and scoring for sensitivity to extreme weather events
We define sensitivity as the impacts felt by society and the economy, specifically to extreme
weather events which are linked to climate change - droughts, floods, extreme temperatures,
storms and wildfires. Data is taken from the World Bank and the EMDAT database. Our
sensitivity scoring uses three areas:
1. cost of damage (40% weighting)
2. number of deaths (30% weighting)
3. number of people affected (30% weighting)
Total sensitivity ranking: We thus attempt to capture what the physical impacts of climate change
actually mean at a socio-economic level. Overall, as with exposure, all sensitivity scores are scaled
to a decimalised value between 0 and 10 and all countries in our sample are then ranked.
______________________________________ 11 The Climate System, Working Group I: The Scientific Basis, Weblink: https://www.ipcc.ch/ipccreports/tar/wg1/040.htm, accessed 30 January 2018
Three factors in climate
exposure
A higher weight to water
Socio-economic impacts of
droughts, floods, extreme
temperatures, storms and
wildfires

CLIMATE CHANGE ● GLOBAL
March 2018
46
Measuring and scoring for energy transition risks
Our analysis in Scoring Climate Risk, 23 March 2016 looked at the physical impacts of climate
change and how well placed countries were to adapt to these. We have developed our thinking
since the 2016 report to look at energy transition risk – a concept which encapsulates the
challenges faced by countries around the world associated with transitioning to a lower-carbon
economy. We gauge transition risk by looking at the diversification of the economy, energy
consumption and exports away from carbon and towards cleaner energy forms. Data are taken
from the United Nations Conference on Trade and Development (UNCTAD) database.
We have modelled to capture overall exposure to the transition risks of climate change by
looking at diversification of exports, energy and GDP away from fossil fuels. To do this we have
considered three metrics, capturing diversification over the past ten years, with two indicators
for each – the level and the change:
1. Fossil rents (economic profit) as a % of GDP: We have compared fossil rents – the
‘economic profit’ derived from the production of coal, oil and natural gas – with the size of
the economy. Countries that rely heavily on fossil production to support fiscal spending risk
macroeconomic destabilisation when the fossil price or demand goes down. We capture
the actual value for 2015 and the change over 2005-2015.
2. Share of fossil fuels in exports: We have considered the value of fossil fuel exports
relative to total exports. Significant net exports of fossil fuels puts countries’ trade balances
at risk in an environment where less are demanded in future. We capture the actual value
for 2016 and the change over 2006-2016.
3. Share of fossil fuels in primary energy use: We use the consumption of fossil fuels
relative to total primary energy consumption. Countries still heavily dependent on fossil
fuels in their energy systems are less closely aligned with a 2ºC warming outcome. We
capture actual value for 2016 and change over 2006-2016.
Our scoring of countries’ energy transition risk assigns equal (one-third) weights to fossil rents,
share of fossils in exports, and share of fossils in energy demand. Each parameter is captured
in terms of absolute value and the change over the last decade – for each we have assigned
twice the weighting of the level of that of the change. This is because we believe countries
already at a lower level of fossil dependence should be ‘rewarded’, rather than equally scored
with those moving from a high base level of carbon dependence, although the fact that some
carbon-heavy economies are now beginning to transition towards cleaner energy should indeed
be rewarded also. As per previous sections, scores are given between 1 and 10 according to
positioning amongst the 67 countries and then aggregated for the overall score.
Challenges in transitioning to
a lower-carbon trajectory
47
CLIMATE CHANGE ● GLOBAL
March 2018
Measuring and scoring for potential to respond to climate change
This final section attempts to capture how well countries are placed to address the impacts of
climate change and the need to transition their economies on to a lower-carbon trajectory.
To score countries, we have used metrics to capture financial well-being (allocated a 50%
weight). We’ve also looked at the strength of countries’ institutions (with a 50% weight) via
inequality, corruption, rule of law and tertiary education.
Climate finance
Climate finance can come from a number of capital sources, including capital markets, asset
owners, private wealth and corporate cash flows, and can be raised through many instruments
including grants and loans, project finance and balance sheet financing. Here we focus on the
finance available to governments, the population and companies – public financing – and the
broader level of wealth amongst the population, recognising that much of the climate response
will be bottom-up, particularly in terms of addressing the physical impacts. Data are taken from
the World Bank, the IMF and the Sovereign Wealth Fund Institute. We utilise the following
metrics in the 67 countries under consideration in doing so, assigning equal weights to each:
1. Gross domestic product per capita at purchasing power parity (PPP GDPpc) –We
chose the ‘PPP version’ of this per capita indicator given much adaptation spend would
occur within the local economy. This is different to the GDPpc indicator which we
considered in the section on transition risk, where we chose the non-PPP version as we
were concerned with energy and commodities in the economy and these are therefore
exposed to global pricing, rather than local factors.
2. Public debt − To allow for different overall economy sizes, here we consider the level of a
country’s public debt relative to the GDP of the country.
3. Sovereign Wealth Funds (SWFs) − Here we look at SWFs on a per capita basis, i.e. how
much is theoretically available to spend on respond to climate change, per person.
4. Cost-of-capital – We utilise the equity risk premium, i.e. the rate which investors expect
above the risk-free rate, typically that provided by a 10y US Treasury Bond. A high equity
risk premium means investors see investments in a country as more risky and so they are
less likely to commit capital to projects, which can include those which enable climate
adaptation and mitigation.
National governance potential Having the funds available to spend on adapting to and mitigating climate change is one part of
a country’s adaptive capacity. However, we think countries must also have the potential to use
funds prudently to respond to climate change. Here we look at four socio-political indicators to
capture a countries national governance potential (the datapoints we have utilised to capture
the metrics below are taken from the World Bank and the IMF):
1. Rule of law: captures the extent of confidence in the rules of society, and includes metrics
on the quality of contract enforcement and property rights, as well as the likelihood of
crime and violence.
2. Corruption: represents the use of public power for private gain, as well as "capture" of the
state by elites and private interests.
3. Education: we look at levels of the population achieving tertiary education – a better
educated country is more likely to have both the expertise to respond to climate change
and an understanding of the risks faced.
Money and the ability to use
it prudently
Funds available to
government, society and
companies
Socio-political indicators to
understand national
governance
CLIMATE CHANGE ● GLOBAL
March 2018
48
4. Inequality: we look at the GINI Index, which measures the extent to which the distribution
of income within an economy deviates from a perfectly equal distribution. We believe that
in a more equal society, climate risks are more evenly spread and there will be more equal
opportunities for all to aim for a more resilient future, rather than their being a significant
disparity in vulnerability.
Where the rule of law is strong, corruption is lower, and a higher proportion of the population
has received tertiary education, we assume the potential for stronger central governance of
climate change is higher. Also from a bottom-up perspective, these three indicators, as well as
inequality, together show greater potential for positive behavioural changes amongst the
general population, in our view.
The distribution of weights within each of the two categories is given in Table v. As per previous
sections, scores are given between 1 and 10 according to positioning amongst the 67 countries
and then aggregated for the overall score.
Overall climate vulnerability
The assessment of overall climate vulnerability integrates the four indicators discussed above. Thus
conceptually, vulnerability is a function of the exposure and sensitivity to physical impacts,
energy transition risks and the potential to respond to climate change. Our scoring method
assigns scores to the four indicators, as mentioned before, such that a lower score implies a higher
vulnerability for any indicator. We weight the four categories of scores equally and add them
together, to arrive at a final vulnerability score for each of the 67 countries (see table 1).
Governance indicators
capture potential for positive
behavioural change
49
CLIMATE CHANGE ● GLOBAL
March 2018
1. (Follows from page 9) The time span of our analysis is too small to see a perceptible
difference in water availability created by changes in hydrological cycles which can be
attributed to climate change. As a result of which, the change in values (per capita availability)
over time could solely be attributed to rising population. Irrespective of this, we believe that
countries experiencing water stress face greater exposure to associated climate change
related exposure, i.e. water availability can change because of demand or supply variation.
On the demand side, this can be due to a growing population and/or a population with higher
water use (for instance a more affluent country). In terms of supply, droughts and changing
hydrological patterns can limit supply, while investment in water infrastructure, changes in
economic activity and higher rainfall can increase supply. We have used internal water
resources data to avoid double counting and political complexity relating to expropriation of
water resources from neighbouring states, but there may be variability in absolute external
resources available to countries – inflows from upstream countries (including groundwater and
surface water, and part of the water of border lakes and rivers).
2. (Follows from page 35) Kuwait’s General Reserve Fund was established in 1960 and
replaced by the Reserve Fund for Future Generations in 1976. The Venezuelan
Investment Fund was set up during the oil boom years of the 1970s and more recently
President Chavez replaced it with the 1998 Macroeconomic Stabilisation Fund, to act as a
buffer against volatile oil prices. The Oman Oil Fund was established in 1993 for the
purpose of financing state investments in the sector. The Alaska Permanent Fund was
established in 1976 and receives 50% of certain mineral revenues.
3. (Follows from page 44) This source differs from our previous reports on ranking G20
countries on climate risk, in which we used single station temperature data for countries
provided by the US National Oceanic and Atmospheric Administration (NOAA). As a result
of this, the temperature values are not comparable between this report and its conceptual
predecessor, Scoring Climate Risk, 23 March 2016. The latest year of country level data
available is 2015, which we use to measure country-wide temperature exposure (for
individual stations it is 2016).
Appendix 2 – notes

CLIMATE CHANGE ● GLOBAL
March 2018
50
Appendix 3 – vulnerability indicators
Summary of vulnerability indicators
Indicator Weight Value Summary rationale
Exposure 25%
1) Avg. temperature Average °C 2006-15 A higher starting average temperature indicates a greater vulnerability 2) Temp. changes % change 1996-2005 to 2006-15 A higher rate of increase in average temperature suggests a higher vulnerability 3) Water availability Data for 2016 in m3 renewable/per capita/yr A lower water availability per capita value indicates a greater vulnerability 4) Water availability % change from 2006 to 2016 A higher value negative percentage change of renewable water per capita
indicates a greater vulnerability 5) Extreme events Adjusted per land area A high level of extreme events indicates a higher exposure Impact sensitivity 25%
1) People affected Number affected by weather events* More people affected reflects a higher vulnerability 2) Deaths Number killed by weather events Higher number reflects a higher vulnerability 3) Damage costs USD as a proportion of GDP Higher proportional damage costs as a proportion of the economy reflect a
higher vulnerability to climate change driven weather events Energy transition risk 25%
1) Fossil rents Share of earnings from fossil fuel production in GDP Higher rents signify higher transition risk 1) Fossil rents Change in share over 2006-2016 An increase in share implies higher transition risk 2) Fossil in export Share in total export of goods and services A higher share of fossil in export reflects higher transition risk 2) Fossil in export Change in share over 2006-2016 An increase in share implies higher transition risk 3) Fossil in energy Share in primary energy use A higher share reflects higher transition risk 3) Fossil in energy Change in share over 2006-2016 An increase in share implies higher transition risk Capacity for adaptive response 25%
1) Wealth Income per capita (USDm ppp) A lower GDP per capita indicates a higher vulnerability because of the lower ability to invest to adapt
2) Budget Debt to GDP ratio Higher debt indicates a lower capacity to pay for infrastructure build 3) Sovereign Wealth Fund (SWF) SWF per capita in USD Higher SWF per capita implies higher capacity for adaptive response 4) Equity risk premium (ERP) Represents cost of raising equity funding Higher ERP implies lower capacity for adaptive response
5) Inequality index (GINI) Represents income distribution Higher inequality implies lower capacity for adaptive response 6) Rule of law Index to capture perception of confidence in rule of law Higher rule of law indicates better governance and a better environment for
deploying capital effectively 7) Corruption Index to capture perception of control of governance Better control of corruption indicates a greater likelihood of proper allocation
of funds for adaptation 8) Education Ratio of total enrolment to the population officially
corresponding to tertiary education age Higher education indicates a higher skills base to effect and demand change
Source: HSBC; Note: * weather events considered are drought, extreme temperatures, flood, storm and wildfire
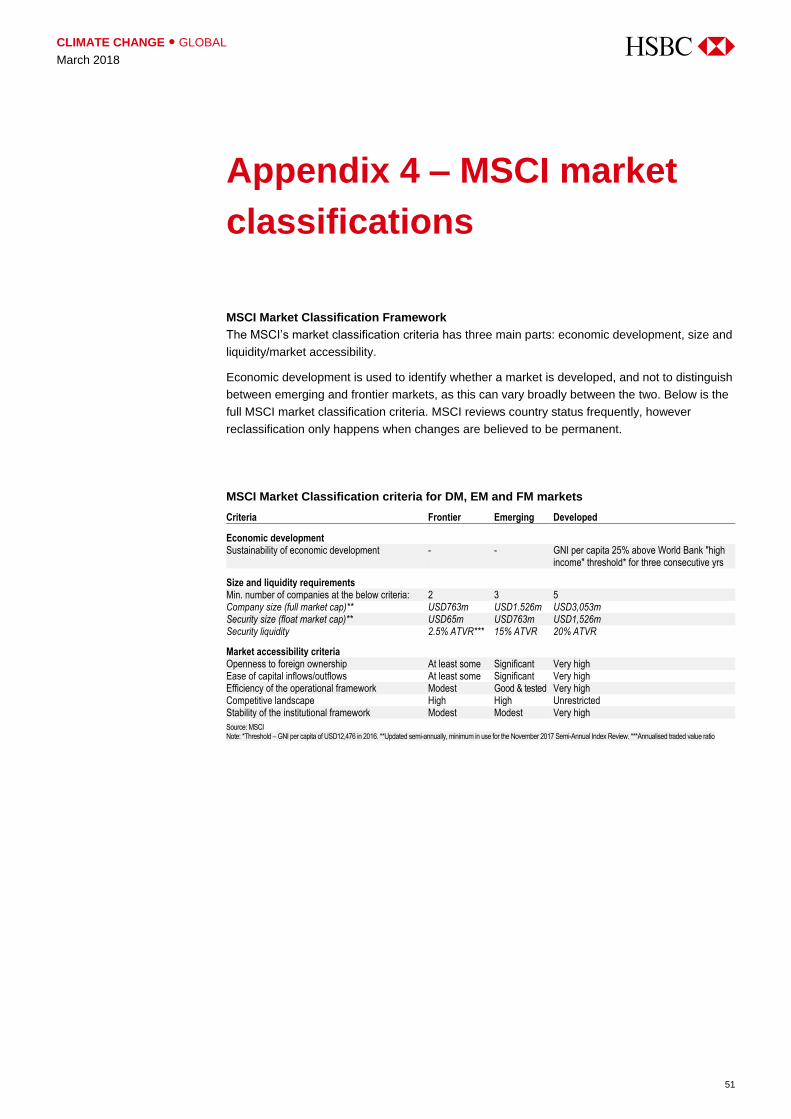
51
CLIMATE CHANGE ● GLOBAL
March 2018
MSCI Market Classification Framework
The MSCI’s market classification criteria has three main parts: economic development, size and
liquidity/market accessibility.
Economic development is used to identify whether a market is developed, and not to distinguish
between emerging and frontier markets, as this can vary broadly between the two. Below is the
full MSCI market classification criteria. MSCI reviews country status frequently, however
reclassification only happens when changes are believed to be permanent.
MSCI Market Classification criteria for DM, EM and FM markets
Criteria Frontier Emerging Developed
Economic development Sustainability of economic development - - GNI per capita 25% above World Bank "high
income" threshold* for three consecutive yrs
Size and liquidity requirements Min. number of companies at the below criteria: 2 3 5 Company size (full market cap)** USD763m USD1.526m USD3,053m Security size (float market cap)** USD65m USD763m USD1,526m Security liquidity 2.5% ATVR*** 15% ATVR 20% ATVR
Market accessibility criteria Openness to foreign ownership At least some Significant Very high Ease of capital inflows/outflows At least some Significant Very high Efficiency of the operational framework Modest Good & tested Very high Competitive landscape High High Unrestricted Stability of the institutional framework Modest Modest Very high
Source: MSCI Note: *Threshold – GNI per capita of USD12,476 in 2016. **Updated semi-annually, minimum in use for the November 2017 Semi-Annual Index Review. ***Annualised traded value ratio
Appendix 4 – MSCI market
classifications

CLIMATE CHANGE ● GLOBAL
March 2018
52
Country INDCs
Pledge Target year Base year Long-term pledge Comments Adaptation policy (Y/N) and proposed strategy
Developed Markets Australia 26-28% 2030 2005 None Reserves right to adjust target should it
consider UCA inadequate N Australia has developed a National
Climate Resilience and Adaptation Strategy
Canada 30% 2030 2005 None Intends to account for the land sector using a net-net approach
N -
EU 40% 2030 1990 Reduce emissions by 80-95% by 2050 from
1990
No contribution from international credits
N -
Israel NA 2030 2005 None Target 7.7tCO2e per capita by 2030, 26% below the 10.4tCO2e in 2005
Y National Adaptation Plan
Japan 26% 2030 2013 None Equivalent to 25.4% reduction from 2005 levels
N -
New Zealand 30% 2030 2005 50% below 1990 by 2050
The 30% target is comparable to a 11% reduction from 1990
N -
Norway 40% 2030 1990 To become a low emission society by
2050
Target to be met through collective delivery with the EU
N -
Singapore Peak 2030 NA None Aims to cut emissions intensity of GDP by 36% by 2030 (vs. 2005)
N -
Switzerland 50% 2030 1990 Reduce emissions 70-85% by 2050 from
1990
Carbon credits from international mechanisms will partly be used
N -
United States 26-28% 2025 2005 Reductions of 80% or more by 2050
Will aim to reduce emissions by 28% N -
Emerging Markets Brazil 37% 2025 2005 None Equivalent to 6% below 1990; already
achieved 41% below 2005 by 2012. Indicative target of 16% below 1990 by
2030 (equivalent)
Y National Adaptation Plan, implement knowledge management systems, promote research and technology
development for adaptation Chile NA 2030 2007 None Unconditional reduction in emission
intensity of GDP by 30% by 2030 (2007); conditional intensity reduction
35%-45% if financial support
Y National Plan for Adaptation (including sector plans), develop an assessment
exercise through vulnerability indicators and methodologies to determine the
increasing adaptive capacity of individuals, communities and systems
China Peak 2030 NA None Cut carbon intensity of GDP by 60-65% by 2030 from 2005
N -
Colombia 20% 2030 BAU None Up to 30% from 2030 BAU with international support
Y Strengthen agriculture, education and technology
Egypt NA 2030 NA None Listed out 30 mitigation actions across different sectors at the national level
Manage decreasing water resources through maintaining water level in Lake
Nasser, increased water storage capacity, improved irrigation systems.
Agricultural security, adaptation in coastal zones, affected populations relocated to
safe zones India NA 2030 2005 None Reduce emissions intensity of GDP by
33-35% from 2005 level; achieve 40% installed capacity from non-fossil fuel
based energy resources; create additional carbon sink through forest
cover
Y Adaptation in agriculture, water, Himalayan ecosystems, forestry, capacity
building, and knowledge management, strengthen adaptive capacities of
vulnerable communities
Source: Country INDCs; Note: Taken from country INCDs only. Some countries may have adaptation plans/long term pledges that are not mentioned in their INDC release and are therefore not showing in the table
Appendix 5 – Country INDCs
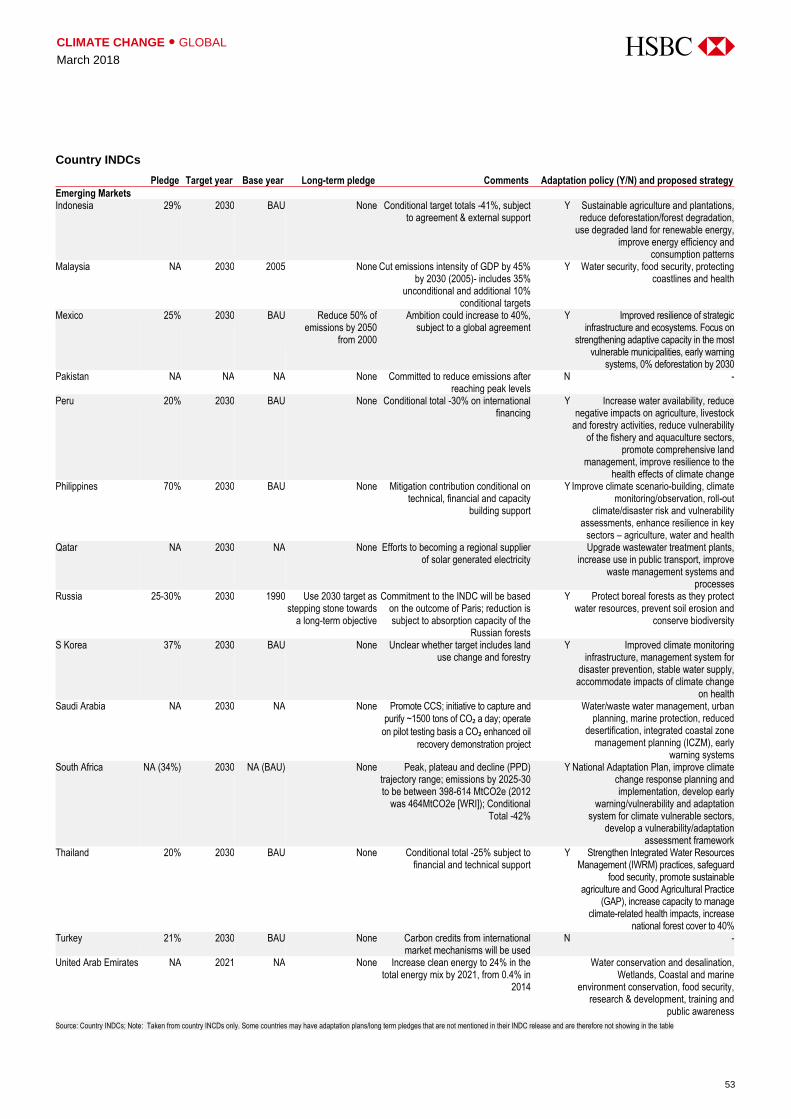
53
CLIMATE CHANGE ● GLOBAL
March 2018
Country INDCs
Pledge Target year Base year Long-term pledge Comments Adaptation policy (Y/N) and proposed strategy
Emerging Markets Indonesia 29% 2030 BAU None Conditional target totals -41%, subject
to agreement & external support Y Sustainable agriculture and plantations,
reduce deforestation/forest degradation, use degraded land for renewable energy,
improve energy efficiency and consumption patterns
Malaysia NA 2030 2005 None Cut emissions intensity of GDP by 45% by 2030 (2005)- includes 35%
unconditional and additional 10% conditional targets
Y Water security, food security, protecting coastlines and health
Mexico 25% 2030 BAU Reduce 50% of emissions by 2050
from 2000
Ambition could increase to 40%, subject to a global agreement
Y Improved resilience of strategic infrastructure and ecosystems. Focus on
strengthening adaptive capacity in the most vulnerable municipalities, early warning
systems, 0% deforestation by 2030 Pakistan NA NA NA None Committed to reduce emissions after
reaching peak levels N -
Peru 20% 2030 BAU None Conditional total -30% on international financing
Y Increase water availability, reduce negative impacts on agriculture, livestock
and forestry activities, reduce vulnerability of the fishery and aquaculture sectors,
promote comprehensive land management, improve resilience to the
health effects of climate change Philippines 70% 2030 BAU None Mitigation contribution conditional on
technical, financial and capacity building support
Y Improve climate scenario-building, climate monitoring/observation, roll-out
climate/disaster risk and vulnerability assessments, enhance resilience in key
sectors – agriculture, water and health Qatar NA 2030 NA None Efforts to becoming a regional supplier
of solar generated electricity Upgrade wastewater treatment plants,
increase use in public transport, improve waste management systems and
processes Russia 25-30% 2030 1990 Use 2030 target as
stepping stone towards a long-term objective
Commitment to the INDC will be based on the outcome of Paris; reduction is subject to absorption capacity of the
Russian forests
Y Protect boreal forests as they protect water resources, prevent soil erosion and
conserve biodiversity
S Korea 37% 2030 BAU None Unclear whether target includes land use change and forestry
Y Improved climate monitoring infrastructure, management system for
disaster prevention, stable water supply, accommodate impacts of climate change
on health Saudi Arabia NA 2030 NA None Promote CCS; initiative to capture and
purify ~1500 tons of CO₂ a day; operate
on pilot testing basis a CO₂ enhanced oil
recovery demonstration project
Water/waste water management, urban planning, marine protection, reduced
desertification, integrated coastal zone management planning (ICZM), early
warning systems South Africa NA (34%) 2030 NA (BAU) None Peak, plateau and decline (PPD)
trajectory range; emissions by 2025-30 to be between 398-614 MtCO2e (2012
was 464MtCO2e [WRI]); Conditional Total -42%
Y National Adaptation Plan, improve climate change response planning and implementation, develop early
warning/vulnerability and adaptation system for climate vulnerable sectors,
develop a vulnerability/adaptation assessment framework
Thailand 20% 2030 BAU None Conditional total -25% subject to financial and technical support
Y Strengthen Integrated Water Resources Management (IWRM) practices, safeguard
food security, promote sustainable agriculture and Good Agricultural Practice
(GAP), increase capacity to manage climate-related health impacts, increase
national forest cover to 40% Turkey 21% 2030 BAU None Carbon credits from international
market mechanisms will be used N -
United Arab Emirates NA 2021 NA None Increase clean energy to 24% in the total energy mix by 2021, from 0.4% in
2014
Water conservation and desalination, Wetlands, Coastal and marine
environment conservation, food security, research & development, training and
public awareness
Source: Country INDCs; Note: Taken from country INCDs only. Some countries may have adaptation plans/long term pledges that are not mentioned in their INDC release and are therefore not showing in the table

CLIMATE CHANGE ● GLOBAL
March 2018
54
Country INDCs
Pledge Target year Base year Long-term pledge Comments Adaptation policy (Y/N) and proposed strategy
Frontier Markets Argentina 15% 2030 BAU None Conditional total -30%; subject to
financial and technical support; Y Early warning systems for extreme
weather events, climate disaster response systems, sustainable forest management,
increased irrigated crop areas, improved water resource management, improved decision making on crop management,
strengthened health processes Bahrain NA 2030 NA None Aims to improve energy efficiency to
reduce cumulative electricity consumption by 2030
Y Upgrade water distribution networks, Mangrove Transplantation Project for the
cultivation of plants and planting mangrove seedlings to rehabilitate
degraded coastal areas Bangladesh 5% 2030 BAU None Only covers power, transport and
industry. Conditional total -15% Y Food and water security, livelihood and
health protection, comprehensive disaster management, coastal zone management
including flood control and erosion protection, building resilient infrastructure
Jordan (revised) 2% 2030 BAU None Unconditional – 1.5%; conditional – 12.5% (Total – 14%)
Y Adaptation covering water, health, biodiversity, agriculture, socioeconomic
development Kazakhstan 15% 2030 1990 None Conditional total -25% on international
investment N -
Kenya 30% 2030 BAU None Target subject to international support (finance, technology, etc.)
Y National Adaptation Plan focusing on energy, transport, and buildings. Enhanced resilience
of ecosystems, water infrastructure and irrigation, urban populations, tourism,
agriculture and fisheries Kuwait NA 2035 NA None Aims to transition into a low carbon
economy in a BAU scenario N -
Lebanon 15% 2030 BAU None Conditional total -30% by 2030 (BAU) Y Establish national monitoring sites and species to protect biodiversity. Prioritise
coastal zones, implement the National Forest Programme, increase water availability and reduce water usage
Mauritius 30% 2030 BAU None Conditional on support (USD1.5bn mitigation; USD4bn adaptation)
Y Enhanced infrastructure, disaster risk strategies, improved awareness,
strengthened regulatory framework for the protection of beach, dunes and vegetation.
Improved forecasting, management, protection of water resources
Morocco 13% 2030 BAU None Target – 13% – unconditional; 19% – conditional; (Total 32%); Requires
USD45bn; conditional upon USD35bn of int’l finance, a UCA
Protect populations in vulnerable coastal zones, desert and mountain areas.
Protect ecosystems, agriculture, high-risk infrastructures and water resources.
Focus on desalination, wastewater, new dams, flood protection, irrigation
infrastructure. Increase monitoring and evaluation
Nigeria 20% 2030 BAU None To be achieved through energy efficiency measures and 13GW of
renewable energy sources; conditional target- 45 % below BAU by 2030
Y Improve agricultural systems, strengthen the implementation of the national
Community-Based Forest Resources Management Programme, increase
protective margins in construction and placement of transportation and
communications infrastructure, increase knowledge and awareness of climate
change risks and opportunities Oman 2% 2030 BAU None Listed conditional adaptation and
mitigation efforts subject to international support
Y Develop national adaptation plans. Focus on tropical cyclones, coastal erosion and
sea levels, fisheries and marine environment, water scarcity and
desertification, flood protection, energy security, food security
Serbia 10% 2030 1990 None Climate change strategy & action plan to be finalised by 2017
N -
Source: Country INDCs; Note: Taken from country INCDs only. Some countries may have adaptation plans/long term pledges that are not mentioned in their INDC release and are therefore not showing in the table

55
CLIMATE CHANGE ● GLOBAL
March 2018
Country INDCs
Pledge Target year Base year Long-term pledge Comments Adaptation policy (Y/N) and proposed strategy
Frontier Markets Sri Lanka NA 2030 2010 None Conditional - 7%; 20% (unconditional
-4% conditionally -16%) in energy sector; 10% in other sectors (3%
unconditional; 7% conditional) (other sectors include: transport, industry,
forests and waste)
Y National planning/development, ensure climate resilient human settlements,
protect food security, safeguard natural resources and biodiversity, create
strategies for vulnerable sectors
Tunisia NA 2030 2010 None Unconditional –13% in carbon intensity; conditional –28%; (total –
41%)
Y Water resource, coastline, agriculture, ecosystem, tourism and health
Vietnam 8% 2030 BAU None Conditional total -25% by 2030 from BAU. Carbon intensity of GDP could
decline by 30% by 2030 from 2010 with external support
Y Modernise the hydro-meteorological observatory and forecasting system,
develop a climate and sea level assessment and monitoring system,
integrated coastal zone management
Source: Country INDCs; Note: Taken from country INCDs only. Some countries may have adaptation plans/long term pledges that are not mentioned in their INDC release and are therefore not showing in the table
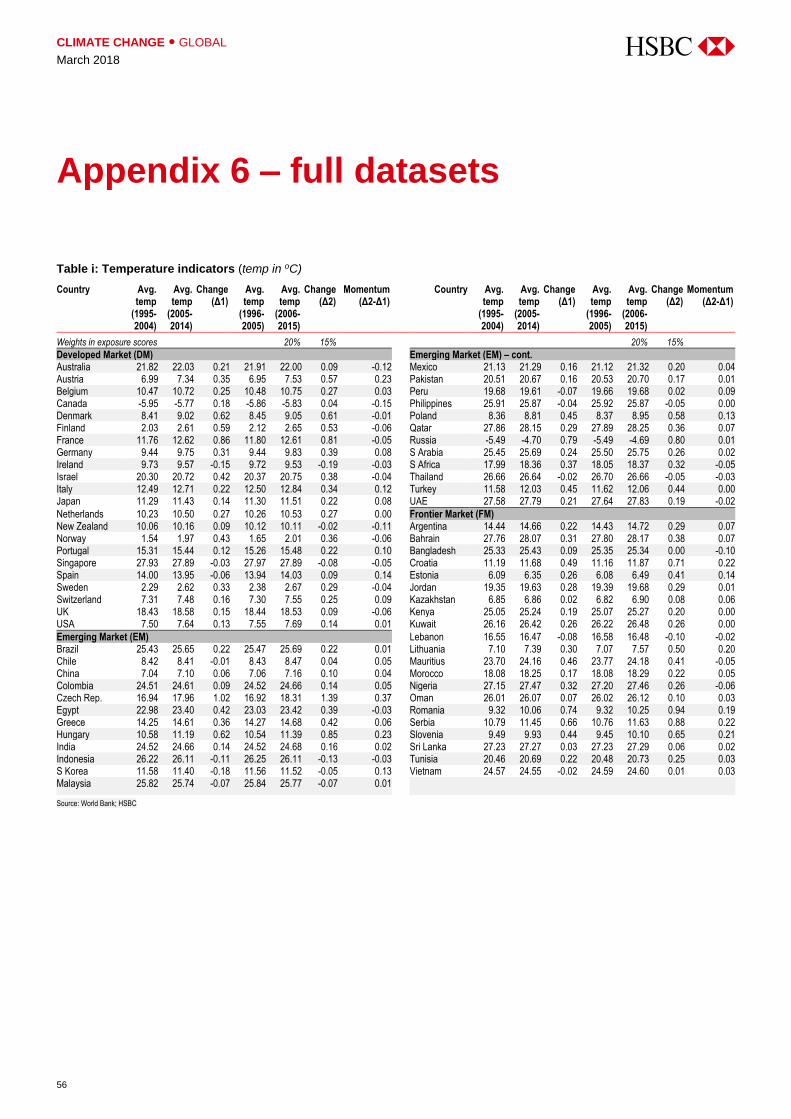
CLIMATE CHANGE ● GLOBAL
March 2018
56
Table i: Temperature indicators (temp in oC)
Country Avg. temp
(1995-2004)
Avg. temp
(2005-2014)
Change (Δ1)
Avg. temp
(1996-2005)
Avg. temp
(2006-2015)
Change(Δ2)
Momentum (Δ2-Δ1)
Country Avg. temp
(1995-2004)
Avg. temp
(2005-2014)
Change (Δ1)
Avg. temp
(1996-2005)
Avg. temp
(2006-2015)
Change(Δ2)
Momentum (Δ2-Δ1)
Weights in exposure scores 20% 15% 20% 15%
Developed Market (DM) Emerging Market (EM) – cont. Australia 21.82 22.03 0.21 21.91 22.00 0.09 -0.12 Mexico 21.13 21.29 0.16 21.12 21.32 0.20 0.04 Austria 6.99 7.34 0.35 6.95 7.53 0.57 0.23 Pakistan 20.51 20.67 0.16 20.53 20.70 0.17 0.01 Belgium 10.47 10.72 0.25 10.48 10.75 0.27 0.03 Peru 19.68 19.61 -0.07 19.66 19.68 0.02 0.09 Canada -5.95 -5.77 0.18 -5.86 -5.83 0.04 -0.15 Philippines 25.91 25.87 -0.04 25.92 25.87 -0.05 0.00 Denmark 8.41 9.02 0.62 8.45 9.05 0.61 -0.01 Poland 8.36 8.81 0.45 8.37 8.95 0.58 0.13 Finland 2.03 2.61 0.59 2.12 2.65 0.53 -0.06 Qatar 27.86 28.15 0.29 27.89 28.25 0.36 0.07 France 11.76 12.62 0.86 11.80 12.61 0.81 -0.05 Russia -5.49 -4.70 0.79 -5.49 -4.69 0.80 0.01 Germany 9.44 9.75 0.31 9.44 9.83 0.39 0.08 S Arabia 25.45 25.69 0.24 25.50 25.75 0.26 0.02 Ireland 9.73 9.57 -0.15 9.72 9.53 -0.19 -0.03 S Africa 17.99 18.36 0.37 18.05 18.37 0.32 -0.05 Israel 20.30 20.72 0.42 20.37 20.75 0.38 -0.04 Thailand 26.66 26.64 -0.02 26.70 26.66 -0.05 -0.03 Italy 12.49 12.71 0.22 12.50 12.84 0.34 0.12 Turkey 11.58 12.03 0.45 11.62 12.06 0.44 0.00 Japan 11.29 11.43 0.14 11.30 11.51 0.22 0.08 UAE 27.58 27.79 0.21 27.64 27.83 0.19 -0.02
Netherlands 10.23 10.50 0.27 10.26 10.53 0.27 0.00 Frontier Market (FM) New Zealand 10.06 10.16 0.09 10.12 10.11 -0.02 -0.11 Argentina 14.44 14.66 0.22 14.43 14.72 0.29 0.07 Norway 1.54 1.97 0.43 1.65 2.01 0.36 -0.06 Bahrain 27.76 28.07 0.31 27.80 28.17 0.38 0.07 Portugal 15.31 15.44 0.12 15.26 15.48 0.22 0.10 Bangladesh 25.33 25.43 0.09 25.35 25.34 0.00 -0.10 Singapore 27.93 27.89 -0.03 27.97 27.89 -0.08 -0.05 Croatia 11.19 11.68 0.49 11.16 11.87 0.71 0.22 Spain 14.00 13.95 -0.06 13.94 14.03 0.09 0.14 Estonia 6.09 6.35 0.26 6.08 6.49 0.41 0.14 Sweden 2.29 2.62 0.33 2.38 2.67 0.29 -0.04 Jordan 19.35 19.63 0.28 19.39 19.68 0.29 0.01 Switzerland 7.31 7.48 0.16 7.30 7.55 0.25 0.09 Kazakhstan 6.85 6.86 0.02 6.82 6.90 0.08 0.06 UK 18.43 18.58 0.15 18.44 18.53 0.09 -0.06 Kenya 25.05 25.24 0.19 25.07 25.27 0.20 0.00 USA 7.50 7.64 0.13 7.55 7.69 0.14 0.01 Kuwait 26.16 26.42 0.26 26.22 26.48 0.26 0.00
Emerging Market (EM) Lebanon 16.55 16.47 -0.08 16.58 16.48 -0.10 -0.02 Brazil 25.43 25.65 0.22 25.47 25.69 0.22 0.01 Lithuania 7.10 7.39 0.30 7.07 7.57 0.50 0.20 Chile 8.42 8.41 -0.01 8.43 8.47 0.04 0.05 Mauritius 23.70 24.16 0.46 23.77 24.18 0.41 -0.05 China 7.04 7.10 0.06 7.06 7.16 0.10 0.04 Morocco 18.08 18.25 0.17 18.08 18.29 0.22 0.05 Colombia 24.51 24.61 0.09 24.52 24.66 0.14 0.05 Nigeria 27.15 27.47 0.32 27.20 27.46 0.26 -0.06 Czech Rep. 16.94 17.96 1.02 16.92 18.31 1.39 0.37 Oman 26.01 26.07 0.07 26.02 26.12 0.10 0.03 Egypt 22.98 23.40 0.42 23.03 23.42 0.39 -0.03 Romania 9.32 10.06 0.74 9.32 10.25 0.94 0.19 Greece 14.25 14.61 0.36 14.27 14.68 0.42 0.06 Serbia 10.79 11.45 0.66 10.76 11.63 0.88 0.22 Hungary 10.58 11.19 0.62 10.54 11.39 0.85 0.23 Slovenia 9.49 9.93 0.44 9.45 10.10 0.65 0.21 India 24.52 24.66 0.14 24.52 24.68 0.16 0.02 Sri Lanka 27.23 27.27 0.03 27.23 27.29 0.06 0.02 Indonesia 26.22 26.11 -0.11 26.25 26.11 -0.13 -0.03 Tunisia 20.46 20.69 0.22 20.48 20.73 0.25 0.03 S Korea 11.58 11.40 -0.18 11.56 11.52 -0.05 0.13 Vietnam 24.57 24.55 -0.02 24.59 24.60 0.01 0.03 Malaysia 25.82 25.74 -0.07 25.84 25.77 -0.07 0.01 Source: World Bank; HSBC
Appendix 6 – full datasets

57
CLIMATE CHANGE ● GLOBAL
March 2018
Table ii: Water risk indicators
Water resource per
capita (m3 /person/ yr.)
Water resource pc. Change (%
change) (Δ1) (Δ2)
Momentum (Δ2-Δ1)
Water resource per
capita (m3 /person/ yr.)
Water resource pc. Change (%
change) (Δ1) (Δ2)
Momentum(Δ2-Δ1)
Country 2014 2016 % Difference
between 2014 & 2016
Change over
2004-2014
Change over
2006-2016
Difference in the
decade change
Country 2014 2016 % Difference
between 2014 & 2016
Change over
2004-2014
Change over
2006-2016
Difference in the
decade change
Weights in exposure scores 25% 25% 25% 25%
Developed Market (DM) Emerging Market (EM) – cont. Australia 20,971 20,392 -2.8 -14.2 -14.2 0.0 Mexico 3,718 3,622 -2.6 -13.9 -13.7 0.2 Austria 9,097 8,883 -2.4 -4.3 -5.5 -1.1 Pakistan 1,330 1,277 -4.0 -18.7 -18.7 0.0 Belgium 1,633 1,613 -1.2 -7.0 -7.1 0.0 Peru 60,697 59,168 -2.5 -11.9 -12.0 -0.1 Canada 81,644 79,975 -2.0 -10.0 -10.2 -0.3 Philippines 4,785 4,636 -3.1 -15.4 -15.0 0.4 Denmark 1,063 1,047 -1.5 -4.2 -5.1 -0.9 Poland 1,592 1,594 0.2 0.4 0.5 0.1 Finland 20,141 20,018 -0.6 -4.3 -4.2 0.1 Qatar 24 23 -7.6 -68.0 -60.7 7.4 France 3,181 3,154 -0.8 -5.5 -4.9 0.6 Russia 31,463 31,349 -0.4 0.2 -0.9 -1.1 Germany 1,902 1,863 -2.0 1.9 -0.4 -2.2 S Arabia 78 74 -4.6 -24.5 -23.8 0.7 Ireland 11,262 10,894 -3.3 -11.8 -10.5 1.4 S Africa 948 918 -3.2 -13.2 -13.7 -0.5 Israel 217 208 -3.9 -17.1 -17.5 -0.4 Thailand 6,411 6,369 -0.6 -5.0 -4.4 0.6 Italy 3,147 3,157 0.3 -5.1 -4.1 1.1 Turkey 2,747 2,661 -3.1 -13.0 -13.5 -0.5 Japan 3,378 3,386 0.2 0.4 0.7 0.3 UAE 17 16 -2.1 -54.9 -43.4 11.5
Netherlands 5,396 5,347 -0.9 -3.5 -4.0 -0.5 Frontier Market (FM) New Zealand 72,510 69,683 -3.9 -9.4 -10.8 -1.5 Argentina 20,386 19,983 -2.0 -9.9 -9.8 0.1 Norway 76,500 75,101 -1.8 -10.6 -10.9 -0.3 Bahrain 87 81 -6.2 -37.9 -32.8 5.2 Portugal 7,442 7,497 0.7 0.8 1.9 1.1 Bangladesh 7,697 7,530 -2.2 -11.4 -10.8 0.6 Singapore 110 107 -2.5 -23.8 -21.5 2.3 Croatia 24,892 25,296 1.6 4.7 6.5 1.7 Spain 2,399 2,401 0.1 -7.7 -4.4 3.3 Estonia 9,745 9,730 -0.1 3.7 2.3 -1.3 Sweden 17,945 17,570 -2.1 -7.2 -8.3 -1.1 Jordan 106 99 -6.8 -37.2 -37.2 -0.1 Switzerland 6,533 6,390 -2.2 -9.8 -10.6 -0.9 Kazakhstan 6,270 6,091 -2.9 -13.2 -14.0 -0.8 UK 2,275 2,240 -1.6 -7.2 -7.3 -0.1 Kenya 667 633 -5.0 -23.8 -23.5 0.2 USA 9,634 9,498 -1.4 -8.1 -7.7 0.4 Kuwait 5 5 -6.7 -41.6 -41.3 0.3
Emerging Market (EM) Lebanon 804 750 -6.7 -31.1 -32.5 -1.4 Brazil 42,343 41,642 -1.7 -9.5 -9.0 0.6 Lithuania 8,355 8,530 2.1 15.2 13.8 -1.3 Chile 52,408 51,542 -1.7 -9.3 -8.9 0.4 Mauritius 2,182 2,177 -0.2 -3.2 -2.3 0.8 China 2,082 2,060 -1.0 -5.0 -4.9 0.1 Morocco 845 822 -2.7 -12.1 -12.5 -0.4 Colombia 49,381 48,506 -1.8 -10.6 -9.9 0.7 Nigeria 1,622 1,539 -5.1 -23.3 -23.3 0.0 Czech Republic 1,249 1,245 -0.3 -3.1 -3.1 0.1 Oman 353 316 -10.5 -38.3 -41.6 -3.3 Egypt 635 609 -4.1 -17.9 -18.3 -0.4 Romania 10,648 10,759 1.0 7.7 7.6 -0.2 Greece 6,280 6,365 1.4 0.6 2.5 2.0 Serbia 22,747 22,983 1.0 4.7 5.0 0.4 Hungary 10,541 10,593 0.5 2.4 2.6 0.1 Slovenia 15,456 15,435 -0.1 -3.2 -2.8 0.3 India 1,477 1,443 -2.3 -13.0 -12.2 0.7 Sri Lanka 2,542 2,490 -2.0 -7.4 -7.9 -0.5 Indonesia 7,914 7,732 -2.3 -12.4 -12.0 0.4 Tunisia 414 405 -2.3 -10.1 -10.6 -0.5 S Korea 1,373 1,360 -1.0 -5.2 -5.5 -0.2 Vietnam 9,744 9,537 -2.1 -10.2 -10.1 0.1 Malaysia 19,187 18,597 -3.1 -16.7 -16.2 0.5 Source: Aqua Stat, FAO; World Bank; HSBC

CLIMATE CHANGE ● GLOBAL
March 2018
58
Table iii: Exposure and sensitivity to extreme events _____________ Exposure ______________ _______________________________________Sensitivity _______________________________________
______No. of disasters (per 10,000 sq. km) _____ _Disaster damages (per 1000 GDP)_ __ Deaths (per million pop.) ___ People affected (per 1000 pop.) Country 1997-2006 2007-2016 Change (%) 1997-2006 2007-2016 Change (%) 1997-2006 2007-2016 Change (%) 1997-2006 2007-2016 Change (%) Weights in: Exposure 15% : Sensitivity 40% 30% 30%
Developed markets
Australia 0.08 0.06 -27.87 0.83 2.13 155.77 0.36 3.41 839.51 3.25 15.25 369.04 Austria 1.33 1.21 -9.03 1.05 0.65 -38.66 4.54 0.25 -94.53 7.63 0.02 -99.69 Belgium 4.95 4.95 0.00 0.02 0.19 >1,000 20.59 3.87 -81.18 0.35 0.07 -80.43 Canada 0.04 0.03 -31.43 0.22 0.91 318.22 0.25 0.09 -64.78 2.10 6.42 206.01 Denmark 0.71 0.95 34.73 1.30 0.03 -97.68 0.22 0.04 -84.00 0.00 0.00 Finland 0.03 0.00 -100.00 0.00 0.00 0.00 0.00 0.08 0.00 -100.00 France 0.82 0.58 -28.89 0.84 0.51 -39.28 34.30 5.28 -84.62 57.98 7.83 -86.49 Germany 0.72 0.66 -8.03 0.62 0.83 32.95 11.56 0.11 -99.08 5.31 0.08 -98.50 Ireland 0.87 0.58 -33.33 0.11 0.13 14.58 0.28 0.09 -68.85 0.13 0.13 2.80 Israel 2.31 2.31 0.00 0.07 0.32 371.35 0.28 0.64 129.06 0.22 265.47 >1,000 Italy 0.71 0.99 38.10 0.72 0.30 -58.83 35.24 0.31 -99.11 1.01 0.34 -66.33 Japan 1.34 1.65 22.43 0.74 0.26 -65.36 0.54 1.03 91.36 11.93 4.49 -62.38 Netherlands 2.67 2.37 -10.93 0.13 0.17 33.47 12.29 0.06 -99.51 0.13 0.00 -100.00 New Zealand 0.53 0.27 -50.00 0.50 0.74 48.53 0.23 0.09 -60.20 2.08 0.35 -83.08 Norway 0.08 0.05 -33.33 0.03 0.00 -100.00 0.00 0.08 0.46 0.12 -74.02 Portugal 1.64 1.31 -20.12 2.15 0.77 -64.36 31.59 0.60 -98.10 14.58 0.56 -96.13 Singapore N.A. N.A. N.A. N.A. N.A. N.A. N.A. N.A. N.A. N.A. N.A. N.A. Spain 0.46 0.34 -26.26 0.60 0.22 -63.55 36.61 0.13 -99.63 0.10 0.18 75.46 Sweden 0.10 0.02 -74.81 0.73 0.00 -100.00 0.12 0.07 -40.18 0.00 0.00 Switzerland 3.04 3.04 0.01 0.87 0.29 -67.18 14.61 0.18 -98.80 0.76 0.02 -96.88 UK 1.20 1.07 -10.34 0.50 0.70 39.52 0.69 1.31 90.32 4.72 7.38 56.28 USA 0.28 0.25 -12.31 2.33 2.22 -4.49 1.53 0.96 -37.19 35.79 320.19 794.59
Emerging markets
Brazil 0.05 0.06 18.60 0.16 0.51 224.97 0.36 0.98 169.92 65.74 194.90 196.49 Chile 0.32 0.24 -25.00 0.51 1.30 155.86 0.95 1.35 41.32 41.18 24.41 -40.73 China 0.21 0.23 13.99 3.91 2.97 -24.17 1.15 0.66 -42.78 931.07 627.92 -32.56 Colombia 0.24 0.23 -3.70 0.01 1.10 >1,000 1.82 2.64 44.91 45.59 180.35 295.61 Czech Rep. 1.55 1.42 -8.29 2.72 0.72 -73.68 4.83 0.87 -82.03 29.93 125.61 319.73 Egypt 0.06 0.07 16.67 0.00 0.06 >1,000 0.08 0.26 231.89 0.01 0.42 >1,000 Greece 1.78 1.01 -43.48 0.66 0.65 -1.58 0.74 0.91 23.49 1.26 0.74 -41.59 Hungary 1.90 0.88 -53.42 0.48 0.32 -32.84 1.91 5.37 181.67 17.65 7.43 -57.93 India 0.42 0.47 11.20 2.24 2.33 4.34 3.28 1.69 -48.68 598.17 364.65 -39.04 Indonesia 0.26 0.45 72.34 2.01 0.76 -62.08 1.41 0.61 -56.84 16.46 12.44 -24.41 S Korea 3.61 1.44 -60.26 1.63 0.10 -93.61 2.48 0.37 -85.03 14.28 1.54 -89.24 Malaysia 0.85 0.46 -46.43 0.19 0.49 154.96 0.30 0.24 -19.60 11.77 94.96 706.70 Mexico 0.31 0.29 -8.20 1.25 1.81 44.69 2.51 0.59 -76.36 52.12 69.72 33.75 Pakistan 0.58 0.54 -6.67 0.42 10.57 >1,000 2.78 3.85 38.57 90.83 218.51 140.57 Peru 0.16 0.20 19.05 0.01 0.06 362.33 4.40 6.69 52.04 201.56 117.84 -41.54 Philippines 3.05 5.47 79.12 0.78 8.64 >1,000 7.71 15.56 101.89 464.90 1,021.95 119.82 Poland 0.59 0.72 22.28 1.24 0.66 -46.54 2.87 2.99 4.04 6.40 2.72 -57.48 Qatar N.A. N.A. N.A. N.A. N.A. N.A. N.A. N.A. N.A. N.A. N.A. N.A. Russia 0.05 0.02 -62.33 0.31 0.41 31.15 1.40 39.29 >1,000 20.12 1.48 -92.64 S Arabia 0.03 0.06 100.00 0.00 0.21 0.45 1.05 130.74 0.62 0.42 -31.97 S Africa 0.26 0.18 -29.03 0.21 0.38 76.82 0.66 0.55 -15.60 333.31 59.81 -82.05 Thailand 0.88 0.69 -22.22 0.47 12.54 >1,000 1.76 2.18 23.32 353.69 832.76 135.45 Turkey 0.35 0.14 -59.26 0.25 0.06 -75.36 0.53 0.14 -72.93 21.14 0.61 -97.12 UAE N.A. N.A. N.A. N.A. N.A. N.A. N.A. N.A. N.A. N.A. N.A. N.A.
Frontier markets
Argentina 0.12 0.08 -28.13 1.08 0.57 -47.74 0.43 0.44 1.63 22.93 20.58 -10.23 Bahrain N.A. N.A. N.A. N.A. N.A. N.A. N.A. N.A. N.A. N.A. N.A. N.A. Bangladesh 6.30 3.46 -45.12 9.94 2.87 -71.15 4.18 4.50 7.85 478.47 310.77 -35.05 Croatia 2.14 1.97 -8.33 1.19 0.13 -88.83 18.70 0.51 -97.27 0.50 3.00 496.47 Estonia 0.47 0.24 -50.00 0.81 0.00 -100.00 0.22 0.08 -65.37 0.07 0.00 -100.00 Jordan 0.68 0.00 -100.00 0.01 0.00 -100.00 0.30 0.00 -100.00 62.38 0.00 -100.00 Kazakhstan 0.02 0.03 33.33 0.01 0.15 >1,000 0.02 0.32 >1,000 42.52 5.28 -87.58 Kenya 0.39 0.54 40.91 0.04 0.31 600.71 2.25 1.72 -23.53 984.95 409.17 -58.46 Kuwait 0.56 0.00 -100.00 0.00 0.00 0.10 0.00 -100.00 0.10 0.00 -100.00 Lebanon 1.96 3.91 100.00 0.00 0.00 0.00 0.12 4.99 204.60 >1,000 Lithuania 0.96 0.64 -33.30 0.91 0.00 -100.00 1.57 1.28 -18.09 0.00 0.00 Mauritius 14.78 9.85 -33.33 3.28 0.02 -99.42 0.25 1.04 313.73 1.71 0.07 -96.18 Morocco 0.27 0.25 -8.33 1.73 0.33 -80.85 0.73 0.51 -29.70 10.34 29.58 186.17 Nigeria 0.32 0.20 -37.93 0.01 0.14 >1,000 0.53 0.52 -2.56 4.53 54.11 >1,000 Oman 0.06 0.16 150.00 0.12 8.28 >1,000 1.57 3.14 100.38 0.04 7.63 >1,000 Romania 1.87 0.96 -48.86 1.90 0.63 -66.77 2.43 1.71 -29.92 15.75 2.13 -86.50 Serbia 0.00 2.40 0.00 5.38 0.00 1.22 0.00 25.40 Slovenia 0.99 2.48 150.00 0.22 1.35 520.09 14.50 0.44 -96.97 0.00 32.02 Sri Lanka 2.23 4.78 114.29 0.10 3.01 >1,000 1.60 3.40 111.97 232.57 507.50 118.21 Tunisia 0.13 0.19 50.00 0.00 0.00 0.12 0.30 148.96 2.75 0.60 -78.18 Vietnam 2.10 2.00 -4.62 5.31 10.46 97.14 9.04 2.23 -75.33 361.91 200.92 -44.48
Source: EMDAT, World Bank; Note: Values are total over the decade and changes are between the two decades, figures are rounded to two decimal

59
CLIMATE CHANGE ● GLOBAL
March 2018
Table iv: Transition risk exposure
Fossil rents (% GDP) Fossil in export (%) Fossil in energy (%) Fossil rents (% GDP) Fossil in export (%) Fossil in energy (%)
Country 2015 Chg. (2015-05)
2016 Chg. (2016-06)
2016 Chg. (2016-06)
Country 2015 Chg. (2015-05)
2016 Chg. (2016-06)
2016 Chg. (2016-06)
Weights 22% 11% 22% 11% 22% 11% Weights 22% 11% 22% 11% 22% 11%
Developed markets Emerging markets
Australia 0.8 -1.2 25.6 1.6 93.4 -0.9 Mexico 1.5 -3.9 4.8 -10.6 90.4 1.3 Austria 0.1 0.0 1.0 -0.4 66.0 -8.9 Pakistan 0.9 -1.6 0.0 0.0 59.7 -2.0 Belgium 0.0 0.0 6.9 -0.9 75.8 1.9 Peru 0.6 -1.0 6.4 -1.6 79.6 10.6 Canada 0.3 -4.2 15.4 -4.0 73.6 -1.0 Philippines 0.1 -0.2 1.3 -1.0 62.0 5.8 Denmark 0.5 -1.3 3.3 -5.9 65.7 -20.9 Poland 0.3 -0.5 2.3 -1.5 89.9 -6.0 Finland 0.0 0.0 7.5 2.5 39.7 -12.1 Qatar 11.3 -21.2 80.3 -8.7 100.0 0.0 France 0.0 0.0 1.9 -1.6 46.6 -5.3 Russia 9.1 -8.9 47.0 -15.7 90.2 -0.4 Germany 0.0 -0.1 1.4 -0.7 79.8 -1.5 S Arabia 23.3 -28.5 70.3 -14.0 100.0 0.0 Ireland 0.0 0.0 0.5 -0.1 85.4 -5.6 S Africa 1.3 -1.4 8.6 -0.9 86.9 -0.2 Israel 0.2 0.1 1.4 1.3 96.3 -0.6 Thailand 0.7 -1.0 3.0 -2.0 79.8 -1.8 Italy 0.1 0.0 2.5 -1.1 79.2 -10.0 Turkey 0.1 -0.1 2.1 -1.9 87.6 -1.4 Japan 0.0 0.0 1.5 0.5 93.7 12.2 UAE 11.9 -10.0 31.7 -30.9 99.8 -0.1
Netherlands 0.5 -0.1 10.9 -0.5 91.4 -1.4 Frontier markets
New Zealand 0.2 -0.1 1.4 -1.3 59.4 -8.3 Argentina 0.8 -4.2 2.5 -12.4 88.5 -0.1 Norway 5.4 -5.9 52.2 -15.1 58.5 1.8 Bahrain 4.9 -0.7 42.1 5.8 100.0 0.0 Portugal 0.0 0.0 5.7 0.8 76.9 -3.9 Bangladesh 0.7 -0.2 0.2 -0.2 73.8 8.4 Singapore 0.0 0.0 11.4 -1.8 97.5 -0.8 Croatia 0.4 -0.1 6.4 -7.4 70.7 -6.9 Spain 0.0 0.0 3.8 -0.7 72.9 -9.6 Estonia 0.1 -0.1 6.7 -8.5 12.3 -19.1 Sweden 0.0 0.0 5.0 -0.1 26.8 -6.6 Jordan 0.0 0.0 0.0 -0.4 97.6 -0.3 Switzerland 0.0 0.0 0.2 -0.2 50.1 -3.8 Kazakhstan 7.0 -17.4 60.6 -8.0 99.2 0.3 UK 0.3 -0.6 6.2 -3.3 80.7 -7.8 Kenya 0.0 0.0 2.6 -5.6 17.2 0.6 USA 0.2 -1.1 6.5 3.2 82.8 -2.9 Kuwait 39.1 -15.6 85.2 -6.7 100.0 0.0
Emerging markets Lebanon 0.0 0.0 2.7 2.1 97.6 4.2
Brazil 0.9 -1.5 6.2 -1.4 59.1 5.7 Lithuania 0.0 -0.2 13.5 -9.7 68.0 6.8 Chile 0.0 0.0 0.7 -1.7 73.3 -0.7 Mauritius 0.0 0.0 1.5 1.4 84.5 5.0 China 0.6 -3.5 1.2 -0.5 87.5 0.7 Morocco 0.0 0.0 0.5 0.0 88.5 3.6 Colombia 2.8 -2.5 47.5 9.6 76.7 1.4 Nigeria 3.4 -27.3 89.1 -7.7 19.0 -0.7 Czech Rep. 0.1 -0.5 1.2 -0.6 76.0 -7.0 Oman 22.9 -21.8 69.2 -17.9 100.0 0.0 Egypt 0.0 0.0 17.9 -29.3 96.0 0.0 Romania 0.8 -1.3 3.1 -6.3 72.8 -12.3 Greece 0.0 -0.1 27.1 14.2 85.1 -7.8 Sri Lanka 0.0 0.0 0.0 0.0 50.3 6.8 Hungary 0.2 -0.2 1.2 -0.7 69.3 -10.7 Serbia 0.3 -1.0 1.7 83.9 -6.3 India 1.2 -1.3 10.6 -4.2 73.5 6.7 Slovenia 0.0 0.0 2.7 2.2 60.9 -8.6 Indonesia 1.3 -5.4 19.3 -8.1 65.6 0.4 Tunisia 2.1 -1.9 5.6 -7.3 88.4 1.8 S Korea 0.0 0.0 5.5 -0.9 82.0 1.5 Vietnam 1.6 -8.4 0.0 0.0 69.8 9.1 Malaysia 2.1 -5.8 14.0 0.3 96.6 -0.1
Source: UNCTAD, World Bank; Note: weights are rounded off to the nearest whole number

CLIMATE CHANGE ● GLOBAL
March 2018
60
Table v: Capacity to respond to climate change
GDP PPP pc Pub. debt SWF pc Eq. risk prem. GINI ________ Governance ________ Education
Country % GDP USD (%) Control of corrpt. Rule of law School enrol, tert.
2016 2015 Latest Jan ‘18 (-2.5 to 2.5) (-2.5 to 2.5) (%)
Weights 12.5% 12.5% 12.5% 12.5% 12.5% 12.5% 12.5% 12.5%
Developed markets
Australia 46,790 37.6 4,381 - 34.7 1.8 1.8 90.3 Austria 50,644 86.2 0.5 30.5 1.5 1.8 81.5 Belgium 46,541 106.1 0.7 28.1 1.6 1.4 75.0 Canada 44,025 91.5 369 - 34.0 2.0 1.8 N.A. Denmark 49,819 45.5 - 28.5 2.2 1.9 82.8 Finland 43,365 62.5 0.5 26.8 2.3 2.0 87.3 France 41,466 96.1 0.6 32.3 1.4 1.4 64.4 Germany 48,885 71.0 - 31.4 1.8 1.6 68.3 Ireland 71,405 78.7 1,781 1.0 31.9 1.6 1.5 83.8 Israel 37,783 64.1 0.8 41.4 1.1 1.0 64.7 Italy 38,345 132.7 2.2 34.7 0.0 0.3 62.5 Japan 41,476 248.0 0.8 32.1 1.5 1.4 63.4 Netherlands 51,320 65.1 - 28.6 2.0 1.9 78.5 New Zealand 39,049 30.0 6,073 - N.A. 2.3 1.9 83.9 Norway 59,385 27.9 190,893 - 26.8 2.2 2.0 76.7 Portugal 30,665 129.0 2.9 35.6 1.0 1.1 61.9 Singapore 88,003 104.7 99,157 - N.A. 2.1 1.8 N.A. Spain 36,462 99.3 2.2 36.0 0.5 1.0 89.7 Sweden 49,508 43.4 - 27.2 2.2 2.0 62.3 Switzerland 63,741 45.7 - 32.5 2.1 1.9 57.7 UK 43,081 89.0 0.6 34.1 1.9 1.6 56.5 USA 57,638 105.2 484 - 41.0 1.3 1.7 85.8
Emerging markets
Brazil 15,153 73.7 3.5 51.3 -0.4 -0.1 50.6 Chile 23,960 17.5 0.7 47.7 1.1 1.1 88.6 China 15,559 42.9 1,190 0.8 42.2 -0.3 -0.2 43.4 Colombia 14,181 50.6 2.2 51.1 -0.3 -0.3 55.7 Czech Rep. 35,140 40.3 0.8 25.9 0.5 1.1 65.0 Egypt 11,150 89.0 7.5 31.8 -0.6 -0.4 36.2 Greece 26,526 176.9 10.4 35.8 -0.1 0.2 113.9 Hungary 26,997 75.3 2.5 30.9 0.1 0.5 50.9 India 6,583 69.1 2.2 35.2 -0.3 -0.1 26.9 Indonesia 11,632 27.3 2.5 39.5 -0.4 -0.4 24.3 S Korea 35,751 37.9 2,387 0.6 31.6 0.4 1.1 93.2 Malaysia 27,736 57.4 1,119 1.4 46.3 0.1 0.5 26.1 Mexico 17,877 54.0 1.4 48.2 -0.8 -0.5 29.9 Pakistan 5,246 63.6 7.5 30.7 -0.9 -0.8 9.9 Peru 13,044 24.0 1.4 44.3 -0.4 -0.5 40.5 Philippines 7,819 34.8 2.2 40.1 -0.5 -0.4 35.8 Poland 27,923 51.3 1.0 32.1 0.7 0.7 68.1 Qatar 127,728 39.8 124,523 0.7 N.A. 0.9 0.9 14.5 Russia 23,163 16.4 702 2.9 37.7 -0.9 -0.8 80.4 S Arabia 54,522 5.0 22,243 0.8 N.A. 0.2 0.5 63.1 S Africa 13,248 49.8 2.5 63.4 0.0 0.1 19.4 Thailand 16,946 42.7 1.8 37.8 -0.4 0.0 48.9 Turkey 24,412 32.9 2.9 41.2 -0.2 -0.2 94.7 UAE 72,540 18.1 140,944 0.6 N.A. 1.3 0.9 N.A.
Frontier markets
Argentina 19,979 52.1 6.3 42.7 -0.3 -0.3 82.9 Bahrain 46,867 61.9 7,438 5.2 N.A. -0.1 0.5 43.3 Bangladesh 3,587 31.7 4.2 32.1 -0.8 -0.6 13.4 Croatia 23,732 86.7 3.5 32.2 0.2 0.4 69.1 Estonia 29,620 9.7 0.8 34.6 1.2 1.2 69.6 Jordan 9,065 93.4 5.2 33.7 0.3 0.3 44.9 Kazakhstan 25,331 21.9 6,788 2.5 26.5 -0.8 -0.4 46.3 Kenya 3,161 51.3 5.2 N.A. -0.9 -0.5 4.1 Kuwait 74,408 11.2 129,300 0.6 N.A. -0.2 0.0 27.0 Lebanon 14,337 138.4 7.5 31.8 -1.0 -0.9 38.5 Lithuania 29,966 42.8 1.4 37.7 0.7 1.0 68.5 Mauritius 21,144 58.6 1.8 35.8 0.3 0.8 36.7 Morocco 7,838 64.1 2.9 N.A. -0.1 -0.1 28.1 Nigeria 5,872 11.5 16 6.3 43.0 -1.0 -1.1 10.1 Oman 42,826 14.9 5,424 2.2 0.0 0.4 0.4 7.8 Romania 23,626 39.3 2.5 27.5 0.0 0.3 53.2 Serbia 14,725 77.4 4.2 29.1 -0.3 -0.1 58.3 Slovenia 33,421 83.2 1.8 25.7 0.8 1.1 82.9 Sri Lanka 12,337 76.0 5.2 39.2 -0.3 0.0 19.8 Tunisia 11,618 55.7 5.2 35.8 -0.1 0.0 34.6 Vietnam 6,435 58.3 5 5.2 34.8 -0.4 0.0 28.8
Source: World Bank, IMF, SWF Institute, Note: Equity risk premium is marked against matured market rate, School enrol.- tertiary value captures all the enrolment against the corresponding. age group (could be >100), N.A.= not available, GINI, governance and education data points are the latest available

61
CLIMATE CHANGE ● GLOBAL
March 2018
Disclosure appendix
Analyst Certification
The following analyst(s), economist(s), or strategist(s) who is(are) primarily responsible for this report, including any analyst(s)
whose name(s) appear(s) as author of an individual section or sections of the report and any analyst(s) named as the covering
analyst(s) of a subsidiary company in a sum-of-the-parts valuation certifies(y) that the opinion(s) on the subject security(ies) or
issuer(s), any views or forecasts expressed in the section(s) of which such individual(s) is(are) named as author(s), and any other
views or forecasts expressed herein, including any views expressed on the back page of the research report, accurately reflect
their personal view(s) and that no part of their compensation was, is or will be directly or indirectly related to the specific
recommendation(s) or views contained in this research report: Ashim Paun, Lucy Acton, Wai-Shin Chan, CFA, James Pomeroy,
Charles Swabey, Kim Fustier, Tarek Soliman, CFA, Gordon Gray, Laurie Fitzjohn-Sykes, CFA and Tessie Petion
Important disclosures
Equities: Stock ratings and basis for financial analysis
HSBC and its affiliates, including the issuer of this report (“HSBC”) believes an investor's decision to buy or sell a stock should
depend on individual circumstances such as the investor's existing holdings, risk tolerance and other considerations and that
investors utilise various disciplines and investment horizons when making investment decisions. Ratings should not be used or
relied on in isolation as investment advice. Different securities firms use a variety of ratings terms as well as different rating
systems to describe their recommendations and therefore investors should carefully read the definitions of the ratings used in
each research report. Further, investors should carefully read the entire research report and not infer its contents from the rating
because research reports contain more complete information concerning the analysts' views and the basis for the rating.
From 23rd March 2015 HSBC has assigned ratings on the following basis:
The target price is based on the analyst’s assessment of the stock’s actual current value, although we expect it to take six to 12
months for the market price to reflect this. When the target price is more than 20% above the current share price, the stock will
be classified as a Buy; when it is between 5% and 20% above the current share price, the stock may be classified as a Buy or a
Hold; when it is between 5% below and 5% above the current share price, the stock will be classified as a Hold; when it is between
5% and 20% below the current share price, the stock may be classified as a Hold or a Reduce; and when it is more than 20%
below the current share price, the stock will be classified as a Reduce.
Our ratings are re-calibrated against these bands at the time of any 'material change' (initiation or resumption of coverage, change
in target price or estimates).
Upside/Downside is the percentage difference between the target price and the share price.
Prior to this date, HSBC’s rating structure was applied on the following basis:
For each stock we set a required rate of return calculated from the cost of equity for that stock’s domestic or, as appropriate,
regional market established by our strategy team. The target price for a stock represented the value the analyst expected the
stock to reach over our performance horizon. The performance horizon was 12 months. For a stock to be classified as Overweight,
the potential return, which equals the percentage difference between the current share price and the target price, including the
forecast dividend yield when indicated, had to exceed the required return by at least 5 percentage points over the succeeding 12
months (or 10 percentage points for a stock classified as Volatile*). For a stock to be classified as Underweight, the stock was
expected to underperform its required return by at least 5 percentage points over the succeeding 12 months (or 10 percentage
points for a stock classified as Volatile*). Stocks between these bands were classified as Neutral.
*A stock was classified as volatile if its historical volatility had exceeded 40%, if the stock had been listed for less than 12 months
(unless it was in an industry or sector where volatility is low) or if the analyst expected significant volatility. However, stocks which
we did not consider volatile may in fact also have behaved in such a way. Historical volatility was defined as the past month's
average of the daily 365-day moving average volatilities. In order to avoid misleadingly frequent changes in rating, however,
volatility had to move 2.5 percentage points past the 40% benchmark in either direction for a stock's status to change.

CLIMATE CHANGE ● GLOBAL
March 2018
62
Rating distribution for long-term investment opportunities
As of 15 March 2018, the distribution of all independent ratings published by HSBC is as follows:
For the purposes of the distribution above the following mapping structure is used during the transition from the previous to current
rating models: under our previous model, Overweight = Buy, Neutral = Hold and Underweight = Sell; under our current model Buy
= Buy, Hold = Hold and Reduce = Sell. For rating definitions under both models, please see “Stock ratings and basis for financial
analysis” above.
For the distribution of non-independent ratings published by HSBC, please see the disclosure page available at
http://www.hsbcnet.com/gbm/financial-regulation/investment-recommendations-disclosures.
To view a list of all the independent fundamental ratings disseminated by HSBC during the preceding 12-month period, please
use the following links to access the disclosure page:
Clients of Global Research and Global Banking and Markets: www.research.hsbc.com/A/Disclosures
Clients of HSBC Private Banking: www.research.privatebank.hsbc.com/Disclosures
HSBC and its affiliates will from time to time sell to and buy from customers the securities/instruments, both equity and debt
(including derivatives) of companies covered in HSBC Research on a principal or agency basis.
Analysts, economists, and strategists are paid in part by reference to the profitability of HSBC which includes investment banking,
sales & trading, and principal trading revenues.
Whether, or in what time frame, an update of this analysis will be published is not determined in advance.
Non-U.S. analysts may not be associated persons of HSBC Securities (USA) Inc, and therefore may not be subject to FINRA
Rule 2241 or FINRA Rule 2242 restrictions on communications with the subject company, public appearances and trading
securities held by the analysts.
Economic sanctions imposed by the EU and OFAC prohibit transacting or dealing in new debt or equity of Russian SSI entities.
This report does not constitute advice in relation to any securities issued by Russian SSI entities on or after July 16 2014 and as
such, this report should not be construed as an inducement to transact in any sanctioned securities.
For disclosures in respect of any company mentioned in this report, please see the most recently published report on that company
available at www.hsbcnet.com/research. HSBC Private Banking clients should contact their Relationship Manager for queries
regarding other research reports. In order to find out more about the proprietary models used to produce this report, please contact
the authoring analyst.
Additional disclosures
1 This report is dated as at 19 March 2018.
2 All market data included in this report are dated as at close 15 March 2018, unless a different date and/or a specific time of
day is indicated in the report.
3 HSBC has procedures in place to identify and manage any potential conflicts of interest that arise in connection with its
Research business. HSBC's analysts and its other staff who are involved in the preparation and dissemination of
Research operate and have a management reporting line independent of HSBC's Investment Banking business.
Information Barrier procedures are in place between the Investment Banking, Principal Trading, and Research businesses
to ensure that any confidential and/or price sensitive information is handled in an appropriate manner.
4 You are not permitted to use, for reference, any data in this document for the purpose of (i) determining the interest
payable, or other sums due, under loan agreements or under other financial contracts or instruments, (ii) determining the
price at which a financial instrument may be bought or sold or traded or redeemed, or the value of a financial instrument,
and/or (iii) measuring the performance of a financial instrument.
Buy 46% ( 28% of these provided with Investment Banking Services )
Hold 41% ( 26% of these provided with Investment Banking Services )
Sell 13% ( 17% of these provided with Investment Banking Services )

63
CLIMATE CHANGE ● GLOBAL
March 2018
MSCI Disclaimer
The MSCI sourced information is the exclusive property of MSCI Inc. (MSCI). Without prior written permission of MSCI, this
information and any other MSCI intellectual property may not be reproduced, redisseminated or used to create any financial
products, including any indices. This information is provided on an “as is” basis. The user assumes the entire risk of any use made
of this information. MSCI, its affiliates and any third party involved in, or related to, computing or compiling the information hereby
expressly disclaim all warranties of originality, accuracy, completeness, merchantability or fitness for a particular purpose with
respect to any of this information. Without limiting any of the foregoing, in no event shall MSCI, any of its affiliates or any third
party involved in, or related to, computing or compiling the information have any liability for any damages of any kind. MSCI and
the MSCI indexes are services marks of MSCI and its affiliates.
Production & distribution disclosures
1. This report was produced and signed off by the author on 16 Mar 2018 13:42 GMT.
2. In order to see when this report was first disseminated please see the disclosure page available at
https://www.research.hsbc.com/R/34/NWFgvbM

CLIMATE CHANGE ● GLOBAL
March 2018
64
Disclaimer Legal entities as at 30 November 2017
‘UAE’ HSBC Bank Middle East Limited, Dubai; ‘HK’ The Hongkong and Shanghai Banking Corporation Limited, Hong Kong;
‘TW’ HSBC Securities (Taiwan) Corporation Limited; 'CA' HSBC Securities (Canada) Inc.; HSBC Bank, Paris Branch; HSBC
France; ‘DE’ HSBC Trinkaus & Burkhardt AG, Düsseldorf; 000 HSBC Bank (RR), Moscow; ‘IN’ HSBC Securities and Capital
Markets (India) Private Limited, Mumbai; ‘JP’ HSBC Securities (Japan) Limited, Tokyo; ‘EG’ HSBC Securities Egypt SAE,
Cairo; ‘CN’ HSBC Investment Bank Asia Limited, Beijing Representative Office; The Hongkong and Shanghai Banking
Corporation Limited, Singapore Branch; The Hongkong and Shanghai Banking Corporation Limited, Seoul Securities
Branch; The Hongkong and Shanghai Banking Corporation Limited, Seoul Branch; HSBC Securities (South Africa) (Pty)
Ltd, Johannesburg; HSBC Bank plc, London, Madrid, Milan, Stockholm, Tel Aviv; ‘US’ HSBC Securities (USA) Inc, New
York; HSBC Yatirim Menkul Degerler AS, Istanbul; HSBC México, SA, Institución de Banca Múltiple, Grupo Financiero
HSBC; HSBC Bank Australia Limited; HSBC Bank Argentina SA; HSBC Saudi Arabia Limited; The Hongkong and Shanghai
Banking Corporation Limited, New Zealand Branch incorporated in Hong Kong SAR; The Hongkong and Shanghai Banking
Corporation Limited, Bangkok Branch; PT Bank HSBC Indonesia; HSBC Qianhai Securities Limited
Issuer of report
HSBC Bank plc
8 Canada Square
London, E14 5HQ, United Kingdom
Telephone: +44 20 7991 8888
Fax: +44 20 7992 4880
Website: www.research.hsbc.com
In the UK this document has been issued and approved by HSBC Bank plc (“HSBC”) for the information of its Clients (as defined in the Rules of FCA) and those of its affiliates only. It is not
intended for Retail Clients in the UK. If this research is received by a customer of an affiliate of HSBC, its provision to the recipient is subject to the terms of business in place between the
recipient and such affiliate.
HSBC Securities (USA) Inc. accepts responsibility for the content of this research report prepared by its non-US foreign affiliate. All U.S. persons receiving and/or accessing this report and
wishing to effect transactions in any security discussed herein should do so with HSBC Securities (USA) Inc. in the United States and not with its non-US foreign affiliate, the issuer of this report.
In Singapore, this publication is distributed by The Hongkong and Shanghai Banking Corporation Limited, Singapore Branch for the general information of institutional investors or other persons
specified in Sections 274 and 304 of the Securities and Futures Act (Chapter 289) (“SFA”) and accredited investors and other persons in accordance with the conditions specified in Sections
275 and 305 of the SFA. This publication is not a prospectus as defined in the SFA. It may not be further distributed in whole or in part for any purpose. The Hongkong and Shanghai Banking
Corporation Limited Singapore Branch is regulated by the Monetary Authority of Singapore. Recipients in Singapore should contact a "Hongkong and Shanghai Banking Corporation Limited,
Singapore Branch" representative in respect of any matters arising from, or in connection with this report.
In Australia, this publication has been distributed by The Hongkong and Shanghai Banking Corporation Limited (ABN 65 117 925 970, AFSL 301737) for the general information of its “wholesale”
customers (as defined in the Corporations Act 2001). Where distributed to retail customers, this research is distributed by HSBC Bank Australia Limited (ABN 48 006 434 162, AFSL No.
232595). These respective entities make no representations that the products or services mentioned in this document are available to persons in Australia or are necessarily suitable for any
particular person or appropriate in accordance with local law. No consideration has been given to the particular investment objectives, financial situation or particular needs of any recipient.
This publication has been distributed in Japan by HSBC Securities (Japan) Limited. It may not be further distributed, in whole or in part, for any purpose. In Hong Kong, this document has been distributed
by The Hongkong and Shanghai Banking Corporation Limited in the conduct of its Hong Kong regulated business for the information of its institutional and professional customers; it is not intended for and
should not be distributed to retail customers in Hong Kong. The Hongkong and Shanghai Banking Corporation Limited makes no representations that the products or services mentioned in this document
are available to persons in Hong Kong or are necessarily suitable for any particular person or appropriate in accordance with local law. All inquiries by such recipients must be directed to The Hongkong
and Shanghai Banking Corporation Limited. In Korea, this publication is distributed by The Hongkong and Shanghai Banking Corporation Limited, Seoul Securities Branch ("HBAP SLS") for the general
information of professional investors specified in Article 9 of the Financial Investment Services and Capital Markets Act (“FSCMA”). This publication is not a prospectus as defined in the FSCMA. It may not
be further distributed in whole or in part for any purpose. HBAP SLS is regulated by the Financial Services Commission and the Financial Supervisory Service of Korea. This publication is distributed in
New Zealand by The Hongkong and Shanghai Banking Corporation Limited, New Zealand Branch incorporated in Hong Kong SAR.
This document is not and should not be construed as an offer to sell or the solicitation of an offer to purchase or subscribe for any investment. HSBC has based this document on information obtained from
sources it believes to be reliable but which it has not independently verified; HSBC makes no guarantee, representation or warranty and accepts no responsibility or liability as to its accuracy or completeness.
The opinions contained within the report are based upon publicly available information at the time of publication and are subject to change without notice. From time to time research analysts conduct site
visits of covered issuers. HSBC policies prohibit research analysts from accepting payment or reimbursement for travel expenses from the issuer for such visits.
Nothing herein excludes or restricts any duty or liability to a customer which HSBC has under the Financial Services and Markets Act 2000 or under the Rules of FCA and PRA. A recipient who chooses to
deal with any person who is not a representative of HSBC in the UK will not enjoy the protections afforded by the UK regulatory regime. Past performance is not necessarily a guide to future performance.
The value of any investment or income may go down as well as up and you may not get back the full amount invested. Where an investment is denominated in a currency other than the local currency of
the recipient of the research report, changes in the exchange rates may have an adverse effect on the value, price or income of that investment. In case of investments for which there is no recognised
market it may be difficult for investors to sell their investments or to obtain reliable information about its value or the extent of the risk to which it is exposed.
In Canada, this document has been distributed by HSBC Securities (Canada) Inc. (member IIROC), and/or its affiliates. The information contained herein is under no circumstances to be construed as
investment advice in any province or territory of Canada and is not tailored to the needs of the recipient. No securities commission or similar regulatory authority in Canada has reviewed or in any way
passed judgment upon these materials, the information contained herein or the merits of the securities described herein, and any representation to the contrary is an offense.
HSBC Bank plc is registered in England No 14259, is authorised by the Prudential Regulation Authority and regulated by the Financial Conduct Authority and the Prudential Regulation Authority
and is a member of the London Stock Exchange. (070905)
If you are an HSBC Private Banking (“PB”) customer with approval for receipt of relevant research publications by an applicable HSBC legal entity, you are eligible to receive this publication. To
be eligible to receive such publications, you must have agreed to the applicable HSBC entity’s terms and conditions (“KRC Terms”) for access to the KRC, and the terms and conditions of any
other internet banking service offered by that HSBC entity through which you will access research publications using the KRC. Distribution of this publication is the sole responsibility of the
HSBC entity with whom you have agreed the KRC Terms.
If you do not meet the aforementioned eligibility requirements please disregard this publication and, if you are a customer of PB, please notify your Relationship Manager. Receipt of research
publications is strictly subject to the KRC Terms, which can be found at https://research.privatebank.hsbc.com/ – we draw your attention also to the provisions contained in the Important Notes
section therein.
© Copyright 2018, HSBC Bank plc, ALL RIGHTS RESERVED. No part of this publication may be reproduced, stored in a retrieval system, or transmitted, on any form or by any means, electronic,
mechanical, photocopying, recording, or otherwise, without the prior written permission of HSBC Bank plc. MCI (P) 116/01/2018, MCI (P) 016/02/2018
[1088475]
*Employed by a non-US affiliate of HSBC Securities (USA) Inc, and is not registered/qualified pursuant to FINRA regulations.
Main contributors
Issuer of report:HSBC Bank plc
8 Canada SquareLondon, E14 5HQ, United Kingdom
Telephone: +44 20 7991 8888Fax: +44 20 7992 4880
Website: www.research.hsbc.com
Lucy Acton ESG Analyst HSBC Bank plc [email protected] +44 20 3359 3365
Charles Swabey* Oil & Gas Analyst HSBC Bank plc [email protected] +44 20 3268 3954
Kim Fustier* Oil & Gas Analyst HSBC Bank plc [email protected] +44 20 3359 2136
Laurie Fitzjohn-Sykes, CFA ESG Analyst HSBC Bank plc [email protected] +44 20 7992 3689
Tessie Petion Head of ESG Research, Americas HSBC Securities (USA) Inc. [email protected] +1 212 525 4866
Ashim Paun Director, Climate Change Strategy HSBC Bank plc [email protected] +44 20 7992 3591
Wai-Shin Chan, CFA Head, Climate Change Centre of Excellence The Hongkong and Shanghai Banking Corporation Limited [email protected] +852 2822 4870
James Pomeroy Economist HSBC Bank plc [email protected] +44 20 7991 6714
Tarek Soliman*, CFA Oil & Gas Analyst HSBC Bank plc [email protected] +44 20 3268 5528
Gordon Gray* Global Head of Oil and Gas Equity Research HSBC Bank plc [email protected] +44 20 7991 6787
Top Related