


Languages
Pages
Legal


139
Seven Centuries of Energy Services: The Price and Use of Light in the United Kingdom (1300-2000)1
Roger Fouquet* and Peter J.G. Pearson**
Before the mid-eighteenth century, most people lived in near-complete darkness except in the presence of sunlight and moonlight. Since then, the provision of artificial light has been revolutionised by a series of innovations in appliances, fuels, infrastructures and institutions that have enabled the growing demands of economic development for artificial light to be met at dramatically lower costs: by the year 2000, while United Kingdom GDP per capita was 15 times its 1800 value, lighting services cost less than one three thousandth of their 1800 value, per capita use was 6,500 times greater and total lighting consumption was 25,000 times higher than in 1800. The economic history of light shows how focussing on developments in energy service provision rather than simply on energy use and prices can reveal the ‘true’ declines in costs, enhanced levels of consumption and welfare gains that have been achieved. While emphasising the value of past experience, the paper also warns against the dangers of over-reliance on past trends for the long-run forecasting of energy consumption given the potential for the introduction of new technologies and fuels, and for rebound and saturation effects.
1. INTRODUCTION
Over the last three centuries, industrialised societies have been freed from dependence on sun and moonlight for illumination: technological innovation, mass production of lighting appliances, expansion of energy infrastructures and
The Energy Journal, Vol. 27, No. 1. Copyright ©2006 by the IAEE. All rights reserved.
* Lecturer, Department of Economics, University of the South Pacific, Suva, Fiji, and Visiting Research Fellow, Centre for Energy Policy & Technology (ICEPT), Imperial College London, Faculty of Life Sciences, South Kensington Campus, London, UK. email: [email protected].
** Director, Centre for Energy Policy & Technology (ICEPT), Imperial Collge London, Faculty of Life Sciences, South Kensington Campus, London SW7 2AZ, UK. email: [email protected].
1. An earlier version of this paper was presented at the British Institute of Energy Economics/IAEE conference. Government Intervention in Energy Markets. St John’s College, Oxford, 25-26 Sept 2003. The authors would like to thank Dave Woodcock and Jon Newman, four anonymous referees and Campbell Watkins for their constructive comments. All errors are the authors’ responsibility.
140 / The Energy Journal
networks, falling costs of fuels, rising incomes and social and cultural change have revolutionised our desire and ability to illuminate. Substantial economic welfare, resource and environmental consequences have flowed from these changes in lighting services. The purpose of this paper is to present evidence on the decline in the cost of illumination and the associated rise in light use, from the fourteenth century to the present day, in what was to become the United Kingdom. An investigation into the economic and technological history of lighting identifies useful lessons for our understanding of energy markets: it enables us to analyse the consumption, costs and quality of energy services, rather than energy (since demand is for the flow of services of illumination - and other attractive or unattractive attributes - supplied by the light source); and it also helps us to understand how energy markets and market institutions are born, grow and decline, how innovations are developed and diffused, and how governments play their parts in service provision and market regulation.2
There have been previous long run indicators of the cost of fuel and light in the United Kingdom (including the detail in Phelps-Brown and Hopkins 1956, Feinstein 1972, or Fouquet and Pearson 2003b). However, these series do not take into account the efficiency with which energy consuming technologies use and convert the energy flows. Thus, they measure the price of energy, not the price of the energy service. William Nordhaus (1997) addressed this failure by estimating the efficiencies of lighting technologies, and then combining them with the price of the energy source, to create a ‘true’ price of light series for the U.S., which was dramatically different from the conventional light price index.3 This paper builds on Nordhaus’s pioneering approach, creating a much more detailed study of the technological changes and their impact on the price of lighting services, and focussing on the United Kingdom. It also extends Nordhaus’s paper by incorporating consumption data, and, therefore, identifying a relationship between the price of energy services, economic development and the consumption of energy services.
There is also a wider context in which the evolution of energy service markets should be understood: climate change scenarios often draw on CO2 emissions projections that are based on extrapolated trends in the relationship between fossil energy use, GDP growth, and fuel prices. But better insights about future fuel use and emissions might come from understanding the two-stage relationships between: (i) energy use, energy technologies and delivered energy services; (ii) and between energy service consumption, GDP growth and the costs and prices of energy services. As yet, however, both the impact of innovation
2. See also Fouquet and Pearson (2003a, 2003b) and Smil (1993).3. He estimated that between 1800 and 2000 the conventional price of light in the U.S. rose by a
factor of 1000 relative to the ‘true’ price. He used the ‘true’ series to suggest that if similar biases were found in other price indexes, real output and wage measures would not “capture reality” by failing to allow for quality changes (Nordhaus 1997). He argues that “conventional price indexes ignore the impact of revolutionary new products on the cost of living by linking them into the price index, which implicitly assumes that they offer no additional enhancement of economic welfare” (Nordhaus 1998).

Seven Centuries of Energy Services / 141
on energy service provision and costs and the evolution of demand over waves of socio-technical development are poorly understood. In this paper, we aim to contribute to this understanding using lighting in the United Kingdom as a specific example.
At the same time, as economists, we are not trying to provide a formal historical analysis of artificial lighting. The richness and complexity of treatment that this would deserve is beyond our scope and skills (O’Dea 1956, Schivelbusch 1988, Bower 1998). This paper offers a modest illustration of the dramatic transformations that have occurred in the cost and provision of artificial illumination over the last seven hundred years.
The paper has eleven parts: the next section identifies the data sources and explains how the series were constructed. Section 3 outlines the behaviour of GDP, population and the general level of prices between 1500 and 2000; section 4 explores candlelight before the eighteenth century, while section5 examines its growth during the eighteenth and nineteenth centuries, including the significant technological advances in candle-making; section 6 discusses oil lamps before the nineteenth century; section 7 examines the era of gas (1820-1920); section 8 addresses the expansion of electric lighting (1890-1939); section 9 examines electric lighting after World War II; section 10 reviews the changes in key variables that influenced lighting use over seven centuries, with a particular focus on the period 1800-2000; and section 11 concludes the paper.
2. DATA SOURCES AND METHODS4
An assessment of the evolution of the cost and use of artificial illumination services requires statistical information on prices and consumption of lighting fuels, on lighting technologies and their efficiencies, and on variables that help to explain service consumption patterns. The following outlines the principal sources and methods used to assemble the data series associated with lighting fuels, prices, consumption and technologies. Other data series used in the paper, including economic output and population, are discussed further in Fouquet and Pearson (1998, 2003b).
There is a surprising amount of annual or periodic information on the history of lighting in Britain, available from markets, schools, colleges, hospitals and government departments around the country, which goes back over several centuries. However, despite their relative richness, it is necessary to stress that the data presented and discussed below should be interpreted with caution. Hatcher (1993 p.572) raises specific concerns about creating a single national price index for energy products in early periods, and these concerns are accepted. Especially for the early centuries, the data are often drawn from the records of one or a few institutions that bought fuel for lighting in the South of England, and so are not representative of Britain as a whole. Moreover, the development of national energy
4. Further details of data and estimation methods are available from the authors (see also Fouquet and Pearson 1998).

142 / The Energy Journal
markets was limited by the growth of transport networks and related institutions. In some other cases, the data are interpolations based on information for previous and later years. In particular, while ‘annual’ data for ‘the United Kingdom’ are shown, there are considerable margins of error and data gaps, notably before the mid-nineteenth century. Hence, it is wiser to focus on the broader trends and the orders of magnitude differences over several decades or one technological revolution and the next, rather than on individual year-on-year changes.
2. 1. Outline of Price Data
2.1.1. Candles
Information about the price of candles can be found from the fourteenth century onwards, partly thanks to Thorold Rogers’ considerable efforts in collecting data from market towns across England (Rogers 1883). His first figure dates back to 1265, and from 1320 there are data for virtually every year up to 1700. William Beveridge took up the baton with his volumes that drew on data from old English institutions, including Eton and Westminster Colleges, Greenwich Hospital and the Navy. From the seventeenth century up to 1830, there are thus numerous time series that we have combined to assemble a price series for tallow candles (i.e. candles made from moulded animal fat) for England, by weighting each series according to its length, location and likely reliability. While Beveridge provides series for wax candles, they were a luxury commodity and, therefore, do not reflect the average cost of lighting to the majority of the population. Although the wax series provides insights into the premium paid at a particular period for higher quality light, the time series presented here is for tallow candles.
2.1.2. Whale Oil
Jackson (1978) is the principal source of information on whale oil prices (and also provides a valuable commentary on the economic history of the British whaling industry). There are data for the price of Sperm Whale oil. However, because it provided relatively high quality illumination, it was more expensive and exclusive than other whale oils. Consequently, we present here the price series for Right Whale oil, which provides a basis for assessing the cost of using oil in lamps. We have not tried to assemble series for fish and vegetable oils, not least because their regional price variations were much greater than those for whale oil. Price series for fish or, say, rapeseed oil (‘colza oil’) would be valuable because they might help in estimating the value of switching fuel between lamp fuels.
2.1.3. Gas
Town gas prices are available from 1823 for different gas companies, mostly in the South East of England, and published in sources in the British

Seven Centuries of Energy Services / 143
Parliamentary Papers.5 We have created a time series for an average price of gas for the period up to 1935. After this, the successive ministries associated with energy provide a United Kingdom gas price, although, by then, gas was used less for lighting and increasingly for heating.
2.1.4. Petroleum
From 1857, an average refined petroleum price series can be found in the Parliamentary Papers; this provides an appropriate indicator because lighting and lubrication were the main uses of petroleum until the early twentieth century. From 1903, explicit prices for kerosene (also referred to as paraffin, lamp oil or burning oil) are presented.
2.1.5. Electricity
The first British statistics on electricity prices date from 1898 and are presented by the Administrative Council of London – and, therefore, reflect costs to Londoners rather than the whole of the United Kingdom. Following a gap of four years in the series, between 1919 and 1922, national electricity prices have been published from 1923 to date (in the annual Digests of UK Energy Statistics and their precursor, the Ministry of Fuel and Power Statistical Digest).
Except where stated, all prices quoted throughout the paper are in real terms (i.e. in £(2000) money). The retail price index (discussed in the next section) is from Officer (2004). Thus, our costs of using different lighting fuels and technologies are broadly comparable across time.
2.2. Outline of Consumption Data
2.2.1. Candles
Estimates of tallow candle consumption are available between 1711 and 1830, providing a useful early indicator of light consumption (Mitchell 1988 p. 412). The figures are based on candles for which tax was paid (see the discussion of the Candle Tax, below). Tax evasion was relatively common in the candle-making industry, since the production process was short and the duty high (Mitchell 1988 p. 398). Although the overall production is understated in the series, the degree of understatement is thought to be relatively constant (Fine p. 219 in Mitchell 1988 p. 398).
5. British Parliamentary Papers are documents submitted to the Houses of Parliament during each session of Parliament and bound in volumes at the end of each session. The extensive historical material ranges from the reports of Royal Commissions and committees of inquiry to Parliamentary correspondence. For further information and sources, see www.bopcris.ac.uk/.

144 / The Energy Journal
2.2.2. Whale Oil
Jackson (1978) provides the basis for data on whale oil consumption. Although there are separate data on the consumption of Right Whale oil and Sperm whale oil, and we only present the price series for Right Whale oil, to avoid presenting too much information we have brought the two series together (having taken account of their different quality of illumination) to produce a single series for ‘all whale oil’ use. Based on evidence in Jackson (1978), before 1750 Sperm Whale oil provided only about one tenth of the total whale oil illumination. This rose to around four-tenths by the end of the eighteenth century, and fell back to one-quarter in the first half of the nineteenth century. Unfortunately, it was impossible to collect any indicators of the consumption of fish and vegetable oils for lighting, as they were used for many other purposes as well, and were often not traded but made within the household. This means that, up to the second-half of the nineteenth century, this paper is likely to have underestimated the proportion of oils used for lighting, compared with candles and gas.
2.2.3. Gas
For town gas, the British consumption figures start in 1881 (Mitchell 1988 p. 269). Before then, estimates of gas consumption for London are available from 1822. They have been extrapolated to represent the whole country (using the 1881 ratio between London and country consumption as an anchor, which was one-third, and increasing the share of London consumption going back to 1822). Later gas consumption data also come from the Parliamentary Papers, then the Ministry of Fuel and Power Statistical Digest and then the Digest of UK Energy Statistics.
2.2.4. Kerosene
Kerosene consumption figures in the Parliamentary Papers are based initially (from 1863) on estimating the proportion of refined petroleum used as a lighting fuel. From 1910 onwards, actual kerosene data are provided in the statistical digests of the energy ministries. These help provide a basis for estimating the proportion of the total used as a lighting fuel, needed for the period before 1910.
2.2.5. Electricity
Pre-1920 electricity sales are collected in Mitchell (1988 p. 263), then the usual statistical Digests from the ministries associated with energy. We have estimated the proportion of this consumption used for lighting. The Ministry of Fuel and Power (1951) Digest provides actual electricity figures used for lighting between 1924 and 1949. Estimates of the proportion of lighting consumption between 1900 and 1924 are interpolated, with an assumption that at the turn of

Seven Centuries of Energy Services / 145
the century 60% of electricity was for lighting. Mills (2002) indicates that in 1997 14% of United Kingdom electricity use was for lighting.
2.2.6. Proportions of Gas, Petroleum and Electricity Consumption Devoted to Lighting Use
Table 1 shows our estimates of the proportions of each fuel that was used for lighting purposes for ten-year intervals from 1800 to 2000.
Table 1. Estimates of the Proportion of Fuel Consumption Used for Lighting (percentage shares)
Year Gas Petroleum Electricity Year Gas Petroleum Electricity
1800 100 1900 60 1810 100 1910 89 60* 40 1820 100 1920 80 22* 27 1830 99 1930 50 1 32* 1840 98 1940 30 37* 1850 97 90 1950 5 45* 1860 96 88 1960 1 38 1870 95 85 98 1970 28 1880 94 80 91 1980 26 1890 93 75 85 1990 22 1900 91 68 60 2000 14*
Note: * Based on quantitative information; otherwise, the estimates are based on qualitative evidence.
2.3. Outline of Data on Lighting Efficiency
The conversion of the price and consumption of fuels into their equivalents in light requires estimates of the conversion of energy into light emission by different lighting technologies, be they candles, gas or oil lamps, or light bulbs. The rate of light emission from a source is the light flux/flow, which can be measured in lumens. A wax candle emits about 13 lumens, a sixty-watt incandescent filament bulb about 700 lumens and a fifteen-watt compact fluorescent bulb about 800 lumens. Light emission per unit of energy input is one indicator of the efficiency of a lighting appliance, measured in terms of lumen-hours per thousand Btu (British thermal units) or kilowatt hours or alternatively as lumens per watt. Nordhaus (1997), through experiments of his own and of others, provides estimates of the lumen-hours per 1,000Btu (and lumens per watt) for a particular generation of lighting technology and the year in which it would have been used. A table indicating trends in efficiency (in lumen-hours per kWh) is presented at the end of the paper. In the meantime, a few examples highlight the improvements. An early ‘town gas’ lamp, circa 1827, would have generated 130 lumen-hours per kWh; by 1916 the innovative ‘Welsbach Mantle’ gas lamp produced more than six

146 / The Energy Journal
times more light, 870 lumen-hours per kWh. With these estimates (augmented by several additional sources) and the use of a simple diffusion model of generations of lighting technology, we assembled four time series of the average lighting efficiency (in lumen-hours per kWh) for each lighting technology – that is, for tallow candles, gas lamps, kerosene lamps and electric lights.
The figures presented in Nordhaus (1997) are estimates of the lighting efficiency at the time of introduction of a new technology. To generate estimates of the average efficiency between these years, we developed a series of basic epidemic models of the uptake of the new technologies, reflecting an evolving weighting of the proportions of ‘old’ and ‘new’ lighting appliances being used. We have prepared separate price series and indices for the cost of illumination from each energy source (tallow, whale oil, kerosene, gas and electricity) and its associated appliance technology.
We follow Nordhaus – and traditional light price indexes - in that we estimate only the marginal cost of lighting in terms of fuel, while other costs, including capital and labour (and health damage and other external environmental costs), are not included. However, our estimated price series and indices differ technically from those of Nordhaus, since he assumed that the ‘frontier’ technology was adopted once introduced, i.e. that at any time there will be a single dominant technology and a unique price of illumination; he thus constructs a ‘frontier’ price index, which estimates the cost of the best available technology (he does, however, allow for developments in the efficiency of incandescent lamps between 1940 and 1980, via a series of linear interpolations). Also, the Nordhaus U.S. price series and indices run from 1800, whereas the price series in this UK-focused paper starts from 1300 until the end of twentieth century. And, as noted, Nordhaus does not attempt to estimate levels of light consumption.
3. ECONOMIC GROWTH, POPULATION AND THE GENERAL PRICE LEVEL
Growth in economic activity and personal incomes, as well as population expansion and migration, exert significant influences on the demand and supply of lighting services. From the eleventh century to the mid-fourteenth century population and economic activity rose quite rapidly in Britain. Then in 1347-48 the ‘Black Death’ – bubonic plague – approximately halved the population, and reduced it and economic output back to the levels of around two centuries earlier.6 Figure 1 shows estimates of population and real gross domestic product (GDP) per capita (at year 2000 prices) for 1300-1800: population took nearly four centuries and per capita income nearly two centuries to recover to their pre-1348 levels; per capita income increased relatively rapidly in the sixteenth century and more
6. It should be noted that the picture is more complex than this outline of aggregate output may suggest; for example, wages rose because of labour shortages and thus altered the distribution of income and expenditure.

Seven Centuries of Energy Services / 147
slowly during the next century; and population increased relatively quickly from the second half of the eighteenth century, linked with the rising living standards associated with the industrial revolution. Figure 2 shows the significant increases in population (also associated with rapid urbanisation) during the nineteenth and twentieth centuries – and the growth in GDP per capita in the second half of the nineteenth century, which accelerated in the twentieth century.
Figure 3 presents a retail price index series for 1300-2000, using Officer’s (2004) series. It shows a deflationary period after the Black Death until the beginning of the sixteenth century, fairly rapid growth in prices from about 1500 to the middle of the seventeenth century, then a century of slightly declining prices until about 1750. The second half of the eighteenth century was a period of rapid price increases. In comparison, the nineteenth century was more stable – up to 1850, prices mostly had a downward tendency, and then rose somewhat, falling downwards in the last quarter. The twentieth century experienced far more rapid price increases, as well as considerable volatility. This retail price index is needed, of course, to deflate any nominal, money-of-the-day price series into ‘real’ prices and is an important element in comparing the cost of lighting services over the last seven centuries.7
7. However, as noted earlier, it is striking that Nordhaus (1997) chose to use changes in lighting technologies, qualities and costs to illustrate the tendency of general price indexes to understate improvements in living standards in the face of technological change. This kind of bias in the UK retail price index would also, of course, affect the lighting price indexes in this paper.
Figure 1. Population and real Gross Domestic Product per capita in the United Kingdom (at year 2000 prices), 1300-1800
Source: Snooks (1994) and others; see Fouquet and Pearson (1998) for details.

148 / The Energy Journal
Figure 2. Population and real Gross Domestic Product per capita in the United Kingdom (at year 2000 prices), 1300-2000
Source: Snooks (1994) and others; see Fouquet and Pearson (1998) for details.
Figure 3. Retail Price Index in the United Kingdom, 1300-2000
Source: Officer (2004)

Seven Centuries of Energy Services / 149
4. CANDLE-LIGHT BEFORE THE EIGHTEENTH CENTURY
Throughout history, light has been valued in households, in workshops, as well as in commercial and ecclesiastical buildings, in streets and along the coasts. Before the sixteenth century, lighting methods and costs are thought to have been broadly similar for indoor and outdoor technologies, except for the need to cover outdoor lights from wind and rain (O’Dea 1956). Apart from the central light generated by the fireplace for cooking and heating (see Fouquet and Pearson (1998)), up to the nineteenth century onwards (Meadows 2001) candles provided the main source of artificial lighting in the UK.8
As mentioned above, most candles were made from tallow, or animal fat, which was relatively smoky and smelly9 compared with, say, the finer beeswax, which was too scarce and costly for all but the rich and the church. Many of the rural poor made their own form of candles, known as rushlight10 (Eveleigh 2003). They collected rushes11 spending evenings stripping the reeds (except for a small strip to support the pithy centre) and dipping them in tallow, which was often gathered as a by-product from cooking meat. A home-made rushlight avoided the expense of purchasing tallow candles, as the (urban) poor tended to do, which led to possibly misplaced criticism from Gilbert White, who averred that the latter were “always the worst economists” (O’Dea 1958 p.42).12 A 50-60cm rushlight would burn with a clear light for between 45 minutes and an hour and, unlike tallow candles, did not need to be trimmed every quarter of an hour (Meadows 2001, Woodcock 2002).13 For every pound of rush, six pounds of animal fat was used; one and a half pounds of rushlight would last a family one year (O’Dea 1958, drawing on Gilbert White). At the beginning of the fourteenth century, including light from wood fires, a household might have consumed around 3,000 lumen-hours of artificial light per
8. The comment in the data section qualifies this statement. Although in warmer climates oil lamps were preferred because candles tended to melt, in Britain this was rarely a problem – especially during the colder period between the 15th and 19th centuries (Anderson 1981).
9. “…then by-peeping in an eye/ Base and unlustrous as the smoky light / That’s fed with stinking tallow.” Shakespeare - Cymbeline, Act 1, Sc. 6: http://www.it.usyd.edu.au/~matty/Shakespeare/texts/comedies/cymbeline.html#xref008.
10. “Forward, I pray, since we have come so far,/ And be it moon, or sun, or what you please:/ An if you please to call it a rush-candle,/ Henceforth I vow it shall be so for me.” Shakespeare - The Taming of the Shrew, Act 4, Scene 5: http://www.it.usyd.edu.au/~matty/Shakespeare/texts/comedies/tamingoftheshrew.html#xref018.
11. In forested or upland areas without marshes and reeds, pine splints were burned instead (Woodcock 2002).
12. This comes from Gilbert White’s remarkable 1775 description of rushlight making, printed in 1789 in his Natural History of Selborne. His comment possibly ignores the costs that poor (urban) dwellers faced, in money and time, of obtaining rushes and tallow and preparing the rushlight. Eveleigh (2003, p.6) quotes William Cobbett’s view that poor labourers often had little meat and hence surplus fat with which to make rushlights.
13. Although Eveleigh (2003 p. 5) suggests, without citing any authority, that a 46cm rushlight would only burn for between fifteen and twenty minutes.

150 / The Energy Journal
year.14 In towns, in particular, candles were also commercially produced and sold: by the mid-fourteenth century, wax and the cheaper tallow candles were produced on an industrial scale – royal consent was granted for these activities in the second-half of the fifteenth century (O’Dea 1958 p.38).15
From the fourteenth to the sixteenth century, there seems to have been a general decline in lighting costs from tallow candles, which is likely to have stimulated consumption. Over that period, the cost of lighting approximately halved – from around £20,00016 to £10,000 per million lumen-hours (See Figure 4). Candle efficiency is thought to have improved at a modest rate (Bowers 1998), which for this analysis is assumed to be one tenth of 1% (0.1%) per year – or about a ten percent improvement every century. Tallow candles would have generated with an efficiency of about 15 lumen-hours per kWh at the beginning of the fourteenth century, and about 25 lumen hours per kWh by the end of the eighteenth century. The cost of lighting also depended on the cost of the main fuel source, tallow. Despite much regional variation, tallow candles fell over that five hundred year period from around 70 to 20 pence/kWh – probably associated with a decline in the cost of livestock (Thirsk 1978). This is likely to have encouraged rising levels of per capita consumption.
Candle-light seems to have been at its cheapest for several centuries between the 1530s and the 1560s (at the end of King Henry VIII’s reign), averaging around £10,000 per million lumen-hours. With a soaring GDP (see Figure 1), it was probably a time of growth in production and of great improvements in lighting standards. After the 1560s and up to the end of the seventeenth century, the cost of candle lighting stayed relatively constant, at about £12,000 per million lumen-hours. With rising population (from about five to about nine million people) and per capita real GDP (from about £600 to £850), the total use of lighting seems likely to have risen again.
5. CANDLE-LIGHT IN THE EIGHTEENTH CENTURY
In 1696, prosperous lovers of natural light faced the introduction of the Window Tax. At the time, residents paid a tax of two shillings,17 four if they had
14. Based on the assumption that in 1300 a family would have generated light from a small wood fire (say, of 1 kg with an energy density of 12MJ per kg), producing around 8 lumen-hours per day (Nordhaus 1997) and might have used the equivalent of a pound and one half of tallow candles per year, generating around 150 lumen-hours per year, i.e. about 0.4 lumen-hours per day, for a total of 8.4 lumen hours per day and a little over 3,000 per year. This crude estimate (and the one for 1800 that follows) is for illustrative purposes only.
15. The craft guilds of tallow and wax chandlers enforced trade regulations and sought to advance their members’ interests. Monier-Williams (1973) dates the first articles of the Tallow Chandlers of London back to 1300. He also describes periods of price and export control of tallow by the City of London, during the 14th to the 16th centuries (see also: http://www.tallowchandlers.org/).
16. As a reminder, all values are in year 2000 prices, unless otherwise stated. 17. In current (2000) money, this is equivalent to eight pounds for a house with less than ten
windows, when the average annual income was nearly one thousand pounds – thus, nearly one percent of income.

Seven Centuries of Energy Services / 151
between ten and twenty windows and eight if they had more than twenty windows in their house. It was revised downwards in 1747,18 by which time smaller houses were exempt. It was intended to reflect the wealth of the inhabitants, as proxied by the number of windows in the house. Inevitably, it “operat[ed] as a tax on light, and a cause of deformity in buildings” (Mill 1909 p.3.27), but was retained until well into the nineteenth century. For most, though, windows remained a luxury until the end of the eighteenth century, creating a need for artificial light in the daytime (Woodcock 2002 p. 4).
Moreover, at the beginning of the eighteenth century, in Queen Anne’s reign, a tax on candles (and other articles of general consumption) was proposed to help fund the war of Spanish Succession. Shortly after, some retailers raised candle prices by an amount equal to the proposed tax (suggesting a fairly price inelastic demand). In 1709, the tax was actually imposed and the cost of lighting rose (Dowell 1965 p.307). A duty of four pence per pound was placed on wax candles and one half penny on tallow candles, equivalent to a tax of about £1,000 for a million lumen-hours, or a 10% increase. This fed through into the (ten-year) average real price, which rose by nearly 50% between 1700 and the mid-1740s (See Figure 4). The tax was followed by fairly heavy regulation – although households
Figure 4. The Price of Lighting from Tallow Candles and Whale Oil in the United Kingdom (per million lumen-hours), 1300-1900
Source: authors’ own estimates – see Section 2.1.1-2 and 2.3.
18. Houses with between ten and fourteen windows paid six pence per window, houses with between fifteen and nineteen windows paid nine pence per window, and houses with twenty windows or more paid one shilling per window.

152 / The Energy Journal
were allowed to make their own rushlights, as long as they were “not for sale, of small size, and only dipped once in or once drawn through grease…” (Dowell 1965 p.308). This change in relative prices may account for their apparent resurgence in poorer households during the eighteenth century (Woodcock 2002 p.4).19
The tax was criticised by commentators including Adam Smith.20 on grounds of its regressive nature, its effect on the price of labour, its tendency to encourage fraudulent production of candles at the expense of honest chandlers, and the cost of regulation. The duty on candles was not fully repealed until 1830 (Dowell 1965 p. 310). Conveniently, the tax collection data provide a first indicator of national candlelight consumption (Mitchell 1988 p. 398): in 1711, around 30 million pounds of tallow candles generated some 17 billion21 lumen-hours (See Figure 5). Up to 1750, overall candlelight consumption appears to have changed little, however. There must have been considerable upward pressure on demand from a more than 20% rise in per capita income over that period. Nevertheless, since population rose by around 10% to 10 million, per capita lighting consumption seems likely to have fallen. With the window and candle taxes increasing the cost of natural and artificial light, the first half of the eighteenth century might be seen as another kind of ‘dark age’.
It has been suggested that there was no improvement in the quality of lighting during the period of the candle tax, and considerable developments in technology once it was repealed in 1830 (Dowell 1960 p.310). It might be expected, however, that tax-induced price increases would create incentives to improve the efficiency of lighting provision. Evidence suggests that the quality of candles did improve dramatically between the end of the eighteenth century and the mid-nineteenth century. Moulding processes and plaited wicks were developed and refined, which reduced the cost and improved the efficiency of candlelight provision (O’Dea 1958 p.54; Eveleigh 2003 p. 19). These improvements meant that tallow candles in the 1830s could produce light with an efficiency of 75 lumen-hours per kWh compared with the 25 lumen-hours at the end of eighteenth century (Nordhaus 1997 p.36). Across Europe, where similar taxes had been imposed, efforts were made to better understand the burning properties of fats. By 1840, the firm of Price’s Candles were able to build on the French chemist Chevreuil’s research on fatty acids, carried out in the 1820s in collaboration with
19. The relatively poor quality of tallow as a light source is illustrated in Robinson Crusoe (Defoe 1719, ch. 5): “I was at a great loss for candles; as soon as ever it was dark, which was generally by seven o’clock, I was obliged to go to bed […] The only remedy I had was, that when I had killed a goat, I saved the tallow, and with a little dish of clay, which I baked in the sun, to which I added a wick of some oakum, I made me a lamp; and this gave me light, though not a clear steady light like a candle.” See: http://www.online-literature.com/defoe/crusoe.
20. Smith noted in 1776 that the tax was a penny a pound, equivalent to fourteen or fifteen per cent of the original price (Smith 1776, Book Five, Chapter II): “As all those four commodities [salt, leather, soap and candles] are real necessaries of life, such heavy taxes upon them must increase somewhat the expense of the sober and industrious poor, and must consequently raise more or less the wages of their labour.” See also: http://www.adamsmith.org/smith/won-b5-c2-article-4-ss2.htm
21. Billion is 109 or one thousand million.

Seven Centuries of Energy Services / 153
Gay Lussac (Eveleigh 2003), to refine tallow and vegetable oils to produce, a harder, pure white fat known as stearine; it made candles that burnt brightly with little smoke or smell (Newman 2003 p. 12).22
As a result of these technological improvements, the real price of candle light fell from around £15,000 in 1760 to below £4,000 in the 1820s. Lighting use probably doubled (to 15 billion lumen hours) in the second half of the nineteenth century (See Figure 5). With population rising by 50% between 1750 and 1800, this would represent a substantial increase in per capita consumption. By 1820, over 60 million pounds of tallow candles produced about 35 billion lumen-hours. Candles continued to be a main source of lighting up to the mid-nineteenth century and afterwards were valued as complements to other lighting methods.
6. OIL LAMPS BEFORE THE NINETEENTH CENTURY
The oil lamp was another important source of lighting services. Vegetable oils, principally colza oil from rapeseed, cabbage, kale and the root of the swede in Britain, were said to “burn exceedingly well” in lamps (Nash in BPP 1816 p.177). However, colza oil was for a time of limited availability for lighting, because the main use was for cleaning good quality wool, and it was
Figure 5. Consumption of Lighting from Tallow Candles and Whale Oil in the United Kingdom (in billion lumen-hours), 1711-1900
Source: authors’ own estimates – see Section 2.1.1-2 and 2.3. Billion: 109 (i.e. one thousand million)
22. Eveleigh (2003 p. 3) suggests that the peak of candlelight development occurred in the mid nineteenth century, when there were sixty-four candle exhibitors at the 1851Great Exhibition in London.

154 / The Energy Journal
used mostly indoors because it tended to congeal in cold weather (Mellish in BPP 1816 p.189).23
The most basic lighting oil was fish oil, particularly cheap in coastal areas. When the candle tax was introduced, households were only allowed to use oil lamps if they were fuelled by fish oil. The smell and poor quality of illumination meant it was a poor-person’s fuel, however. Whale oil represented an improvement on fish oil – and since most people thought whales were fish, the candle tax regulation seems not to have prohibited its use (Jackson 1976 p. 20). As explained in the data section, oil from the Right Whale24 was a common source of lighting from the sixteenth century. From the eighteenth century until the early nineteenth century, oil from Sperm whales was the product of choice for lamps, because of its better quality illumination, although it never provided more than half of the lighting associated with whales. Sperm oil was used almost exclusively for illumination. In addition to the oil, spermaceti wax, found in this whale’s brain cavity, was made into candles that gave light that was better than that from traditional tallow candles – and equivalent to but less costly than that from beeswax candles.
As with candles, demand for all forms of lighting had been rising since the fourteenth century. Greater household wealth demanded better ways of keeping active after sunset (Jackson 1978 p.56). Mechanisation and growth of the textile industry created a need for lighting to extend factory working hours. And, urbanisation, as many left the countryside, called for improvements in street lighting, mainly to enhance public safety. The illumination of town and city streets, and other public space, became an important driver for technological change. In the first decades of the fifteenth century, town lighting regulations began to be introduced, requiring certain citizens, such as innkeepers, to place a ‘lanthorn’ in front of their doors. This probably also reflected a decline in the cost of lighting in the early 1400s, which would have made such regulations less onerous than before. By Elizabethan times, all (non-poor) citizens on main roads had to provide light in front of their buildings (Falkus 1976 p. 252; see also Monier-Williams 1973 p. 79).25 This remained the main basis for regulating street lighting until the end of the seventeenth century. As the rate of urbanisation
23. “Colza lamps provided the great link between the primitive form of teapot- and saucer shaped lamps and the highly efficient paraffin lamps of the mid nineteenth century. They represented the application of mechanical ingenuity to the provision of better domestic lighting, for the oil lamp as an efficient means of lighting really dates from the end of the eighteenth century” (Meadows 2001 p. 7).
24. Right whales are said to have been named by whalers who considered them the “right” whales to hunt, since they were rich in blubber, were easy to catch (being relatively slow swimmers) and they floated after being killed.
25. In 1599, in what Monier-Williams (1973 p. 87) calls “a landmark in the history of street lighting”, an Act of Common Council required every householder in the City of London, “from the first day of October until the first day of March to cause a good and substantial lanthorn and a candle … to be hanged without their doors … every night when the moon shall be dark.” Monier-Williams also discusses later developments in London, through to 1736, when the era of rate paid lighting was brought in by an Act of Parliament.
Seven Centuries of Energy Services / 155
increased (for example, London’s population had grown two and a half times during the seventeenth century), lighting became increasingly seen as one of the basic amenities that local authorities should be responsible for providing.
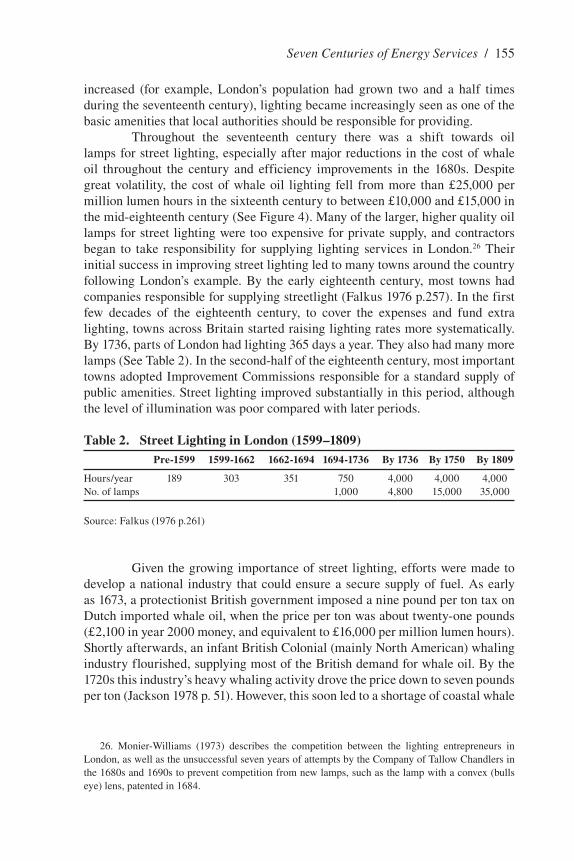
Throughout the seventeenth century there was a shift towards oil lamps for street lighting, especially after major reductions in the cost of whale oil throughout the century and efficiency improvements in the 1680s. Despite great volatility, the cost of whale oil lighting fell from more than £25,000 per million lumen hours in the sixteenth century to between £10,000 and £15,000 in the mid-eighteenth century (See Figure 4). Many of the larger, higher quality oil lamps for street lighting were too expensive for private supply, and contractors began to take responsibility for supplying lighting services in London.26 Their initial success in improving street lighting led to many towns around the country following London’s example. By the early eighteenth century, most towns had companies responsible for supplying streetlight (Falkus 1976 p.257). In the first few decades of the eighteenth century, to cover the expenses and fund extra lighting, towns across Britain started raising lighting rates more systematically. By 1736, parts of London had lighting 365 days a year. They also had many more lamps (See Table 2). In the second-half of the eighteenth century, most important towns adopted Improvement Commissions responsible for a standard supply of public amenities. Street lighting improved substantially in this period, although the level of illumination was poor compared with later periods.
Table 2. Street Lighting in London (1599–1809) Pre-1599 1599-1662 1662-1694 1694-1736 By 1736 By 1750 By 1809
Hours/year 189 303 351 750 4,000 4,000 4,000 No. of lamps 1,000 4,800 15,000 35,000
Source: Falkus (1976 p.261)
Given the growing importance of street lighting, efforts were made to develop a national industry that could ensure a secure supply of fuel. As early as 1673, a protectionist British government imposed a nine pound per ton tax on Dutch imported whale oil, when the price per ton was about twenty-one pounds (£2,100 in year 2000 money, and equivalent to £16,000 per million lumen hours). Shortly afterwards, an infant British Colonial (mainly North American) whaling industry flourished, supplying most of the British demand for whale oil. By the 1720s this industry’s heavy whaling activity drove the price down to seven pounds per ton (Jackson 1978 p. 51). However, this soon led to a shortage of coastal whale
26. Monier-Williams (1973) describes the competition between the lighting entrepreneurs in London, as well as the unsuccessful seven years of attempts by the Company of Tallow Chandlers in the 1680s and 1690s to prevent competition from new lamps, such as the lamp with a convex (bulls eye) lens, patented in 1684.

156 / The Energy Journal
stocks and higher prices, creating a demand for larger whalers seeking stocks further afield. In the 1750s hostilities between the British and the French over North American territories interrupted the supply routes to English ports, creating opportunities for a British whaling industry. In 1732 the government introduced a key incentive for the whaling industry, a bounty of 30 shillings per ton of the vessel’s weight for every voyage of an appropriately qualified ship – evidence of the growing dependence on oil imports and concern about supply shortages. In 1749 the bounty was raised to 40 shillings (£200 in current (2000) money). The payments were lowered after 1790 and abolished in 1824 (Barrow 2001).
When Franco-British hostilities ended in 1763, the Colonists again became for a few years the main whale oil suppliers. However, the War of American Independence (1775–1783) came at a price to the whalers, now paying a heavy import duty on what had become foreign rather than colonial products. John Adams, the future second president of the United States, lobbied the British Government: “... you prefer darkness, consequent robberies, burglaries and murders in your streets, to the receiving, as a remittance, our spermaceti oil” (Jackson 1978 p. 70). The lights did not go out completely, however, since many of the main whaling families moved to England.
Yet, consumption patterns were closely influenced by the political interruptions and influences, and by industrial developments. In 1750, around 370 million lumen-hours were generated from about 3,000 tons of Sperm and other whale oil; and while other whale oil made up nine-tenths of this total, sperm oil was about twice as effective in providing illumination. By 1774, the oils (30% from Sperm oil) generated nearly three times as much, just over one billion lumen-hours. In 1781, lighting from Sperm and other whale oils fell back to less than 300 million lumen-hours, perhaps leaving the streets in some darkness, as John Adams had predicted. Once hostilities ceased though, Sperm and other whale oil imports resurged, with light output reaching more than 1.8 billion lumen-hours by the late 1780s.27
The growth in lighting was the result of increased supplies of oil at declining prices and major efficiency gains in energy conversion. Improvements in oil lamp technology from the 1770s included Leger’s 1783 invention in Paris of the flat-wick lamp, the Swiss chemist Argand’s 1780-84 invention of the Argand lamp, with its round tubular wick with a hollow centre, giving a double air supply
27. Herman Melville’s novel Moby Dick, published in 1851 (as The Whale) gives graphic descriptions of the American whaling industry. In a review, Horace Greeley noted that, ‘The intensity of the plot is happily relieved by minute descriptions of the most homely processes of the whale fishery.’ (see: http://www.melville.org/hmmoby.htm#Contemporary). In a chapter called ‘The Advocate’, Melville offers a glowing defence of whaling: ‘Why did Britain between the years 1750 and 1788 pay to her whalemen in bounties upwards of lb. 1,000,000? And lastly, how comes it that we whalemen of America now outnumber all the rest of the banded whalemen in the world; sail a navy of upwards of seven hundred vessels; manned by eighteen thousand men; yearly consuming 4,000,000 of dollars; the ships worth, at the time of sailing, $20,000,000; and every year importing into our harbors a well reaped harvest of $7,000,000. How comes all this, if there be not something puissant in whaling? (see: http://www.princeton.edu/~batke/moby/moby_024.html)

Seven Centuries of Energy Services / 157
from inside and outside, a chimney placed over the flame for better aeration and a mechanism for raising and lowering the wick, and then the ‘bird-fountain’ feed, which ensured that there was always the same level of oil in the reservoir, providing a better supply to the wick (O’Dea 1958 p. 40; Meadows 2001). These improvements doubled and, eventually with refinements, tripled the efficiency of oil lamps.28 As a result, the cost of lighting from lamps fell substantially over that period, from about £15,000 per million lumen-hours in 1750 to around £5,000 by 1820. After a sluggish end of the eighteenth century, with consumption at about 1.7 billion lumen-hours, the trend in consumption reverted upwards, rising to about 3.4 billion lumen-hours in 1805 and 4.7 billion lumen-hours by 1820 – around 8% of overall lighting. By then candles provided less than 60% of lighting. Thus, already, about one third of lighting was provided by a new source of energy, gas.
7. LIGHT IN THE GAS ERA (1820–1920)
In 1800, a family might have generated as much as 50,000 lumen-hours of light per year,29 although most of this would still be a valued by-product of cooking and heating, rather than an energy service sought directly. As we have seen, up to the latter part of the eighteenth century, the active production of artificial light was based on relatively primitive fuels and technologies, mainly tallow candles and fairly basic oil lamps. These technologies required frequent manual re-stocking and were awkward. Oil lamps smoked in draughts, were difficult to supply with the correct rate of fuel, and would smell bad when cheaper oils were used (Bowers 1998). Candles required frequent wick trimming to avoid smoking and guttering, which tended to generate sparks. The threat of fires and economic loss was constant. Factories developed safety regulations, took out insurance policies and frequently kept their own fire engines (Falkus 1982 p. 220).
Increasing demand for higher-quality lighting, as well as dissatisfaction with existing technologies, had generated a large body of research into developing better illumination. From the 1770s, the Royal Society handed out many prizes and awards for lighting improvements. Similarly, the number of lighting patents rose dramatically, 14 in the 1790s and 29 the next decade (Falkus 1982 p. 218). And, when the by-products of the coking process were used for lighting, the
28. Argand’s lamp, for example, was smokeless and produced light equivalent to that of nine best wax candles, while the circular wick burned 15% less oil than Leger’s flat ribbon wick for an equal amount of light. Argand lamps spread rapidly across Europe (Woodcock 2002 p. 5).
29. Based on the assumptions: (a) in 1800 domestic consumption of coal was about 5.6 million tonnes and the population was about 16 million (or roughly 4 million households) - hence the average family might have used 1.4 tonnes of coal per year (with an energy density double that of wood and the same lumen-hours per watt) and, therefore, generated about 45,000 lumen-hours per year (or 120 lumen-hours per night) from coal fires (Fouquet and Pearson 1998); and (b) an estimated national consumption of artificial light of around 20 billion lumen-hours from other sources, of which half (following the domestic sector’s share of total coal consumption at the time) was consumed by the domestic sector, then each household might have generated 2,500 lumen-hours. Adding these together, an average household might have generated around 47,500 lumen-hours of light.

158 / The Energy Journal
Times claimed that “… there is nothing so important to the British Realm, since that of Navigation, ..[as] the grand discovery of the Gas Lights…” (quoted in Falkus 1982 p.226). William Murdoch lit the Soho works of Boulton and Watt with gas in 1803, with a light equivalent of 2,500 tallow candles, at relative costs said to be about £600 per year for gas and £2,200-3,000 for candles (Gledhill 1999 p. 6). In 1812, Frederick Winsor’s Gas Light and Coke Company received the first charter to supply parts of London and, after eighteen months of errors in equipment investment and design, the market for gas-lighting grew quickly as prices fell. In 1820, gas lighting cost around £3,000 per million lumen-hours. By 1840, it had fallen to £1,300 and then, by 1850, to about £500 per million lumen-hours (See Figure 6).30
The dramatic cost decline was to generate the first of three phases in the demand. Gas lighting rose ten-fold – from around 25 billion lumen-hours in 1820 to 250 billion in 1850 (See Figure 7). The growing wealth and associated desire for comfort, the accelerating industrialisation and the increased urbanisation of Britain were also factors driving the demand. Initial demand was for public street lighting, commercial establishments (especially shops), and some wealthy households. By the 1840s, middle class families were starting to use gas in their homes.
30. From 1820, the Argand burner, adapted for use with gas, was the most widely used alternative to the simple gas jet (Gledhill 1999 p. 11). Gledhill describes subsequent developments in the gas jet and in controlling and regulating the gas pressure.
Figure 6. Price of Lighting from Gas, Kerosene and Electricity in the United Kingdom (per million lumen-hours), 1800-2000
Source: authors’ own estimates – see Section 2.1.3-5 and 2.3.
Seven Centuries of Energy Services / 159
In the mid-nineteenth century, the demand for all forms of lighting was growing. Candles and oil lamps continued to be the main source of illumination for many, particularly poorer households, as they could not afford the infrastructure costs required for gas use.31 The dramatic improvements in tallow candles, generating about 75 lumen-hours per kWh, meant that candle-light had become much cheaper than before – with costs nearly halving between 1800 and 1830 to £4,000 per lumen-hour (See Figure 4). Price’s Candle Company, established in 1830, grew rapidly, particularly after its new ‘composite’ candles, made from a mixture of refined tallow (stearine) and coconut oil, and enhanced by plaited wicks, were widely used to celebrate the eve of Queen Victoria’s wedding to Prince Albert in 1840 (Eveleigh 2003, Newman 2003).32 Throughout most of the second-half of the nineteenth century, candlelight cost less than £1,500 per million lumen-hours. Despite the competition, candlelight consumption increased from 20 billion lumen-hours in 1800 to 75 billion lumen-hours in 1830 and, at times in the second half of the nineteenth century, it rose to nearly 100 billion lumen-hours (See Figure 7). While it had lost much of its share of the market to gas (77%) by 1850, it still provided more than one fifth of the lighting in the United Kingdom.
The introduction of mineral oils, principally kerosene (or paraffin),33 provided a new source of lighting for lamps. Between the discovery of oil in Burma in 1854 and Drake’s Well in Pennsylvania in 1859, Price’s Patent Candle Company imported and refined Burmese oil.34 However, the growth of the American petroleum industry from the 1860s signalled the abundant availability of a lighting fuel that required little equipment and infrastructure. In contrast to the extremely volatile supply of whale oil, there was now a potentially large supply of a high-quality lighting fuel (Yergin 1991 p. 22). In the 1860s, the price of lighting oil lamps using kerosene was more than £1,500 per million lumen-hours (See Figure 6). But the rapid expansion of the industry drove down prices: by 1870, £500 worth of kerosene would generate one million lumen-hours, while by 1900 the cost had fallen to around £200.35 Consumption responded accordingly.
31. Meadows (2001 p.18) suggests that “by 1846 colza oil was only a third of the cost of sperm oil and the latter became obsolete.” By the 1870s, kerosene, cleaner and cheaper than colza oil, replaced the latter in lamps.
32. Price’s made the mistake of not patenting their composite candles. In 1847, their name change, to Price’s Patent Candle Company, acknowledged their intention to use patented processes. By 1858 they held 114 patents for candle manufacturing inventions.(See http://www.prices-candles.co.uk/history/HISTORYdetails.htm, Newman 2003).
33. Reichenbach and Christison both discovered paraffin in 1830. A Scot, James Young, then devised a process for extracting oil from “cannel coal” (now thought to be oil shale): filing his patent in 1850, he used the word “cracking” to describe the splitting of the oil into its component substances. Young extended his patents to the US and set up an oil refinery near Edinburgh (Meadows 2001 p. 10; see also: http://www.technologyscotland.org/pioneering/technology_paraffine.html).
34. See http://www.prices-candles.co.uk/history/HISTORYdetails.htm.35. In 1879, James Wilson, of Price’s, noted that: “This flood of American petroleum poured in
upon us by millions of gallons, and giving light at a fifth of the cost of the cheapest candle made by the company when it first started.” Source: http://www.prices-candles.co.uk/history/HISTORYdetails.htm.

160 / The Energy Journal
By 1870, kerosene lamps, with a lighting efficiency of about 159 lumen-hours per kWh, generated about 3.3 billion lumen-hours.36 The following decade saw a six-fold increase to nearly 20 billion lumen-hours. It tripled throughout the 1880s and then more than doubled in the 1890s, as it reached over 1.5 trillion37 lumen hours in 1900 (See Figure 8).
Yet, despite kerosene’s growth (14% of the lighting market in 1900), the gas-lighting industry was to show its resilience (with 81% of the market in 1900). After 1850, gas prices were initially stable with even a slight increase in the mid-1860s. Then lighting costs began to fall again – to about £270 per million lumen-hours by 1880, £170 by 1890 and just over £125 by 1900 (See Figure 6). While the price of gas as a fuel changed little through the second half of the century, gas lighting efficiency tripled after the introduction of the incandescent mantle (Nordhaus 1997). This was invented in the 1880s by Carl Auer von Welsbach, using chemical substances (eventually thorium and cerium oxides) to create a mantle that would fit around the flame from Bunsen’s aerated
Figure 7. Consumption of Lighting from Gas and Tallow Candles in the United Kingdom (in billion lumen-hours), 1800-1850
Source: authors’ own estimates – see Section 2.2.1-4 and 2.3. Billion: 109 (i.e. one thousand million)
36. Meadows (2001 p. 12) notes that some eighty patents a year relating to oil lamps were applied for between 1859 and 1870.
37. Trillion is 1012 or one million million.38. See http://www.althofen.at/AvW-Museum/Englisch/biographie_e.htm.

Seven Centuries of Energy Services / 161
gas burner.38 Gledhill (1999 p. 14) suggests that it was the appearance of electric light in the 1870s that offered the incentive to improve gas light through enhanced incandescence.39 He remarks on the rapid uptake of incandescent burners in Britain: the numbers sold grew from 20,000 in 1893, to 105,000 in 1894 and then tripled to 300,000 in 1895.
Gaslight consumption grew dramatically in the second-half of the nineteenth century. Because demand was mostly non-industrial, it was less vulnerable to fluctuations induced by business cycles. In every decade of the second-half of the nineteenth century, growth always averaged more than 60%. In the 1850s, consumption grew by 140% and, in the 1880s, by 156%. In 1850, an estimated 267 billion lumen-hours of light were produced. By 1900, it had increased to 8.65 trillion lumen-hours, a 32-fold rise at an average annual growth rate of over 12% from 1850 (See Figure 8).
Once again, declining cost was central to the major switch towards gas but was not the only factor. By the turn of the century, working class living standards had improved substantially, and with them demands for better quality lighting. Also, the introduction of the ‘coin in the slot’ meter attracted many new customers, as they did not have to pay for the installation costs (which the gas
Figure 8. Consumption of Lighting from Gas and Kerosene in the United Kingdom (in billion lumen-hours), 1850-1900
Source: authors’ own estimates – see Section 2.2.3-4 and 2.3. Billion: 109 (i.e. one thousand million)
39. This is effectively a suggestion of a ‘sailing-ship’ effect (where an incumbent technology, threatened by a new technology, improves dramatically). See Geels (2005) and Schivelbush (1988).

162 / The Energy Journal
companies covered in return for higher prices). First used in London in 1893, by 1914 two-thirds of customers used it. In that time, the London Gas Company’s customers quadrupled from fewer than 300,000 to over 1,280,000, representing most of London’s households (Matthews 1986).
8. THE EXPANSION OF ELECTRIC LIGHTING (1890–1939)
Despite its dominance of the lighting market at the turn of the century, gas was already under threat from the next technological revolution. Electricity had shown promise since the eighteenth century, and Humphry Davy demonstrated the electric arc at the Royal Institution in London in 1810 (Bright 1949 p. 22). However, lighting applications only began to be commercialised in the mid-nineteenth century. Arc lighting was used increasingly from the late 1860s for illuminating large areas, like markets, stations, stadiums and lighthouses (Bright 1949 p. 29). For example, Crompton imported Gramme generators and arc lights from Paris, developed improved arc lamps and in 1879 illuminated the Henley Regatta and the grounds of Alexandra Palace with them (Bowers 1969 p. 20). Arc lighting had large economies of scale but was impractical for indoor lighting, especially in dwellings. Much innovative effort went into “subdividing the electric light” (Bright 1949 pp. 34, 58) in a way that enabled individual control of the lights, a task that many eminent electrical engineers thought impossible (Byatt 1979 p. 15). In the late 1870s, Swan, in the UK, and Edison, in the US, led the field of inventors working on incandescent lamps.40 They succeeded in patenting the incandescent light bulb. With subsequent developments in generation and transmission, it enabled electricity to brighten up shops, offices and homes (O’Dea 1956). Crompton and Swan joined forces in 1880, to make lamps, lamp fittings and generators, and in 1882 made the first major installation of incandescent lighting in England, at the Law Courts in London (Bowers 1969 p. 22; Byatt 1979 p. 16).
Despite early difficulties with public supply (Hannah 1979 p. 6), by 1888, more than 80 private companies and local authorities were supplying electricity; and by the mid-1890s most towns had an electricity supplier. By the end of 1903, only two towns of more than 100,000 people lacked a supply, although even as late as 1910, only a small proportion of houses were lit by electricity (Byatt 1979 p. 25).41 Electricity prices fell from around £2 per kWh in 1883 to just over £1.15 by 1900. Lack of storage capabilities, however, forced companies to keep a reserve capacity for unexpected surges in demand and to limit the frequency of ‘black-outs’. So, despite the introduction of off-peak pricing in 1900, the need for
40. Kane and Sell (2001) review the development of lamp technologies, from the incandescent lamp to the sodium lamp (although they do not examine light emitting diodes (LEDs)). For earlier material, see Bright (1949).
41. See also Gordon (1981).42. For a critical discussion of the use of ‘faulty pricing theory’ in the period to 1914, see Byatt
(1979 pp.131-35).

Seven Centuries of Energy Services / 163
reserve capacity kept upward pressure on the price of electricity. Nevertheless, prices continued to fall to £0.70 per kWh in 1910 and £0.20 per kWh in 1920.42
Meanwhile, the efficiency of electric lamps was improving. In 1879, the carbon filament lamp generated less than 2,000 lumen-hours per kWh. By 1897 efficiency had more than tripled to 7,000 lumen-hours per kWh, with the introduction of the osmium filament lamp,43 and over 10,000 lumen-hours per kWh when gas-filled tungsten lamps were used in 1913 (O’Dea 1956). Declining energy prices and rising technical efficiency led to a dramatic fall in the costs of electric lighting services. Starting in the mid-1880s, from over £1,000 per million lumen-hours, which was four times more expensive than gas-light, the cost of electric lighting dropped to about £360 by 1900 (See Figure 6). The decline continued down to £180 in 1910 and below £35 by 1920 – less than one twentieth of what it had been thirty years before. By then, in cost terms, after nearly four decades incandescent electric lighting had finally caught up with gas lighting, as Figure 9 shows.
And electric lighting companies had been chasing a moving target. At the beginning of the twentieth century, the gas lighting industry had also achieved major improvements: refinements associated with the gas mantle meant that,
43. Also invented by Carl Auer von Welsbach.
Figure 9. Price Ratio of Lighting from Competing Energy Sources in the United Kingdom, 1820–1950
Source: authors’ own estimates – see Section 2.1.1-5 and 2.3.

164 / The Energy Journal
Figure 10. Price of Lighting from Gas and Electricity in the United Kingdom (per million lumen-hours), 1900-2000
Source: authors’ own estimates – see Section 2.1.1-5 and 2.3.
Figure 11. Consumption of Lighting from Gas and Electricity in the United Kingdom (per million lumen-hours), 1900-1950
Source: authors’ own estimates – see Section 2.1.3-5 and 2.3. Trillion: 1012 (i.e. one million million)

Seven Centuries of Energy Services / 165
Figure 12. Price of Lighting from Electricity in the United Kingdom (per million lumen-hours), 1930-2000
Source: authors’ own estimates – see Section 2.1.5 and 2.3.
compared with lamps from the 1880s, by 1920 three times as much light could be generated from the same amount of gas, and until then gas managed to out-compete electricity. The cost of gas lighting had fallen from £125 per million lumen-hours in 1900 to £35 in 1920 (See Figure 10). Gas lighting consumption peaked at over 20 trillion lumen-hours in 1920 (See Figure 11).
Initially, the demand for electric lighting was in streets and other outdoor locations. In 1895, consumption was about 45 billion lumen hours, which was less illumination than was generated from candles. Consumption increased more than five-fold in five years, seven-fold in the first decade of the twentieth century, and then just over three-fold in the second decade, to 6 trillion lumen hours by 1920 (See Figure 11). This was nearly a third of the consumption of lighting from gas. And, yet, by as late as 1919, only around six percent of households were wired to an electricity supplier (Jones 1989 p.89).
The industry was severely affected by a lack of coordination, with many companies using different voltages and frequencies. Better coordination would enable companies to link up their distribution networks, minimising the extra reserve capacity required – since the likelihood that all areas connected suffer unexpected surges in demand at the same time falls as the number of connected areas increases. In 1933, the National Grid was completed, saving electricity suppliers substantial capital, fuel and running costs. These savings led to another drop in prices (See Figure 12). Falling prices from 1933 to 1942, coupled with

166 / The Energy Journal
the mass production of electrical appliances, increased the demand for electricity. By 1938, two-thirds of UK houses had electricity supply, consuming nearly 100 trillion lumen-hours.
9. POST-SECOND WORLD WAR ELECTRICITY
Low electricity prices, coal shortages and cold weather after World War II helped electricity consumption to rise to three times higher in 1948 than it had been in 1938. The government was catalysed into nationalising electricity production and supply.44 The period up to the first oil shock of 1973-74 saw declining costs of electric lighting. With minimal improvements in incandescent light bulb efficiency (now around 12,000 lumen-hours per kWh) but increased commercial and industrial use of fluorescent tubes, there were major increases in the consumption of light – from 200 trillion lumen hours in 1945 to 1,000 trillion in 1973 (See Figure 13).
From 1973 to 1995, there was no increase in consumption – and only a little cyclical fluctuation. Then, since the advent of compact fluorescent lights,
Figure 13. Consumption of Lighting from Electricity in the United Kingdom (in billion lumen-hours), 1930-2000
Source: authors’ own estimates – see Section 2.2.5 and 2.3. Trillion: 1012 (i.e. one million million)
44. In April 1948, the 200 companies and 369 local authority undertakings, along with the Central Electricity Board and almost 300 power stations, were transferred to the new British Electricity Authority (Hannah 1982, p. 7).

Seven Centuries of Energy Services / 167
which in the early 1990s produced 62,000 lumen-hours per kWh, and the decline in electricity prices that gradually fed through from the liberalisation and re-regulation of the electricity supply industry in 1990, the amount of light provided started rising once again. By the late 1990s it was estimated that the average household in the UK used 720 kWh – over 10 million lumen-hours – per year (Palmer and Boardman 1998).
10. DEVELOPMENTS IN KEY LIGHTING VARIABLES AND INDICES (1300–2000)
In this section, with the aid of Table 3, we explore some of the striking changes that occurred over the centuries, with a particular focus on the period from 1800 to 2000. Selected indices are also graphed in Figure 14 (on a log scale, to accommodate the very wide range of values, and with a value of one in the year 1800).
The first two variables in Table 3 are measures of the price of the lighting fuel (in pence per kWh) and the efficiency of lighting appliances (in lumen-hours per kWh). They show a relatively modest decline in prices and proportionately smaller increase in efficiency between the fourteenth and eighteenth centuries. The price of lighting fuels (associated with the shifts from tallow candles to oil, gas and then electricity) falls considerably in the second half of the nineteenth century, and then rises (from the use of high-value electricity, which also had a high initial price) and falls in the twentieth century. There are, however, dramatic improvements in efficiency in the nineteenth century (fourteen-fold) and the twentieth century (nearly seventy-fold), indicating the major role played by technological and institutional innovation, especially over the first fifty years of the twentieth century. The shift to electricity (highlighted by * in Table 3) at the beginning of the twentieth century supports the argument (Fouquet and Pearson 2003b) that while the average price of energy can rise, the consumer can still benefit, as long as improvements in energy conversion continue to reduce the price and/or enhance the quality of energy services.
Combined together, the fuel price and the efficiency series provide an indicator of the price of lighting services (in £(2000) per million lumen-hours). As Table 3 and Figure 14 indicate, by 1800, lighting (costing about £6,600 per million lumen-hours) cost one sixth of what it had in 1300. But by 1900 it cost one twenty-fifth of what it had cost in 1800 – and by 2000 the cost of lighting in the UK was £1.7 per million lumen-hours – one one hundred and sixtieth of what it had been in 1900.
Table 4 shows the average annual rates of growth of the lighting service price, GDP per capita and consumption of light per capita, during 50 year periods, from 1800-2000. Not surprisingly, given all the economic, social and demographic changes experienced over these periods, the data seem to indicate a changing relationship between consumption, price and income. For example, while per capita light consumption increases rapidly with the significant price and income

168 / The Energy Journal
changes in 1850-1900 and 1900-1950, it appears less responsive after 1950. This is particularly evident in a comparison between 1850-1900 and 1950-2000: in the latter period, a similar rate of price change and much larger rate of income growth is associated with a halved rate of consumption growth (see also Figure 14).
An extrapolated forecast of per capita lighting consumption in the second half of the twentieth century, based on the experience of the first half, would have
Tab
le 3
. K
ey L
ight
ing
Var
iabl
es a
nd I
ndic
es, 1
300-
2000
P
rice
of
Lig
htin
g
Eff
icie
ncy
of
Pri
ce o
f C
onsu
mpt
ion
of
Con
sum
ptio
n of
R
eal G
DP
F
uel/
Ene
rgy
Sour
ce
Lig
htin
g L
ight
ing
Serv
ices
L
ight
per
Cap
ita
Lig
ht (
tota
l)
per
capi
ta
Yea
r P
ence
£(2
00
0)
(y
ear
lum
en-
pe
r m
illi
on
M
illi
on
Inde
x
20
00)
In
dex
hour
s In
dex
lum
en-
Inde
x lu
men
- In
dex
Inde
x In
dex
18
00
pe
r kW
h 18
00
=1
per
kWh
180
0=
1 ho
urs
180
0=
1 ho
urs
180
0=
1 18
00
=1
180
0=
1 £
(20
00)
=
1
1300
38
1.
50
18
0.5
19,8
75
3.0
- -
- -
- 0.
25
1700
38
1.
50
27
0.75
13
,050
2.
0 0.
0005
8 0.
17
5 0.
1 90
0 0.
75
1750
41
1.
65
29
0.79
13
,690
2.
1 0.
0007
4 0.
22
7.5
0.15
1,
000
0.83
1800
25
1
35
1 6,
630
1 0.
0032
0 1
50
1 1,
200
1
1850
10
0.
40
150
4.4
1,77
5 0.
27
0.01
27
3.9
350
7 1,
400
1.17
1900
6
0.26
24
0 14
.5
276
0.04
2 0.
2740
84
.7
11,0
00
220
3,50
0 2.
9
1950
10
* 0.
40
11,6
00
340
10
0.00
2 4.
94
1,52
8 25
0,00
0 5,
000
4,70
0 3.
92
2000
4
0.18
25
,000
1,
000
1.7
0.00
03
21.2
5 6,
566
1,27
0,00
0 25
,600
18
,000
15
Sour
ce: a
utho
rs’
own
esti
mat
es a
nd F
ouqu
et a
nd P
ears
on (
2003
b)

Seven Centuries of Energy Services / 169
significantly overestimated actual levels of per capita consumption, as Figure 14 suggests. It would also have implied demands on coal and gas production and electricity generation, as well as environmental implications, very different from actual experience. And a forecast based only on the price of the lighting fuel (instead of the lighting service) and per capita income and their elasticities, would have been even more inaccurate. This emphasises the importance of understanding the complex and changing factors and relationships that influence
Figure 14. Indices of Key Lighting Variables in the United Kingdom (Log Scale, 1800=1), 1300-2000
Source: authors’ own estimates – see Section 2.
Table 4. Growth Rates of Light Price, Per Capita Income and Per Capita Light Use in the United Kingdom, 1800-2000 (average annual, in per cent per year)
Price of lighting services GDP/capita Light use/capita
1800-1850 -2.2 0.3 2.7 1850-1900 -3.6 1.8 6.3 1900-1950 -6.3 0.6 6.0 1950-2000 -3.7 2.7 3.0
Source: derived from data underlying Table 2.

170 / The Energy Journal
the demand, supply and price of energy services. As indicated in the first section, our understanding of the evolution of energy services over waves of economic, social and technological development still has many gaps, and requires not only an understanding of the evolution of service prices but also an exploration of the influence of other factors, in addition to income and price, that influence the take-up of those services. We return to this issue in the final section.
11. CONCLUSION
The history of artificial lighting in the United Kingdom illustrates the kinds of dramatic and often surprising improvements that can be achieved in energy services – and that are likely to continue to flow from ongoing and future developments in lighting and associated technologies. As Grübler et al. (1999) have shown, explorations of historical patterns are central to anticipating developments in future energy systems and their environmental impact. This study of artificial lighting corroborates their conclusions: (i) accumulated experience and learning of technologies creates reductions in cost and improvements in performance; (ii) there are regular patterns of technological competition; and (iii) synergies lead clusters of technologies and infrastructures to co-evolve. The evolution of lighting markets certainly saw both the rapid emergence of new technologies (benefiting from accumulated experience in niche markets and synergies with other technologies) and the dominance – and sometimes lock-in - of incumbent technologies for long periods (See Figure 15).
One lesson, as we have suggested, is that using past trends to anticipate future developments is risky: it might be appropriate, if we are in a period of technological and infrastructure lock-ins, or misguided, if new technologies, fuels and synergies are or are likely to be being discovered. The evolution of markets for lighting services seems to have experienced a number of ‘punctuated equilibria’ (Gould 2002). Rather than a continually and gradually changing system, periods of stability were disrupted by dramatic transformations, resulting from major innovations in energy and/or technology markets and their associated institutions.
Indeed, it can be suggested that we have seen four distinct revolutions in lighting services. The first occurred in the second-half of the eighteenth century. Between 1750 and 1800, the price of lighting halved, as the cost of candles and oil fell and the lighting technologies improved. These changes resulted from a combination of changing supply-side factors, such as production technologies and methods, and rising demand, due to rising income and other influences, in the context of expanding markets. Lighting consumption (mostly from tallow candles, as well as whale and vegetable oil) rose six-fold in this period.
The second revolution (between about 1810 and 1850), associated with the introduction of gas lighting, left the price of lighting eight times lower. Consumption rose twelve-fold. By the mid-nineteenth century, gas made from the coking of coal produced three-quarters of UK lighting. The third revolution (from 1860 to 1900) resulted from the second wave of gas and the expansion of

Seven Centuries of Energy Services / 171
kerosene markets. The cost of lighting fell six-fold. These developments were of considerable benefit to the middle and lower classes, respectively, and represent a kind of ‘democratisation’ of access to relatively affordable artificial lighting. Consumption increased twelve-fold. By the end of the nineteenth century, gas provided around four fifths (82%) and kerosene one sixth (15%) of lighting services in the UK. The fourth revolution (from about 1920 to 1950) saw the large-scale introduction of electricity. Prices fell twenty-fold, and consumption rose ten fold. At the beginning of this phase, gas provided 80% of the lighting in the UK but, by the end, electricity generated 99%.
Table 5 shows the changes in the lighting sources over time, as well as their efficiencies. It indicates how energy sources that were virtually not in use, then became the dominant source in less than fifty years. Thus, energy technologies and systems that seemed eternal, to those living at the time, could be replaced in a few decades. One might wonder about the next revolution in lighting services. While compact fluorescent lighting (CFL) is in the process of reducing the costs of illumination again, another revolution will come. And, when it comes, possibly from solid state lighting technologies, such as Light Emitting Diodes (LED), Organic Light Emitting Diodes (OLED) and other developments, we can expect dramatic declines in the price of lighting services (U.S. Department of Energy 2003, The Economist 2002).45 Based on past evidence, new technologies
Figure 15. Consumption of Lighting from Candles, Gas, Kerosene and Electricity in the United Kingdom (in billion lumen-hours), 1700–2000
Source: authors’ own estimates – see Section 2.2 and 2.3. Billion: 109 (i.e. one thousand million)
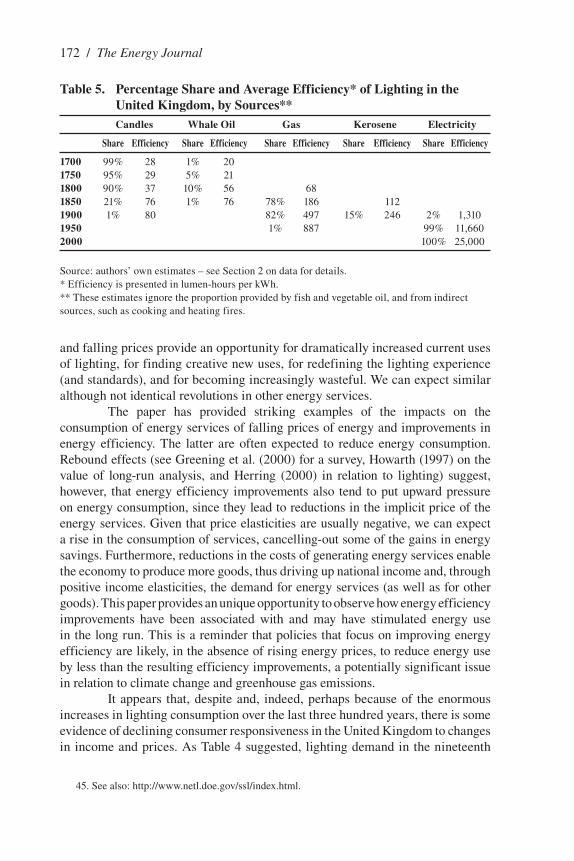
172 / The Energy Journal
and falling prices provide an opportunity for dramatically increased current uses of lighting, for finding creative new uses, for redefining the lighting experience (and standards), and for becoming increasingly wasteful. We can expect similar although not identical revolutions in other energy services.
The paper has provided striking examples of the impacts on the consumption of energy services of falling prices of energy and improvements in energy efficiency. The latter are often expected to reduce energy consumption. Rebound effects (see Greening et al. (2000) for a survey, Howarth (1997) on the value of long-run analysis, and Herring (2000) in relation to lighting) suggest, however, that energy efficiency improvements also tend to put upward pressure on energy consumption, since they lead to reductions in the implicit price of the energy services. Given that price elasticities are usually negative, we can expect a rise in the consumption of services, cancelling-out some of the gains in energy savings. Furthermore, reductions in the costs of generating energy services enable the economy to produce more goods, thus driving up national income and, through positive income elasticities, the demand for energy services (as well as for other goods). This paper provides an unique opportunity to observe how energy efficiency improvements have been associated with and may have stimulated energy use in the long run. This is a reminder that policies that focus on improving energy efficiency are likely, in the absence of rising energy prices, to reduce energy use by less than the resulting efficiency improvements, a potentially significant issue in relation to climate change and greenhouse gas emissions.
It appears that, despite and, indeed, perhaps because of the enormous increases in lighting consumption over the last three hundred years, there is some evidence of declining consumer responsiveness in the United Kingdom to changes in income and prices. As Table 4 suggested, lighting demand in the nineteenth
45. See also: http://www.netl.doe.gov/ssl/index.html.
Table 5. Percentage Share and Average Efficiency* of Lighting in the United Kingdom, by Sources**
Candles Whale Oil Gas Kerosene Electricity
Share Efficiency Share Efficiency Share Efficiency Share Efficiency Share Efficiency
1700 99% 28 1% 20 1750 95% 29 5% 21 1800 90% 37 10% 56 68 1850 21% 76 1% 76 78% 186 112 1900 1% 80 82% 497 15% 246 2% 1,310 1950 1% 887 99% 11,660 2000 100% 25,000
Source: authors’ own estimates – see Section 2 on data for details. * Efficiency is presented in lumen-hours per kWh. ** These estimates ignore the proportion provided by fish and vegetable oil, and from indirect sources, such as cooking and heating fires.

Seven Centuries of Energy Services / 173
century appears to have been more income and price elastic than in the second half of the twentieth century. In homes and businesses before the nineteenth century, people lived and worked to the rhythms of the sun and moon. Cheaper lighting - and greater wealth - were opportunities to ‘lengthen the day’ both in the factory and in the kitchen (Bowers 1998). Improvements in access to and in the affordability and quality of lighting transformed the economy and society – longer and safer working hours, new tools for marketing, better conditions for learning, and safer streets. They may have also changed the way we think about and sense the world – less dependent on the sun and moon, less afraid of the dark and distancing ourselves from the communal fire, less tactile and more visual (Verdon 2002). Today, most homes, businesses and streets in the UK seem lit sufficiently for most requirements. People are no longer in awe of our ability to create light. So, when prices fall and incomes rise further, consumption will grow, but probably not with the dynamism that illuminated the industrial revolution.
The demand for lighting evolved as income rose, innovation proceeded, lighting service prices fell and attributes associated with the fuels and technologies changed and were refined. While hard to estimate, especially in the early periods, given the patchiness of the data, the long run evolution of demand for lighting has also been influenced by non-price variables (Wilm and Mills 1993). The development of markets for candles and oil enabled many families to reduce their time spent preparing rushlights, freeing them for other activities. The introduction of gas was of major benefit to lighting large areas, including factories, as the heat generated by sufficient candles to provide illumination was frequently unbearable (Bowers 1998). Similarly, candles and oil lamps were the source of many fires, mostly avoided with gas lighting. The introduction of electricity provided other valuable attributes. Large scale gas lighting, for example in theatres, created heat and depleted oxygen. Simply flicking a switch to turn on the electric lamps made lighting up a room much easier. It also reduced the amount of preparation, maintenance and cleaning required, as well as the smell of burning tallow candles, animal or vegetable oil or gas (O’Dea 1956). Thus, the growth in the demand for new or enhanced attributes has always been important for the successful introduction or failure of a new lighting technology. Our measures of the cost of lighting services in this paper do not themselves take proper account of the effects of technical change on the full range of attributes that affect the quality of lighting services: in our view, further research in this area would yield valuable insights.
Through technological, market and other institutional and public policy developments, our ability to live and work in a well-illuminated environment has radically transformed the economy and society of industrialised countries. The economic and technological history of light in the UK shows how a focus on energy service provision – rather than just energy markets – reveals the remarkable declines in costs and increases in consumption that have been achieved, especially since the nineteenth century. Today, one lumen-hour costs almost one twenty thousandth of what it cost seven centuries ago, and almost one three thousandth of what it cost in 1800. The average British family uses 200 times more light
174 / The Energy Journal
per year (i.e. around 6 million lumen hours), while as an economy we consume around twenty-five thousand times more light than we did in 1800 (see Figures 14 and 15).
The combination of falling costs, rising quality and increased consumption implies substantial long run welfare gains in the United Kingdom. One implication of these improvements, however, is that they highlight the possibilities for substantial and increasing gaps between rich and poor income groups that can arise from differential access to and ability to pay for modern fuels, energy infrastructures and end-use technologies. Correspondingly, the poor often pay much more than the rich per unit of energy service because they cannot afford the first costs of the efficient technologies. Thus, writing about light in Africa, van der Plas (1994) observed: “The level of services many rural households ‘enjoy’ now is only barely distinguishable from that of medieval Europe.” The average non-electricity using household consumes about 120,000 lumen hours46
per year (Mills 2002). One-third of the global population still uses non-electrical energy sources to generate light – in large part, with kerosene lamps rather than compact fluorescent lamps, which are 1,625 times more efficient. Households around the world are estimated to consume 96 billion litres of kerosene (3,600 petajoules (PJ)) per year, worth $48 billion. This represents 20% of the global lighting expenditure (estimated at $230 billion), but only 0.2% of the lighting consumed (Mills 2002). Clearly, access to modern lighting services is a key issue in many of the poorest parts of the developing world.
Correspondingly, the evidence from the history of lighting in the UK suggests that rising income in developing economies that are managing to grow rapidly, such as China and India, and declining costs of lighting services through electrification can be expected to lead to dramatic increases in lighting consumption. There are very substantial economic and social benefits to be gained from the far greater levels of illumination these countries will experience. However, in the course of this century countries in the developing world will also add significantly to an already large flow of carbon dioxide emissions associated with illumination. In 1997, the electrified world used 2,016TWh (21,100PJ) of electricity, providing around 12,100 trillion lumen hours (Mills 2002). This electricity was generated by power stations emitting 1.8 billion tonnes of carbon dioxide; emissions from kerosene lighting were around 0.24 billion tonnes. Further research is needed on the likely impacts of improved access to modern lighting services on energy use and emissions.
Mills and Borg (1999) discuss the policies in place in some countries to control light behaviour, as a means of reducing energy use and emissions. Furthermore, in some places, light pollution has been a growing problem (Riegel 1973). To address it, several countries have already imposed restrictions on lighting levels (HoCSTC 2003). Rising income levels and improving energy efficiency
46. As a reminder, one million lumen-hours is approximately equivalent to a 100 watt bulb running for 100 hours.

Seven Centuries of Energy Services / 175
(particularly associated with outdoor lighting), which will increase illumination levels, are in direct conflict with policies to reduce light pollution. In the absence of effective policies, the problem is likely to intensify in industrialised and fast developing economies.
In this paper we have aimed to show the value of trying to develop a richer understanding of the demand for energy services and its evolution over long periods of time and at different stages of economic, societal and technological development. In our future work (including Fouquet and Pearson 2006) we intend to explore the underlying relationships, influences and issues in more depth, and to try to elucidate some of the insights for future policy that might be drawn from this story of light.
REFERENCES
Administrative Council of London. (1920). Electricity Supply 1917-1920. London: London County Council.
Anderson, J.L. (1981). “Climatic change in European economic history.” Research in Economic History 6: 1-34.
Barrow, T. (2001). The Whaling Trade of North-East England 1750-1850. University of Sunderland Press.
Beveridge, W. (1894). Prices and Wages in England: From the Twelfth to the Nineteenth Century. London: Longmans, Green and Co.
Bowers, B. (1969). R.E.B. Crompton: An account of his electrical work. London: Her Majesty’s Stationery Office.
Bowers, B. (1998). Lengthening the Day: A History of Lighting Technology. Oxford: Oxford University Press.
Bright, AA. (1949). The Electric Lamp Industry: Technological change and economic development from 1800 to 1947. New York: Macmillan.
Byatt, I.C.R. (1979). The British Electrical Industry 1875-1914. Oxford: Clarendon Press.Defoe, D. (1719) The Life and Strange Surprising Adventures of Robinson Crusoe. See: http://www.
online-literature.com/defoe/crusoe/ .Department of Trade and Industry (1997 and backdates). Digest of United Kingdom Energy Statistics.
London: HMSO.The Economist. (2002). ‘A solid future for lighting’. October 3rd. Electricity Council (1987). Electricity Supply in the United Kingdom, (4th ed.). London: The
Electricity Council.Eveleigh, D.J. (2003). Candle Lighting. Princes Risborough: Shire Publications.Falkus, M.E. (1967). ‘The British Gas Industry before 1850.’ Economic History Review XX: 494-508.Falkus, M. (1976). “Lighting in the Dark Ages of English economic history.” in D.C. Coleman and
A.H. John, eds., Trade, Government and Economy in Pre-Industrial England. London: Weidenfeld and Nicolson.
Falkus, M.E. (1982). ‘The early development of the British Gas Industry, 1790-1815.’ Economic History Review XXXV: 217-34.
Feinstein, C.H. (1972). National Income, Expenditure and Output of the United Kingdom, 1855-1965. Cambridge: Cambridge University Press.
Fouquet, R. and P.J.G. Pearson. (1998). ‘A Thousand Years of Energy Use in the United Kingdom’, The Energy Journal, 19(4), 1-39.
Fouquet, R. and P.J.G. Pearson. (2003a). ‘Long Run Trends in Energy Services: The Price and Use of Road and Rail Transport in the UK (1300-2000)’, Proceedings of the BIEE Conference, St John’s College Oxford, September (CD-ROM): http://www.biee.org/downloads/conferences/HISLIG20.PDF.

176 / The Energy Journal
Fouquet, R. and P.J.G. Pearson.(2003b). ‘Five Centuries of Energy Prices’, World Economics, 4(3): 93-119.
Fouquet, R. and P.J.G. Pearson. (2006, forthcoming). Heat, Power and Light: Revolutions in Energy Services. Cheltenham: Edward Elgar.
Francis, D. (1990). A History of World Whaling. London: Viking, Penguin Books. Fussel, G. (1955). ‘History of Cole.’ Nature CLXXVI no.4471: 47-51.Geels, F.W. (2005). Technological Transitions and System Innovations, Cheltenham: Edward
Elgar.Gledhill, D. (1999). Gas Lighting. Princes Risborough: Shire Publications.Gould, S.J. (2002). The Structure of Evolutionary Theory. Cambridge, Mass: Harvard University
Press. Gordon, B. (1981). One Hundred Years of Electricity Supply. A Milne Museum booklet. Hove: South
Eastern Electricity Board.Greening, L.A., D.L. Greene, and C. Difiglio. (2000). ‘Energy efficiency and consumption – the
rebound effect – survey.’ Energy Policy 28(6/7): 389–401.Hatcher, J. (1993). The History of the British Coal Industry. Volume I. Oxford: Clarendon Press.Hannah, L. (1979). Electricity before Nationalisation. London: Macmillan.Hannah, L. (1982). Engineers, Managers and Politicians. London: Macmillan.Herring, H. (2000). ‘Is energy efficiency environmentally friendly?’ Energy and Environment
11(3): 313-325.House of Commons Science and Technology Committee (HoCSTC) (2003). Light Pollution and
Astronomy. Seventh Report of Session 2002-3. London: The Stationery Office. Howarth, R. (1997). ‘Energy efficiency and economic growth.’ Contemporary Economic Policy
15: 1-9.Jackson, G. (1976). The British Whaling Trade. London: A & C Black Ltd. Jones, C.L. (1989). “Coal, gas and electricity,” in R. Pope, ed., Atlas of British Economic and Social
History since 1700. London: Routledge.Kane, R. and H. Sell. (eds.) (2001). A Revolution in Lamps (2nd ed.). Lilburn, GA: The Fairmont
Press (distributed by Prentice-Hall). Landes, D.S. (1969). The Unbound Prometheus: Technological Change and Development in Western
Europe from 1750 to the Present. Cambridge: Cambridge University Press.Matthews, D. (1986). ‘Laissez-faire and the London Gas Industry in the nineteenth Century: Another
look.’ Economic History Review XXXIX: 244-63.Meadows, C.A. (2001). Discovering Oil Lamps. Princes Risborough: Shire Publications.Mill, J.S. (1909). Principles of Political Economy with some of their Applications to Social
Philosophy. Book V. London: Longmans, Green and Co. 7th ed. Mills, E. (2002). ‘The $230-billion global lighting energy bill.’ Proceedings of the Fifth European
Conference on Energy-Efficient Lighting, International Association for Energy-Efficient Lighting, Stockholm: 368-385 . http://eetd.lbl.gov/ea/EMills/LightingPublications.html.
Mills, E. and N. Borg. (1999). ‘Trends in recommended lighting levels: an international comparison.’ Journal of the Illuminating Engineering Society of North America 28(1): 155-163.
Ministry of Fuel and Power (1951). Statistical Digest 1950. London: HMSO. Ministry of Power (1961). Statistical Digest 1960. London: HMSO.Mitchell, B.R. (1988). British Historical Statistics. Cambridge: Cambridge University Press.Monier-Williams, R. (1973). The Tallow Chandlers of London, Vol. 3: The Guild Catholic. London:
Kaye & Ward.Newman, J. (2003). A Short History of Price’s Patent Candle Company Ltd., pers. communication.Nordhaus, W. D. (1997). “Do real output and real wage measures capture reality? The history of
lighting suggests not,” in T.F. Bresnahan and R. Gordon, eds., The Economics of New Goods.Nordhaus, W. D. (1998). “Quality Change in Price Indexes,” Journal of Economic Perspectives,
12(1): 59-68.O’Dea, W.T. (1958). The Social History of Lighting. London: Routledge & Kegan Paul Ltd.Office of National Statistics (1997). Economic Trends. London: HMSO.

Seven Centuries of Energy Services / 177
Officer, L.H. (2004). ‘Retail price index 1256-2002’. Economic History Services. Palmer, J. and B. Boardman. (1998). DELight, Environmental Change Unit. Oxford: University of
Oxford.Phelps-Brown, H. and S.V. Hopkins. (1956). “Seven centuries of the prices of consumables, compared
with builders’ wage-rates.” Economica 23: 92-110.Riegel, K.W. (1973). ‘Light pollution.’ Science 179(4080): 1285-91. Rogers J.E.T. (1865, 1882, 1886). A History of Agriculture and Prices in England. Vol I-VI. Oxford:
Clarendon Press.Schivelbusch, W. (1988). Disenchanted Night: The Industrialization of Light in the Nineteenth
Century. Oxford: Berg. Schofield, R. (1994). “British population change, 1700-1871.” in M. Floud, and D. McCloskey,
eds., The Economic History of Britain since 1700: Vol I (1700-1860). Cambridge: Cambridge University Press.
Smil, V. (1993). Energy in World History, Boulder, Westview.Smith, A. (1776). An Inquiry into the Nature and Causes of the Wealth of Nations, Four vols.
Edinburgh. http://www.adamsmith.org/smith/won-intro.htm.Snooks, G.B. (1994). Was The Industrial Revolution Necessary? London: Routledge.Thirsk, J. (1978). Horses in Early Modern England: for Services, for Pleasure, for Power. Reading:
The British Agricultural History Society.U.S. Department of Energy. (2003). Energy Savings Potential of Solid State Lighting in General
Illumination Applications, Building Technologies Program, Office of Energy Efficiency and Renewable Energy, U.S. Department of Energy. http://www.netl.doe.gov/ssl/PDFs/SSL%20 Energy%20Savi_ntial%20Final.pdf
van der Plas, R. (1994). ‘Solar energy answer to rural power in Africa’, FPD Note 6, World Bank, Washington, DC.
Verdon, J. (2002). Night in the Middle Ages. Notre Dame, Indiana: University of Notre Dame Press.
Williams, T.I. (1981). A History of the British Gas Industry. Oxford: Oxford University Press. Wilms, W. and E. Mills. (1995). “Analysis of Price and Non-Price Factors in the Adoption of
Compact Fluorescent Lamps by Households.” Light and Engineering 3(1):33-43.Woodcock, D. (2002). Lighting the English Home before Gas and Electricity. London: Science
Museum.

178 / The Energy Journal
Top Related