


Languages
Pages
Legal

1
Formal HRM Practices in Small Growing Firms Bernice Kotey and Peter Slade
Longer Manuscript
Author for correspondence – Bernice Kotey New England Business School The University of New England Armidale, NSW 2351 Australia Tel. 61 2 6773 2830 Fax. 61 2 6773 3148 Email: [email protected]
Peter Slade Faculty of Business University of the Sunshine Coast Maroochydore South, QLD 4556 Australia Tel. 61 7 5430 1267 Fax. 61 7 5430 1231 Email: [email protected]
Bibliographical Statements
Dr. Bernice Kotey is senior lecturer in the New England Business School at the University of
New England, Armidale. Her research interests cover management and performance issues in
SMEs and family business, and small business education. Dr Peter Slade is senior lecturer in
the Faculty of Business at the University of the Sunshine Coast. He has interests in labour
economics and industrial relations, technological change, the economics of crime, and
gambling.
Acknowledgements
The authors are grateful to Dr Harry Kibbler for his review of the paper.

2
Formal HRM Practices in Small Growing Firms
ABSTRACT
Using data from micro, small and medium firms in Australia, the paper examines the rate of
adoption of formal HRM practices with increasing firm size. The results demonstrate a move
towards division of labour, hierarchical structures, increased documentation, and more
administrative processes as the number of employees increase. The adoption of formal practices
begins early in the growth process, initially at a rapid rate (as a significant percentage of firms
implement these practices) and then at a slower rate (as fewer new firms adopt the formal
practices). At smaller business sizes HRM practices are less formal for managers than for
operatives. The paper concludes that static models cannot be used to portray HRM practices in
small firms, and that management training and advice for small firms must recognise the
diversity of practices associated with various firm sizes.

3
Formal HRM Practices in Small Growing Firms
INTRODUCTION
It is increasingly recognised that small and medium enterprises (SMEs) are complex, varied, and
influenced by a range of factors (Loan-Clarke, Boocock, Smith, and Whittaker 1999; Wagar
1998) and thus cannot be depicted by static models (Reid and Adams 2001; Baron and Kreps
1999). SMEs encompass firms of various sizes with varying degrees of complexity in
management practices. However, they are often treated as one entity. Management training and
advice to SMEs is largely based on textbook prescriptions that require the adoption of formal
management procedures more suited to large firms. Trainers and advisers often fail to
investigate the degree of formality already established in the firm and the implications for the
firm’s competitiveness before prescribing changes to existing practices. This is particularly true
for human resource management (HRM) where practices in SMEs are generally described as
‘informal’ (Wilkinson 1999; Ritchie 1993; Kotey 1999).
Katzell (1962) argued that no one system of organization and management can serve as a
blueprint for all organizations. He identified certain genotypic dimensions, including
organizational size, and the degree of interaction and interdependence of organisational
members, as determinants of variation and complexity in organizational practices and activities.
Following Katzell’s (1962) suggestion, firm size as well as the strategic implications of
increasing size must be considered when defining appropriate levels and areas of formal HRM
practices suitable to each firm. Blau (1970, 1972, 1994) noted two broad trends as organisations
increase in size. The first is increasing division of labour, leading to greater horizontal and
vertical differentiation. The second is that as size expands, differentiation increases- at first
rapidly, but then more and more slowly.

4
The need to examine the interaction between firm size and HRM practices is gaining recognition
among researchers (Heneman, Tansky, and Camp 2000). This paper investigates the extent to
which HRM practices become formal as firms progress in size, and the implications of the
changes for effective and competitive HRM practices. The HRM practices examined are
recruitment and selection, training, performance appraisal, development of human resource
(HR) policies, and maintenance of HR records. Kaman, McCarthy, Gulbro, and Tucker (2001)
noted that these are HRM areas prone to increased formalisation with firm growth.
LITERATURE REVIEW AND HYPOTHESES DEVELOPMENT
In this study, the word formal refers to prescribed practices - that is, practices generally
approved in the literature as appropriate for the various HRM areas examined. In this regard, it
extends beyond documentation and standardisation of procedures, roles, and instructions to
include legitimate sources of recruitment and the use of specialists for training. From Katzell’s
(1962) contention SMEs of varying sizes should exhibit various levels of formality in their
HRM practices.
Consistent with Katzell’s propositions, Hornsby and Kuratko (1990) examined HRM practices
of small United States (US) firms in three size categories, and reported increased sophistication
in practices with firm growth. Roberts, Sawbridge and Bamber (1992) argued that the limits of
informality become apparent in firms with 20 or more employees, when informal networks of
recruitment dry-up and informal styles of management communication are stretched. Jennings
and Beaver (1997) noted that at this size the owner becomes over-extended and needs to
delegate responsibility to more professional management. In contrast, Wilkinson (1999) argued
that employment relations in SMEs are characterised by informality and that formal control
systems and communication strategies are almost non-existent. He maintained that emphasis on

5
rules and procedures is outdated in an environment where owners have to make speedy
decisions in response to market pressures. Golhar and Deshpande (1997) found similarities
among small and large firms in many areas of HRM practices. These contrasting views make it
difficult to understand existing HRM practices in SMEs and to prescribe appropriate practices
for these firms. The result is a ‘one size fit all’ approach to HRM training and advice for SMEs.
Recruitment and Selection
It is expected that as firms grow the skills and abilities required to perform various functions and
activities would no longer be available from the familiar and informal recruitment sources
preferred by the owner-manager. Thus, a greater variety of formal recruitment sources would be
used to attract suitable candidates. Hornsby and Kuratko (1990) reported extensive use of
newspaper advertisements, government and private employment agencies, employee referrals,
and unsolicited applications among small firm recruitment practices. Their findings are
consistent with Barber, Wesson, Robertson, and Taylor (1999) who established increased use of
formal hiring procedures as firms grow. In contrast, Marlow and Patton (1993) and Carroll,
Marchington, Earnshaw, and Taylor (1999) found that recruitment in United Kingdom (UK)
small firms is mainly through informal channels and networks based on previous knowledge of
the individual by the owner, management, or trusted employees. Carroll et al. (1999) cited
Atkinson and Meager (1994) who determined that for very small firms, knowing the individual
is virtually a precondition for recruitment and that informal methods of recruitment remain
predominant as firms grow. Marlow and Patton (1993) explained that SMEs prefer informal
recruitment sources because they are cheaper.
As firms grow, multiple selection techniques would be used, in addition to interviews, to reduce
errors in selecting employees recruited from sources unfamiliar to the owner-manager. Golhar
and Deshpande (1997) demonstrated that one-to-one interviews are the most popular selection
6
techniques in both small and large firms, with large firms also likely to use written tests and
panel interviews in the selection process. Hornsby and Kuratko (1990) reported increasing
prominence of application forms and reference checks in the selection process as firms increased
in size. Barber et al. (1999) determined that larger SMEs tend to rely on objective qualifications
and to use a greater number of selection procedures in making hiring decisions. Rowden (2002)
found that technical skills and positive work ethics received high priority in the selection
processes of several of the successful small manufacturing and processing firms in his sample.
Other researchers report that in SMEs, the one-to-one selection interviews emphasise ‘fitting in’,
with little attention to paper qualifications or previous work record (Bird 1989; Heneman et al.
2000; Carroll et al. 1999). Consequently, ‘good’ potential employees are not selected because
they may be perceived as a threat to the valued independence of the owner-manager (Stanworth
and Curran 1989). Whilst ‘fitting in’ would continue to be emphasised as a selection criterion as
firms grow, attention will also be given to skills and abilities of candidates.
The adoption of formal employment procedures at the managerial level will lag behind that at
the operational level for small firms, as owner-managers prefer to employ the few managers
required from family and friends. This difference is expected to diminish with further growth, as
these familiar sources are no longer able to cater for the specialist skills required. The contention
that HRM practices will become formal with firm growth suggests the following hypotheses -
H1 A greater variety of formal recruitment sources is employed with firm growth.
H2 Screening of candidates is intensified through the use of multiple selection methods as
firm size increases.
H3 The application of formal employment procedures at the managerial level lags behind
that at the operational level for smaller firms.

7
Training and Performance Appraisal
Training in SMEs has been described as informal and on-the-job, with little or no provision for
management development (Loan-Clarke et al. 1999; Marlow and Patton 1993; Storey 1994).
MacMahon and Murphy (1999) noted that SMEs rarely carry out formal training needs analysis
and have no systematic approach to training. Training is often perceived as an unaffordable
luxury involving not only course fees but also the cost of unproductive labour. Owner-managers
argue that training results in highly specialised staff, as opposed to the multi-skilled workforce
required to cope with the highly flexible nature of jobs (MacMahon and Murphy 1999). In
contrast, Hornsby and Kuratko (1990) reported the use of a variety of training methods in small
firms with on-the-job training the predominant method. In very small firms, owner-managers
perform most business activities themselves or directly supervise the performance of these
activities (Timmons 1999). Thus, they take direct responsibility for employee training and teach
their preferred methods of doing things.
Hornsby and Kuratko (1990) found that performance appraisal varies by firm size and industry
sector. They identified narrative descriptions of employee performance, assessment of their
ability to meet targets, and the use of rating scales, as appraisal methods that increased in
prominence with firm size. In contrast, MacMahon and Murphy (1999) argued that owner –
managers usually lack the skills necessary to carry out effective performance reviews and may
perceive formal performance appraisal systems as time-consuming. In very small firms,
performance appraisal would be informal and continuous as owner-managers directly control all
activities (Mintzerg, Quinn and Voyer 1995). As the span of control increases, it is expected that
appraisals would be more formal and occur at longer intervals.
Following textbook prescriptions, middle managers are required to take responsibility for daily
operations of the firm and to supervise operational staff as the number of employees and span of

8
control increase (Collins and McLaughlin 1998). Lavarack (1995) argued that the ability to
recruit extra staff and delegate some responsibility to them is one of the most important skills
for business growth. In reality owner-managers have difficulty in trusting employees and are
reluctant to delegate work (MacMahon and Murphy 1999). This leaves owner-managers too
busy to devote time to strategic roles.
As firms grow, it is expected that training and performance appraisal of operational staff will be
delegated to middle managers. To effectively control performance, owner-managers would shift
their emphasis from operational staff to middle managers. This means they need to pay greater
attention to training, development, and performance appraisal of managers to ensure that
managers develop the skills and abilities necessary to perform their responsibilities. The above
discussion on training and performance appraisal in SMEs would suggest the following
hypotheses -
H4. On-the-job training is the predominant training method in SMEs.
H5 Other training methods become more prominent as firms grow.
H6 Development of managerial staff is given greater attention with firm growth.
H7 Responsibility for training and performance appraisal of operational staff is increasingly
delegated to middle management with firm growth.
H8 Performance appraisal of managerial staff receives greater emphasis with firm growth.
Human Resource Policies and Records
Kotey (1999) stated that few owner-managers have formal and professional policies on human
resource related issues such as promotions, incentives, and disciplinary action. The lack of HR
policies coupled with nepotism and cronyism raise questions of fair treatment of all employees

9
(Bird 1989). SME employers believe that their family orientation ensures that employees are
treated fairly, employee loyalty is encouraged (Rowden 2002) and explicit HR policies are
rendered unnecessary (MacMahon and Murphy 1999). However, Adler and Borys (1996)
suggested that increased formal policies and procedures could reduce employee role stress and
facilitate greater employee commitment.
Job descriptions in small firms are vague because over time jobs change or develop and
employees often create their own jobs (Holliday 1995). Carroll et al. (1999) found no evidence
of systematic job analysis in UK small firms. They noted that managers perceive job
descriptions to be too rigid, restricting the flexibility of their firms. In contrast, MacMahon and
Murphy (1999) reported that poor job descriptions lead to role conflicts and employee
frustration. In many cases, both employers and employees are ignorant of their roles, rights, and
obligations.
In very small firms, direct control by the owner-manager reduces the need for detailed
documentation and accountability. Although limited documentation of policies and procedures
leads to inconsistent application of HRM practices, it does provide flexibility in adapting to
change (Mintzberg et al. 1995). As employee numbers increase, procedures will need to be
standardised for consistent and efficient application and fair treatment of employees (Child
1972). The introduction of standardised practices will induce the establishment and
documentation of HR policies – a practice likely to increase with firm size. Documentation
would also be required for purposes of accountability as owner-managers lose direct control of
operations with firm growth. Documentation includes maintaining employee records required
for statutory purposes and for evidence in the event of litigation. The following hypotheses are
developed for testing based on the above discussion.

10
H9 Documentation of human resource policies and procedures increases with firm
size.
H10 More firms will maintain records on employees as firm size increases.
METHODOLOGY
Definition of Small and Medium firms
The Australian Bureau of Statistics (ABS) defines a firm as small if it employs less than 20
workers and medium if it has up to 199 employees, regardless of the industry sector in which it
operates (Office of Small Business 1999). Small firms are further classified into ‘micro firms’
(if they employ less than 5 workers) and ‘small firms’ (if they have between 5 and 19
employees). These classifications (micro, small, and medium) were used in this research with
the exception that medium firms were restricted to those employing up to 100 workers (see next
paragraph).
Sample and Data Collection
The research was based on a survey of 1330 micro, small, and medium firms on the Sunshine
Coast region of South East Queensland. The Sunshine Coast Economic Development Board
(SCEDB) maintains a database of small and medium firms in the region, which it updates
frequently. All the firms in the 1996 database were surveyed with the exception of one firm –
the Buderim Ginger Factory, then a public company and the only firm in the database with more
than 100 employees. This firm was excluded from the study to avoid distorting the results.

11
Data for the research was obtained from a mail survey of firms in the sample 1. The eight-page
questionnaire covered general information on the business, demographic details of respondents,
recruitment and selection practices, performance appraisal, training methods, and HR records
and policies. The average number of employees in the various size categories is shown in Table
1. The table also presents number of employees in managerial and operational positions and
under various employment contracts (full-time, part-time and casual).
Measurement of Variables
Business details such as employee numbers, positions, and contract length, and number of
business locations were measured at the ratio level. Respondents were asked to indicate the
number of employees in each position and employment category (that is, managerial and
operatives; full time, part time, and casual) and the number of business locations. The questions
for the other business characteristics and respondents’ (owner-manager) details were close-
ended and measured by nominal scales. Respondents were asked to choose among a number of
alternative answers those corresponding to their responses to each question. Examples include
gender (male or female); method of business acquisition (purchase, inherited, started); work
experience (own business, family business, other private business, public companies,
government organisation).
All the HR practices except those in Table 6 were measured at the nominal level. A list of
recruitment sources, selection techniques, and training and appraisal methods were defined and
respondents asked to choose those that corresponded with their practices, separately at the
operative and managerial levels. Five-point Likert scales were used to measure variable items in
Table 6 with a ‘c’ superscript (such as provision of orientation training, use of application and
1 It was not possible to carry out a fully stratified random sample of firms in these size categories due to lack of information on employment sizes in the database from which the sample was drawn. However, the responses reported below show reasonable representation of all size and industry groups.

12
appointment letters and/or forms) and 3-point Likert scales were used to measure items with a
‘b’ superscript (such as maintenance of records on employees, job descriptions). A copy of the
questionnaire showing the questions asked and response format is attached as an appendix.
Analytical Techniques
One-way Analysis of Variance (ANOVA) was used to examine differences in HRM practices of
employers in the three size categories for variables measured at interval and ratio levels.
Variables measured by nominal scales were analysed using Chi-square tests. Where significant
differences were indicated by ANOVA, differences between the groups were examined using
Tukey tests of significance of difference to control for Type 1 errors. Similarly, where Chi-
square tests indicated significant differences between the three groups, the differences were
further investigated by separate Chi-square tests for micro and small firms, and for small and
medium firms. Differences in the adoption of formal HRM practices at the managerial and
operational levels were examined for the three size categories using Wilcoxon Signed Ranked
Tests.
Response
Three hundred and seventy-one (371)2 useable responses were received out of the 1,330
questionnaires sent, - a response rate of about 28%. This response is consistent with similar
HRM surveys involving small firms (for example Deshpande and Golhar 1994). Nevertheless,
to address the possibility of non-response bias, the ‘final wave’ of respondents (to surrogate late
respondents for non-respondents) was compared to the initial respondents within each size
group. Chi-square and t-test statistics revealed no significant differences at the 5% level for any
of the variables in the study.

13
Of the 371 responses, 84 (22%) were micro-firms, 211 (57%) were in the small firm category,
and 76 (21%) were medium firms. A comparison of business characteristics between this
regional sample and national samples of firms in similar size categories showed no significant
differences.3
DISCUSSION OF RESULTS
Sample Characteristics - Business Details and Demographics of Owner-managers
On average, medium firms employed significantly more permanent (full-time) and flexible staff
(part-time and casual) than both micro and small firms (Table 1). There were significantly more
full time workers in small firms than in micro firms (Table 1), but the number of part time and
casual staff were similar for both firms. The percentages of permanent and flexible staff were
similar for the three groups, with the exception that medium firms employed relatively more
part-time staff than micro firms. An appropriate mix of fulltime and flexible staff is necessary
for effective labour cost management. Full-time employees provide the stability in operations
required for permanent growth and staff on flexible contracts supports temporal fluctuations in
growth (English 2001). The average ratio of permanent to flexible staff was 2:1 (Table 1).
Take in Table 1 here
The number of employees at both operational and managerial levels increased significantly
across the three firms. However, the ratio of one manager to four operatives was maintained for
all firm sizes. This means additional managerial staff was employed at each firm size to
maintain a consistent span of control.
2 This was the final response after a mail follow up was conducted 3 Source of statistics on national sample: Department of Industry, Science and Tourism (DIST) (1998), A Portrait of Australian Business, Results of the 1995 Business Longitudinal Survey, Small Business Research Program, Canberra.

14
The number of firms owned and operated in other locations was higher for medium firms
compared to small and micro firms (Table 1). In micro firms, the niche market strategy, with a
single or few product lines is effectively contained in one location. As firms grow the niche
strategy is gradually replaced by a mass-market strategy, market segmentation and broader
product lines, or even by diversified products (Mintzberg et al. 1995). Thus in medium firms
production facilities may be established in other locations in pursuit of more markets.
On average, medium firms were the oldest of the three firm groups, with the majority aged more
than 10 years (Table 2). Consistent with their age, a higher percentage of medium firms were
inherited, as older firms are likely to have been passed on to second-generation owners. The
majority of respondents were male (79%), aged between 41 and 60 years (71%). Many (53%)
were employees in other businesses before commencing their current business or had prior
experience as business owners (44%). There were more female owners in micro firms than in
both small and medium firms (Table 2). This is consistent with the literature, which indicates
that female owner-managers tend to operate smaller firms (Brush 1992; Meredith and Barrett
1994). The percentage of respondents with prior experience in the private sector was fewer for
medium firms compared to small and micro firms (Table 2)- a finding that may reflect national
and to some extent international changes in employment preferences over the last decade - from
public to private sector and/or to self-employment (Timmons 1999).
Take in Table 2 here
Results of the Hypotheses Tests
The results showed that adoption of formal HRM practices increased with firm size, with a
move towards formal practices occurring early in the growth process. This was demonstrated by
a greater increase between micro and small firms than between small and medium firms in the
percentages of firms that implemented various formal HRM practices. At the micro and small

15
levels the adoption of formal HRM practices at the managerial level lagged behind that at the
operational level. Attention to the development of managers increased with firm size. The
results also showed increasing standardisation and documentation of HRM practices as firms
grow.
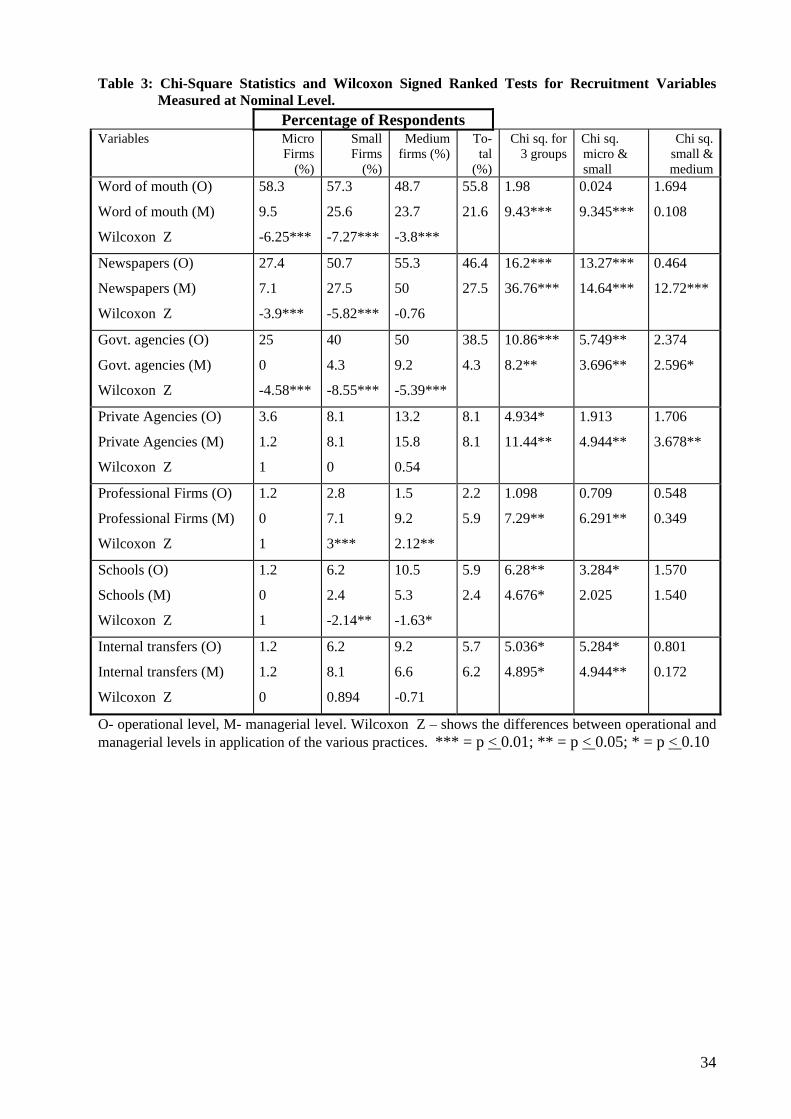
Recruitment and Selection
A greater range of formal recruitment sources, such as newspaper advertisements and
government recruitment agencies, was employed with firm growth. Screening of candidates also
intensified as the use of various selection techniques increased with firm size. Although the use
of formal employment procedures for managers lagged behind that for operational staff in micro
and small firms the differences diminished for medium firms. Hypotheses 1, 2 and 3 were thus
confirmed.
At the operational level, word of mouth was the main recruitment source for micro and small
firms, confirming the findings of Marlow and Patton (1993). The greater use of government
employment agencies, newspaper advertisements, and school recruitment by small and medium
firms compared to micro firms demonstrates increased formal recruitment sources as firms grow
(Table 3). This is consistent with the need to widen the search for suitable employees as the pool
of potential employees from informal sources such as family and friends becomes exhausted
(Roberts et al. 1992). The findings also indicate that the skills required to support growth are not
readily available from these informal sources. The trend began early in the growth process
between micro and small firms but slowed down considerably thereafter (as portrayed by the
absence of significant changes between small and medium firms). There was some evidence of
internal transfers in small and medium firms, made possible by growth.
Take in Table 3 here

16
The need for suitably qualified managerial staff to fill gaps in the owner-manager’s skills and to
take responsibility for operational activities as the firm grows, was indicated by the sharp rise in
the use of formal recruitment sources such as newspaper advertisements (Table 3). However,
recruiting managers by word of mouth was still common in small and medium firms. Atkinson
and Meager (1994) suggested that this reflects the desire of owners to work with managers who
are known to them. Government agencies and schools were rarely used at the managerial level,
as these sources are considered more appropriate for recruiting operational staff than managers
(Collins and McLaughlin 1998). Students often lack the experience required at the managerial
level and managers rarely enlist with government employment agencies for work. In contrast,
professional firms were used more often to recruit managers than operatives in small and
medium firms. The predominant use of newspaper advertisements compared to word of mouth
to recruit managers in medium firms reflects the greater specialisation in tasks. It also shows
that the number and skills of managers required in medium firms are not available from the
informal sources preferred by the owner-manager. Only a small percentage of micro firms
reported using the various recruitment sources at the managerial level. With less than 5
employees, recruitment, particularly at the managerial level, is not a frequent occurrence in
micro firms. The gap in the use of formal recruitment sources at the managerial and operational
levels diminished in medium firms as more managers were employed.
Take in Table 4 here
The interview was the predominant selection method at the operational level for all three groups
of firms. This finding is consistent with those of Golhar and Deshpande (1997) and Marlow and
Patton (1993). In addition, more small and medium firms than micro firms reviewed
applications and qualifications, and investigated candidates’ backgrounds from previous
employers. The increased use of a variety of selection techniques as more employees joined the

17
firm from outside the network of friends and family is in consonance with the increased risk in
selection and greater cost of recruitment. Although a greater variety of selection techniques is
advised in HRM texts, greater variety entails higher costs. For micro firms the higher costs can
be avoided and employee qualities can be better assessed through informal interviews (Marlow
and Patton 1993).
At the managerial level, selection techniques such as interviews, review of applications,
assessment of candidates’ qualifications, and the use of references increased with firm size
(Table 4). Moreover, investigations from previous employers were more prevalent in small and
medium firms than in micro firms (Table 4). These selection methods were less frequently
applied in micro firms, as employment of managerial staff is rare and potential managers are
likely to be family and/or friends. This reduces the need for in-depth screening and reflects the
limited resources available to micro firms.
The gap between operational and managerial staff in the application of various selection
techniques narrowed in medium firms compared to micro and small firms. At the operational
level, there were no significant differences between small and medium firms in the application
of the various selection techniques with the exception of medical examinations. In contrast, at
the managerial level the percentage of firms applying the various selection techniques continued
to increase as firms grew. This suggests greater attention to the quality of management as firm
size increases and more managers are employed from outside the confines of friends and family.
Training
The results support the hypotheses that on-the-job training is the predominant training method in
SMEs (H4) and that other training methods gain prominence with firm growth (H5), particularly
at the managerial level. That greater emphasis is given to development of managerial staff as

18
firms grow (H6) and training of operational staff is delegated to middle management (H7) were
also supported by the results.
Take in Table 5 here
At the operational level, the majority of employers in all three categories of firms provided on-
the-job training for their employees, supporting the findings of Marlow and Patton (1993) and
Hornsby and Kuratko (1990). However, the use of this method declined whilst the delegation of
training responsibility to supervisors increased with firm size (Table 5). Shifting the
responsibility for training operatives from owner-managers to middle management is consistent
with increased delegation of operations to middle management as firms grow. Nevertheless, the
percentage of owner-managers who provided on-the-job training to operatives exceeded those
who delegated training to middle management at all firm sizes. This suggests a reluctance of
owner-managers to delegate and confirms the findings of MacMahon and Murphy (1999). The
decline in external training for operatives from small to medium firms may imply that in-house
training by middle management is more cost-effective as employee numbers increase. For micro
firms, training operational staff predominantly by watching and correcting their performance on
the job is justified on cost grounds (Baron and Kreps 1999).
As firms grew, the increased emphasis on external training for managers signifies concern for
both their training and their development, possibly to enhance their ability to contribute to
organizational success (Kaman et al. 2001; Rowden 2002). It also indicates a greater awareness
of management succession. Further, the move towards on-the-job training for managerial staff,
as firm size increased, is consistent with the shift in the role of owner-managers from managing
operations to managing managers (Timmons 1999). It may also reflect the desire of owner-
managers to maintain control and direct the firm towards their vision. Relatively little attention

19
was given to training managers in micro firms, possibly because managers are few and are
family or friends with whom business matters are discussed informally. In addition, the high
level of uncertainty and change in micro firms could render extensive training of management
ineffective. MacMahon and Murphy (1999) noted that extensive training could produce highly
specialised staff unable to adapt to changing work requirements.
Small and medium firms were more likely than micro firms to provide orientation training for
new employees (Table 6) and to cover more issues during orientation (Table 5). These findings
reflect the greater resources of small and medium firms, and the need to minimise the risk and
costs associated with employing staff from sources unfamiliar to the owner-manager. Efforts to
ensure consistency in the orientation process increased with firm size - about half of the medium
firms had a checklist of issues covered during orientation compared with a third for small firms
and a quarter for micro firms (Table 5). These findings demonstrate greater standardisation of
HRM practices with growth, necessary for uniform and efficient practices. Kaman et al. (2001)
stated that orientation programs help employees to overcome uncertainty, become familiar with
the organisation, and make positive contributions.
Take in Table 6 here
The increase in coverage of orientation issues between micro and small firms compared with
small and medium firms supports Blau’s (1970) contention that the adoption of formal practices
begins at a faster rate, early in the growth process and continues at a declining rate thereafter.
More medium firms than both micro and small firms indicated that some of their employees
were multi-skilled. In contrast, the percentages of micro and small firms with a totally multi-
skilled workforce were higher than for medium firms (Table 5). This demonstrates greater
specialisation of tasks in medium firms. The majority of respondents in all three categories of

20
firms indicated that operations would continue even if one or more employees (including the
owner-manager) were unable to attend to their normal duties.
Performance Appraisal
The appraisal of performance of operatives by middle managers increased with firm size (H7).
Although a higher percentage of micro and small firms applied the various appraisal methods at
the operational level than at the managerial level, the differences declined in medium firms. As
firms grew, there were greater increases in the percentage using the various appraisal methods at
the managerial level than at the operational level confirming H8.
The majority of firms appraised performance of their employees, particularly in small and
medium firms (Table 7). For micro firms, the close association with employees enabled owner-
managers to observe and correct wrong performance almost immediately, whereas under the
more formal processes of the larger firms performance appraisal occurred at less frequent
intervals (Table 7). Rating scales were the most popular appraisal methods at the operational
level and some employers compared performance between employees. As the number of
operatives increased, appraisal of their performance was increasingly delegated to managers
(Table 7). The use of peer- and self-appraisals also increased with firm size. However, at the
operational level the use of other appraisal methods rarely changed as firms grew.
Take table 7 in here
Compared with the appraisal of operative performance, fewer firms appraised the performance
of managers in micro and small firms. This may reflect the small number of managers in these
firms and their close association with the owner-manager. In micro and small firms appraisal of
management performance may take place informally. The most common methods of appraising

21
managerial performance were by rating scales and to a lesser extent, their ability to meet targets
(Table 7). The use of targets has a flow on effect - by holding managers accountable for
performance targets, they will in turn ensure that these targets are achieved at the operational
level.
The fewer opportunities for promotion and limited formal training in micro firms compared with
both small and medium firms may explain why less use is made of information from
performance appraisal to assess employee training needs and promotional prospects. Both micro
and medium firms were less likely than small firms to train staff with consistently low
performance before terminating their employment. This suggests that micro firms may not
always be able to afford the cost of extensive training for poor performing employees. For
medium firms, which may have the relevant legal and administrative structures for dismissal in
place, it may be cheaper to dismiss than to train very poor performing staff.
Human Resource Policies and Records
The findings indicate that standardisation and documentation of HR procedures (H9) and
maintenance of employee records (H10) increase with firm size. Both begin early in the growth
process and continue at an increasing rate thereafter as portrayed by the increasing percentage of
firms with HR policies and records on various issues as firms grew in size (Table 8). Concern
for Occupational Health and Safety (OHS) by the majority of firms reflects that it is an area
prone to regulation and legal dispute. The narrowing gap between written OHS policies and
verbal communication of these policies to employees as firm size increased may indicate
increasing use of formal communication methods (Table 8).
Take in Table 8 here

22
As owner-managers become distanced from employees, it is necessary to maintain detailed
records on each employee for control purposes, as evidenced by the higher propensity to
maintain such records among small and medium firms, compared to micro firms (Table 6).
These records also serve as reference documents in the event of litigation. Furthermore, once a
certain employment size is reached, records may be maintained in compliance with legal
requirements. In micro firms, the close bond between employer and employees, the close control
exercised by the employer, and the high level of informality in HRM practices reduce the need
for detailed records on employees. However, this practice may prove risky in the event of
litigation. While formal human resource policies and procedures may work against the
flexibility required in micro firms, they are important to ensure uniform and fair treatment of
employees as their numbers increase (Baron and Kreps 1999).
The results showed significant differences between micro and both small and medium firms in
the use of job descriptions and application letters but the differences were not significant
between small and medium firms (Table 6). The findings imply that these administrative
procedures (job description and review of application letters), which minimise errors in the
recruitment and selection process, are implemented early in the growth process as employees
unknown to the owner-manager join the firm. The findings are consistent with Blau’s (1972)
theory that formal practices are implemented at a fast rate during the initial growth phase and at
a declining rate thereafter. The increasing use of application forms as firms grew suggests that
as the frequency of recruitment increases it becomes necessary to standardise the hiring process
for both accuracy and efficiency (Table 6). That job descriptions were not always provided in
either small or medium firms confirm the findings of Holliday (1995) that jobs are not always
clearly defined even in the larger firms. The increasing propensity to issue appointment letters
(Table 6) and to cover more issues in these letters as firm size increased (Table 8) provide

23
further evidence of growing implementation of administrative controls to replace direct control
by the owner-manager.
CONCLUSIONS
Although the study was not set up explicitly to examine interrelationships among the various
dimensions of structure the findings confirm those of Pugh, Hickson, Hinings and Turner (1968)
in the Aston study, Inkson, Pugh and Hickson (1970), and the replication of the Aston study by
Hinings and Lee (1971) and Child (1972). Consistent with these studies the results suggest
positive associations among specialisation (denoted by number of managers), standardisation
and formalization of roles and procedures. The findings show that regulation of the employees’
work and behaviour through specification and documentation of their roles, the procedures they
are to follow in performing these roles and their performance outcomes, tend to increase as more
managers (specialist staff) join the firm. The increase occurs rapidly initially and then at the
reduced rate thereafter (Blau 1970). The findings also concur with Child’s (1972) proposition
that when decision-making is confined to top levels (in this case with the owner-manager(s)) the
need for systems, procedures and paperwork is reduced and the requirement for specialised staff
to maintain and operate the established system minimised.
The results are consistent with the changes associated with start-up and growth stages of firms
(Hanks, Watson, Jansen and Chandler 1993). In support of the life cycle theories the findings
indicate a move from simple structures with highly centralised and informal systems to
functional structures with specialised functions and greater standardisation and formalisation of
activities. Nevertheless, the percentage of firms in the micro and small category aged 10 years
or older reflect a preference among owner-managers for life-style businesses (Storey 1994). This

24
implies that some of the firms at micro and small level may be at a mature stage, with growth
limited by owner-managers and/or the markets in which they operate (Hanks et al. 1993).
The observed changes in HRM practices may also reflect the strategic orientation of firms at
each of the sizes examined. In micro-firms, the close relationship between employer and
employees replaces formal controls and reduces the need for detailed documentation, leaving the
firm malleable to the frequent changes that characterise business strategy at this size. At this
size, business strategy is likely to be intuitive and oriented towards aggressive search for
opportunities and product development (Hanks et al 1993).
As the firm grows, product lines may be broadened to support a strategy of market segmentation
and to confront competition (Mintzberg et al. 1995). Increased production means more
employees are needed at the operational level. More managers are also required to fill gaps in
the owner-manager’s expertise and to take responsibility for daily operation of the firm as the
owner-manager takes on more strategic roles. This is consistent with the transfer of training and
appraisal responsibilities to middle management. Administrative procedures and controls
replace direct control by the owner-manager. Documentation is increased as part of the control
process to enable accountability, particularly as the number of stakeholders increase. Cappelli
and Crocker-Hefter (1996) and Arthur (1994) support the contention that HRM practices differ
with the strategic approach adopted by firms.
Baron and Kreps (1999) cautioned that the implementation of formal HRM procedures should
not be aimed at ensuring conformity with what is perceived as ‘best practice’ but rather at
developing systems that increase the net benefits associated with human resources. Such
systems should integrate well with other areas of the business, and create synergistic effects to
enhance the total value of the firm. Thus decisions to implement formal HRM practices must

25
involve cost benefit analyses. Benefits of formal HRM practices include meeting legal
requirements, maintaining records in support of decisions in the event of litigation, fair
treatment of employees, and increased efficiency. The major costs are reduced flexibility and
financial resources, and increased organisational inertia. Formal HRM practices can also detract
from performance (Welbourne and Cyr 1999; Kaman et al. 2001). Kaman et al. (2001) found a
positive correlation between bureaucratic HRM practices and absenteeism. In contrast, informal
procedures alleviate the personal distance necessary to handle employee grievances objectively
and can be problematic to growing firms (MacMahon and Murphy 1999). Becker et al. (1997)
stated that to continue to benefit from successful HR practices, firms must continuously add to
their fundamental practices as their strategies change with growth.
While the analyses show that a significant percentage of SMEs implement formal HRM
practices with growth, HRM remains informal in the majority of firms, particularly in small
firms. It could be that implementation of formal HR structures and procedures necessary to
support growth differentiates successful from unsuccessful SMEs. Kotey and Meredith (1997),
Heneman and Berkley (1999), and Huselid (1995) have found positive relationships between
specific HRM practices and firm performance. In general, differences in the adoption of formal
HRM practices among SMEs confirm Katzell’s (1962) proposition that variations in
management practices among SMEs can be explained by firm size.
Summary
The study has shown that unlike the situation in large firms where HRM practices are formal,
HRM in small and medium firms – a) changes with size towards more enunciated and
prescribed practices; b) changes begin early in the growth process and proceed at a faster rate
than during the latter growth phase; and c) adoption of formal HRM practices at the managerial
level lags behind that at the operational level at the smaller firm sizes.

26
Implications
Management training and advice for SMEs, which emphasise formal procedures, may be
counter-productive at certain firm sizes. Such advice may reduce flexibility of the firm and
hinder speedy response to changing strategic visions and environmental variables. HRM
practices such as formal recruitment sources, extensive screening of candidates and extensive
training of employees may not be necessary in micro firms, where employee numbers are small,
the majority are either family or friends, and the owner is in a position to exercise direct control
over activities in the business. Moreover, the owner-manager may not have the resources
required to implement extensive HRM practices. Owner-managers should be made aware of the
importance of maintaining a balance in HRM practices that enable proper accountability and
control, reduce the risk of litigation, and ensure statutory requirements are met, whilst at the
same time providing adequate flexibility for response to changing strategies. The appropriate
balance will differ with size and strategy of the firm.
Limitations and Future Research
The study did not examine industry effects on the changes in HRM practices. This could be
addressed in future research. A longitudinal examination of HRM practices of firms as they
progress through various growth stages should complement the findings in this research. Finally
the self-report, single administrative nature of the questionnaire may pose limitations in that
responses were vulnerable to response consistency bias. Future research could address this
limitation. Care must be taken in generalising the findings from this research as it is based on
SMEs in one small region of Australia.

27
REFERENCES
Adler, R.S., and B. Borys (1996). “Two types of bureaucracy: Enabling and coercive”,
Administrative Science Quarterly, 41(1), 61-89.
Arthur, J. (1994). “Effects of human resource systems on manufacturing performance and
turnover,” Academy of Management Journal 37, 67-687
Atkinson, J., and N. Meager (1994). “Running to stand still: the small firms in the labour
market,” in Small firms and the Labour Market. Ed. J. Atkinson and D. Storey, London:
Routledge,
Barber, A. E., M. J. Wesson, Q. M. Robertson, and M. S. Taylor (1999). “A tale of two job
markets: Organisational size and its effects on hiring practices and job search
behaviour”, Personnel Psychology 52(4), 841-867
Baron, J.A, and D.M. Kreps (1999). Strategic Human Resources: Framework for General
Managers, New York: John Wiley and Sons.
Becker, B. E., M. A. Huselid, and P. S. Pickus (1997). “HR as a source of shareholder value:
Research and recommendations”, Human Resource Management 36 (1) 39 - 47
Bird, B. (1989). Entrepreneurial Behavior. Illinois: Scott Foresman and Company.
Blau, P. M. (1970). “A formal theory of differentiation in organisations”, American Sociological
Review . 35 (2), 201 - 218
Blau, P. M (1972). “Interdependence and hierarchy in organisations”, Social Science Research
1, 1-24.
Blau, P. M. (1994). The Organization of Academic Work. New Jersey: Transaction Publishers.
Brush, C. G. (1992). “Research on women business owners: Past trends, a new perspective and
future directions”, Entrepreneurship Theory and Practice, (Summer), 5-30.
Cappelli, P., and A. Crocker-Hefter (1996). “Distinctive human resources as firms’ core
competencies”, Organisational Dynamics 24(3), 7-22.

28
Carroll, M., M. Marchington, J. Earnshaw, and S. Taylor (1999). “Recruitment in Small Firms:
Processes, Methods and Problems”. Employee Relations. 21(3), 236-250.
Child, J. (1972). “Organization, structure and strategies of control: A replication of the Aston
study”, Administrative Science Quarterly, 17 (3), 163-177.
Collins, R., and Y. McLaughlin (1998). Effective Management, CCH Australia Ltd.
Deshpande, S. P., and D.Y Golhar (1994). “HRM practices in large and small firms: A
comparative study”, Journal of Small Business Management. 32(2), 49-56.
Golhar, D. Y., and S.P. Deshpande (1997). “HRM practices of large and small Canadian
manufacturing firms”, Journal of Small Business Management, 35(3), 30-38.
English, J. (2001). How to Organise and Operate a Small Business. Sydney: Allen and Unwin.
Hanks, S.H., C.J. Watson, E. Jansen, and G.H. Chandler (1993). “Tightening the life-cycle
construct: A taxonomic study of growth stage configurations in high-technology
organizations”, Entrepreneurship Theory and Practice. 18(2), 5-31
Heneman, R.L., J.W. Tansky, and S. M. Camp (2000). “Human resource management practices
in small and medium-sized enterprises: Unanswered questions and future research
perspectives”, Entrepreneurship Theory and Practice. 25(1), 11-26.
Heneman H.G. III and R.A Berkley (1999). “Applicant attraction practices and outcomes
among small businesses”, Journal of Small Business Management. 37(1), 53-74.
Hinings, C.R. and G.L. Lee (1971). “Dimensions of organizational structure: A replication”,
Sociology. 5, 83-93.
Holliday R. (1995). Investigating small firms: nice work? London: Routledge.
Homans, G.C. (1950). The Human Group. New York: Harcourt Brace Jovanovich
Hornsby, J.S., and D.K Kuratko (1990) “Human resource management in small firms: Critical
issues for the 1990”, Journal of Small Business Management. 28(July), 9-18.
29
Huselid, M.A. (1995). “The impact of human resource management practices on turnover,
productivity and corporate financial performance”, Academy of Management Journal.
38(3), 635-672.
Inkson, J.H.K, D.S. Pugh, and D.L. Hickson (1970). “Organization context and structure: An
abbreviated replication”, Administrative Science Quarterly. 15(4), 318-329
Jennings, P., and G. Beaver (1997). “The performance and competitive advantage of small
firms: A management perspective”, International Small Business Journal. 15(2), 63-
75.
Kaman V., A.M. McCarthy, R.D. Gulbro, and L.T. Tucker (2001). “Bureaucratic and high
commitment human resource practices in small service firms”, HR. Human Resource
Planning 24(1) 33-44
Katzell, R.A. (1962). “Contrasting systems of work organizations.” American Psychologist. 17,
102-108.
Kotey, B., and G.G. Meredith (1997). “Relationships among owner/manager personal values,
business strategies and enterprise performance”, Journal of Small Business Management.
35(2), 37-64.
Kotey, B. (1999). “Human resource management practices of Sunshine Coast small firms with
reference to the prescribed models”, International Journal of Employment Studies. 7(1),
79-104.
Lavarack, D. (1995). “Unlocking the small business”, Training Tomorrow. 9(February), 27-28.
Loan-Clarke, J., G. Boocock, A. Smith, and J. Whittaker (1999). “Investment in management
training and development by small business”, Employee Relations. 21(3), 296-310.
MacMahon J., and E. Murphy (1999). “Managerial effectiveness in small enterprises:
Implications for HRD”, Journal of European Industrial Training. 23(1), 25–35.

30
Marlow, S., and D. Patton (1993). “Managing the employment relationship in the smaller firm:
Possibilities for human resource management”, International Small Business Journal.
11(4), 57-64.
Meredith, G. G., and P. Barrett (1994). Women self-employed entrepreneurs in Queensland:
Significance and policy issues: First Report. Queensland Small Business Corporation.
Lismore, Australia.
Mintzberg H. (1979). The Structuring of Organisations. Englewood Cliffs, New Jersey: Prentice-Hall.
Mintzberg, H., J. Quinn, and J. Voyer (1995). The Strategy Process. Englewood-Cliffs, New
Jersey: Prentice Hall.
Office of Small Business (1999). Annual review of small business 1999. Canberra: Paragon
Printing.
Pugh, D. S., D.J. Hickson, C.R. Hinings, and C. Turner (1968). “Dimensions of organizational
structure”, Administrative Science Quarterly. 13(1), 65-91.
Reid, R. S., and J. S. Adams (2001). “Human resource management – a survey of practices
within family and non-family firms”, Journal of European Industrial Training. 25(6),
310-320.
Ritchie, J. (1993). “Strategies for human resource management: Challenges in smaller and
entrepreneurial organizations”, in Human Resource Management. Ed. R. Harrison.
Wokingham: Addison-Wesley, 111-135.
Roberts, I., D. Sawbridge, and G. Bamber (1992). “Employee relations in small firms”, in
Handbook of Industrial Relations Practice. Ed. B.A. Towers, , London: Kogan Page.
Rowden, R.W. (2002). “High performance and human resource characteristics of successful
small manufacturing and processing companies”, Leadership and Organisational
Development Journal, 23(2) 79-83.

31
Stanworth, J., and J. Curran (1989). “Employment relations in small firms”, in Small Business
and Entrepreneurship. Ed. P. Burns and J. Dewhurst, Basingstoke: Macmillan
Education.
Storey D. (1994). Understanding the small business sector, London: International Thomson
Business press.
Sunshine Coast Economic Development Board (1996). Sunshine Coast Business Outlook,
March-May. Mooloolaba, Australia: SCEDB.
Timmons, J. A. (1999). New Venture Creation: Entrepreneurship For the 21st Century. New
York: Irwin McGraw-Hill.
Wagar, T. (1998). “Determinants of human resource management practices in small firms: Some
evidence from Atlantic Canada”, Journal of Small Business Management. 36(2), 13-
23.
Weber, M. (1947). The Theory of Social and Economic Organisation. New York: Free Press.
Welbourne T.M., and L.A. Cyr (1999). “ The human resource executive effect in initial public
offerings”, Academy of Management Journal. 42(6), 616-629.
Wilkinson, A. (1999). “Employment Relations in SMEs”, Employee Relations. 21(3) 206-217.

32
Table 1: Firm Characteristics - Employees and Number of Locations: Results of ANOVA and Multiple Comparisons
Comparison of Means Variables Business
Group Means F-value Sig 1 - 2
(sig) 1 - 3 (sig)
2 - 3 (sig)
Full-time employees a
Micro (1) Small (2)
Medium (3)
1.9 6.8
23.6
150.69
0.000
-4.88 (0.000)
-21.69 (0.000)
-16.81(0.000)
Part-time employees a
Micro (1) Small (2)
Medium (3)
0.58 1.05 4.00
11.99
0.000
-0.46 (0.748)
-3.42 (0.000)
-2.95(0.000)
Casuals a Micro (1) Small (2)
Medium (3)
0.79 1.90
10.43
43.16
0.000
-1.11 (0.479)
-9.65 (0.000)
-8.53(0.000)
Percentage of Full-time employees to all employees a
Micro (1) Small (2)
Medium (3) Total
0.61 0.69 0.64 0.66
2.18
0.114
-0.08 (0.11)
-0.03 (0.74)
0.05(0.54)
Percentage of Part-time employees to all employees a
Micro (1) Small (2)
Medium (3) Total
0.17 0.11 0.09 0.12
2.98
0.05
0.06 (0.13)
0.08 (0.05)
0.02(0.65)
Percentage of Casuals to all employees a
Micro (1) Small (2)
Medium (3) Total
0.23 0.20 0.27 0.22
1.53
0.22
0.03 (0.73)
-0.04 (0.68)
--0.07(0.20)
Operational Staff a Micro (1) Small (2)
Medium (3)
2.26 7.06
28.84
188.79
0.000
-4.80 (0.000)
-26.58 (0.000)
-21.79(0.000)
Managerial Staff a Micro (1) Small (2)
Medium (3)
0.60 1.86 4.70
82.01
0.000
-1.26 (0.000)
-4.12 (0.000)
-2.85(0.000)
Percentage of Operational Staff to all employees a
Micro (1) Small (2)
Medium (3) Total
0.81 0.79 0.81 0.80
0.366
0.69
0.02 (0.78)
0.00 (1.00)
-0.02(0.77)
Percentage of Managerial Staff to all employees a
Micro (1) Small (2)
Medium (3) Total
0.19 0.21 0.19 0.20
0.366
0.69
-0.02 (0.78)
0.00 (1.00)
0.02(0.77)
No. of businesses in other locations a
Micro (1) Small (2)
Medium (3)
1.16 1.41 2.15
11.74
0.000
-0.24 (0.349)
-0.98 (0.000)
-0.74(0.000)
a variables measured at ratio level

33
Table 2: Differences in Firm and Owner-manager Details: Chi-Square Statistics
Percentage of Respondents Variables Micro
Firms (%)
Small Firms
(%)
Medium firms (%)
To-tal
(%)
Chi sq. for 3 groups
Chi sq. micro & small
Chi sq. small & medium
Firm & Personal details
Age – 10 yrs or older 36 49 58 48 8.09** 1.16** 1.84
Inherited businesses 1.2 2.9 11.8 4.3 13.39*** 0.70 9.06***
Females 31.3 19.4 15.8 21.4 6.78** 4.79** 0.49
Private sector experience 59 55 40.8 53 6.09** 0.40 4.50**
*** = p < 0.01; ** = p < 0.05; * = p < 0.10
34
Table 3: Chi-Square Statistics and Wilcoxon Signed Ranked Tests for Recruitment Variables Measured at Nominal Level.
Percentage of Respondents Variables Micro
Firms (%)
Small Firms
(%)
Medium firms (%)
To-tal
(%)
Chi sq. for 3 groups
Chi sq. micro & small
Chi sq. small & medium
Word of mouth (O)
Word of mouth (M)
Wilcoxon Z
58.3
9.5
-6.25***
57.3
25.6
-7.27***
48.7
23.7
-3.8***
55.8
21.6
1.98
9.43***
0.024
9.345***
1.694
0.108
Newspapers (O)
Newspapers (M)
Wilcoxon Z
27.4
7.1
-3.9***
50.7
27.5
-5.82***
55.3
50
-0.76
46.4
27.5
16.2***
36.76***
13.27***
14.64***
0.464
12.72***
Govt. agencies (O)
Govt. agencies (M)
Wilcoxon Z
25
0
-4.58***
40
4.3
-8.55***
50
9.2
-5.39***
38.5
4.3
10.86***
8.2**
5.749**
3.696**
2.374
2.596*
Private Agencies (O)
Private Agencies (M)
Wilcoxon Z
3.6
1.2
1
8.1
8.1
0
13.2
15.8
0.54
8.1
8.1
4.934*
11.44**
1.913
4.944**
1.706
3.678**
Professional Firms (O)
Professional Firms (M)
Wilcoxon Z
1.2
0
1
2.8
7.1
3***
1.5
9.2
2.12**
2.2
5.9
1.098
7.29**
0.709
6.291**
0.548
0.349
Schools (O)
Schools (M)
Wilcoxon Z
1.2
0
1
6.2
2.4
-2.14**
10.5
5.3
-1.63*
5.9
2.4
6.28**
4.676*
3.284*
2.025
1.570
1.540
Internal transfers (O)
Internal transfers (M)
Wilcoxon Z
1.2
1.2
0
6.2
8.1
0.894
9.2
6.6
-0.71
5.7
6.2
5.036*
4.895*
5.284*
4.944**
0.801
0.172
O- operational level, M- managerial level. Wilcoxon Z – shows the differences between operational and managerial levels in application of the various practices. *** = p < 0.01; ** = p < 0.05; * = p < 0.10

35
Table 4: Chi-Square Statistics and Wilcoxon Signed Ranked Tests for Selection Variables Measured at Nominal Level.
Percentage of Respondents Variables Micro
Firms (%)
Small Firms
(%)
Medium firms (%)
To-tal
(%)
Chi sq. for 3 groups
Chi sq. micro & small
Chi sq. small & medium
Interviews (O)
Interviews (M)
Wilcoxon Z
76.5
22
-6.49***
85.3
49.3
-8.61***
82.9
65.8
-3.15***
82.9
46.6
3.17
31.88***
3.168*
18.161***
0.251
6.118**
Qualifications (O)
Qualifications (M)
Wilcoxon Z
58.5
14.6
-6***
71.6
45.5
-6.13***
64.5
61.8
-0.47
67.2
42.0
4.872*
38.55***
4.599**
24.169***
1.330
5.917**
Review application (O)
Review application (M)
Wilcoxon Z
20.7
9.8
-2.7***
42.2
28.9
-4.13***
48.7
52.6
-0.78
38.8
29.5
15.42***
34.93***
11.765***
12.033***
0.960
13.786***
Prev. Employment (O)
Prev. Employment (M)
Wilcoxon Z
34.1
12.2
-3.84***
49.8
30.8
-5.66***
42.1
36.8
-1.41
44.7
27.9
6.08**
13.96***
5.810**
10.739***
1.313
0.930
References (O)
References (M)
Wilcoxon Z
15.9
6.1
-2.83***
26.1
16.6
-3.54***
27.6
27.6
0
24.1
16.5
4.010
13.26***
3.456*
5.512**
0.070
4.339**
Practical test (O)
Practical test (M)
Wilcoxon Z
24.4
1.2
-4.36***
22.7
4.7
-5.86***
15.8
5.3
-2.53***
21.7
4.1
2.050
2.228
0.089
2.025
1.637
0.033
Written test (O)
Written test (M)
Wilcoxon Z
2.4
2.4
0
5.2
3.3
-1.07
3.9
5.3
0.38
4.3
3.5
1.131
0.987
1.072
0.153
0.193
0.574
Medical Exam (O)
Medical Exam (M)
Wilcoxon Z
1.2
0
-1
2.4
1.4
-1
6.6
6.6
0
3.0
2.2
4.554*
9.34***
0.389
1.728
2.944*
5.484**
O- operational level, M- managerial level. Wilcoxon Z – shows the differences between operational and managerial levels in application of the various practices. *** = p < 0.01; ** = p < 0.05; * = p < 0.10

36
Table 5: Chi-Square Statistics and Wilcoxon Signed Ranked Tests for Training Variables Measured at Nominal Level
Percentage of Respondents Variables Micro
Firms (%)
Small Firms
(%)
Medium firms (%)
To-tal
(%)
Chi sq. for 3 groups
Chi sq. micro & small
Chi sq. small & medium
Training methods On the job-owners –O
On the job-owners– M
Wilcoxon Z
90.2
14.6
-7.87***
80.5
29
-9.94***
69.7
46.1
-3.40***
80.4
29.3
10.54***
18.8***
4.03**
6.53***
3.71**
7.24***
By supervisors –O
By Supervisors – M
Wilcoxon Z
8.5
1.2
-2.45***
27.1
5.7
-6.3***
52.6
10.5
-5.66***
28.3
5.7
38.13***
6.35**
11.93***
2.8*
16.18***
1.99
Job Rotation -O
Job Rotation-M
Wilcoxon Z
35.4
3.7
-5.1***
44.3
10.5
-7.99***
47.4
15.8
-4.54***
42.9
10.1
2.68
6.52**
1.93
3.5*
0.214
1.5
External courses –O
External courses –M
Wilcoxon Z
26.8
7.3
-4.0***
45.2
24.3
-5.59***
31.6
40.0
1.50
38.3
23.7
10.30***
23.23***
8.32***
10.81***
4.29**
6.71***
Encourage ext sem –O
Encourage ext sem –M
Wilcoxon Z
18.3
9.8
-2.11**
29.0
33.3
1.17
14.7
35.5
3.27***
23.7
28.5
8.03**
18.37***
3.54*
16.75***
6.05**
0.12
Oblige ext. sem -O
Oblige ext. sem –M
Wilcoxon Z
6.1
2.4
-1.34
15.7
9
-2.65***
7.9
14.5
1.39
12
8.7
6.68**
7.27**
4.82**
3.86**
2.90*
0.19
Orientation - Contents
Employment Conditions 63 78.2 82.9 75.8 10.03*** 7.06*** 0.75
Duties 69.1 89.1 88.2 84.5 18.79*** 17.0*** 0.05
Intro. to workplace 58 86.7 88.2 80.7 34.39*** 28.84*** 0.10
OHS 45.7 53.1 67.1 54.3 7.57** 1.28 4.48**
Management policies 29.6 56.9 52.6 50 17.64*** 17.38*** 0.40
Business Objectives 39.5 48.8 39.5 44.8 3.26 2.04 1.96
Checklist 25.8 34.8 51.4 36.7 10.53*** 1.86 6.15**
Multi-skilled-Some 55.6 62.9 79.7 64.7 10.59*** 1.31 7.07***
All Multi-skilled 39.5 34.8 20.3 32.9 7.28** 0.57 5.37**
Ability to run the firm 81.5 84.4 80.6 83 0.713 0.35 0.56
O- operational level, M- managerial level. Wilcoxon Z – shows the differences between operational and managerial levels in application of the various practices. *** = p < 0.01; ** = p < 0.05; * = p < 0.10

37
Table 6: Results of ANOVA and Multiple Comparisons for Variables Measured at Interval Level
Comparison of Means Variables Business Group Means F-value Sig 1 – 2
(sig) 1 - 3 (sig)
2 - 3 (sig)
Orientation c Micro (1)
Small (2)
Medium (3)
3.52
4.07
4.25
7.15 0.001
-0.55
0.004
-0.73
0.001
-0.18
0.564
Job
Description b
Micro (1)
Small (2)
Medium (3)
1.11
1.87
2.07
14.48 0.000
-0.43
0.000
-0.64
0.000
-0.21
0.119
Application
Letters c
Micro (1)
Small (2)
Medium (3)
2.13
3.11
3.39
17.40 0.000
-0.98
0.000
-1.25
0.000
-0.27
0.362
Application
Forms c
Micro (1)
Small (2)
Medium (3)
1.89
2.76
3.99
33.39 0.000
-0.87
0.000
-2.10
0.000
-1.22
0.000
Appointment
Letters c
Micro (1)
Small (2)
Medium (3)
1.57
2.46
2.84
14.35 0.000
-0.89
0.000
-1.27
0.000
-0.38
0.162
Records on
employees b
Micro (1)
Small (2)
Medium (3)
2.04
2.55
2.70
17.0 0.000
-0.52
0.000
-0.66
0.000
-0.15
0.348
b variables measured on a three point Likert scale c variables measured on a five point Likert scale

38
Table 7: Chi-Square Statistics and Wilcoxon Signed Ranked Tests for Performance Appraisal Variables Measured at Nominal Level
Percentage of Respondents Variables Micro
Firms (%)
Small Firms
(%)
Medium firms (%)
To-tal
(%)
Chi sq. for 3 groups
Chi sq. micro & small
Chi sq. small & medium
Performance Appraisal 70 82.4 80 79 5.95** 5.84** 0.21
Daily 29.3 19.5 13.2 20.4 6.53** 3.24* 1.54
Monthly 11 24.8 32.9 23.4 11.11*** 6.78*** 1.88
Ratings on duties- O
Ratings on duties –M
Mgers vrs operatives
48.8
8.5
-5.58***
53.3
32.9
-6.0***
56.6
50
-1.29
53.3
31
1.02
32.52***
0.6
18.12***
0.17
7.0***
Ratings on quality -O
Ratings on quality –M
Mgers vrs operatives
48.8
8.5
-5.58***
53.3
24.8
-7.17***
44.7
30.3
-3.05***
50.5
22.3
1.78
12.49***
0.49
9.63***
1.65
0.87
Comparisons –O
Comparisons –M
Mgers vrs operatives
22
3.7
-3.87***
32.4
11.4
-6.63***
35.3
13.2
-3.9***
30.7
10.1
4.06
4.96*
3.09*
4.24**
0.25
0.16
Meeting target – O
Meeting target – M
Mgers vrs operatives
20.7
7.3
-2.67***
25.7
18.1
-2.74***
17.1
21.1
1
22.8
16.3
2.61
6.60**
0.80
5.35**
2.31
0.32
Observe behaviour -O
Observe behaviour –M
Mgers vrs operatives
13.4
3.7
-2.83***
21.4
7.6
-5.05***
17.1
17.2
0
18.8
8.7
2.66
9.7***
2.44
1.52
0.65
5.51**
Self assessment – O
Self assessment – M
Mgers vrs operatives
4.9
2.4
1
17.1
11.0
-2.84***
9.2
11.8
1
12.8
9.2
9.05***
5.87**
7.5***
5.46**
2.75* 0.04
Peer assessment – O
Peer assessment – M
Mgers vrs operatives
8.5
1.2
-2.45**
19.0
8.1
-4.43***
21.1
14.5
-1.67*
17.1
7.9
5.64*
9.58***
4.82**
4.82**
0.14
2.57
Supervisors-O
Supervisors-M
Mgers vrs operatives
19.5
6.1
-3.32***
46.7
20.5
-6.93***
47.4
25.0
-3.71***
40.8
18.2
19.74***
11.16**
18.27***
8.88***
0.01 0.67
Use of Appraisal Train needs assessmnt 22.2 41.0 44.7 37.6 10.82*** 8.93*** 0.33
Promotion 7.4 22.4 35.5 21.8 18.28*** 8.8*** 5.03**
Train poor performers 65.4 80.0 69.7 74.7 7.79** 6.79*** 3.35*
O- operational level, M- managerial level. Wilcoxon Z – shows the differences between operational and managerial levels in application of the various practices. *** = p < 0.01; ** = p < 0.05; * = p < 0.10

39
Table 8: Chi-Square Statistics for Variables Representing HR Policy and Records Measured at Nominal Level
Percentage of Respondents Variables Micro
Firms (%)
Small Firms
(%)
Medium firms (%)
To-tal
(%)
Chi sq. for 3 groups
Chi sq. micro & small
Chi sq. small & medium
HRM policies Working hours 22.1 48.0 60.0 44.2 22.93*** 15.1*** 2.73*
Annual leave 16.2 42.3 60.6 40.1 29.51*** 15.79*** 6.51***
Sick leave 14.9 33.1 53.8 33.1 23.74*** 8.74*** 8.64***
Overtime 11.1 30.9 50.0 30.2 24.37*** 10.58*** 7.46***
Employment termination 12.3 31.1 47.8 30.3 20.89*** 9.6*** 5.9**
Long service leave 9.6 22.7 47.5 24.5 26.58*** 5.75** 13.47***
Disciplinary procedures 8.3 22.2 45.5 23.9 26.68*** 6.59*** 12.56***
Grievance handling 6.8 20.1 30.8 19.2 12.86*** 6.7*** 3.06*
Promotion 9.7 8.9 16.7 10.7 2.87 0.04 2.71*
Written OHS Policies 60 71.3 89.3 72.5 17.09*** 3.4* 7.0***
Communicating OHS 88.5 97.5 95.5 95.3 7.08** 9.87*** 0.624
Personnel records Sick & annual leave 42.7 68.6 77.6 64.7 24.34*** 16.66*** 2.22
Workers compensation 31.7 54.3 69.7 52.4 23.54*** 12.05*** 5.48**
Job description 22 48.6 53.9 43.8 21.03*** 17.26*** 0.65
Appointment letter 14.6 40.5 52.6 37.2 26.58*** 17.75*** 3.35*
Training records 17.1 35.2 47.4 33.7 16.72*** 9.24*** 3.47*
Performance records 17.1 29.5 44.7 29.9 14.44*** 4.75** 5.79**
Probation 6.1 13.3 26.3 14.4 13.53*** 3.08* 6.73***
Termination 63 78.5 89.2 77.2 15.59*** 7.34*** 4.07*
Poor Performance 91.8 85.6 85.3 86.9 1.95 1.80 0.004
Absenteeism 72 64 66.7 66.4 1.62 1.62 1.6
Disobedience 47.6 59.3 77.3 60.4 14.74*** 3.3* 7.77***
OHS non-compliance 34.1 35.9 48 38 4.1 0.08 3.4*
Appointment letters -Contents Job title 18.5 41.7 56.6 39.7 24.59*** 13.78*** 4.98**
Duties 18.5 40.3 59.2 39.4 27.35*** 12.31*** 8.08***
Remuneration 18.5 40.8 53.9 38.6 21.75*** 12.8*** 3.94**
Superannuation 13.6 26.1 38.2 25.8 12.38*** 5.22** 3.95**
Leave entitlements 13.6 24.2 36.8 24.5 11.51*** 3.93** 4.5**
Probation 9.9 34.6 44.7 31.3 24.76*** 17.84*** 2.46

40
*** = p < 0.01; ** = p < 0.05; * = p < 0.10
Top Related