


Languages
Pages
Legal

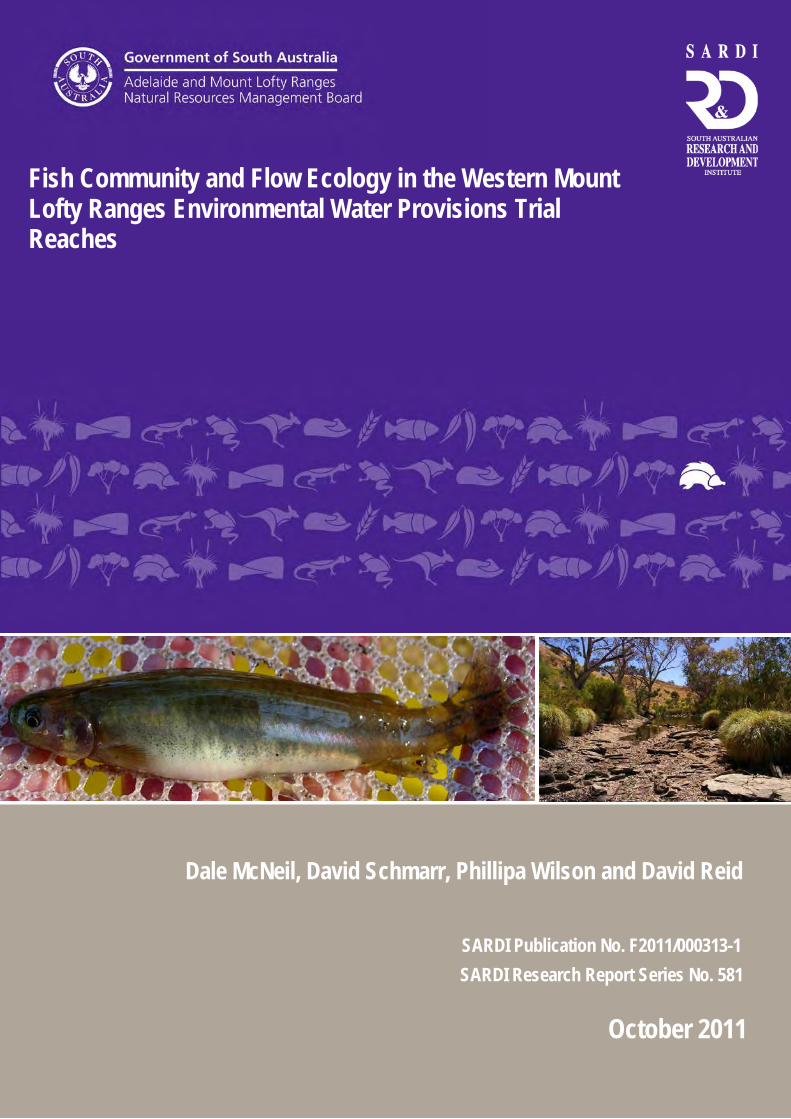
Fish Community and Flow Ecology in the Western Mount Lofty Ranges Environmental Water Provisions Trial Reaches
October 2011
Dale McNeil, David Schmarr, Phillipa Wilson and David Reid
SARDI Publication No. F2011/000313-1 SARDI Research Report Series No. 581

Fish Community and Flow Ecology in the Western Mount Lofty Ranges Environmental
Water Provisions Trial Reaches
Final Report to the Adelaide and Mount Lofty Ranges Natural Resources Management Board and the SA Department for Water.
Dale McNeil, David Schmarr, Phillipa Wilson and David Reid
SARDI Publication No. F2011/000313-1 SARDI Research Report Series No. 581
October 2011
FRONTISPIECE: Surveying Site Access above the South Para River Gorge.

This Publication may be cited as: McNeil, D.G., Schmarr, D.W., Wilson, P.J. and Reid D. J (2011). Fish Community and Flow Ecology in the Western Mount Lofty Ranges Environmental Water Provisions Trial Reaches. Final Report to the Adelaide and Mount Lofty Ranges Natural Resources Management Board and the SA Department for Water. South Australian Research and Development Institute (Aquatic Sciences), Adelaide. SARDI Research Report Series No. 581. 238pp.
South Australian Research and Development Institute SARDI Aquatic Sciences 2 Hamra Avenue West Beach SA 5024 Telephone: (08) 8207 5400 Facsimile: (08) 8207 5406 http://www.sardi.sa.gov.au DISCLAIMER The authors warrant that they have taken all reasonable care in producing this report. The report has been through the SARDI Aquatic Sciences internal review process, and has been formally approved for release by the Chief, Aquatic Sciences. Although all reasonable efforts have been made to ensure quality, SARDI Aquatic Sciences does not warrant that the information in this report is free from errors or omissions. SARDI Aquatic Sciences does not accept any liability for the contents of this report or for any consequences arising from its use or any reliance placed upon it.
© 2012 SARDI This work is copyright. Apart from any use as permitted under the Copyright Act 1968 (Cth), no part may be reproduced by any process, electronic or otherwise, without the specific written permission of the copyright owner. Neither may information be stored electronically in any form whatsoever without such permission. Printed in Adelaide: October 2011 SARDI Publication No. F2011/000313-1 SARDI Research Report Series No. 581
Author(s): Dale McNeil, David Schmarr, Phillipa Wilson and David Reid Reviewer(s): Michael Hammer, Rod Ward, Kathleen Beyer, Katherine Cheshire, Rehanna
Halfyard, Steve Gatti and Dean Hartwell Approved by: Dr. Jason Nicol A/Principal Scientist – Inland Waters & Catchment Ecology Signed: Date: 4 October 2011 Distribution: Adelaide and Mount Lofty Ranges NRM Board, Department for Water,
SAASC Library, University of Adelaide Library, Parliamentary Library, State Library and National Library
Circulation: Public Domain

McNeil et al. 2011 Fish and EWPs in the WMLR
i
TABLE OF CONTENTS
TABLE OF CONTENTS .................................................................................................................................................. I
ACKNOWLEDGEMENTS ........................................................................................................................................... VI
EXECUTIVE SUMMARY ........................................................................................................................................... VII
1. INTRODUCTION .................................................................................................................................................... 1
1.1. CATCHMENTS OF THE MOUNT LOFTY RANGES .................................................................................................. 1 1.2. FLOW MANAGEMENT AND REGIME .................................................................................................................... 1
1.3. FLOW ECOLOGY AND FISH IN THE WMLR ......................................................................................................... 2
1.4. ENVIRONMENTAL WATER PROVISIONS IN THE WMLR ...................................................................................... 4
1.5 AIMS .......................................................................................................................................................................... 8
2. METHODS ............................................................................................................................................................... 9
2.1. SITE DESCRIPTIONS ............................................................................................................................................. 9
2.1.1. South Para River ....................................................................................................................................... 9
2.1.2. River Torrens .......................................................................................................................................... 14
2.1.3. Onkaparinga River ................................................................................................................................. 22
2.2. FIELD SAMPLING DESIGN .................................................................................................................................. 24
2.3. PHYSICAL AND CHEMICAL SITE CHARACTERISTICS ........................................................................................... 27
2.4. DATA ANALYSIS ............................................................................................................................................... 28
3. RESULTS ................................................................................................................................................................ 29
3.1. SOUTH PARA RIVER ......................................................................................................................................... 29
3.1.1. South Para Weir...................................................................................................................................... 31
3.1.1.1. Site assessment .................................................................................................................................................... 31
3.1.1.2. Water Quality ...................................................................................................................................................... 33
3.1.1.3. Hydrology............................................................................................................................................................ 33
3.1.1.4. Fish community ................................................................................................................................................... 33
3.1.2. Para Wirra .............................................................................................................................................. 34
3.1.2.1. Site assessment .................................................................................................................................................... 34
3.1.2.2. Water Quality ...................................................................................................................................................... 38
3.1.2.3. Hydrology............................................................................................................................................................ 38
3.1.2.4. Fish community ................................................................................................................................................... 38
3.1.2.5. Fish population structure ..................................................................................................................................... 40
3.1.3. Nolan’s .................................................................................................................................................... 42
3.1.3.1. Site assessment .................................................................................................................................................... 42

McNeil et al. 2011 Fish and EWPs in the WMLR
ii
3.1.3.2. Water Quality ...................................................................................................................................................... 44
3.1.3.3. Hydrology............................................................................................................................................................ 45
3.1.3.4. Fish community ................................................................................................................................................... 46
3.1.3.5. Fish population structure ..................................................................................................................................... 47
3.1.4. Woodlands Weir ...................................................................................................................................... 51
3.1.4.1. Site assessment .................................................................................................................................................... 51
3.1.4.2. Water Quality ...................................................................................................................................................... 53
3.1.4.3. Hydrology............................................................................................................................................................ 54
3.1.4.4. Fish community ................................................................................................................................................... 54
3.1.4.5. Fish population structure ..................................................................................................................................... 55
3.2. TORRENS RIVER ............................................................................................................................................... 60
3.2.1. Gumeracha Weir ..................................................................................................................................... 63
3.2.1.1. Site assessment .................................................................................................................................................... 63
3.2.1.2. Water Quality ...................................................................................................................................................... 67
3.2.1.3. Hydrology............................................................................................................................................................ 67
3.2.1.4. Fish community ................................................................................................................................................... 67
3.2.1.5. Fish population structure ..................................................................................................................................... 69
3.2.2. Cudlee Creek .......................................................................................................................................... 77
3.2.2.1. Site assessment .................................................................................................................................................... 77
3.2.2.2. Water Quality ...................................................................................................................................................... 80
3.2.2.3. Hydrology............................................................................................................................................................ 80
3.2.2.4. Fish community ................................................................................................................................................... 82
3.2.2.5. Fish Population Structure .................................................................................................................................... 83
3.2.3. Gorge Weir ............................................................................................................................................. 90
3.2.3.1. Site assessment .................................................................................................................................................... 90
3.2.3.2. Water Quality ...................................................................................................................................................... 93
3.2.3.3. Hydrology............................................................................................................................................................ 93
3.2.3.4. Fish community ................................................................................................................................................... 94
3.2.3.5. Fish population structure ..................................................................................................................................... 95
3.2.4. Silke’s Road .......................................................................................................................................... 101
3.2.4.1. Site assessment .................................................................................................................................................. 101
3.2.4.2. Water Quality .................................................................................................................................................... 103
3.2.4.3. Hydrology.......................................................................................................................................................... 104

McNeil et al. 2011 Fish and EWPs in the WMLR
iii
3.2.4.4. Fish community ................................................................................................................................................. 104
3.2.4.5. Fish population structure ................................................................................................................................... 105
3.2.5. Breakout Creek ..................................................................................................................................... 111
3.2.5.1. Site assessment .................................................................................................................................................. 111
3.2.5.2. Water Quality .................................................................................................................................................... 114
3.2.5.3. Hydrology.......................................................................................................................................................... 114
3.2.5.4. Fish community ................................................................................................................................................. 116
3.2.5.5. Fish population .................................................................................................................................................. 118
3.3. ONKAPARINGA RIVER .................................................................................................................................... 129
3.3.1. Clarendon Oval..................................................................................................................................... 132
3.3.1.1. Site assessment .................................................................................................................................................. 132
3.3.1.2. Water Quality .................................................................................................................................................... 135
3.3.1.3. Hydrology.......................................................................................................................................................... 135
3.3.1.4. Fish community ................................................................................................................................................. 136
3.3.1.5. Fish population .................................................................................................................................................. 137
3.3.2. Brooks Road .......................................................................................................................................... 145
3.3.2.1. Site assessment .................................................................................................................................................. 145
3.3.2.2. Water Quality .................................................................................................................................................... 148
3.3.2.3. Hydrology.......................................................................................................................................................... 148
3.3.2.4. Fish community ................................................................................................................................................. 149
3.3.2.5. Fish population .................................................................................................................................................. 149
3.3.3. Old Noarlunga ...................................................................................................................................... 157
3.3.3.1. Site assessment .................................................................................................................................................. 157
3.3.3.2. Water Quality .................................................................................................................................................... 160
3.3.3.3. Hydrology.......................................................................................................................................................... 161
3.3.3.4. Fish community ................................................................................................................................................. 162
3.3.3.5. Fish population .................................................................................................................................................. 163
4. DISCUSSION ....................................................................................................................................................... 174
4.1. BASELINE ASSESSMENT OF FISH POPULATIONS IN THE WMLR ..................................................................... 174
4.1.1. Idealised pre-European fish communities ............................................................................................. 175
4.2. PHYSICAL HABITAT AT EWP SITES ................................................................................................................ 178
4.3. FLOW REGIME AT EWP SITES ........................................................................................................................ 179
4.4. FISH ECOLOGY OF EWP REACHES – SOUTH PARA ......................................................................................... 181

McNeil et al. 2011 Fish and EWPs in the WMLR
iv
4.4.1. Sustainability of Native Fish in the South Para River .......................................................................... 181
4.4.2. Flow Regime and Ecology of Fish in the South Para River .................................................................. 182
4.4.3. Flow Management for Native Fish in the South Para River ................................................................. 184
4.5. FISH ECOLOGY OF EWP REACHES –TORRENS RIVER ..................................................................................... 185 4.5.1. Sustainability of Native Fish in the Torrens River ................................................................................ 185
4.5.2. Flow Regime and Ecology of Fish in the Torrens River ....................................................................... 187
4.5.2.1. Upper Torrens.................................................................................................................................................... 187
4.5.2.2. Lower Torrens ................................................................................................................................................... 189
4.5.3. Flow Management for Native Fish in the Torrens River ...................................................................... 191
4.6. FISH ECOLOGY OF EWP REACHES – LOWER ONKAPARINGA RIVER............................................................... 193
4.6.1. Sustainability of Native Fish in the Onkaparinga River ....................................................................... 193
4.6.2. Flow Regime and Ecology of Fish in the Onkaparinga River .............................................................. 195
4.6.3. Flow Management for Native Fish in the Onkaparinga River .............................................................. 198
4.7. SUMMARIES .................................................................................................................................................... 200
4.7.1. Native Fish Management and EWPs in the WMLR .............................................................................. 200
4.7.2. Designing EWPs for native fish ............................................................................................................ 201
4.7.3. Critical flow gaps for fish in EWP reaches ........................................................................................... 204
4.8. UTILITY OF MULTIVARIATE DATA ANALYSIS ................................................................................................ 204
4.8.1. Further research ................................................................................................................................... 205
4.9. SUMMARY OF KEY RECOMMENDATIONS ........................................................................................................ 205
4.9.1. South Para River ................................................................................................................................... 205
4.9.2. Torrens River ........................................................................................................................................ 205
4.9.3. Onkaparinga River ............................................................................................................................... 206
4.9.4. General ................................................................................................................................................. 206
4.9.5. Flow is a major determinant of physical habitat and therefore biotic composition ............................. 207
5. SPECIES SPECIFIC BIOLOGICAL INFORMATION AND MATRICES .................................................. 208
5.1. NATIVE FISHES OF THE WMLR ...................................................................................................................... 208
5.1.1. Shorthead lamprey ................................................................................................................................ 208
5.1.2. Shortfinned eel ...................................................................................................................................... 209
5.1.3. Freshwater catfish ................................................................................................................................ 209
5.1.4. Bony Herring ........................................................................................................................................ 209
5.1.5. Climbing galaxias ................................................................................................................................. 210

McNeil et al. 2011 Fish and EWPs in the WMLR
v
5.1.6. Common galaxias ................................................................................................................................. 210
5.1.7. Mountain galaxias ................................................................................................................................ 211
5.1.8. Murray rainbowfish .............................................................................................................................. 211
5.1.9. Small-mouthed hardyhead .................................................................................................................... 211
5.1.10. Congolli ................................................................................................................................................ 212
5.1.11. Carp gudgeon ....................................................................................................................................... 212
5.1.12. Flathead gudgeon ................................................................................................................................. 212
5.1.13. Dwarf flathead gudgeon ....................................................................................................................... 213
5.1.14. Western blue spot goby ......................................................................................................................... 213
5.2. EXOTIC FISHES ............................................................................................................................................... 214
5.2.1. Redfin perch .......................................................................................................................................... 214
5.2.2. Gambusia .............................................................................................................................................. 214
5.2.3. Carp ...................................................................................................................................................... 215
5.2.4. Goldfish................................................................................................................................................. 215
5.2.5. Tench .................................................................................................................................................... 216
5.2.6. Trout ..................................................................................................................................................... 216
5.2.7. Estuarine Fishes ................................................................................................................................... 216
5.3. SPECIES MATRIX UPDATES ............................................................................................................................ 217
6. REFERENCES ..................................................................................................................................................... 233
7. APPENDIX 1 – RAW ABUNDANCE CHART ................................................................................................. 238

McNeil et al. 2011 Fish and EWPs in the WMLR
vi
ACKNOWLEDGEMENTS
This work was funded by the Adelaide and Mount Lofty Ranges Natural Resources Management
Board and the South Australian Department for Water (formerly Water, Land and Biodiversity
Conservation). The authors would like to acknowledge the invaluable input of the Environmental
Water Provisions (EWP) project steering group including Pedro Schulz and Steven Gatti
(AMLRNRMB), Michele Bald, Ed Pikusa, Ben Fee and Jason VanLaarhoven (DfW) Paul McEvoy
(Australian Water Quality Centre), Glynn Ashman (SA Water) and Mardi van der Wielen
(SAMDBNRMB). In particular, Pedro Schulz provided project management and ongoing guidance
and support to the project team which enabled the monitoring program to succeed. Qifeng Ye
provided staff and program management for SARDI Aquatic Sciences (Inland Waters and
Catchment Ecology). Mike Hammer aided greatly in the early stages of project development and
his advice and assistance was invaluable in ensuring that local knowledge and experience was
integrated into the monitoring program. He also took several of the photos included within the
report and contributed greatly to the development of ideas around the development of
environmental flow requirements of fish communities.
Several SARDI Staff contributed a great deal to the collection of field data, David Short and Phillipa
Wilson in particular lead the field team at various stages and conducted the field sampling to an
excellent standard. They were ably assisted by Michael Hammer, Matthew Pellizzari, Joshua
Fredberg, Mike Guderian, Jo Margraf (University of Alaska – Fairbanks), Simon Westergaard, Rod
Ward, Michelle Braley and Neil Wellman. David Reid,
Phillipa Wilson and Katherine Cheshire all contributed to the
development of earlier drafts of the manuscripts and the final
version owes much to their contributions. Work conducted
within Park Management Areas was surveyed under permit
number Y25128-5 and all fish were collected under section
115 of the SA Fisheries Management Act 2007. Special
acknowledgement must be given to the landholders who generously
granted access to the field sites and in particular John Nolan (right),
who also provided historical, cultural and political input as well as
access and company, and Tom and Lavidia from Woodlands Weir.
Many thanks also to the rangers at Parra Wirra Recreational Park,
Steve Taylor, Eric and Troy and for help with access and site
selection.

McNeil et al. 2011 Fish and EWPs in the WMLR
vii
EXECUTIVE SUMMARY
The coastal reaches of many streams in the Western Mount Lofty Ranges (WMLR) are highly
regulated with almost no natural in-flows received from upper catchment areas outside of very
large flooding flows that coincide with high water storage volume (reservoirs). With the
acknowledgement that these coastal reaches possess ecosystems of high environmental value, a
program was initiated in 2005 to develop environmental watering provisions (EWPs) for reaches
downstream of major water storages in the Onkaparinga, Torrens and South Para Rivers located in
or near Adelaide, South Australia. As part of the EWP process, a project was developed to gain a
baseline of knowledge regarding the ecological values of these river reaches, and in particular to
assess the sustainability of native fish populations, which comprised key ecological assets and can
serve as an effective indicator of overall ecological health. In addition, fish are a primary biotic
group utilised in the development of ecological water targets that can inform and support the
optimisation of environmental flow planning and design.
The current study collected baseline ecological data over a three year period (sampling twice
annually in autumn and spring) from a total of 11 sites downstream of major water storages in the
South Para River (3 sites), the Upper Torrens (2 sites), Lower Torrens (3 sites) and Lower
Onkaparinga River (3 sites). Each site consisted of three separate pools located within a three
kilometre reach, with adjacent riffle and run areas also sampled during periods of hydrological
connectivity. Pools were sampled extensively using nets, with shallower areas also sampled using
backpack electrofishing. Sites were spread downstream of each designated release point (Weir)
so that one site was located within 3km of the release point, another 5-10km downstream of the
release point and where appropriate, a coastal or extreme downstream site was also sampled in
each of the three River catchments.
The surveys collected a wide range of baseline biological and ecological data that relates directly
to the nature of sustainability regarding native fish populations in EWP reaches as well as a range
of information regarding the interactions between native and introduced fish and between fish and
freshwater flows. As a result, a body of information and knowledge has been created that can
contribute to the estimation of native fish values, key threats, and importantly optimise the
development of Environmental Water Targets that can build the protection of native fishes and the
sustainability of coastal stream environments into future plans for the delivery of water resources.
The study collected data through a period of intensifying drought which added additional pressure
to EWP ecosystems, providing an exceptional insight into the historical impacts that flow
abstraction has had on these coastal freshwater systems during dry climatic periods. The data
revealed that without the provision of EWP flows, almost all native fish species suffered extreme
contractions during summer zero flow periods into isolated refuge pools, the majority of which dried
completely during hot summers leading to the loss of their resident fish populations. Only a small

McNeil et al. 2011 Fish and EWPs in the WMLR
viii
number of critical refuge pools were maintained without the addition of flows, in which native fish
species found protection. This pattern occurred in all EWP reaches demonstrating the importance
of flow provisions in maintaining aquatic habitats for aquatic biota.
Associated with this pattern was the gradual reduction in the abundance of key native fish species
across all sites and the contraction in range of some species from the entire reach, down to a
handful of refuge pools. In the case of the Onkaparinga River, common galaxias, initially
widespread through all areas up to Clarendon weir were gradually lost from upstream pools until
they were able to persist only in the most downstream pools where local catchment runoff and
possibly groundwater inputs were highest. Close linkages were observed between freshwater and
estuarine habitats and species in the Onkaparinga River and future studies must take into
consideration the broader impacts of water resource use across freshwater and marine habitats.
The importance of flow provisions for providing spawning and recruitment cues and providing
adequate passage for fish movements were highlighted, particularly under a natural flow regime
where late autumn and spring flows need to be re-instated to facilitate critical life history functions
of native species.
Baseline data revealed that ecosystems and native fish communities were already significantly
impacted to varying degrees by past management, with only a single native species remaining
within the South Para River EWP reach between Woodlands Weir and the Barossa Diversion Weir.
The high abundance of introduced predators and competitors in redfin perch and gambusia
maintain constant pressure on the remaining native fish in both the South Para and Torrens Rivers,
with trout adding to the pressure in the mid Torrens. The upper Torrens River also suffered from
highly erratic flow changes resulting from inter-basin transfer flows. This highly disturbed flow
regime was asynchronous with natural flow regimes and as a result native fish were patchy and in
low abundance compared to invasive species that are better adapted to stable and high flow
volumes.
Despite high degrees of hydrological stress and evidence of other major threats, several native
fishes including some threatened taxa persisted in the different EWP reaches, albeit often with
localised distributions and/or low abundance. Their presence suggests that restoration of habitat,
flow and fish passage linked with the control of introduced species could have a significant positive
impact in returning these native fishes to viable and sustainable levels in the future. The removal
of fish passage barriers was identified as a strong threat present in all EWP reaches that should be
pursued in order to maximise the effectiveness of EWP releases and to optimise the outcomes of
environmental water resource allocations. This data provides an excellent ‘before’ study that can
now be compared to similar data collected once EWP releases occur. The subsequent Before-
After-Impact (BAI) design provides a reasonably strong scientific basis for linking EWPs to
ecological responses in lieu of any realistic experimental control options.

McNeil et al. 2011 Fish and EWPs in the WMLR
ix
Key findings and Recommendations Include:
• The current structure of monitoring with autumn and spring surveys across a number of
sites within each EWP reach has provided an excellent level of information for informing the
baseline condition and flow requirements of native fish populations.
• Non water resource related threats such as barriers to fish movement, vegetation clearance
and encroachment, land use impacts, should be identified throughout EWP reaches to
optimise management of flow management outcomes
• Restoration of instream and riparian structural and vegetation habitat should be linked with
EWP target reaches to maximise outcomes of flows that promote fish populations,
spawning and recruitment.
• Consideration be given to extending the South Para EWP trial reach downstream to the sea
to incorporate diadromous fish management issues (following the removal of Gawler weir).
• Transfer flow operations in the Upper Torrens be designed with the aim of minimising
ecological impacts of periods of constant high, or low flow volumes.
• Onkaparinga EWPs need to clearly address issues relating to diadromous fish movements
as well as maintaining current low levels of exotic species.
• Post EWP monitoring should target the same sites and cover (at a minimum) the duration
of pre flow monitoring to assure meaningful comparisons can be drawn.
• The season to season variation in the EWP catchments is such that several years of
continuous data are likely to be required for causative flow responses and benefits to the
fish community to be confidently identified.
• Flows that boost the volume and duration of autumn and spring flows are likely to provide
the largest benefit to native fish and broader aquatic ecosystem health across EWP
reaches.

McNeil et al. 2011 Fish and EWPs in the WMLR
1
1. INTRODUCTION
1.1. Catchments of the Mount Lofty Ranges
The Mount Lofty Ranges which bound the eastern edge of Adelaide, forms the watershed between
the Murray-Darling Basin and The South Australian Gulf Drainage Division. The eastern draining
catchments of the MLR drain towards the Murray River and Lower Lakes, with the coastal
catchments of the Western Mount Lofty Ranges (WMLR) draining into Gulf St. Vincent. The major
catchments in the WMLR are the Gawler River (fed by the North and South Para Rivers), the River
Torrens, which runs through the City of Adelaide, and the Onkaparinga which drains a large
section of the central MLR and enters the Gulf through the far-southern Adelaide suburbs at Port
Noarlunga. Each of these catchments has undergone significant and continuing anthropogenic
modification since European settlement in the mid nineteenth century (Kraehnbuehl 1996).
Largely, modification of waterways revolves around the capture and storage of water resources to
support agricultural and urban community uses, and the modification of the physical catchment
through land use and urbanisation. As a result, the essential character of these rivers has
changed significantly, and subsequently, their role as aquatic ecosystems has also been
dramatically changed from pre-European condition (McNeil and Hammer 2007). One of the key
mechanisms of anthropogenic change in these systems is the construction of water storage
reservoirs and weirs which have in turn, greatly altered the flow regime from natural condition.
1.2. Flow Management and Regime
A number of water storages have been constructed within river valleys to store water for human
use, including very large water storages on the South Para River (South Para Reservoir), the River
Torrens (Kangaroo Creek Reservoir) and the Onkaparinga (Mount Bold Reservoir). Smaller but
significant weirs also exist on all three rivers (Gumeracha Weir, Gorge Weir, City Weir and
Breakout Creek Weir (Torrens), Warren Reservoir, Woodlands Weir and Gawler Weir (removed by
the time of writing) on the South Para, and Clarendon Weir on the Onkaparinga.
In addition, large volumes of rainfall and catchment run-off are captured in farm dams in upper
catchment areas, ensuring that small flows in particular do not flow through natural landscape
pathways into creeks and rivers (Teoh 2002). As a result, stream hydrology in the Mount Lofty
Ranges has largely shifted from flows resulting from rainfall and catchment runoff toward managed
flow transfers between water storages. These transfers utilise some stream reaches but are often
moved through an extensive pipeline network that diverts river flows to water storages outside of
the catchment such as the Millbrook and Hope Valley Reservoirs. Furthermore, large volumes of

McNeil et al. 2011 Fish and EWPs in the WMLR
2
water are piped into MLR catchments from the Murray River, flowing through streams and rivers in
the upper catchment into storages.
As a result, stream sections are impacted variously by either highly managed flow releases driven
by water usage patterns and human demand, or have been cut off from natural catchment flows
which are captured and diverted upstream above water storages. The former scenario has
resulted in some river reaches that flow independently to catchment rainfall patterns and a highly
altered flow regime. The latter scenario has resulted in river reaches that possess very low flow
rates compared to pre-regulation and often have important components of their flow regime
missing or greatly reduced; relying entirely on local rainfall and runoff to provide surface flows
except during very large events that overtop dams and weirs. In both situations, regulation has
lead to changes in the magnitude, frequency, duration and timing of river flows, all of which are
critical components of riverine flow regime, and key mechanisms driving riverine ecosystems (Poff
et al. 1997). These ecosystems and associated aquatic biota are often highly dependent on
specific aspects of natural flow regime. Conversely, specific aspects of the altered flow regime are
detrimental to these ecosystems.
1.3. Flow Ecology and fish in the WMLR
Flow regime determines the physical structure of riverine habitats and provides connectivity
between catchment components both longitudinally, connecting upstream and downstream
reaches, tributaries, estuarine and marine systems, and laterally, connecting to floodplains and off
channel wetlands and lakes. Critically, many aquatic organisms have evolved life history
strategies that rely directly on specific components of the natural flow regime and on patterns of
longitudinal and lateral connectivity (Bunn and Arthington 2002; Lloyd et al. 2003). In particular,
native fish species are dependent on a wide range of flow regime components having evolved to
survive within the highly variable and often harsh conditions within Australia’s waterways
(Puckridge et al. 2000; Lloyd et al. 2003; Lintermans and Cottingham 2007).
Flow magnitude controls inundation of floodplains and connection across aquatic habitats, and
native fish have evolved to utilise high magnitude flows for migrating long distances along rivers,
for moving into and out of floodplain and wetland habitats and for migrating to and from the sea
both as adults and as larvae or juveniles. The duration of these flows is also critical to provide
connectivity across these habitats for long enough so that these life history functions can be
completed, to generate appropriate ecological processes such as macrophyte growth and the
production of abundant food resources during wetland inundation (Zeug and Winemiller 2008), for
diadromous migrants to move long distances from the sea to upper catchment habitats (McDowall
1988; Mackay 2008; McNeil et al. 2009), or for freshwater species to move to spawning grounds
and return to adult habitats without being stranded. Timing and seasonality of flow is often critical

McNeil et al. 2011 Fish and EWPs in the WMLR
3
for native fishes which have evolved very specific seasonal spawning, migrational and recruitment
traits linked to the peculiarities of the Australian climate and flow regime (McNeil and Hammer
2007).
Diadromous fish are often highly dependent on autumn and/or spring flows to allow larvae and
adults to move out to sea and return to freshwater habitats later in the year. Pouched lamprey
(Geotria australis) and short-headed lamprey (Mordacia mordax) live in the sea as adults but return
to freshwater habitats where they spawn and where larval and juvenile life stages develop and
grow before returning to the sea as adults (Potter 1970). Galaxiid species such as common
galaxias (Galaxias maculatus) and climbing galaxias (G. brevipinnis) rely on autumn flows for
newly spawned larvae to move out to sea and on spring flows for those fish to move back into
freshwater catchments (McDowall 1988).
At even finer scales, climbing galaxias also rely on multiple pulses of flow during autumn for
spawning, development and hatching of eggs which are spawned during a high flow event but
require subsequent inundation a couple of weeks later to hatch and migrate to sea; Mountain
galaxias require flows that maintain cool, well oxygenated water, minimising stagnation during dry
periods (O'Connor and Koehn 1998). Therefore, multiple aspects of flow regime such as
magnitude, timing, duration and frequency, all combine to support critical life history functions in
Australia’s freshwater fish. These relationships demonstrate the intricate linkages between very
specific flow components and the long term survival and viability of native fish populations in
coastal waterways.
Rivers with a greatly changed flow regime often possess depauperate and less diverse native fish
communities and are susceptible to becoming dominated by species – mostly introduced – which
are better adapted to the changed regime (Marchetti et al. 2004). A number of introduced fish
species have become well established within the WMLR, including veracious predators such as
brown trout (Salmo trutta), rainbow trout (Oncorhynchus mykiss) and redfin perch (Perca fluviatilis)
as well as tench (Tinca tinca), goldfish (Carassius auratus), common carp (Cyprinus carpio) and
gambusia (Gambusia holbrooki) (McNeil and Hammer 2007).
Recent research into redfin perch in the WMLR has suggested that this species is a predator of
native fishes but that harsh summer conditions and diverse macro-invertebrate assemblages may
ease predation pressure on native fish as long as flow regime and native riparian and in-stream
habitat condition is in fairly natural condition (Wilson et al. 2008). Victorian research also suggests
that brown trout predation can similarly be restricted under natural flow regime where summer
temperatures become high (Closs and Lake 1996). Carp appear to prosper under both regulated
and variable flow conditions especially when linked to large floods, however, numbers have
decreased significantly in relation to the current low flow conditions associated with drought
(McNeil et al. 2011a). Gambusia may be disadvantaged under natural flow regimes that support
McNeil et al. 2011 Fish and EWPs in the WMLR
4
increased native fish biodiversity (McNeil 2004), and as a still water specialist they may also be
flushed downstream under high flows (Meffe 1984). The ecology of other introduced species
regarding flow regime is poorly understood.
Given that all freshwater fish species present in the WMLR are unable to survive periods of
desiccation i.e. they have no special adaptations to survive drying of their pool habitat (Bunn and
Arthington 2002; McNeil et al. 2011b), flows provide habitat and prevent declines in water quality
that can reach lethal levels within isolated waterholes under inadequate flow regimes (McNeil and
Closs 2007). In this way, the duration of very low or zero flow periods is critical for the survival of
native fish, particularly during harsh climatic conditions such as during drought, or under extreme
levels of river regulation, such as exist in most river reaches in the MLR (McNeil and Hammer
2007; McNeil et al. 2009). However, low flow periods are an important aspect of natural flow
regime that may control introduced predatory and competitive species many of which are relatively
intolerant to naturally harsh summer conditions in Australian waterways (Closs and Lake 1996;
McNeil 2004; McNeil and Closs 2007).
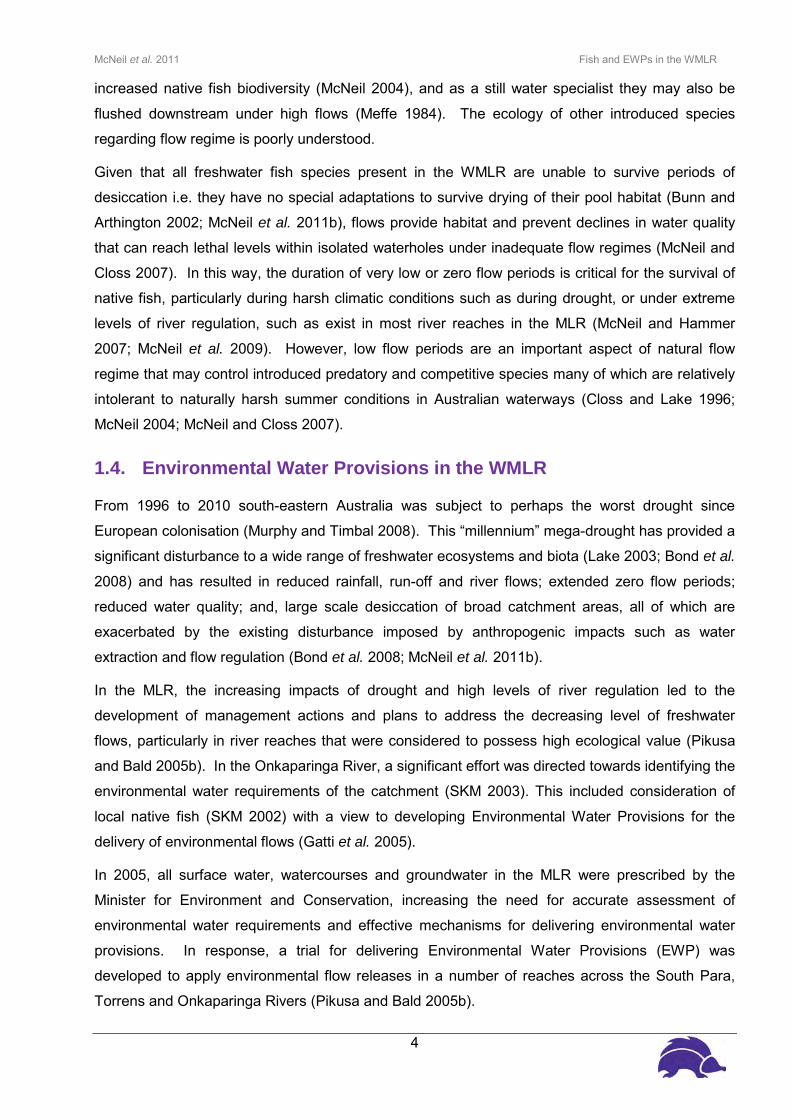
1.4. Environmental Water Provisions in the WMLR
From 1996 to 2010 south-eastern Australia was subject to perhaps the worst drought since
European colonisation (Murphy and Timbal 2008). This “millennium” mega-drought has provided a
significant disturbance to a wide range of freshwater ecosystems and biota (Lake 2003; Bond et al.
2008) and has resulted in reduced rainfall, run-off and river flows; extended zero flow periods;
reduced water quality; and, large scale desiccation of broad catchment areas, all of which are
exacerbated by the existing disturbance imposed by anthropogenic impacts such as water
extraction and flow regulation (Bond et al. 2008; McNeil et al. 2011b).
In the MLR, the increasing impacts of drought and high levels of river regulation led to the
development of management actions and plans to address the decreasing level of freshwater
flows, particularly in river reaches that were considered to possess high ecological value (Pikusa
and Bald 2005b). In the Onkaparinga River, a significant effort was directed towards identifying the
environmental water requirements of the catchment (SKM 2003). This included consideration of
local native fish (SKM 2002) with a view to developing Environmental Water Provisions for the
delivery of environmental flows (Gatti et al. 2005).
In 2005, all surface water, watercourses and groundwater in the MLR were prescribed by the
Minister for Environment and Conservation, increasing the need for accurate assessment of
environmental water requirements and effective mechanisms for delivering environmental water
provisions. In response, a trial for delivering Environmental Water Provisions (EWP) was
developed to apply environmental flow releases in a number of reaches across the South Para,
Torrens and Onkaparinga Rivers (Pikusa and Bald 2005b).

McNeil et al. 2011 Fish and EWPs in the WMLR
5
This EWP program provided collaboration between the Department of Water, Land and
Biodiversity Conservation (DWLBC, now the Department for Water or DFW) and the newly formed
Adelaide and Mount Lofty Ranges Natural Resources Management Board (AMLRNRMB), in co-
operation with SA-Water and the SA Murray-Darling Basin NRM Board. The EWP project planned
trial flow releases from the South Para Reservoir, Gumeracha and Gorge Weirs on the Torrens
and Clarendon Weir on the Onkaparinga River. Flow trials were divided into baseflow, freshening
flows and flushing flows acknowledging the differential requirements of the environment for varying
flow magnitude and timing, with volumes differing across target catchments in line with existing and
historic flow volumes, and catchment capacity (Pikusa and Bald 2005b).
As well as developing plans and infrastructure for the delivery of environmental water provisions,
this program sought to improve understanding of the ecological systems in target reaches and to
assess the responses of aquatic biota to freshwater flows, particularly to flow releases delivered
under the EWP trial. To this end, DWLBC and the AMLRNRMB commissioned projects to assess
baseline ecological and biological knowledge regarding the four planned target reaches: the South
Para River downstream of the South Para Reservoir; the River Torrens downstream of Gumeracha
Weir and downstream of Gorge Weir; and the Onkaparinga River downstream of the Clarendon
Weir.
The sustainability of native fish populations, their flow requirements and their responses to
freshwater flow releases were selected as key indicators for ecological condition and to
demonstrate environmental outcomes of the planned flow releases. A review of biological
information regarding freshwater fishes of the Mount Lofty Ranges was produced (McNeil and
Hammer 2007) and a project developed to collect baseline data on native fishes within target river
reaches. This project would provide valuable ‘before data’ to support data collected during and
after the delivery of environmental flows, improving the capacity to assess the outcomes of flow
releases.
This project was designed to provide a long term monitoring strategy that would inform government
and natural resource managers on the environmental outcomes of environmental flow provisions
and identify potential failures and future directions to improve planning and design of highly
efficient and effective environmental watering activities. Whilst the first trial flows under the EWP
program were planned for spring 2007, drought contingency policies delayed planned EWPs
indefinitely, and they have not yet been delivered under ongoing drought conditions, regardless of
drought contingency EWP plans being adapted by the AMLRNRMB and DWLBC (Bald and Scholz
2007a).
Despite the postponement of EWP releases, the fish monitoring program continued to collect
valuable baseline data which would be compared to post-flow data and improve the resolution and
power of subsequent monitoring and evaluation activities. Prior to postponement however, a trial

McNeil et al. 2011 Fish and EWPs in the WMLR
6
flushing flow was released from Clarendon Weir during 2006 to test the delivery capacity and
infrastructure (P. Schultz, AMLRNRMB, Pers. Comm.).
A key focus of the current project is to ascertain the status and general ecology of native fish within
these reaches. Very little comprehensive ecological work has been conducted on fishes within the
WMLR prior to this project. Most research has focused on distributional inventories of fish species
within single catchments. Inventory ‘snapshots’ have been undertaken within the Torrens and
Patawalonga catchments as part of the Adelaide Hills fish inventory for the Torrens Catchment
Water Management Board, during 2004 (Hammer 2005) and in the Onkaparinga catchment for the
Onkaparinga Catchment Water Management Board during 2001/2002 (SKM 2002).
Other spot surveys have been carried out in the Broughton, Light, Gawler and Wakefield
catchments in the north (Hicks and Sheldon 1998; 1999c; b; a; Lloyd 2000; Lloyd 2001) and at
single sites at Breakout Creek on the Torrens (Gray et al. 2005) with desktop reviews collated from
existing published and unpublished observations for the Torrens catchment (Hicks and Hammer
2004) and the Onkaparinga estuary (Hammer 2006).
A comprehensive review of species distribution records was presented in (McNeil and Hammer
2007), based on records from state government agencies, the SA museum, Adelaide University,
Native Fish Australia surveys and private collections as well as published records and data. Only a
small amount of information is available from the Gawler River catchment (Hicks and Sheldon
1999b), except for a study of redfin perch and their impact on flathead gudgeon (Philypnodon
grandiceps) that was conducted within the EWP target reach in the South Para River as part of the
current project (Wilson et al. 2008). A summary of recent fish species records from each of the
three EWP target catchments prior to the current project is presented below in Table 1.

McNeil et al. 2011 Fish and EWPs in the WMLR
7
Table 1. List of native and introduced species recorded in the Western Mount Lofty Ranges in the three target rivers (P=present knowledge base prior to this study).
Common Name Scientific Name
South-P
ara
Torrens
Onkaparinga
Record
Reliability
Pouched lamprey Geotria australis P P P 3
Shortheaded lamprey Mordacia mordax P P P 3
Freshwater catfish Tandanus tandanus P 3*
Smelt Retropinna semoni P 1
Climbing galaxias Galaxias brevipinnis P P P 3
Common galaxias Galaxias maculatus P P P 3
Mountain galaxias Galaxias olidus P P P 3
Murray rainbowfish Melanotaenia fluviatilis P 3*
Small-mouthed hardyhead Atherinosoma microstoma P P 3
Murray cod Maccullochella peelii P 1*
Murray-Darling Golden perch Macquaria ambigua ambigua P 1*
Silver perch Bidyanus bidyanus P 1*
Barramundi Lates calcarifer P 3*
Congolli Pseudaphritis urvillii P P P 3
Midgley’s carp gudgeon Hypseleotris sp. 1 P 3*
Southern purple-spotted gudgeon Mogurnda adspersa P P 2
Flathead gudgeon Philypnodon grandiceps P P P 3
Dwarf flathead gudgeon Philypnodon macrostomus P P 3*
Western blue spot goby Pseudogobius olorum P P
3
Goldfish Carassius auratus P P 3**
Common carp Cyprinus carpio P P 3**
Tench Tinca tinca P P P 3**
Rainbow trout Oncorhynchus mykiss P P P 3**
Brown trout Salmo trutta P P P 3**
Brook trout Salvelinus fontinalis 1**
Gambusia Gambusia holbrooki P P P 3**
Redfin perch Perca fluviatilis P P P 3**
Sources: Hammer and Walker 2004, Hicks and Hammer 2004, Gray et al. 2005, Hammer 2005, Hammer 2006, McNeil and Hammer 2007.
* represents translocated species
** represents introduced species
Record reliability scale 1 = possible misidentification or very old record
2 = reliable observation but no recent observation
3 = reliable recent observation

McNeil et al. 2011 Fish and EWPs in the WMLR
8
1.5 Aims
This report outlines the findings of the first three years of the long-term fish monitoring project,
provides baseline data on the status and ecology of native fishes within EWP trial reaches and
informs the relationship between natural flow variability and fish ecology. The report also aims to
provide knowledge regarding the flow responses of native and introduced fishes, informing the
development of effective and efficient flow release strategies and to providing optimal benefit to the
environment within the limited water volumes available. The project is not explicitly designed,
however, to define the environmental water requirements and flow targets for native fish, but rather
to provide the baseline knowledge from which these definitions and metrics may be derived.
The specific aims of the project were:
1. To implement and trial the long term fish monitoring strategy outlined in McNeil and
Hammer (2007) within EWP target reaches;
2. To assess the baseline ecological structure and condition of native fish communities in
EWP target reaches and update information presented in McNeil and Hammer (2007);
3. To identify issues that relate to the sustainability of native fishes within EWP reaches;
4. To inform management of the environmental water requirements pertaining to native fishes
in the Western Mount Lofty Ranges; and
5. To inform the development and improvement of environmental watering strategies to
optimise environmental outcomes.

McNeil et al. 2011 Fish and EWPs in the WMLR
9
2. METHODS
2.1. Site descriptions
Surveys were conducted within each of the four EWP target reaches, immediately downstream of
the flow release points, across three river catchments. The South Para River was surveyed
downstream of South Para Weir; the Torrens was sampled in two reaches, the first downstream of
the Gumeracha Weir in the upper catchment and the second downstream of the Gorge Weir in the
lower catchment. The Onkaparinga River was surveyed downstream of Clarendon Weir (Figure 1).
2.1.1. South Para River
The South Para River is located approximately 60 km to the north-east of Adelaide, beginning near
Mount Crawford on the western slope of the Mount Lofty Ranges (Teoh 2006a). Before meeting
the North Para River, the river flows north-west joining the North Para River at Gawler and flows
east as the Gawler River before discharging into Gulf St Vincent (Walter 2005) (Figure 1). The
natural flow regime in the South Para River has been heavily impacted by the impoundment and
diversion of catchment water for domestic supply (Teoh 2006b). Four SA Water storages control
the South Para catchment, namely the Warren Reservoir, the South Para Reservoir, the Barossa
Diversion Weir and the Barossa Reservoir on the North Para River, into which water is diverted
through the Barossa Diversion Weir (Pikusa and Bald 2005b). These water storages are controlled
to provide water supplies to cater for Metropolitan Adelaide and the Northern Region. On average,
21000 ML of water per year is diverted from the catchment for water supply, 16800 ML originating
from the catchment and 4200 ML sourced from the River Murray (Teoh 2006).
The study reach was located downstream of the South Para Reservoir (Figure 2) and Barossa
Diversion Weir, and was located in the gorge reach encompassed by Crown land, national park
(Parra Wirra) and private freehold. The gorge section has been heavily impacted by grazing and
vegetation clearance since European settlement, but intact riparian vegetation remains in sections,
particularly within the Para Wirra National Park and Crown land reach below the Barossa Diversion
Weir (Pikusa and Bald 2005b). Within the survey reach the stream regularly dries into a series of
isolated pools re-connecting primarily during significant local rainfall and large flood events such as
occurred in November 2005 (Wilson et al. 2008). Overflows from the Barossa Diversion Weir are
extremely rare and flows are derived primarily from local catchment runoff. Provision of year-round
baseflow has been identified as the main environmental water requirement for this reach, which is
believed to have formerly flowed perennially prior to regulation (Pikusa and Bald 2005b).

McNeil et al. 2011 Fish and EWPs in the WMLR
10
Figure 1. Map showing the location of all sample sites in the western Mount Lofty Ranges, South Australia. South Para River sites: A – South Para Weir, B – Para Wirra, C – Nolan’s, D – Woodlands Weir. River Torrens sites: E – Gumeracha Weir, F – Cudlee Creek, G – Gorge Weir, H – Silkes Rd and I – Torrens Mouth. Onkaparinga River sites: J – Clarendon Weir, K - Brooks Road, L – Old Noarlunga. Each sample site was sampled at three pools.
McNeil et al. 2011 Fish and EWPs in the WMLR
11
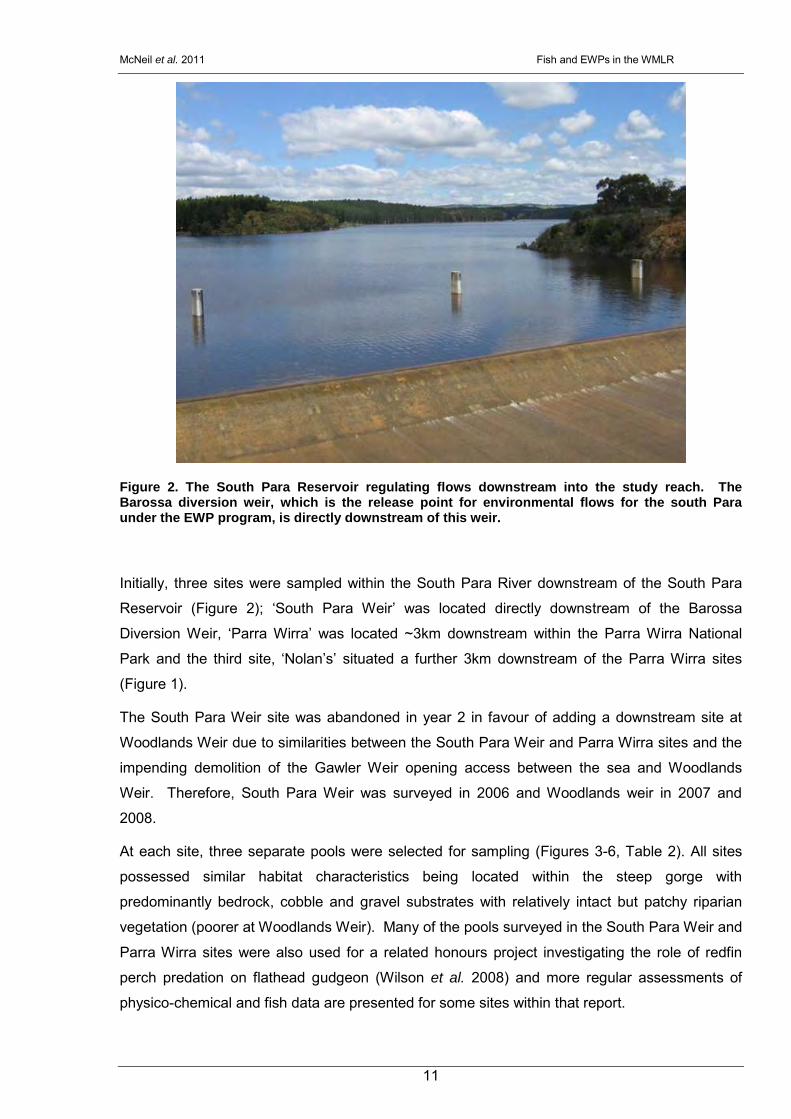
Figure 2. The South Para Reservoir regulating flows downstream into the study reach. The Barossa diversion weir, which is the release point for environmental flows for the south Para under the EWP program, is directly downstream of this weir.
Initially, three sites were sampled within the South Para River downstream of the South Para
Reservoir (Figure 2); ‘South Para Weir’ was located directly downstream of the Barossa
Diversion Weir, ‘Parra Wirra’ was located ~3km downstream within the Parra Wirra National
Park and the third site, ‘Nolan’s’ situated a further 3km downstream of the Parra Wirra sites
(Figure 1).
The South Para Weir site was abandoned in year 2 in favour of adding a downstream site at
Woodlands Weir due to similarities between the South Para Weir and Parra Wirra sites and the
impending demolition of the Gawler Weir opening access between the sea and Woodlands
Weir. Therefore, South Para Weir was surveyed in 2006 and Woodlands weir in 2007 and
2008.
At each site, three separate pools were selected for sampling (Figures 3-6, Table 2). All sites
possessed similar habitat characteristics being located within the steep gorge with
predominantly bedrock, cobble and gravel substrates with relatively intact but patchy riparian
vegetation (poorer at Woodlands Weir). Many of the pools surveyed in the South Para Weir and
Parra Wirra sites were also used for a related honours project investigating the role of redfin
perch predation on flathead gudgeon (Wilson et al. 2008) and more regular assessments of
physico-chemical and fish data are presented for some sites within that report.

McNeil et al. 2011 Fish and EWPs in the WMLR
12
Table 2. GPS co ordinates for the pools surveyed within each of the South Para River sites.
Site Pool Coordinates (UTM)
A - South Para Weir 1 54 H 302824 6159839 2 54 H 302830 6160010 3 54 H 302852 6160122 B - Para Wirra 1 54 H 301402 6161383 2 54 H 301398 6161427 3 54 H 301310 6161486 C - Nolan’s Property 1 54 H 298573 6162010 2 54 H 297995 6162167 3 54 H 297800 6162163 D - Woodlands Weir 1 54 H 295447 6167085 2 54 H 295418 6167108 3 54 H 295138 6167016
Figure 3. Location of the three monitoring pools at the South Para Weir site (A) on the South Para River.

McNeil et al. 2011 Fish and EWPs in the WMLR
13
Figure 4. Location of the three monitoring pools at the Para Wirra site (B) on the South Para River.
Figure 5. Location of the three monitoring pools at Nolan’s site (C) on the South Para River.

McNeil et al. 2011 Fish and EWPs in the WMLR
14
Figure 6. Location of the three monitoring pools at the Woodlands Weir site (D) on the South Para River.
2.1.2. River Torrens
The River Torrens flows through central Adelaide and suburbs and is therefore the most visible
and accessible river on the Adelaide Coast. The Torrens catchment covers more than 620
square kilometres draining a large section of the western Mount Lofty Ranges before flowing
westward across the Cowandilla plain and into Gulf St Vincent (Figure 1). Various groundwater
systems underlay the catchment, including fractured rock aquifers in the hills areas and
sedimentary aquifers on the plains (TCWMB 2005). The catchment is an important source of
water for the Adelaide region supplying water for drinking supplies, agricultural industries, rural
living, recreation and the environment. Natural features and drainage of the region have been
greatly modified following European settlement. The River Torrens formerly fed large wetland
areas to the west of Adelaide which in turn drained northwards through West Lakes and the Port
River (Holmes and Iverson 1976). However, reclamation activities have led to the rapid draining
of the area via Breakout Creek, a constructed conduit that drains the Lower Torrens westward
into the sea at Henley Beach (Hicks and Hammer 2004; Gray et al. 2005). In addition, a
number of weirs and reservoirs have been constructed within the Torrens catchment for the
purpose of water storage.

McNeil et al. 2011 Fish and EWPs in the WMLR
15
The River Torrens is controlled by numerous reservoirs with a total storage capacity of 39 GL.
River Murray water is also pumped into the Torrens at Mt Pleasant and Angas Creek to meet
the demands of the public water supply (Bald and Scholz 2007a). The most significant storages
are the Gumeracha Weir (Figure 7), Kangaroo Creek Reservoir, Millbrook reservoir and Gorge
Weir (Figure 8), with water diverted to out of catchment storage at Happy Valley Reservoir
(Pikusa and Bald 2005b). This regulation of flow in the River Torrens has led to dramatic
changes in the natural flow regime of the river, impacting on timing, duration of flows as well
water quality and suspended sediment characteristics.
Figure 7. Gumeracha Weir, one of the release points for EWPs in the Torrens River.
Figure 8. Gorge Weir release point.
The majority of Torrens River flows are diverted at Gumeracha Weir into Millbrook Reservoir via
a tunnel. As a result, the Torrens below Gumeracha Weir has become almost completely dry
except in large floods and was wet for only 121 days over the 8 yr period 1996-2003. Similarly,
there have been significant reductions in flow immediately downstream of Gorge Weir. Loss of
flow in these reaches has caused reductions in habitat and diversity of aquatic communities
(Pikusa and Bald 2005a). Under the EWP trial program, these two reaches have been identified
as priority sites for receiving environmental water allocations from SA Water reservoirs.
Specifically, target reaches are the River Torrens between Gumeracha Weir and Kangaroo

McNeil et al. 2011 Fish and EWPs in the WMLR
16
Creek Reservoir (9.3km) and between Gorge Weir and the Torrens Lake (20km) (Pikusa and
Bald 2005b). The principal objectives of flow provisions for these reaches are to maintain and
further improve water quality, visual amenity, macroinvertebrate and fish habitat with low flows
and to scour sediment build up and control encroaching vegetation with winter pulse flows
(Pikusa and Bald 2005b). These objectives are currently being revised and updated (S. Gatti
pers comm, 2011).
Two separate reaches were surveyed in the Torrens in line with the EWP target reaches,
reflecting the fragmentation and differential management of individual reaches in this river
system (Pikusa and Bald 2005b). In line with the project sampling design, at least two sites
were selected within each reach with one site selected as close as possible to the weir/flow
release point and another several km downstream. There were a total of five sites within the
River Torrens. The first reach extended downstream of the Gumeracha Weir and included two
sites, the first “Gumeracha Weir” was just below the weir and the second “Cudlee Creek” was
downstream of the Cudlee Creek Reserve. This reach flows into the Kangaroo Creek Reservoir
where water is re-captured to the system, and flows are not therefore transferred downstream of
this storage.
The section of the Torrens between Kangaroo Creek Reservoir and the Gorge Weir was not
surveyed due to extreme and unpredictable levels of flow regulation. The second survey reach
was downstream of Gorge Weir extending through the inner north eastern suburbs of Adelaide.
Two sites were selected “Gorge Weir” immediately downstream of the Gorge Weir below the
water transfer pipeline, and “Silke’s Rd” a downstream site situated at the end of Silke’s road in
Athelstone amid suburban development and parkland (Torrens Linear Park). A third site
“Breakout Creek” was included to capture any impact of flow releases in delivering
environmental services to coastal and diadromous fish populations in the lower reaches of the
River Torrens and the estuarine habitat downstream of the Breakout Creek Weir (Figure 1).
The “Gumeracha Weir” site is situated approximately 1km downstream of the Gumeracha Weir
wall (Table 3, Figure 9) with all three pools located within State controlled land accessed by the
Gorge Rd. The Gumeracha reach lies within a highly regulated section of the Torrens and
receives a high degree of Murray River water resulting in higher than usual turbidity for the
catchment (Hammer 2005). Being upstream of major water storage in the Kangaroo Creek
Reservoir, most of the water passing thorough the reach is for the purpose of urban and
drinking water transfer, whilst upstream flows are highly regulated by large volume diversions at
Gumeracha Weir. There has been some recent survey data collected from this reach, largely
reported in (Hammer 2005). Those surveys have found low native biodiversity with strong
presence of introduced species. The “Cudlee Creek” site is situated in the Cudlee Creek
Conservation Reserve upstream of the Cudlee Creek Township (Table 3, Figure 10).

McNeil et al. 2011 Fish and EWPs in the WMLR
17
Table 3. GPS co ordinates for the pools surveyed within each of the South Para River sites.
Site Pool Coordinates (UTM)
E - Gumeracha Weir 1 54 H 303565 6144257 2 54 H 303525 6144164 3 54 H 303600 6144096 F - Cudlee Creek 1 54 H 302688 6142465 2 54 H 302490 6142286 3 54 H 302274 6142234 G - Gorge Weir 1 54 H 292474 6140264 2 54 H 292383 6140187 3 54 H 292255 6140124 H - Silke’s Rd 1 54 H 288542 6139391 2 54 H 288443 6139374 3 54 H 288302 6139332 I - Breakout Creek 1 54 H 273633 6132520 2 54 H 273591 6132064 3 54 H 271546 6131289
Figure 9. Location of the three monitoring pools at the Gumeracha site on the Torrens River.

McNeil et al. 2011 Fish and EWPs in the WMLR
18
Figure 10. Location of the three monitoring pools at the Cudlee Creek site on the Torrens River.
The Gorge Weir reach consisted of two sites, one directly below the weir (Table 3, Figure 11)
and another several kilometres downstream in suburban Athelstone at Silke’s Rd (Figure 12).
Whilst the Gorge Weir site is directly regulated by the weir, the reach below the site has regular
levels of baseflow, largely due to tributary and stormwater inputs as well as some groundwater
recharge (Pikusa and Bald 2005b).
The primary aim of EWPs in this reach is to maintain baseflows and provided permanent levels
of connectivity and surface flow and to increase the frequency of flushing flows which are
reduced via upstream regulation and water capture (Pikusa and Bald 2005b). This reach has
been surveyed for fish previously, although most data stems from sites further downstream near
the Adelaide CBD (Rowntree and Hammer 2004). Previous surveys have revealed low native
species richness, dominated by translocated species and high abundances of introduced
species, particularly large predatory fishes (Table 4) (Rowntree and Hammer 2004; Hammer
2005). The Silke’s Rd site was located several kilometres downstream of the Gorge Weir amid
suburban development in the Torrens Linear Park, and is maintained as a park by local council
(Table 3, Figure 12)

McNeil et al. 2011 Fish and EWPs in the WMLR
19
Table 4. Previous Fish survey results for the Gorge Weir reach (from 1: Rowntree and Hammer 2004; and 2: Hammer 2005).
Species Status Source
Flathead gudgeon Native 1,2 Blue spot goby Native 1 Carp gudgeon Native-translocated 1 Murray rainbowfish Native-translocated 1 Freshwater catfish Native-translocated 1 Goldfish Introduced 1 Carp Introduced 1,2 Gambusia Introduced 1 Redfin perch Introduced 2 Brown trout Introduced 2
Figure 11. Location of the three monitoring pools at the Gorge Weir site on the Torrens River.
McNeil et al. 2011 Fish and EWPs in the WMLR
20
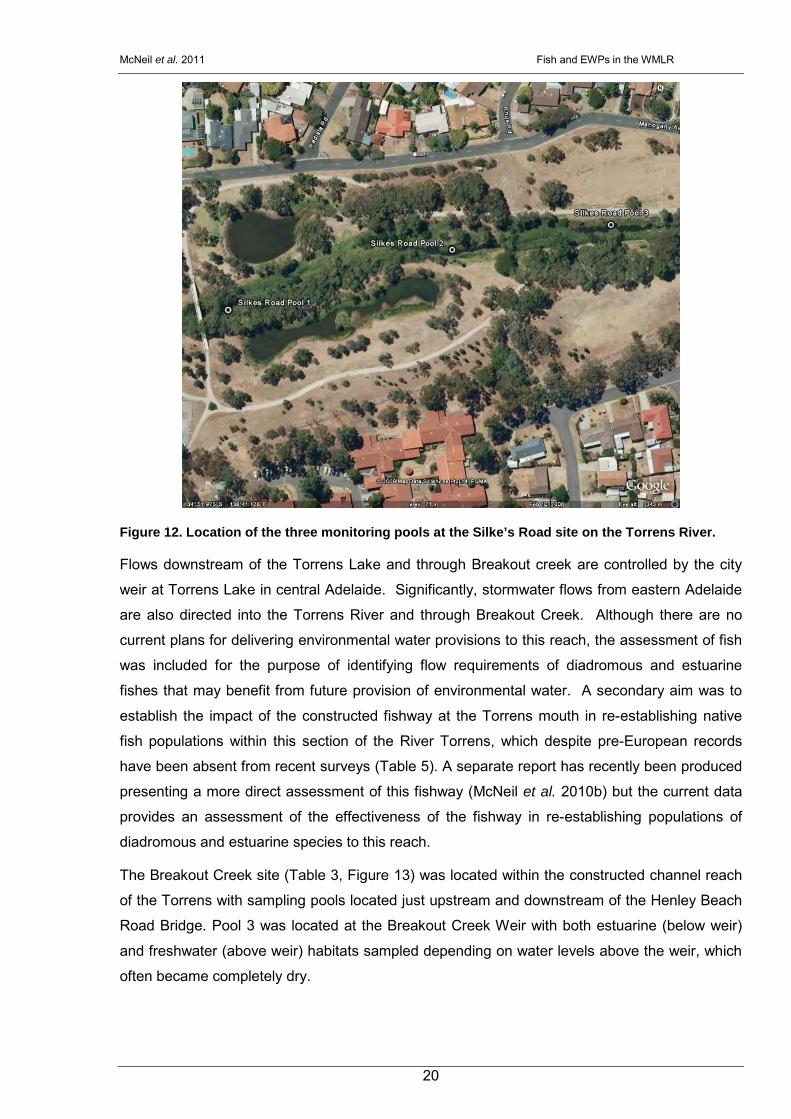
Figure 12. Location of the three monitoring pools at the Silke’s Road site on the Torrens River.
Flows downstream of the Torrens Lake and through Breakout creek are controlled by the city
weir at Torrens Lake in central Adelaide. Significantly, stormwater flows from eastern Adelaide
are also directed into the Torrens River and through Breakout Creek. Although there are no
current plans for delivering environmental water provisions to this reach, the assessment of fish
was included for the purpose of identifying flow requirements of diadromous and estuarine
fishes that may benefit from future provision of environmental water. A secondary aim was to
establish the impact of the constructed fishway at the Torrens mouth in re-establishing native
fish populations within this section of the River Torrens, which despite pre-European records
have been absent from recent surveys (Table 5). A separate report has recently been produced
presenting a more direct assessment of this fishway (McNeil et al. 2010b) but the current data
provides an assessment of the effectiveness of the fishway in re-establishing populations of
diadromous and estuarine species to this reach.
The Breakout Creek site (Table 3, Figure 13) was located within the constructed channel reach
of the Torrens with sampling pools located just upstream and downstream of the Henley Beach
Road Bridge. Pool 3 was located at the Breakout Creek Weir with both estuarine (below weir)
and freshwater (above weir) habitats sampled depending on water levels above the weir, which
often became completely dry.

McNeil et al. 2011 Fish and EWPs in the WMLR
21
Table 5. Fish Species Recorded from the lower River Torrens, downstream of city weir. Records are from: 1) Hammer (2005) (SA Museum records), 2) Gray et al. (2005) and 3) Scott (1962).
Species Status Historic records
Recent Records 1990-2006
Common galaxias Native diadromous 1 Short headed lamprey Native diadromous 1 Pouched lamprey Native diadromous 1 1 Congolli Native diadromous 1 Purple spotted gudgeon Native 1 Flathead gudgeon Native 1,2 Blue spot goby Native 3 1 Carp gudgeon Native-translocated 1,2 Murray rainbowfish Native-translocated 1,2 Freshwater catfish Native-translocated 1,2 Goldfish Introduced 1,2 Carp Introduced 1,2 Gambusia Introduced 1,2
Figure 13. Location of the three monitoring pools at the Breakout Creek site on the Torrens River.

McNeil et al. 2011 Fish and EWPs in the WMLR
22
2.1.3. Onkaparinga River
The Onkaparinga catchment is the largest catchment area in the western Mount Lofty Ranges
and is located approximately 25 km to the south-east of Adelaide (Figure 1). Covering an area
of 560 km² the Onkaparinga catchment is the single largest (WMLR) contributor to Adelaide’s
water supply and additional water inputs come from the Murray River via a pipeline that
discharges into the river near Hahndorf. The Onkaparinga provides water for domestic,
agricultural, horticultural and industrial use with much of its surface water captured in farm
dams, reservoirs and weirs (Kawalec and Roberts 2005). Large storages exist at the Mount
Bold Reservoir and the Clarendon Weir (Figure 14) with additional off takes from Clarendon
piped to Happy Valley Reservoir.
Figure 14. Clarendon Weir, the release point for lower Onkaparinga flows. This weir must be breached for upper catchment flows to reach the sea.
The construction of Mount Bold Reservoir has lead to a drastic reduction in surface flows within
the lower Onkaparinga downstream of Clarendon Weir with flows ceasing altogether during
summer (Pikusa and Bald 2005a). In this reach, channel flows are now largely dependent upon
local catchment rainfall runoff and input from a few small tributary streams, of which Kangarilla
Creek is the only significant contributor, except under extreme rainfall and flow conditions when
Clarendon Weir becomes breached (Kawalec and Roberts 2005). This section of the River is
dominated by the Onkaparinga Gorge, much of which lies within the Onkaparinga National Park
but has been historically modified for grazing. A number of large agricultural developments, in
particular wineries, abstract water from pools in the main channel upstream of the park, stock
impacts are also high throughout this reach. The riparian and gorge area is dominated by
introduced weed species, although in sections, reasonable densities of native trees and shrubs
remain, including river redgum (Eucalyptus camaldulensis), wattles (Acacia spp.), bottlebrush
(Callistemon sierberi) and ti tree (Leptospermum spp.) (Nicol and Bald 2006). Below the gorge
section immediately upstream of Old Noarlunga, the Onkaparinga River comes under estuarine

McNeil et al. 2011 Fish and EWPs in the WMLR
23
influence and is brackish or marine between Old Noarlunga and the sea with the principal
freshwater/estuarine interface proximal to the Church Track causeway within the park.
The three fish monitoring sites in the lower Onkaparinga River are located downstream of
Clarendon Weir. Sampling sites were established at ‘Clarendon Oval’, directly downstream of
the weir; ‘Brooks Road’, situated within the central gorge several kilometres downstream of the
weir and ‘Old Noarlunga’, at the foot of the gorge where freshwater reaches graduate into
brackish and estuarine reaches under tidal influence, a further several kilometres downstream
from Brooks Rd (Figure 15). As such, the Onkaparinga study reach covers the section between
the Clarendon Weir and Onkaparinga estuary.
Table 6. GPS co ordinates for the pools surveyed within each of the Onkaparinga sites.
Site Pool Coordinates (UTM)
J - Clarendon Oval 1 54 H 283928 6112029 2 54 H 284042 6111876 3 54 H 284098 6111835 K - Brooks Road’ 1 54 H 281900 6109139 2 54 H 281803 6109080 3 54 H 281777 6108952 L - Old Noarlunga 1 54 H 273694 6104752 2 54 H 273188 6104393 3 54 H 272735 6104409
Figure 15. Map showing the location of the 3 sampling sites on the Onkaparinga River. Each site consisted of three adjacent pools and interconnecting riffle/run reaches.

McNeil et al. 2011 Fish and EWPs in the WMLR
24
2.2. Field sampling design
Fish surveys were carried out twice a year, in autumn and spring of each year between April
2006 and December 2008. Surveys were conducted within each of the four EWP target
reaches, immediately downstream of the flow release points, across three river catchments (see
Section 2.1 for individual site descriptions). Sampling was carried out as close as possible to
April (autumn) and November (spring) with all sites and catchments surveyed within a one
month period.
The sampling design was based upon the monitoring framework developed in conjunction with
the EWP project steering committee and presented in detail in (McNeil and Hammer 2007). The
sampling design consisted of at least two sites within each of the four EWP target reaches; the
first was within 1 km of each flow release point with the second positioned approximately 5 km
downstream of the upstream site. In this way, data could be compared between sites that
directly receive full e-flow releases, with those farther downstream that may receive lesser flow
volumes from the same releases. In the Torrens and Onkaparinga Rivers, a third site was
added at the very bottom of each catchment to assess the impact that e-flow releases may have
on coastal and diadromous ecosystems and fish populations. In the second year of the survey,
an additional downstream site was also included on the South Para River, the details of which
will be discussed later.
At each site, three separate pools were selected for sampling, with all connecting riffle and run
areas included if inundated. Each pool was sampled with a consistent sampling design outlined
in Figure 16. Each pool was set with four small fyke nets, two large fyke nets and two double
winged fyke nets placed at either end of each pool to capture any fish moving through or into
the reach. Small fykes consisted of a 3 m leader and 3 m cod-end with two valves and 3 mm
stretch mesh (Figure 17a), whilst large fykes consisted of a 5 m leader, 4 m cod end with three
valves with 6 mm mesh. Double winged fykes had two 5 m wings, a 3 m cod end with three
valves and 3 mm mesh (Figure 17b). All fykes were set with a buoyed cod end to enable
surface access for air-breathing by-catch and weighted at each end point with chain or attached
to stakes. In earlier surveys, small bait traps were also used but this was discontinued due to
similarity in catches between these and small fykes. The ‘set’ of fyke nets was sufficient to
saturate smaller pools whilst in some larger pools nets were set to cover all major habitat types
(Figure 18). In very small pools (such as during drought summers in 2007/08, the four small
fykes were used as a base level of sampling with large fykes and then double winged fykes not
set. This maintained a base level of comparable data across small fyke catches at each site. In
extreme drying cases, very shallow pools were dip netted and/or seined using a 2 x 1 m seine
net with 2 mm mesh.

McNeil et al. 2011 Fish and EWPs in the WMLR
25
Figure 16. Site sampling design consisting of three netted pools interspersed with riffle/run reaches sampled using backpack electrofishing when inundated. Reproduced from McNeil and Hammer (2007).
Figure 17. Fyke nets used for field sampling, a) small fyke and b) double winged fyke.
At all sites areas connecting the three pools were also sampled with a backpack electrofisher
consisting of four sets of 250 second shots with frequency, voltage and duty-cycle set
independently based on local conditions. When connecting sections were dry, electrofishing
was carried out within the nearest possible fishable sections both upstream and downstream of
the reach.

McNeil et al. 2011 Fish and EWPs in the WMLR
26
Figure 18. A set of fyke nets in a pool at Brooks Rd in the Onkaparinga.
The principal focus of the sampling strategy was: a) to provide comprehensive data on species
presence and b) to gain an idea of the relative abundance of fish species across sites and
seasons. Each site was set for ~24 hours with a single site (i.e. three pools) set in a single day
and retrieved the following day. Electrofishing was usually carried out at the same time as
netting, although on some occasions, time limitations required that electrofishing was carried out
up to a week after the netting survey.
All nets were emptied into holding buckets, fish were then identified and measured; breeding
condition and the presence of disease or parasites was also recorded. All fish were identified
and total numbers for each species was recorded. Where very large numbers of fish were
collected size measurements were only taken from a sub-sample. Sub-sampling was
conducted by ensuring that at least the first fifty fish of each species were measured; however in
all cases, all fish within the selected net were measured, even if more than fifty were present.
This ensured that sub-sampling errors did not result in very large or small individuals within a
catch being neglected during measurement. Breeding condition was assessed by ‘squeezing’
the underbelly of each fish and recording the presence of eggs or sperm issuing from the vent.
For new records or uncertain classifications, some voucher species were retained and in the
case of novel species, submitted to the South Australian Museum, Adelaide. All nets were
washed thoroughly in mild bleach and/or sea water between catchments to ensure against the
incidental translocation of algae, parasites or pest species through contaminated netting.
Snakes, turtles, water hen, ducks and water rats were occasionally collected in nets and were
released unharmed at the site of capture.

McNeil et al. 2011 Fish and EWPs in the WMLR
27
2.3. Physical and chemical site characteristics
At each site a number of physical characteristics were estimated for each sampling event.
Some physical characteristics were not expected to change greatly over the course of the
survey including the percent cover and composition of riparian vegetation, size structure of
streambed substrates, maximum depth and the number of snags within each pool. These
estimates were taken each season and average values were used in site summary tables to
allow for inter-sample variability in the estimation of physical values and to account for
differences between subjective estimates made each season.
A number of physical, chemical and flow parameters were expected to vary across years and
these were assessed independently for each sampling season. These measurements included
the percent cover and composition of aquatic macrophytes, the maximum depth, dissolved
oxygen, pH, salinity and water temperature as well as flow condition and antecedent flow
regime.
The composition of aquatic macrophytes and riparian vegetation was determined using (Sainty
and Jacobs 1994) cross checked with previous vegetation records where possible (i.e. Nicol
and Bald 2006). Subjective estimates of cover were made in relation to pool surface area (e.g.
area of pool surface covered by macrophytes). Whilst this was excellent for non-emergent
macrophytes, assessment of emergent cover was found to vary between estimators and a
protocol was developed whereby, stems protruding from the water were counted in macrophyte
cover estimates, ignoring stems that may be present upon banks but not available as physical
fish habitat at the time of sampling. As a result of difficulties in locating the waters edge below
emergent beds, some estimates of macrophyte cover may be overestimated, particularly for
cumbungi (Typha domingensis) and common reed (Phragmites australis).
Maximum depth was recorded at the same point each season using measuring tape pinned to a
fyke net chain, lowered to the substrate at the deepest point in each pool (at which absolute
maximum depth was recorded). Water temperature, pH, dissolved oxygen and conductivity
were assessed during each sampling trip with a TPS water quality multi-meter. Water quality
was measured around 15 cm below the water surface in a central part of each pool and where
depth was sufficient, additional samples were taken for each parameter at 50 cm depth intervals
until the probes touched the substrate. For consistent comparison, the surface water quality
values only are presented in site summary tables; although in some cases results may refer to
values from deeper stations. It should be noted that surface values presented are not
necessarily consistent with water quality in deeper sections and that stratification will not be
accounted for using these surface data. As a result, deeper waters may be more hypoxic
and/or saline than values obtained at the surface and caution should be taken in using surface
value only as indicative of the total volume of the pool. Flow condition was categorized for each

McNeil et al. 2011 Fish and EWPs in the WMLR
28
pool and each sampling season as either ‘No flow’, ‘Low flow’, or ‘High flow’ via visual
assessment made at the downstream extent of survey pools. Antecedent flow conditions relate
to the six month period preceding each sampling trip in an effort to capture the recent flow
conditions prior to sampling for each season. Antecedent flow conditions were assessed using
hydrographs provided by Water Data Services (WDS) recorded from DWLBC and AMLRNRMB
hydrometric stations. These conditions were classified based on the EWP flow classes
determined for each target river (Bald and Scholz 2007a) as no flow, very low flows, low flows,
freshes and flushes. Additional categories were added to account for low and very low flow
conditions that occurred over the sampling period. These low flow categories differentiated
between small and/or infrequent periods of flow and extended periods of baseflow as set out in
the EWP proposal (Bald and Scholz 2007a).
2.4. Data analysis
A multivariate statistical approach was used to investigate the relationship between fish
community with flow, water quality and habitat variables. In general, the temporal variability of
the existing data sets are likely to be too small to pick up large scale trends, which may be
obscured by short term variables such as seasonal recruitment, abundance etc. However, the
analytical approach was applied here as a trial to investigate the applicability of this approach to
the long term monitoring program that is envisaged under the MLR EWP trial. In addition, the
approach may reveal factors that are heavily influencing fish community structure over the three
year sampling period represented in this report. As ‘before’ flow data, the approach can also be
applied to comparing pre and post EWP data and may be useful for determining the numbers
and locations of sites can be used for post flow monitoring.
Multivariate analyses of fish community data were undertaken using non-metric
multidimensional scaling (NMDS); i.e. a means to cluster similar sites with similar fish
communities. NMDS was performed using PC-ORD v.5.12 (McCune and Mefford 2006) (Bray-
Curtis (1957) distance measure, 40 real runs, 400 iterations). Measured environmental
variables, water quality parameters, and flow metrics such as maximum flow, average and total
flow were correlated to the axes of the NMDS to identify which variables co-vary with fish
community. NMDS data was plotted with environmental variables that correlated with fish
assemblage axes at an R-squared value of greater than 0.1. Analysis was conducted
independently for each EWP reach and plots presented show the relationship across pools and
sites based on fish community data, with correlated vectors representing the degree and
direction of influence that they have on the data.

McNeil et al. 2011 Fish and EWPs in the WMLR
29
3. RESULTS
3.1. South Para River
The fish community in the South Para River showed the lowest species richness of the three
target catchments with nine species caught in total throughout the survey (Table 7). Only four
of the seven expected native species were caught with five introduced species present.
The distribution of species in the South Para River varied along a longitudinal gradient. Only
flathead gudgeon and redfin perch were present throughout the steep gorge section upstream
of Nolan’s extending to the Barossa Diversion Weir at the top of the reach. Downstream of
Parra Wirra at Nolan’s, gambusia became a significant component of the fish assemblage, and
although not caught in the main river channel, mountain galaxias were also captured in the
Tenafeate Creek tributary.
The presence of only two species, redfin perch and flathead gudgeon, upstream of Nolan’s lead
to the inclusion of a downstream site at Woodlands weir in year two. At Woodlands Weir,
introduced tench, goldfish and carp were caught. Two native diadromous species in common
galaxias and congolli were notable records, however both were reportedly translocated into the
reach from below Gawler Weir during spring 2006 by the “Friends of the Gawler River” (Adrian
Shackley, FOTGR, pers. Comm.).
NMDS orders sites that are characterized by multiple species so that similar sites are near each
other and dissimilar sites are farther from each other. The relationships between the sites are
then characterized graphically on the NMDS plot. Environmental covariates can then be overlain
on the NMDS plot to explore relationships between species distribution and environmental
variables. Patterns in the South Para fish community in the NMDS were associated with a weak
salinity gradient upstream to downstream with a coefficient of determination (R2) greater than
0.1 (Figure 19) but data deficiencies in the hydrograph meant that no strong relationship was
established between flow and fish community. In other words, there were no flow correlates and
only salinity (and a very weak temperature relationship) that were capable of explaining 10% of
the variation in fish assemblage. This was largely due to the small number of replicates and the
lack of contrast in the flow regime. There was a strong distinction between the upstream sites
(South Para Weir and Para Wirra) and the downstream sites (Nolan’s and Woodlands Weir)
based primarily around the presence or absence of gambusia.

McNeil et al. 2011 Fish and EWPs in the WMLR
30
Table 7. Taxa which were present (P) and spawning (s) for each site and season in the South Para River. The columns of native freshwater fish taxa are shaded green, those of exotic taxa shaded red and those of marine/estuarine taxa shaded blue.
Site
Sam
plin
g S
easo
n *
Com
mon
ga
laxi
as
Mou
ntai
n ga
laxi
as
Flat
head
gu
dgeo
n
Gam
busi
a
Red
fin p
erch
Gol
dfis
h
Car
p
Tenc
h
Con
golli
South Para Weir
2006A P P 2006S P P
Para Wirra 2006A P P 2006S Pss P 2007A P 2007S P P 2008A P P 2008S P P
Nolan’s 2006A P P P P 2006S P P P 2007A P P P P 2007S P P P 2008A P P P 2008S P P P
Woodlands Weir
2007A Ps P P P 2007S P P P P P P P 2008A P P P 2008S P P P P P
* A – Autumn, S – Spring
Figure 19. NMDS ordination of fish communities in the South Para River from autumn 2006 to spring 2008, overlain with correlated environmental vectors (R2>0.1) and labelled by site.
DO
Cond
pH
Temp
TotFloMaxFlo
Axis 1
Axi
s 3
SiteSouth Para WeirPara WirraNolan'sWoodlands Weir

McNeil et al. 2011 Fish and EWPs in the WMLR
31
3.1.1. South Para Weir
3.1.1.1. Site assessment
The South Para Weir site was located between the Plum Quarry track and the Barossa
Diversion Weir, immediately downstream of the EWR flow release point. This site was
dominated by dense riparian vegetation primarily of bottlebrush and redgum, and possessed a
substrate dominated by bedrock and cobbles with mud present only at Pool 1 (Table 8). This
site was somewhat difficult to access due to weeds and riparian vegetation and steep valley
sides.
Table 8. Habitat characteristics of the three monitoring pools at South Para Weir in the South Para River.
South Para Weir Substrate size (mm) Riparian cover (%) Snags Absolute max. depth (m)
Pool 1 10+ 25 1 2.5 Pool 2 10+ 30 0 1.5 Pool 3 10+ 60 0 1.2
Pool 1 was the deepest pool in the South Para Weir site. It was surrounded by dense riparian
vegetation primarily of bottlebrush and redgum, and possessed a substrate dominated by
bedrock and cobbles with some soil banks (Figure 20). Floods in November 2005 had scoured
Phragmites beds and there were weeds rapidly regenerating in autumn 2006. Since that flood,
there was very little flow before the autumn or spring 2006 surveys and there was no flow at the
time of each survey. The pool had stable dissolved oxygen, pH and temperature for both
surveys, while salinity almost doubled between the two surveys (Table 9).
Figure 20. South Para Weir Pool 1 in spring 2006.
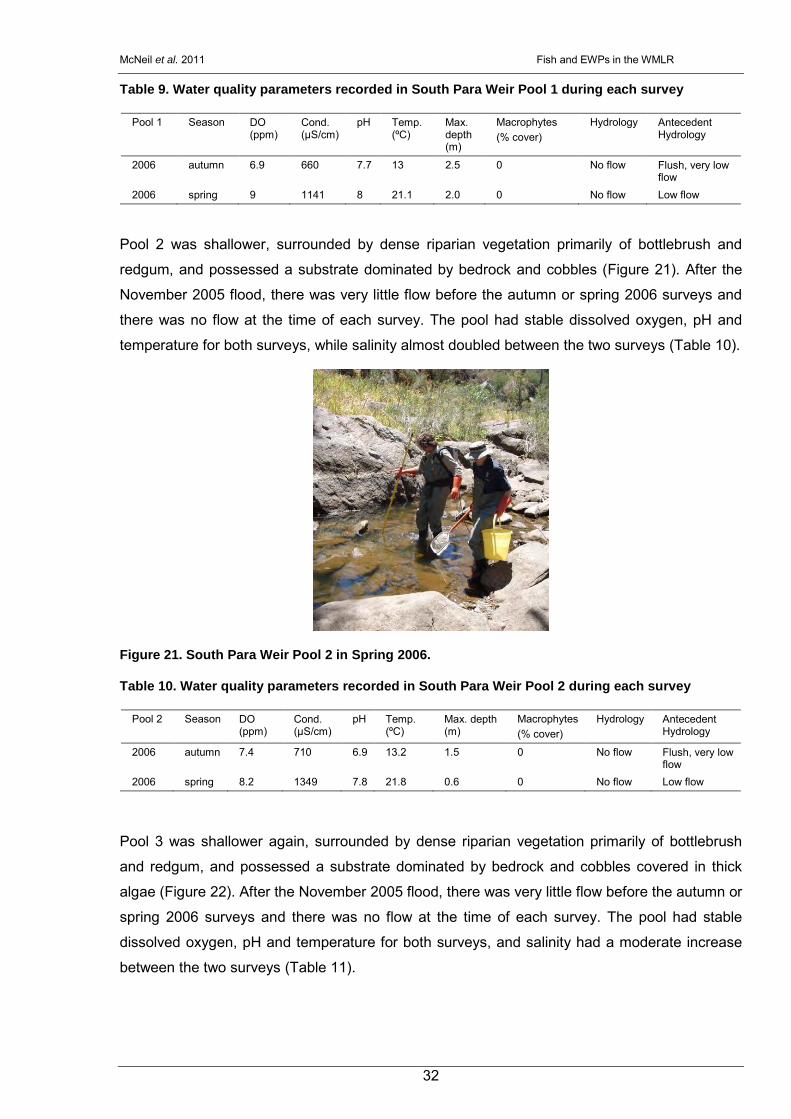
McNeil et al. 2011 Fish and EWPs in the WMLR
32
Table 9. Water quality parameters recorded in South Para Weir Pool 1 during each survey
Pool 1 Season DO (ppm)
Cond. (μS/cm)
pH Temp. (ºC)
Max. depth (m)
Macrophytes (% cover)
Hydrology Antecedent Hydrology
2006 autumn 6.9 660 7.7 13 2.5 0 No flow Flush, very low flow
2006 spring 9 1141 8 21.1 2.0 0 No flow Low flow
Pool 2 was shallower, surrounded by dense riparian vegetation primarily of bottlebrush and
redgum, and possessed a substrate dominated by bedrock and cobbles (Figure 21). After the
November 2005 flood, there was very little flow before the autumn or spring 2006 surveys and
there was no flow at the time of each survey. The pool had stable dissolved oxygen, pH and
temperature for both surveys, while salinity almost doubled between the two surveys (Table 10).
Figure 21. South Para Weir Pool 2 in Spring 2006.
Table 10. Water quality parameters recorded in South Para Weir Pool 2 during each survey
Pool 2 Season DO (ppm)
Cond. (µS/cm)
pH Temp. (ºC)
Max. depth (m)
Macrophytes (% cover)
Hydrology Antecedent Hydrology
2006 autumn 7.4 710 6.9 13.2 1.5 0 No flow Flush, very low flow
2006 spring 8.2 1349 7.8 21.8 0.6 0 No flow Low flow
Pool 3 was shallower again, surrounded by dense riparian vegetation primarily of bottlebrush
and redgum, and possessed a substrate dominated by bedrock and cobbles covered in thick
algae (Figure 22). After the November 2005 flood, there was very little flow before the autumn or
spring 2006 surveys and there was no flow at the time of each survey. The pool had stable
dissolved oxygen, pH and temperature for both surveys, and salinity had a moderate increase
between the two surveys (Table 11).

McNeil et al. 2011 Fish and EWPs in the WMLR
33
Figure 22. South Para Weir Pool 3
Table 11. Water quality parameters recorded in Para Weir Pool 3 during each survey
Pool 3 Season DO (ppm)
Cond. (μS/cm)
pH Temp. (ºC)
Max. depth (m)
Macrophytes (% cover)
Hydrology Antecedent Hydrology
2006 autumn 9.9 581 7.8 14.2 1.2 0 No flow Flush, very low flow
2006 spring 11 889 8.8 18.8 0.7 0 No flow Low flow
3.1.1.2. Water Quality
Salinity was the only water quality parameter to be high enough to impact on aquatic biota.
Whilst levels recorded here may be high enough to impact on particularly sensitive invertebrate
species, all levels recorded are suitable for the maintenance of native fish.
3.1.1.3. Hydrology
The water level was low for both surveys conducted at this site in autumn 2006, on May 10 and
spring 2006, conducted on November 7. The survey pools were disconnected during both
surveys. The gauge at South Para Weir was damaged during high flows in November 2005 and
no hydrological data was available over the duration that the present surveys were being
conducted.
3.1.1.4. Fish community
Only two fish taxa were captured at South Para Weir during the two surveys conducted at this
site, in autumn 2006 and spring 2006 (Figure 23). In autumn 2006 redfin perch were more
commonly captured than flathead gudgeon, but in spring 2006 this dominance pattern was
reversed. Surveying of South Para Weir was discontinued after 2006, as the species poor fish
community at this site was similar to that at Para Wirra.

McNeil et al. 2011 Fish and EWPs in the WMLR
34
Figure 23. Abundances of each taxa present in the fish communities at South Para Weir over two survey seasons. Surveys were discontinued at this site after spring 2006.
3.1.2. Para Wirra
3.1.2.1. Site assessment
Para Wirra sites were relatively inaccessible and as a result, riparian vegetation was largely
intact and was perhaps the most ‘natural’ in condition of any of the survey sites. Riparian
stands of bottlebrush and redgum overhung most pools, although due to the predominance of
bedrock and cliff edges on pool margins, large sections were naturally devoid of riparian
vegetation, and riparian cover was consistently at around 30% (Table 12). Substrate ranged
from cobble and gravel in Pool 1 with increasing bedrock in Pool 2 and predominantly bedrock
in Pool 3. Pools increased in depth in a downstream fashion with Pool 1 shallowest and Pool 3
deepest. Snags were not present in any of the pools.
Table 12. Habitat characteristics of the three monitoring pools at Para Wirra in the South Para River.
Para Wirra Substrate size (mm) Riparian cover (%) Snags Absolute max. depth (m)
Pool 1 10+ 25 0 1.2 Pool 2 Bedrock-10+ 30 0 2.0 Pool 3 Bedrock-10+ 30 0 2.5
Autumn 06 Spring 06 Autumn 07 Spring 07 Autumn 08 Spring 08
No.
of i
ndiv
idua
ls
0
50
100
150
200
250
300Tench Congolli Common Galaxias Goldfish European Carp Redfin Eastern Gambusia Flathead Gudgeon

McNeil et al. 2011 Fish and EWPs in the WMLR
35
Pool 1 (Figure 24) was the shallowest of the three Parra Wirra pools with water depth fluctuating
widely between seasons, ranging from 1.2m when full to 0.5m during dry periods (Table 13).
Although marginally salty, dissolved oxygen and pH were fairly consistent with only slight acidity
occurring in spring 2007. This pool had a tendency to become very warm in spring; with
temperature rising above 30˚C in spring 2007 associated with low pH and slightly reduced
oxygen levels.
There were no macrophytes in this pool and stream flows were recorded only in the autumn
2007 and 2008 surveys. Antecedent hydrology was predominantly very low flows with the
exception of large flushes in autumn 2006 and low flows prior to autumn 2008. Pool 1 was a
watering spot for kangaroos and red-bellied black snakes were commonly found in the water or
on rocks and occasionally caught in fyke nets.
Figure 24. Para Wirra Pool 1 in a) spring 2007 and b) autumn 2008.
Table 13. Water quality parameters recorded in Para Wirra Pool 1 during each survey.
Pool 1 Season DO (ppm)
Cond. (μS/cm)
pH Temp. (ºC)
Max. depth (m)
Macrophytes (% cover)
Hydrology Antecedent Hydrology
2006 autumn 8 1030 8 12.1 0.5 0 No flow Flushes 2006 spring 10 2201 8 23.0 1.2 0 No flow Very low flows 2007 autumn 10 700 8 13.4 1.2 0 Low flow Very low flows 2007 spring 6 1767 5 30.5 0.7 0 No flow Very low flows 2008 autumn 11 900 8 16.7 1.2 0 Low flow Low flows 2008 spring 7 1323 8 21.9 0.5 0 No Flow Very low flows
Pool 2, situated on a sharp bend was bordered by sharp bedrock cliff on the outside (right) bank
with sand and rocks on the depositional inside bank (Figure 25). Whilst a deep hole (up to 2 m)
was present under the cliff, the depth across the pool was generally no more than 1 m. The

McNeil et al. 2011 Fish and EWPs in the WMLR
36
maximum depth fluctuated across seasons becoming as shallow as 0.5 m during the dry spring
of 2007 (Table 14).
Salinity fluctuated throughout the study, becoming mildly saline during spring each year and
also in autumn 2008. Temperatures became moderately warm in spring but did not peak as
sharply as Pool 1. Pool 2 became somewhat acidic during spring 2007, as with Pool 1 during
the dry summer of 2007. A few very small individual Vallisneria (ribbon weed) were present in
2006 in the shallower area at the downstream end of the pool, but subsequently disappeared
from the pool. Stream flows were recorded only in the autumn 2007 and 2008 surveys and
antecedent hydrology was predominantly very low flows with the exception of large flushes in
autumn 2006 and low flows prior to autumn 2008.
Figure 25. Para Wirra Pool 2 in a) spring 2007 and b) autumn 2008.
Table 14. Water quality parameters recorded in Para Wirra Pool 2 during each survey.
Pool 2 Season DO (ppm)
Cond. (μS/cm)
pH Temp. (ºC)
Max. depth (m)
Macrophytes (% cover)
Hydrology Antecedent Hydrology
2006 autumn 10 1130 8 12.3 2.0 0.5 No flow Flushes 2006 spring 9 2060 8 22.2 0.6 0.1 No flow Very low
flows 2007 autumn 9 689 8 14.2 1.8 0 Low flow Very low
flows 2007 spring 8 1816 5 24.6 0.5 0 No flow Very low
flows 2008 autumn 12 1400 8 16.3 1.5 0 Low flow Low flows 2008 spring 8.6 1293 8.1 21.3 0.8 0 No flow Very low
flows

McNeil et al. 2011 Fish and EWPs in the WMLR
37
Pool 3 (Figure 26) was the largest and deepest and coolest (Table 15) of the three Parra Wirra
pools with a vertical bedrock cliff forming the inside (left) bank and rock and mud forming the
right bank, increasing at the downstream end of the pool. Pool depth fluctuated between 2.5m
in autumn and ~1m in spring (Table 15), with deep holes present under the cliff face but a depth
of 1-1.5 m was more common across the pool.
Conductivity was consistently over 1000 μS/cm becoming fresher in autumn 2007. Pool 3 also
became acidic during the spring of 2007. Vallisneria was present at the downstream end of the
pool were siltation was highest although macrophyte cover was never high. Similar to Pool 1
and Pool 2 stream flows were recorded only in the autumn 2007 and 2008 surveys and
antecedent hydrology was predominantly very low flows with the exception of large flushes in
autumn 2006 and low flows prior to autumn 2008.
Figure 26. Para Wirra Pool 3 in a) spring 2007 and b) autumn 2008.
Table 15. Water quality parameters recorded in Para Wirra Pool 3 during each survey.
Pool 3 Season DO (ppm)
Cond. (μS/cm)
pH Temp. (ºC)
Max. depth (m)
Macrophytes (% cover)
Hydrology Antecedent Hydrology
2006 autumn 8 1435 8 12.5 2.5 5 No flow Flushes 2006 spring 8 1970 8 16.8 0.7 1 No flow Very low
flows 2007 autumn 9 688 8 14.8 2.5 0 Low flow Very low
flows 2007 spring 7 2065 4 23.2 1.0 0 No flow Very low
flows 2008 autumn 8 1100 6 15.8 2.5 5 Low flow Low flows 2008 spring 7.95 1510 7.6 21.7 1 0 No Flow Very low
flows

McNeil et al. 2011 Fish and EWPs in the WMLR
38
3.1.2.2. Water Quality
The acidification of pools during extremely low flows in 2007 is likely to impact on fish health as
levels recorded here can cause damage to gill tissues and lead to an inability to cope with
hypoxic episodes and in extreme cases to suffocation (Gehrke et al. 1993). Salinity was
frequently high enough to impact on sensitive invertebrate species, but all levels recorded are
suitable for the maintenance of native fish.
3.1.2.3. Hydrology
The water level at Para Wirra was low throughout the survey period, and connectivity between
the sites was intermittent. The survey pools were disconnected during autumn and spring 2006.
The same pattern was followed in 2007 and 2008, where low flows reconnected the pools in
autumn followed by a disconnection in spring.
There was no recordable flow at Para Wirra from September 8, 2006, to spring 2006, on
November 10 (Figure 27). This lack of flow continued over summer and to late April 2007.
There were very low flows during the first week of May, followed by two weeks of no recordable
flow, and another three days of very low flows (<1 ML/day) immediately prior to the autumn
2007 surveys, conducted on May 24. Over winter the flow was very low, only rarely exceeding
1 ML/day and with a number of weeks in which no flow was recorded.
From late August until the spring 2007 surveys, conducted on December 12, there was no flow
recorded at the Para Wirra gauge. Flows did not resume at the site until the end of April, but this
flow was only a brief pulse, and there was no recordable flow during the week immediately prior
to the autumn 2008 surveys, conducted on May 9. Low flow resumed in July 2008, ceased in
October 2008 and did not recommence by the time of the final survey November 25.
3.1.2.4. Fish community
Only two species of fish were captured at Para Wirra (Figure 28). Large numbers of the native
flathead gudgeon were captured during each of the first four surveys, from autumn 2006 to
spring 2007. Changes in community structure amongst pools and survey seasons were largely
driven by fluctuations in the numbers of these fish. The largest total numbers of flathead
gudgeon occurred during autumn 2006 and spring of both 2006 and 2007, when the pools were
not flowing. In contrast, higher numbers of redfin perch were recorded during autumn and spring
2008.

McNeil et al. 2011 Fish and EWPs in the WMLR
39
Figure 27. Hydrograph for flow in South Para River at Para Wirra. Flow data (ML/day) was collected downstream of Para Wirra Recreational Park (gauge number A5051003) from September 8, 2006 (indicated by blue arrow). The timing of each survey season is also shown above the figure.
Figure 28. Abundances of each taxa present in the fish communities at Para Wirra (South Para River) over six survey seasons.
Jan/
05
Mar
/05
M
ay/0
5
Jul/0
5
Sep/
05
Nov/0
5
Jan/
06
Mar
/06
M
ay/0
6
Jul/0
6
Sep/
06
Nov/0
6
Jan/
07
Mar
/07
M
ay/0
7
Jul/0
7
Sep/
07
Nov/0
7
Jan/
08
Mar
/08
M
ay/0
8
Jul/0
8
Sep/
08
Nov/0
8
Jan/
09
ML/
day
0
10
20
30
40
50
1000
2000
3000
2006
A
2006
S
2007
S
2007
A
2008
A
2008
S
Autumn 06 Spring 06 Autumn 07 Spring 07 Autumn 08 Spring 08
No.
of i
ndiv
idua
ls
0
100
200
300
400
500
600
700
800
Redfin Flathead Gudgeon Perch

McNeil et al. 2011 Fish and EWPs in the WMLR
40
3.1.2.5. Fish population structure
There were high captures of small individuals in both autumn and spring of 2006. Despite a
lower number of flathead gudgeon being captured in autumn 2007, the largest numbers of small
individuals and a substantial number of medium to large individuals were captured in spring
2007. Only two individuals (one medium-sized and one large) were captured during autumn
2008. In the spring 2008, only medium to large flathead gudgeon were present. A wide range of
sizes of flathead gudgeon were captured at Para Wirra in 2006-2007 (Figure 29).
Small numbers of medium to large redfin perch were captured at Para Wirra in 2006, but none
were captured in autumn 2007 and only one redfin perch was captured in spring 2007. In
autumn 2008 large numbers of small redfin perch were captured at Para Wirra, and in spring the
same cohort was present in similar numbers with no larger or smaller fish present.

McNeil et al. 2011 Fish and EWPs in the WMLR
41
Figure 29. Lengths of flathead gudgeon (P. grandiceps) and redfin perch (P. fluviatilis) at Para Wirra (South Para River) over six survey seasons, from autumn 2006 to spring 2008. The flow at the time of the survey and major hydrological pattern since the last survey are shown for each season.
Size class (mm)
0-5
6-10
11-1
516
-20
21-2
526
-30
31-3
536
-40
41-4
546
-50
51-5
556
-60
61-6
566
-70
71-7
576
-80
81-8
586
-90
91-9
596
-100
>100
0
50
100
Size class (mm)
0-5
6-10
11-1
516
-20
21-2
526
-30
31-3
536
-40
41-4
546
-50
51-5
556
-60
61-6
566
-70
71-7
576
-80
81-8
586
-90
91-9
596
-100
>100
0
50
100
Size class (mm)
0-5
6-10
11-1
516
-20
21-2
526
-30
31-3
536
-40
41-4
546
-50
51-5
556
-60
61-6
566
-70
71-7
576
-80
81-8
586
-90
91-9
596
-100
>100
0
50
Size class (mm)
0-5
6-10
11-1
516
-20
21-2
526
-30
31-3
536
-40
41-4
546
-50
51-5
556
-60
61-6
566
-70
71-7
576
-80
81-8
586
-90
91-9
596
-100
>100
0
50
100
150
200
250
Size class (mm)
0-5
6-10
11-1
516
-20
21-2
526
-30
31-3
536
-40
41-4
546
-50
51-5
556
-60
61-6
566
-70
71-7
576
-80
81-8
586
-90
91-9
596
-100
>100
0
50
Si l ( )
0-5
6-10
11-1
516
-20
21-2
526
-30
31-3
536
-40
41-4
546
-50
51-5
556
-60
61-6
566
-70
71-7
576
-80
81-8
586
-90
91-9
596
-100
>100
0
50
i) Autumn 2006Disconnected pools, flushing flows over summer
ii) Spring 2006Disconnected pools, very lowflows over winter
Num
ber o
f ind
ivid
uals
iv) Spring 2007Disconnected pools, very lowflows over winter
vi) Spring 2008Low flow, lowflows over winter
iii) Autumn 2007Low flow, very low flows over summer
v) Autumn 2008Low flow, low flows over summer
0
50
0
50
0
50
0
50
0
50
0-10
11-2
021
-30
31-4
041
-50
51-6
061
-70
71-8
081
-90
91-1
0010
1-11
011
1-12
012
1-13
013
1-14
014
1-15
015
1-16
016
1-17
017
1-18
018
1-19
019
1-20
020
1-21
021
1-22
022
1-23
023
1-24
024
1-25
025
1-26
026
1-27
027
1-28
028
1-29
029
1-30
0
0
50
i) Autumn 2006Disconnected pools, flushing flows over summer
ii) Spring 2006Disconnected pools, very lowflows over winter
iv) Spring 2007Disconnected pools, very lowflows over winter
vi) Spring 2008Low flow, lowflows over winter
iii) Autumn 2007Low flow, very low flows over summerNo fish collected
v) Autumn 2008Low flow, low flows over summer

McNeil et al. 2011 Fish and EWPs in the WMLR
42
3.1.3. Nolan’s
3.1.3.1. Site assessment
The Nolan’s site was located in a more accessible section of the South Para Gorge less than
two kilometres downstream from the Para Wirra Recreation Park. The site was on a cattle
grazing property and the surrounding vegetation was either cleared completely or impacted by
grazing. Riparian vegetation around the pools consisted predominantly of large remnant
redgums and fringing juncus (common rush). The substrate in pools 1 and 2 was predominantly
cobble while pool 2 was mostly bedrock and large cobble (Table 16). There was only one snag
observed at the Nolan’s site in pool 2.
Table 16. Habitat characteristics of the three monitoring pools at Nolan’s in the South Para River.
Nolan’s Substrate size (mm) Riparian cover (%) Snags Absolute max. depth (m)
Pool 1 5-10+ 70 None 1.5 Pool 2 10+-Bedrock 100 1 1.5 Pool 3 5-10+ 55 None 1.5
Pool 1 (Figure 30) was the largest pool at Nolan’s site with depths ranging from 1.5m to 1.0m.
The pool became marginally salty each spring but pH and dissolved oxygen remained stable
(Table 17). There were no submerged or emergent macrophytes recorded at this site and the
hydrology during sampling was usually no flow or very low flow (Table 17). The antecedent
flows were predominantly very low flows with the exceptions of small freshes prior to the autumn
2006 and 2008 surveys. Pool 1 had a pump to extract water for farming purposes.
Figure 30. Nolan’s Pool 1 in a) spring 2007 and b) autumn 2008.

McNeil et al. 2011 Fish and EWPs in the WMLR
43
Table 17. Water quality parameters recorded in Nolan’s Pool 1 during each survey.
Pool 1
Season DO (ppm)
Cond. (μS/cm)
pH Temp. (ºC)
Max. depth (m)
Macrophytes (% cover)
Hydrology Antecedent Hydrology
2006 autumn 10 1700 8 10.3 1.4 0 Low flow Flush, very low flow 2006 spring 8 1909 8 24.6 1.0 0 No flow Low flow 2007 autumn 8 1793 8 14.4 1.3 0 Low flow Very low flow 2007 spring 7 2490 6 24.5 1.5 0 No flow Very low flow 2008 autumn 8 1400 6 13.9 1.0 0 No flow Fresh, very low flow 2008 spring 6 3395 7.6 20.7 1.0 0 No flow Low flow
Pool 2 (Figure 31) was a smaller pool and was prone to shrink down into a series of small
shallow pools with depths ranging from 1.5m to 0.2m. The pool became marginally salty each
spring and especially salty in spring 2008 when it was almost dry, but pH and dissolved oxygen
remained stable. There were no submerged or emergent macrophytes recorded at this site and
the hydrology during sampling was usually no flow or very low flow (Table 18). The antecedent
flows were predominantly very low flows with the exceptions of small freshes prior to the autumn
2006 and 2008 surveys. There is a small cave above pool 2 containing aboriginal paintings
protected by a locked cage.
Figure 31. Nolan’s Pool 2 in a) spring 2007 and b) autumn 2008.
Table 18. Water quality parameters recorded in Nolan’s Pool 2 during each survey.
Pool 2
Season DO (ppm)
Cond. (μS/cm)
pH Temp. (ºC)
Max. depth (m)
Macrophytes (% cover)
Hydrology Antecedent Hydrology
2006 autumn 12 1680 8 10.1 1.1 0 Low flow Flush, very low flow 2006 spring 8 2010 8 22.5 1.3 0 No flow Low flow 2007 autumn 7 1970 8 13.9 1.5 0 Low flow Very low flow 2007 spring 5 2730 6 23.5 0.3 0 No flow Very low flow 2008 autumn 9 1800 6 14.7 1.0 0 No flow Fresh, very low flow 2008 spring 6 7550 7.3 18.1 0.2 0 No flow Low flow

McNeil et al. 2011 Fish and EWPs in the WMLR
44
Pool 3 (Figure 32) was a smaller pool and was also prone to shrink down into a series of small
shallow pools with depths ranging from 1.5m to 0.3m. The pool became marginally salty each
spring but pH and dissolved oxygen remained stable. There were no submerged or emergent
macrophytes recorded at this site and the hydrology during sampling was usually no flow or very
low flow. The antecedent flows were predominantly very low flows with the exceptions of small
freshes prior to the autumn 2006 and 2008 surveys. Red-bellied black snakes were occasionally
caught in fyke nets.
Figure 32. Nolan’s Pool 3 in a) spring 2007 and b) autumn 2008.
Table 19. Water quality parameters recorded in Nolan’s Pool 3 during each survey.
3.1.3.2. Water Quality
Salinity was the only water quality parameter to be high enough to impact on aquatic biota.
Whilst levels recorded here may be high enough to impact on sensitive invertebrate species, all
levels recorded are suitable for the maintenance of native fish.
Pool 3 Season DO (ppm)
Cond. (μS)
pH Temp. (ºC)
Max. depth (m)
Macrophytes (% cover)
Hydrology Antecedent Hydrology
2006 autumn 10 1723 7 11 1.4 0 Low flow Flush, very low flow 2006 spring 8 2300 7 23.0 0.6 0 No flow Low flow 2007 autumn 7 1979 8 12.3 1.5 0 Low flow Very low flow 2007 spring 6 2740 5 25.4 0.3 0 No flow Very low flow 2008 autumn 13 1400 7 14.9 0.7 0 No flow Fresh, very low flow 2008 spring 9 1870 7.6 23.1 0.4 0 No flow Low flow

McNeil et al. 2011 Fish and EWPs in the WMLR
45
3.1.3.3. Hydrology
During 2006 and 2007 the survey pools were connected by low flow in each autumn, but were
disconnected in each spring. In 2008 the pools were disconnected during both autumn and
spring. There was very low flow (average of <1 ML/day) recorded upstream of Nolan’s over the
first seven weeks in 2006, but no data was available from this gauge between February 22 and
October 27 of that year (Figure 33). From this time until spring 2006 surveys, conducted on
November 9, there was no recordable flow. This lack of flow continued through summer and on
to the end of April 2007. The flow throughout May was generally below 1 ML/day, up to autumn
2007 surveys, conducted on May 24. Other than a few pulses of flow above 10 ML/day, the
flow was low throughout winter. Flow declined even further, with an average of <1 ML/day from
the start of September to mid-October, no readable flow from mid-October to the start of
November, ten days of flow under 0.5 ML/day in early November, and no readable flow from
mid-November until spring 2007 surveys, conducted on December 11. This lack of flow
continued over summer, until April 21, 2008. There was a fresh in late April, followed by low
flows at the site up to the autumn 2008 surveys, conducted on May 6. Very low flows continued
over winter, ceased in October and did not recommence by the time of the final survey on
November 25.
Figure 33. Hydrograph for flow at Nolan’s in the South Para River. Flow data (ML/day) from upstream of Tenafeate Creek (A5051004) is reported from January 1, 2005, but there was no data collected from February 22 to October 27, 2006. The timing of each survey season is also shown above the figure.
Jan/
05
Mar
/05
M
ay/0
5
Jul/0
5
Sep/
05
Nov
/05
Ja
n/06
M
ar/0
6
May
/06
Ju
l/06
Se
p/06
N
ov/0
6
Jan/
07
Mar
/07
M
ay/0
7
Jul/0
7
Sep/
07
Nov
/07
Ja
n/08
M
ar/0
8
May
/08
Ju
l/08
Se
p/08
N
ov/0
8
Jan/
09
ML/
day
0
50
100
150
2001000
2006
A
2006
S
2007
S
2007
A
2008
A
2008
S

McNeil et al. 2011 Fish and EWPs in the WMLR
46
3.1.3.4. Fish community
Three native and two introduced fish species were captured at Nolan’s over the five survey
seasons (Figure 34). Distinct changes in the structures of fish communities between seasons in
each year were driven largely by fluctuations in the numbers of gambusia captured during each
survey. Gambusia was one of the most regularly captured species across all surveys, with
particularly high numbers during each spring survey.
Seasonal changes in community structure in 2006 and 2007 were associated with pools
changing from being connected by low flows in each autumn to becoming disconnected and
shallow in each spring. Relatively high numbers of flathead gudgeon were captured at this site
in 2006 and 2007, particularly in autumn. However, in autumn of 2008 only two individuals of
this species were captured and the communities from different pools at that time formed a group
which was discrete from the previous two years.
This survey was the only one preceded by a fresh, but also the only autumn during which the
pools were not connected at the time of surveys. Four mountain galaxias were captured whilst
electrofishing in riffles in autumn 2006, and two common galaxias were captured in the
downstream pool in autumn 2007. Small numbers of redfin perch were captured throughout the
surveys. Flathead gudgeon were the only dominant native fish regularly captured.
Figure 34. Abundances of each taxa present in the fish communities at Nolan’s (South Para River) over six survey seasons.
Autumn 06 Spring 06 Autumn 07 Spring 07 Autumn 08 Spring 08 0
100
200
300
400
2000 4000 6000
Flathead Gudgeon
Common Galaxias Redfin Perch Gambusia
No
of In
divi
dual
s
Mountain Galaxias

McNeil et al. 2011 Fish and EWPs in the WMLR
47
3.1.3.5. Fish population structure
During the first three survey seasons, from autumn 2006 to autumn 2007, there were high
numbers of flathead gudgeon consisting of a wide range of size classes (Figure 35). Although
there was only a small number of medium to large individuals captured in spring 2007, this was
also the season with the highest number of small individuals. In autumn 2008 there were only
two small flathead gudgeon captured from the upstream pool. In spring 2008 a moderate
number of new recruits were caught, but the number was well down on previous recruitment
levels. Only two adult common galaxias were captured in autumn 2007 and only four adult
mountain galaxias in autumn 2006.
There were relatively large numbers of small and medium gambusia captured during all surveys
(Figure 36). During each spring survey higher numbers of small individuals were captured than
in autumn. Although only small numbers of medium to large redfin perch were captured across
all of the surveys in autumn, there were large numbers of small individuals, as well as small
numbers of larger individuals, captured during all spring surveys (Figure 37).
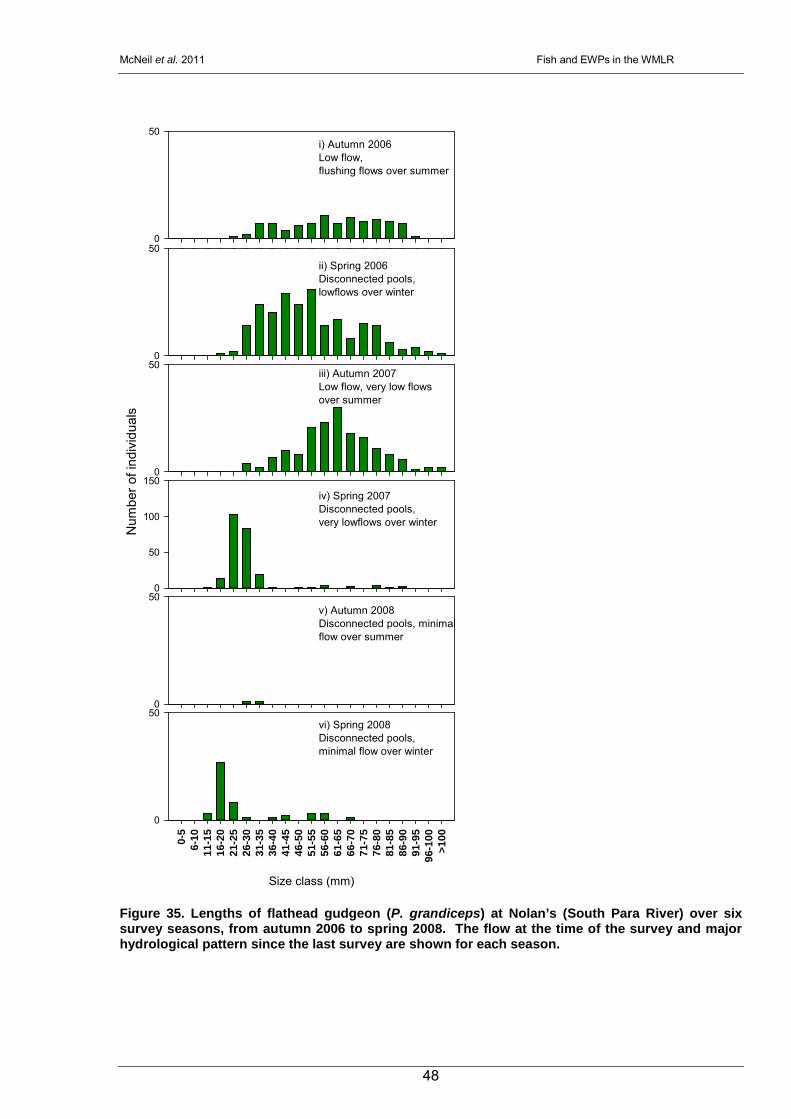
McNeil et al. 2011 Fish and EWPs in the WMLR
48
Figure 35. Lengths of flathead gudgeon (P. grandiceps) at Nolan’s (South Para River) over six survey seasons, from autumn 2006 to spring 2008. The flow at the time of the survey and major hydrological pattern since the last survey are shown for each season.
Size class (mm)
0-5
6-10
11-1
516
-20
21-2
526
-30
31-3
536
-40
41-4
546
-50
51-5
556
-60
61-6
566
-70
71-7
576
-80
81-8
586
-90
91-9
596
-100
>100
0
50
Size class (mm)
0-5
6-10
11-1
516
-20
21-2
526
-30
31-3
536
-40
41-4
546
-50
51-5
556
-60
61-6
566
-70
71-7
576
-80
81-8
586
-90
91-9
596
-100
>100
0
50
Size class (mm)
0-5
6-10
11-1
516
-20
21-2
526
-30
31-3
536
-40
41-4
546
-50
51-5
556
-60
61-6
566
-70
71-7
576
-80
81-8
586
-90
91-9
596
-100
>100
0
50
Size class (mm)
0-5
6-10
11-1
516
-20
21-2
526
-30
31-3
536
-40
41-4
546
-50
51-5
556
-60
61-6
566
-70
71-7
576
-80
81-8
586
-90
91-9
596
-100
>100
0
50
100
150
Size class (mm)
0-5
6-10
11-1
516
-20
21-2
526
-30
31-3
536
-40
41-4
546
-50
51-5
556
-60
61-6
566
-70
71-7
576
-80
81-8
586
-90
91-9
596
-100
>100
0
50
Size class (mm)
0-5
6-10
11-1
516
-20
21-2
526
-30
31-3
536
-40
41-4
546
-50
51-5
556
-60
61-6
566
-70
71-7
576
-80
81-8
586
-90
91-9
596
-100
>100
0
50
i) Autumn 2006Low flow, flushing flows over summer
ii) Spring 2006Disconnected pools, lowflows over winter
iv) Spring 2007Disconnected pools, very lowflows over winter
vi) Spring 2008Disconnected pools, minimal flow over winter
iii) Autumn 2007Low flow, very low flows over summer
v) Autumn 2008Disconnected pools, minimal flow over summer
Num
ber o
f ind
ivid
uals

McNeil et al. 2011 Fish and EWPs in the WMLR
49
Figure 36. Lengths of gambusia (G. holbrooki) at Nolan’s (South Para River) over six survey seasons, from autumn 2006 to spring 2008. The flow at the time of the survey and major hydrological pattern since the last survey are shown for each season.
Size class (mm)
0-5
6-10
11-1
516
-20
21-2
526
-30
31-3
536
-40
41-4
546
-50
51-5
556
-60
61-6
566
-70
71-7
576
-80
0
50
Size class (mm)
0-5
6-10
11-1
516
-20
21-2
526
-30
31-3
536
-40
41-4
546
-50
51-5
556
-60
61-6
566
-70
71-7
576
-80
0
50
100
150
Size class (mm)
0-5
6-10
11-1
516
-20
21-2
526
-30
31-3
536
-40
41-4
546
-50
51-5
556
-60
61-6
566
-70
71-7
576
-80
0
50
Size class (mm)
0-5
6-10
11-1
516
-20
21-2
526
-30
31-3
536
-40
41-4
546
-50
51-5
556
-60
61-6
566
-70
71-7
576
-80
Num
ber o
f ind
ivid
uals
0
50
100
Size class (mm)
0-5
6-10
11-1
516
-20
21-2
526
-30
31-3
536
-40
41-4
546
-50
51-5
556
-60
61-6
566
-70
71-7
576
-80
0
50
Size class (mm)
0-5
6-10
11-1
516
-20
21-2
526
-30
31-3
536
-40
41-4
546
-50
51-5
556
-60
61-6
566
-70
71-7
576
-80
0
50
100
150
i) Autumn 2006Low flow, flushing flows over summer
ii) Spring 2006Disconnected pools, lowflows over winter
iv) Spring 2007Disconnected pools, very lowflows over winter
vi) Spring 2008Disconnected pools, minimal flow over winter
iii) Autumn 2007Low flow, very low flows over summer
v) Autumn 2008Disconnected pools, minimal flow over summer

McNeil et al. 2011 Fish and EWPs in the WMLR
50
Figure 37. Lengths of redfin perch (P. fluviatilis) at Nolan’s (South Para River) over six survey seasons, from autumn 2006 to spring 2008. The flow at the time of the survey and major hydrological pattern since the last survey are shown for each season.
Size class (mm)
0-10
11-2
021
-30
31-4
041
-50
51-6
061
-70
71-8
081
-90
91-1
0010
1-11
011
1-12
012
1-13
013
1-14
014
1-15
015
1-16
016
1-17
017
1-18
018
1-19
019
1-20
020
1-21
021
1-22
022
1-23
023
1-24
024
1-25
025
1-26
026
1-27
027
1-28
028
1-29
029
1-30
0>3
00
0
50
Size class (mm)
0-10
11-2
021
-30
31-4
041
-50
51-6
061
-70
71-8
081
-90
91-1
0010
1-11
011
1-12
012
1-13
013
1-14
014
1-15
015
1-16
016
1-17
017
1-18
018
1-19
019
1-20
020
1-21
021
1-22
022
1-23
023
1-24
024
1-25
025
1-26
026
1-27
027
1-28
028
1-29
029
1-30
0>3
00
0
50
Size class (mm)
0-10
11-2
021
-30
31-4
041
-50
51-6
061
-70
71-8
081
-90
91-1
0010
1-11
011
1-12
012
1-13
013
1-14
014
1-15
015
1-16
016
1-17
017
1-18
018
1-19
019
1-20
020
1-21
021
1-22
022
1-23
023
1-24
024
1-25
025
1-26
026
1-27
027
1-28
028
1-29
029
1-30
0>3
00
0
50
Size class (mm)
0-10
11-2
021
-30
31-4
041
-50
51-6
061
-70
71-8
081
-90
91-1
0010
1-11
011
1-12
012
1-13
013
1-14
014
1-15
015
1-16
016
1-17
017
1-18
018
1-19
019
1-20
020
1-21
021
1-22
022
1-23
023
1-24
024
1-25
025
1-26
026
1-27
027
1-28
028
1-29
029
1-30
0>3
00
Num
ber o
f ind
ivid
uals
0
50
Size class (mm)
0-10
11-2
021
-30
31-4
041
-50
51-6
061
-70
71-8
081
-90
91-1
0010
1-11
011
1-12
012
1-13
013
1-14
014
1-15
015
1-16
016
1-17
017
1-18
018
1-19
019
1-20
020
1-21
021
1-22
022
1-23
023
1-24
024
1-25
025
1-26
026
1-27
027
1-28
028
1-29
029
1-30
0>3
00
0
50
0-10
11-2
021
-30
31-4
041
-50
51-6
061
-70
71-8
081
-90
91-1
0010
1-11
011
1-12
012
1-13
013
1-14
014
1-15
015
1-16
016
1-17
017
1-18
018
1-19
019
1-20
020
1-21
021
1-22
022
1-23
023
1-24
024
1-25
025
1-26
026
1-27
027
1-28
028
1-29
029
1-30
0>3
00
0
50
i) Autumn 2006Low flow, flushing flows over summer
ii) Spring 2006Disconnected pools, lowflows over winter
iv) Spring 2007Disconnected pools, very lowflows over winter
vi) Spring 2008Disconnected pools, minimal flow over winter
iii) Autumn 2007Low flow, very low flows over summer
v) Autumn 2008Disconnected pools, minimal flow over summer

McNeil et al. 2011 Fish and EWPs in the WMLR
51
3.1.4. Woodlands Weir
3.1.4.1. Site assessment
Woodlands Weir is located in the foothills above Gawler over 5 km from where the South Para
joins up with the North Para River, becoming the Gawler River which flows out over the Adelaide
Plains towards Gulf St Vincent. The site is on cleared grazing land with only a few large remnant
redgums remaining. There is very little riparian vegetation or emergent macrophytes and the banks
are impacted by stock grazing and access to the pools. The concrete weir forms a large vertical
barrier between pool 1 above the weir and pools 2 and 3 below.
Table 20. Habitat characteristics of the three monitoring pools at Woodlands Weir in the South Para River.
Woodlands Weir Substrate size (mm) Riparian cover (%) Snags Absolute max. depth (m)
Pool 1 <1-10 <5 1 2.0 Pool 2 10+-Bedrock <5 2 2.0 Pool 3 10+-Bedrock 25 0 2.0
Pool 1 (Figure 38) was contained by Woodlands Weir itself. It was a large pool with relatively consistent depth over the four surveys. The substrate was predominantly fine sediment accumulated above the weir. The pool contained emergent macrophytes at each survey although their cover varied greatly. Salinity in the pool was quite high, and became saltier as the water evaporated and the depth decreased, but temperature, pH and dissolved oxygen were relatively stable (Table 21).
Figure 38. Woodlands Weir Pool 1 in a) spring 2007 and b) autumn 2008.

McNeil et al. 2011 Fish and EWPs in the WMLR
52
Table 21. Water quality parameters recorded in Woodlands Weir Pool 1 during each survey.
Pool 1 Season DO (ppm) Cond. (μS/cm)
pH Temp. (ºC)
Max. depth (m)
Macrophytes (% cover)
Hydrology Antecedent Hydrology
2007 autumn 13 3120 8 15.3 1.8 <5 Connected Low flows 2007 spring 11 5390 9 20.4 1.8 90 Isolated Very low flows 2008 autumn 7 9500 7 15.5 1.8 50 Isolated Very low flows 2008 spring 9.53 3600 8.54 22.7 1.5 5 Isolated Very low flows
Pool 2 (Figure 39) was directly below the weir with a large deep section scoured by water spilling
over the weir and shallower pools stretching beyond that for over 50m. The substrate was mostly
bedrock in the deeper section and then cobble further downstream. The depth was at its maximum
over the first three surveys due to a small amount of water trickling into the pool from the weir, and
remained quite deep event in isolation for the final survey. Like the other Woodlands Weir sites, the
pool was quite salty throughout the survey period. Dissolved oxygen, pH and temperature were
relatively consistent over time (Table 22).
Figure 39. Woodlands Weir Pool 2 in a) spring 2007 and b) autumn 2008.
Table 22. Water quality parameters recorded in Woodlands Weir Pool 2 during each survey.
Pool 2 DO (ppm)
Cond. (μS/cm)
pH Temp. (ºC)
Season Max. depth (m)
Macrophytes (% cover)
Hydrology Antecedent Hydrology
2007 10 3480 8 15.4 autumn 2.0 20 Connected Low flows 2007 7 6500 5 22 spring 2.0 5 Connected Very low
flows 2008 9 6500 7 17.2 autumn 2.0 6 Connected Very low
flows 2008 9 5480 7.8 21.4 spring 1.6 40 Isolated Very low
flows
Pool 3 (Figure 40) was directly below pool 2. The substrate was predominantly cobble and
bedrock. The depth was at its maximum at each autumn survey and was shallower each spring.

McNeil et al. 2011 Fish and EWPs in the WMLR
53
Like the other Woodlands Weir sites, the pool was quite salty throughout the survey period.
Dissolved oxygen, pH and temperature were relatively consistent over time. Pool 3 had greater
and more consistent macrophyte cover (Table 23).
Figure 40. Woodlands Weir Pool 3 in a) spring 2007 and b) autumn 2008.
Table 23. Water quality parameters recorded in Woodlands Weir Pool 3 during each survey.
Pool 3 DO (ppm)
Cond. (μS/cm)
pH Temp. (ºC)
Season Max. depth (m)
Macrophytes (% cover)
Hydrology Antecedent Hydrology
2007 9 3460 8 14.9 autumn 1.5 80 Connected Low flows 2007 7 6000 6 23 spring 1.2 70 Isolated Very low
flows 2008 11 8700 9 16.5 autumn 2.0 70 Isolated Very low
flows 2008 8 5440 7.8 23.2 spring 1.2 50 Isolated Very low
flows
3.1.4.2. Water Quality
Salinity was recorded at levels that are high enough to impact on more sensitive species and life
stages (e.g. eggs and larvae) of native fish. Flathead gudgeon, southern purple spotted gudgeon
(now extinct) and dwarf flathead gudgeon are likely to suffer larval mortality and recruitment failure
under the higher salinities experienced at this site (McNeil et al. 2010c, McNeil et al. 2010d). Past
peaks in salinity may have excluded sensitive species from these sites (e.g. climbing and mountain
galaxias, purple spotted gudgeon) and may have influenced the current assemblage structure in
the absence of flushing flows from upstream. All species observed here are likely to be tolerant of
recorded conditions, certainly as adults.

McNeil et al. 2011 Fish and EWPs in the WMLR
54
3.1.4.3. Hydrology
Water levels at Woodlands Weir were relatively high for each of the surveys, only decreasing
significantly in spring 2008 after a year of very low flows. The flow at Woodlands Weir was very
low (<0.1 ML/day) over the summer of 2006/07, and up to the end of April 2008. Flow was slightly
higher in May, but still low, up the time of autumn 2007 surveys, conducted on May 22. Except for
a small pulse of flow in early June, the flow remained low until there were two pulsed freshes in
early and late July. Generally the flow decreased for the remainder of the year, with very low flows
(<1 ML/day) from the end of September and to the end of November and no flows in December, up
to the time of spring 2007 surveys, conducted on December 11. This lack of flow at the site
continued over summer and up until the time of autumn 2008 surveys, conducted on May 7. Low
flows resumed again in July and continued through to October except for two small freshes in
September.
Figure 41. Hydrograph for flow in South Para River at Woodlands Weir. Flow data (ML/day) was collected from DWLBC gauge number A5050503. The timing of each survey season is also shown above the figure.
3.1.4.4. Fish community
Three native and five introduced fish taxa were captured at Woodlands Weir during the three
surveys conducted at this site from autumn 2007 to spring 2008 (Figure 42). Large numbers of
flathead gudgeon were captured during all four surveys. Over 50 individual common galaxias were
captured at the site in autumn 2007, but only a small number were captured in spring 2007 (seven
Jan/0
5 Ma
r/05
May/0
5 Ju
l/05
Sep/0
5 No
v/05
Jan/0
6 Ma
r/06
May/0
6 Ju
l/06
Sep/0
6 No
v/06
Jan/0
7 Ma
r/07
May/0
7 Ju
l/07
Sep/0
7 No
v/07
Jan/0
8 Ma
r/08
May/0
8 Ju
l/08
Sep/0
8 No
v/08
Jan/0
9
ML/da
y
0
100
2006000
7000
2006
A
2006
S
2007
S
2007
A
2008
A
2008
S

McNeil et al. 2011 Fish and EWPs in the WMLR
55
individuals), autumn 2008 (two individuals) and spring 2008 (one individual). Small numbers of
congolli were captured during both autumn and spring surveys conducted in 2007, but none were
captured at the site in autumn 2008 and only one in spring 2008. The number of gambusia
captured was relatively small in autumn 2007, however they dominated the community in spring
2007, and autumn and spring 2008. Small numbers of carp and goldfish were captured in spring
2007, but neither were captured during autumn 2008. Three goldfish were captured in spring 2008.
One tench was captured at Woodlands Weir in spring 2007.
Figure 42. Abundances of each taxa present in the fish communities at Woodlands Weir (South Para River) over four survey seasons.
3.1.4.5. Fish population structure
There was a relatively large number of medium to large common galaxias captured during the
initial survey, conducted in autumn 2007 (Figure 43). Large numbers of flathead gudgeon
consisting of a wide range of sizes were captured at Woodlands Weir (Figure 44). The numbers of
both small and medium sized individuals peaked during the spring 2007 survey, while in spring
2008 the number of small individuals was very low. However, the numbers of individuals declined
over subsequent surveys, with only two adult individuals captured during the autumn 2008 survey
and one adult in spring 2008. There were small numbers of medium to large congolli captured
during autumn 2007 and spring 2007 (Figure 45). However, no congolli were captured during
autumn 2008, and only one large adult captured in spring 2008. Most of the gambusia captured
were small to medium sized individuals during all surveys (Figure 46).
Autumn 06 Spring 06 Autumn 07 Spring 07 Autumn 08 Spring 08
No.
of i
ndiv
idua
ls
0
50
100
150
1000
2000
3000 Tench Congolli Common Galaxias Goldfish European Carp Redfin Eastern Gambusia Flathead Gudgeon

McNeil et al. 2011 Fish and EWPs in the WMLR
56
Figure 43. Lengths of common galaxias (G. maculatus) at Woodlands Weir (South Para River) over six survey seasons, from autumn 2007 to spring 2008. The flow at the time of the survey and major hydrological pattern since the last survey are shown for each season.
Num
ber o
f ind
ivid
uals
Size class (mm)
0-10
11-2
021
-30
31-4
041
-50
51-6
061
-70
71-8
081
-90
91-1
0010
1-11
011
1-12
012
1-13
013
1-14
014
1-15
015
1-16
016
1-17
017
1-18
0
0
10
Size class (mm)
0-10
11-2
021
-30
31-4
041
-50
51-6
061
-70
71-8
081
-90
91-1
0010
1-11
011
1-12
012
1-13
013
1-14
014
1-15
015
1-16
016
1-17
017
1-18
0
0
10
Size class (mm)
0-10
11-2
021
-30
31-4
041
-50
51-6
061
-70
71-8
081
-90
91-1
0010
1-11
011
1-12
012
1-13
013
1-14
014
1-15
015
1-16
016
1-17
017
1-18
0
0
10
Size class (mm)
0-10
11-2
021
-30
31-4
041
-50
51-6
061
-70
71-8
081
-90
91-1
0010
1-11
011
1-12
012
1-13
013
1-14
014
1-15
015
1-16
016
1-17
017
1-18
0
0
10
Size class (mm)
0-10
11-2
021
-30
31-4
041
-50
51-6
061
-70
71-8
081
-90
91-1
0010
1-11
011
1-12
012
1-13
013
1-14
014
1-15
015
1-16
016
1-17
017
1-18
0
0
Size class (mm)
0-10
11-2
021
-30
31-4
041
-50
51-6
061
-70
71-8
081
-90
91-1
0010
1-11
011
1-12
012
1-13
013
1-14
014
1-15
015
1-16
016
1-17
017
1-18
0
0
10
i) Autumn 2006Not surveyed
ii) Spring 2006Not surveyed
iv) Spring 2007Disconnected pools, very lowflows over winter
vi) Spring 2008Disconnected pools, minimal flow over winter
iii) Autumn 2007Low flow, very low flows over summer
v) Autumn 2008Disconnected pools, minimal flow over summer

McNeil et al. 2011 Fish and EWPs in the WMLR
57
Figure 44. Lengths of flathead gudgeon (P. grandiceps) at Woodlands Weir (South Para River) over six survey seasons, from autumn 2007 to spring 2008. The flow at the time of the survey and major hydrological pattern since the last survey are shown for each.
Size class (mm)
0-5
6-10
11-1
516
-20
21-2
526
-30
31-3
536
-40
41-4
546
-50
51-5
556
-60
61-6
566
-70
71-7
576
-80
81-8
586
-90
91-9
596
-100
>100
0
50
100
150
Size class (mm)
0-5
6-10
11-1
516
-20
21-2
526
-30
31-3
536
-40
41-4
546
-50
51-5
556
-60
61-6
566
-70
71-7
576
-80
81-8
586
-90
91-9
596
-100
>100
0
50
100
150
Size class (mm)
0-5
6-10
11-1
516
-20
21-2
526
-30
31-3
536
-40
41-4
546
-50
51-5
556
-60
61-6
566
-70
71-7
576
-80
81-8
586
-90
91-9
596
-100
>100
0
50
100
150
Size class (mm)
0-5
6-10
11-1
516
-20
21-2
526
-30
31-3
536
-40
41-4
546
-50
51-5
556
-60
61-6
566
-70
71-7
576
-80
81-8
586
-90
91-9
596
-100
>100
0
50
100
150
Size class (mm)
0-5
6-10
11-1
516
-20
21-2
526
-30
31-3
536
-40
41-4
546
-50
51-5
556
-60
61-6
566
-70
71-7
576
-80
81-8
586
-90
91-9
596
-100
>100
0
50
100
150
Size class (mm)
0-5
6-10
11-1
516
-20
21-2
526
-30
31-3
536
-40
41-4
546
-50
51-5
556
-60
61-6
566
-70
71-7
576
-80
81-8
586
-90
91-9
596
-100
>100
0
50
100
150
i) Autumn 2006Not surveyed
ii) Spring 2006Not surveyed
iv) Spring 2007Disconnected pools, very lowflows over winter
vi) Spring 2008Disconnected pools, minimal flow over winter
iii) Autumn 2007Low flow, very low flows over summer
v) Autumn 2008Disconnected pools, minimal flow over summer

McNeil et al. 2011 Fish and EWPs in the WMLR
58
Figure 45. Lengths of congolli (P. urvillii) at Woodlands Weir (South Para River) over six survey seasons, from autumn 2007 to spring 2008. The flow at the time of the survey and major hydrological pattern since the last survey are shown for each season.
Size class (mm)
0-10
11-2
021
-30
31-4
041
-50
51-6
061
-70
71-8
081
-90
91-1
0010
1-11
011
1-12
012
1-13
013
1-14
014
1-15
015
1-16
016
1-17
017
1-18
018
1-19
019
1-20
020
1-21
021
1-22
022
1-23
023
1-24
024
1-25
025
1-26
026
1-27
027
1-28
028
1-29
029
1-30
030
1-31
031
1-32
0
0
10
Size class (mm)
0-10
11-2
021
-30
31-4
041
-50
51-6
061
-70
71-8
081
-90
91-1
0010
1-11
011
1-12
012
1-13
013
1-14
014
1-15
015
1-16
016
1-17
017
1-18
018
1-19
019
1-20
020
1-21
021
1-22
022
1-23
023
1-24
024
1-25
025
1-26
026
1-27
027
1-28
028
1-29
029
1-30
030
1-31
031
1-32
0
0
10
Size class (mm)
0-10
11-2
021
-30
31-4
041
-50
51-6
061
-70
71-8
081
-90
91-1
0010
1-11
011
1-12
012
1-13
013
1-14
014
1-15
015
1-16
016
1-17
017
1-18
018
1-19
019
1-20
020
1-21
021
1-22
022
1-23
023
1-24
024
1-25
025
1-26
026
1-27
027
1-28
028
1-29
029
1-30
030
1-31
031
1-32
0
0
10
Size class (mm)
0-10
11-2
021
-30
31-4
041
-50
51-6
061
-70
71-8
081
-90
91-1
0010
1-11
011
1-12
012
1-13
013
1-14
014
1-15
015
1-16
016
1-17
017
1-18
018
1-19
019
1-20
020
1-21
021
1-22
022
1-23
023
1-24
024
1-25
025
1-26
026
1-27
027
1-28
028
1-29
029
1-30
030
1-31
031
1-32
0
0
10
Size class (mm)
0-10
11-2
021
-30
31-4
041
-50
51-6
061
-70
71-8
081
-90
91-1
0010
1-11
011
1-12
012
1-13
013
1-14
014
1-15
015
1-16
016
1-17
017
1-18
018
1-19
019
1-20
020
1-21
021
1-22
022
1-23
023
1-24
024
1-25
025
1-26
026
1-27
027
1-28
028
1-29
029
1-30
030
1-31
031
1-32
0
0
10
Size class (mm)
0-10
11-2
021
-30
31-4
041
-50
51-6
061
-70
71-8
081
-90
91-1
0010
1-11
011
1-12
012
1-13
013
1-14
014
1-15
015
1-16
016
1-17
017
1-18
018
1-19
019
1-20
020
1-21
021
1-22
022
1-23
023
1-24
024
1-25
025
1-26
026
1-27
027
1-28
028
1-29
029
1-30
030
1-31
031
1-32
0
0
10
Num
ber o
f ind
ivid
uals
i) Autumn 2006Not surveyed
ii) Spring 2006Not surveyed
iv) Spring 2007Disconnected pools, very lowflows over winter
vi) Spring 2008Disconnected pools, minimal flow over winter
iii) Autumn 2007Low flow, very low flows over summer
v) Autumn 2008Disconnected pools, minimal flow over summerNo Congolli captured

McNeil et al. 2011 Fish and EWPs in the WMLR
59
Figure 46. Lengths of gambusia (G. holbrooki) at Woodlands Weir (South Para River) over six survey seasons, from autumn 2007 to spring 2008. The flow at the time of the survey and major hydrological pattern since the last survey are shown for each season.
Size class (mm)
0-5
6-10
11-1
516
-20
21-2
526
-30
31-3
536
-40
41-4
546
-50
51-5
556
-60
61-6
566
-70
71-7
576
-80
0
50
100
150
Size class (mm)
0-5
6-10
11-1
516
-20
21-2
526
-30
31-3
536
-40
41-4
546
-50
51-5
556
-60
61-6
566
-70
71-7
576
-80
0
50
100
150
Size class (mm)
0-5
6-10
11-1
516
-20
21-2
526
-30
31-3
536
-40
41-4
546
-50
51-5
556
-60
61-6
566
-70
71-7
576
-80
0
50
100
150
Size class (mm)
0-5
6-10
11-1
516
-20
21-2
526
-30
31-3
536
-40
41-4
546
-50
51-5
556
-60
61-6
566
-70
71-7
576
-80
0
50
100
150
Size class (mm)
0-5
6-10
11-1
516
-20
21-2
526
-30
31-3
536
-40
41-4
546
-50
51-5
556
-60
61-6
566
-70
71-7
576
-80
0
50
100
150
Size class (mm)
0-5
6-10
11-1
516
-20
21-2
526
-30
31-3
536
-40
41-4
546
-50
51-5
556
-60
61-6
566
-70
71-7
576
-80
0
50
100
150
Num
ber o
f ind
ivid
uals
i) Autumn 2006Not surveyed
ii) Spring 2006Not surveyed
iv) Spring 2007Disconnected pools, very lowflows over winter
vi) Spring 2008Disconnected pools, minimal flow over winter
iii) Autumn 2007Low flow, very low flows over summer
v) Autumn 2008Disconnected pools, minimal flow over summer

McNeil et al. 2011 Fish and EWPs in the WMLR
60
3.2. Torrens River
In total 29 species of fish were caught in the Torrens catchment during the duration of the survey.
Of these, 12 were native species, although at least four of these, carp gudgeon, freshwater catfish,
Murray rainbowfish and bony herring, are known to have been translocated into the Torrens from
the Murray-Darling Basin (McNeil and Hammer 2007). The dwarf flathead gudgeon may have been
translocated also, but as this species is only recently described from the flathead gudgeon (Hoese
and Reader 2006), no data is available on its historical distribution in the WMLR prior to ~ 2002
(Hammer 2005). A further twelve species of marine or estuarine fishes were collected only from
Breakout Creek, and only below the weir wall in the estuarine section of the reach (Table 24).
The present study has identified two native fish species not previously recorded from the Torrens
catchment, WMLR or SA Gulf drainage (Hammer and Walker 2004; Hammer 2005). These new
records are for the bony herring (Nematalosa erebi) and the short finned eel (Anguilla australis
australis). The collection of short headed lamprey (Mordacia mordax) in autumn 2007 at the
Torrens estuary is the first record in the catchment since 1958.
Two diadromous species, congolli and common galaxias were historically recorded as abundant in
the lower River Torrens, but have not been recorded since 1886 and 1928 respectively. Recent
records however, have found common galaxias above the Gorge Weir, possibly a landlocked
remnant population (Hammer 2005), whilst other papers found common galaxias present in the
Torrens estuary below breakout creek weir (Hicks and Hammer 2004).
Furthermore, recent fish surveys in Breakout Creek (upstream of the weir) failed to detect either
species in the lower River Torrens (Gray et al. 2005). As such the records of both of these species
from the lowland reach of the River Torrens represent the first reported collection of these species
in the river since at least the 1920’s. This result is almost certainly due to the construction of a fish
ladder on the Breakout Creek Weir at the Torrens Mouth. The structure, built by the AMLRNRMB
to facilitate diadromous fish passage has recently been found to successfully allow the migration of
juvenile congolli and common galaxias into the lower Torrens (McNeil et al. 2009. This survey
establishes that both species were present in all seasons and years within the lower Torrens since
autumn 2006.
The survey has re-enforced the locally extinct status of two native species; river blackfish
(Gadopsis marmoratus) and purple spotted gudgeon (Mogurnda adspersa) both historically
reported from the Torrens catchment (Hicks and Hammer 2004; Hammer 2005), although
anecdotal information continues to suggest G. marmoratus populations may exist outside of the
EWP reaches in the Onkaparinga catchment (J. McPhail - PIRSA Inland Fisheries Manager, Pers.
comm). The survey did not detect pouched lamprey (Geotria australis) in the Torrens catchment
despite recent records of the species from the lower river Torrens and Breakout Creek (Hammer

McNeil et al. 2011 Fish and EWPs in the WMLR
61
2005; McNeil et al. 2010b). All other species of native fish have been previously collected from the
River Torrens although in some cases, not in the reaches surveys here. For example, the
collection of climbing galaxias at Gorge Weir and Silke’s Rd are much farther downstream than
previous records indicate (Hammer 2005).
Six species of introduced fish were collected throughout the survey (Table 24). Of these, carp and
gambusia were distributed across all sampling reaches, redfin perch were only present in the
upper catchment upstream of Silke’s Rd, whilst the opposite was true of goldfish captured at and
downstream of Silke’s Rd. Brown trout were found in all reaches except for Breakout Creek, whilst
rainbow trout was only collected from Gorge Weir.
The suite of marine and estuarine species at Breakout Creek is reflected in the NMDS where those
samples form a distinct cluster (Figure 47). The overlap between clusters at all other sites indicates
no clear pattern in the distribution of species upstream in the Torrens. There were no
environmental or flow variables significantly correlated with patterns in assemblage at R2 greater
than 0.1. In other words, there were no environmental or flow correlates that were capable of
explaining 10% of the variation in fish assemblage. This was largely due to the small number of
replicates and the lack of contrast in the flow regime. Under the observed low flow regime and with
significant barriers to fish movement, it appears that the upper Torrens fish assemblage is isolated
from the assemblages downstream.

McNeil et al. 2011 Fish and EWPs in the WMLR
62
Table 24. Taxa which were present (P) in each site and season in the River Torrens. The columns of native freshwater and diadromous fish taxa are shaded green, those of exotic taxa shaded pink and those of marine/estuarine taxa shaded blue. (*) represents native species translocated into the Torrens Catchment from the Murray-Darling Basin.
Rea
ch
Site
Nam
e
Sam
plin
g S
easo
n
Con
golli
Com
mon
gal
axia
s
Mou
ntai
n ga
laxi
as
Clim
bing
gal
axia
s
Flat
head
gud
geon
Dw
arf f
lath
ead
gudg
eon
Car
p gu
dgeo
n *
Sho
rt-he
aded
lam
prey
Sho
rt-fin
ned
eel
Fres
hwat
er c
atfis
h *
Mur
ray
rain
bow
fish*
Bon
y he
rring
*
Gam
busi
a
Red
fin p
erch
Gol
dfis
h
Car
p
Bro
wn
trout
Rai
nbow
trou
t
Uni
dent
ified
gob
ies
Brid
led
goby
gob
y
Blu
e sp
ot g
oby
Tam
ar g
oby
Aus
tralia
n an
chov
y
Bla
ck b
ream
Jum
ping
mul
let
Yel
low
-eye
d m
ulle
t
Yel
low
fin w
hitin
g
San
dy s
prat
Sm
ooth
toad
fish
Aus
tralia
n sa
lmon
Gum
erac
ha W
eir
Gumeracha Weir
2006A P P P P 2006S Not Sampled 2007A P
P P P P
2007S P P P P P P P 2008A P P P P P 2008S P P P
Cudlee Creek
2006A P P P P 2006S Not Sampled 2007A P
P P P P P P
2007S P P P P P P 2008A P P P P P 2008S P P P P P P P
Gor
ge W
eir
Gorge Weir 2006A P
P
P P P
P 2006S P P P P P 2007A P P P P 2007S P P P P P 2008A P P P P P 2008S P P P P P P
Silke’s Road
2006A P P P P 2006S P P P P P 2007A P
P P P P
2007S P P P P P P P P 2008A P P P P 2008S P P P P P P
City
Wei
r
Breakout Creek
2006A P P P P P P P P P P P P P 2006S P P P P P P P P P P P P P P 2007A P P P P P P P P P P P P P P P P P 2007S P P P P P P P P P P P P P P P P 2008A P P P P P P P P P P P P P 2008S P P P P P P P P P P P P P P P

McNeil et al. 2011 Fish and EWPs in the WMLR
63
Axis 1
Axi
s 2
SiteCudlee CreekGumeracha WeirGorge WeirSilkes RoadBreakout Creek
Figure 44. NMDS ordination of fish communities in the Torrens River from autumn 2006 to spring 2008, labelled by site. There were no significantly correlated environmental vectors (R2>0.1).
3.2.1. Gumeracha Weir
3.2.1.1. Site assessment
The reach exists largely within relatively shallow gorge habitats, increasing in steepness
downstream. Pools 2 and 3 were slightly deeper than Pool 1, whilst Pool 3 was the largest in
surface area (Table 25). All three pools possessed rocky substrate with Pool 2 being dominated
by bedrock. All sites possessed some woody debris with Pool 3 possessing at least eight
moderately sized snags. Riparian cover was reasonable, particularly in Pools 1 and 2 with an
overstorey of redgums and redgum saplings, as well as some wattle and bottlebrush, with small
cumbungi beds present at each pool, but especially dominant in the intervening run/riffle areas.
Table 25. Habitat characteristics of the three monitoring pools at Gumeracha in the River Torrens.
Gumeracha Substrate size (mm) Riparian cover (%) Snags Absolute max. depth (m)
Pool 1 <1-5 35 2 1.6 Pool 2 <1-Bedrock 50 2 2.0 Pool 3 5-10+ 5 8 2.0
Pool 1 (Figure 45) was fairly stable in regards to water quality parameters, with little variability in dissolved oxygen, pH, salinity (which remained ~500 – 1000 μS/cm) and water temperature which fluctuated very little from season to season (Table 26).
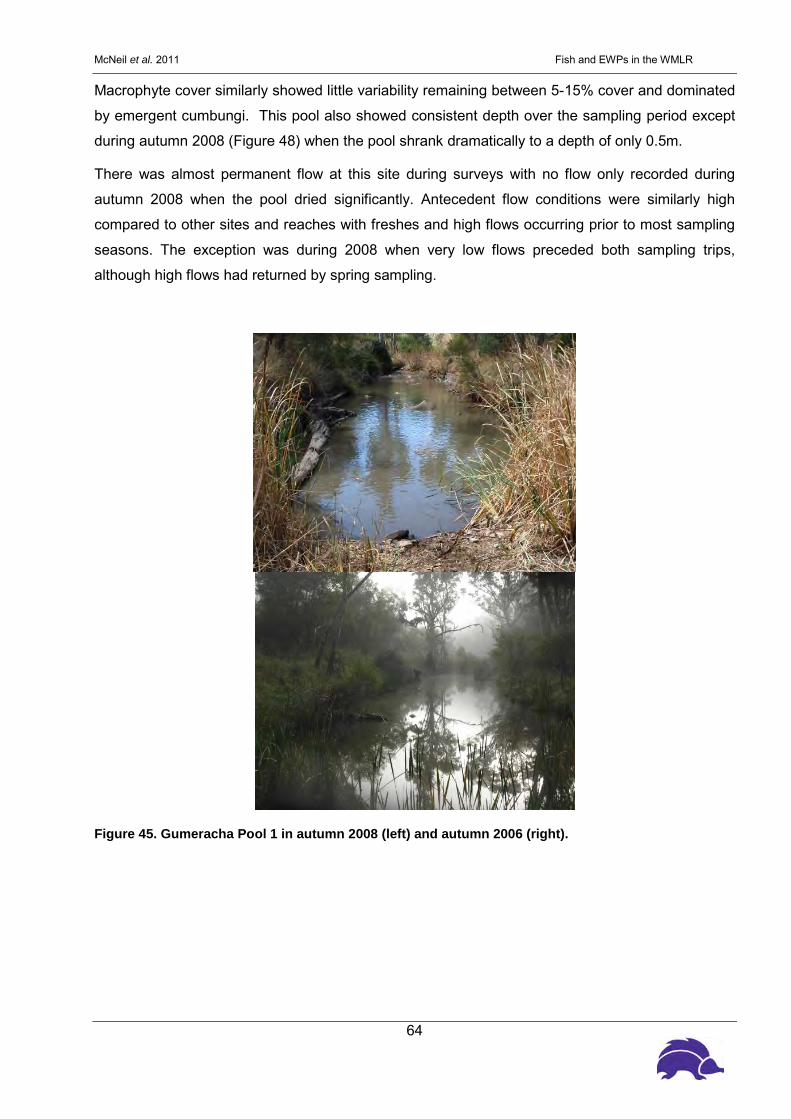
McNeil et al. 2011 Fish and EWPs in the WMLR
64
Macrophyte cover similarly showed little variability remaining between 5-15% cover and dominated
by emergent cumbungi. This pool also showed consistent depth over the sampling period except
during autumn 2008 (Figure 48) when the pool shrank dramatically to a depth of only 0.5m.
There was almost permanent flow at this site during surveys with no flow only recorded during
autumn 2008 when the pool dried significantly. Antecedent flow conditions were similarly high
compared to other sites and reaches with freshes and high flows occurring prior to most sampling
seasons. The exception was during 2008 when very low flows preceded both sampling trips,
although high flows had returned by spring sampling.
Figure 45. Gumeracha Pool 1 in autumn 2008 (left) and autumn 2006 (right).
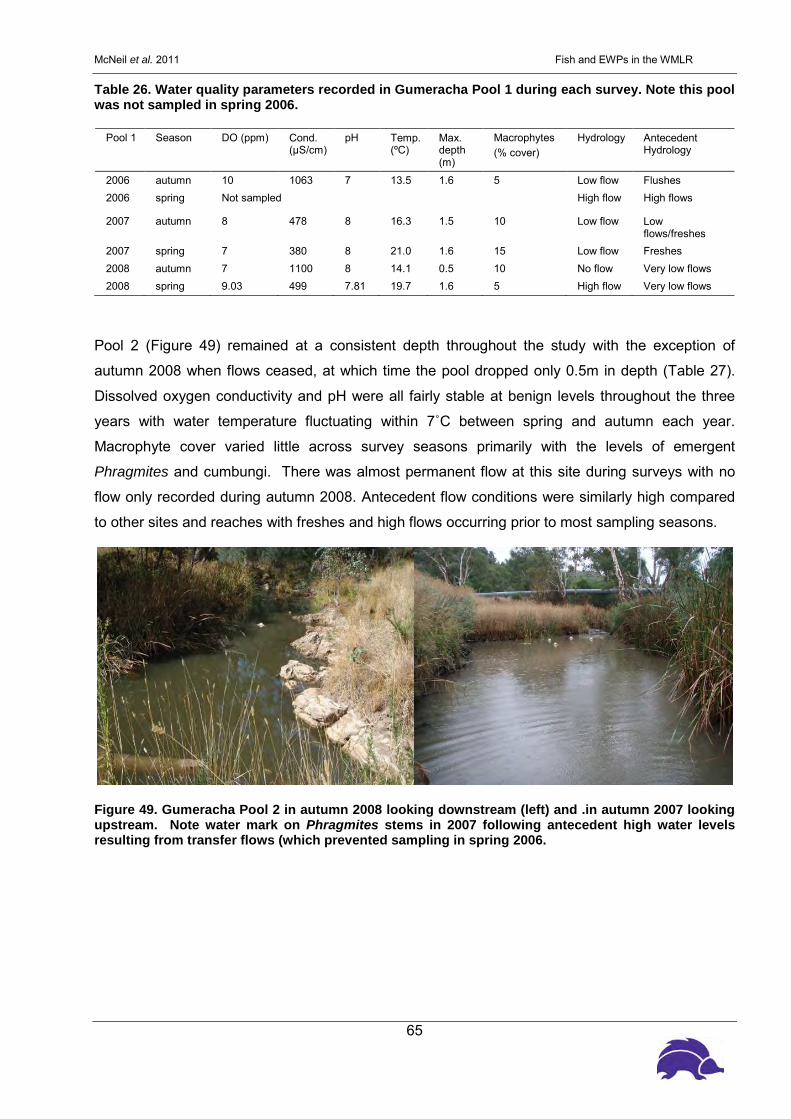
McNeil et al. 2011 Fish and EWPs in the WMLR
65
Table 26. Water quality parameters recorded in Gumeracha Pool 1 during each survey. Note this pool was not sampled in spring 2006.
Pool 1 Season DO (ppm) Cond. (μS/cm)
pH Temp. (ºC)
Max. depth (m)
Macrophytes (% cover)
Hydrology Antecedent Hydrology
2006 autumn 10 1063 7 13.5 1.6 5 Low flow Flushes 2006 spring Not sampled High flow High flows
2007 autumn 8 478 8 16.3 1.5 10 Low flow Low flows/freshes
2007 spring 7 380 8 21.0 1.6 15 Low flow Freshes 2008 autumn 7 1100 8 14.1 0.5 10 No flow Very low flows 2008 spring 9.03 499 7.81 19.7 1.6 5 High flow Very low flows
Pool 2 (Figure 49) remained at a consistent depth throughout the study with the exception of
autumn 2008 when flows ceased, at which time the pool dropped only 0.5m in depth (Table 27).
Dissolved oxygen conductivity and pH were all fairly stable at benign levels throughout the three
years with water temperature fluctuating within 7˚C between spring and autumn each year.
Macrophyte cover varied little across survey seasons primarily with the levels of emergent
Phragmites and cumbungi. There was almost permanent flow at this site during surveys with no
flow only recorded during autumn 2008. Antecedent flow conditions were similarly high compared
to other sites and reaches with freshes and high flows occurring prior to most sampling seasons.
Figure 49. Gumeracha Pool 2 in autumn 2008 looking downstream (left) and .in autumn 2007 looking upstream. Note water mark on Phragmites stems in 2007 following antecedent high water levels resulting from transfer flows (which prevented sampling in spring 2006.

McNeil et al. 2011 Fish and EWPs in the WMLR
66
Table 27. Water quality parameters recorded in Gumeracha Pool 2 during each survey. Note this pool was not sampled in spring 2006.
Pool 2 Season DO (ppm) Cond. (μS/cm)
pH Temp. (ºC)
Max. depth (m)
Macrophytes (% cover)
Hydrology Antecedent Hydrology
2006 autumn 9 1106 8 13.3 2.0 10 Low flow Flushes
2006 spring Not sampled High flow High flows
2007 autumn 8 405 8 16.2 2.0 10 Low flow Low flows/freshes
2007 spring 7 350 8 22.0 2.0 10 Low flow Freshes
2008 autumn 8 900 8 14.5 1.5 5 No flow Very low flows
2008 spring 7.5 509 7.8 21 2.0 10 High flow Very low flows
Pool 3 (Figure 50) was the largest of the three pools and was generally deeper over much its area,
although maximum depth fluctuated to a higher degree than the other two pools. Riparian
vegetation was patchy with the left bank almost completely overgrown with blackberries and patchy
redgum saplings and grasses on the right bank. The substrate was cobbled and macrophyte cover
was generally low with cumbungi beds at the up- and down-stream extent of the pool inundated at
higher water levels (Table 28). Temperature varied seasonally within 8˚C, whilst pH, dissolved
oxygen and conductivity remained consistently at benign levels. There was almost permanent flow
at this site during surveys with no flow only recorded during autumn 2008. Antecedent flow
conditions were similarly high compared to other sites and reaches with freshes and high flows
occurring prior to most sampling seasons.
Figure 50. Gumeracha Pool 3 in autumn 2008.

McNeil et al. 2011 Fish and EWPs in the WMLR
67
Table 28. Water quality parameters recorded in Gumeracha Pool 3 during each survey. Note this pool was not sampled in spring 2006.
Pool 3 Season DO (ppm)
Cond. (μS/cm)
pH Temp. (ºC)
Max. depth (m)
Macrophytes (% cover)
Hydrology Antecedent Hydrology
2006 autumn 8 1097 8 13.1 1.0 5 Low flow Flushes 2006 spring Not sampled High flow High flows 2007 autumn 8 506 8 17.2 1.2 5 Low flow Low flows/freshes 2007 spring 7 350 8 21.0 2.0 5 Low flow Freshes 2008 autumn 12 1100 9 15.2 1.5 1 No flow Very low flows 2008 spring 8.5 506 7.7 20 2.0 5 High flow Very low flows
3.2.1.2. Water Quality
Salinity was the only water quality parameter to be high enough to impact on aquatic biota. Whilst
levels recorded here may be high enough to impact on particularly sensitive invertebrate species,
all levels recorded are suitable for the maintenance of native fish.
3.2.1.3. Hydrology
The water level at Gumeracha Weir was low at the time that autumn 2006 surveys were
conducted. In spring 2006 the discharge was too high for nets to be set. The water level was
again low during autumn 2007, and was moderate during spring 2007 surveys. During the autumn
2008 survey, the pools were disconnected and there had been no flow over summer. Over winter,
low baseflows resumed and pools were connected by strong flow in spring 2008. Much of the flow
from upstream is intercepted by Gumeracha Weir, and does not reach the survey site below the
weir (Figure 51). The gauge data collected at Cudlee Creek was used to evaluate the hydrology
below the weir. A detailed description of this hydrology is provided below (see results for Cudlee
Creek).
3.2.1.4. Fish community
Five native and four introduced species were captured at Gumeracha Weir over the five survey
seasons (Figure 52). Typically, only relatively low numbers of most taxa were captured at this site
in each season. However, in autumn 2006 and autumn and spring 2008 the fish community at
Gumeracha Weir was dominated by very high numbers of flathead gudgeon. The structure of this
community in autumn 2007 was dominated by exotic taxa. This dominance by exotics was again
evident in spring 2007, and was associated with relatively high flows, as well as high temperature
and low conductivity at the time of the surveys. The site became drier in 2008, with no freshes or
flushes over summer and minimal surface water in the isolated pools in autumn. By this time the
community structure had moved back somewhat to that occurring in 2006, with relatively high

McNeil et al. 2011 Fish and EWPs in the WMLR
68
numbers of flathead gudgeon, but also with relatively high numbers of gambusia. In the last survey
in spring 2008 baseflows had returned to this reach and the pools were connected.
Jan/
05
Mar
/05
M
ay/0
5
Jul/0
5
Sep/
05
Nov
/05
Ja
n/06
M
ar/0
6
May
/06
Ju
l/06
Se
p/06
N
ov/0
6
Jan/
07
Mar
/07
M
ay/0
7
Jul/0
7
Sep/
07
Nov
/07
Ja
n/08
M
ar/0
8
May
/08
Ju
l/08
Se
p/08
N
ov/0
8
Jan/
09
ML/
day
0
50
100
150
200
250
300
Jan/
05
Mar
/05
M
ay/0
5
Jul/0
5
Sep/
05
Nov
/05
Ja
n/06
M
ar/0
6
May
/06
Ju
l/06
Se
p/06
N
ov/0
6
Jan/
07
Mar
/07
M
ay/0
7
Jul/0
7
Sep/
07
Nov
/07
Ja
n/08
M
ar/0
8
May
/08
Ju
l/08
Se
p/08
N
ov/0
8
Jan/
09
ML/
day
0
50
100
150
200 2006A
2006S
2007S
2007A
2008A
2008S
2006A
2006S
2007S
2007A
2008A
2008S
Jan/
05
Mar
/05
M
ay/0
5
Jul/0
5
Sep/
05
Nov
/05
Ja
n/06
M
ar/0
6
May
/06
Ju
l/06
Se
p/06
N
ov/0
6
Jan/
07
Mar
/07
M
ay/0
7
Jul/0
7
Sep/
07
Nov
/07
Ja
n/08
M
ar/0
8
May
/08
Ju
l/08
Se
p/08
N
ov/0
8
Jan/
09
ML/
day
0
50
100
150
200 2006A
2006S
2007S
2007A
2008A
2008S
2006A2006A
2006S2006S
2007S2007S
2007A2007A
2008A2008A
2008S2008S
2006A
2006S
2007S
2007A
2008A
2008S
2006A2006A
2006S2006S
2007S2007S
2007A2007A
2008A2008A
2008S2008S
Figure 51. Hydrographs for a) flow in Torrens River above Gumeracha Weir survey site (top graph), and b) flow below Gumeracha Weir (bottom graph). Flow data (ML/day) for the survey site was collected at both Cudlee Creek (gauge number A5041019) and upstream of Gumeracha Weir (gauge number A5041020) from June 27, 2006. The timing of each survey season is also shown above the figures. Note that no survey was possible during spring 2006 due to the prevailing high discharge at the survey site.

McNeil et al. 2011 Fish and EWPs in the WMLR
69
Large numbers of flathead gudgeon were captured along with moderate numbers of redfin perch
and brown trout, but gambusia were absent. Small numbers of mountain galaxias were captured in
each of the three surveys from autumn 2007 to autumn 2008, whilst only one climbing galaxias
was captured at Gumeracha Weir during the present surveys, in spring 2007. One bony herring
was captured at Gumeracha Weir during the autumn 2008 survey; this is the first record of the
species in the WMLR and is a likely translocation via water pumped from the Murray River.
The most common fish captured during the three surveys from autumn 2007 to autumn 2008 were
introduced taxa. Gambusia numbers varied, both seasonally and across surveys. Only one carp
was captured in spring 2007; however numbers of carp at the site had increased by spring 2008. A
single brown trout was also captured in autumn 2008.
Figure 52. Abundances of each taxa present in the fish communities at Gumeracha Weir (Torrens River) over six survey seasons. There was no survey data for this site in spring 2006 due to very high flow.
3.2.1.5. Fish population structure
There was a very large number of small to medium sized flathead gudgeon captured during
autumn 2006 (Figure 53). However, in both autumn and spring 2007 only a small number of
mainly medium sized individuals were captured. In autumn 2008, a very high number of juvenile
recruits were captured and by spring had matured into adults. There were relatively high numbers
of small to medium sized dwarf flathead gudgeon captured during autumn 2006 (Figure 54). However, only one fish was captured during each of the surveys conducted in 2007, and no fish
were captured in autumn or spring 2008.
Autumn 06 Spring 06 Autumn 07 Spring 07 Autumn 08 Spring 08
No.
of i
ndiv
idua
ls
0
10
20
30
40
50
60
1000
2000
3000
European Carp Climbing Galaxias Mountain Galaxias Bony Herring Redfin Dwarf Flathead Gudgeon Brown Trout Flathead Gudgeon Eastern Gambusia
McNeil et al. 2011 Fish and EWPs in the WMLR
70
Mountain galaxias were only captured at Gumeracha Weir in 2007 (Figure 55). Small numbers
were captured, with medium sized fish captured in autumn and smaller fish captured in spring.
During spring 2007 one small climbing galaxias was captured (Figure 56)
The pattern for captures of gambusia was similar to that for flathead gudgeon (although during the
initial survey the numbers of gambusia captured were much lower (Figure 57). High numbers of
small to medium sized gambusia were captured in autumn 2006 and 2008, with far fewer captured
during either survey in 2007 and in spring 2008.
Only medium to large redfin perch were captured during autumn 2006 and autumn 2007 (Figure
58). There were relatively high numbers of new recruits caught in spring 2007 and of small to
medium sized individuals in autumn 2008. In spring 2008, only medium to large redfin perch were
captured. In addition 10 adult brown trout were captured in autumn 2008 ranging in size from 275-
335 mm.

McNeil et al. 2011 Fish and EWPs in the WMLR
71
Figure 53. Lengths of flathead gudgeon (P. grandiceps) at Gumeracha Weir (Torrens River) over six survey seasons, from autumn 2006 to spring 2008. The flow at the time of the survey and major hydrological pattern since the last survey are shown for each season.
Size class (mm)
0-5
6-10
11-1
516
-20
21-2
526
-30
31-3
536
-40
41-4
546
-50
51-5
556
-60
61-6
566
-70
71-7
576
-80
81-8
586
-90
91-9
596
-100
>100
0
50
100
150
Size class (mm)
0-5
6-10
11-1
516
-20
21-2
526
-30
31-3
536
-40
41-4
546
-50
51-5
556
-60
61-6
566
-70
71-7
576
-80
81-8
586
-90
91-9
596
-100
>100
0
50
Size class (mm)
0-5
6-10
11-1
516
-20
21-2
526
-30
31-3
536
-40
41-4
546
-50
51-5
556
-60
61-6
566
-70
71-7
576
-80
81-8
586
-90
91-9
596
-100
>100
0
50
Size class (mm)
0-5
6-10
11-1
516
-20
21-2
526
-30
31-3
536
-40
41-4
546
-50
51-5
556
-60
61-6
566
-70
71-7
576
-80
81-8
586
-90
91-9
596
-100
>100
0
50
Size class (mm)
0-5
6-10
11-1
516
-20
21-2
526
-30
31-3
536
-40
41-4
546
-50
51-5
556
-60
61-6
566
-70
71-7
576
-80
81-8
586
-90
91-9
596
-100
>100
0
50
100
150
Size class (mm)
0-5
6-10
11-1
516
-20
21-2
526
-30
31-3
536
-40
41-4
546
-50
51-5
556
-60
61-6
566
-70
71-7
576
-80
81-8
586
-90
91-9
596
-100
>100
0
50
100
150
Num
ber o
f ind
ivid
uals
i) Autumn 2006Low flow, flushing flows over summer
ii) Spring 2006Not surveyed due to high discharge
iv) Spring 2007Moderate flow, low flows with very small flushes over winter
vi) Spring 2008High flow, baseflows and flushes over winter
iii) Autumn 2007Low flow, sustained moderate flows over much of summer, but very low flows prior to survey
v) Autumn 2008Disconnected pools, very lowflows over summer

McNeil et al. 2011 Fish and EWPs in the WMLR
72
Figure 54. Lengths of dwarf flathead gudgeon (P. macrostomus) at Gumeracha Weir (Torrens River) over six survey seasons, from autumn 2006 to spring 2008. The flow at the time of the survey and major hydrological pattern since the last survey are shown for each season.
Size class (mm)
0-5
6-10
11-1
516
-20
21-2
526
-30
31-3
536
-40
41-4
546
-50
51-5
556
-60
61-6
566
-70
71-7
5
0
50
Size class (mm)
0-5
6-10
11-1
516
-20
21-2
526
-30
31-3
536
-40
41-4
546
-50
51-5
556
-60
61-6
566
-70
71-7
5
0
50
Size class (mm)
0-5
6-10
11-1
516
-20
21-2
526
-30
31-3
536
-40
41-4
546
-50
51-5
556
-60
61-6
566
-70
71-7
5
0
50
Size class (mm)
0-5
6-10
11-1
516
-20
21-2
526
-30
31-3
536
-40
41-4
546
-50
51-5
556
-60
61-6
566
-70
71-7
5
0
50
Size class (mm)
0-5
6-10
11-1
516
-20
21-2
526
-30
31-3
536
-40
41-4
546
-50
51-5
556
-60
61-6
566
-70
71-7
5
0
50
Size class (mm)
0-5
6-10
11-1
516
-20
21-2
526
-30
31-3
536
-40
41-4
546
-50
51-5
556
-60
61-6
566
-70
71-7
5
0
50
i) Autumn 2006Low flow, flushing flows over summer
ii) Spring 2006Not surveyed due to high dischargeNo Dwarf Flathead Gudgeon Captured
iv) Spring 2007Moderate flow, low flows with very small flushes over winter
vi) Spring 2008High flow, baseflows and flushes over winterNo Dwarf Flathead Gudgeon Captured
iii) Autumn 2007Low flow, sustained moderate flows over much of summer, but very low flows prior to survey
v) Autumn 2008Disconnected pools, very lowflows over summerNo Dwarf Flathead Gudgeon Captured

McNeil et al. 2011 Fish and EWPs in the WMLR
73
Figure 55. Lengths of mountain galaxias (G. olidus) at Gumeracha Weir (Torrens River) over six survey seasons, from autumn 2006 to spring 2008. The flow at the time of the survey and major hydrological pattern since the last survey are shown for each season.
Size class (mm)
0-5
6-10
11-1
516
-20
21-2
526
-30
31-3
536
-40
41-4
546
-50
51-5
556
-60
61-6
566
-70
71-7
576
-80
81-8
586
-90
91-9
596
-100
101-
105
106-
110
111-
115
116-
120
0
10
Size class (mm)
0-5
6-10
11-1
516
-20
21-2
526
-30
31-3
536
-40
41-4
546
-50
51-5
556
-60
61-6
566
-70
71-7
576
-80
81-8
586
-90
91-9
596
-100
101-
105
106-
110
111-
115
116-
120
0
10
Size class (mm)
0-5
6-10
11-1
516
-20
21-2
526
-30
31-3
536
-40
41-4
546
-50
51-5
556
-60
61-6
566
-70
71-7
576
-80
81-8
586
-90
91-9
596
-100
101-
105
106-
110
111-
115
116-
120
0
10
Size class (mm)
0-5
6-10
11-1
516
-20
21-2
526
-30
31-3
536
-40
41-4
546
-50
51-5
556
-60
61-6
566
-70
71-7
576
-80
81-8
586
-90
91-9
596
-100
101-
105
106-
110
111-
115
116-
120
0
10
Size class (mm)
0-5
6-10
11-1
516
-20
21-2
526
-30
31-3
536
-40
41-4
546
-50
51-5
556
-60
61-6
566
-70
71-7
576
-80
81-8
586
-90
91-9
596
-100
101-
105
106-
110
111-
115
116-
120
0
10
0-5
6-10
11-1
516
-20
21-2
526
-30
31-3
536
-40
41-4
546
-50
51-5
556
-60
61-6
566
-70
71-7
576
-80
81-8
586
-90
91-9
596
-100
101-
105
106-
110
111-
115
116-
120
0
10
Num
ber o
f ind
ivid
uals
i) Autumn 2006Low flow, flushing flows over summerNo Mountain GalaxiasCaptured
ii) Spring 2006Not surveyed due to high discharge
iv) Spring 2007Moderate flow, low flows with very small flushes over winter
vi) Spring 2008High flow, baseflows and flushes over winterNo Mountain GalaxiasCaptured
iii) Autumn 2007Low flow, sustained moderate flows over much of summer, but very low flows prior to survey
v) Autumn 2008Disconnected pools, very lowflows over summer

McNeil et al. 2011 Fish and EWPs in the WMLR
74
Figure 56. Lengths of climbing galaxias (G. brevipinnis) at Gumeracha Weir (Torrens River) over six survey seasons, from autumn 2006 to spring 2008. The flow at the time of the survey and major hydrological pattern since the last survey are shown for each season.
Size class (mm)
0-5
6-10
11-1
516
-20
21-2
526
-30
31-3
536
-40
41-4
546
-50
51-5
556
-60
61-6
566
-70
71-7
576
-80
81-8
586
-90
91-9
596
-100
101-
105
106-
110
111-
115
116-
120
0
10
Size class (mm)
0-5
6-10
11-1
516
-20
21-2
526
-30
31-3
536
-40
41-4
546
-50
51-5
556
-60
61-6
566
-70
71-7
576
-80
81-8
586
-90
91-9
596
-100
101-
105
106-
110
111-
115
116-
120
0
10
Size class (mm)
0-5
6-10
11-1
516
-20
21-2
526
-30
31-3
536
-40
41-4
546
-50
51-5
556
-60
61-6
566
-70
71-7
576
-80
81-8
586
-90
91-9
596
-100
101-
105
106-
110
111-
115
116-
120
0
10
Size class (mm)
0-5
6-10
11-1
516
-20
21-2
526
-30
31-3
536
-40
41-4
546
-50
51-5
556
-60
61-6
566
-70
71-7
576
-80
81-8
586
-90
91-9
596
-100
101-
105
106-
110
111-
115
116-
120
0
10
Size class (mm)
0-5
6-10
11-1
516
-20
21-2
526
-30
31-3
536
-40
41-4
546
-50
51-5
556
-60
61-6
566
-70
71-7
576
-80
81-8
586
-90
91-9
596
-100
101-
105
106-
110
111-
115
116-
120
0
10
Size class (mm)
0-5
6-10
11-1
516
-20
21-2
526
-30
31-3
536
-40
41-4
546
-50
51-5
556
-60
61-6
566
-70
71-7
576
-80
81-8
586
-90
91-9
596
-100
101-
105
106-
110
111-
115
116-
120
0
10
Num
ber o
f ind
ivid
uals
i) Autumn 2006Low flow, flushing flows over summerNo Climbing GalaxiasCaptured
ii) Spring 2006Not surveyed due to high discharge
iv) Spring 2007Moderate flow, low flows with very small flushes over winter
vi) Spring 2008High flow, baseflows and flushes over winterNo Climbing GalaxiasCaptured
iii) Autumn 2007Low flow, sustained moderate flows over much of summer, but very low flows prior to surveyNo Climbing GalaxiasCaptured
v) Autumn 2008Disconnected pools, very lowflows over summerNo Climbing GalaxiasCaptured

McNeil et al. 2011 Fish and EWPs in the WMLR
75
Figure 57. Lengths of gambusia (G. holbrooki) at Gumeracha Weir (Torrens River) over six survey seasons, from autumn 2006 to spring 2008. The flow at the time of the survey and major hydrological pattern since the last survey are shown for each season.
Size class (mm)
0-5
6-10
11-1
516
-20
21-2
526
-30
31-3
536
-40
41-4
546
-50
51-5
556
-60
61-6
566
-70
71-7
576
-80
0
50
Size class (mm)
0-5
6-10
11-1
516
-20
21-2
526
-30
31-3
536
-40
41-4
546
-50
51-5
556
-60
61-6
566
-70
71-7
576
-80
0
50
Size class (mm)
0-5
6-10
11-1
516
-20
21-2
526
-30
31-3
536
-40
41-4
546
-50
51-5
556
-60
61-6
566
-70
71-7
576
-80
0
50
Size class (mm)
0-5
6-10
11-1
516
-20
21-2
526
-30
31-3
536
-40
41-4
546
-50
51-5
556
-60
61-6
566
-70
71-7
576
-80
0
50
Size class (mm)
0-5
6-10
11-1
516
-20
21-2
526
-30
31-3
536
-40
41-4
546
-50
51-5
556
-60
61-6
566
-70
71-7
576
-80
0
50
0-5
6-10
11-1
516
-20
21-2
526
-30
31-3
536
-40
41-4
546
-50
51-5
556
-60
61-6
566
-70
71-7
576
-80
0
50
Num
ber o
f ind
ivid
uals
i) Autumn 2006Low flow, flushing flows over summer
ii) Spring 2006Not surveyed due to high discharge
iv) Spring 2007Moderate flow, low flows with very small flushes over winter
vi) Spring 2008High flow, baseflows and flushes over winter
iii) Autumn 2007Low flow, sustained moderate flows over much of summer, but very low flows prior to survey
v) Autumn 2008Disconnected pools, very lowflows over summer

McNeil et al. 2011 Fish and EWPs in the WMLR
76
Figure 58. Lengths of redfin perch (P. fluviatilis) at Gumeracha Weir (Torrens River) over six survey seasons, from autumn 2006 to spring 2008. The flow at the time of the survey and major hydrological pattern since the last survey are shown for each season.
Size class (mm)
0-10
11-2
021
-30
31-4
041
-50
51-6
061
-70
71-8
081
-90
91-1
0010
1-11
011
1-12
012
1-13
013
1-14
014
1-15
015
1-16
016
1-17
017
1-18
018
1-19
019
1-20
020
1-21
021
1-22
022
1-23
023
1-24
024
1-25
025
1-26
026
1-27
027
1-28
028
1-29
029
1-30
0>3
00
0
50
Size class (mm)
0-10
11-2
021
-30
31-4
041
-50
51-6
061
-70
71-8
081
-90
91-1
0010
1-11
011
1-12
012
1-13
013
1-14
014
1-15
015
1-16
016
1-17
017
1-18
018
1-19
019
1-20
020
1-21
021
1-22
022
1-23
023
1-24
024
1-25
025
1-26
026
1-27
027
1-28
028
1-29
029
1-30
0>3
00
0
50
Size class (mm)
0-10
11-2
021
-30
31-4
041
-50
51-6
061
-70
71-8
081
-90
91-1
0010
1-11
011
1-12
012
1-13
013
1-14
014
1-15
015
1-16
016
1-17
017
1-18
018
1-19
019
1-20
020
1-21
021
1-22
022
1-23
023
1-24
024
1-25
025
1-26
026
1-27
027
1-28
028
1-29
029
1-30
0>3
00
0
50
Size class (mm)
0-10
11-2
021
-30
31-4
041
-50
51-6
061
-70
71-8
081
-90
91-1
0010
1-11
011
1-12
012
1-13
013
1-14
014
1-15
015
1-16
016
1-17
017
1-18
018
1-19
019
1-20
020
1-21
021
1-22
022
1-23
023
1-24
024
1-25
025
1-26
026
1-27
027
1-28
028
1-29
029
1-30
0>3
00
0
50
Size class (mm)
0-10
11-2
021
-30
31-4
041
-50
51-6
061
-70
71-8
081
-90
91-1
0010
1-11
011
1-12
012
1-13
013
1-14
014
1-15
015
1-16
016
1-17
017
1-18
018
1-19
019
1-20
020
1-21
021
1-22
022
1-23
023
1-24
024
1-25
025
1-26
026
1-27
027
1-28
028
1-29
029
1-30
0>3
00
0
50
0-10
11-2
021
-30
31-4
041
-50
51-6
061
-70
71-8
081
-90
91-1
0010
1-11
011
1-12
012
1-13
013
1-14
014
1-15
015
1-16
016
1-17
017
1-18
018
1-19
019
1-20
020
1-21
021
1-22
022
1-23
023
1-24
024
1-25
025
1-26
026
1-27
027
1-28
028
1-29
029
1-30
0>3
00
0
50
Num
ber o
f ind
ivid
uals
i) Autumn 2006Low flow, flushing flows over summer
ii) Spring 2006Not surveyed due to high discharge
iv) Spring 2007Moderate flow, low flows with very small flushes over winter
vi) Spring 2008High flow, baseflows and flushes over winter
iii) Autumn 2007Low flow, sustained moderate flows over much of summer, but very low flows prior to survey
v) Autumn 2008Disconnected pools, very lowflows over summer
McNeil et al. 2011 Fish and EWPs in the WMLR
77
3.2.2. Cudlee Creek
3.2.2.1. Site assessment
The Cudlee Creek site is situated in the Cudlee Creek Conservation Reserve upstream of the
Cudlee Creek township. All three pools are situated within a 1km reach with Pools 1 and 2
connected when full, and Pool 3 separated by a ~100m run riffle reach downstream of Pool 2
which is densely packed with Phragmites. The substrate of all three pools is rocky cobbles, with
slightly smaller particle size in Pool 3 (Table 29). All pools were similar in depth and riparian cover
with sparse overstorey of redgum and some bottlebrush with reasonable densities of Phragmites.
Pools 1 and 3 had low densities of snags. Electrofishing was conducted upstream and
downstream of the site when inundated as well as in the run between Pools 2 and 3. Pool 1 was
not sampled during autumn 2008 as the pool was too shallow for fyke nets and the field team was
concerned that active sampling with seines/electrofishing may endanger stressed fish within such a
shallow pool.
Table 29. Habitat characteristics of the three monitoring pools at Cudlee Creek in the River Torrens.
Cudlee Creek Substrate size (mm) Riparian cover (%) Snags Absolute max. depth (m)
Pool 1 10+ 10 3 1.8 Pool 2 10+ 5 0 1.8 Pool 3 5-10 10 2 2.0
Pool 1 (Figure 59) consisted of a run riffle at the upstream extent becoming gradually deeper and
at higher water levels joining with Pool 2. Due to consistently high water levels, Pools 1 and two
only separated in autumn 2008. Dissolved oxygen, pH and water temperature remained at benign
levels over the course of the study with little variation. Temperature fluctuated seasonally within
6 ˚C, whilst conductivity peaked in spring 2008 at 5080 µS/cm following the drying event in autumn
that year (Table 30), although the impact of these salinity levels on fish is likely to be relatively low
(McNeil et al. 2010a).
This site was not measured in spring 2006 due to very high transfer flows or in autumn 2008 due to
extreme drying. Macrophyte cover remained relatively low and consistent and was largely
represented by emergent Phragmites that fluctuated in cover with water levels. For the first four
seasons, this site enjoyed flushes and freshes and was flowing to some degree when sampled
before becoming isolated over summer 2008 and drying significantly, being reconnected in the
following spring when high flows returned at the time of sampling.

McNeil et al. 2011 Fish and EWPs in the WMLR
78
Figure 59. Cudlee Creek Pool 1 in autumn 2008. Note this pool was not sampled in 2008 as water levels were too low to set nets (~10cm).
Table 30. Water quality parameters recorded in Cudlee Creek Pool 1 during each survey. Note this pool was not sampled in spring 2006 and autumn 2008.
Pool 1 Season DO (ppm)
Cond. (μS/cm)
pH Temp. (ºC)
Max. depth (m)
Macrophytes (% cover)
Hydrology Antecedent Hydrology
2006 autumn 10 1029 7 13.2 1.8 15 Baseflow Flushes 2006 spring Not sampled (2m+) - High flow Flushes 2007 autumn 7 646 7 16.4 1.8 10 Low flow Freshes 2007 spring 8 364 8 20.3 1.2 10 Low flow Freshes 2008 autumn Not sampled 0.2 0 No flow low flows 2008 spring 9.2 5080 7.6 18.4 1.5 10 High flow low flows
The physical characteristics of Pool 2 (Figure 60) were very similar to Pool 1 with dissolved
oxygen, pH, water temperature and conductivity following almost identical patterns (Table 31).
Macrophyte cover, again due largely to emergent Phragmites beds was relatively low, whilst
maximum depth varied little except for extreme drying of the pool in autumn 2008 (see Figure 60).
Flushes and freshes occurred in the first four seasons and pool 2 was flowing to some degree
when sampled before becoming isolated over summer 2008 and drying significantly, being
reconnected in the following spring when high flows returned at the time of sampling.

McNeil et al. 2011 Fish and EWPs in the WMLR
79
Figure 60. Cudlee Creek Pool 2 in a) autumn 2007 and b) autumn 2008.
Table 31. Water quality parameters recorded in Cudlee Creek Pool 2 during each survey. Note this pool was not sampled in spring 2006.
Pool 2 Season DO (ppm)
Cond. (μS/cm)
pH Temp. (ºC)
Max. depth (m)
Macrophytes (% cover)
Hydrology Antecedent Hydrology
2006 autumn 10 1031 7 13.3 1.8 10 Baseflow Flushes 2006 spring Not sampled 2.0+ - High flow Flushes 2007 autumn 8 551 8 15.3 1.8 5 Low flow Freshes 2007 spring 9 358 8 21.0 1.8 5 Low flow Freshes 2008 autumn 9 1500 8 13.8 0.3 0 No flow Very low flows 2008 spring 9 5040 7.7 18.7 1.8 1 High flow low flows
Pool 3 (Figure 61) varied little in regards to dissolved oxygen, pH, water temperature (with
seasonal fluctuations) and conductivity (Table 32). Macrophyte cover was primarily emergent
Phragmites which varied little also between sampling seasons. As with the other pools, this pool
enjoyed flushes and freshes for the first four seasons and was flowing to some degree when
sampled before becoming isolated over summer 2008 and drying somewhat, being reconnected in
the following spring when high flows returned at the time of sampling. Pool 3 was less impacted by
drought and maintained a depth of ~1m during autumn 2008, making this the most permanent of
the three Cudlee Creek pools.

McNeil et al. 2011 Fish and EWPs in the WMLR
80
Figure 61. Cudlee Creek Pool 3 in a) spring and b) autumn 2008.
Table 32. Water quality parameters recorded in Cudlee Creek Pool 3 during each survey. Note this pool was not sampled in spring 2006.
Pool 3 Season DO (ppm)
Cond. (μS/cm)
pH Temp. (ºC)
Max. depth (m)
Macrophytes (% cover)
Hydrology Antecedent Hydrology
2006 autumn 11 985 8 14.3 2.0 20 Baseflow Flushes 2008 spring Not sampled (2.0+) - High flow Flushes 2007 autumn 10 523 8 15.2 2.0 10 Low flow Freshes 2007 spring 10 325 8 21 1.6 5 Low flow Freshes 2008 autumn 13 1400 8 13.3 1.0 0 No flow Very low flows 2008 spring Not sampled 2.0 5 High flow low flows
3.2.2.2. Water Quality
Salinity was the only water quality parameter to be high enough to impact on aquatic biota. Whilst
levels recorded here may be high enough to impact on particularly sensitive invertebrate species,
all levels recorded are suitable for the maintenance of native fish.
3.2.2.3. Hydrology
The water level at Cudlee Creek was relatively high, compared to the other sites during the present
surveys. In 2006 the water level was moderate during autumn, and was too high to allow nets to
be set in spring. In autumn 2007 the water level was low, but it was moderate in spring 2007. The
only time that the pools at Cudlee Creek were disconnected was during the autumn 2008 survey.
In spring 2008, the water level was high.
Except for a pulsed fresh in mid-July, flow was typically low at the Cudlee Creek gauge from the
time that data was collected in late June 2006 until early October 2006 (Figure 62). There was then

McNeil et al. 2011 Fish and EWPs in the WMLR
81
a sustained fresh from October 6 to November 17, 2006, and flow was too high to allow nets to be
set at this site in the spring. Flows were low at the gauge for most of the remainder of the year. In
2007, baseflows were maintained throughout January, followed by a sustained fresh from the
beginning of February until mid-March. There were then low flows from this time until mid-April,
followed by a brief period of zero flow, which was alleviated by a large fresh (>70 ML) on April 29.
From this time there were low flows at Cudlee Creek up to the autumn 2007 surveys, conducted on
May 8.
Low flows continued until late June, followed by sustained baseflow plus a number of freshes and
flushes from late June until the end of July. Flows declined from baseflows in early August to low
flows by mid-August. However, baseflows returned from early September to November 11. This
was followed by a week and a half of low flows up to the spring 2007 surveys, conducted on
November 22. Baseflows returned for three weeks after these surveys, but there was no readable
flow by the beginning of 2008. This absence of flow continued until the autumn 2008 surveys,
conducted on April 17. Over winter 2008 there were good baseflows and some freshes. The flow
ended in September, and resumed shortly before November 2008.
Figure 62. Hydrograph for flow in Torrens River at Cudlee Creek. Flow data (ML/day) was collected at Cudlee Creek (gauge number A5041019) from June 27, 2006 (indicated by blue arrow). The timing of each survey season is also shown above the figure. Note that no survey was possible during spring 2006 due to the prevailing high discharge at the survey site.
Jan/
05
Mar
/05
M
ay/0
5
Jul/0
5
Sep/
05
Nov/0
5
Jan/
06
Mar
/06
M
ay/0
6
Jul/0
6
Sep/
06
Nov/0
6
Jan/
07
Mar
/07
M
ay/0
7
Jul/0
7
Sep/
07
Nov/0
7
Jan/
08
Mar
/08
M
ay/0
8
Jul/0
8
Sep/
08
Nov/0
8
Jan/
09
ML/
day
0
50
100
150
200
2006
A
2006
S
2007
S
2007
A
2008
A
2008
S

McNeil et al. 2011 Fish and EWPs in the WMLR
82
3.2.2.4. Fish community
Four native and three introduced fish species were captured at Cudlee Creek over the five survey
seasons (Figure 63). In most seasons there were only relatively small numbers of fish captured,
and there was considerable variation in the proportions of each taxa captured across seasons.
During the first survey season, in autumn 2006, 90% of the total capture consisted of similar
numbers of flathead gudgeon and redfin perch. These numbers decreased in each subsequent
survey. Small numbers of dwarf flathead gudgeon were captured during all surveys, whereas
climbing galaxias were captured only during autumn and spring 2007, and spring 2008. During the
last four surveys a large proportion of gambusia were captured, and were the most common fish
captured over the last two autumns. Small numbers of carp were also captured during the past
four surveys.
Across successive autumns, from 2006 to 2008, the fish community at Cudlee Creek changed from
being dominated by flathead gudgeon and redfin perch to being dominated by gambusia. This
dominance by gambusia during autumn 2008 was closely associated with pools becoming
disconnected and having low water depths at the time of surveys. During spring surveys there
were few fish captured and considerable variability in the structure of the communities among
pools. The site-scale community structure during spring was distinctly different from that occurring
during all autumn surveys, reflecting the comparatively high temperatures and disconnection prior
to autumn and the pulsed high flows prior to the spring surveys.
Figure 63. Abundances of each taxa present in the fish communities at Cudlee Creek (Torrens River) over six survey seasons. There was no survey data for this site in spring 2006 due to very high flow related to River Murray water transfers.
Autumn 06 Spring 06 Autumn 07 Spring 07 Autumn 08 Spring 08 0
50
100
150
2000 2050 2100 2150 2200
European Carp Climbing Galaxias Mountain Galaxias Redfin Perch Dwarf Flathead Gudgeon Flathead Gudgeon Gambusia
No.
of I
ndiv
idua
ls

McNeil et al. 2011 Fish and EWPs in the WMLR
83
3.2.2.5. Fish Population Structure
A large number of small flathead gudgeon, as well as a number of larger individuals from a wide
range of size classes, were captured during the initial surveys conducted at Cudlee Creek in
autumn 2006 (Figure 64). Many medium sized individuals were captured in spring 2006.
However, there were far fewer small individuals captured in autumn 2007, and a low number of
large individuals captured in spring 2007. In autumn 2008 there was again a large number of small
individuals. These smaller fish appear to have persisted at the site and matured to larger
individuals. A small number of dwarf flathead gudgeon were captured (Figure 65) with the highest
number occurring during autumn 2008. The size class captured in spring 2008 was similar to that
captured in the preceding autumn.
Climbing galaxias were captured in 2007, with large individuals in reproductive condition captured
in autumn and small individuals captured in spring (Figure 66). In 2008, climbing galaxias were
absent in the autumn survey, but a cohort of new recruits did appear in spring. There was only one
adult mountain galaxias captured during autumn 2007 (Figure 67). However, with the increased
flows prior to the spring 2008 survey, a large number of new recruits were captured.
There was much fluctuation in the numbers of gambusia captured amongst survey seasons (Figure
68). The size distribution during each survey did not vary a great deal, reflecting the constant
recruitment typical of this species.
A large number of medium to large sized redfin perch were captured during autumn 2006 (Figure
69). However, in all subsequent surveys there were only a small number of individuals recorded. A
small number of new recruits were evident in spring 2008.

McNeil et al. 2011 Fish and EWPs in the WMLR
84
Figure 64. Lengths of dwarf flathead gudgeon (P. macrostomus) at Cudlee Creek (Torrens River) over six survey seasons, from autumn 2006 to spring 2008. The flow at the time of the survey and major hydrological pattern since the last survey are shown for each season.
Size class (mm)
0-5
6-10
11-1
516
-20
21-2
526
-30
31-3
536
-40
41-4
546
-50
51-5
556
-60
61-6
566
-70
71-7
5
0
20
Size class (mm)
0-5
6-10
11-1
516
-20
21-2
526
-30
31-3
536
-40
41-4
546
-50
51-5
556
-60
61-6
566
-70
71-7
5
0
20
Size class (mm)
0-5
6-10
11-1
516
-20
21-2
526
-30
31-3
536
-40
41-4
546
-50
51-5
556
-60
61-6
566
-70
71-7
5
0
20
Size class (mm)
0-5
6-10
11-1
516
-20
21-2
526
-30
31-3
536
-40
41-4
546
-50
51-5
556
-60
61-6
566
-70
71-7
5
0
20
Size class (mm)
0-5
6-10
11-1
516
-20
21-2
526
-30
31-3
536
-40
41-4
546
-50
51-5
556
-60
61-6
566
-70
71-7
5
0
20
Size class (mm)
0-5
6-10
11-1
516
-20
21-2
526
-30
31-3
536
-40
41-4
546
-50
51-5
556
-60
61-6
566
-70
71-7
5
0
20
Num
ber o
f ind
ivid
uals
i) Autumn 2006Moderate flow, flushing flows over summer
ii) Spring 2006Not surveyed due to high discharge
iv) Spring 2007Moderate flow, low flows with multiple freshes over winter
vi) Spring 2008High flow, low flows withmultiple freshes and flushes over winter
iii) Autumn 2007Low flow, sustained freshes over summer, but very low flows prior to survey
v) Autumn 2008Disconnected pools, very lowflows over summer

McNeil et al. 2011 Fish and EWPs in the WMLR
85
Figure 65. Lengths of flathead gudgeon (P. grandiceps) at Cudlee Creek (Torrens River) over six survey seasons, from autumn 2006 to spring 2008. The flow at the time of the survey and major hydrological pattern since the last survey are shown for each season.
Size class (mm)
0-5
6-10
11-1
516
-20
21-2
526
-30
31-3
536
-40
41-4
546
-50
51-5
556
-60
61-6
566
-70
71-7
576
-80
81-8
586
-90
91-9
596
-100
>100
0
20
Size class (mm)
0-5
6-10
11-1
516
-20
21-2
526
-30
31-3
536
-40
41-4
546
-50
51-5
556
-60
61-6
566
-70
71-7
576
-80
81-8
586
-90
91-9
596
-100
>100
0
20
Size class (mm)
0-5
6-10
11-1
516
-20
21-2
526
-30
31-3
536
-40
41-4
546
-50
51-5
556
-60
61-6
566
-70
71-7
576
-80
81-8
586
-90
91-9
596
-100
>100
0
20
Size class (mm)
0-5
6-10
11-1
516
-20
21-2
526
-30
31-3
536
-40
41-4
546
-50
51-5
556
-60
61-6
566
-70
71-7
576
-80
81-8
586
-90
91-9
596
-100
>100
0
20
Size class (mm)
0-5
6-10
11-1
516
-20
21-2
526
-30
31-3
536
-40
41-4
546
-50
51-5
556
-60
61-6
566
-70
71-7
576
-80
81-8
586
-90
91-9
596
-100
>100
0
20
0-5
6-10
11-1
516
-20
21-2
526
-30
31-3
536
-40
41-4
546
-50
51-5
556
-60
61-6
566
-70
71-7
576
-80
81-8
586
-90
91-9
596
-100
>100
0
20
Num
ber o
f ind
ivid
uals
i) Autumn 2006Moderate flow, flushing flows over summer
ii) Spring 2006Not surveyed due to high discharge
iv) Spring 2007Moderate flow, low flows with multiple freshes over winter
vi) Spring 2008High flow, low flows withmultiple freshes and flushes over winter
iii) Autumn 2007Low flow, sustained freshes over summer, but very low flows prior to survey
v) Autumn 2008Disconnected pools, very lowflows over summer

McNeil et al. 2011 Fish and EWPs in the WMLR
86
Figure 66. Lengths of climbing galaxias (G. brevipinnis) at Cudlee Creek (Torrens River) over six survey seasons, from autumn 2006 to spring 2008. The flow at the time of the survey and major hydrological pattern since the last survey are shown for each season.
Size class (mm)
0-5
6-10
11-1
516
-20
21-2
526
-30
31-3
536
-40
41-4
546
-50
51-5
556
-60
61-6
566
-70
71-7
576
-80
81-8
586
-90
91-9
596
-100
101-
105
106-
110
111-
115
116-
120
0
10
Size class (mm)
0-5
6-10
11-1
516
-20
21-2
526
-30
31-3
536
-40
41-4
546
-50
51-5
556
-60
61-6
566
-70
71-7
576
-80
81-8
586
-90
91-9
596
-100
101-
105
106-
110
111-
115
116-
120
0
10
Size class (mm)
0-5
6-10
11-1
516
-20
21-2
526
-30
31-3
536
-40
41-4
546
-50
51-5
556
-60
61-6
566
-70
71-7
576
-80
81-8
586
-90
91-9
596
-100
101-
105
106-
110
111-
115
116-
120
0
10
Size class (mm)
0-5
6-10
11-1
516
-20
21-2
526
-30
31-3
536
-40
41-4
546
-50
51-5
556
-60
61-6
566
-70
71-7
576
-80
81-8
586
-90
91-9
596
-100
101-
105
106-
110
111-
115
116-
120
0
10
Size class (mm)
0-5
6-10
11-1
516
-20
21-2
526
-30
31-3
536
-40
41-4
546
-50
51-5
556
-60
61-6
566
-70
71-7
576
-80
81-8
586
-90
91-9
596
-100
101-
105
106-
110
111-
115
116-
120
0
10
0-5
6-10
11-1
516
-20
21-2
526
-30
31-3
536
-40
41-4
546
-50
51-5
556
-60
61-6
566
-70
71-7
576
-80
81-8
586
-90
91-9
596
-100
101-
105
106-
110
111-
115
116-
120
0
10
Num
ber o
f ind
ivid
uals
i) Autumn 2006Moderate flow, flushing flows over summerNo Climbing Galaxias Captured
ii) Spring 2006Not surveyed due to high discharge
iv) Spring 2007Moderate flow, low flows with multiple freshes over winter
vi) Spring 2006High flow, low flows withmultiple freshes and flushes over winter
iii) Autumn 2007Low flow, sustained freshes over summer, but very low flows prior to survey
v) Autumn 2008Disconnected pools, very lowflows over summerNo Climbing Galaxias Captured

McNeil et al. 2011 Fish and EWPs in the WMLR
87
Figure 67. Lengths of mountain galaxias (G. olidus) at Cudlee Creek (Torrens River) over six survey seasons, from autumn 2006 to spring 2008. The flow at the time of the survey and major hydrological pattern since the last survey are shown for each season.
Size class (mm)
0-5
6-10
11-1
516
-20
21-2
526
-30
31-3
536
-40
41-4
546
-50
51-5
556
-60
61-6
566
-70
71-7
576
-80
81-8
586
-90
91-9
596
-100
101-
105
106-
110
111-
115
116-
120
0
10
Size class (mm)
0-5
6-10
11-1
516
-20
21-2
526
-30
31-3
536
-40
41-4
546
-50
51-5
556
-60
61-6
566
-70
71-7
576
-80
81-8
586
-90
91-9
596
-100
101-
105
106-
110
111-
115
116-
120
0
10
Size class (mm)
0-5
6-10
11-1
516
-20
21-2
526
-30
31-3
536
-40
41-4
546
-50
51-5
556
-60
61-6
566
-70
71-7
576
-80
81-8
586
-90
91-9
596
-100
101-
105
106-
110
111-
115
116-
120
0
10
Size class (mm)
0-5
6-10
11-1
516
-20
21-2
526
-30
31-3
536
-40
41-4
546
-50
51-5
556
-60
61-6
566
-70
71-7
576
-80
81-8
586
-90
91-9
596
-100
101-
105
106-
110
111-
115
116-
120
0
10
Size class (mm)
0-5
6-10
11-1
516
-20
21-2
526
-30
31-3
536
-40
41-4
546
-50
51-5
556
-60
61-6
566
-70
71-7
576
-80
81-8
586
-90
91-9
596
-100
101-
105
106-
110
111-
115
116-
120
0
10
0-5
6-10
11-1
516
-20
21-2
526
-30
31-3
536
-40
41-4
546
-50
51-5
556
-60
61-6
566
-70
71-7
576
-80
81-8
586
-90
91-9
596
-100
101-
105
106-
110
111-
115
116-
120
0
10
Num
ber o
f ind
ivid
uals
i) Autumn 2006Moderate flow, flushing flows over summerNo Mountain Galaxias Captured
ii) Spring 2006Not surveyed due to high discharge
iv) Spring 2007Moderate flow, low flows with multiple freshes over winterNo Mountain Galaxias Captured
vi) Spring 2006High flow, low flows withmultiple freshes and flushes over winter
iii) Autumn 2007Low flow, sustained freshes over summer, but very low flows prior to survey
v) Autumn 2008Disconnected pools, very lowflows over summerNo Mountain Galaxias Captured

McNeil et al. 2011 Fish and EWPs in the WMLR
88
Figure 68. Lengths of gambusia (G. holbrooki) at Cudlee Creek (Torrens River) over six survey seasons, from autumn 2006 to spring 2008. The flow at the time of the survey and major hydrological pattern since the last survey are shown for each season.
Size class (mm)
0-5
6-10
11-1
516
-20
21-2
526
-30
31-3
536
-40
41-4
546
-50
51-5
556
-60
61-6
566
-70
71-7
576
-80
0
50
Size class (mm)
0-5
6-10
11-1
516
-20
21-2
526
-30
31-3
536
-40
41-4
546
-50
51-5
556
-60
61-6
566
-70
71-7
576
-80
0
50
Size class (mm)
0-5
6-10
11-1
516
-20
21-2
526
-30
31-3
536
-40
41-4
546
-50
51-5
556
-60
61-6
566
-70
71-7
576
-80
0
50
Size class (mm)
0-5
6-10
11-1
516
-20
21-2
526
-30
31-3
536
-40
41-4
546
-50
51-5
556
-60
61-6
566
-70
71-7
576
-80
0
50
Size class (mm)
0-5
6-10
11-1
516
-20
21-2
526
-30
31-3
536
-40
41-4
546
-50
51-5
556
-60
61-6
566
-70
71-7
576
-80
0
50
0-5
6-10
11-1
516
-20
21-2
526
-30
31-3
536
-40
41-4
546
-50
51-5
556
-60
61-6
566
-70
71-7
576
-80
0
50
Num
ber o
f ind
ivid
uals
i) Autumn 2006Moderate flow, flushing flows over summer
ii) Spring 2006Not surveyed due to high discharge
iv) Spring 2007Moderate flow, low flows with multiple freshes over winter
vi) Spring 2006High flow, low flows withmultiple freshes and flushes over winter
iii) Autumn 2007Low flow, sustained freshes over summer, but very low flows prior to survey
v) Autumn 2008Disconnected pools, very lowflows over summer

McNeil et al. 2011 Fish and EWPs in the WMLR
89
Figure 69. Lengths of redfin perch (P. fluviatilis) at Cudlee Creek (Torrens River) over six survey seasons, from autumn 2006 to spring 2008. The flow at the time of the survey and major hydrological pattern since the last survey are shown for each season.
Size class (mm)
0-10
11-2
021
-30
31-4
041
-50
51-6
061
-70
71-8
081
-90
91-1
0010
1-11
011
1-12
012
1-13
013
1-14
014
1-15
015
1-16
016
1-17
017
1-18
018
1-19
019
1-20
020
1-21
021
1-22
022
1-23
023
1-24
024
1-25
025
1-26
026
1-27
027
1-28
028
1-29
029
1-30
0>3
00
0
10
Size class (mm)
0-10
11-2
021
-30
31-4
041
-50
51-6
061
-70
71-8
081
-90
91-1
0010
1-11
011
1-12
012
1-13
013
1-14
014
1-15
015
1-16
016
1-17
017
1-18
018
1-19
019
1-20
020
1-21
021
1-22
022
1-23
023
1-24
024
1-25
025
1-26
026
1-27
027
1-28
028
1-29
029
1-30
0>3
00
0
10
Size class (mm)
0-10
11-2
021
-30
31-4
041
-50
51-6
061
-70
71-8
081
-90
91-1
0010
1-11
011
1-12
012
1-13
013
1-14
014
1-15
015
1-16
016
1-17
017
1-18
018
1-19
019
1-20
020
1-21
021
1-22
022
1-23
023
1-24
024
1-25
025
1-26
026
1-27
027
1-28
028
1-29
029
1-30
0>3
00
0
10
Size class (mm)
0-10
11-2
021
-30
31-4
041
-50
51-6
061
-70
71-8
081
-90
91-1
0010
1-11
011
1-12
012
1-13
013
1-14
014
1-15
015
1-16
016
1-17
017
1-18
018
1-19
019
1-20
020
1-21
021
1-22
022
1-23
023
1-24
024
1-25
025
1-26
026
1-27
027
1-28
028
1-29
029
1-30
0>3
00
0
10
Size class (mm)
0-10
11-2
021
-30
31-4
041
-50
51-6
061
-70
71-8
081
-90
91-1
0010
1-11
011
1-12
012
1-13
013
1-14
014
1-15
015
1-16
016
1-17
017
1-18
018
1-19
019
1-20
020
1-21
021
1-22
022
1-23
023
1-24
024
1-25
025
1-26
026
1-27
027
1-28
028
1-29
029
1-30
0>3
00
0
10
0-10
11-2
021
-30
31-4
041
-50
51-6
061
-70
71-8
081
-90
91-1
0010
1-11
011
1-12
012
1-13
013
1-14
014
1-15
015
1-16
016
1-17
017
1-18
018
1-19
019
1-20
020
1-21
021
1-22
022
1-23
023
1-24
024
1-25
025
1-26
026
1-27
027
1-28
028
1-29
029
1-30
0>3
00
0
10
Num
ber o
f ind
ivid
uals
i) Autumn 2006Moderate flow, flushing flows over summer
ii) Spring 2006Not surveyed due to high discharge
iv) Spring 2007Moderate flow, low flows with multiple freshes over winter
vi) Spring 2006High flow, low flows withmultiple freshes and flushes over winter
iii) Autumn 2007Low flow, sustained freshes over summer, but very low flows prior to survey
v) Autumn 2008Disconnected pools, very lowflows over summer

McNeil et al. 2011 Fish and EWPs in the WMLR
90
3.2.3. Gorge Weir
3.2.3.1. Site assessment
The three pools were situated directly below the Gorge Weir. All pools possessed cobbled
and gravel substrates, low levels of snags and dense riparian vegetation (Table 33); even
though the riparian overstorey was somewhat sparse and introduced vegetation was
dominant. Electrofishing was conducted between upstream and downstream of the sampling
pools all of which had run/riffle reaches dominated by Phragmites. Pool 1 was the deepest
and largest pool, with Pool 2 being the shallowest at ~1.5m maximum depth.
Table 33. Habitat characteristics of the three monitoring pools at Gorge Weir in the River Torrens.
Gorge Weir Substrate size (mm) Riparian cover (%)
Snags Absolute max. depth (m)
Pool 1 <1-10 30 0 3.0 Pool 2 <1-10+ 80 1 1.5 Pool 3 <1-10+ 80 2 2.0
Pool 1 (Figure 70) is located a few hundred metres downstream of the weir wall beneath the
water transfer pipe beside the Gorge Rd. This pool was a deep and relatively large pool with
benign and reasonably stable salinity, dissolved oxygen, pH, water temperature and depth
(Table 34). Riparian cover is relatively sparse and predominantly exotic trees and shrubs
(i.e. Salix spp.) with some eucalypts on higher on the banks. Macrophyte cover was
relatively low and dominated by emergent Phragmites beds that varied with water depth.
The flow conditions during sampling were always either low or no flow whilst the antecedent
flow conditions consisted of baseflows and flushes across all seasons.
Figure 70. Gorge Weir Pool 1 in a) spring 2006 and b) autumn 2008.
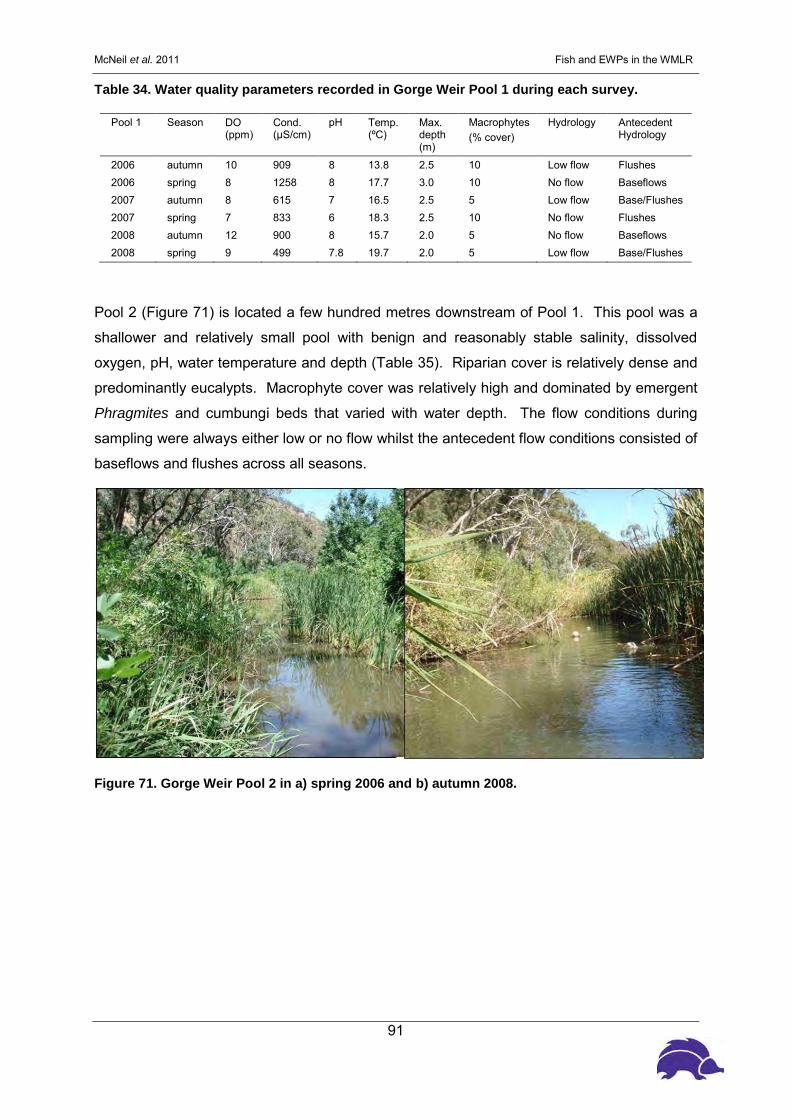
McNeil et al. 2011 Fish and EWPs in the WMLR
91
Table 34. Water quality parameters recorded in Gorge Weir Pool 1 during each survey.
Pool 1 Season DO (ppm)
Cond. (μS/cm)
pH Temp. (ºC)
Max. depth (m)
Macrophytes (% cover)
Hydrology Antecedent Hydrology
2006 autumn 10 909 8 13.8 2.5 10 Low flow Flushes 2006 spring 8 1258 8 17.7 3.0 10 No flow Baseflows 2007 autumn 8 615 7 16.5 2.5 5 Low flow Base/Flushes 2007 spring 7 833 6 18.3 2.5 10 No flow Flushes 2008 autumn 12 900 8 15.7 2.0 5 No flow Baseflows 2008 spring 9 499 7.8 19.7 2.0 5 Low flow Base/Flushes
Pool 2 (Figure 71) is located a few hundred metres downstream of Pool 1. This pool was a
shallower and relatively small pool with benign and reasonably stable salinity, dissolved
oxygen, pH, water temperature and depth (Table 35). Riparian cover is relatively dense and
predominantly eucalypts. Macrophyte cover was relatively high and dominated by emergent
Phragmites and cumbungi beds that varied with water depth. The flow conditions during
sampling were always either low or no flow whilst the antecedent flow conditions consisted of
baseflows and flushes across all seasons.
Figure 71. Gorge Weir Pool 2 in a) spring 2006 and b) autumn 2008.

McNeil et al. 2011 Fish and EWPs in the WMLR
92
Table 35. Water quality parameters recorded in Gorge Weir Pool 2 during each survey.
Pool 2 Season DO (ppm)
Cond. (μS/cm)
pH Temp. (ºC)
Max. depth (m)
Macrophytes (% cover)
Hydrology Antecedent Hydrology
2006 autumn 8 815 8 12.8 1.5 40 Low flow Flushes 2006 spring 4 1070 8 18.4 1.5 10 No flow Baseflows 2007 autumn 7 646 7 16.4 1.4 10 Low flow Baseflows +
flush 2007 spring 8 857 5 17.4 1.5 5 No flow Flushes 2008 autumn 10 800 8 14.9 1.5 5 No flow Baseflows 2008 spring 7.5 509 7.8 21 1.5 30 No flow Baseflows
Pool 3 (Figure 72) was narrower and shallower than Pool 1 and dominated by thick stands of
riparian vegetation (predominantly exotic species) and emergent Phragmites beds on all
sides which varied in cover between 5% and 30%. Whilst spring 2006 saw low dissolved
oxygen levels and slightly increased salinities, water quality parameters were consistent and
benign throughout the study (Table 36). Water depth did not fluctuate tremendously
throughout the study, with flow conditions consistently low or still, whilst antecedent flow
consisted of baseflows and/or flushes.
Figure 72. Gorge Weir Pool 3 in a) spring 2006 and b) autumn 2008.

McNeil et al. 2011 Fish and EWPs in the WMLR
93
Table 36. Water quality parameters recorded in Gorge Weir Pool 3 during each survey.
Pool 3 Season DO (ppm)
Cond. (μS/cm)
pH Temp. (ºC)
Max. depth (m)
Macrophytes (% cover)
Hydrology Antecedent Hydrology
2006 autumn 8 1093 8 13.5 2.0 20 Low flow Flushes 2006 spring 4 1338 7 18.4 1.2 20 No flow Baseflows 2007 autumn 5 800 7 16.7 2.0 30 Low flow Baseflows/flushes 2007 spring 8 870 6 17.7 1.5 5 No flow Flushes 2008 autumn 13 900 8 16.4 1.0 25 No flow Baseflows 2008 spring 8.5 506 7.7 20 2.0 30 Low flow Baseflows/flushes
3.2.3.2. Water Quality
Dissolved oxygen levels were low during 2006 and may have impacted on particularly
sensitive species (McNeil and Closs 2007), although it is not expected that any species in the
WMLR would be overly sensitive to recorded levels. Salinity was the only other water quality
parameter to be high enough to impact on aquatic biota. Whilst levels recorded here may be
high enough to impact on particularly sensitive invertebrate species, all levels recorded are
suitable for the maintenance of native fish.
3.2.3.3. Hydrology
The water flow was low at Gorge Weir during the autumn surveys of 2006 and 2007, and the
spring survey in 2008. Pools were disconnected during spring 2006 and 2007, and autumn
2008. Baseflow was maintained, and there was a small fresh, at Gorge Weir from the time
that gauge data was collected at the end of June 2006 to the spring 2006 surveys, conducted
on November 24 (Figure 73).
Baseflow continued through to the end of April 2007 and there was a small flushing flow of
over 100 ML/day for two days the week before the autumn 2007 surveys were conducted, on
May 3. The winter of 2007 was much wetter than that of 2006. There were three large
flushing flows in June and July, followed by sustained freshes in August and high baseflows
(>8 ML/day) throughout September. Flow then dropped and was low from mid-October until
there was a small pulsed fresh of 12 ML two days prior to the spring 2007 surveys,
conducted on November 20. Baseflow was maintained from this date until the autumn 2008
surveys, conducted on April 17. Subsequent to the autumn survey, there were very low flows
right up to the spring survey apart from two large flushes.
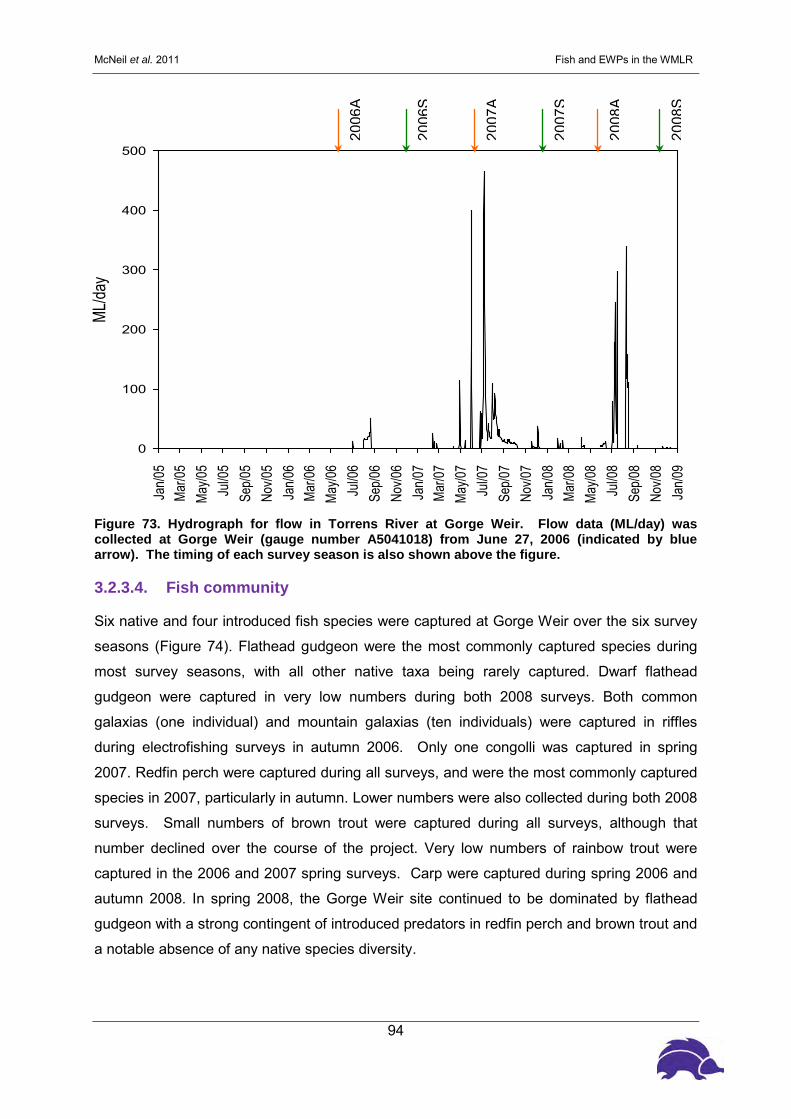
McNeil et al. 2011 Fish and EWPs in the WMLR
94
Figure 73. Hydrograph for flow in Torrens River at Gorge Weir. Flow data (ML/day) was collected at Gorge Weir (gauge number A5041018) from June 27, 2006 (indicated by blue arrow). The timing of each survey season is also shown above the figure.
3.2.3.4. Fish community
Six native and four introduced fish species were captured at Gorge Weir over the six survey
seasons (Figure 74). Flathead gudgeon were the most commonly captured species during
most survey seasons, with all other native taxa being rarely captured. Dwarf flathead
gudgeon were captured in very low numbers during both 2008 surveys. Both common
galaxias (one individual) and mountain galaxias (ten individuals) were captured in riffles
during electrofishing surveys in autumn 2006. Only one congolli was captured in spring
2007. Redfin perch were captured during all surveys, and were the most commonly captured
species in 2007, particularly in autumn. Lower numbers were also collected during both 2008
surveys. Small numbers of brown trout were captured during all surveys, although that
number declined over the course of the project. Very low numbers of rainbow trout were
captured in the 2006 and 2007 spring surveys. Carp were captured during spring 2006 and
autumn 2008. In spring 2008, the Gorge Weir site continued to be dominated by flathead
gudgeon with a strong contingent of introduced predators in redfin perch and brown trout and
a notable absence of any native species diversity.
Jan/0
5 Ma
r/05
May/0
5 Ju
l/05
Sep/0
5 No
v/05
Jan/0
6 Ma
r/06
May/0
6 Ju
l/06
Sep/0
6 No
v/06
Jan/0
7 Ma
r/07
May/0
7 Ju
l/07
Sep/0
7 No
v/07
Jan/0
8 Ma
r/08
May/0
8 Ju
l/08
Sep/0
8 No
v/08
Jan/0
9
ML/da
y
0
100
200
300
400
500
2006
A
2006
S
2007
S
2007
A
2008
A
2008
S

McNeil et al. 2011 Fish and EWPs in the WMLR
95
Figure 74. Abundances of each taxa present in the fish communities at Gorge Weir (Torrens River) over six survey seasons.
3.2.3.5. Fish population structure
Across surveys, there were large fluctuations in the numbers of flathead gudgeon captured at
Gorge Weir. In 2006 there were large numbers of juveniles captured in autumn and of
medium sized fish in spring (Figure 75). However, in 2007 there were no small flathead
gudgeon captured in autumn and only a relatively small number of medium to large fish in
spring. During autumn 2008, there were again large numbers of both small and large
flathead gudgeon captured. In spring 2008, a range of sizes were present with the exception
of larger individuals. There were three large individual common galaxias captured at Gorge
Weir throughout the survey (Figure 76). Small and medium sized mountain galaxias were
captured whilst electrofishing in autumn 2006 and again in spring 2008 (Figure 77)
The numbers of redfin perch captured peaked during autumn 2007, when large numbers of
juveniles were captured (Figure 78). Relatively small numbers of redfin perch, of a wide
range of sizes, were captured during all other surveys. Moderate numbers of mostly large
brown trout were present in the first two surveys in 2006. However, after that the number
declined in the catch and mostly smaller individuals were captured until spring 2008 when
several larger brown trout were captured (Figure 79). In addition, one large adult congolli
was captured at Gorge Weir, in spring 2007 (size = 263 mm).
Autumn 06 Spring 06 Autumn 07 Spring 07 Autumn 08 Spring 08
No.
of i
ndiv
idua
ls
0
10
20
30
40
50
60
70
80
90
100
200
300
400 European Carp Common Galaxias Mountain Galaxias Eastern Gambusia Rainbow Trout Dwarf Flathead Gudgeon Congolli Brown Trout Redfin Flathead Gudgeon

McNeil et al. 2011 Fish and EWPs in the WMLR
96
Figure 75. Lengths of flathead gudgeon (P. grandiceps) at Gorge Weir (Torrens River) over six survey seasons, from autumn 2006 to spring 2008. The flow at the time of the survey and major hydrological pattern since the last survey are shown for each season.
Size class (mm)
0-5
6-10
11-1
516
-20
21-2
526
-30
31-3
536
-40
41-4
546
-50
51-5
556
-60
61-6
566
-70
71-7
576
-80
81-8
586
-90
91-9
596
-100
>100
0
50
Size class (mm)
0-5
6-10
11-1
516
-20
21-2
526
-30
31-3
536
-40
41-4
546
-50
51-5
556
-60
61-6
566
-70
71-7
576
-80
81-8
586
-90
91-9
596
-100
>100
0
50
100
Size class (mm)
0-5
6-10
11-1
516
-20
21-2
526
-30
31-3
536
-40
41-4
546
-50
51-5
556
-60
61-6
566
-70
71-7
576
-80
81-8
586
-90
91-9
596
-100
>100
0
50
Size class (mm)
0-5
6-10
11-1
516
-20
21-2
526
-30
31-3
536
-40
41-4
546
-50
51-5
556
-60
61-6
566
-70
71-7
576
-80
81-8
586
-90
91-9
596
-100
>100
0
50
Size class (mm)
0-5
6-10
11-1
516
-20
21-2
526
-30
31-3
536
-40
41-4
546
-50
51-5
556
-60
61-6
566
-70
71-7
576
-80
81-8
586
-90
91-9
596
-100
>100
0
50
100
Size class (mm)
0-5
6-10
11-1
516
-20
21-2
526
-30
31-3
536
-40
41-4
546
-50
51-5
556
-60
61-6
566
-70
71-7
576
-80
81-8
586
-90
91-9
596
-100
>100
0
50
Num
ber o
f ind
ivid
uals
i) Autumn 2006Low flow, flushing flows over summer
ii) Spring 2006Disconnected pools, baseflows maintainedover winter
iv) Spring 2007Disconnected pools, multiple freshes and flowsover winter
vi) Spring 2008Disconnected pools, multiple freshes and flows over winter
iii) Autumn 2007Low flow, baseflow maintained over summer withsmall flush prior to survey
v) Autumn 2008Disconnected pools, baseflowmaintained over summer

McNeil et al. 2011 Fish and EWPs in the WMLR
97
Figure 76. Lengths of common galaxias (G. maculatus) at Gorge Weir (Torrens River) over six survey seasons, from autumn 2006 to spring 2008. The flow at the time of the survey and major hydrological pattern since the last survey are shown for each season.
Size class (mm)
0-10
11-2
021
-30
31-4
041
-50
51-6
061
-70
71-8
081
-90
91-1
0010
1-11
011
1-12
012
1-13
013
1-14
014
1-15
015
1-16
016
1-17
017
1-18
0
0
10
Size class (mm)
0-10
11-2
021
-30
31-4
041
-50
51-6
061
-70
71-8
081
-90
91-1
0010
1-11
011
1-12
012
1-13
013
1-14
014
1-15
015
1-16
016
1-17
017
1-18
0
0
10
Size class (mm)
0-10
11-2
021
-30
31-4
041
-50
51-6
061
-70
71-8
081
-90
91-1
0010
1-11
011
1-12
012
1-13
013
1-14
014
1-15
015
1-16
016
1-17
017
1-18
0
0
10
Size class (mm)
0-10
11-2
021
-30
31-4
041
-50
51-6
061
-70
71-8
081
-90
91-1
0010
1-11
011
1-12
012
1-13
013
1-14
014
1-15
015
1-16
016
1-17
017
1-18
0
0
10
Size class (mm)
0-10
11-2
021
-30
31-4
041
-50
51-6
061
-70
71-8
081
-90
91-1
0010
1-11
011
1-12
012
1-13
013
1-14
014
1-15
015
1-16
016
1-17
017
1-18
0
0
10
0-10
11-2
021
-30
31-4
041
-50
51-6
061
-70
71-8
081
-90
91-1
0010
1-11
011
1-12
012
1-13
013
1-14
014
1-15
015
1-16
016
1-17
017
1-18
0
0
10
Num
ber o
f ind
ivid
uals
i) Autumn 2006Low flow, flushing flows over summer
ii) Spring 2006Disconnected pools, baseflows maintained over winterNo Common Galaxias captured
iv) Spring 2007Disconnected pools, multiple freshes and flowsover winterNo Common Galaxias captured
vi) Spring 2008Disconnected pools, multiple freshes and flows over winterNo Common Galaxias captured
iii) Autumn 2007Low flow, baseflow maintained over summer withsmall flush prior to survey
v) Autumn 2008Disconnected pools, baseflowmaintained over summerNo Common Galaxias captured

McNeil et al. 2011 Fish and EWPs in the WMLR
98
Figure 77. Lengths of mountain galaxias (G. olidus) at Gorge Weir (Torrens River) over six survey seasons, from autumn 2006 to spring 2008. The flow at the time of the survey and major hydrological pattern since the last survey are shown for each season.
Size class (mm)
0-5
6-10
11-1
516
-20
21-2
526
-30
31-3
536
-40
41-4
546
-50
51-5
556
-60
61-6
566
-70
71-7
576
-80
81-8
586
-90
91-9
596
-100
101-
105
106-
110
111-
115
116-
120
0
10
Size class (mm)
0-5
6-10
11-1
516
-20
21-2
526
-30
31-3
536
-40
41-4
546
-50
51-5
556
-60
61-6
566
-70
71-7
576
-80
81-8
586
-90
91-9
596
-100
101-
105
106-
110
111-
115
116-
120
0
10
Size class (mm)
0-5
6-10
11-1
516
-20
21-2
526
-30
31-3
536
-40
41-4
546
-50
51-5
556
-60
61-6
566
-70
71-7
576
-80
81-8
586
-90
91-9
596
-100
101-
105
106-
110
111-
115
116-
120
0
10
Size class (mm)
0-5
6-10
11-1
516
-20
21-2
526
-30
31-3
536
-40
41-4
546
-50
51-5
556
-60
61-6
566
-70
71-7
576
-80
81-8
586
-90
91-9
596
-100
101-
105
106-
110
111-
115
116-
120
0
10
Size class (mm)
0-5
6-10
11-1
516
-20
21-2
526
-30
31-3
536
-40
41-4
546
-50
51-5
556
-60
61-6
566
-70
71-7
576
-80
81-8
586
-90
91-9
596
-100
101-
105
106-
110
111-
115
116-
120
0
10
Size class (mm)
0-5
6-10
11-1
516
-20
21-2
526
-30
31-3
536
-40
41-4
546
-50
51-5
556
-60
61-6
566
-70
71-7
576
-80
81-8
586
-90
91-9
596
-100
101-
105
106-
110
111-
115
116-
120
0
10
i) Autumn 2006Low flow, flushing flows over summer
ii) Spring 2006Disconnected pools, baseflows maintained over winterNo Mountain Galaxias captured
iv) Spring 2007Disconnected pools, multiple freshes and flowsover winterNo Mountain Galaxias captured
vi) Spring 2008Disconnected pools, multiple freshes and flows over winter
iii) Autumn 2007Low flow, baseflow maintained over summer withsmall flush prior to surveyNo Mountain Galaxias captured
v) Autumn 2008Disconnected pools, baseflowmaintained over summerNo Mountain Galaxias captured

McNeil et al. 2011 Fish and EWPs in the WMLR
99
Figure 78. Lengths of redfin perch (P. fluviatilis) at Gorge Weir (Torrens River) over six survey seasons, from autumn 2006 to spring 2008. The flow at the time of the survey and major hydrological pattern since the last survey are shown for each season.
Size class (mm)
0-10
11-2
021
-30
31-4
041
-50
51-6
061
-70
71-8
081
-90
91-1
0010
1-11
011
1-12
012
1-13
013
1-14
014
1-15
015
1-16
016
1-17
017
1-18
018
1-19
019
1-20
020
1-21
021
1-22
022
1-23
023
1-24
024
1-25
025
1-26
026
1-27
027
1-28
028
1-29
029
1-30
0>3
00
0
50
Size class (mm)
0-10
11-2
021
-30
31-4
041
-50
51-6
061
-70
71-8
081
-90
91-1
0010
1-11
011
1-12
012
1-13
013
1-14
014
1-15
015
1-16
016
1-17
017
1-18
018
1-19
019
1-20
020
1-21
021
1-22
022
1-23
023
1-24
024
1-25
025
1-26
026
1-27
027
1-28
028
1-29
029
1-30
0>3
00
0
50
Size class (mm)
0-10
11-2
021
-30
31-4
041
-50
51-6
061
-70
71-8
081
-90
91-1
0010
1-11
011
1-12
012
1-13
013
1-14
014
1-15
015
1-16
016
1-17
017
1-18
018
1-19
019
1-20
020
1-21
021
1-22
022
1-23
023
1-24
024
1-25
025
1-26
026
1-27
027
1-28
028
1-29
029
1-30
0>3
00
0
50
Size class (mm)
0-10
11-2
021
-30
31-4
041
-50
51-6
061
-70
71-8
081
-90
91-1
0010
1-11
011
1-12
012
1-13
013
1-14
014
1-15
015
1-16
016
1-17
017
1-18
018
1-19
019
1-20
020
1-21
021
1-22
022
1-23
023
1-24
024
1-25
025
1-26
026
1-27
027
1-28
028
1-29
029
1-30
0>3
00
0
50
Size class (mm)
0-10
11-2
021
-30
31-4
041
-50
51-6
061
-70
71-8
081
-90
91-1
0010
1-11
011
1-12
012
1-13
013
1-14
014
1-15
015
1-16
016
1-17
017
1-18
018
1-19
019
1-20
020
1-21
021
1-22
022
1-23
023
1-24
024
1-25
025
1-26
026
1-27
027
1-28
028
1-29
029
1-30
0>3
00
0
50
0-10
11-2
021
-30
31-4
041
-50
51-6
061
-70
71-8
081
-90
91-1
0010
1-11
011
1-12
012
1-13
013
1-14
014
1-15
015
1-16
016
1-17
017
1-18
018
1-19
019
1-20
020
1-21
021
1-22
022
1-23
023
1-24
024
1-25
025
1-26
026
1-27
027
1-28
028
1-29
029
1-30
0>3
00
0
50
Num
ber o
f ind
ivid
uals
i) Autumn 2006Low flow, flushing flows over summer
ii) Spring 2006Disconnected pools, baseflows maintained over winter
iv) Spring 2007Disconnected pools, multiple freshes and flowsover winter
vi) Spring 2008Disconnected pools, multiple freshes and flows over winter
iii) Autumn 2007Low flow, baseflow maintained over summer withsmall flush prior to survey
v) Autumn 2008Disconnected pools, baseflowmaintained over summer

McNeil et al. 2011 Fish and EWPs in the WMLR
100
Figure 79. Lengths of brown trout (Salmo trutta) at Gorge Weir (Torrens River) over six survey seasons, from autumn 2006 to spring 2008. The flow at the time of the survey and major hydrological pattern since the last survey are shown for each season.
Size class (mm)
0-20
21-4
041
-60
61-8
081
-100
101-
120
121-
140
141-
160
161-
180
181-
200
201-
220
221-
240
241-
260
261-
280
281-
300
301-
320
321-
340
341-
360
361-
380
381-
400
>400
0
50
Size class (mm)
0-20
21-4
041
-60
61-8
081
-100
101-
120
121-
140
141-
160
161-
180
181-
200
201-
220
221-
240
241-
260
261-
280
281-
300
301-
320
321-
340
341-
360
361-
380
381-
400
>400
0
50
Size class (mm)
0-20
21-4
041
-60
61-8
081
-100
101-
120
121-
140
141-
160
161-
180
181-
200
201-
220
221-
240
241-
260
261-
280
281-
300
301-
320
321-
340
341-
360
361-
380
381-
400
>400
0
50
Size class (mm)
0-20
21-4
041
-60
61-8
081
-100
101-
120
121-
140
141-
160
161-
180
181-
200
201-
220
221-
240
241-
260
261-
280
281-
300
301-
320
321-
340
341-
360
361-
380
381-
400
>400
0
50
Size class (mm)
0-20
21-4
041
-60
61-8
081
-100
101-
120
121-
140
141-
160
161-
180
181-
200
201-
220
221-
240
241-
260
261-
280
281-
300
301-
320
321-
340
341-
360
361-
380
381-
400
>400
0
50
0-20
21-4
041
-60
61-8
081
-100
101-
120
121-
140
141-
160
161-
180
181-
200
201-
220
221-
240
241-
260
261-
280
281-
300
301-
320
321-
340
341-
360
361-
380
381-
400
>400
0
50
Num
ber o
f ind
ivid
uals
i) Autumn 2006Low flow, flushing flows over summer
ii) Spring 2006Disconnected pools, baseflows maintained over winter
iv) Spring 2007Disconnected pools, multiple freshes and flowsover winter
vi) Spring 2008Disconnected pools, multiple freshes and flows over winter
iii) Autumn 2007Low flow, baseflow maintained over summer withsmall flush prior to survey
v) Autumn 2008Disconnected pools, baseflowmaintained over summer
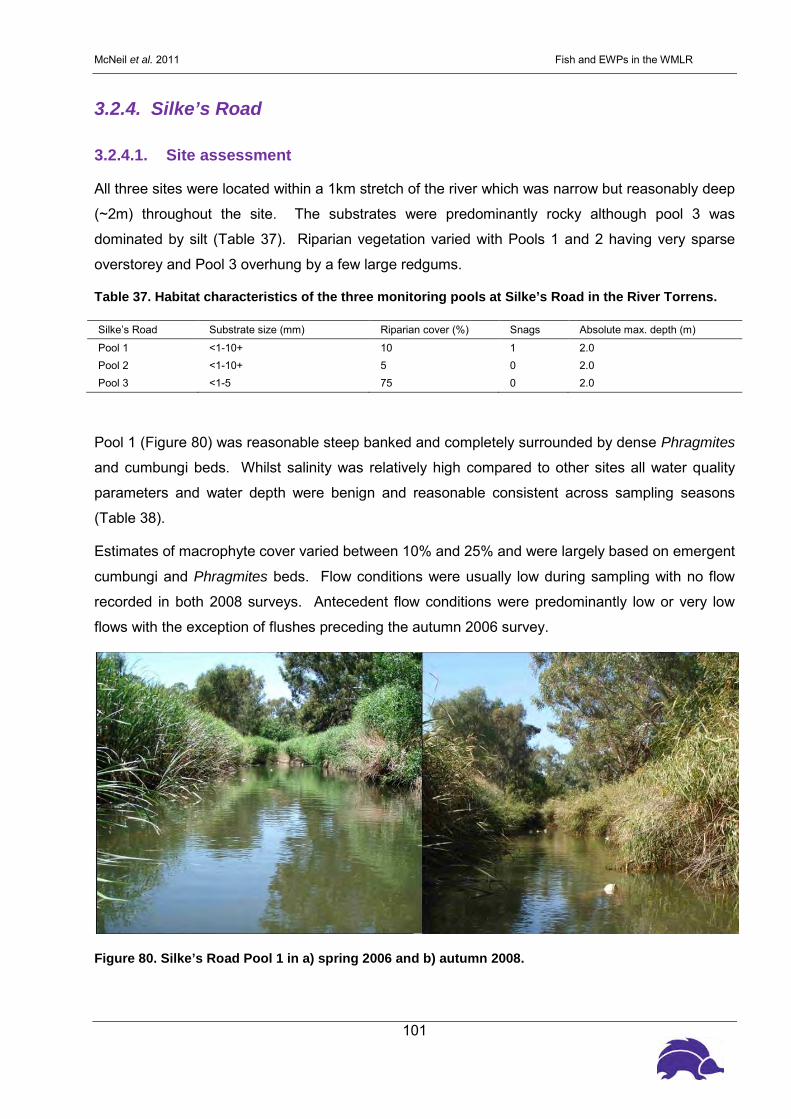
McNeil et al. 2011 Fish and EWPs in the WMLR
101
3.2.4. Silke’s Road
3.2.4.1. Site assessment
All three sites were located within a 1km stretch of the river which was narrow but reasonably deep
(~2m) throughout the site. The substrates were predominantly rocky although pool 3 was
dominated by silt (Table 37). Riparian vegetation varied with Pools 1 and 2 having very sparse
overstorey and Pool 3 overhung by a few large redgums.
Table 37. Habitat characteristics of the three monitoring pools at Silke’s Road in the River Torrens.
Silke’s Road Substrate size (mm) Riparian cover (%) Snags Absolute max. depth (m)
Pool 1 <1-10+ 10 1 2.0 Pool 2 <1-10+ 5 0 2.0 Pool 3 <1-5 75 0 2.0
Pool 1 (Figure 80) was reasonable steep banked and completely surrounded by dense Phragmites
and cumbungi beds. Whilst salinity was relatively high compared to other sites all water quality
parameters and water depth were benign and reasonable consistent across sampling seasons
(Table 38).
Estimates of macrophyte cover varied between 10% and 25% and were largely based on emergent
cumbungi and Phragmites beds. Flow conditions were usually low during sampling with no flow
recorded in both 2008 surveys. Antecedent flow conditions were predominantly low or very low
flows with the exception of flushes preceding the autumn 2006 survey.
Figure 80. Silke’s Road Pool 1 in a) spring 2006 and b) autumn 2008.

McNeil et al. 2011 Fish and EWPs in the WMLR
102
Table 38. Water quality parameters recorded in Silke’s Road Pool 1 during each survey.
Pool 1 Season DO (ppm)
Cond. (μS/cm)
pH Temp. (ºC)
Max. depth (m)
Macrophytes (% cover)
Hydrology Antecedent Hydrology
2006 autumn 8 1733 8 12.8 2.0 25 Low flow Flushes 2006 spring 5 1719 8 20.4 2.0 10 Low flow Very low flow 2007 autumn 7 1366 7 16.5 2.0 20 Low flow Very low /flushes 2007 spring 6 1535 5 21.6 2.0 25 Low flow Low flow/flushes 2008 autumn 6 1500 8 16.9 1.8 10 No flow Baseflows 2008 spring 4.6 3380 7.7 16.5 1.8 20 No flow Low flow/flushes
Pool 2 (Figure 81) was very long and narrow and whilst as deep as pools 1 and 2 the maximum
width was only ~ 2 m. Salinity in this pool was relatively high (Table 39) but not to levels that are
likely to impact on fishes. All other water quality parameters were constantly benign. Water depth
varied slightly across seasons whilst flow conditions were low during 2006 and 2006 and not
flowing during 2008. Antecedent flows were variable with low flows, flushes and very low flows
occurring across seasons. Macrophyte cover was largely emergent Phragmites and cumbungi and
varied little across seasons.
Figure 81. Silke’s Road Pool 2 in a) spring 2006 and b) autumn 2008.
Table 39. Water quality parameters recorded in Silke’s Road Pool 2 during each survey.
Pool 2 Season DO (ppm)
Cond. (μS/cm)
pH Temp. (ºC)
Max. depth (m)
Macrophytes (% cover)
Hydrology Antecedent Hydrology
2006 autumn 9 1753 8 12.8 2.0 30 Low flow Flushes 2006 spring 5 1778 8 20.5 2.0 30 Low flow Very low flow 2007 autumn 8 1391 7 15.9 2.0 30 Low flow Very low/flushes 2007 spring 8 1667 5 21.9 2.0 30 Low flow Low flow/flushes 2008 autumn 7 2400 7 16.4 2.0 10 No flow Baseflows 2008 spring 5.95 3720 7.26 18.1 1.5 30 No flow Low flow/flushes

McNeil et al. 2011 Fish and EWPs in the WMLR
103
Pool 3 (Figure 82) was located below the footbridge linking the two sections of Silke’s Rd. It had
relatively stable water quality conditions across the survey, although dissolved oxygen was
somewhat low in spring 2008 as was pH in spring 2007. Salinity was consistently high but not at
levels likely to impact on biota (Table 40). Both water depth and temperature varied only slightly
across seasons, whilst macrophyte cover varied more dramatically, based on the expansion of
large beds of curly pondweed during spring in 2006 and 2008 and consistently low levels of
emergent Phragmites at each end of the pool. Maximum depth became slightly lower during the
drought in 2007 but was relatively stable at across other seasons. Antecedent flows were variable
with low flows, flushes and very low flows occurring across seasons.
Figure 82. Silke’s Road Pool 3 in a) spring 2006 and b) autumn 2008.
Table 40. Water quality parameters recorded in Silke’s Road Pool 3 during each survey.
Pool 3
Season DO (ppm)
Cond. (μS/cm)
pH Temp. (ºC)
Max. depth (m)
Macrophytes (% cover)
Hydrology Antecedent Hydrology
2006 autumn 11 1780 8 12.7 2.0 10 Low flow Flushes 2006 spring 7 1750 8 21.7 2.0 60 Low flow Very low flow 2007 autumn 7 1428 8 15.1 2.0 5 Low flow Very low/flushes 2007 spring 7 1707 5 20.7 1.8 5 Low flow Low flow/flushes 2008 autumn 6 2100 8 16.1 1.5 5 No flow Baseflows 2008 spring 4.6 2550 7.4 19.3 2.0 90 No flow Low flow/flushes
3.2.4.2. Water Quality
Salinity was the only water quality parameter to be high enough to impact on aquatic biota. Whilst
levels recorded here may be high enough to impact on particularly sensitive invertebrate species,
all levels recorded are suitable for the maintenance of native fish.

McNeil et al. 2011 Fish and EWPs in the WMLR
104
3.2.4.3. Hydrology
The water level was low at Silke’s Road during each of the first three surveys, conducted in
autumn 2006, spring 2006, and autumn 2007. During the last three surveys in spring 2007,
autumn 2008 and spring 2008, the pools at Silke’s Road were disconnected during surveys. The
gauge data from Gorge Weir was used to determine the hydrology at Silke’s Road between
surveys. A detailed description of the hydrology is provided in the results for Gorge Weir.
3.2.4.4. Fish community
There were six native and four introduced fish species captured at Silke’s Road over the six survey
seasons (Figure 83). Flathead gudgeon were the most commonly captured taxa during autumn
and spring 2006, high numbers continued to be collected; although they were less common than
gambusia during the autumn 2008 survey. Small numbers of carp gudgeon were captured during
all survey seasons. Very small numbers of galaxiids were captured throughout. Mountain galaxias
were captured during the first three surveys and the spring 2008 survey, but not spring 2007 and
autumn 2008.
One climbing galaxias was captured, in autumn 2006, and four common galaxias were captured in
spring 2007. One freshwater catfish was also captured in spring 2007. Small numbers of goldfish
were captured during the last four surveys. Two carp and one brown trout were captured in spring
2007.
The fish community at Silke’s Road changed from being dominated by flathead gudgeon in 2006 to
being dominated by gambusia in 2007 and autumn 2008. This shift occurred in association with
the site becoming progressive drier each subsequent survey. The highest numbers of gambusia
were captured in autumn, when water temperature was lower (but after a period of warm
temperatures).

McNeil et al. 2011 Fish and EWPs in the WMLR
105
Figure 83. Abundances of each taxa present in the fish communities at Silke’s Road (Torrens River) over six survey seasons.
3.2.4.5. Fish population structure
The numbers of flathead gudgeon captured at Silke’s Road has been relatively high during all
survey seasons and the size distribution was very consistent (Figure 84). Most of these fish were
medium sized individuals, but both juveniles and large fish are also regularly captured.
There were a small number of medium sized carp gudgeon captured at Silke’s Road (Figure 85).
This population appears reasonably stable, but higher numbers were captured during autumn
2008.
Small numbers of mountain galaxias were captured but only during each of the first three survey
seasons (Figure 86). In addition, three adult common galaxias were captured in spring 2007. One
large adult climbing galaxias was captured during spring 2006 (size = 46 mm).
The gambusia population at Silke’s Road appears to be relatively stable, with relatively high
numbers of small to medium sized individuals captured throughout the surveys (Figure 87).
Goldfish were not captured during 2006 (Figure 88). Several smaller individuals were captured in
autumn 2007. One individual was captured during both spring 2007 and autumn 2008, but then
several larger individuals were captured spring 2008.
Autumn 06 Spring 06 Autumn 07 Spring 07 Autumn 08 Spring 08
No.
of i
ndiv
idua
ls
0
10
20
30
40
50
60
70
1000
2000
3000 Goldfish European Carp Climbing Galaxias Common Galaxias Mountain Galaxias Carp Gudgeon Brown Trout Freshwater Catfish Flathead Gudgeon Eastern Gambusia

McNeil et al. 2011 Fish and EWPs in the WMLR
106
Figure 84. Lengths of flathead gudgeon (P. grandiceps) at Silke’s Road (Torrens River) over six survey seasons, from autumn 2006 to spring 2008. The flow at the time of the survey and major hydrological pattern since the last survey are shown for each season.
Size class (mm)
0-5
6-10
11-1
516
-20
21-2
526
-30
31-3
536
-40
41-4
546
-50
51-5
556
-60
61-6
566
-70
71-7
576
-80
81-8
586
-90
91-9
596
-100
>100
0
50
100
Size class (mm)
0-5
6-10
11-1
516
-20
21-2
526
-30
31-3
536
-40
41-4
546
-50
51-5
556
-60
61-6
566
-70
71-7
576
-80
81-8
586
-90
91-9
596
-100
>100
0
50
100
Size class (mm)
0-5
6-10
11-1
516
-20
21-2
526
-30
31-3
536
-40
41-4
546
-50
51-5
556
-60
61-6
566
-70
71-7
576
-80
81-8
586
-90
91-9
596
-100
>100
0
50
100
Size class (mm)
0-5
6-10
11-1
516
-20
21-2
526
-30
31-3
536
-40
41-4
546
-50
51-5
556
-60
61-6
566
-70
71-7
576
-80
81-8
586
-90
91-9
596
-100
>100
Num
ber o
f ind
ivid
uals
0
50
100
Size class (mm)
0-5
6-10
11-1
516
-20
21-2
526
-30
31-3
536
-40
41-4
546
-50
51-5
556
-60
61-6
566
-70
71-7
576
-80
81-8
586
-90
91-9
596
-100
>100
0
50
100
Size class (mm)
0-5
6-10
11-1
516
-20
21-2
526
-30
31-3
536
-40
41-4
546
-50
51-5
556
-60
61-6
566
-70
71-7
576
-80
81-8
586
-90
91-9
596
-100
>100
0
50
100
i) Autumn 2006Low flow, flushing flows over summer
ii) Spring 2006Low flow, very low flow over winter
iv) Spring 2007Low flow, lowflow with two large flushes over winter
iii) Autumn 2007Lowflow, very low flowover summer with small flush prior to surveys
v) Autumn 2008Disconnected pools, baseflow maintained over summer
vi) Spring 2008Disconnected pools, low flows and two large flushes over winter

McNeil et al. 2011 Fish and EWPs in the WMLR
107
Figure 85. Lengths of carp gudgeon (Hypseleotris spp.) at Silke’s Road (Torrens River) over six survey seasons, from autumn 2006 to spring 2008. The flow at the time of the survey and major hydrological pattern since the last survey are shown for each season.
Size class (mm)
0-5
6-10
11-1
516
-20
21-2
526
-30
31-3
536
-40
41-4
546
-50
51-5
556
-60
61-6
566
-70
71-7
5
0
50
Size class (mm)
0-5
6-10
11-1
516
-20
21-2
526
-30
31-3
536
-40
41-4
546
-50
51-5
556
-60
61-6
566
-70
71-7
5
0
50
Size class (mm)
0-5
6-10
11-1
516
-20
21-2
526
-30
31-3
536
-40
41-4
546
-50
51-5
556
-60
61-6
566
-70
71-7
5
0
50
Size class (mm)
0-5
6-10
11-1
516
-20
21-2
526
-30
31-3
536
-40
41-4
546
-50
51-5
556
-60
61-6
566
-70
71-7
5
Num
ber o
f ind
ivid
uals
0
50
Size class (mm)
0-5
6-10
11-1
516
-20
21-2
526
-30
31-3
536
-40
41-4
546
-50
51-5
556
-60
61-6
566
-70
71-7
5
0
50
0-5
6-10
11-1
516
-20
21-2
526
-30
31-3
536
-40
41-4
546
-50
51-5
556
-60
61-6
566
-70
71-7
5
0
50
i) Autumn 2006Low flow, flushing flows over summer
ii) Spring 2006Low flow, very low flow over winter
iv) Spring 2007Low flow, lowflow with two large flushes over winter
iii) Autumn 2007Lowflow, very low flowover summer with small flush prior to surveys
v) Autumn 2008Disconnected pools, baseflow maintained over summer
vi) Spring 2008Disconnected pools, low flows and two large flushes over winter

McNeil et al. 2011 Fish and EWPs in the WMLR
108
Figure 86. Lengths of mountain galaxias (G. olidus) at Silke’s Road (Torrens River) over six survey seasons, from autumn 2006 to spring 2008. The flow at the time of the survey and major hydrological pattern since the last survey are shown for each season.
Size class (mm)
0-5
6-10
11-1
516
-20
21-2
526
-30
31-3
536
-40
41-4
546
-50
51-5
556
-60
61-6
566
-70
71-7
576
-80
81-8
586
-90
91-9
596
-100
101-
105
106-
110
111-
115
116-
120
0
10
Size class (mm)
0-5
6-10
11-1
516
-20
21-2
526
-30
31-3
536
-40
41-4
546
-50
51-5
556
-60
61-6
566
-70
71-7
576
-80
81-8
586
-90
91-9
596
-100
101-
105
106-
110
111-
115
116-
120
0
10
Size class (mm)
0-5
6-10
11-1
516
-20
21-2
526
-30
31-3
536
-40
41-4
546
-50
51-5
556
-60
61-6
566
-70
71-7
576
-80
81-8
586
-90
91-9
596
-100
101-
105
106-
110
111-
115
116-
120
0
10
Size class (mm)
0-5
6-10
11-1
516
-20
21-2
526
-30
31-3
536
-40
41-4
546
-50
51-5
556
-60
61-6
566
-70
71-7
576
-80
81-8
586
-90
91-9
596
-100
101-
105
106-
110
111-
115
116-
120
Num
ber o
f ind
ivid
uals
0
10
Size class (mm)
0-5
6-10
11-1
516
-20
21-2
526
-30
31-3
536
-40
41-4
546
-50
51-5
556
-60
61-6
566
-70
71-7
576
-80
81-8
586
-90
91-9
596
-100
101-
105
106-
110
111-
115
116-
120
0
10
0-5
6-10
11-1
516
-20
21-2
526
-30
31-3
536
-40
41-4
546
-50
51-5
556
-60
61-6
566
-70
71-7
576
-80
81-8
586
-90
91-9
596
-100
101-
105
106-
110
111-
115
116-
120
0
10
i) Autumn 2006Low flow, flushing flows over summer
ii) Spring 2006Low flow, very low flow over winter
iv) Spring 2007Low flow, lowflow with two large flushes over winterNo Mountain GalaxiasCaptured
iii) Autumn 2007Lowflow, very low flowover summer with small flush prior to surveys
v) Autumn 2008Disconnected pools, baseflow maintained over summerNo Mountain GalaxiasCaptured
vi) Spring 2008Disconnected pools, low flows and two large flushes over winter

McNeil et al. 2011 Fish and EWPs in the WMLR
109
Figure 87. Lengths of goldfish (C. auratus) at Silke’s Road (Torrens River) over six survey seasons, from autumn 2006 to spring 2008. The flow at the time of the survey and major hydrological pattern since the last survey are shown for each season.
Size class (mm)
0-10
11-2
021
-30
31-4
041
-50
51-6
061
-70
71-8
081
-90
91-1
0010
1-11
011
1-12
012
1-13
013
1-14
014
1-15
0>1
50
0
10
Size class (mm)
0-10
11-2
021
-30
31-4
041
-50
51-6
061
-70
71-8
081
-90
91-1
0010
1-11
011
1-12
012
1-13
013
1-14
014
1-15
0>1
50
0
10
Size class (mm)
0-10
11-2
021
-30
31-4
041
-50
51-6
061
-70
71-8
081
-90
91-1
0010
1-11
011
1-12
012
1-13
013
1-14
014
1-15
0>1
50
0
10
Size class (mm)
0-10
11-2
021
-30
31-4
041
-50
51-6
061
-70
71-8
081
-90
91-1
0010
1-11
011
1-12
012
1-13
013
1-14
014
1-15
0>1
50
Num
ber o
f ind
ivid
uals
0
10
Size class (mm)
0-10
11-2
021
-30
31-4
041
-50
51-6
061
-70
71-8
081
-90
91-1
0010
1-11
011
1-12
012
1-13
013
1-14
014
1-15
0>1
50
0
10
0-10
11-2
021
-30
31-4
041
-50
51-6
061
-70
71-8
081
-90
91-1
0010
1-11
011
1-12
012
1-13
013
1-14
014
1-15
0>1
50
0
10
i) Autumn 2006Low flow, flushing flows over summerNo Goldfish Captured
ii) Spring 2006Low flow, very low flow over winterNo Goldfish Captured
iv) Spring 2007Low flow, lowflow with two large flushes over winter
iii) Autumn 2007Lowflow, very low flowover summer with small flush prior to surveys
v) Autumn 2008Disconnected pools, baseflow maintained over summer
vi) Spring 2008Disconnected pools, low flows and two large flushes over winter

McNeil et al. 2011 Fish and EWPs in the WMLR
110
Figure 88. Lengths of gambusia (G. holbrooki) at Silke’s Road (Torrens River) over six survey seasons, from autumn 2006 to spring 2008. The flow at the time of the survey and major hydrological pattern since the last survey are shown for each season.
Size class (mm)
0-5
6-10
11-1
516
-20
21-2
526
-30
31-3
536
-40
41-4
546
-50
51-5
556
-60
61-6
566
-70
71-7
576
-80
0
50
100
Size class (mm)
0-5
6-10
11-1
516
-20
21-2
526
-30
31-3
536
-40
41-4
546
-50
51-5
556
-60
61-6
566
-70
71-7
576
-80
0
50
100
Size class (mm)
0-5
6-10
11-1
516
-20
21-2
526
-30
31-3
536
-40
41-4
546
-50
51-5
556
-60
61-6
566
-70
71-7
576
-80
0
50
100
Size class (mm)
0-5
6-10
11-1
516
-20
21-2
526
-30
31-3
536
-40
41-4
546
-50
51-5
556
-60
61-6
566
-70
71-7
576
-80
Num
ber o
f ind
ivid
uals
0
50
100
Size class (mm)
0-5
6-10
11-1
516
-20
21-2
526
-30
31-3
536
-40
41-4
546
-50
51-5
556
-60
61-6
566
-70
71-7
576
-80
0
50
100
0-5
6-10
11-1
516
-20
21-2
526
-30
31-3
536
-40
41-4
546
-50
51-5
556
-60
61-6
566
-70
71-7
576
-80
0
50
100
i) Autumn 2006Low flow, flushing flows over summer
ii) Spring 2006Low flow, very low flow over winter
iv) Spring 2007Low flow, lowflow with two large flushes over winter
iii) Autumn 2007Lowflow, very low flowover summer with small flush prior to surveys
v) Autumn 2008Disconnected pools, baseflow maintained over summer
vi) Spring 2008Disconnected pools, low flows and two large flushes over winter

McNeil et al. 2011 Fish and EWPs in the WMLR
111
3.2.5. Breakout Creek
3.2.5.1. Site assessment
The three pools vary greatly in substrate and depth whilst all had virtually no riparian cover and few
if any snags (Table 41). Electrofishing surveys were carried out within any shallow reaches
available, which varied with hydrology. These electrofishing reaches were most frequently up- and
down- stream of Pool 2.
Table 41. Habitat characteristics of the three monitoring pools at Breakout Creek in the River Torrens. Breakout Creek Substrate size (mm) Riparian cover (%) Snags Absolute max. depth (m)
Pool 1 <1 0 2 2.0 Pool 2 <1 0 0 1.3 Pool 3 Sand 0 0 3.5
Pool 1 (Figure 89) is located upstream of the Henley Beach Rd Bridge in the large pool created
through relatively recent restoration work and maintained buy a small rock weir at the downstream
end of the site which has good facility for fish passage. The site has a high level of public access
with wooden jetties and walking paths. Macrophyte cover varied across seasons with small beds
of Phragmites and cumbungi dispersed around the site, and large beds of curly pondweed
expanding and contracting seasonally (Table 42).
Water depth, temperature and pH did not vary significantly across seasons, whilst conductivity
ranged between 540 and ~2000μS. Dissolved oxygen peaked dramatically at 16ppm in autumn
2006 but remained stable across other seasons. The site was predominantly isolated during most
sampling trips, with low flows and flushing flows present during autumn 2006 and 2007
respectively. Antecedent flow conditions for this site changed between very low flows to baseflows
and flushes across the study period.
Figure 89. Breakout Creek Pool 1 in a) spring 2006 and b) autumn 2008.

McNeil et al. 2011 Fish and EWPs in the WMLR
112
Table 42. Water quality parameters recorded in Breakout Creek Pool 1 during each survey.
Pool 1 season DO (ppm)
Cond. (μS/cm)
pH Temp. (ºC)
Max. depth (m)
Macrophytes (% cover)
Hydrology Antecedent Hydrology
2006 autumn 16 540 9 14.6 2.0 10 Low flow Baseflows + flushes 2006 spring 8 1932 8 27.0 2.0 10 No flow Baseflows + flush 2007 autumn 7 1963 7 20.0 2.0 25 Flush Very low flows 2007 spring 6 780 8 26.8 1.5 10 No flow Baseflows + flushes 2008 autumn 7 1600 7 17.1 2.0 10 No flow Very low flow 2008 spring 7.4 1251 8.1 19.8 2.0 30 No flow Very low flow
Pool 2 (Figure 90) was situated downstream of Henley Beach Rd and has been dramatically re-
engineered following the spring 2008 sampling trip, and therefore providing excellent ‘before’ data
for assessing the impacts of the development at this site. The survey in autumn 2006 was actually
carried out farther downstream below Tapley’s Hill Rd but was moved following loss of wetted
habitat following that season. The site was sampled above and below a small concrete weir which
divided the pool. Above the weir sediments were predominantly silty with large beds of
macrophytes predominantly introduced Elodea canadensis. Below the weir the pool was
predominantly rocky with some littoral silt beds covered with Elodea. The pool possessed large
cumbungi beds both above and below the weir that expanded and contracted seasonally covering
between 0% and 70% of the pool, predominantly increasing in spring (Table 43).
Oxygen, pH and salinity fluctuated slightly throughout the study, whilst temperature fluctuated
seasonally. Water depth remained constant throughout the study, whilst flow conditions were
mainly zero flow with low flow in autumn 2006 and flushing flows in autumn 2007. Antecedent flow
conditions for this site changed between very low flows to baseflows and flushes across the study
period.
Figure 90. Breakout Creek Pool 2 in a) spring 2006 and b) autumn 2008.

McNeil et al. 2011 Fish and EWPs in the WMLR
113
Table 43. Water quality parameters recorded in Breakout Creek Pool 2 during each survey.
Pool 2 Season DO (ppm)
Cond. (μS/cm)
pH Temp. (ºC)
Max. depth (m)
Macrophytes (% cover)
Hydrology Antecedent Hydrology
2006 autumn 12 538 8 12.4 0.3 0 Low flow Base/flushes 2006 spring 8 1932 8 28.0 1.0 30 No flow Base/flush 2007 autumn 8 700 8 15.0 1.3 10 Flush Very low flows 2007 spring 5 804 10 29.7 1.0 10 No flow Base/flushes 2008 autumn 8 1400 7 18.1 1.0 10 No flow Very low flow 2008 spring 1.0 70 No flow Very low flow
Pool 3 (Figure 91) was situated at Breakout Creek, with the main pool located below the weir within
the estuarine section of the Torrens. This pool is estuarine in nature, and as such should not be
compared directly to other pools, but rather used as an indication of connectivity between marine
and freshwater sections of this reach. Nets were also set in the freshwater section above the weir
wall when inundated and a net was always set above the fishway to ensure that fish moving into
freshwater habitats were captured. The conditions in this pool (downstream of the weir) fluctuated
between marine and brackish (Table 44), with freshwater flows generally stratifying the pool with
saline conditions remaining at depth and freshening at the surface. Dissolved oxygen fluctuated
across seasons becoming severely hypoxic during spring 2006 and autumn 2008 during zero flow
events under high salinities.
Whilst there were no macrophytes at the site, decaying marine algae was often abundant over
sandy substrates. Due to tidal influence, maximum depth and temperature did not vary dramatically
over the survey period, although water temperature became relatively high in spring 2006 when the
pool became anoxic. No flow condition prevailed during most surveys with low flow in autumn
2006 and flushes in autumn 2007 the exception. Flushes and baseflow in 2006 and in spring 2007
were the only flows recorded prior to sampling events.
Figure 91. Breakout Creek Pool 3 in a) spring 2006 and b) autumn 2008.

McNeil et al. 2011 Fish and EWPs in the WMLR
114
Table 44. Water quality parameters recorded in Breakout Creek Pool 3 during each survey.
Pool 3 Season DO (ppm)
Cond. (μS/cm)
pH Temp. (ºC)
Max. depth (m)
Macrophytes (% cover)
Hydrology Antecedent Hydrology
2006 autumn 8 5170 8 11.5 2.0 0 Low flow Base/flushes 2006 spring 0 55100 7 22.5 2.0 0 No flow Base/flush 2007 autumn 8 7000 8 17.1 3.5 0 Flush Very low flows 2007 spring 6 56100 8 19.3 2.0 0 No flow Base/flushes 2008 autumn 2 60700 7 18.9 2.0 0 No flow Very low flow 2008 spring 4.6 4920 7.8 18.5 2.0 0 No flow Very low flow
3.2.5.2. Water Quality
Salinity at freshwater sites was the only water quality parameter to be high enough to impact on
aquatic biota. Whilst levels recorded here may be high enough to impact on particularly sensitive
invertebrate species, all levels recorded are suitable for the maintenance of native fish.
Below the weir wall, however, estuarine and marine conditions prevailed and would likely exclude
the long term survival of freshwater fish species. Fresh water sitting atop saline water during flows
led to the capture of many freshwater fish below the weir, and the constructed fishway has been
observed to facilitate the movement of these freshwater fish back up into more inhabitable reaches
(McNeil et al. 2010e).
3.2.5.3. Hydrology
During sampling in autumn 2006 the water level at Breakout Creek was low and in the spring
survey period the survey pools were disconnected at this site. During autumn 2007 the water level
was moderate at the time of the surveys, but pools were again disconnected during the surveys of
spring 2007 and also when the site was surveyed in autumn 2008.
Gauge data is available since 1978 for Breakout Creek (collected at Holbrook’s Road: site number
A5040529). Throughout the summer of 2005/06 a high baseflow was maintained, and there were
a number of freshes and flushes, at this site (Figure 92). This hydrological pattern, of high
baseflows and multiple flushing flows of various magnitudes, continued to the autumn 2006
surveys, conducted on May 25.
Baseflows above 5 ML/day were maintained, and there were a number of freshes and small
flushes from this time until October 2006. Baseflows were lower in October and early November
than they had been in previous months, averaging under 2 ML/day. However, there was a large
flushing flow of 340 ML two and a half weeks prior to the spring 2006 surveys. These surveys
were conducted on the 29 November, three days into a period where there was no readable flow
recorded at the gauging station. This lack of any recordable flow continued until late December.

McNeil et al. 2011 Fish and EWPs in the WMLR
115
From January to late April of 2007 there were multiple freshes, but also long periods when no flow
was recorded. Autumn 2007 surveys were conducted on April 30, just two days after a very large
flushing flow (>800 ML in one day) had been recorded. From this time until early-November the
baseflow was high and there were regular pulsed freshes and flushes, with one very high flushing
flow of over 1600 ML in one day in early July.
Flows steadily declined over the week prior to spring 2007 surveys, conducted on November 14,
when the flow was just above 3 ML/day. Flows were low over much of summer, but there was also
a large flush in late December. There was no recordable flow at the site from early February until
late March. From the beginning of April baseflow was maintained and there were a number of
freshes up to the time of autumn 2008 surveys, conducted on April 23.
Figure 92. Hydrograph for flow in Breakout Creek (mouth of Torrens River). Flow data (ML/day) from Holbrook’s Road (gauge number A5040529) is reported from January 1, 2006. The timing of each survey season is also shown above the figure.
Jan/
05
Mar
/05
M
ay/0
5
Jul/0
5
Sep/
05
Nov/
05
Jan/
06
Mar
/06
M
ay/0
6
Jul/0
6
Sep/
06
Nov/
06
Jan/
07
Mar
/07
M
ay/0
7
Jul/0
7
Sep/
07
Nov/
07
Jan/
08
Mar
/08
M
ay/0
8
Jul/0
8
Sep/
08
Nov/
08
Jan/
09
ML/
day
0
1000
2000
30009000
10000
11000
12000
2006
A
2006
S
2007
S
2007
A
2008
A
2008
S

McNeil et al. 2011 Fish and EWPs in the WMLR
116
3.2.5.4. Fish community
Breakout Creek had the highest diversity of fish amongst any of the sites surveyed in the WMLR,
with a predominantly freshwater community above the fishway and an estuarine/marine community
downstream of the fishway. Across all pools and survey seasons there were six native freshwater,
fourteen native estuarine/marine and three introduced fish species recorded (Figure 93). Large
numbers of carp gudgeon were captured in all seasons. Flathead gudgeon and Murray
rainbowfish were also captured in relatively high numbers across all survey seasons.
There was an inverse relationship between the abundance of carp gudgeon and flathead gudgeon.
Common galaxias were captured in each survey except for autumn 2008, but they were only
captured in larger numbers during the spring 2008 survey (Figure a). The estuarine/marine taxa
were mainly captured only in the most downstream pool and the numbers of captures of all these
taxa were relatively low in all seasons (Figure b). Gambusia and European carp were the most
commonly captured introduced taxa, and were caught in high numbers in alternating seasons:
gambusia in autumn and carp in spring.

McNeil et al. 2011 Fish and EWPs in the WMLR
117
Figure 93. Abundances of each taxa present in the fish communities of each pool at Breakout Creek (mouth of Torrens River) over six survey seasons. a) Commonly captured species and b) uncommon species.
Autumn 06 Spring 06 Autumn 07 Spring 07 Autumn 08 Spring 08
No.
of i
ndiv
idua
ls
0
50
100
150
200
250
300Bream Tamar Goby Yellow-eye Mullet Shortfin Eel Bridled Goby Australian Salmon Smallmouth Hardyhead Goldfish Anchovy Gobies Sandy Sprat Short-headed Lamprey Swan River Goby Congolli King George Whiting Yellowfin Whiting Freshwater Catfish Smooth Toadfish
Autumn 06 Spring 06 Autumn 07 Spring 07 Autumn 08 Spring 08
No.
of i
ndiv
idua
ls
0
1000
2000
3000
4000
5000
6000
7000
8000
9000
10000
11000
12000
European Carp Common Galaxias Eastern Gambusia Freshwater Catfish Flathead Gudgeon Crimson Spotted RainbowfishCarp Gudgeon
a)
b)
Autumn 06 Spring 06 Autumn 07 Spring 07 Autumn 08 Spring 08
No.
of i
ndiv
idua
ls
0
50
100
150
200
250
300Bream Tamar Goby Yellow-eye Mullet Shortfin Eel Bridled Goby Australian Salmon Smallmouth Hardyhead Goldfish Anchovy Gobies Sandy Sprat Short-headed Lamprey Swan River Goby Congolli King George Whiting Yellowfin Whiting Freshwater Catfish Smooth Toadfish
Autumn 06 Spring 06 Autumn 07 Spring 07 Autumn 08 Spring 08
No.
of i
ndiv
idua
ls
0
1000
2000
3000
4000
5000
6000
7000
8000
9000
10000
11000
12000
European Carp Common Galaxias Eastern Gambusia Freshwater Catfish Flathead Gudgeon Crimson Spotted RainbowfishCarp Gudgeon
a)
b)

McNeil et al. 2011 Fish and EWPs in the WMLR
118
3.2.5.5. Fish population
There were relatively large numbers of common galaxias captured at Breakout Creek during all
surveys conducted in 2006 and 2007. Larger individuals were present in autumn, and both large
and small individuals in spring (Figure 94). Only two of these fish were captured during autumn
2008, but in spring 2008 large numbers had were again recorded. A small number of common
galaxias were captured in 2007.
At Breakout Creek most congolli were captured in the pool downstream of the fishway, but they
have also be captured above the fishway during most survey seasons (Figure 95). The number of
congolli captures peaked in spring 2007. These were mainly small individuals and they were
mostly below the weir. In spring 2008 there were again a large number of small congolli, but in that
survey they were mostly above the fishway.
Flathead gudgeon were captured above the fishway in all seasons and there were also over 80
individuals of this taxon captured downstream of the fishway in autumn 2007 (Figure 96). Most of
the individuals captured at this site were small to medium sized.
The population of Murray rainbowfish appears well established, with large numbers of medium to
large fish captured during all of the present surveys (Figure 97). A pattern of smaller individuals in
autumn and larger individuals in spring suggests strong recruitment over summer.
Freshwater catfish were captured above the fishway in all seasons, and there were also seven
individuals of this taxon captured in the pool below the fishway in autumn 2007 (Figure 98). Across
the middle three surveys, from spring 2008 to spring 2007, both small and large individuals of this
species were captured. Only small individuals of this taxon were captured at this site in autumn
2006 and autumn 2008. In spring 2008 large and small freshwater catfish were captured again.
High numbers of, mainly small to medium sized, carp gudgeon were captured above the fishway
during all of the survey seasons (Figure 99). These taxa were also captured in the pool below the
fishway, in autumn 2006 (three individuals) and autumn 2007 (over 300 individuals). These fish
displayed a uniform size distribution over the entire project.
Small numbers of both goldfish (Figure 100) and carp (Figure 101) were captured from the pools
upstream of the fishway at Breakout Creek during the present surveys. Relatively large numbers
of small carp were captured during all surveys conducted in spring, whereas only a small number
of medium fish were captured during each of the autumn surveys. The largest numbers of goldfish
were captured in autumn 2006, but none of this taxon was captured in either autumn 2007 or 2008.
However, three small goldfish were captured in spring 2008.

McNeil et al. 2011 Fish and EWPs in the WMLR
119
Only small numbers of gambusia were captured in 2006, but there were large numbers of small to
medium sized fish captured during both surveys in 2007 and in autumn 2008. The gambusia
captured in spring 2008 were a similar size but had decreased significantly in number (Figure 102).
Most of the marine and estuarine species were captured infrequently and in low numbers therefore
graphs are not provided here. Blue spot goby were only captured once (in spring 2007, in the
middle survey pool, above the fishway). Tamar goby were captured in the pool downstream of the
fishway at Breakout Creek in autumn 2006, spring 2006 and autumn 2008. Individual bridled goby
were captured downstream of the fishway in autumn 2007 and spring 2008. Three small (29-43
mm) unidentified gobies were captured in spring 2007 and autumn 2008, but are likely to be
misidentified blue spot or bridled gobies.
Two adult short-headed lamprey ( 430 mm and 380 mm) were captured in the pool downstream of
the fishway at Breakout Creek in autumn 2007, but were not captured during any of the other
surveys. This is the first record of this rare diadromous species in the catchment and may have
been trapped below the weir from the previous spring due to low flows preventing upstream
passage. Only a small number of medium and large black bream were captured from the pool
downstream of the fishway, with the largest number in autumn 2007, whilst no individuals of were
captured during autumn and spring 2008.
Jumping mullet were captured in the pool downstream of the fishway during all of the surveys. The
highest numbers of captures occurred in spring 2006, when all captures were large individuals, and
autumn 2007, which was predominantly small individuals, in spring 2008, one large and one small
individual were captured. The captures of yellow-eyed mullet increased from only a few individuals
in 2006 to relatively large numbers, of predominantly small individuals, in spring 2007;
predominantly medium individuals in autumn 2008, and smaller individuals again in spring 2008.
All of these fish were captured in the pool downstream of the fishway.

McNeil et al. 2011 Fish and EWPs in the WMLR
120
Figure 94. Lengths of common galaxias (G. maculatus) at Breakout Creek (mouth of Torrens River) over six survey seasons, from autumn 2006 to spring 2008. Note, light blue bars indicate fish captured in estuarine waters. The flow at the time of the survey and major hydrological pattern since the last survey are shown for each season.
Size class (mm)
0-10
11-2
021
-30
31-4
041
-50
51-6
061
-70
71-8
081
-90
91-1
0010
1-11
011
1-12
012
1-13
013
1-14
014
1-15
015
1-16
016
1-17
017
1-18
0
0
50
Size class (mm)
0-10
11-2
021
-30
31-4
041
-50
51-6
061
-70
71-8
081
-90
91-1
0010
1-11
011
1-12
012
1-13
013
1-14
014
1-15
015
1-16
016
1-17
017
1-18
0
0
50
Size class (mm)
0-10
11-2
021
-30
31-4
041
-50
51-6
061
-70
71-8
081
-90
91-1
0010
1-11
011
1-12
012
1-13
013
1-14
014
1-15
015
1-16
016
1-17
017
1-18
0
0
50
Size class (mm)
0-10
11-2
021
-30
31-4
041
-50
51-6
061
-70
71-8
081
-90
91-1
0010
1-11
011
1-12
012
1-13
013
1-14
014
1-15
015
1-16
016
1-17
017
1-18
0
Num
ber o
f ind
ivid
uals
0
50
Size class (mm)
0-10
11-2
021
-30
31-4
041
-50
51-6
061
-70
71-8
081
-90
91-1
0010
1-11
011
1-12
012
1-13
013
1-14
014
1-15
015
1-16
016
1-17
017
1-18
0
0
50
Size class (mm)
0-10
11-2
021
-30
31-4
041
-50
51-6
061
-70
71-8
081
-90
91-1
0010
1-11
011
1-12
012
1-13
013
1-14
014
1-15
015
1-16
016
1-17
017
1-18
0
0
50
100
150
200
250
300
i) Autumn 2006Low flow, high baseflowwith multiple flushes over summer
ii) Spring 2006Disconnected pools, baseflows over winter with large flush prior tosurveys
iv) Spring 2007Disconnected pools, baseflows with regular flushes over winter
iii) Autumn 2007Moderate flow, minimal flowover summer but large flushprior to surveys
v) Autumn 2008Disconnected pools, minimal flow with small flushes over summer
vi) Spring 2008Disconnected pools, baseflows with low regularflushes over winter

McNeil et al. 2011 Fish and EWPs in the WMLR
121
Figure 95. Lengths of Murray rainbowfish (M. fluviatilis) at Breakout Creek (mouth of Torrens River) over six survey seasons, from autumn 2006 to spring 2008. Note, light blue bars indicate fish captured in estuarine waters. The flow at the time of the survey and major hydrological pattern since the last survey are shown for each season.
Size class (mm)
0-5
6-10
11-1
516
-20
21-2
526
-30
31-3
536
-40
41-4
546
-50
51-5
556
-60
61-6
566
-70
71-7
576
-80
81-8
586
-90
0
50
Size class (mm)
0-5
6-10
11-1
516
-20
21-2
526
-30
31-3
536
-40
41-4
546
-50
51-5
556
-60
61-6
566
-70
71-7
576
-80
81-8
586
-90
0
50
Size class (mm)
0-5
6-10
11-1
516
-20
21-2
526
-30
31-3
536
-40
41-4
546
-50
51-5
556
-60
61-6
566
-70
71-7
576
-80
81-8
586
-90
0
50
Size class (mm)
0-5
6-10
11-1
516
-20
21-2
526
-30
31-3
536
-40
41-4
546
-50
51-5
556
-60
61-6
566
-70
71-7
576
-80
81-8
586
-90
Num
ber o
f ind
ivid
uals
0
50
100
Size class (mm)
0-5
6-10
11-1
516
-20
21-2
526
-30
31-3
536
-40
41-4
546
-50
51-5
556
-60
61-6
566
-70
71-7
576
-80
81-8
586
-90
0
50
100
0-5
6-10
11-1
516
-20
21-2
526
-30
31-3
536
-40
41-4
546
-50
51-5
556
-60
61-6
566
-70
71-7
576
-80
81-8
586
-90
0
50
i) Autumn 2006Low flow, high baseflowwith multiple flushes over summer
ii) Spring 2006Disconnected pools, baseflows over winter with large flush prior tosurveys
iv) Spring 2007Disconnected pools, baseflows with regular flushes over winter
iii) Autumn 2007Moderate flow, minimal flowover summer but large flushprior to surveys
v) Autumn 2008Disconnected pools, minimal flow with small flushes over summer
vi) Spring 2008Disconnected pools, baseflows with low regularflushes over winter

McNeil et al. 2011 Fish and EWPs in the WMLR
122
Figure 96. Lengths of flathead gudgeon (P. grandiceps) at Breakout Creek (mouth of Torrens River) over six survey seasons, from autumn 2006 to spring 2008. Note, light blue bars indicate fish captured in estuarine waters. The flow at the time of the survey and major hydrological pattern since the last survey are shown for each season.
Size class (mm)
0-5
6-10
11-1
516
-20
21-2
526
-30
31-3
536
-40
41-4
546
-50
51-5
556
-60
61-6
566
-70
71-7
576
-80
81-8
586
-90
91-9
596
-100
>100
0
50
Size class (mm)
0-5
6-10
11-1
516
-20
21-2
526
-30
31-3
536
-40
41-4
546
-50
51-5
556
-60
61-6
566
-70
71-7
576
-80
81-8
586
-90
91-9
596
-100
>100
0
50
100
150
Size class (mm)
0-5
6-10
11-1
516
-20
21-2
526
-30
31-3
536
-40
41-4
546
-50
51-5
556
-60
61-6
566
-70
71-7
576
-80
81-8
586
-90
91-9
596
-100
>100
0
50
100
Size class (mm)
0-5
6-10
11-1
516
-20
21-2
526
-30
31-3
536
-40
41-4
546
-50
51-5
556
-60
61-6
566
-70
71-7
576
-80
81-8
586
-90
91-9
596
-100
>100
Num
ber o
f ind
ivid
uals
0
50
Size class (mm)
0-5
6-10
11-1
516
-20
21-2
526
-30
31-3
536
-40
41-4
546
-50
51-5
556
-60
61-6
566
-70
71-7
576
-80
81-8
586
-90
91-9
596
-100
>100
0
50
100
0-5
6-10
11-1
516
-20
21-2
526
-30
31-3
536
-40
41-4
546
-50
51-5
556
-60
61-6
566
-70
71-7
576
-80
81-8
586
-90
91-9
596
-100
>100
0
50
100
150
i) Autumn 2006Low flow, high baseflowwith multiple flushes over summer
ii) Spring 2006Disconnected pools, baseflows over winter with large flush prior tosurveys
iv) Spring 2007Disconnected pools, baseflows with regular flushes over winter
iii) Autumn 2007Moderate flow, minimal flowover summer but large flushprior to surveys
v) Autumn 2008Disconnected pools, minimal flow with small flushes over summer
vi) Spring 2008Disconnected pools, baseflows with low regularflushes over winter
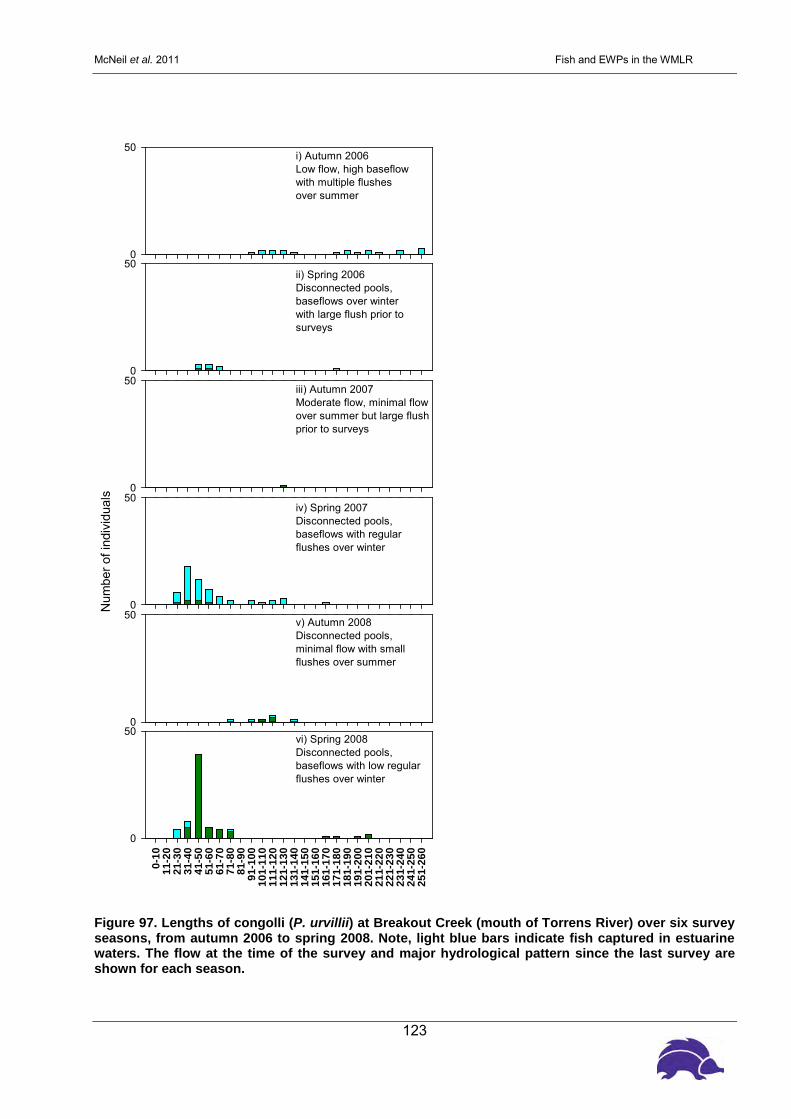
McNeil et al. 2011 Fish and EWPs in the WMLR
123
Figure 97. Lengths of congolli (P. urvillii) at Breakout Creek (mouth of Torrens River) over six survey seasons, from autumn 2006 to spring 2008. Note, light blue bars indicate fish captured in estuarine waters. The flow at the time of the survey and major hydrological pattern since the last survey are shown for each season.
Size class (mm)
0-10
11-2
021
-30
31-4
041
-50
51-6
061
-70
71-8
081
-90
91-1
0010
1-11
011
1-12
012
1-13
013
1-14
014
1-15
015
1-16
016
1-17
017
1-18
018
1-19
019
1-20
020
1-21
021
1-22
022
1-23
023
1-24
024
1-25
025
1-26
0
0
50
Size class (mm)
0-10
11-2
021
-30
31-4
041
-50
51-6
061
-70
71-8
081
-90
91-1
0010
1-11
011
1-12
012
1-13
013
1-14
014
1-15
015
1-16
016
1-17
017
1-18
018
1-19
019
1-20
020
1-21
021
1-22
022
1-23
023
1-24
024
1-25
025
1-26
0
0
50
Size class (mm)
0-10
11-2
021
-30
31-4
041
-50
51-6
061
-70
71-8
081
-90
91-1
0010
1-11
011
1-12
012
1-13
013
1-14
014
1-15
015
1-16
016
1-17
017
1-18
018
1-19
019
1-20
020
1-21
021
1-22
022
1-23
023
1-24
024
1-25
025
1-26
0
0
50
Size class (mm)
0-10
11-2
021
-30
31-4
041
-50
51-6
061
-70
71-8
081
-90
91-1
0010
1-11
011
1-12
012
1-13
013
1-14
014
1-15
015
1-16
016
1-17
017
1-18
018
1-19
019
1-20
020
1-21
021
1-22
022
1-23
023
1-24
024
1-25
025
1-26
0
Num
ber o
f ind
ivid
uals
0
50
Size class (mm)
0-10
11-2
021
-30
31-4
041
-50
51-6
061
-70
71-8
081
-90
91-1
0010
1-11
011
1-12
012
1-13
013
1-14
014
1-15
015
1-16
016
1-17
017
1-18
018
1-19
019
1-20
020
1-21
021
1-22
022
1-23
023
1-24
024
1-25
025
1-26
0
0
50
0-10
11-2
021
-30
31-4
041
-50
51-6
061
-70
71-8
081
-90
91-1
0010
1-11
011
1-12
012
1-13
013
1-14
014
1-15
015
1-16
016
1-17
017
1-18
018
1-19
019
1-20
020
1-21
021
1-22
022
1-23
023
1-24
024
1-25
025
1-26
0
0
50
i) Autumn 2006Low flow, high baseflowwith multiple flushes over summer
ii) Spring 2006Disconnected pools, baseflows over winter with large flush prior tosurveys
iv) Spring 2007Disconnected pools, baseflows with regular flushes over winter
iii) Autumn 2007Moderate flow, minimal flowover summer but large flushprior to surveys
v) Autumn 2008Disconnected pools, minimal flow with small flushes over summer
vi) Spring 2008Disconnected pools, baseflows with low regularflushes over winter

McNeil et al. 2011 Fish and EWPs in the WMLR
124
Figure 98. Lengths of freshwater catfish (T. tandanus) at Breakout Creek (mouth of Torrens River) over six survey seasons, from autumn 2006 to spring 2008. Note, light blue bars indicate fish captured in estuarine waters. The flow at the time of the survey and major hydrological pattern since the last survey are shown for each season.
Size class (mm)
0-10
11-2
021
-30
31-4
041
-50
51-6
061
-70
71-8
081
-90
91-1
0010
1-11
011
1-12
012
1-13
013
1-14
014
1-15
015
1-16
016
1-17
017
1-18
018
1-19
019
1-20
020
1-21
021
1-22
022
1-23
023
1-24
024
1-25
025
1-26
026
1-27
027
1-28
028
1-29
029
1-30
030
0-40
040
1-50
0>5
00
0
30
Size class (mm)
0-10
11-2
021
-30
31-4
041
-50
51-6
061
-70
71-8
081
-90
91-1
0010
1-11
011
1-12
012
1-13
013
1-14
014
1-15
015
1-16
016
1-17
017
1-18
018
1-19
019
1-20
020
1-21
021
1-22
022
1-23
023
1-24
024
1-25
025
1-26
026
1-27
027
1-28
028
1-29
029
1-30
030
0-40
040
1-50
0>5
00
0
30
Size class (mm)
0-10
11-2
021
-30
31-4
041
-50
51-6
061
-70
71-8
081
-90
91-1
0010
1-11
011
1-12
012
1-13
013
1-14
014
1-15
015
1-16
016
1-17
017
1-18
018
1-19
019
1-20
020
1-21
021
1-22
022
1-23
023
1-24
024
1-25
025
1-26
026
1-27
027
1-28
028
1-29
029
1-30
030
0-40
040
1-50
0>5
00
0
30
Size class (mm)
0-10
11-2
021
-30
31-4
041
-50
51-6
061
-70
71-8
081
-90
91-1
0010
1-11
011
1-12
012
1-13
013
1-14
014
1-15
015
1-16
016
1-17
017
1-18
018
1-19
019
1-20
020
1-21
021
1-22
022
1-23
023
1-24
024
1-25
025
1-26
026
1-27
027
1-28
028
1-29
029
1-30
030
0-40
040
1-50
0>5
00
Num
ber o
f ind
ivid
uals
0
30
Size class (mm)
0-10
11-2
021
-30
31-4
041
-50
51-6
061
-70
71-8
081
-90
91-1
0010
1-11
011
1-12
012
1-13
013
1-14
014
1-15
015
1-16
016
1-17
017
1-18
018
1-19
019
1-20
020
1-21
021
1-22
022
1-23
023
1-24
024
1-25
025
1-26
026
1-27
027
1-28
028
1-29
029
1-30
030
0-40
040
1-50
0>5
00
0
30
0-10
11-2
021
-30
31-4
041
-50
51-6
061
-70
71-8
081
-90
91-1
0010
1-11
011
1-12
012
1-13
013
1-14
014
1-15
015
1-16
016
1-17
017
1-18
018
1-19
019
1-20
020
1-21
021
1-22
022
1-23
023
1-24
024
1-25
025
1-26
026
1-27
027
1-28
028
1-29
029
1-30
030
0-40
040
1-50
0>5
00
0
30
i) Autumn 2006Low flow, high baseflowwith multiple flushes over summer
ii) Spring 2006Disconnected pools, baseflows over winter with large flush prior tosurveys
iv) Spring 2007Disconnected pools, baseflows with regular flushes over winter
iii) Autumn 2007Moderate flow, minimal flowover summer but large flushprior to surveys
v) Autumn 2008Disconnected pools, minimal flow with small flushes over summer
vi) Spring 2008Disconnected pools, baseflows with low regularflushes over winter

McNeil et al. 2011 Fish and EWPs in the WMLR
125
Figure 99. Lengths of carp gudgeon (Hypseleotris spp.) at Breakout Creek (mouth of Torrens River) over six survey seasons, from autumn 2006 to spring 2008. Note, light blue bars indicate fish captured in estuarine waters. The flow at the time of the survey and major hydrological pattern since the last survey are shown for each season.
Size class (mm)
0-5
6-10
11-1
516
-20
21-2
526
-30
31-3
536
-40
41-4
546
-50
51-5
556
-60
61-6
566
-70
71-7
5
0
50
100
150
Size class (mm)
0-5
6-10
11-1
516
-20
21-2
526
-30
31-3
536
-40
41-4
546
-50
51-5
556
-60
61-6
566
-70
71-7
5
0
50
100
150
Size class (mm)
0-5
6-10
11-1
516
-20
21-2
526
-30
31-3
536
-40
41-4
546
-50
51-5
556
-60
61-6
566
-70
71-7
5
0
50
100
150
Size class (mm)
0-5
6-10
11-1
516
-20
21-2
526
-30
31-3
536
-40
41-4
546
-50
51-5
556
-60
61-6
566
-70
71-7
5
Num
ber o
f ind
ivid
uals
0
100
200
300
400
500
Size class (mm)
0-5
6-10
11-1
516
-20
21-2
526
-30
31-3
536
-40
41-4
546
-50
51-5
556
-60
61-6
566
-70
71-7
5
0
100
200
300
400
500
0-5
6-10
11-1
516
-20
21-2
526
-30
31-3
536
-40
41-4
546
-50
51-5
556
-60
61-6
566
-70
71-7
5
0
100
200
300
400
500
i) Autumn 2006Low flow, high baseflowwith multiple flushes over summer
ii) Spring 2006Disconnected pools, baseflows over winter with large flush prior tosurveys
iv) Spring 2007Disconnected pools, baseflows with regular flushes over winter
iii) Autumn 2007Moderate flow, minimal flowover summer but large flushprior to surveys
v) Autumn 2008Disconnected pools, minimal flow with small flushes over summer
vi) Spring 2008Disconnected pools, baseflows with low regularflushes over winter
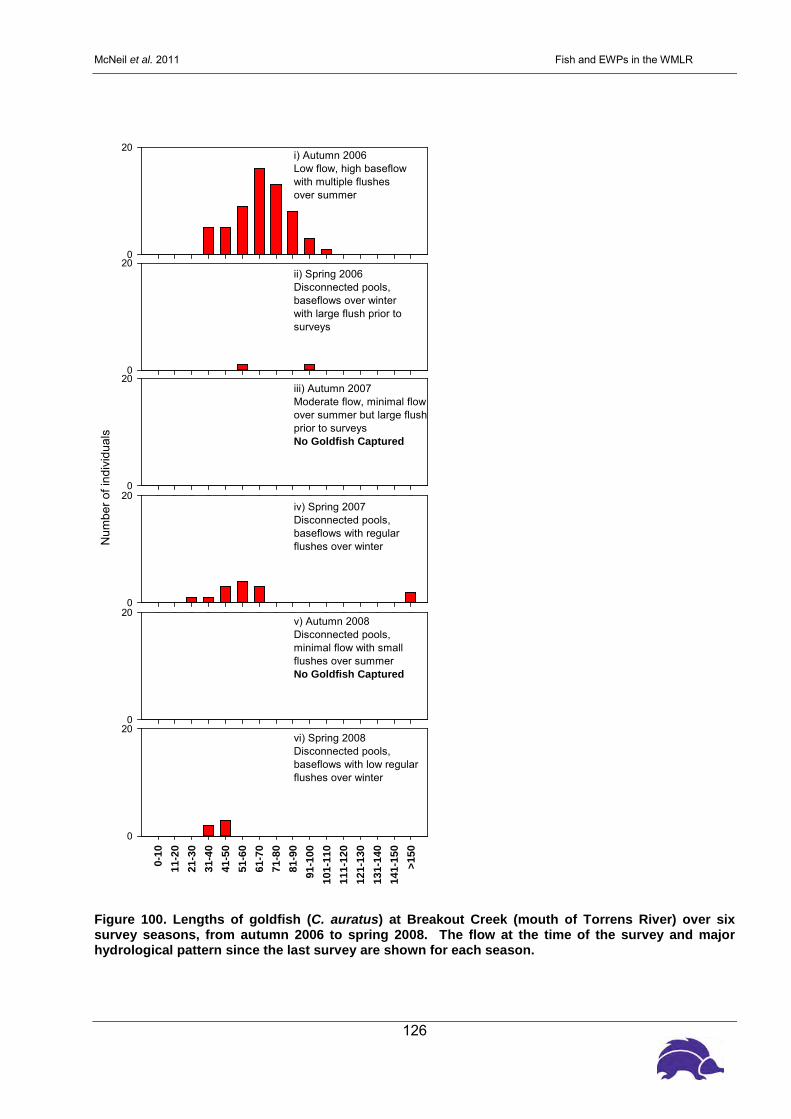
McNeil et al. 2011 Fish and EWPs in the WMLR
126
Figure 100. Lengths of goldfish (C. auratus) at Breakout Creek (mouth of Torrens River) over six survey seasons, from autumn 2006 to spring 2008. The flow at the time of the survey and major hydrological pattern since the last survey are shown for each season.
Size class (mm)
0-10
11-2
021
-30
31-4
041
-50
51-6
061
-70
71-8
081
-90
91-1
0010
1-11
011
1-12
012
1-13
013
1-14
014
1-15
0>1
50
0
20
Size class (mm)
0-10
11-2
021
-30
31-4
041
-50
51-6
061
-70
71-8
081
-90
91-1
0010
1-11
011
1-12
012
1-13
013
1-14
014
1-15
0>1
50
0
20
Size class (mm)
0-10
11-2
021
-30
31-4
041
-50
51-6
061
-70
71-8
081
-90
91-1
0010
1-11
011
1-12
012
1-13
013
1-14
014
1-15
0>1
50
0
20
Size class (mm)
0-10
11-2
021
-30
31-4
041
-50
51-6
061
-70
71-8
081
-90
91-1
0010
1-11
011
1-12
012
1-13
013
1-14
014
1-15
0>1
50
Num
ber o
f ind
ivid
uals
0
20
Size class (mm)
0-10
11-2
021
-30
31-4
041
-50
51-6
061
-70
71-8
081
-90
91-1
0010
1-11
011
1-12
012
1-13
013
1-14
014
1-15
0>1
50
0
20
0-10
11-2
021
-30
31-4
041
-50
51-6
061
-70
71-8
081
-90
91-1
0010
1-11
011
1-12
012
1-13
013
1-14
014
1-15
0>1
50
0
20
i) Autumn 2006Low flow, high baseflowwith multiple flushes over summer
ii) Spring 2006Disconnected pools, baseflows over winter with large flush prior tosurveys
iv) Spring 2007Disconnected pools, baseflows with regular flushes over winter
iii) Autumn 2007Moderate flow, minimal flowover summer but large flushprior to surveysNo Goldfish Captured
v) Autumn 2008Disconnected pools, minimal flow with small flushes over summerNo Goldfish Captured
vi) Spring 2008Disconnected pools, baseflows with low regularflushes over winter

McNeil et al. 2011 Fish and EWPs in the WMLR
127
Figure 101. Lengths of carp (C. carpio) at Breakout Creek (mouth of Torrens River) over six survey seasons, from autumn 2006 to spring 2008. The flow at the time of the survey and major hydrological pattern since the last survey are shown for each season.
Size class (mm)
0-10
11-2
021
-30
31-4
041
-50
51-6
061
-70
71-8
081
-90
91-1
0010
1-11
011
1-12
012
1-13
013
1-14
014
1-15
015
1-16
016
1-17
017
1-18
018
1-19
019
1-20
0
0
50
Size class (mm)
0-10
11-2
021
-30
31-4
041
-50
51-6
061
-70
71-8
081
-90
91-1
0010
1-11
011
1-12
012
1-13
013
1-14
014
1-15
015
1-16
016
1-17
017
1-18
018
1-19
019
1-20
0
0
50
100
Size class (mm)
0-10
11-2
021
-30
31-4
041
-50
51-6
061
-70
71-8
081
-90
91-1
0010
1-11
011
1-12
012
1-13
013
1-14
014
1-15
015
1-16
016
1-17
017
1-18
018
1-19
019
1-20
0
0
50
Size class (mm)
0-10
11-2
021
-30
31-4
041
-50
51-6
061
-70
71-8
081
-90
91-1
0010
1-11
011
1-12
012
1-13
013
1-14
014
1-15
015
1-16
016
1-17
017
1-18
018
1-19
019
1-20
0
Num
ber o
f ind
ivid
uals
0
50
100
Size class (mm)
0-10
11-2
021
-30
31-4
041
-50
51-6
061
-70
71-8
081
-90
91-1
0010
1-11
011
1-12
012
1-13
013
1-14
014
1-15
015
1-16
016
1-17
017
1-18
018
1-19
019
1-20
0
0
50
0-10
11-2
021
-30
31-4
041
-50
51-6
061
-70
71-8
081
-90
91-1
0010
1-11
011
1-12
012
1-13
013
1-14
014
1-15
015
1-16
016
1-17
017
1-18
018
1-19
019
1-20
0
0
50
100
150
200
250
i) Autumn 2006Low flow, high baseflowwith multiple flushes over summer
ii) Spring 2006Disconnected pools, baseflows over winter with large flush prior tosurveys
iv) Spring 2007Disconnected pools, baseflows with regular flushes over winter
iii) Autumn 2007Moderate flow, minimal flowover summer but large flushprior to surveys
v) Autumn 2008Disconnected pools, minimal flow with small flushes over summer
vi) Spring 2008Disconnected pools, baseflows with low regularflushes over winter

McNeil et al. 2011 Fish and EWPs in the WMLR
128
Figure 102. Lengths of gambusia (G. holbrooki) at Breakout Creek (mouth of Torrens River) over six survey seasons, from autumn 2006 to spring 2008. Note, light blue bars indicate fish captured in estuarine waters. The flow at the time of the survey and major hydrological pattern since the last survey are shown for each season.
Size class (mm)
0-5
6-10
11-1
516
-20
21-2
526
-30
31-3
536
-40
41-4
546
-50
51-5
556
-60
61-6
566
-70
71-7
576
-80
0
50
Size class (mm)
0-5
6-10
11-1
516
-20
21-2
526
-30
31-3
536
-40
41-4
546
-50
51-5
556
-60
61-6
566
-70
71-7
576
-80
0
50
Size class (mm)
0-5
6-10
11-1
516
-20
21-2
526
-30
31-3
536
-40
41-4
546
-50
51-5
556
-60
61-6
566
-70
71-7
576
-80
0
50
100
150
200
Size class (mm)
0-5
6-10
11-1
516
-20
21-2
526
-30
31-3
536
-40
41-4
546
-50
51-5
556
-60
61-6
566
-70
71-7
576
-80
Num
ber o
f ind
ivid
uals
0
50
Size class (mm)
0-5
6-10
11-1
516
-20
21-2
526
-30
31-3
536
-40
41-4
546
-50
51-5
556
-60
61-6
566
-70
71-7
576
-80
0
50
100
0-5
6-10
11-1
516
-20
21-2
526
-30
31-3
536
-40
41-4
546
-50
51-5
556
-60
61-6
566
-70
71-7
576
-80
0
50
i) Autumn 2006Low flow, high baseflowwith multiple flushes over summer
ii) Spring 2006Disconnected pools, baseflows over winter with large flush prior tosurveys
iv) Spring 2007Disconnected pools, baseflows with regular flushes over winter
iii) Autumn 2007Moderate flow, minimal flowover summer but large flushprior to surveys
v) Autumn 2008Disconnected pools, minimal flow with small flushes over summer
vi) Spring 2008Disconnected pools, baseflows with low regularflushes over winter

McNeil et al. 2011 Fish and EWPs in the WMLR
129
3.3. Onkaparinga River
The Onkaparinga River was second to the Torrens in species richness, with fourteen native
species captured during the surveys, including seven native freshwater species. No known
translocated species were captured, although the dwarf flathead gudgeon was possibly
translocated from the Murray-Darling Basin through inter-basin water pipelines (McNeil and
Hammer 2007). Golden perch, which were translocated into reservoirs in the Onkaparinga in the
past (SKM 2003) were not recorded from the trial reach. The southern purple-spotted gudgeon
was historically common in the Onkaparinga River (Scott 1961), but given the last confirmed
records from this study reach were during the 1880s (Hammer et al. 2009) it is presumed extinct in
the Onkaparinga.
Pouched and short–headed lampreys were not recorded from the Onkaparinga and its continued
absence during this and other surveys (McNeil et al. 2009) suggest that these species may have
become locally extinct from the catchment. Records of smelt from the lower Onkaparinga River
(SKM 2003) are considered to be erroneous identifications. No other smelt have ever been
recorded from the catchment during this or other surveys and several species slightly similar in
appearance to smelt (juvenile common galaxias, glass goby and hardyhead) are present at the
reported sites (see also Hammer and Walker 2004).
It is recommended that the presence of smelt in the WMLR hereby be considered erroneous and
that the species should not be included in the fish fauna of the WMLR.
There were a large number of introduced species (five), however trout and common carp were not
observed during these surveys, although they have been recorded within the reach during related
separate surveys. Flathead gudgeon and dwarf flathead gudgeon were widespread in the
catchment but their numbers declined during the survey period, particularly at upstream sites.
Common galaxias were initially distributed throughout the target reach, but disappeared in the
upper reaches throughout the survey. This contraction of diadromous fish into the very lower
reaches of the river matched the distribution of congolli. It is considered that species with marine
dependant life history phases were unable to recolonise the upper reaches, probably due to low
flows. Furthermore, fish in lower reaches were subject to extreme environmental conditions in
shrinking pools with most fish suffering from disease and malnutrition during the summer of 2008
(Figure 103).
Multivariate analyses of the fish community in the Onkaparinga confirmed the distinct fish
assemblage at Old Noarlunga (Figure 104). This was largely due to the diadromous and estuarine
species present there that due to low flows, didn’t have access to upper reaches of the river.
Accordingly, there was a weak relationship between higher conductivity and the Old Noarlunga

McNeil et al. 2011 Fish and EWPs in the WMLR
130
samples, and higher dissolved oxygen and pH with Brooks Road and Clarendon. Flow metrics did
not have a significant relationship with fish assemblage. In other words, there were no flow metrics
that were capable of explaining 10% of the variation in fish assemblage, but water quality
parameters (conductivity, DO and pH) were.
Figure 103. Emaciated, diseased G. maculatus from the shallow Pool 1 at Old Noarlunga during the dry season of 2008 showing infections, encystations and rupturing emergent parasites.
DOCond pH
Axis 1
Axis
2
SiteClarendon WeirBrooks RoadOld Noarlunga
Figure 104. NMDS ordination of total fish community in the Onkaparinga River, overlain with correlated environmental vectors (R2>0.1) and labelled by site.

McNeil et al. 2011 Fish and Flows in the WMLR
131
Table 45. Taxa which were present (P), spawning (s) and recruiting (r) for each site and season. The columns of native freshwater fish taxa are shaded green, those of exotic taxa shaded red and those of marine/estuarine taxa shaded blue.
Site
Nam
e
Sam
plin
g S
easo
n
Com
mon
gal
axia
s
Mou
ntai
n ga
laxi
as
Clim
bing
gal
axia
s
Flat
head
gud
geon
Dw
arf f
lath
ead
gudg
eon
Sho
rtfin
ned
eel
Gam
busi
a
Red
fin p
erch
Gol
dfis
h
Car
p
Tenc
h
Con
golli
Brid
led
goby
Blu
e S
pot g
oby
Tam
ar g
oby
Sm
allm
outh
har
dyhe
ad
Bla
ck b
ream
Jum
ping
mul
let
Yel
low
-eye
d m
ulle
t
Clarendon Oval 2006A P P P P P P Pr Pr P 2006S P P P P P P 2007A Pr P P P P Pr 2007S P P P P P P P 2008A Pr P P P P 2008S P P P P P P P P
Brooks Road 2006A Ps Ps P P Ps P 2006S P P P Ps Ps P P Pr 2007A Ps Ps Ps P P Pr 2007S P P P P P 2008A Pr P P P P Pr 2008S P P P P
Old Noarlunga 2006A Ps P P Ps Pr Pr P P 2006S P P P Pr P P Pr 2007A Ps P P P Ps P P P P P 2007S Ps Ps Ps Ps P P P 2008A Ps P P Pr Ps 2008S P P P P P P P P P P

McNeil et al. 2011 Fish and EWPs in the WMLR
132
3.3.1. Clarendon Oval
3.3.1.1. Site assessment
The Clarendon Site was situated at the Clarendon Oval reserve and consisted of three separate
pools within a 300 m reach approximately 500 m downstream of the Clarendon Weir. Each of the
pools was similar in size and depth with pool 2 being the smallest and shallowest (Table 46). The
substrate in all pools was dominated by cobbles over 10 mm diameter with large littoral sections of
emergent macrophytes, predominantly cumbungi and Phragmites.
The riparian zone was largely dominated by exotic deciduous trees with a few redgums whilst
blackberry and fig trees dominated the understory. Pool 3 had a denser riparian overstorey than
the others. Small patches of submerged macrophytes, predominantly water ribbon (Triglochin
procerum) were present in all pools, fluctuating in cover seasonally. All pools were bordered by a
rocky cliff on the right bank with modified parkland on the left bank. A long section of overgrown
shallow riffle habitat separated Pool 1 and Pool 2, whilst Pool 2 and Pool 3 were separated by a
short section of Phragmites.
All pools became isolated during each dry season and were reconnected each winter, no pools
dried completely in any season. Electrofishing surveys were conducted where access was
possible between pools and extended upstream to the footbridge causeway. The run/riffle section
downstream of Pool 3 was electrofished when inundated.
Table 46. Habitat characteristics of the three monitoring pools at Clarendon Oval in the Onkaparinga River.
Clarendon Oval Substrate size (mm) Riparian cover (%) Snags Absolute max. depth (m)
Pool 1 5-10+ 30 0 2.0 Pool 2 5-10+ 21 1 1.8 Pool 3 5-10+ 95 3-4 2.2
Pool 1 (Figure 105) was situated on a bend with high cliff on the right bank. Large rocks and
cobbles dominated the substrate. The left bank was dominated by cumbungi with a riparian
overstorey of wattle and redgum with some bottlebrush. The right bank consisted primarily of fig
(Ficus spp.) and blackberry (Rubus spp.), with no overstorey. This was the least variable of the
three Clarendon pools although the pool became reasonably shallow during 2007 and 2008 (Table
47).
Most water quality parameters remained fairly constant over the study period, whilst macrophyte
cover varied between 5 % and 25 % seasonally. Green filamentous algal mats formed within this

McNeil et al. 2011 Fish and EWPs in the WMLR
133
pool during 2007. Except for the first season in autumn 2006, this pool was isolated and not
flowing in either spring or autumn sampling periods.
Figure 105. Clarendon Oval Pool 1 in a) autumn 2007 and b) spring 2007.
Table 47. Water quality parameters recorded in Clarendon Oval Pool 1 during each survey.
Pool 1 Season DO (ppm)
Cond. (μS/cm)
pH Temp. (ºC)
Max. depth (m)
Macrophyte (% cover)
Hydrology Antecedent Hydrology
2006 autumn 10 1135 8 15.9 2.0 25 Low flow Flushes 2006 spring 8 981 8 15.7 1.8 5 No flow Flushes 2007 autumn 7 1736 8 15.3 1.8 20 No flow Very low flows 2007 spring 10 1363 8 16.5 1.5 15 No flow Very low flows 2008 autumn 11 1300 8 12.3 1.0 10 No flow Very low flows 2008 spring 6.6 1138 7.4 18.2 1.6 20 No flow Very low flows
Pool 2 (Figure 106) was almost completely surrounded by emergent Phragmites with small
patches of cumbungi. The right bank was rocky cliff whilst neither bank possessed significant
riparian overstorey except for a single bottlebrush and a small silver willow (Salix spp.) with some
blackberry also present. Pool 2 always possessed a reasonable cover of macrophytes although
estimates of cover varied seasonally between 5 % and 40 %, being higher in spring compared to
autumn (Table 48). Macrophytes were dominated by water ribbon and large patches of curly pond
weed (Potamogeton crispus) developing in some seasons. This pool became very shallow during
autumn 2007 and 2008 but filled each winter.
Oxygen could be very high in this pool, particularly with higher water temperature and salinity rose
to 2800 μS/cm in autumn 2008, although these values are unlikely to have biological significance.
Very low flow conditions existed during the first (autumn 2006) and final (spring 2008) sampling
trips but this site was isolated and not flowing during all other times.

McNeil et al. 2011 Fish and EWPs in the WMLR
134
Figure 106. Clarendon Oval Pool 2 in a) autumn 2006 and b) autumn 2007.
Table 48. Water quality parameters recorded in Clarendon Oval Pool 2 during each survey.
Pool 2 Season DO (ppm)
Cond. (μS/cm)
pH Temp. (ºC)
Max. depth (m)
Macrophyte (% cover)
Hydrology Antecedent Hydrology
2006 autumn 6 1165 8 15.2 2.0 15 Low flow Flushes 2006 spring 8 1038 8 15.8 1.8 20 No flow Flushes 2007 autumn 14 1264 8 17.2 1.0 5 No flow Very low flows 2007 spring 9 1152 8 16.2 1.8 40 No flow Very low flows 2008 autumn 12 2800 8 12.8 1.0 10 No flow Very low flows 2008 spring 13.3 1190 7.8 17.3 2.0 40 Low flow Very low flows
Pool 3 was the farthest downstream and as with the others the right bank was dominated by a cliff
with two bottlebrush overhanging the pool (Figure 107). The upstream end of Pool 3 was
surrounded with cumbungi and Phragmites, however the left bank was dominated by tall exotic
trees and a few redgums with little ground cove or understorey. The downstream end of the pool
opened into a wide riffle/run section and connected to a larger corner pool downstream when full.
A deep section below a rock ledge on the right bank made this the deepest of the three Clarendon
pools.
Water quality parameters varied little over the study period; however the pool became shallower
during autumn and very shallow in autumn 2008. Macrophyte cover increased each spring with
curly pondweed dominating and small patches of ribbonweed (Vallisneria australis) (Table 49).
Except for the first season in autumn 2006, this pool was isolated and not flowing in either spring or
autumn sampling periods.

McNeil et al. 2011 Fish and EWPs in the WMLR
135
Figure 107. Clarendon Oval Pool 3 in a) spring 2007 and b) autumn 2008.
Table 49. Water quality parameters recorded in Clarendon Oval Pool 3 during each survey. Pool 3 Season DO
(ppm) Cond. (μS/cm)
pH Temp. (ºC)
Max. depth (m)
Macrophyte (% cover)
Hydrology Antecedent Hydrology
2006 autumn 7 1050 7 15.1 2.2 10 Low flow Flushes 2006 spring 6 957 8 16.0 2.0 25 No flow Flushes 2007 autumn 10 1573 9 16.7 1.2 5 No flow Very low flows 2007 spring 6 1131 8 15.5 2.0 10 No flow Very low flows 2008 autumn 9 1800 8 12.6 0.8 0 No flow Very low flows 2008 spring 6.8 1138 7.8 18.1 1.6 30 No Flow Very low flows
3.3.1.2. Water Quality
Salinity was the only water quality parameter to be high enough to impact on aquatic biota. Whilst
levels recorded here may be high enough to impact on particularly sensitive invertebrate species,
all levels recorded are suitable for the maintenance of native fish.
3.3.1.3. Hydrology
The water level at Clarendon Oval was generally very low, however, survey pools were connected
during autumn 2006, following this period these pools were disconnected for the duration of the
project. Data from the Clarendon Oval gauge (flowing under the footbridge) indicates that there
were periods of several months when no flows were maintained, and that water flow decreased
from 2006 to 2007 (Figure 108). During the winter of 2006 there was sustained baseflow (average
daily flow of 36 ML/day from the end of July to mid-October), which included five days of small
flushing flows (over 65 ML/day) at the end of August. However, from mid-October until the spring
2006 surveys, conducted on November 16, there was no flow recorded at the gauge.
This lack of any recordable flow continued throughout summer and into autumn 2007, up until the
surveys conducted on April 27. Over the winter of 2007 flow was much lower than the previous
year, and very much lower than the environmental flow requirements recommended by the
DWLBC (Van Laarhoven and van der Wielen 2009), averaging <1 ML/day except for a couple of
small flushing flows of short duration. There was only one day when any of these pulsed flows

McNeil et al. 2011 Fish and EWPs in the WMLR
136
exceeded 40 ML/day during that winter. The average flow was very low (<0.5 ML/day) during the
three months prior to the spring 2007 surveys, conducted on November 8, and there was no
recordable flow for much of the time between these surveys and those conducted in autumn 2008,
on April 30. No moderate or high flushing flows were recorded at Clarendon Oval over the past
two years. Ja
n/05
M
ar/0
5
May
/05
Ju
l/05
Se
p/05
N
ov/0
5
Jan/
06
Mar
/06
M
ay/0
6
Jul/0
6
Sep/
06
Nov
/06
Ja
n/07
M
ar/0
7
May
/07
Ju
l/07
Se
p/07
N
ov/0
7
Jan/
08
Mar
/08
M
ay/0
8
Jul/0
8
Sep/
08
Nov
/08
Ja
n/09
ML/
day
0
10
20
30
40
50
60
70
80
90
100
Figure 108. Hydrograph for flow in Onkaparinga River at Clarendon Oval. Flow data (ML/day) was collected downstream of Clarendon Oval (gauge number A5031004) from May 21, 2006 (indicated by blue arrow). The timing of each survey season is also shown above the figure.
3.3.1.4. Fish community
Six native and four introduced fish species were captured at Clarendon Oval over the five survey
seasons (Figure 109). From autumn 2006 to autumn 2007 flathead gudgeon were the most
common species captured; following this the community was dominated introduced species. Dwarf
flathead gudgeon and galaxiids were captured in low numbers during each survey season.
Common galaxias and mountain galaxias peaked in spring 2006, after the maintenance of winter
baseflows. Neither of these galaxiids has been encountered during spring 2007 and autumn 2008,
2006
A
2006
S
2007
S
2007
A
2008
A
2008
S

McNeil et al. 2011 Fish and EWPs in the WMLR
137
and only one climbing galaxias was captured. A single native shortfinned eel was collected in
autumn 2006, being the first record for the Onkaparinga Catchment.
Redfin perch and gambusia were the most common introduced species captured and in spring
2007 and autumn 2008, over 50% of the fish captured were one of these two species. Small
numbers of introduced goldfish, carp and tench have also been captured, although typically as
lone individuals in each season.
Figure 109. Abundances of each taxa present in the fish communities at Clarendon Oval (Onkaparinga River) over six survey seasons.
3.3.1.5. Fish population
The flathead gudgeon population at Clarendon Oval appears to be reasonably well established,
with both small and large individuals captured throughout the survey (Figure 110) Although there
was a decline in the number of captures from autumn 2006 to spring 2007, a large number of
medium and large individuals were captured in autumn 2008. The largest numbers of dwarf
flathead gudgeon captures occurred during in autumn 2006 (Figure 111). During all subsequent
surveys small numbers of medium sized dwarf flathead gudgeon were captured. A small number of
common galaxias were captured during both autumn and spring 2006 (Figure 112).
Autumn 06 Spring 06 Autumn 07 Spring 07 Autumn 08 Spring 08
No.
of
indiv
iduals
0102030405060708090
100110120130140150
500100015002000
Shortfin Eel Goldfish European Carp Climbing Galaxias Common Galaxias Mountain Galaxias Tench Dwarf Flathead Gudgeon Redfin Flathead Gudgeon Eastern Gambusia

McNeil et al. 2011 Fish and EWPs in the WMLR
138
A small number of juvenile mountain galaxias were captured during spring 2006 (Figure 113).
However, neither of these species was captured during any subsequent surveys. Two climbing
galaxias were captured, one adult in autumn 2007 and one in spring 2007. The shortfinned eel was
a large adult (~ 700 mm).
The gambusia population remained reasonably stable throughout the surveys (Figure 114). Large
numbers of small to medium sized gambusia were captured in the three surveys from autumn 2006
to autumn 2007. Despite a decline in the number of captures in spring 2007, high numbers were
again captured during autumn 2008.
The redfin perch population also appears to be well established, large numbers of small individuals
and a number of large individuals were captured in each year (Figure 115). The largest numbers
of juvenile recruits at this site were captured during the 2007 surveys and despite a decline in the
number of medium to large sized fish (100mm+) over successive surveys there were still a large
number of small recruits captured during the most recent survey, in autumn 2008.
One large individual tench was collected in spring of each year. A similar pattern was observed for
goldfish, with individuals only occasionally captured, two medium sized fish in autumn 2006, and
one large adult in spring of 2007 and 2008.

McNeil et al. 2011 Fish and EWPs in the WMLR
139
Figure 110. Lengths of flathead gudgeon (P. grandiceps) at Clarendon Oval (Onkaparinga River) over six survey seasons, from autumn 2006 to spring 2008. The flow at the time of the survey and major hydrological pattern since the last survey are shown for each season.
Size class (mm)
0-5
6-10
11-1
516
-20
21-2
526
-30
31-3
536
-40
41-4
546
-50
51-5
556
-60
61-6
566
-70
71-7
576
-80
81-8
586
-90
91-9
596
-100
>100
0
50
100
150
200
250
Size class (mm)
0-5
6-10
11-1
516
-20
21-2
526
-30
31-3
536
-40
41-4
546
-50
51-5
556
-60
61-6
566
-70
71-7
576
-80
81-8
586
-90
91-9
596
-100
>100
0
50
100
Size class (mm)
0-5
6-10
11-1
516
-20
21-2
526
-30
31-3
536
-40
41-4
546
-50
51-5
556
-60
61-6
566
-70
71-7
576
-80
81-8
586
-90
91-9
596
-100
>100
0
50
Size class (mm)
0-5
6-10
11-1
516
-20
21-2
526
-30
31-3
536
-40
41-4
546
-50
51-5
556
-60
61-6
566
-70
71-7
576
-80
81-8
586
-90
91-9
596
-100
>100
Num
ber o
f ind
ivid
uals
0
50
Size class (mm)
0-5
6-10
11-1
516
-20
21-2
526
-30
31-3
536
-40
41-4
546
-50
51-5
556
-60
61-6
566
-70
71-7
576
-80
81-8
586
-90
91-9
596
-100
>100
0
50
100
Size class (mm)
0-5
6-10
11-1
516
-20
21-2
526
-30
31-3
536
-40
41-4
546
-50
51-5
556
-60
61-6
566
-70
71-7
576
-80
81-8
586
-90
91-9
596
-100
>100
0
50
i) Autumn 2006Low flow, flushing flows over summer
ii) Spring 2006Disconnected pools, lowflows over winter
iv) Spring 2007Disconnected pools, very lowflows over winter
vi) Spring 2008Disconnected pools, verylow flows over winter
iii) Autumn 2007Disconnected pools, very low flows over summer
v) Autumn 2008Disconnected pools, very low flows over summer

McNeil et al. 2011 Fish and EWPs in the WMLR
140
Figure 111. Lengths of dwarf flathead gudgeon (P. macrostomus) at Clarendon Oval (Onkaparinga River) over six survey seasons, from autumn 2006 to spring 2008. The flow at the time of the survey and major hydrological pattern since the last survey are shown for each season.
Size class (mm)
0-5
6-10
11-1
516
-20
21-2
526
-30
31-3
536
-40
41-4
546
-50
51-5
556
-60
61-6
566
-70
71-7
5
0
50
100
Size class (mm)
0-5
6-10
11-1
516
-20
21-2
526
-30
31-3
536
-40
41-4
546
-50
51-5
556
-60
61-6
566
-70
71-7
5
0
50
Size class (mm)
0-5
6-10
11-1
516
-20
21-2
526
-30
31-3
536
-40
41-4
546
-50
51-5
556
-60
61-6
566
-70
71-7
5
0
50
Size class (mm)
0-5
6-10
11-1
516
-20
21-2
526
-30
31-3
536
-40
41-4
546
-50
51-5
556
-60
61-6
566
-70
71-7
5
Num
ber o
f ind
ivid
uals
0
50
Size class (mm)
0-5
6-10
11-1
516
-20
21-2
526
-30
31-3
536
-40
41-4
546
-50
51-5
556
-60
61-6
566
-70
71-7
5
0
50
Size class (mm)
0-5
6-10
11-1
516
-20
21-2
526
-30
31-3
536
-40
41-4
546
-50
51-5
556
-60
61-6
566
-70
71-7
5
0
50
i) Autumn 2006Low flow, flushing flows over summer
ii) Spring 2006Disconnected pools, small flushing flows over winter
iv) Spring 2007Disconnected pools, very lowflows over winter
iii) Autumn 2007Disconnected pools, very low flows over summer
v) Autumn 2008Disconnected pools, verylow flows over summer
vi) Spring 2008Disconnected pools, verylow flows over winter

McNeil et al. 2011 Fish and EWPs in the WMLR
141
Figure 112. Lengths of common galaxias (G. maculatus) at Clarendon Oval (Onkaparinga River) over six survey seasons, from autumn 2006 to spring 2008. The flow at the time of the survey and major hydrological pattern since the last survey are shown for each season.
Size class (mm)
0-10
11-2
021
-30
31-4
041
-50
51-6
061
-70
71-8
081
-90
91-1
0010
1-11
011
1-12
012
1-13
013
1-14
014
1-15
015
1-16
016
1-17
017
1-18
0
0
20
Size class (mm)
0-10
11-2
021
-30
31-4
041
-50
51-6
061
-70
71-8
081
-90
91-1
0010
1-11
011
1-12
012
1-13
013
1-14
014
1-15
015
1-16
016
1-17
017
1-18
0
0
20
Size class (mm)
0-10
11-2
021
-30
31-4
041
-50
51-6
061
-70
71-8
081
-90
91-1
0010
1-11
011
1-12
012
1-13
013
1-14
014
1-15
015
1-16
016
1-17
017
1-18
0
0
20
Size class (mm)
0-10
11-2
021
-30
31-4
041
-50
51-6
061
-70
71-8
081
-90
91-1
0010
1-11
011
1-12
012
1-13
013
1-14
014
1-15
015
1-16
016
1-17
017
1-18
0
Num
ber o
f ind
ivid
uals
0
20
Size class (mm)
0-10
11-2
021
-30
31-4
041
-50
51-6
061
-70
71-8
081
-90
91-1
0010
1-11
011
1-12
012
1-13
013
1-14
014
1-15
015
1-16
016
1-17
017
1-18
0
0
50
0-10
11-2
021
-30
31-4
041
-50
51-6
061
-70
71-8
081
-90
91-1
0010
1-11
011
1-12
012
1-13
013
1-14
014
1-15
015
1-16
016
1-17
017
1-18
0
0
50
i) Autumn 2006Low flow, flushing flows over summer
ii) Spring 2006Disconnected pools, small flushing flows over winter
iv) Spring 2007Disconnected pools, very lowflows over winterNo Common Galaxias Captured
iii) Autumn 2007Disconnected pools, very low flows over summerNo Common Galaxias Captured
v) Autumn 2008Disconnected pools, verylow flows over summerNo Common Galaxias Captured
vi) Spring 2008Disconnected pools, verylow flows over winterNo Common Galaxias Captured

McNeil et al. 2011 Fish and EWPs in the WMLR
142
Figure 113. Lengths of mountain galaxias (G. olidus) at Clarendon Oval (Onkaparinga River) over six survey seasons, from autumn 2006 to spring 2008. The flow at the time of the survey and major hydrological pattern since the last survey are shown for each season.
Size class (mm)
0-5
6-10
11-1
516
-20
21-2
526
-30
31-3
536
-40
41-4
546
-50
51-5
556
-60
61-6
566
-70
71-7
576
-80
81-8
586
-90
91-9
596
-100
101-
105
106-
110
111-
115
116-
120
0
20
Size class (mm)
0-5
6-10
11-1
516
-20
21-2
526
-30
31-3
536
-40
41-4
546
-50
51-5
556
-60
61-6
566
-70
71-7
576
-80
81-8
586
-90
91-9
596
-100
101-
105
106-
110
111-
115
116-
120
0
20
Size class (mm)
0-5
6-10
11-1
516
-20
21-2
526
-30
31-3
536
-40
41-4
546
-50
51-5
556
-60
61-6
566
-70
71-7
576
-80
81-8
586
-90
91-9
596
-100
101-
105
106-
110
111-
115
116-
120
Num
ber o
f ind
ivid
uals
0
20
Size class (mm)
0-5
6-10
11-1
516
-20
21-2
526
-30
31-3
536
-40
41-4
546
-50
51-5
556
-60
61-6
566
-70
71-7
576
-80
81-8
586
-90
91-9
596
-100
101-
105
106-
110
111-
115
116-
120
0
20
Size class (mm)
0-5
6-10
11-1
516
-20
21-2
526
-30
31-3
536
-40
41-4
546
-50
51-5
556
-60
61-6
566
-70
71-7
576
-80
81-8
586
-90
91-9
596
-100
101-
105
106-
110
111-
115
116-
120
0
20
0-5
6-10
11-1
516
-20
21-2
526
-30
31-3
536
-40
41-4
546
-50
51-5
556
-60
61-6
566
-70
71-7
576
-80
81-8
586
-90
91-9
596
-100
101-
105
106-
110
111-
115
116-
120
0
20
i) Autumn 2006Low flow, flushing flows over summerNo Mountain Galaxias Captured
ii) Spring 2006Disconnected pools, small flushing flows over winter
iv) Spring 2007Disconnected pools, very lowflows over winterNo Mountain Galaxias Captured
iii) Autumn 2007Disconnected pools, very low flows over summerNo Mountain Galaxias Captured
v) Autumn 2008Disconnected pools, verylow flows over summerNo Mountain Galaxias Captured
vi) Spring 2008Disconnected pools, verylow flows over winter

McNeil et al. 2011 Fish and EWPs in the WMLR
143
Figure 114. Lengths of gambusia (G. holbrooki) at Clarendon Oval (Onkaparinga River) over six survey seasons, from autumn 2006 to spring 2008. The flow at the time of the survey and major hydrological pattern since the last survey are shown for each season.
Size class (mm)
0-5
6-10
11-1
516
-20
21-2
526
-30
31-3
536
-40
41-4
546
-50
51-5
556
-60
61-6
566
-70
71-7
576
-80
0
50
100
Size class (mm)
0-5
6-10
11-1
516
-20
21-2
526
-30
31-3
536
-40
41-4
546
-50
51-5
556
-60
61-6
566
-70
71-7
576
-80
0
50
Size class (mm)
0-5
6-10
11-1
516
-20
21-2
526
-30
31-3
536
-40
41-4
546
-50
51-5
556
-60
61-6
566
-70
71-7
576
-80
0
50
Size class (mm)
0-5
6-10
11-1
516
-20
21-2
526
-30
31-3
536
-40
41-4
546
-50
51-5
556
-60
61-6
566
-70
71-7
576
-80
Num
ber o
f ind
ivid
uals
0
50
Size class (mm)
0-5
6-10
11-1
516
-20
21-2
526
-30
31-3
536
-40
41-4
546
-50
51-5
556
-60
61-6
566
-70
71-7
576
-80
0
50
Size class (mm)
0-5
6-10
11-1
516
-20
21-2
526
-30
31-3
536
-40
41-4
546
-50
51-5
556
-60
61-6
566
-70
71-7
576
-80
0
50
i) Autumn 2006Low flow, flushing flows over summer
ii) Spring 2006Disconnected pools, small flushing flows over winter
iv) Spring 2007Disconnected pools, very lowflows over winter
iii) Autumn 2007Disconnected pools, very low flows over summer
v) Autumn 2008Disconnected pools, verylow flows over summer
vi) Spring 2008Disconnected pools, verylow flows over winter

McNeil et al. 2011 Fish and EWPs in the WMLR
144
Figure 115. Lengths of redfin perch (P. fluviatilis) at Clarendon Oval (Onkaparinga River) over six survey seasons, from autumn 2006 to spring 2008. The flow at the time of the survey and major hydrological pattern since the last survey are shown for each season.
Size class (mm)
0-10
11-2
021
-30
31-4
041
-50
51-6
061
-70
71-8
081
-90
91-1
0010
1-11
011
1-12
012
1-13
013
1-14
014
1-15
015
1-16
016
1-17
017
1-18
018
1-19
019
1-20
020
1-21
021
1-22
022
1-23
023
1-24
024
1-25
025
1-26
026
1-27
027
1-28
028
1-29
029
1-30
0>3
00
0
50
Size class (mm)
0-10
11-2
021
-30
31-4
041
-50
51-6
061
-70
71-8
081
-90
91-1
0010
1-11
011
1-12
012
1-13
013
1-14
014
1-15
015
1-16
016
1-17
017
1-18
018
1-19
019
1-20
020
1-21
021
1-22
022
1-23
023
1-24
024
1-25
025
1-26
026
1-27
027
1-28
028
1-29
029
1-30
0>3
00
0
50
Size class (mm)
0-10
11-2
021
-30
31-4
041
-50
51-6
061
-70
71-8
081
-90
91-1
0010
1-11
011
1-12
012
1-13
013
1-14
014
1-15
015
1-16
016
1-17
017
1-18
018
1-19
019
1-20
020
1-21
021
1-22
022
1-23
023
1-24
024
1-25
025
1-26
026
1-27
027
1-28
028
1-29
029
1-30
0>3
00
0
50
Size class (mm)
0-10
11-2
021
-30
31-4
041
-50
51-6
061
-70
71-8
081
-90
91-1
0010
1-11
011
1-12
012
1-13
013
1-14
014
1-15
015
1-16
016
1-17
017
1-18
018
1-19
019
1-20
020
1-21
021
1-22
022
1-23
023
1-24
024
1-25
025
1-26
026
1-27
027
1-28
028
1-29
029
1-30
0>3
00
Num
ber o
f ind
ivid
uals
0
50
Size class (mm)
0-10
11-2
021
-30
31-4
041
-50
51-6
061
-70
71-8
081
-90
91-1
0010
1-11
011
1-12
012
1-13
013
1-14
014
1-15
015
1-16
016
1-17
017
1-18
018
1-19
019
1-20
020
1-21
021
1-22
022
1-23
023
1-24
024
1-25
025
1-26
026
1-27
027
1-28
028
1-29
029
1-30
0>3
00
0
50
Size class (mm)
0-10
11-2
021
-30
31-4
041
-50
51-6
061
-70
71-8
081
-90
91-1
0010
1-11
011
1-12
012
1-13
013
1-14
014
1-15
015
1-16
016
1-17
017
1-18
018
1-19
019
1-20
020
1-21
021
1-22
022
1-23
023
1-24
024
1-25
025
1-26
026
1-27
027
1-28
028
1-29
029
1-30
0>3
00
0
50
100
150
i) Autumn 2006Low flow, flushing flows over summer
ii) Spring 2006Disconnected pools, small flushing flows over winter
iv) Spring 2007Disconnected pools, very lowflows over winter
iii) Autumn 2007Disconnected pools, very low flows over summer
v) Autumn 2008Disconnected pools, verylow flows over summer
vi) Spring 2008Disconnected pools, verylow flows over winter

McNeil et al. 2011 Fish and EWPs in the WMLR
145
3.3.2. Brooks Road
3.3.2.1. Site assessment
The Brooks Rd Site is situated in the Onkaparinga Gorge several kilometres downstream of the
Clarendon Weir. All sites were situated within a 300 m reach of the river. Pool 1 and pool 2 were
connected when full, at opposite ends of a deep section of bedrock based river, with Pool 1 being
somewhat shallower than Pools 2 and 3 (Table 50), whilst Pool 3 was separated from that section
by ~ 30-40 m of riffle. The reach was dominated by solid bedrock with some large rocks present
and steep gully on either bank. Riparian vegetation was not laterally extensive but consisted of
large redgums and relatively high numbers of bottlebrush, ti-tree and wattle. The section was very
rocky and dominated by the introduced foxtail grass (Pennisetum villosum) (Bald and Scholz
2007a), which formed a very dense understorey over 1m tall extending to the water’s edge. This
section was wholly within the Onkaparinga Gorge National Park although historical clearing was
apparent and revegetation of the gorge has been recently undertaken. Electrofishing was
conducted upstream and downstream of the site as well as between Pools 2 and 3. Upstream of
Pool 1 is a small pool amongst dense vegetation which was electrofished when inundated. During
dry periods throughout 2007 and 2008, electrofishing extended downstream to the junction of
Kangarilla Creek as permanent water became scarce.
Table 50. Habitat characteristics of the three monitoring pools at Brooks Road in the Onkaparinga River.
Brooks Road Substrate size (mm) Riparian cover (%) Snags Absolute max. depth (m)
Pool 1 10+-Bedrock 80 0 1.2 Pool 2 Bedrock 50 1 2.5 Pool 3 Bedrock 50 0 2.0
Pools 1 and 2 are at separate ends of a large reach and are connected when full, but separate into
separate pools during the dry season. Pool 1 was relatively shallow and possessed a higher
degree of cobbled substrate in relation to bedrock compared to the other two pools (Figure ). This
pool is the one of the most ephemeral selected for the current study. In autumn 2007, this pool
became incredibly shallow (Figure 116) and moderately saline and oxygen saturation was very low
(Table 51) but still possessed fish; however by autumn 2008 it had dried completely, refilling in
spring 2008. At other times, water quality parameters were reasonable stable and benign. The
pool was surrounded on three sides with emergent cumbungi and Phragmites with a patchy
overstorey of redgum, bottlebrush and some wattles. Submerged macrophytes were rare but were
present in spring of each year. Except for the first season in autumn 2006, this pool was isolated
and not flowing in either spring or autumn sampling periods.
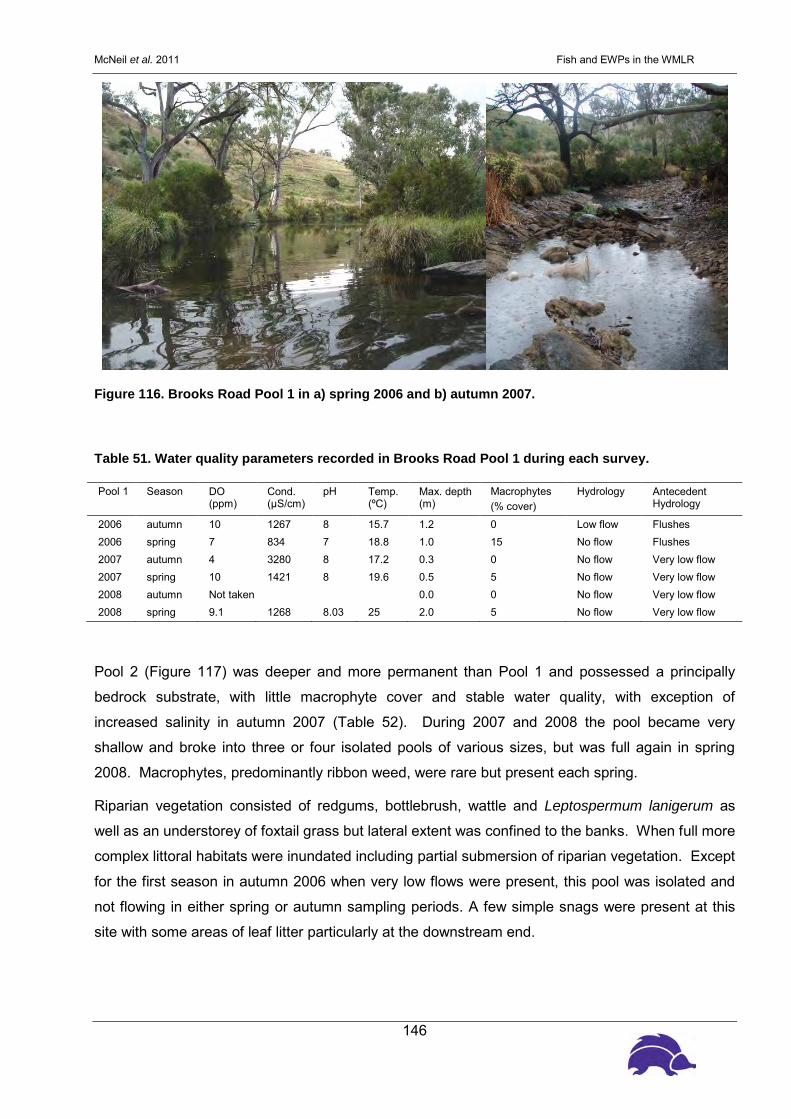
McNeil et al. 2011 Fish and EWPs in the WMLR
146
Figure 116. Brooks Road Pool 1 in a) spring 2006 and b) autumn 2007.
Table 51. Water quality parameters recorded in Brooks Road Pool 1 during each survey.
Pool 1 Season DO (ppm)
Cond. (μS/cm)
pH Temp. (ºC)
Max. depth (m)
Macrophytes (% cover)
Hydrology Antecedent Hydrology
2006 autumn 10 1267 8 15.7 1.2 0 Low flow Flushes 2006 spring 7 834 7 18.8 1.0 15 No flow Flushes 2007 autumn 4 3280 8 17.2 0.3 0 No flow Very low flow 2007 spring 10 1421 8 19.6 0.5 5 No flow Very low flow 2008 autumn Not taken 0.0 0 No flow Very low flow 2008 spring 9.1 1268 8.03 25 2.0 5 No flow Very low flow
Pool 2 (Figure 117) was deeper and more permanent than Pool 1 and possessed a principally
bedrock substrate, with little macrophyte cover and stable water quality, with exception of
increased salinity in autumn 2007 (Table 52). During 2007 and 2008 the pool became very
shallow and broke into three or four isolated pools of various sizes, but was full again in spring
2008. Macrophytes, predominantly ribbon weed, were rare but present each spring.
Riparian vegetation consisted of redgums, bottlebrush, wattle and Leptospermum lanigerum as
well as an understorey of foxtail grass but lateral extent was confined to the banks. When full more
complex littoral habitats were inundated including partial submersion of riparian vegetation. Except
for the first season in autumn 2006 when very low flows were present, this pool was isolated and
not flowing in either spring or autumn sampling periods. A few simple snags were present at this
site with some areas of leaf litter particularly at the downstream end.
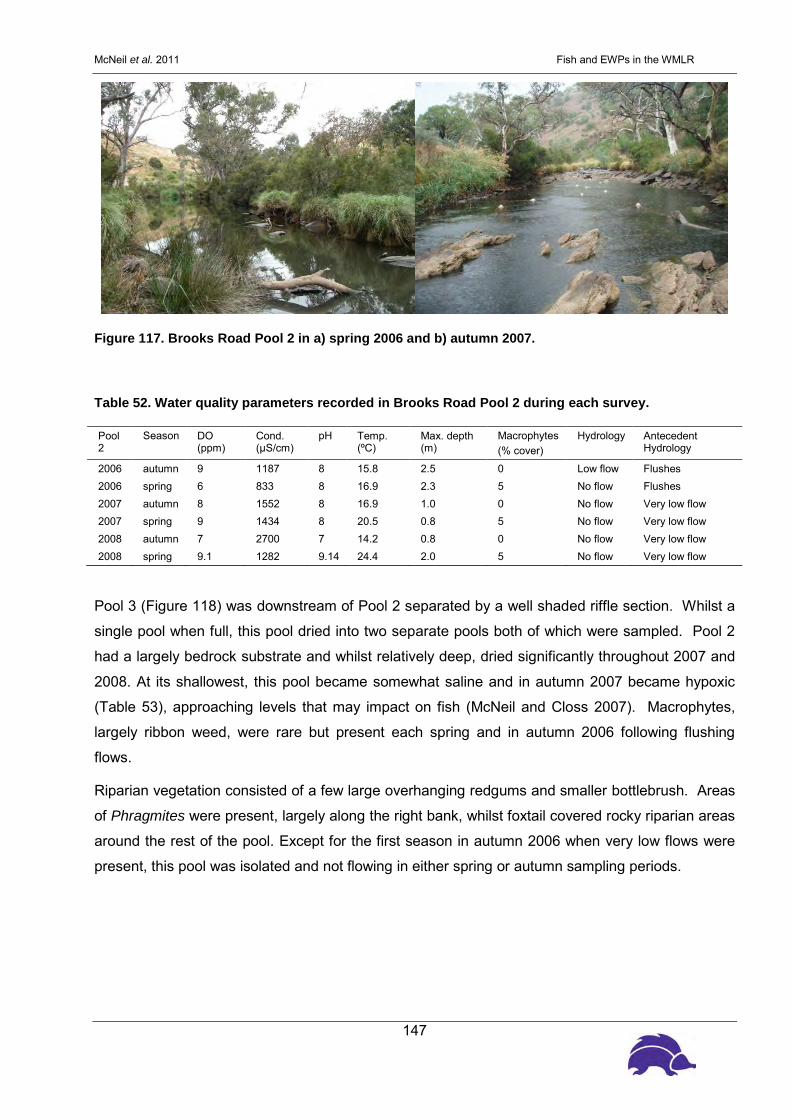
McNeil et al. 2011 Fish and EWPs in the WMLR
147
Figure 117. Brooks Road Pool 2 in a) spring 2006 and b) autumn 2007.
Table 52. Water quality parameters recorded in Brooks Road Pool 2 during each survey.
Pool 2
Season DO (ppm)
Cond. (μS/cm)
pH Temp. (ºC)
Max. depth (m)
Macrophytes (% cover)
Hydrology Antecedent Hydrology
2006 autumn 9 1187 8 15.8 2.5 0 Low flow Flushes 2006 spring 6 833 8 16.9 2.3 5 No flow Flushes 2007 autumn 8 1552 8 16.9 1.0 0 No flow Very low flow 2007 spring 9 1434 8 20.5 0.8 5 No flow Very low flow 2008 autumn 7 2700 7 14.2 0.8 0 No flow Very low flow 2008 spring 9.1 1282 9.14 24.4 2.0 5 No flow Very low flow
Pool 3 (Figure 118) was downstream of Pool 2 separated by a well shaded riffle section. Whilst a
single pool when full, this pool dried into two separate pools both of which were sampled. Pool 2
had a largely bedrock substrate and whilst relatively deep, dried significantly throughout 2007 and
2008. At its shallowest, this pool became somewhat saline and in autumn 2007 became hypoxic
(Table 53), approaching levels that may impact on fish (McNeil and Closs 2007). Macrophytes,
largely ribbon weed, were rare but present each spring and in autumn 2006 following flushing
flows.
Riparian vegetation consisted of a few large overhanging redgums and smaller bottlebrush. Areas
of Phragmites were present, largely along the right bank, whilst foxtail covered rocky riparian areas
around the rest of the pool. Except for the first season in autumn 2006 when very low flows were
present, this pool was isolated and not flowing in either spring or autumn sampling periods.

McNeil et al. 2011 Fish and EWPs in the WMLR
148
Figure 118. Brooks Road Pool 3 in a) spring 2006 and b) autumn 2007.
Table 53. Water quality parameters recorded in Brooks Road Pool 3 during each survey.
Pool 3 Season DO (ppm)
Cond. (μS/cm)
pH Temp. (ºC)
Max. depth (m)
Macrophytes (% cover)
Hydrology Antecedent Hydrology
2006 autumn 8 1193 8 16.1 2.0 5 Low flow Flushes 2006 spring 5 852 8 15.6 1.8 10 No flow Flushes 2007 autumn 2 4500 8 16.7 0.3 0 No flow Very low flow 2007 spring 8 1625 7 27.9 0.5 5 No flow Very low flow 2008 autumn 8 2800 8 13.8 0.4 0 No flow Very low flow 2008 spring 5.99 877 7.02 21.6 1.1 5 No flow Very low flow
3.3.2.2. Water Quality
Hypoxic conditions during 2007 reached levels low enough to present a challenge to the survival of
some species of freshwater fish (McNeil and Closs 2007) however, there is no tolerance data for
WMLR species. Obligate freshwater species such as G. olidus may be more sensitive to hypoxia
and could feasibly be impacted by these levels. Salinity levels recorded here may be high enough
to impact on particularly sensitive invertebrate species, but all levels recorded are suitable for the
maintenance of native fish.
3.3.2.3. Hydrology
Whilst the present surveys were conducted at Brooks Road the water level was similar to that at
Clarendon Oval, with low water level connecting pools during the initial survey in autumn 2006, but
pools disconnected during all subsequent surveys.
The Brooks Road site is downstream from, and has a similar hydrology to Clarendon Oval. A
detailed description of the hydrology occurring at Clarendon Oval during the present surveys is
provided above.

McNeil et al. 2011 Fish and EWPs in the WMLR
149
3.3.2.4. Fish community
There were five native and three introduced fish taxa captured at Brooks Road over the five survey
seasons (Figure 119). Amongst the natives, flathead gudgeon were present in relatively high
abundances in all seasons. Dwarf flathead gudgeon were initially more abundant than flathead but
their numbers have steadily declined from survey to survey.
A large number of mountain galaxias were captured in spring 2006, but far lower numbers of this
taxon were captured in spring 2007 and each of the autumn surveys. Records of extremely
hypoxic conditions at this site in 2007 may be associated with the decline in abundance of
mountain galaxias given their association with flowing well oxygenated water. However, the
species is known to tolerate extreme conditions in drying stream pools (Closs and Lake 2006) and
tolerance threshold data would need to be collected for this species before a strong connection
can be made.
Relatively small numbers of common galaxias were captured in all survey seasons. As for
Clarendon Oval, the number of captures of these galaxiids peaked in spring 2006, at over 100
individuals, but only one individual has been captured during each of the last two surveys,
conducted in spring 2007 and autumn 2008. During the present surveys, only one individual
climbing galaxiid has been captured at Brooks Road in spring 2006. Gambusia was the most
common introduced fish present in pools during all surveys at this site, with particularly high
numbers of these fish captured in all autumns. Both redfin perch and goldfish were present in very
low numbers across survey seasons.
3.3.2.5. Fish population
There were large numbers of flathead gudgeon captured at Brooks Road over 2006 and 2007
(Figure 120). These were predominantly small individuals, but medium and large gudgeon were
also captured in each season. During these two years juvenile recruits peaked in both autumns,
but fewer small individuals were captured in autumn 2008. Most of the dwarf flathead gudgeon
captured at Brooks Road were of medium size in all seasons (Figure 121). This species peaked in
spring 2006, but have steadily declined over successive surveys.
Medium and large mountain galaxias were captured at Brooks Road during the initial surveys in
autumn 2006 (Figure 122). In spring 2006 there was a large number of juveniles captured, but
only a small number of medium sized individuals were captured in autumn 2006. In 2007 the
number of juvenile mountain galaxias captured in spring was much lower than that for the previous
year. Only three medium sized individuals were captured in autumn 2008.
Most of the common galaxias captured at Brooks Road were medium and large individuals (Figure
123). There was a large number of medium sized individuals captured in spring 2006, with reduced

McNeil et al. 2011 Fish and EWPs in the WMLR
150
but still relatively high numbers of individuals captured in autumn 2007. However, there has only
been one individual common galaxias captured in each of the two subsequent surveys. One
medium climbing galaxias (size = 44 mm) was collected in spring 2006.
There were large numbers of small gambusia captured during each of the five surveys (Figure
124). Although few larger individuals were captured from this population, the numbers of captures
has remained relatively stable over survey seasons. Small numbers of large goldfish were
captured, but this does not appear to be an established population (Figure 125). One goldfish was
captured during autumn 2008, and more were captured in 2007.
Figure 119. Abundances of each taxa present in the fish communities of each pool at Brooks Road (Onkaparinga River) over six survey seasons.
Autumn 06 Spring 06 Autumn 07 Spring 07 Autumn 08 Spring 08
No.
of i
ndiv
idua
ls
0
100
200
300
400
500
600
700
800
900
10002000300040005000600070008000 Goldfish
Climbing Galaxias Redfin Common Galaxias Mountain Galaxias Eastern Gambusia Dwarf Flathead Gudgeon Flathead Gudgeon

McNeil et al. 2011 Fish and EWPs in the WMLR
151
Figure 120. Lengths of dwarf flathead gudgeon (P. macrostomus) at Brooks Road (Onkaparinga River) over six survey seasons, from autumn 2006 to spring 2008. The flow at the time of the survey and major hydrological pattern since the last survey are shown for each season.
Size class (mm)
0-5
6-10
11-1
516
-20
21-2
526
-30
31-3
536
-40
41-4
546
-50
51-5
556
-60
61-6
566
-70
71-7
5
0
50
Size class (mm)
0-5
6-10
11-1
516
-20
21-2
526
-30
31-3
536
-40
41-4
546
-50
51-5
556
-60
61-6
566
-70
71-7
5
0
50
100
150
Size class (mm)
0-5
6-10
11-1
516
-20
21-2
526
-30
31-3
536
-40
41-4
546
-50
51-5
556
-60
61-6
566
-70
71-7
5
0
50
100
Size class (mm)
0-5
6-10
11-1
516
-20
21-2
526
-30
31-3
536
-40
41-4
546
-50
51-5
556
-60
61-6
566
-70
71-7
5
Num
ber o
f ind
ivid
uals
0
50
Size class (mm)
0-5
6-10
11-1
516
-20
21-2
526
-30
31-3
536
-40
41-4
546
-50
51-5
556
-60
61-6
566
-70
71-7
5
0
50
Size class (mm)
0-5
6-10
11-1
516
-20
21-2
526
-30
31-3
536
-40
41-4
546
-50
51-5
556
-60
61-6
566
-70
71-7
5
0
50
100
i) Autumn 2006Low flow, flushing flows over summer
ii) Spring 2006Disconnected pools, small flushing flows over winter
iv) Spring 2007Disconnected pools, very lowflows over winter
iii) Autumn 2007Disconnected pools, very low flows over summer
v) Autumn 2008Disconnected pools, verylow flows over summer
vi) Spring 2008Disconnected pools, verylow flows over winter
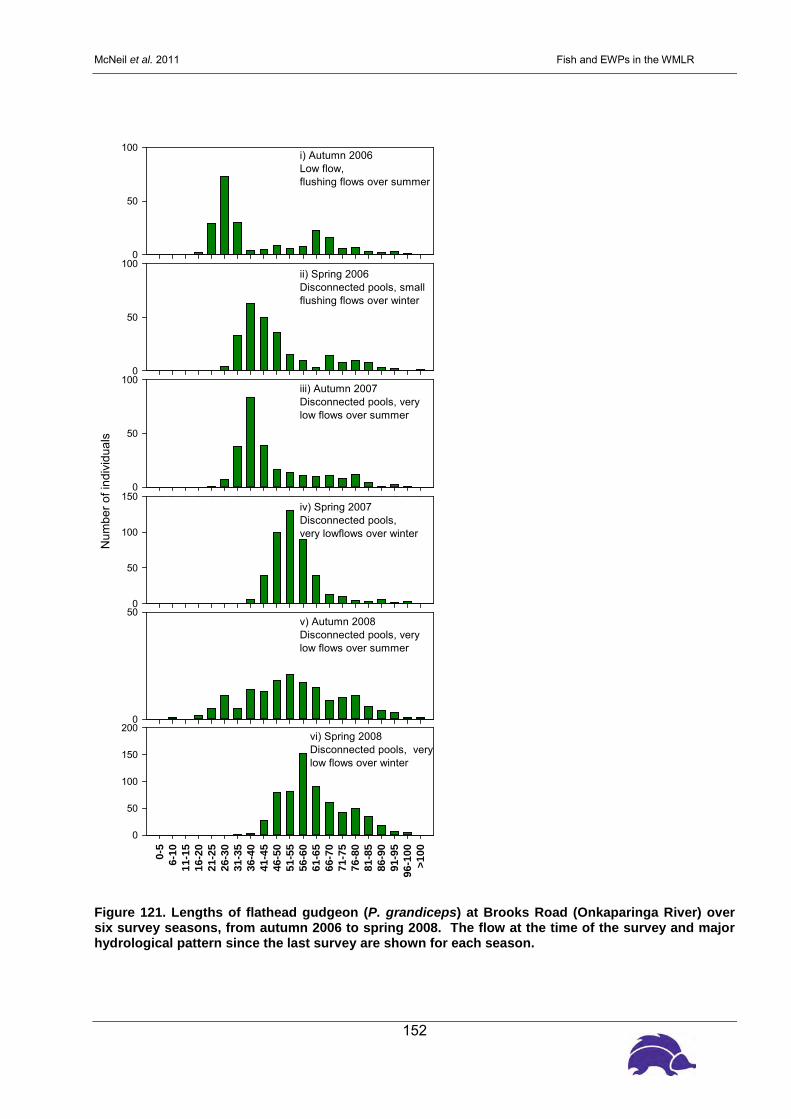
McNeil et al. 2011 Fish and EWPs in the WMLR
152
Figure 121. Lengths of flathead gudgeon (P. grandiceps) at Brooks Road (Onkaparinga River) over six survey seasons, from autumn 2006 to spring 2008. The flow at the time of the survey and major hydrological pattern since the last survey are shown for each season.
Size class (mm)
0-5
6-10
11-1
516
-20
21-2
526
-30
31-3
536
-40
41-4
546
-50
51-5
556
-60
61-6
566
-70
71-7
576
-80
81-8
586
-90
91-9
596
-100
>100
0
50
100
Size class (mm)
0-5
6-10
11-1
516
-20
21-2
526
-30
31-3
536
-40
41-4
546
-50
51-5
556
-60
61-6
566
-70
71-7
576
-80
81-8
586
-90
91-9
596
-100
>100
0
50
100
Size class (mm)
0-5
6-10
11-1
516
-20
21-2
526
-30
31-3
536
-40
41-4
546
-50
51-5
556
-60
61-6
566
-70
71-7
576
-80
81-8
586
-90
91-9
596
-100
>100
0
50
100
Size class (mm)
0-5
6-10
11-1
516
-20
21-2
526
-30
31-3
536
-40
41-4
546
-50
51-5
556
-60
61-6
566
-70
71-7
576
-80
81-8
586
-90
91-9
596
-100
>100
Num
ber o
f ind
ivid
uals
0
50
100
150
Size class (mm)
0-5
6-10
11-1
516
-20
21-2
526
-30
31-3
536
-40
41-4
546
-50
51-5
556
-60
61-6
566
-70
71-7
576
-80
81-8
586
-90
91-9
596
-100
>100
0
50
0-5
6-10
11-1
516
-20
21-2
526
-30
31-3
536
-40
41-4
546
-50
51-5
556
-60
61-6
566
-70
71-7
576
-80
81-8
586
-90
91-9
596
-100
>100
0
50
100
150
200
i) Autumn 2006Low flow, flushing flows over summer
ii) Spring 2006Disconnected pools, small flushing flows over winter
iv) Spring 2007Disconnected pools, very lowflows over winter
iii) Autumn 2007Disconnected pools, very low flows over summer
v) Autumn 2008Disconnected pools, verylow flows over summer
vi) Spring 2008Disconnected pools, verylow flows over winter
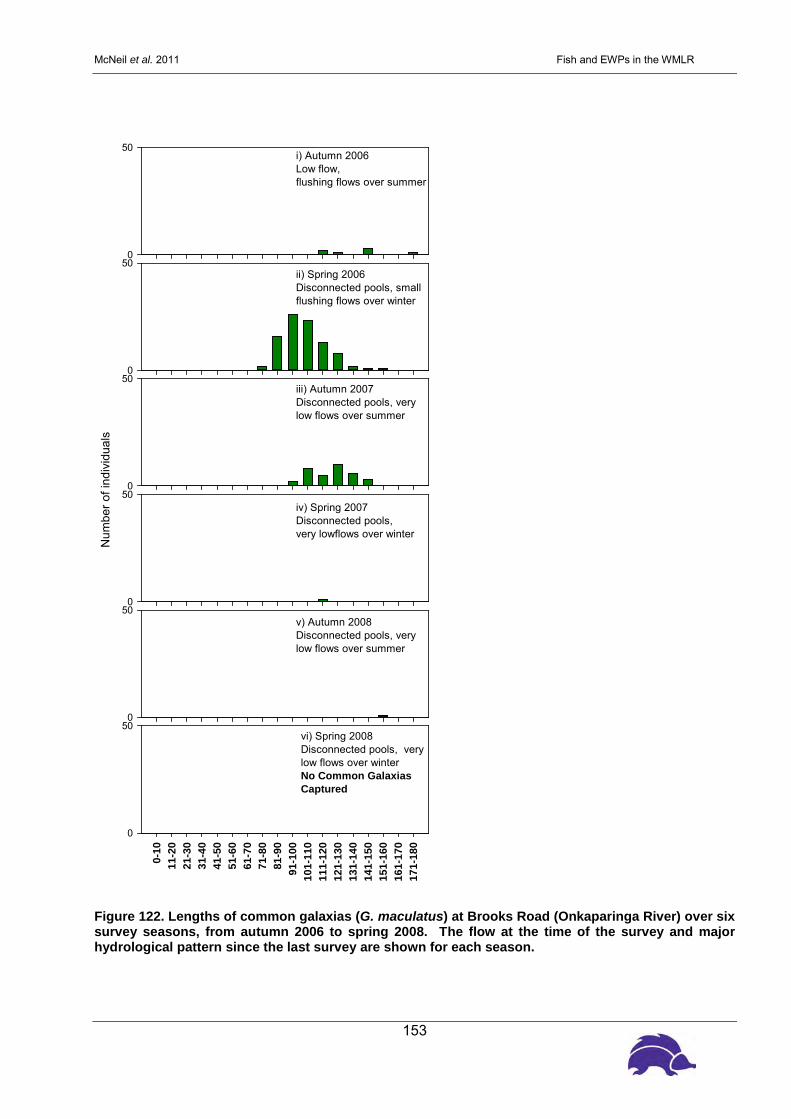
McNeil et al. 2011 Fish and EWPs in the WMLR
153
Figure 122. Lengths of common galaxias (G. maculatus) at Brooks Road (Onkaparinga River) over six survey seasons, from autumn 2006 to spring 2008. The flow at the time of the survey and major hydrological pattern since the last survey are shown for each season.
Size class (mm)
0-10
11-2
021
-30
31-4
041
-50
51-6
061
-70
71-8
081
-90
91-1
0010
1-11
011
1-12
012
1-13
013
1-14
014
1-15
015
1-16
016
1-17
017
1-18
0
0
50
Size class (mm)
0-10
11-2
021
-30
31-4
041
-50
51-6
061
-70
71-8
081
-90
91-1
0010
1-11
011
1-12
012
1-13
013
1-14
014
1-15
015
1-16
016
1-17
017
1-18
0
0
50
Size class (mm)
0-10
11-2
021
-30
31-4
041
-50
51-6
061
-70
71-8
081
-90
91-1
0010
1-11
011
1-12
012
1-13
013
1-14
014
1-15
015
1-16
016
1-17
017
1-18
0
0
50
Size class (mm)
0-10
11-2
021
-30
31-4
041
-50
51-6
061
-70
71-8
081
-90
91-1
0010
1-11
011
1-12
012
1-13
013
1-14
014
1-15
015
1-16
016
1-17
017
1-18
0
Num
ber o
f ind
ivid
uals
0
50
Size class (mm)
0-10
11-2
021
-30
31-4
041
-50
51-6
061
-70
71-8
081
-90
91-1
0010
1-11
011
1-12
012
1-13
013
1-14
014
1-15
015
1-16
016
1-17
017
1-18
0
0
50
0-10
11-2
021
-30
31-4
041
-50
51-6
061
-70
71-8
081
-90
91-1
0010
1-11
011
1-12
012
1-13
013
1-14
014
1-15
015
1-16
016
1-17
017
1-18
0
0
50
i) Autumn 2006Low flow, flushing flows over summer
ii) Spring 2006Disconnected pools, small flushing flows over winter
iv) Spring 2007Disconnected pools, very lowflows over winter
iii) Autumn 2007Disconnected pools, very low flows over summer
v) Autumn 2008Disconnected pools, verylow flows over summer
vi) Spring 2008Disconnected pools, verylow flows over winterNo Common Galaxias Captured

McNeil et al. 2011 Fish and EWPs in the WMLR
154
Figure 123. Lengths of mountain galaxias (G. olidus) at Brooks Road (Onkaparinga River) over six survey seasons, from autumn 2006 to spring 2008. The flow at the time of the survey and major hydrological pattern since the last survey are shown for each season.
Size class (mm)
0-5
6-10
11-1
516
-20
21-2
526
-30
31-3
536
-40
41-4
546
-50
51-5
556
-60
61-6
566
-70
71-7
576
-80
81-8
586
-90
91-9
596
-100
101-
105
106-
110
111-
115
116-
120
0
50
Size class (mm)
0-5
6-10
11-1
516
-20
21-2
526
-30
31-3
536
-40
41-4
546
-50
51-5
556
-60
61-6
566
-70
71-7
576
-80
81-8
586
-90
91-9
596
-100
101-
105
106-
110
111-
115
116-
120
0
50
100
150
Size class (mm)
0-5
6-10
11-1
516
-20
21-2
526
-30
31-3
536
-40
41-4
546
-50
51-5
556
-60
61-6
566
-70
71-7
576
-80
81-8
586
-90
91-9
596
-100
101-
105
106-
110
111-
115
116-
120
0
50
Size class (mm)
0-5
6-10
11-1
516
-20
21-2
526
-30
31-3
536
-40
41-4
546
-50
51-5
556
-60
61-6
566
-70
71-7
576
-80
81-8
586
-90
91-9
596
-100
101-
105
106-
110
111-
115
116-
120
Num
ber o
f ind
ivid
uals
0
50
Size class (mm)
0-5
6-10
11-1
516
-20
21-2
526
-30
31-3
536
-40
41-4
546
-50
51-5
556
-60
61-6
566
-70
71-7
576
-80
81-8
586
-90
91-9
596
-100
101-
105
106-
110
111-
115
116-
120
0
50
0-5
6-10
11-1
516
-20
21-2
526
-30
31-3
536
-40
41-4
546
-50
51-5
556
-60
61-6
566
-70
71-7
576
-80
81-8
586
-90
91-9
596
-100
101-
105
106-
110
111-
115
116-
120
0
50
100
150
i) Autumn 2006Low flow, flushing flows over summer
ii) Spring 2006Disconnected pools, small flushing flows over winter
iv) Spring 2007Disconnected pools, very lowflows over winter
iii) Autumn 2007Disconnected pools, very low flows over summer
v) Autumn 2008Disconnected pools, verylow flows over summer
vi) Spring 2008Disconnected pools, verylow flows over winter

McNeil et al. 2011 Fish and EWPs in the WMLR
155
Figure 124. Lengths of gambusia (G. holbrooki) at Brooks Road (Onkaparinga River) over six survey seasons, from autumn 2006 to spring 2008. The flow at the time of the survey and major hydrological pattern since the last survey are shown for each season.
Size class (mm)
0-5
6-10
11-1
516
-20
21-2
526
-30
31-3
536
-40
41-4
546
-50
51-5
556
-60
61-6
566
-70
71-7
576
-80
0
50
Size class (mm)
0-5
6-10
11-1
516
-20
21-2
526
-30
31-3
536
-40
41-4
546
-50
51-5
556
-60
61-6
566
-70
71-7
576
-80
0
50
100
Size class (mm)
0-5
6-10
11-1
516
-20
21-2
526
-30
31-3
536
-40
41-4
546
-50
51-5
556
-60
61-6
566
-70
71-7
576
-80
0
50
100
150
200
Size class (mm)
0-5
6-10
11-1
516
-20
21-2
526
-30
31-3
536
-40
41-4
546
-50
51-5
556
-60
61-6
566
-70
71-7
576
-80
Num
ber o
f ind
ivid
uals
0
50
Size class (mm)
0-5
6-10
11-1
516
-20
21-2
526
-30
31-3
536
-40
41-4
546
-50
51-5
556
-60
61-6
566
-70
71-7
576
-80
0
50
0-5
6-10
11-1
516
-20
21-2
526
-30
31-3
536
-40
41-4
546
-50
51-5
556
-60
61-6
566
-70
71-7
576
-80
0
50
i) Autumn 2006Low flow, flushing flows over summer
ii) Spring 2006Disconnected pools, small flushing flows over winter
iv) Spring 2007Disconnected pools, very lowflows over winter
iii) Autumn 2007Disconnected pools, very low flows over summer
v) Autumn 2008Disconnected pools, verylow flows over summer
vi) Spring 2008Disconnected pools, verylow flows over winter

McNeil et al. 2011 Fish and EWPs in the WMLR
156
Figure 125. Lengths of goldfish (C. auratus) at Brooks Road (Onkaparinga River) over six survey seasons, from autumn 2006 to spring 2008. The flow at the time of the survey and major hydrological pattern since the last survey are shown for each season.
Size class (mm)
0-10
11-2
021
-30
31-4
041
-50
51-6
061
-70
71-8
081
-90
91-1
0010
1-11
011
1-12
012
1-13
013
1-14
014
1-15
0>1
50
No.
of i
ndiv
idua
ls
0
10
Size class (mm)
0-10
11-2
021
-30
31-4
041
-50
51-6
061
-70
71-8
081
-90
91-1
0010
1-11
011
1-12
012
1-13
013
1-14
014
1-15
0>1
50
No.
of i
ndiv
idua
ls
0
10
Size class (mm)
0-10
11-2
021
-30
31-4
041
-50
51-6
061
-70
71-8
081
-90
91-1
0010
1-11
011
1-12
012
1-13
013
1-14
014
1-15
0>1
50
No.
of i
ndiv
idua
ls
0
10
Size class (mm)
0-10
11-2
021
-30
31-4
041
-50
51-6
061
-70
71-8
081
-90
91-1
0010
1-11
011
1-12
012
1-13
013
1-14
014
1-15
0>1
50
No.
of i
ndiv
idua
ls
0
10
Size class (mm)
0-10
11-2
021
-30
31-4
041
-50
51-6
061
-70
71-8
081
-90
91-1
0010
1-11
011
1-12
012
1-13
013
1-14
014
1-15
0>1
50
No.
of i
ndiv
idua
ls
0
10
0-10
11-2
021
-30
31-4
041
-50
51-6
061
-70
71-8
081
-90
91-1
0010
1-11
011
1-12
012
1-13
013
1-14
014
1-15
0>1
50
No.
of i
ndiv
idua
ls
0
10
i) Autumn 2006Low flow, flushing flows over summer
ii) Spring 2006Disconnected pools, small flushing flows over winter
iv) Spring 2007Disconnected pools, very lowflows over winterNo Goldfish captured
iii) Autumn 2007Disconnected pools, very low flows over summerNo Goldfish captured
v) Autumn 2008Disconnected pools, verylow flows over summer
vi) Spring 2008Disconnected pools, verylow flows over winterNo Goldfish captured

McNeil et al. 2011 Fish and EWPs in the WMLR
157
3.3.3. Old Noarlunga
3.3.3.1. Site assessment
The Old Noarlunga site encompasses the lower freshwater reaches of the river immediately above the
normal upper influence of the tidal estuary. All pools are situated at the base of the Onkaparinga
Gorge and encompassed by the National Park. The three pools were relatively deep, particularly
Pools 2 and 3, with rocky substrate and bedrock sections (Table 54). These pools had a higher
density of woody debris (snags) than other sites and riparian vegetation at all sites was dominated by
native species primarily redgum and bottlebrush. All three pools were surrounded with dense
emergent vegetation primarily Phragmites and cumbungi. With much of this reach dominated by deep
pool sections, electrofishing was conducted amongst dense Phragmites between pools as well in
shallower rifle/run sections upstream and downstream of Pool 1.
Table 54. Habitat characteristics of the three monitoring pools at Old Noarlunga in the Onkaparinga River.
Old Noarlunga Substrate size (mm) Riparian cover (%) Snags Absolute max. depth (m)
Pool 1 10+ 45 7 2.5 Pool 2 5-10+ 15 25 3.5 Pool 3 5-10+ 25 20+ 3.5
Pool 1 (Figure 126) was the shallowest of the Old Noarlunga pools (Table 55) at the hydrometric weir
located at the point at which the water pipeline crosses the river. During dry periods the pool
separated into three separate pools with the measurement weir the most downstream. The upstream
pool was the most permanent and although it never dried completely became extremely shallow in
autumn 2007 and 2008. This pool was moderately salty throughout the study period and became
hypoxic during the intervening summer. Pool 1 was not flowing in spring 2006, autumn 2007 or spring
2008 sampling trips with low flow during other times.
Macrophytes were abundant at Pool 1 with large areas of emergent Phragmites and submerged beds
of water ribbon and Potamogeton crispus, which increased in density each spring and becoming very
dense in spring 2008 covering approximately 80 % of the pool. The pool was overhung with large
redgums and some bottlebrush and was reasonably well shaded (Figure 125). Apart from flushes prior
to sampling in autumn and spring 2006, antecedent hydrology consisted of very low flows prior to all
other sampling trips.

McNeil et al. 2011 Fish and EWPs in the WMLR
158
Figure 126. Old Noarlunga Pool 1 in a) spring 2006 and b) autumn 2008.
Table 55. Water quality parameters recorded in Old Noarlunga Pool 1 during each survey.
Pool 1
Season DO (ppm)
Cond. (μS/cm)
pH Temp. (ºC)
Max. depth (m)
Macrophytes (% cover)
Hydrology Antecedent Hydrology
2006 autumn 8 2580 8 12.5 2.5 40 Low flow Flushes 2006 spring 5 1699 7 20.5 2.0 10 No flow Flushes 2007 autumn 7 3360 8 16.1 0.5 10 No flow Very low flows 2007 spring 3 2373 7 21.1 2.5 30 Low flow Very low flows 2008 autumn 4 3270 7 12.9 0.3 15 No flow Very low flows 2008 spring 2 2450 7 19.2 1.5 80 Low flow Very low flows
Pool 2 is a deep permanent freshwater pool predominantly bedrock based with cobbled substrate
towards the downstream end. The pools consists of a long deep channel approximately 2 m in depth
and 50 m long which opens into a deep pool 3.5 m in depth and surrounded by emergent macrophytes
(Figure 127). This large pool is dominated by a large redgum snag (whole tree) whilst other snags are
abundant throughout the pool length. Riparian vegetation is fairly dense with large redgums and
bottlebrush along both banks. Macrophytes mainly consisted of Phragmites which surrounded the
pool and extended into the pool especially within the shallower downstream section.
Whilst dissolved oxygen and other water quality parameters remained relatively stable throughout the
sampling period, acidic and low oxygen conditions were recorded in the final survey in spring 2008.
Salinity fluctuated considerably, becoming somewhat saline in autumn 2007 and 2008 (Table 56).

McNeil et al. 2011 Fish and EWPs in the WMLR
159
Pool depth remained fairly consistent fluctuating within a metre over the course of the study. Low flow
was detected during sampling in autumn 2006 and in spring 2007 and 2008 with no flow at other
times. Apart from flushes in 2006, antecedent flow conditions were very low.
Figure 127. Old Noarlunga Pool 2 in a) spring 2006 and b) autumn 2008.
Table 56. Water quality parameters recorded in Old Noarlunga Pool 2 during each survey.
Pool 2
Season DO (ppm)
Cond. (μS/cm)
pH Temp. (ºC)
Max. depth (m)
Macrophytes (% cover)
Hydrology Antecedent Hydrology
2006 autumn 9 2630 8 13.9 3.5 20 Low flow Flushes 2006 spring 7 1968 8 21.6 3.0 20 No flow Flushes 2007 autumn 9 11600 8 15.6 2.5 20 No flow Very low flows 2007 spring 6 2490 7 20.0 3.0 20 Low flow Very low flows 2008 autumn 8 8600 8 14.8 2.0 20 No flow Very low flows 2008 spring 4 2590 6 20.9 2.0 20 Low flow Very low flows
Pool 3 (Figure 128) is a large and deep pool surrounded by Phragmites with sparse redgum and
bottlebrush the riparian zone. This was the most environmentally variable pool within the study with
significant changes in salinity. Whilst the pool was fresh at the beginning of the study and throughout
2006, salt water intrusion due to very large tidal and storm swells lead to marine conditions in the pool
(Table 57). Small freshwater flushes during winter 2007 and 2008 freshened surface waters
temporarily, returning to marine conditions in autumn 2008.
More detailed salinity mapping, not presented here revealed that salinity was strongly stratified in this
pool and that marine conditions were permanent below 0.5 m following the autumn 2007 tidal inflow.

McNeil et al. 2011 Fish and EWPs in the WMLR
160
As a result Pool 3 underwent a shift from freshwater to marine habitat during autumn 2007. A
dissolved oxygen reading of 22 ppm in 2007 may reflect a boom in productivity following this saltwater
intrusion, whilst the following autumn experienced sever hypoxia with oxygen levels declining to levels
not sufficient for fish respiration (McNeil and Closs 2007). As with other pools at this site, zero flow
was observed during spring 2006, autumn 2007 and autumn 2008 with low flow at other sampling
times, whilst antecedent flow conditions were very low in all years except for autumn and spring 2006.
Figure 128. Old Noarlunga Pool 3 in a) spring 2006 and b) autumn 2008 and c) flowing during winter surveys (from McNeil and Fredberg 2010).
Table 57. Water quality parameters recorded in Old Noarlunga Pool 3 during each survey.
Pool 3 Season DO (ppm)
Cond. (μS/cm)
pH Temp. (ºC)
Max. depth (m)
Macrophytes (% cover)
Hydrology Antecedent Hydrology
2006 autumn 8 2830 8 12.9 3.5 10 Low flow Flushes 2006 spring 8 1850 8 21.9 3.0 10 No flow Flushes 2007 autumn 22 50000 8 18.6 2.5 10 No flow Very low flows 2007 spring 6 2930 8 20.8 3.5 10 Low flow Very low flows 2008 autumn 1 62800 6 17.0 2.0 10 No flow Very low flows 2008 spring 6 9060 6 23.5 2.0 10 Low flow Very low flows
3.3.3.2. Water Quality
Extremes in dissolved oxygen and salinity levels highlight the highly variable and frequently harsh
nature of this site, which fluctuates wildly between benign freshwater and marine conditions, a shift
which is likely to cause large fish kills and result in changes to fish assemblage structure.
Water quality management at this site is critical and freshwater in-flows may be required to maintain
freshwater habitats and prevent fish kills, particularly during large tidal and storm surges where saline
waters are pushed up into normally fresh reaches.

McNeil et al. 2011 Fish and EWPs in the WMLR
161
3.3.3.3. Hydrology
The water level at Old Noarlunga has been low during all times that surveys have been conducted,
with the survey pools disconnected on three of the five survey days, in spring 2006 and autumns of
2007 and 2008. The survey pools were connected by low flow in autumn 2006 and spring 2007.
Between the autumn 2006 and spring 2006 surveys the gauge data indicates that Old Noarlunga
received multiple moderate flushing flows in the high flow period, including a flow of over 470 ML on
July 18 and a sustained flow above 50 ML/day throughout most of August (Figure 129). However,
there was no readable flow by mid-October. This lack of flow continued to the spring 2006 surveys,
conducted on November 28, and then over summer until the autumn 2007 survey, conducted on May
16. Very low flows returned towards the end of May 2007, with a moderate flushing flow at the end of
the low flow period in early June.
There were also two moderate flushing flows at the beginning of the high flow period. However, the
flow was more typically low throughout July and the average flow was very low by mid-August. The
average flow was less than 2 ML/day from September to the time of the spring 2007 surveys
conducted on November 13. There was no readable flow from the end of November through the
summer of 2007/08 and up to the time of the autumn 2008 surveys, conducted on May 1.
At Old Noarlunga, the structure of the fish community in the most downstream estuarine pool was
distinct from the two freshwater pools at all times except during the spring 2006 surveys, prior to which
there were sustained flushing flows. Within the two freshwater pools there was no consistent change
in the structure of fish communities between seasons or among years, possibly indicating that none of
the freshwater fish at this site are being favoured as conditions became progressively drier.

McNeil et al. 2011 Fish and EWPs in the WMLR
162
Figure 129. Hydrograph for the Onkaparinga River at Old Noarlunga. Flow data (ML/day) was collected upstream of Old Noarlunga (gauge number A5031005) from May 26, 2006 (indicated by blue arrow). The timing of each survey season is also shown above the figure.
3.3.3.4. Fish community
There were three native freshwater taxa and one introduced freshwater taxa, as well as six
estuarine/marine taxa amongst the fish captured at Old Noarlunga over the six survey seasons (Figure
130). In all seasons the most common taxa encountered were common galaxias. Relatively high
numbers of flathead gudgeon and congolli were also captured in all pools across all survey seasons.
Small numbers of dwarf flathead gudgeon were captured in all pools and seasons.
Large numbers of gambusia were captured in the most upstream pool in autumn 2007 and in riffles
during electrofishing surveys in autumn 2008, but these fish have never been captured in the two
downstream survey pools. Conversely, the estuarine/marine taxa black bream, jumping mullet, tamar
goby, bridled goby and blue spot goby have all only been caught in the pool farthest downstream and
have always been relatively rare. Tamar goby (four individuals) and bridled goby (one individual) were
only captured in autumn 2007.
Jan/0
5 Ma
r/05
May/0
5 Ju
l/05
Sep/0
5 No
v/05
Jan/0
6 Ma
r/06
May/0
6 Ju
l/06
Sep/0
6 No
v/06
Jan/0
7 Ma
r/07
May/0
7 Ju
l/07
Sep/0
7 No
v/07
Jan/0
8 Ma
r/08
May/0
8 Ju
l/08
Sep/0
8 No
v/08
Jan/0
9
ML/da
y
0
100
200
300
400
500
600
700
2006
A
2006
S
2007
S
2007
A
2008
A
2008
S

McNeil et al. 2011 Fish and EWPs in the WMLR
163
3.3.3.5. Fish population
Only small numbers of dwarf flathead gudgeon were captured at Old Noarlunga during any of the
present surveys (Figure 131). During spring of both 2006 and 2007 some of these fish were captured
from the most downstream pool. High numbers of flathead gudgeon across a broad size range were
captured at Old Noarlunga during all surveys (Figure 132). These fish have been captured from both
the upstream freshwater pools and the downstream estuarine pool in all seasons, except during
autumn 2008 when none were captured from the downstream pool.
The population of common galaxias appears well established, with high numbers captured during all
surveys (Figure 133). The highest numbers of juveniles were captured during spring of 2006 and
2007, including a number of fish captured in the most downstream (estuarine) pool leading to an
increase in adults moving up into the freshwater habitats at this site.
The population of congolli appears to be well established, with a wide range of sizes captured in all
pools during each survey and regular progression of year classes throughout the survey (Figure 134).
There were small numbers of medium gambusia captured at Old Noarlunga during both autumn and
spring 2006 (Figure 135). The highest number of captures occurred in autumn 2007, but none were
captured in spring 2007 and only a small number in autumn 2008.
The estuarine species were well represented at Old Noarlunga. The highest numbers of black bream
were captured in the most downstream pool under low flow conditions during autumn 2006, but very
few individuals were captured during any subsequent surveys (Figure 136). Only a small number of
jumping mullet were captured during the present surveys, the peak occurred in autumn 2007. No
jumping mullet were recorded in autumn 2008 (Figure 137).
Small numbers of blue spot goby were captured during 2006 and 2007, and none during autumn 2008
surveys (Figure 138). One medium sized bridled goby was captured in the most downstream pool
during autumn 2007. Tamar goby catch peaked in the upstream pools during autumn 2006 (Figure
139). However, only four were captured in autumn 2007, and none of these fish have been captured
at the site during either of the spring surveys or in autumn 2008.

McNeil et al. 2011 Fish and EWPs in the WMLR
164
Figure 130. a) Abundances of freshwater taxa present in the fish communities of each pool at Old Noarlunga (Onkaparinga River) over six survey seasons, and b) Abundances of estuarine taxa present in the fish communities of each pool at Old Noarlunga (Onkaparinga River) over six survey seasons.
Autumn 06 Spring 06 Autumn 07 Spring 07 Autumn 08 Spring 08
No.
of i
ndiv
idua
ls
0
1000
2000
30005000
6000
Common Galaxias Eastern Gambusia Flathead Gudgeon Dwarf Flathead Gudgeon Congolli
Autumn 06 Spring 06 Autumn 07 Spring 07 Autumn 08 Spring 08
No.
of i
ndiv
idua
ls
0
50
250
300Tamar Goby Yellow-eye MulletBridled GobySmallmouth Hardyhead Jumping Mullet Swan River Goby Bream

McNeil et al. 2011 Fish and EWPs in the WMLR
165
Figure 131. Lengths of dwarf flathead gudgeon (P. macrostomus) at Old Noarlunga (Onkaparinga River) over six survey seasons, from autumn 2006 to spring 2008. Note, light blue bars indicate fish captured in estuarine waters. The flow at the time of the survey and major hydrological pattern since the last survey are shown for each season.
Size class (mm)
0-5
6-10
11-1
516
-20
21-2
526
-30
31-3
536
-40
41-4
546
-50
51-5
556
-60
61-6
566
-70
71-7
5
0
10
Size class (mm)
0-5
6-10
11-1
516
-20
21-2
526
-30
31-3
536
-40
41-4
546
-50
51-5
556
-60
61-6
566
-70
71-7
5
0
10
Size class (mm)
0-5
6-10
11-1
516
-20
21-2
526
-30
31-3
536
-40
41-4
546
-50
51-5
556
-60
61-6
566
-70
71-7
5
0
10
Size class (mm)
0-5
6-10
11-1
516
-20
21-2
526
-30
31-3
536
-40
41-4
546
-50
51-5
556
-60
61-6
566
-70
71-7
5
Num
ber o
f ind
ivid
uals
0
10
Size class (mm)
0-5
6-10
11-1
516
-20
21-2
526
-30
31-3
536
-40
41-4
546
-50
51-5
556
-60
61-6
566
-70
71-7
5
0
10
Size class (mm)
0-5
6-10
11-1
516
-20
21-2
526
-30
31-3
536
-40
41-4
546
-50
51-5
556
-60
61-6
566
-70
71-7
5
0
10
i) Autumn 2006Low flow, flushing flows over summerNo Dwarf FlatheadGudgeon Captured
ii) Spring 2006Disconnected pools, moderate flushing flows over winter
iv) Spring 2007Low flow, very lowflows over winter
iii) Autumn 2007Disconnected pools, very low flows over summer
v) Autumn 2008Disconnected pools, verylow flows over summer
vi) Spring 2008Disconnected pools, verylow flows over winter
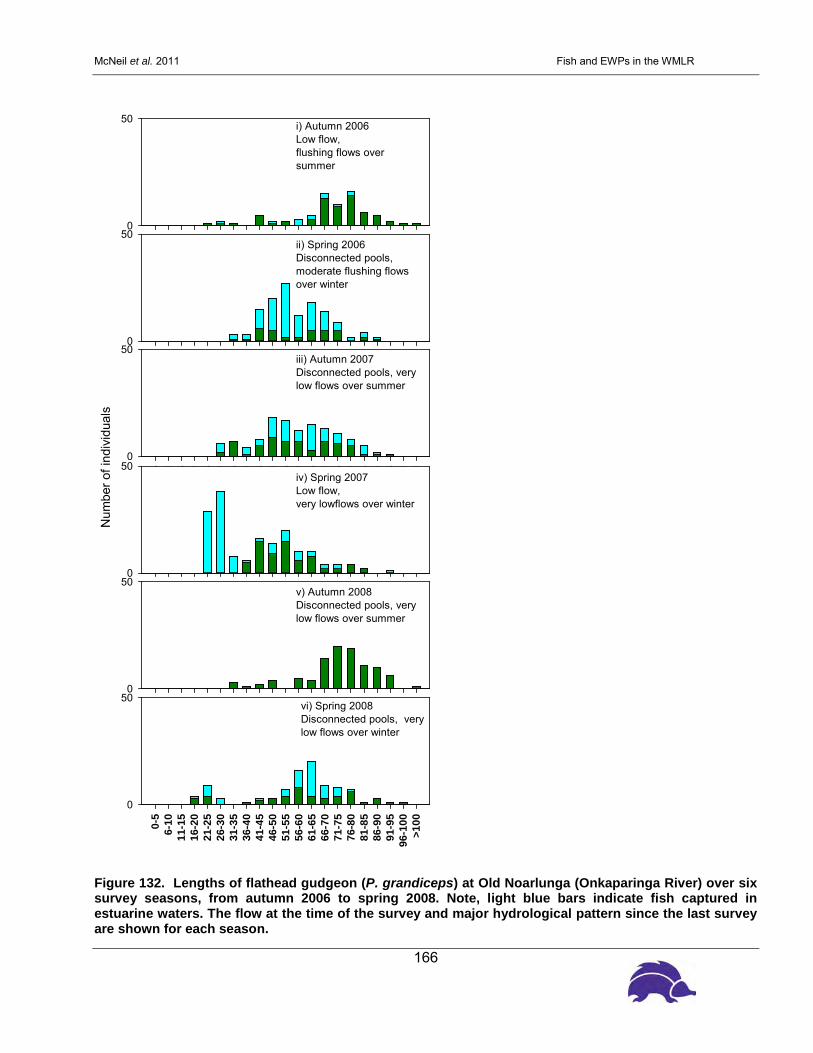
McNeil et al. 2011 Fish and EWPs in the WMLR
166
Figure 132. Lengths of flathead gudgeon (P. grandiceps) at Old Noarlunga (Onkaparinga River) over six survey seasons, from autumn 2006 to spring 2008. Note, light blue bars indicate fish captured in estuarine waters. The flow at the time of the survey and major hydrological pattern since the last survey are shown for each season.
Size class (mm)
0-5
6-10
11-1
516
-20
21-2
526
-30
31-3
536
-40
41-4
546
-50
51-5
556
-60
61-6
566
-70
71-7
576
-80
81-8
586
-90
91-9
596
-100
>100
0
50
Size class (mm)
0-5
6-10
11-1
516
-20
21-2
526
-30
31-3
536
-40
41-4
546
-50
51-5
556
-60
61-6
566
-70
71-7
576
-80
81-8
586
-90
91-9
596
-100
>100
0
50
Size class (mm)
0-5
6-10
11-1
516
-20
21-2
526
-30
31-3
536
-40
41-4
546
-50
51-5
556
-60
61-6
566
-70
71-7
576
-80
81-8
586
-90
91-9
596
-100
>100
0
50
Size class (mm)
0-5
6-10
11-1
516
-20
21-2
526
-30
31-3
536
-40
41-4
546
-50
51-5
556
-60
61-6
566
-70
71-7
576
-80
81-8
586
-90
91-9
596
-100
>100
Num
ber o
f ind
ivid
uals
0
50
Size class (mm)
0-5
6-10
11-1
516
-20
21-2
526
-30
31-3
536
-40
41-4
546
-50
51-5
556
-60
61-6
566
-70
71-7
576
-80
81-8
586
-90
91-9
596
-100
>100
0
50
0-5
6-10
11-1
516
-20
21-2
526
-30
31-3
536
-40
41-4
546
-50
51-5
556
-60
61-6
566
-70
71-7
576
-80
81-8
586
-90
91-9
596
-100
>100
0
50
i) Autumn 2006Low flow, flushing flows over summer
ii) Spring 2006Disconnected pools, moderate flushing flows over winter
iv) Spring 2007Low flow, very lowflows over winter
iii) Autumn 2007Disconnected pools, very low flows over summer
v) Autumn 2008Disconnected pools, verylow flows over summer
vi) Spring 2008Disconnected pools, verylow flows over winter

McNeil et al. 2011 Fish and EWPs in the WMLR
167
Figure 133. Lengths of common galaxias (G. maculatus) at Old Noarlunga (Onkaparinga River) over six survey seasons, from autumn 2006 to spring 2008. Note, light blue bars indicate fish captured in estuarine waters. The flow at the time of the survey and major hydrological pattern since the last survey are shown for each season.
Size class (mm)
0-10
11-2
021
-30
31-4
041
-50
51-6
061
-70
71-8
081
-90
91-1
0010
1-11
011
1-12
012
1-13
013
1-14
014
1-15
015
1-16
016
1-17
017
1-18
018
1-19
019
1-20
0
0
50
100
Size class (mm)
0-10
11-2
021
-30
31-4
041
-50
51-6
061
-70
71-8
081
-90
91-1
0010
1-11
011
1-12
012
1-13
013
1-14
014
1-15
015
1-16
016
1-17
017
1-18
018
1-19
019
1-20
0
0
50
100
Size class (mm)
0-10
11-2
021
-30
31-4
041
-50
51-6
061
-70
71-8
081
-90
91-1
0010
1-11
011
1-12
012
1-13
013
1-14
014
1-15
015
1-16
016
1-17
017
1-18
018
1-19
019
1-20
0
0
50
Size class (mm)
0-10
11-2
021
-30
31-4
041
-50
51-6
061
-70
71-8
081
-90
91-1
0010
1-11
011
1-12
012
1-13
013
1-14
014
1-15
015
1-16
016
1-17
017
1-18
018
1-19
019
1-20
0
Num
ber o
f ind
ivid
uals
0
50
100
Size class (mm)
0-10
11-2
021
-30
31-4
041
-50
51-6
061
-70
71-8
081
-90
91-1
0010
1-11
011
1-12
012
1-13
013
1-14
014
1-15
015
1-16
016
1-17
017
1-18
018
1-19
019
1-20
0
0
50
0-10
11-2
021
-30
31-4
041
-50
51-6
061
-70
71-8
081
-90
91-1
0010
1-11
011
1-12
012
1-13
013
1-14
014
1-15
015
1-16
016
1-17
017
1-18
018
1-19
019
1-20
0
0
50
100
150
200
250
i) Autumn 2006Low flow, flushing flows over summer
ii) Spring 2006Disconnected pools, moderate flushing flows over winter
iv) Spring 2007Low flow, very lowflows over winter
iii) Autumn 2007Disconnected pools, very low flows over summer
v) Autumn 2008Disconnected pools, verylow flows over summer
vi) Spring 2008Disconnected pools, verylow flows over winter

McNeil et al. 2011 Fish and EWPs in the WMLR
168
Figure 134. Lengths of gambusia (G. holbrooki) at Old Noarlunga (Onkaparinga River) over six survey seasons, from autumn 2006 to spring 2008. The flow at the time of the survey and major hydrological pattern since the last survey are shown for each season.
Size class (mm)
0-5
6-10
11-1
516
-20
21-2
526
-30
31-3
536
-40
41-4
546
-50
51-5
556
-60
61-6
566
-70
71-7
576
-80
0
50
Size class (mm)
0-5
6-10
11-1
516
-20
21-2
526
-30
31-3
536
-40
41-4
546
-50
51-5
556
-60
61-6
566
-70
71-7
576
-80
0
50
Size class (mm)
0-5
6-10
11-1
516
-20
21-2
526
-30
31-3
536
-40
41-4
546
-50
51-5
556
-60
61-6
566
-70
71-7
576
-80
0
50
Size class (mm)
0-5
6-10
11-1
516
-20
21-2
526
-30
31-3
536
-40
41-4
546
-50
51-5
556
-60
61-6
566
-70
71-7
576
-80
Num
ber o
f ind
ivid
uals
0
50
Size class (mm)
0-5
6-10
11-1
516
-20
21-2
526
-30
31-3
536
-40
41-4
546
-50
51-5
556
-60
61-6
566
-70
71-7
576
-80
0
50
0-5
6-10
11-1
516
-20
21-2
526
-30
31-3
536
-40
41-4
546
-50
51-5
556
-60
61-6
566
-70
71-7
576
-80
0
50
i) Autumn 2006Low flow, flushing flows over summer
ii) Spring 2006Disconnected pools, moderate flushing flows over winter
iv) Spring 2007Low flow, very lowflows over winter
iii) Autumn 2007Disconnected pools, very low flows over summer
v) Autumn 2008Disconnected pools, verylow flows over summer
vi) Spring 2008Disconnected pools, verylow flows over winter

McNeil et al. 2011 Fish and EWPs in the WMLR
169
Figure 135. Lengths of black bream (A. butcheri) at Old Noarlunga (Onkaparinga River) over six survey seasons, from autumn 2006 to spring 2008. Note, light blue bars indicate fish captured in estuarine waters. The flow at the time of the survey and major hydrological pattern since the last survey are shown for each season.
Size class (mm)
0-10
11-2
021
-30
31-4
041
-50
51-6
061
-70
71-8
081
-90
91-1
0010
1-11
011
1-12
012
1-13
013
1-14
014
1-15
015
1-16
016
1-17
017
1-18
018
1-19
019
1-20
020
1-21
021
1-22
022
1-23
023
1-24
024
1-25
025
1-26
026
1-27
027
1-28
028
1-29
0
0
20
Size class (mm)
0-10
11-2
021
-30
31-4
041
-50
51-6
061
-70
71-8
081
-90
91-1
0010
1-11
011
1-12
012
1-13
013
1-14
014
1-15
015
1-16
016
1-17
017
1-18
018
1-19
019
1-20
020
1-21
021
1-22
022
1-23
023
1-24
024
1-25
025
1-26
026
1-27
027
1-28
028
1-29
0
0
20
Size class (mm)
0-10
11-2
021
-30
31-4
041
-50
51-6
061
-70
71-8
081
-90
91-1
0010
1-11
011
1-12
012
1-13
013
1-14
014
1-15
015
1-16
016
1-17
017
1-18
018
1-19
019
1-20
020
1-21
021
1-22
022
1-23
023
1-24
024
1-25
025
1-26
026
1-27
027
1-28
028
1-29
0
0
20
Size class (mm)
0-10
11-2
021
-30
31-4
041
-50
51-6
061
-70
71-8
081
-90
91-1
0010
1-11
011
1-12
012
1-13
013
1-14
014
1-15
015
1-16
016
1-17
017
1-18
018
1-19
019
1-20
020
1-21
021
1-22
022
1-23
023
1-24
024
1-25
025
1-26
026
1-27
027
1-28
028
1-29
0
Num
ber o
f ind
ivid
uals
0
20
Size class (mm)
0-10
11-2
021
-30
31-4
041
-50
51-6
061
-70
71-8
081
-90
91-1
0010
1-11
011
1-12
012
1-13
013
1-14
014
1-15
015
1-16
016
1-17
017
1-18
018
1-19
019
1-20
020
1-21
021
1-22
022
1-23
023
1-24
024
1-25
025
1-26
026
1-27
027
1-28
028
1-29
0
0
20
0-10
11-2
021
-30
31-4
041
-50
51-6
061
-70
71-8
081
-90
91-1
0010
1-11
011
1-12
012
1-13
013
1-14
014
1-15
015
1-16
016
1-17
017
1-18
018
1-19
019
1-20
020
1-21
021
1-22
022
1-23
023
1-24
024
1-25
025
1-26
026
1-27
027
1-28
028
1-29
0
0
50
100
150
i) Autumn 2006Low flow, flushing flows over summer
ii) Spring 2006Disconnected pools, moderate flushing flows over winter
iv) Spring 2007Low flow, very lowflows over winter
iii) Autumn 2007Disconnected pools, very low flows over summer
v) Autumn 2008Disconnected pools, verylow flows over summer
vi) Spring 2008Disconnected pools, verylow flows over winter

McNeil et al. 2011 Fish and EWPs in the WMLR
170
Figure 136. Lengths of congolli (P. urvillii) at Old Noarlunga (Onkaparinga River) over six survey seasons, from autumn 2006 to spring 2008. Note, light blue bars indicate fish captured in estuarine waters. The flow at the time of the survey and major hydrological pattern since the last survey are shown for each season.
Size class (mm)
0-10
11-2
021
-30
31-4
041
-50
51-6
061
-70
71-8
081
-90
91-1
0010
1-11
011
1-12
012
1-13
013
1-14
014
1-15
015
1-16
016
1-17
017
1-18
018
1-19
019
1-20
020
1-21
021
1-22
022
1-23
023
1-24
024
1-25
025
1-26
026
1-27
027
1-28
028
1-29
029
1-30
030
1-31
031
1-32
0
0
50
100
Size class (mm)
0-10
11-2
021
-30
31-4
041
-50
51-6
061
-70
71-8
081
-90
91-1
0010
1-11
011
1-12
012
1-13
013
1-14
014
1-15
015
1-16
016
1-17
017
1-18
018
1-19
019
1-20
020
1-21
021
1-22
022
1-23
023
1-24
024
1-25
025
1-26
026
1-27
027
1-28
028
1-29
029
1-30
030
1-31
031
1-32
0
0
50
100
Size class (mm)
0-10
11-2
021
-30
31-4
041
-50
51-6
061
-70
71-8
081
-90
91-1
0010
1-11
011
1-12
012
1-13
013
1-14
014
1-15
015
1-16
016
1-17
017
1-18
018
1-19
019
1-20
020
1-21
021
1-22
022
1-23
023
1-24
024
1-25
025
1-26
026
1-27
027
1-28
028
1-29
029
1-30
030
1-31
031
1-32
0
0
50
Size class (mm)
0-10
11-2
021
-30
31-4
041
-50
51-6
061
-70
71-8
081
-90
91-1
0010
1-11
011
1-12
012
1-13
013
1-14
014
1-15
015
1-16
016
1-17
017
1-18
018
1-19
019
1-20
020
1-21
021
1-22
022
1-23
023
1-24
024
1-25
025
1-26
026
1-27
027
1-28
028
1-29
029
1-30
030
1-31
031
1-32
0
Num
ber o
f ind
ivid
uals
0
50
100
150
Size class (mm)
0-10
11-2
021
-30
31-4
041
-50
51-6
061
-70
71-8
081
-90
91-1
0010
1-11
011
1-12
012
1-13
013
1-14
014
1-15
015
1-16
016
1-17
017
1-18
018
1-19
019
1-20
020
1-21
021
1-22
022
1-23
023
1-24
024
1-25
025
1-26
026
1-27
027
1-28
028
1-29
029
1-30
030
1-31
031
1-32
0
0
50
0-10
11-2
021
-30
31-4
041
-50
51-6
061
-70
71-8
081
-90
91-1
0010
1-11
011
1-12
012
1-13
013
1-14
014
1-15
015
1-16
016
1-17
017
1-18
018
1-19
019
1-20
020
1-21
021
1-22
022
1-23
023
1-24
024
1-25
025
1-26
026
1-27
027
1-28
028
1-29
029
1-30
030
1-31
031
1-32
0
0
50
100
150
i) Autumn 2006Low flow, flushing flows over summer
ii) Spring 2006Disconnected pools, moderate flushing flows over winter
iv) Spring 2007Low flow, very lowflows over winter
iii) Autumn 2007Disconnected pools, very low flows over summer
v) Autumn 2008Disconnected pools, verylow flows over summer
vi) Spring 2008Disconnected pools, verylow flows over winter

McNeil et al. 2011 Fish and EWPs in the WMLR
171
Figure 137. Lengths of jumping mullet (L. argentea) at Old Noarlunga (Onkaparinga River) over six survey seasons, from autumn 2006 to spring 2008. Note, light blue bars indicate fish captured in estuarine waters. The flow at the time of the survey and major hydrological pattern since the last survey are shown for each season.
Size class (mm)
0-10
11-2
021
-30
31-4
041
-50
51-6
061
-70
71-8
081
-90
91-1
0010
1-11
011
1-12
012
1-13
013
1-14
014
1-15
015
1-16
016
1-17
017
1-18
018
1-19
019
1-20
020
1-21
021
1-22
022
1-23
023
1-24
024
1-25
025
1-26
026
1-27
027
1-28
028
1-29
029
1-30
030
1-31
031
1-32
0
0
10
Size class (mm)
0-10
11-2
021
-30
31-4
041
-50
51-6
061
-70
71-8
081
-90
91-1
0010
1-11
011
1-12
012
1-13
013
1-14
014
1-15
015
1-16
016
1-17
017
1-18
018
1-19
019
1-20
020
1-21
021
1-22
022
1-23
023
1-24
024
1-25
025
1-26
026
1-27
027
1-28
028
1-29
029
1-30
030
1-31
031
1-32
0
0
10
Size class (mm)
0-10
11-2
021
-30
31-4
041
-50
51-6
061
-70
71-8
081
-90
91-1
0010
1-11
011
1-12
012
1-13
013
1-14
014
1-15
015
1-16
016
1-17
017
1-18
018
1-19
019
1-20
020
1-21
021
1-22
022
1-23
023
1-24
024
1-25
025
1-26
026
1-27
027
1-28
028
1-29
029
1-30
030
1-31
031
1-32
0
0
10
Size class (mm)
0-10
11-2
021
-30
31-4
041
-50
51-6
061
-70
71-8
081
-90
91-1
0010
1-11
011
1-12
012
1-13
013
1-14
014
1-15
015
1-16
016
1-17
017
1-18
018
1-19
019
1-20
020
1-21
021
1-22
022
1-23
023
1-24
024
1-25
025
1-26
026
1-27
027
1-28
028
1-29
029
1-30
030
1-31
031
1-32
0
Num
ber o
f ind
ivid
uals
0
10
Size class (mm)
0-10
11-2
021
-30
31-4
041
-50
51-6
061
-70
71-8
081
-90
91-1
0010
1-11
011
1-12
012
1-13
013
1-14
014
1-15
015
1-16
016
1-17
017
1-18
018
1-19
019
1-20
020
1-21
021
1-22
022
1-23
023
1-24
024
1-25
025
1-26
026
1-27
027
1-28
028
1-29
029
1-30
030
1-31
031
1-32
0
0
10
0-10
11-2
021
-30
31-4
041
-50
51-6
061
-70
71-8
081
-90
91-1
0010
1-11
011
1-12
012
1-13
013
1-14
014
1-15
015
1-16
016
1-17
017
1-18
018
1-19
019
1-20
020
1-21
021
1-22
022
1-23
023
1-24
024
1-25
025
1-26
026
1-27
027
1-28
028
1-29
029
1-30
030
1-31
031
1-32
0
0
10
i) Autumn 2006Low flow, flushing flows over summer
ii) Spring 2006Disconnected pools, moderate flushing flows over winterNo Jumping Mullet Captured
iv) Spring 2007Low flow, very lowflows over winter
iii) Autumn 2007Disconnected pools, very low flows over summer
v) Autumn 2008Disconnected pools, verylow flows over summerNo Jumping Mullet Captured
vi) Spring 2008Disconnected pools, verylow flows over winter

McNeil et al. 2011 Fish and EWPs in the WMLR
172
Figure 138. Lengths of blue spot goby (P. olorum) at Old Noarlunga (Onkaparinga River) over six survey seasons, from autumn 2006 to spring 2008. Note, light blue bars indicate fish captured in estuarine waters. The flow at the time of the survey and major hydrological pattern since the last survey are shown for each season.
Size class (mm)
0-5
6-10
11-1
516
-20
21-2
526
-30
31-3
536
-40
41-4
546
-50
51-5
556
-60
61-6
566
-70
71-7
576
-80
81-8
586
-90
91-9
596
-100
>100
0
10
Size class (mm)
0-5
6-10
11-1
516
-20
21-2
526
-30
31-3
536
-40
41-4
546
-50
51-5
556
-60
61-6
566
-70
71-7
576
-80
81-8
586
-90
91-9
596
-100
>100
0
10
Size class (mm)
0-5
6-10
11-1
516
-20
21-2
526
-30
31-3
536
-40
41-4
546
-50
51-5
556
-60
61-6
566
-70
71-7
576
-80
81-8
586
-90
91-9
596
-100
>100
0
10
Size class (mm)
0-5
6-10
11-1
516
-20
21-2
526
-30
31-3
536
-40
41-4
546
-50
51-5
556
-60
61-6
566
-70
71-7
576
-80
81-8
586
-90
91-9
596
-100
>100
Num
ber o
f ind
ivid
uals
0
10
Size class (mm)
0-5
6-10
11-1
516
-20
21-2
526
-30
31-3
536
-40
41-4
546
-50
51-5
556
-60
61-6
566
-70
71-7
576
-80
81-8
586
-90
91-9
596
-100
>100
0
10
0-5
6-10
11-1
516
-20
21-2
526
-30
31-3
536
-40
41-4
546
-50
51-5
556
-60
61-6
566
-70
71-7
576
-80
81-8
586
-90
91-9
596
-100
>100
0
10
i) Autumn 2006Low flow, flushing flows over summer
ii) Spring 2006Disconnected pools, moderate flushing flows over winter
iv) Spring 2007Low flow, very lowflows over winter
iii) Autumn 2007Disconnected pools, very low flows over summer
v) Autumn 2008Disconnected pools, verylow flows over summerNo Bluespot Goby Captured
vi) Spring 2008Disconnected pools, verylow flows over winter

McNeil et al. 2011 Fish and EWPs in the WMLR
173
Figure 139. Lengths of Tamar goby (A. tamarensis) at Old Noarlunga (Onkaparinga River) over six survey seasons, from autumn 2006 to spring 2008. The flow at the time of the survey and major hydrological pattern since the last survey are shown for each season.
Size class (mm)
0-5
6-10
11-1
516
-20
21-2
526
-30
31-3
536
-40
41-4
546
-50
51-5
556
-60
61-6
566
-70
71-7
576
-80
81-8
586
-90
91-9
596
-100
>100
0
50
Size class (mm)
0-5
6-10
11-1
516
-20
21-2
526
-30
31-3
536
-40
41-4
546
-50
51-5
556
-60
61-6
566
-70
71-7
576
-80
81-8
586
-90
91-9
596
-100
>100
0
50
Size class (mm)
0-5
6-10
11-1
516
-20
21-2
526
-30
31-3
536
-40
41-4
546
-50
51-5
556
-60
61-6
566
-70
71-7
576
-80
81-8
586
-90
91-9
596
-100
>100
0
50
Size class (mm)
0-5
6-10
11-1
516
-20
21-2
526
-30
31-3
536
-40
41-4
546
-50
51-5
556
-60
61-6
566
-70
71-7
576
-80
81-8
586
-90
91-9
596
-100
>100
Num
ber o
f ind
ivid
uals
0
50
Size class (mm)
0-5
6-10
11-1
516
-20
21-2
526
-30
31-3
536
-40
41-4
546
-50
51-5
556
-60
61-6
566
-70
71-7
576
-80
81-8
586
-90
91-9
596
-100
>100
0
50
0-5
6-10
11-1
516
-20
21-2
526
-30
31-3
536
-40
41-4
546
-50
51-5
556
-60
61-6
566
-70
71-7
576
-80
81-8
586
-90
91-9
596
-100
>100
0
50
i) Autumn 2006Low flow, flushing flows over summer
ii) Spring 2006Disconnected pools, moderate flushing flows over winterNo Tamar Goby Captured
iv) Spring 2007Low flow, very lowflows over winterNo Tamar Goby Captured
iii) Autumn 2007Disconnected pools, very low flows over summer
v) Autumn 2008Disconnected pools, verylow flows over summerNo Tamar Goby Captured
vi) Spring 2008Disconnected pools, verylow flows over winterNo Tamar Goby Captured

McNeil et al. 2011 Fish and EWPs in the WMLR
174
4. DISCUSSION
4.1. Baseline Assessment of Fish Populations in the WMLR
Sampling under the current survey caught all native and introduced fish species previously recorded
as common in the WMLR with the exception of the southern purple-spotted gudgeon. This species
was once considered locally common in the WMLR (Scott 1962) but appears to now be extinct from
the region. The local extinction of this species over the past 50 years reflects the extreme degree of
modification that anthropogenic development has had on the ecology of WMLR catchments and
reiterates the urgency for implementing management changes that protect and revive the extant native
fishes in the region. It is unclear why this species has suffered such a devastating loss to distribution
and abundance over the past fifty years, although a combination of flow regime changes, loss of
instream and riparian vegetation, destruction and drainage of wetlands, pollutants and the introduction
of redfin perch have all been identified as likely contributors (Hammer et al. 2010, Lintermans 2007).
This species would formally have been the largest piscivorous predator in the WMLR, and their
replacement by trout and redfin perch over the period of their decline suggests they are likely
contributors to extinction in the region.
A number of new species were identified that were previously not recorded from the WMLR and/or SA
Gulf Drainage Division and are summarised in Table 58. Short-finned eel was discovered for the first
time in the Onkaparinga and Torrens Rivers, although only single specimens were recorded from
each. Bony herring, a widespread and common fish throughout inland Australia was recorded for the
first time in the upper Torrens. Whilst the discovery of short-finned eel potentially reflects very rare
far-western populations of this species (it could also be a Murray River or aquarium translocation), the
appearance of bony herring can only suggest transfer into the drainage through human dispersal
(either directly or via Murray water pipeline) or perhaps a very rare transfer via some vector such as
pelicans or ducks that may carry such a fish across the MLR from the Murray River. In addition, a
number of diadromous and euryhaline species not collected for extended periods were re-discovered
during these surveys, particularly in the lower Torrens. Blue spot goby, congolli, short-headed lamprey
and common galaxias (Galaxias maculatus) were all historically abundant (Scott 1962), but were not
found in recent surveys of the lower Torrens (Rowntree and Hammer 2004, Gray et al. 2005, Hicks
and McEvoy 2005). These discoveries are likely to be due to the relatively recent installation of the
Torrens Fishway by the Torrens Catchment Water Management Board, which has improved

McNeil et al. 2011 Fish and EWPs in the WMLR
175
hydrological connectivity and fish passage between the Breakout Creek and Gulf St Vincent (McNeil et
al. 2009).
4.1.1. Idealised pre-European fish communities
The assemblage structure of EWP reaches varied considerably across sites, although historically, it
would be expected that all matching reaches would have possessed extremely similar fish fauna
based on the similar size and structure of natural habitat and flow characteristics. A generalized pre-
European fish community in the WMLR may have appeared something like this:
Coastal wetlands and estuary: Periodically populations of freshwater species especially congolli,
common and climbing galaxias would move into these areas to spawn or to gather prior to migration
back into freshwater habitats. Adult lampreys would aggregate en masse in late winter to spring
before moving into freshwater reaches to spawn. Estuarine species including black bream, jumping
and yellow-eyed mullet, mulloway, hardyhead and a range of gobies, all of which would move into and
out of fresh and saline habitats at various times or for various life history stages.
Lowland river: Dominated by congolli, common galaxias, blue spot goby and purple spotted gudgeon
(flathead gudgeon were considered rare prior to the 1960’s - Scott 1961). Fish would have attained
large sizes for their species and migrating fish from both up-and downstream would periodically move
through these reaches. Most species would regularly move laterally into inundated floodplain habitats
during winter/spring floods, and species such as purple spotted gudgeon may have remained in
billabongs and wetlands. Lamprey may regularly spawn and young ammocoetes develop in silt or
gravel areas with relatively low flow (Quintella et al. 2003). Eels may sporadically move in based on
coastal currents and reside for many years representing the apex piscivore in the system. Climbing
galaxias would be found in deeper pools with mountain galaxias extending downstream in localised
riffle habitat, especially near tributary junctions.
High velocity gorge reaches: Dominated by climbing, mountain and common galaxias, these fish
would have grown much bigger and had far greater population size and resilience than they do now,
utilizing resources and habitats now overtaken by trout and redfin perch. Regular flushing flows would
have been a regular occurrence used to access coastal spawning areas during autumn and winter and
to facilitate recruitment migrations from the sea during spring.
Upper catchment: Climbing galaxias (diadromous fish that easily scale steep and high velocity
reaches) and mountain galaxias would have dominated these reaches with larger adults living in the

McNeil et al. 2011 Fish and EWPs in the WMLR
176
Table 58. Summary of new, missing and exotic fish species as well as identification of recruitment patterns and key species for management attention across EWP Sites.
Site New Species Missing Species Key Species for Management Recruitment Exotic Species
Sou
th P
ara
New species recorded above woodlands weir (congolli, common galaxias) were translocated to the site and not naturally established populations.
All native fishes except for the common flathead gudgeon failed to have viable populations in this reach.
Mountain galaxias were only found in a tributary creek and appear unable to colonise the main channel habitats probably due to redfin perch.
Recruitment of flathead gudgeon and introduced gambusia and redfin perch were observed.
This reach was dominated by redfin perch and gambusia. Goldfish and tench also present below woodlands weir.
Torre
ns (U
pper
)
Bony herring were identified for the first time in the SAG drainage below Gumeracha Weir. This discovery reiterates concerns about the potential for translocation of Murray-Darling species via cross catchment water transfers.
Purple-spotted gudgeon appear extinct. River blackfish populations not found.
Climbing galaxias moved into riffle areas during higher flows but were unable to remain in main channel pools during dry periods probably due to redfin perch and trout predation. Galaxias olidus persisted in low numbers in refuge pools but declined under low flows.
Seasonal recruitment was observed for most species, but declined over the drought period.
Redfin perch and trout and gambusia were common. Possible translocated species include bony herring and dwarf flathead gudgeon.
Torre
ns (L
ower
)
Short-finned eel were caught for the first time from the Torrens. Diadromous fishes re-established in breakout creek following the construction of the fishway. Congolli, blue-spot goby, common galaxias and shorthead lamprey identified from lower reaches after absence in recent surveys.
Purple-spotted gudgeon appear extinct. River blackfish populations not found. Pouched lamprey not identified during this study (although observed to be present in related surveys).
Diadromous species are critical for management in the Lower Torrens, especially common galaxias, congolli, lamprey, eels and blue spot goby. The lack of climbing galaxias and scarcity of lamprey and eels suggests that diadromous species are still suffering in this reach despite the construction of Breakout Creek fishway.
Seasonal recruitment was observed for most species, less decline over the drought period. Strong recruitment by freshwater catfish, flathead gudgeon, congolli and common carp. No recruitment recorded for eel.
Carp are abundant in lower reaches as were goldfish. Gambusia abundant throughout and trout particularly abundant upstream of the Adelaide Plains. Several translocated native species dominate the lower reaches, especially freshwater catfish, Murray rainbowfish and carp gudgeon, all introduced from the Murray-Darling Basin.
Onk
apar
inga
Short-finned eel caught in the Onkaparinga for the first time.
Purple-spotted gudgeon appear extinct. Lamprey species not recorded, climbing galaxias extremely rare.
Common galaxias in particular, was impacted during low flows and were not able to migrate into upstream parts of the reach. Climbing galaxias are conspicuously rare, supporting the failure of flows and/or connectivity to suitable adult habitats to facilitate viable populations of diadromous species in the lower Onkaparinga. Estuarine species also utilised freshwater habitats and are important species for management.
Seasonal recruitment was observed for most species, but declined over the drought period.
Tench, carp, goldfish and redfin perch all present in relatively low abundances. This reach has the lowest exotic fish impact of all sites.
McNeil et al. 2011 Fish and EWPs in the WMLR
177
main channel and smaller individuals in tributary streams. Freedom of movement between the main
channel and tributaries would be common with regular connectivity during rain induced flow events.
Against this idealized model, the high degree of catchment modification appears to have lead to
modified fish assemblages with greatly reduced abundances based on the current survey. In the
South Para River EWP reach, only the hardy generalist flathead gudgeon remains of this fauna
although it is known that diadromous species still attempt to recolonise during flows and upland fishes
remain in low numbers in upper tributaries, landlocked by large reservoirs. The Torrens is highly
segmented longitudinally, with different reaches exposed to extremely different flow regimes, habitat
modifications, and abundant introduced and translocated predators and competitors. Although many
of the native fishes survive in low abundance in some patches, connectivity and conditions are
insufficient to maintain viable widespread populations throughout their theoretical historical ranges. In
particular, abundance and distribution of galaxiid populations are spatially and temporally
heterogeneous.
Diadromy was until recently almost non-existent in the Torrens and is still restricted to the reach
downstream of the city weir. Landlocked populations are considered at a great disadvantage to
diadromous populations with smaller size and parasitic infections impacting landlocked galaxiid
populations (Pollard 1974, Chapman et 2006), and added risks associated with low genetic population
size. The presence of predators in almost all large pools means that galaxiids are restricted to sub-
optimal habitats such as tributaries and attain relatively small sizes (Smith and Hammer 2005). The
populations of native fish in the Onkaparinga initially appeared most intact, with diadromous fishes
extending the length of the reach with access to the sea and existing populations of mountain and
climbing galaxias remaining despite the presence of exotic predators high in the reach. However, the
lack of flows throughout the study period rapidly led to declines in diadromous fish distribution and
abundance and caused a decline in the abundance of flathead gudgeon, dwarf flathead gudgeon and
mountain galaxias.
Overall, highly resilient and abundant native fish populations, consistent with the idealized model of
sustainable fish populations outlined above, were not present in any EWP Reach. The various
impacts of threats such as barriers, introduced species and habitat and flow regime change will be
further explored on a reach by reach basis in the following section.
Finally, this survey has provided important new information relating to the composition of the fish
fauna in the WMLR, despite the restricted focus of sampling on the four EWP Reaches (summarised
in Tables 58, 59 and 60). The data demonstrates the benefit of regular sampling to support
management of freshwater fish populations and ecosystems, however, it should be recognized that

McNeil et al. 2011 Fish and EWPs in the WMLR
178
more spatially comprehensive surveys would provide additional benefit, by informing over a much
broader range of habitat types that are likely to possess discrete fish assemblages and may harbor
cryptic, as yet undiscovered or indeed ‘presumed extinct’ fish species. Regular, broad spatial surveys
should be considered to support the development of accurate and realistic water resource and flow
allocations for sustaining native fish biodiversity and ecological sustainability in the WMLR.
4.2. Physical Habitat at EWP Sites
Care was taken during the initial site selection for EWP trials to select reaches with similar, and
relatively intact physical habitat characteristics. All sites possessed cobbled substrates with bedrock
and some alluvial sediment. Siltation was principally an issue for sites in the Torrens river, with turbid
Murray River water inputs a likely source of silt deposits. Silt deposits are likely to prove an ecological
issue through the loss of interstitial spaces in the upper Torrens, but in the lower Torrens formed more
significant deposits that dominated substrates below Gorge Weir, commensurate with lower flow
velocities and lower hydraulic energies.
Riparian vegetation was commonly dominated by redgums which were mostly patchy and
interspersed with native wattle, bottlebrush and ti-trees, that were spatially restricted to the bank-side.
Riparian vegetation was almost never well connected to catchment vegetation, an issue likely to
impact on invertebrate population structure and, therefore, ecological and food web structure, that
support native fish sustainability (Peterson et al. 2004). None of the habitats had large accumulations
of woody debris although larger snags were present in some of the bigger pools.
Local land use included forestry (Pinus radiata) in the upper Torrens, state management Recreational
Parks (Parra Wirra, South Para Weir, Brooks Rd, Old Noarlunga), council parks (Clarendon, Breakout
Creek) and private agricultural land uses (Nolan’s, Woodlands weir and sections of other sites). Most
reaches possessed well structured rocky riffles between target pools which provided areas for
electrofishing when inundated. Some adjoining reaches however, were highly choked with emergent
macrophytes and/or through the encroachment of weeds. In particular riffle areas at Clarendon,
Brooks Rd and Old Noarlunga (Onkaparinga); and Gorge Weir and Silke’s Rd (Torrens) were largely
choked by cumbungi, Phragmites or amphibious weeds.
A few reaches had excellent riffle habitat present when flowing, in particular Cuddly Creek, sections of
Brooks Rd and Old Noarlunga, and Parra Wirra, where native riparian and overhanging vegetation
and rocky riffle habitats were present. Whilst land use, habitat and fish populations are likely to be
closely linked, this analysis was not a part of the present study, although data collected here may be
used to assess such linkages. Emergent macrophytes were common to some degree at all sites but

McNeil et al. 2011 Fish and EWPs in the WMLR
179
were less prevalent at Brooks Rd, Parra Wirra, South Para sites. In general, the pools across all sites
were in relatively intact condition compared to the broader catchment areas and were considered
similar enough in regard to physical structure and habitat that ecological responses to EWPs may be
identified. Across sites, however, a range of threats were identified that may complicate assessment
of flow responses.
It is recommended that these non-water regime related threats be considered for intervention works to
further maximize the power of sites to inform on EWP trial outcomes.
Site based summaries of physical habitat issues, threats, key management concerns and other key
monitoring outcomes such as the presence of recruitment and identified flow regime issues that are of
relevance to site management are included in Table 59.
4.3. Flow Regime at EWP Sites
Flow regimes differed across EWP sites and will be discussed in detail relating to native fish ecology
in subsequent sections. As a brief overview, all sites had a highly regulated flow regime and outside
of broad ‘unmanageable’ flow events were largely dependent on localized rainfall run-off and inflows
from small tributary or gully inputs. The key exception was the reach downstream of Gumeracha weir,
which was subject to highly variable flows resulting from inter-catchment transfer flows managed for
Adelaide’s urban water use.
In addition, two sites received flows from tributary streams that contributed a reasonable proportion of
(and sometimes exceeding) main channel flows. These were Old Noarlunga (receiving significant
inflows from Kangarilla Creek between Brooks Rd and Old Noarlunga) and Nolan’s, which received
inflows from Tenafeate Creek directly into the downstream end of Pool 3 (and therefore not
contributing to site flow levels). All sites suffered extensively from extreme drought conditions which
served to highlight the lack of upper catchment inflows and allowed the current surveys to identify the
most critical impacts of flow regulation. In turn this provided an opportunity to judge some of the worst
impacts and issues presented through regulation and therefore identify opportunities to better develop
environmental flow components that may alleviate the extreme impacts of drought in highly regulated
river systems. The provision of managed flows was identified as being a critical component of drought
response management. The provision of environmental flows into these reaches should therefore be
integrated into drought response plans, rather than being suspended as was the case during the
current surveys.

McNeil et al. 2011 Fish and EWPs in the WMLR
180
Table 59. Summary points for EWP sites regarding Habitat and flow characteristics/issues, key threats to native fish and fish habitat and principal issues requiring natural resource management attention.
Site Habitat Flow Threats Key Issues Specific Management Concerns
Sou
th P
ara
Structural habitat is reasonably intact although riparian vegetation restoration would greatly improve habitat structure
Flows are highly restricted to local rainfall events and very high floods. High flows may be critical in restricting gambusia from upper reaches of the gorge, but appear to re-seed the reach with large numbers of redfin perch carried over the weir from upstream reaches.
Exotic species competition and predation. Loss of flow regime and flow volumes for maintaining habitats.
Depauperate native fish fauna
Dominant pest fauna
Fish Passage –sea & upstream
Extremely low flow inputs
Loss of natural flow regime to diversions. Barriers to migration prevent establishment of diadromous species (galaxias, lamprey, congolli, blue spot goby). Exotic predation levels are very high. Stock and land use impacts reduce the habitat quality.
Torre
ns (U
pper
)
In channel habitats are of high quality
Flows are erratic and based on water transfer requirements. Present regime is inadequate for sustaining a diversity of viable populations of native fishes.
Alterations to flow regime through water management. Transfer of Murray River water and aquatic biota via cross catchment water transfers. Exotic predators redfin perch and trout. Reduced riparian and catchment revegetation reduces habitat quality. Sedimentation and turbidity due to Murray transfers impact on water quality, substrate complexity and refuge pool maintenance.
Erratic flow regime.
Dominance of main-channel habitats by trout and redfin perch.
Loss of riffle habitats
Turbid Murray water deposits sediments throughout this section, introduces new biota from the Murray system and is delivered through un-seasonal flow pulses. Addressing the nature of these slow transfers is the principal concern specific to this reach.
Torre
ns (L
ower
)
Very highly modified through urbanisation, channelization, vegetation clearance and modification and encroachment of reeds. Highly sedimented substrates are prevalent in lower reaches.
Flows are driven by rainfall events, especially through stormwater run-off. Natural flow regimes are not present. Stable flow condition likely to support exotics such as gambusia and carp.
Urbanisation, Vegetation clearance, pollution, sedimentation, barriers to fish movement, loss of flow regime, water quality impacts, exotic species.
Urban impacts including loss of riparian vegetation
Stable flow regime supporting gambusia
Fish Passage (to seas and upstream)
Loss of flow regime (medium flows especially).
Habitat restoration is urgently required including riparian and instream restoration. Removal of barriers required to restore diadromous populations from Breakout Creek. Protection of flow inputs under storm water harvesting programs, particularly key flow aspects that support fish life history requirements. Restoration of ecosystem processes, wetlands and estuarine habitats lost through urban development. Restoration of coastal wetlands and swamp habitats that provide nurseries for freshwater and marine fishes.
Onk
apar
inga
Habitat structure relatively good. Riparian restoration and weed removal programs will enhance structural habitat complexity and bolster ecosystem processes. Catchment re-vegetation using perennial species will improve rainfall runoff and flow structure, and increase flow duration from local rainfall events.
Largely from local rainfall events in the reach, higher below the confluence of Kangarilla creek at Bakers Gully. Insufficient durations and volumes of flow for fish movement requirements throughout the reach observed
Weed encroachment, catchment land-use and runoff patterns. Water abstraction for viticultural uses. Loss of flow volumes and regime due to flow regulation. Sea-water incursions accompanied by low freshwater flows caused fish kills in lower reaches.
Hydrological connectivity to allow fish movements
Loss of spring and late autumn flows to facilitate fish migration and sustain refuge pools through summer
Loss of catchment and riparian vegetation and encroachment of weeds.
Flow restoration vital to optimise the sustainability of native fishes and allow diadromous fish movements. Integration of freshwater, estuarine and marine ecological management is important as this represents the largest natural lowland river-estuary system remaining for mainland SA.

McNeil et al. 2011 Fish and EWPs in the WMLR
181
4.4. Fish Ecology of EWP Reaches – South Para
4.4.1. Sustainability of Native Fish in the South Para River
In the South Para catchment, only four native fish species were captured over the course of the survey
period, representing three less than previously listed for the catchment based on recent reliable
records (see Table 1). Importantly, these three species, pouched and short-headed lamprey and
climbing galaxias, are all diadromous species suggesting that the reason for their absence may be
due to downstream barriers to migration, rather than flow regime inadequacies alone. Additionally,
catches of other diadromous species (common galaxias and congolli) in the South Para were linked to
human translocation of these species from below Gawler Weir and that these species would otherwise
also be absent from this reach.
Furthermore, no recruitment was observed for either species during the project suggesting that
connectivity to the sea is insufficient in this reach to support diadromous fish populations. Similarly,
assumed land-locked populations of climbing galaxias are known to be present upstream of the South
Para Reservoir (Waterwatch 2010) and the failure for this species to establish in the EWP reach is
likely to be due to a combination of altered flow regime, presence of redfin perch predation as well as
barriers to migration.
It is therefore a recommendation of this report, that barriers to fish migration be assessed and
removed where possible or bypassed by fishways to allow the movement of these species between
the trial reach and the marine environment.
If sufficient stocks of these species remain in the reach to reignite recruitment, then diadromous
species may be re-established in the South Para River. Subsequent EWPs should be tailored to
account for the water requirements of these species in the future.
Also of concern was the disappearance of mountain galaxias from Tenafeate Creek (Nolan’s
electrofishing site) after the first survey in autumn 2006 after, when it became dry due to a new
instream dam. As a result, only one out of the seven native fish species previously recorded (flathead
gudgeon) remained in the reach by the end of the study. Flathead gudgeon were common and
widespread at the start of the survey period, but declined in abundance over the three years. The loss
and decline of native fish species was accompanied by net decreases in flow, loss of large flows and
loss of spring flows to provide suitable conditions for reproduction and recruitment, as well as the
ongoing barriers to movement of diadromous fish which were exacerbated by decreased flow.

McNeil et al. 2011 Fish and EWPs in the WMLR
182
The loss of over 85% of native fish biodiversity and a decline in the abundance of the remaining
species raises concern over the current management of this reach.
It is recommended that in addition to delivery of planned EWPs, management attention be given to
key threats including barriers to migration, introduced predators (redfin perch), and flow regime and
habitat changes resulting from abstraction from private dams in Tenafeate Creek.
There were five introduced fish species captured in the South Para River identical to those reported in
past surveys, indicating no recent loss or gain of exotics in the reach. Of concern is the high numbers
of redfin perch, which is a veracious predator of smaller native fishes (Wilson et al. 2008). In contrast
to the decline of native species, gambusia became more abundant but not more widespread, while the
redfin perch population remained stable with consistent recruitment and adult survival. Increased
abundance and diversity of native fish and restoration of natural flow regime are likely to disadvantage
gambusia populations (Costelloe et al. 2010) and therefore, management recommendation made for
this reach are likely to lead to natural controls to this pest population. Restoration of flow will also open
up habitat with greater complexity, providing protection from predators and spawning sites for many
native species.
4.4.2. Flow Regime and Ecology of Fish in the South Para River
The loss and decline of native fish species in the South Para revealed through this survey is likely to
be related to several aspects of flow regime and management. During the study period there was a
net decrease in flow volume, loss of large flows and spring flows, leading to suitable conditions for
reproduction and recruitment. Barriers to the movement of diadromous fish were also exacerbated by
decreased flow. Decreased duration of flow led to longer periods of drying resulting in habitat loss and
increased interaction with introduced predators and competitors, such as redfin perch and gambusia.
In the South Para catchment the ecological objectives of EWPs are listed below together with
comments relating to this survey.
1. Connect in instream pools to increase aquatic habitat diversity and improve water quality.
Pre-flow data collected in the South Para was largely collected during a period of extremely low flow,
following a very large flushing flow in November 2005. Under these low flow conditions, fish survived
the dry season in isolated refuge pools, with reconnecting flows occurring each winter/spring. The flow
conditions in the South Para reflect those of arid environment streams where survival in refugia, and
subsequent re-colonisation and population building occurring during brief periods of reconnectivity and
habitat inundation (McNeil and Schmarr 2009). However, survival under this harsh climatic driven

McNeil et al. 2011 Fish and EWPs in the WMLR
183
regime requires excellent levels of physiological resistance to drought and flash flooding and traits that
drive rapid resilience following the flood and drought disturbance (McNeil et al. 2011b). The result
was that the upper reach was entirely dominated by redfin perch and flathead gudgeon, with gambusia
restricted to the area below Para Wirra Gorge where flood velocities would have been somewhat
lower as gambusia are not well adapted to high flow velocities (Costelloe et al. 2010). Other more
sensitive native species were excluded from the reach under such harsh conditions.
A related study was undertaken to further explore the dynamics of the fish population and climatic
drivers within the EWP reach of the South Para. The study revealed that climatic harshness
eliminated redfin perch from refuge waterholes during harsh summer conditions, allowing the highly
tolerant flathead gudgeon to persist without predation (Wilson et al. 2008).
In combination, these results indicate that the addition of connecting flows to maintain pool habitat and
water quality over low flow months may pose two significant risks to native fish sustainability. Firstly,
improved water quality during summer is likely to promote the survival and persistence of redfin perch,
increasing predation pressure on natives. Secondly, increased connectivity with relatively low flows
during summer will allow the recolonisation of upper reaches by gambusia which will in turn add
competitive pressure for resources.
It is therefore recommended that flow allocations (summer/low flows) to the South Para River be
reconsidered to avoid these impacts and be designed to maximize seasonal flow cues for spawning
and migration of native fishes. Also, attention should be given to associated management issues such
as migratory barriers and management of pest redfin perch to optimize the outcomes of EWPs for
native fish sustainability. In addition, the diverse diet of redfin perch was found to ease predation
pressure on native fish and therefore management interventions that maximize invertebrate
biodiversity and abundances will also relieve impacts of introduced predators on native fish.
2. Restore components of natural seasonality including high flow flushing events.
Summer base flows pose potential risks to native fish as explained above, however, the delivery of
EWPs that provide connectivity and spawning cues and habitat in late autumn-late spring will provide
important support for the restoration of native fish biodiversity in the reach, especially if mountain
galaxias are able to recolonise through tributary stream. If downstream barriers are removed, then
diadromous fish populations could also re-establish and be maintained in the lower South Para under
the improved flow regime.
The last high flow flushing event in South Para River was prior to the surveys in November 2005.
During the subsequent surveys there were no high flows and most seasonal flow was intercepted by

McNeil et al. 2011 Fish and EWPs in the WMLR
184
the reservoirs upstream. In comparison to 2005 and earlier, flows began later and ceased earlier in the
year, freshes were rarer or absent altogether and peak flows were significantly lower.
Whilst flows prior to 2006 were by no means natural, being highly restricted by water from the upper
catchment captured by the reservoirs, they provided more variable and therefore suitable conditions
for native fish species within the region. The decline in species diversity and abundance, and the
increase in introduced species following decline in high flow flushing events reflected that loss of
natural seasonality.
4.4.3. Flow Management for Native Fish in the South Para River
The normal flow conditions for the South Para River from 1968 to present indicate flows beginning in
about May, continuing on through December and ceasing in early January. Average flow from June to
December is a minimum of 10 ML/day although December is quite variable (Figure 139). Average
flows during the survey period were much lower, began later in the year and ceased earlier (Figure 27
& 33). Peak flows, flushes and freshes were also much lower than normal conditions.
The proposed EWPs (Figure 140) should enhance flows under naturally occurring flow periods. By re-
timing allocations of freshes and flushing flows to extend current flow duration into late autumn and
spring, cease to flow periods may be reduced, enhancing the persistence and quality of refuge pools
during summer and protecting against loss of native fish through desiccation and extreme collapses in
water quality. However, preservation of natural cease to flow during summer should protect
somewhat against ‘overcorrecting’ climatic impacts that then might provide conditions that allow
gambusia and redfin perch to persist, spread and become more abundant than they are currently.

McNeil et al. 2011 Fish and EWPs in the WMLR
185
0
50
100
150
200
250
Janu
ary
Febr
uary
Mar
ch
Apr
il
May
June
July
Aug
ust
Sep
tem
ber
Oct
ober
Nov
embe
r
Dec
embe
r
Flow
(ML)
Figure 140. Dark blue - Annual flow regime in South Para River between 1968-present measured at Woodlands Weir (Gauge A5050503). Pink – monthly average flow per day. Yellow – original EWP. Light blue – suggested EWP. Summer Base flows should be avoided.
4.5. Fish Ecology of EWP Reaches –Torrens River
4.5.1. Sustainability of Native Fish in the Torrens River
The Torrens River had the most diverse and abundant fish population with at least 26 native species
captured during the surveys, although only 11 of those are considered freshwater species (or spend a
major part of their life in freshwater).
The short-headed lamprey was observed to accumulate in large numbers at the Torrens Mouth in the
past, but as long ago as 1951, it was observed that aggregations were unable to ascend into the river
due to the Breakout Creek Weir (Scott 1961). The re-discovery of this species in the lower Torrens
during this survey raises hopes that this species may yet re-establish in the catchment if appropriate
access, habitat and flow regimes can be developed and maintained. Pouched lamprey is more
recently recorded from the reach, but has also been observed in aggregation, trapped below the City
Weir on the Torrens River (Hammer et al. 2009). Whilst not recorded during the current survey, they

McNeil et al. 2011 Fish and EWPs in the WMLR
186
were recorded from the reach under an associated project during the survey period (McNeil et al.
2010b). There is no evidence as yet that lampreys are able to utilise the Torrens fishway, but they
may move into the river on high tidal surges and exit during very large flows. Both events would have
to be timed with spawning migrations and cues (McNeil and Hammer 2007). In addition, natural
populations of short-finned eel would require similar passage during years where coastal conditions
were adequate to carry migrating juveniles to the Adelaide coast.
A further 3 Australian native species; Murray rainbowfish, freshwater catfish and carp gudgeon were
present having been historically translocated from the Murray-Darling catchment but previously
translocated species, Murray cod and silver perch were not recorded and have most likely failed to
maintain viable populations in the Torrens following translocation. Sadly, the once common southern
purple-spotted gudgeon was not caught and is almost certainly extinct in the Torrens catchment.
Flathead gudgeon were the only widespread and common native species throughout the catchment.
There were also 7 introduced species observed, all of which were previously recorded in the
catchment, although the Brook trout (Salvelinis fontinalis) which was reportedly released in the area
but not since recorded, was not found.
The upper reach (Gumeracha to Kangaroo Creek Reservoir) was dominated by exotic species but
possessed relatively high numbers of Galaxias olidus and Galaxias brevipinnis. However, high levels
of exotic predators in the main channel are likely to severely impact populations of these species. As a
result, tributary populations are likely to be essential in maintaining these species in the upper
Torrens, even though they occur from time to time within the main channel, and would be well suited
to the main channel habitat if not for the presence of predators.
Breakout Creek, created to divert flows from the lower Torrens to the sea, had the most stable and
diverse population of native species but was somewhat dominated by introduced and translocated
species. Additionally, a marine fish fauna dominated below the Breakout Creek Weir, with a lack of
connectivity preventing the maintenance of a true estuary at the Torrens Mouth.
The recently constructed fishway at the mouth of the Torrens is attributed with providing diadromous
fish access to the reach, with large numbers of common galaxias, congolli and many blue spot gobies
captured after being absent from recent surveys of the reach (Hicks and Hammer 2004, Gray et al.
2005). However, upstream barriers such as the City Weir and several smaller weirs prevented any
diadromous fish from moving further into the catchment.
McNeil et al. 2011 Fish and EWPs in the WMLR
187
This report recommends that barriers to fish migration in the lower River Torrens be assessed and
considered for removal or provision of fish passage to maximize the benefits provided by the Torrens
fishway and recent habitat restoration programs at Breakout Creek to the rest of the catchment.
4.5.2. Flow Regime and Ecology of Fish in the Torrens River
4.5.2.1. Upper Torrens
Flow regime in the Torrens River was variable and inconsistent throughout the study period. Flows in
the upper catchment were dominated by water transfers between reservoirs for human use. Flows
were characterised by stable high flows during transfers, or stable low flows tending towards zero
flows, with a small degree of variation due to local rainfall events. The flow regime of the upper
Torrens was largely independent of natural climatic regimes that would have driven flow regime prior
to European development.
Local galaxiids are well adapted to permanently flowing reaches (Lintermans 2007) and were
commonly caught in riffles with high flows. Equally they are tolerant of warm summer conditions and
moderate hypoxia that occur during periods of low/zero flow (Closs and Lake 1996, McNeil and
Fredberg 2011). However, the presence of predators like trout and redfin perch decreased or
eliminated galaxiids from many habitats in the upper Torrens. Exotic species such as trout, redfin
perch and gambusia, all benefit greatly from stable flow environments, whether they be stable flowing
(trout, redfin perch) or stable and low (gambusia, redfin perch).
A key recommendation for this reach is that transfer flows be timed to more closely match climatic
rainfall patterns where possible, as this regime corresponds with ecological flow requirements of
native fish, and reduces the benefit of stable unseasonal flow regime to exotic species.
As previously outlined, the flow regime in the upper Torrens catchment consisted of high-flow transfers
between reservoirs and occasional rainfall related flow, punctuated by periods of no flow. The original
ecological objectives of the EWPs for the Upper Torrens reach are listed below and discussed with
reference to the actual flow regime outcomes:
Low flows
1. Increase permanent pool habitat for macroinvertebrates, frogs and fish.
Transfer of water between reservoirs and water pumped from the Murray River resulted in long
periods of permanent pool habitats and increased availability of high-flow riffle habitats for
invertebrates and galaxiids. However, when transfers were not required, there were very long periods

McNeil et al. 2011 Fish and EWPs in the WMLR
188
of no flow to the extent that some pools dried out completely. The loss of habitat resulted in decreased
abundance of all species and a decline in fish diversity at most sites.
2. Decrease temperature fluctuations, reduce salinity, increase dissolved oxygen.
Extended periods of zero flow resulted in significant desiccation of pools in the upper Torrens, with
high salinity levels accompanying shrinking pools. In addition, highly turbid (and somewhat saline)
water transferred from the Murray River has lead to some sedimentation and reductions in pool depth
and general streambed diversity, particularly in larger pools where flushing flows are less able to move
sediments downstream. The result was a low flow scenario in the upper Torrens of exotic dominated
fauna persisting in shrinking pools with declining water quality. As these pools provide critical refuge
habitats for fish during dry periods, cease to flow periods must be shortened by additional autumn and
spring flows to ensure that water quality is less impacted by zero flows during summer.
3. Increase fish movement
There was very little evidence of fish movement within the upper catchment. The most compelling
evidence was the downstream movement of mountain galaxias from Gumeracha Weir to Cudlee
Creek and Gorge Weir in spring 2008. Strong flow transfer between reservoirs may move fish
downstream into isolated or unsuitable habitats, whilst several impassable barriers prevent the
movement of fish back upstream. Movement of galaxiids into the main channel from tributary streams
was able to occur, however, unsuitable and predator dominated main stream habitats appear to
prevent establishment of viable long term native populations in the Torrens pools.
4. Increase area and diversity of submerged macrophytes
Due to the transient and unpredictable provision of flow in the upper catchment, submerged
macrophytes were not abundant and did not increase in area or diversity under the observed flow
regimes. Macrophytes are highly reliant on natural flow regime (Blanche et al. 2002) and as a result,
beds were largely confined to areas in shallower, or riffle areas that dried out periodically.
Medium to high flushing flows
1. Arrest current stream contraction and infilling
2. Control encroachment by emergent macrophytes
Emergent macrophytes were controlled by regular transfer flows followed by desiccation in the upper
catchment.
3. Sediment transport

McNeil et al. 2011 Fish and EWPs in the WMLR
189
Murray River water was higher in turbidity than other WMLR flows and some level of sedimentation is
inevitable.
4. Creation of deeper pool habitat
Large floods were observed to create new pool habitats through movement of large volumes of
substrate including rocks and gravel. Turbid (Murray sourced) flows appear to lead to sedimentation
of larger pools.
5. Provide appropriate breeding cues for native fish
The timing and magnitude of flows were not suitable to stimulate significant breeding and recruitment
in native fish. However, the magnitude and timing of the flows did stimulate recruitment of redfin perch
and gambusia. Upper Torrens flow regimes therefore should be tailored more closely to the
requirements of native fishes and away from those that support introduced fishes.
6. Improve riparian vegetation health
Large floods inundated riparian areas in the upper Torrens and high transfer flows also prevented
desiccation of riparian vegetation o a regular basis.
7. Restore connection between river and floodplain
Again, only larger floods were of significant volume to inundate floodplain areas in the upper Torrens.
4.5.2.2. Lower Torrens
Downstream of Gorge Weir, the flow regime consisted of several large flushes punctuated by periods
of low or zero flow and a few small freshes, largely from urban stormwater runoff. This runoff
maintained pool levels but often resulted in a series of stagnant pools containing poor quality water.
Flows were short-lived and related to stormwater runoff in the lower catchment, with very little flow
coming from the upper catchment.
Low flows below Gorge Weir provided very low levels of flow which maintained extremely consistent
and stable water levels throughout the study. Consequently fish adapted to these conditions thrived in
the lower Torrens, including introduced gambusia, flathead gudgeon and three translocated species,
carp gudgeon, freshwater catfish and Murray rainbowfish.
In addition, downstream barriers prevented connectivity to lower Torrens environments and marine
habitats and as a result, historically abundant diadromous species are no longer present or abundant
in the reach.

McNeil et al. 2011 Fish and EWPs in the WMLR
190
Issues of flow regime in this reach are complicated by urban development. However, restoration of key
aspects of natural flow regime (especially autumn and spring freshes and flushes) would have multiple
ecological benefits including: support of native fish flow requirements; control of exotic fish, and
improved water quality to stream pools improving aquatic assets such as the Linear Park and Lake
Torrens in the Adelaide city centre. Base-flows may contribute to the maintenance of aquatic habitats
and somewhat improve water quality, but not to the degree that freshes and flushing flows will as they
mobilise and remove organic materials that drive stagnation.
The ecological objectives of the planned EWPs for the lower Torrens, downstream of Gorge Weir are
as follows:
1. Maintain and further improve water quality, visual amenity, and habitat for aquatic biota with
low flows.
Throughout the survey period there were sufficient flows to keep water levels in permanent pools
topped up and to provide permanent habitat and maintain visual amenity. However, the water quality
in many reaches was degraded due to the poor quality of stormwater flowing into the system. The
result for the fish community was that low-flow adapted species - including introduced carp and
gambusia and Murray River translocated species – thrived in the lower Torrens catchment. Serious
water quality declines in Lake Torrens during the study period indicate the failure of flows into the
lower Torrens to ameliorate build up of pollutants, nutrients and the development of blue green algal
blooms.
It is recommended that EWP design in this reach be extended toward lower catchment outcomes,
specifically, the extension of existing EWP targets to downstream reaches including Lake Torrens and
Breakout Creek. If possible, consideration should also be given to the assessment and remediation of
barriers to passage of fish downstream of Gorge Weir to optimize the outcomes of EWPs throughout
the lower Torrens.
2. Scour sediment build-up and control encroaching vegetation with winter pulse flows.
The lack of winter pulse flows contributed to the increases in encroaching vegetation and a build-up of
anoxic sediment. Spraying of resultant encroaching vegetation by local councils may also contribute
to loss of native fishes through poisoning of waterways, loss of cover from predators, and trophic
collapse.

McNeil et al. 2011 Fish and EWPs in the WMLR
191
4.5.3. Flow Management for Native Fish in the Torrens River
The natural flow regime in the upper Torrens catchment was difficult to define; the data for the study
period represents a record of flow transfers between reservoirs mixed with local rainfall (Figure 141).
However, in future the transfer of water in the upper Torrens catchment should be managed with
ecological objectives in mind. The flow conditions observed during these surveys revealed that flows
were often arbitrarily released with no consideration of ecological outcomes. At times, reaches were
isolated for months without flow interspersed with periods of very high flow.
Future management of water transfer could take this into account by releasing water at a slower rate
over a longer time period and maintaining a minimum flow of 2.5 ML/day to provide more consistent
and diverse aquatic habitat, with a possible hiatus of transfers during summer to allow some natural
summer low or zero flow conditions to occur. Further ecological objectives would be met by providing
a 1 GL flush spread over a week at least three times a year between late autumn and early spring.
0
100
200
300
400
500
600
700
800
900
Janu
ary
Febr
uary
Mar
ch
Apr
il
May
June
July
Aug
ust
Sep
tem
ber
Oct
ober
Nov
embe
r
Dec
embe
r
Flow
(ML)
Figure 141. Dark blue - Annual flow regime in upper Torrens River 1974-present measured at Gumeracha Weir (Gauge A5040500). Pink – monthly average flow per day. Yellow – original EWP. Light blue – revised EWP.

McNeil et al. 2011 Fish and EWPs in the WMLR
192
The normal flow conditions for the lower Torrens catchment indicate a highly variable, but naturally
timed flow regime (Figure 142). Average flow per day is over 10 ML even in the summer months,
although variability in the data indicates that over summer it is normal to have periods of no flow
interspersed with moderate flows as a result of stormwater runoff. However, the flow during the
present surveys was drastically reduced with longer periods of no flow over summer and fewer flows
from stormwater due to drought related reductions in catchment runoff.
The proposed EWPs provided for year-round low flows of at least 0.25 ML/day with a 20-day 40
ML/day flush in November. Under normal flow conditions, the proposed EWPs would help to achieve
ecological objectives by bridging the gaps between normal flows over summer and autumn and
provide more regular freshes with higher quality water from the upper catchment. However, under
drought conditions revised EWPs should be considered that provide flows at a higher rate closer to the
10 ML/day observed under normal conditions. These more regular flows should also be interspersed
with a low/zero period during summer to mimic natural drops in catchment rainfall and run-off. This
variability may disadvantage introduced species such as gambusia, which thrive on very stable flow
conditions.
0
50
100
150
200
250
300
350
400
450
Janu
ary
Febr
uary
Mar
ch
April
May
June July
Augu
st
Sept
embe
r
Oct
ober
Nove
mbe
r
Dec
embe
r
Flow
(ML)
Figure 142. Dark blue - Annual flow regime in lower Torrens River 1978-present measured at Holbrooks road (Gauge A5040529). Pink – monthly average flow per day. Yellow – original EWP. Light blue – revised EWP.

McNeil et al. 2011 Fish and EWPs in the WMLR
193
4.6. Fish Ecology of EWP Reaches – Lower Onkaparinga River
4.6.1. Sustainability of Native Fish in the Onkaparinga River
The Onkaparinga fish community was the only EWP reach to be numerically dominated by native
fishes. To some degree this is attributable to the openly connected nature of the estuarine/freshwater
linkages. Subsequently, diadromous species such as common galaxias and congolli are able to
spawn and recruit successfully in the lower and marine reaches and move into the mid and upper
reach as adults. The Onkaparinga populations of these diadromous species are likely to be amongst
the largest remaining (after the Murray & Coorong populations) and most critical in the state.
It is recommended, therefore, that: specific EWP targets be developed for diadromous species to
provide access to marine environments for spawning during late autumn-winter, and extended
connecting flows for recolonisation of the catchment during spring.
In other EWP catchments, assessment and management of barriers to migration should also be linked
to the re-establishment of connecting flows for migration to ensure flow provisions are not
counteracted by an inability to respond.
Robust populations (e.g. high abundances of a full range of age classes) of diadromous species
remained despite very low flows during the 2006-09 drought period. In addition, freshwater species
are also abundant in the Onkaparinga, with mountain galaxias and dwarf-flathead gudgeon also
reaching much higher abundances, at least periodically, in the Onkaparinga than other catchments.
In comparison, numbers of introduced redfin perch, gambusia, carp, tench and goldfish remained
relatively low throughout the study period. This pattern suggests that the more naturally seasonal
cycles of flow present in the Onkaparinga (especially downstream of Bakers Gully) compared to other
reaches has additional benefits for native fishes and that reduced stability may disadvantage invasive
species, as has been observed in other Australian systems (Costelloe et al. 2010, McNeil and
Costelloe 2011). The low abundance of these pest species in the target reach provide a good
baseline for EWP applications; any expansion of these populations resulting from EWP delivery could
lead to complications in the environmental benefit provided to natives.
Future monitoring should, therefore, pay specific attention to the pest species, to warn of possible
expansion of these populations linked to underlying flow processes.
The impact of drought was significant in the Onkaparinga with many refuge pools drying completely
and almost all native species responding with reduced levels of recruitment, abundance and/or

McNeil et al. 2011 Fish and EWPs in the WMLR
194
distribution in response to progressive drought. The downstream pools in the Old Noarlunga region
served as key refuge habitats for diadromous and euryhaline species during dry periods. However,
the water quality crash that followed the saline water intrusion in 2009 shows the precarious nature of
these habitats during drought, especially when upper catchment flows are captured in storages and
not allowed to flow into the lower reaches to counteract tidal peaks and storm surges that would
historically be associated with increased river outputs. In upper reaches, EWPs are required to
maintain refuge pools throughout summer periods, especially during drought periods.
Therefore, refuge maintenance flows should be considered in late spring (to pre-condition pools) and
late autumn (to flush and refresh pools). These flows should be increased during drought rather than
be postponed as in the recent example.
In general the sustainability of native fish populations appears to be better supported in the
Onkaparinga than other surveyed catchments, however, the extremely low abundance of species such
as climbing galaxias reveal that flow regime and/or fish passage are not currently adequate for
sustaining viable populations in the EWP reach. Furthermore, the loss of common galaxias under
drought conditions reveals that flows of adequate duration and volume to provide fish passage
between the sea and Clarendon Weir are not occurring without additional EWPs. This pattern may be
contributing both to the absence of climbing galaxias and the decline of other native species across
the survey period (e.g. mountain galaxias).
Finally, the interactions between estuarine and freshwater habitats and fish assemblages were
revealed during the study. Species such as black bream, jumping mullet, gobies and hardyhead all
moved between estuarine and freshwater habitats during connectivity. The integration of estuarine
and marine habitats and species must be more closely linked with freshwater ecology and
management.
It is recommended that specific steps be taken to integrate estuarine and near shore aspects into
assessments and plans for environmental flows in the coastal drainages of the MLR.

McNeil et al. 2011 Fish and EWPs in the WMLR
195
4.6.2. Flow Regime and Ecology of Fish in the Onkaparinga River
Following the postponement of EWP trial releases due to ongoing drought in the WMLR, the
objectives of fish monitoring program changed slightly, from collecting a single year of “pre flow” data
and two years of “post flow” data, to a three year pre-flow study that will provide a stronger baseline of
information from which post flow “response” patterns can be compared. As such, the revised study
design allows the assessment of EWPs under a Before-After Comparison (BAC) design (Bunn and
Arthington 2002) which can provide a balanced assessment of flow release impacts and responses,
when compared to identical monitoring data following the release of EWPs to the reach.
It is strongly recommended that at least three years of post-flow data be collected using the same
sites and methodology utilised in the present study to allow strong scientific conclusions to be drawn
regarding the role of EWPs in driving observed ecological patterns.
The extreme low flows encountered during the pre-flow survey incidentally improve the value of this
study as a pre-EWP data set given the additional climatic pressure on flows and flow requirements of
native fish.
The ecological objectives of the planned EWPs in the Onkaparinga were as follows:
1. Provide longitudinal connection for fish migration.
A key benefit of providing an Environmental Water Provision to the Onkaparinga River below
Clarendon Oval is the improved connection between the river and the estuary, allowing the movement
and spawning of a greater diversity of fish and other aquatic life than that occurring with present flows
(Bald and Scholz 2007a). The distribution of diadromous fish throughout the reach at the beginning of
the survey suggests that the winter/spring baseflow in 2006 provided sufficient flow volume and
duration for fish to migrate the length of the reach.
Modelling conducted under a related project suggested that this flow was likely to be sufficient for the
passage of diadromous fish from the sea to Clarendon, but that spring flows of this duration and
volume were rare under current flow management (Mackay et al. 2008). Initial surveys found the fish
community in reasonable condition with common, mountain and climbing galaxias all present
downstream of Clarendon Weir suggesting that pre-survey flow conditions were supportive of a
diverse range of native fish throughout the reach.
The decline in range and abundance of all galaxiid species in the upper reach is most likely associated
with the deterioration in flow conditions as drought increased. Congolli and common galaxias
maintained healthy populations at Old Noarlunga partly because of the proximity to the estuary and

McNeil et al. 2011 Fish and EWPs in the WMLR
196
partly because the extra unregulated flow emanating from Kangarilla Creek provided longer flow
duration for springtime recruitment, allowing migratory exchange between the sea and the extreme
downstream reaches of the Onkaparinga.
2. Maintain and improve water quality
Water quality as measured during these surveys was often within the physiological limits of the native
and introduced species. However, increased salinity from tidal incursion into the most downstream
pool at Old Noarlunga resulted in a switch to hypoxic (<0.2mg/l), marine conditions (salinity >35ppt)
and a subsequent fish kill event (McNeil et al. 2009). Maintaining end of catchment flows over spring
and summer is likely to have prevented this incident, or at least provided a means of escape for fish to
move upstream. Freshes and flushes would have also prevented the pool from remaining salty for
long periods as occurred in autumn 2007 and 2008. With potential for increasing marine intrusion
associated with climatic warming and rising sea levels, it may be prudent to address the possibility of
freshwater flow releases to counteract intrusive saline water related to storm swells and king tides.
There are, however, obvious risks to flooding associated with additional flows during high tidal
conditions.
3. Maintain self-sustaining fish populations
The general decline in fish diversity and abundance over the survey period suggests that current flow
conditions are barely sufficient for maintaining self-sustaining populations of most native fish species,
with exception of flathead gudgeon. Recruitment of native species was minimal, while introduced
species thrived. Without improved flow conditions, the pattern observed during the current survey are
likely to lead to long term impacts on the ability of the native fish community to maintain viable self-
sustaining populations within the lower Onkaparinga River.
It is therefore imperative that EWP trials begin as soon as possible to enable the rebuilding of resilient
native fish populations that are able to survive periods of environmental harshness in the future.
This is particularly critical for rebuilding resilience following the recent drought (McNeil et al. 2011b).
4. Maintain and restore habitat diversity for macroinvertebrates
This aspect of the ecological outcomes was not monitored during this survey, however, observed lack
of extended periods of riffle inundation are likely to lead to reduced invertebrate diversity and therefore
impact upon food webs that support native fish populations.
5. Control terrestrial vegetation of the river channel

McNeil et al. 2011 Fish and EWPs in the WMLR
197
A very large flushing flow in 2005 had cleared terrestrial vegetation from the river channel. Over the
duration of the survey period, terrestrial vegetation increased again to the extent that much of the
channel and in particular riffle areas became overgrown by introduced plant species, especially
African fountain grass. The incursion of this species is likely to provide reasonable habitat for native
fish species, but consideration should be given to replacing this introduced weed with similar native
species such as local Lomandra spp. (see Nicol and Bald 2006).
6. Reset aquatic habitat
The very large flow in November 2005 had reset the aquatic habitat by removing built up sediment,
nutrients and organic matter. Similarly, flooding flows in November 2009 provided similar services
following the study period. Flows of this large magnitude are likely to be adequate at these (~4 year)
intervals to flush and reset ecological processes.
7. Summer low flows – maintain shallow water habitat for macroinvertebrates and improve water
quality in pools
Flow provisions and in particular spring and summer baseflow have been developed to maintain
volume and quality of aquatic habitats throughout summer and prevent the annual loss of biota from
drying river reaches (Bald and Scholz 2007b). There were no summer low flows throughout the survey
period and shallow water habitats such as riffles and runs between pools were not maintained. These
are the preferred habitat of galaxias species, which declined in distribution and abundance over the
course of the survey, in particular climbing galaxias which become incredibly rare as drought
progressed.
8. Summer freshes – flush pools to improve water quality and increase habitat value
Summer freshes were not provided. However, naturally occurring winter/spring freshes were
insufficient for restoring freshwater habitats in the lower Onkaparinga following the marine intrusion
event. Larger flushing flows may be required to provide this ecological function, especially towards
the bottom of the reach.
9. Winter low flows – create surface water flow sufficient to fill low flow channels providing
migration opportunities for fish and macroinvertebrates, not significantly impacting depth of
pools
The only winter low flow to meet the volume targets set in planning was that provided by the EWP in
2006, and its duration was not long enough. Low flows in subsequent winters did not even meet

McNeil et al. 2011 Fish and EWPs in the WMLR
198
targets for summer low flows and were of very short duration. The observed decline in abundance and
distribution of diadromous fish indicates the inadequacy of the meagre low flows in this reach.
10. Winter freshes – provide longitudinal connection between pools and allow migration for fish
and macroinvertebrates but not scouring biofilms or sediment
Winter freshes meeting the targets set during planning did not occur at the two upstream sites
throughout the survey period. One small fresh was provided along with the trial EWP in 2006. At the
downstream site, flows from Kangarilla Creek resulted in winter freshes over 100 ML/day although
they flowed for less than the 5 day targets set in planning. Regardless, these freshes were unable to
provide passage between the lower and upper sites. Rainfall events in Kangarilla Creek catchment
should be matched with releases of freshes from Mt Bold to take advantage of the unregulated flow
regime from that catchment.
11. Large winter pulses – reset habitat and ecosystem processes by scouring sediments and
biofilms, also aiding in vegetation control
Significant rainfall events in the Kangarilla Creek catchment resulted in one large winter pulse flowing
down the lower part of the river each year, however the two upstream sites did not receive any large
winter pulses as the rainfall was captured by the reservoir.
4.6.3. Flow Management for Native Fish in the Onkaparinga River
Normal flow in the Onkaparinga at Old Noarlunga reflect both the regulated input from the upper
catchment and the relatively unregulated input from Kangarilla Creek and several other smaller
tributaries (Figure 143) Winter and spring rainfall contributes most towards flow, with no summer and
very little autumn flow. Flow during the present surveys was even more restricted to winter and early
spring flows. Under normal flow conditions, the proposed EWPs would have provided connectivity
over summer and autumn, although they would only enhance winter and spring flows and they would
potentially miss extending flows from spring into December. The natural flow regime in the
Onkaparinga should allow flow year-round in most years. To achieve this, a revised EWP would begin
in spring and extend flows over summer to provide passage back up the river for diadromous fish. It
would also provide large flushes and freshes over spring and summer to stimulate spawning and
recruitment and to maintain high water quality over a longer period of time.
During this survey, EWPs were not delivered because of extreme drought conditions. As a result, most
of the ecologically important aspects of flows were unavailable to the lower Onkaparinga for over three
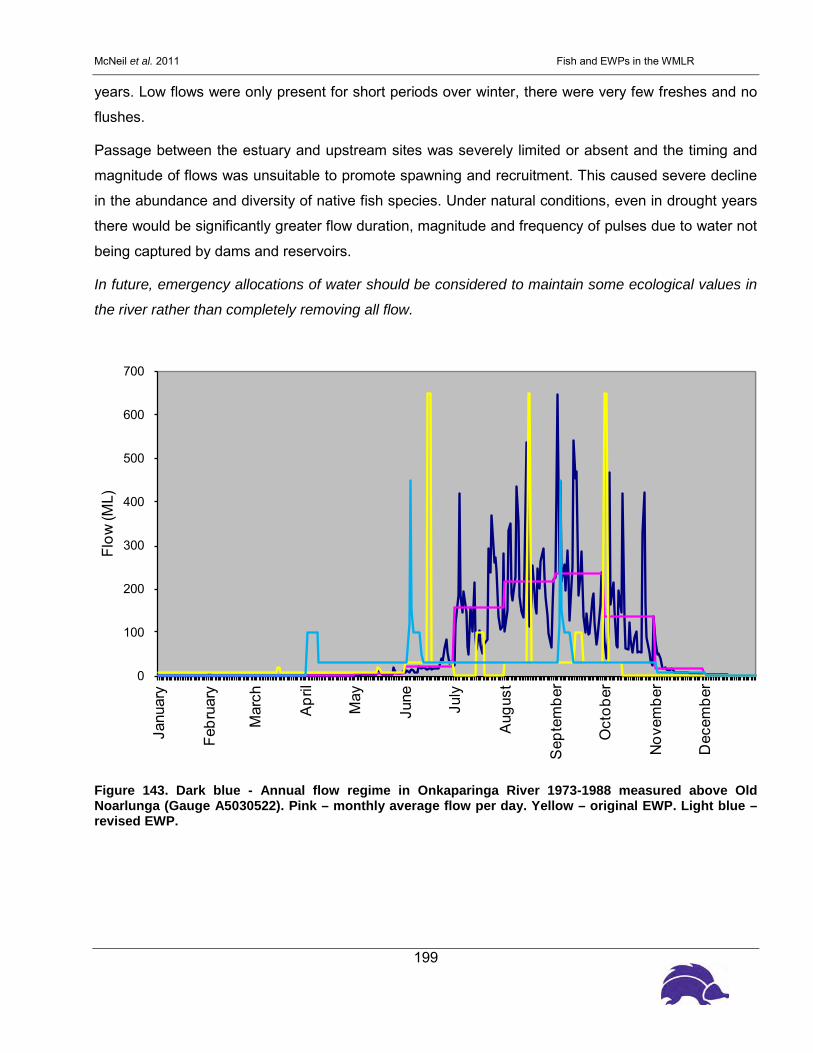
McNeil et al. 2011 Fish and EWPs in the WMLR
199
years. Low flows were only present for short periods over winter, there were very few freshes and no
flushes.
Passage between the estuary and upstream sites was severely limited or absent and the timing and
magnitude of flows was unsuitable to promote spawning and recruitment. This caused severe decline
in the abundance and diversity of native fish species. Under natural conditions, even in drought years
there would be significantly greater flow duration, magnitude and frequency of pulses due to water not
being captured by dams and reservoirs.
In future, emergency allocations of water should be considered to maintain some ecological values in
the river rather than completely removing all flow.
0
100
200
300
400
500
600
700
Janu
ary
Febr
uary
Mar
ch
Apr
il
May
June
July
Aug
ust
Sep
tem
ber
Oct
ober
Nov
embe
r
Dec
embe
r
Flow
(ML)
Figure 143. Dark blue - Annual flow regime in Onkaparinga River 1973-1988 measured above Old Noarlunga (Gauge A5030522). Pink – monthly average flow per day. Yellow – original EWP. Light blue – revised EWP.
McNeil et al. 2011 Fish and EWPs in the WMLR
200
4.7. Summaries
4.7.1. Native Fish Management and EWPs in the WMLR
Overall, the status of native fish populations throughout EWPs was considered relatively poor, with
native biodiversity at some sites represented by a single species only. In addition, many native fish
species were under-represented within catch data suggesting that they are struggling to maintain large
and viable populations in the trial reaches. This may threaten the long term sustainability of these
reaches in supporting native biodiversity.
The four target reaches for EWP trials all possess very different fish communities that are most likely
impacted by a range of historical factors and impacts of past management practices. Whilst habitat
structure in most of the reaches was found to be reasonably intact, the presence of introduced
competitors and predators, combined with highly modified flow regimes and instream barriers are
likely to have heavily influenced current assemblage structure.
The most impacted reach was the South Para River which is reduced to only a single common native
fish that co-exists with gambusia and redfin perch. Native galaxiids that persist in tributaries and in the
upper catchment area, and diadromous natives that persist below the confluence with the North Para
River are not able to establish within the reach because of numerous impassable barriers to migration
and the presence of large redfin perch throughout the reach, which are likely to exclude them through
predation, given their potential desirability as an easily obtainable (pelagic) and high energy food
source (McDowall 2006, Wilson et al. 2008).
The South Para River, therefore, has several ecological challenges to the sustainability of native fish
that are exacerbated by impacts of flow management in the reach. Consequently, identification and
removal of barriers and control of introduced species are desirable management actions for this reach.
In addition, EWPs for this reach should be tailored towards disadvantaging pest fish as well as
assisting in the re-establishment of a native fish assemblage in the reach.
The Torrens River was also dominated by introduced species, but indications from this survey are that
native fishes are still present and would benefit from targeted riverine management, and in particular,
flow regime changes. In the upper catchment, more careful, ecologically considerate management of
water transfers is likely to play a key role in maintaining sustainable and viable native fish populations.
Indications are that galaxiids are able to move into the reach from tributaries and establish during flow
events in riffles and shallower habitats. However, contraction of the reach back to pools, without any
seasonal cues, or gradual drawdown practices that may incite migration to safe refuge leads to

McNeil et al. 2011 Fish and EWPs in the WMLR
201
sporadic catches of the fishes, which are unlikely to survive in larger pools given the high densities of
trout and redfin perch that persist in those habitats. In the lower catchment, habitats and flows are
both highly modified and likely to benefit greatly from both habitat restoration activities as well as the
provision of seasonally timed flows to promote spawning and recruitment of native fish species, and to
drive natural ecological processes that can build native fish populations.
The Onkaparinga River possesses the most natural fish community and has the most intact habitat
structure and the lowest number of barriers to migration into the reach (with the notable exception of
the Bakers Gully gauging weir). The principal barrier to migration is that flow levels are of insufficient
volume and duration to inundate natural cease to flow points and facilitate the regular migration of fish
throughout the reach. EWPs are therefore, most likely to have measurable results in this reach due to
the lower contribution of other factors impacting upon the native fish community. Care must be taken,
however, to guard against EWP regimes that encourage the expansion of introduced fish
communities, which are currently at low levels in the lower Onkaparinga, potentially due to the harsh
summer conditions that discourage less tolerant exotics (Wilson et al. 2008).
4.7.2. Designing EWPs for native fish
The data collected during this monitoring program provides an opportunity to investigate the role of
river flows in structuring and building sustainability into native fish populations in the four EWP
reaches prior to the delivery of trial EWPs. The flow regime of all reaches is highly modified from
natural through water resource developments to support human needs throughout the city of Adelaide.
The collection of baseline biological data can therefore provide important information regarding the
flow-dependant habitat requirements of native fishes, including water quality and the timing and
volume of flows required by fishes for spawning and migrational cues; recruitment and the survival of
robust demographic population structure.
The data is not consistent across target reaches, but some common issues have arisen regarding
critical components of the flow regime. Specific issues may also support the further modification of
flow regimes in these reaches. In addition, the collection of data occurred during extreme drought with
record low catchment rainfall and runoff, leading to extremely low flow conditions. These
circumstances revealed additional information about the exceptional flow requirements that may be
required during drought to protect freshwater fish, over and above those required to maintain and
restore native fish populations during periods of more normal climate and rainfall.

McNeil et al. 2011 Fish and EWPs in the WMLR
202
Three broad flow requirements identified are listed below:
1. Seasonal flow cues to initiate spawning development/behaviour, access to and inundation of
spawning habitats.
• Flow cues timed in late autumn/early winter to allow congolli, and common and climbing
galaxias to access spawning areas in the lower freshwater/upper estuarine reaches of rivers.
• Flows must be of significant volume at the end of the catchment to inundate wetlands, riparian
vegetation and bank shoulders that provide spawning habitats for these species.
• Spring flows timed to allow return migration of larval/juvenile congolli, galaxiids, eels and adult
lampreys; and to provide spawning cues for obligate freshwater species such as mountain
galaxias, blue spot goby, and gudgeon.
• Flows must be of sufficient duration to allow return migration between spawning, larval and
adult habitats.
2. Minimum durations of zero flow periods over summer to prevent impacts of habitat and water
quality decline on native fish (whilst maintaining enough variability in habitat and water quality to
disadvantage exotic pests).
• Natural climatic cycles often drive patterns of habitat loss and recolonisation during drought
periods and subsequent flow seasons (Bond et al. 2008). Refuge habitats of sufficient depth
and habitat quality are critical for protecting native fishes during seasonal and extended
periods of drought.
• Although native fish are well adapted to the decline in water quality and habitat associated with
seasonal climatic drying (McNeil and Closs 2007), minimum zero flow periods are required to
ensure that the tolerance thresholds of native fish are maintained in a critical number of refuge
habitats.
3. Extended duration connecting flows to allow fish movement across freshwater reaches, tributaries.
• In addition to the role of refuge habitats in the survival of fish, flows sufficient to re-inundate
aquatic habitats, and to provide recolonisation pathways are essential for building up
population resilience following drought seasons or periods.
• Freshwater species such as mountain galaxias require spring flows to recolonise high quality
habitats and to maintain appropriate mixing for maintaining genetic diversity.
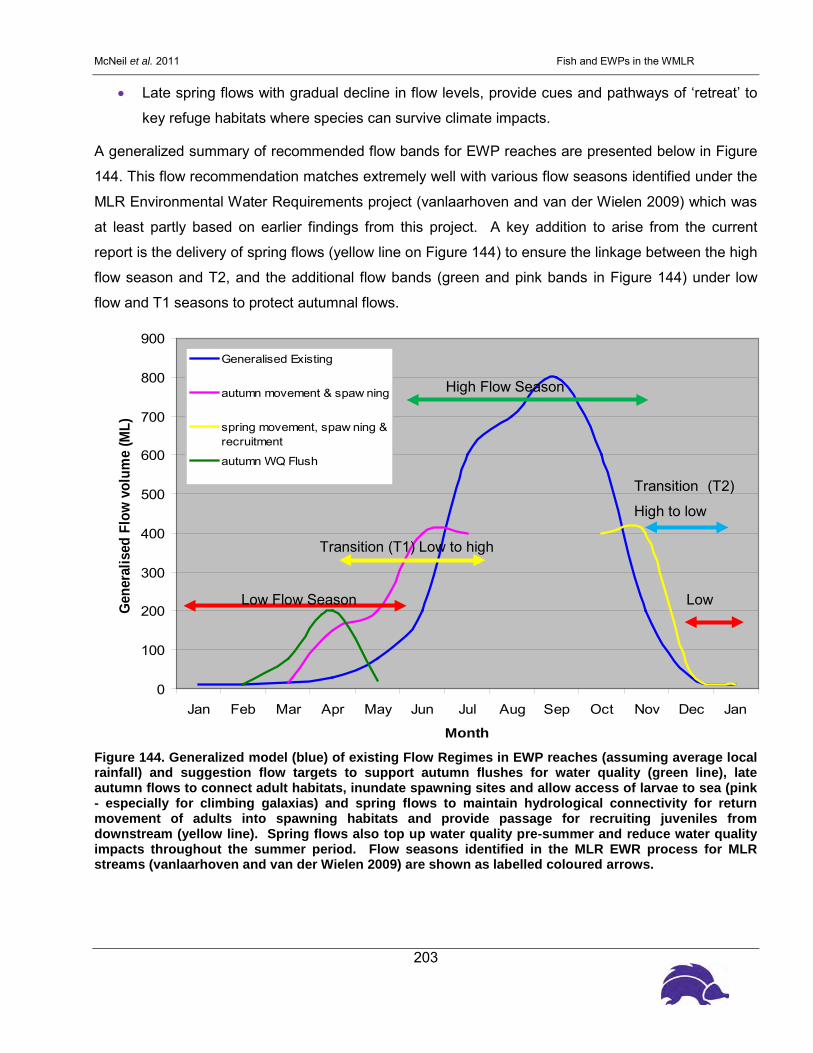
McNeil et al. 2011 Fish and EWPs in the WMLR
203
• Late spring flows with gradual decline in flow levels, provide cues and pathways of ‘retreat’ to
key refuge habitats where species can survive climate impacts.
A generalized summary of recommended flow bands for EWP reaches are presented below in Figure
144. This flow recommendation matches extremely well with various flow seasons identified under the
MLR Environmental Water Requirements project (vanlaarhoven and van der Wielen 2009) which was
at least partly based on earlier findings from this project. A key addition to arise from the current
report is the delivery of spring flows (yellow line on Figure 144) to ensure the linkage between the high
flow season and T2, and the additional flow bands (green and pink bands in Figure 144) under low
flow and T1 seasons to protect autumnal flows.
0
100
200
300
400
500
600
700
800
900
Jan Feb Mar Apr May Jun Jul Aug Sep Oct Nov Dec Jan
Month
Gen
eral
ised
Flo
w v
olum
e (M
L)
Generalised Existing
autumn movement & spaw ning
spring movement, spaw ning &recruitment
autumn WQ Flush
Figure 144. Generalized model (blue) of existing Flow Regimes in EWP reaches (assuming average local rainfall) and suggestion flow targets to support autumn flushes for water quality (green line), late autumn flows to connect adult habitats, inundate spawning sites and allow access of larvae to sea (pink - especially for climbing galaxias) and spring flows to maintain hydrological connectivity for return movement of adults into spawning habitats and provide passage for recruiting juveniles from downstream (yellow line). Spring flows also top up water quality pre-summer and reduce water quality impacts throughout the summer period. Flow seasons identified in the MLR EWR process for MLR streams (vanlaarhoven and van der Wielen 2009) are shown as labelled coloured arrows.
Transition (T1) Low to high
Low Flow Season
Transition (T2)
High to low
High Flow Season
Low

McNeil et al. 2011 Fish and EWPs in the WMLR
204
4.7.3. Critical flow gaps for fish in EWP reaches
The flow regime of EWP reaches (see hydrographs throughout section 4) was compared with those
aspects of flow regime that were identified as critical to fish throughout the current survey. Flow
regime in all four EWP reaches was dominated by local rainfall driven peaks in flow (except for the
irregular water transfers in the upper Torrens) that were predominantly distributed throughout the
winter period and into early spring. However, native fish in the WMLR are reliant on flow peaks that
extend from mid-late autumn when many species begin to spawn, through until late spring, where
recruitment and migrations are common and pool water quality is determined for the oncoming dry
season, where low or zero flows are common and natural.
This crucial difference between natural and altered flow regimes means the restoration of autumn and
spring flows are seen as the most critical aspect of restoring flow regime through the delivery of EWPs
for native fish. This is further amplified by recent climate-change predictions indicating a decrease in
local rainfall (McInnes et al. 2003, Bardsley 2006), and in particular, declining rainfall volumes
throughout autumn and early winter (Timbal and Jones 2008).
The principal recommendation of the current report is therefore that if nothing else, EWPs should aim
to boost autumn and late spring flows and to ensure that these are of significant duration to link up
with winter dominated flows driven by local catchment rainfall.
4.8. Utility of Multivariate Data Analysis
A multivariate statistical approach was used to investigate the relationship between fish community
with flow and habitat variables. The approach using vector analysis may be an effective way of
interpreting long term trends in the data and may be limited by the relatively short duration of data
collection. In particular, flow variables for each reach do not vary across sites within a reach and
therefore, a large number of seasons are required before trends become meaningful. As a result, the
multivariate plots presented here generally show strong seasonal patterns that represent fish
community or population shifts between autumn and spring.
These seasonal patterns are clear for some reaches, and at others are obfuscated by the influence of
other variables such as flow and water quality. It is envisaged that with long term data collection over
several years, the influences of factors such as flow will become clearer. The emergence of some
correlative parameters using the current limited data set is encouraging as it suggests that long term
data collection is likely to lead to clearer correlative patterns that can help to outline trends in the fish
community data and develop linkages between flow and ecological patterns.

McNeil et al. 2011 Fish and EWPs in the WMLR
205
4.8.1. Further research
The return toward average rainfall combined with initiatives to secure water supply to metropolitan
Adelaide, mean it is vital that the EWP program be reinstated to return ecological health to the three
rivers surveyed here. In light of our findings, the EWPs proposed in 2005 (Pikusa and Bald 2005b)
should be revisited and revised as necessary. This project has highlighted the benefits of longer-term
monitoring to assess ecological health. Further EWP trials should incorporate long-term monitoring
surveys with both general and specific aims to ascertain the performance of the EWPs. The surveys
should monitor the general ecological health of each river, but they should also be designed to monitor
the specific hypothesis based ecological outcomes proposed for each river.
There also remain a number of unanswered species specific research outcomes, most of which relate
to the response of species to a natural flow regime (whether that is truly natural or supplemented by
EWP). These knowledge gaps are highlighted in the species matrices below.
4.9. Summary of Key Recommendations
4.9.1. South Para River
• Management attention given to key threats including barriers to migration, introduced predators
(redfin perch) and flow regime, and habitat changes resulting from abstraction from private
dams in Tenafeate Creek.
• Flow allocations to the South Para River be designed to maximize seasonal flow cues for
spawning and migration of native fishes and disadvantage exotics.
• Barriers be removed downstream to re-establish native fish community in the South Para
River, in particular, common and climbing galaxias, congolli, blue spot goby, short headed and
pouched lamprey.
4.9.2. Torrens River
• EWP design in this reach be extended toward lower catchment outcomes, specifically, the
extension of existing EWP target to downstream reaches including Lake Torrens and Breakout
Creek.

McNeil et al. 2011 Fish and EWPs in the WMLR
206
• Barriers to fish migration in the lower River Torrens be assessed and considered for removal or
provision of fish passage to maximize the benefits provided by the Torrens fishway and recent
habitat restoration programs at Breakout Creek to the rest of the catchment.
• Transfer flows in the upper catchment be timed to more closely match climatic rainfall patterns
where possible, as this regime corresponds with ecological flow requirements of native fish,
and reduces the benefit of stable unseasonal flow regime to exotic species.
• Restoration of key aspects of natural flow regime in the lower Torrens to improve water quality
in stagnant stream pools improving aquatic assets such as the Linear Park and Lake Torrens
in the Adelaide city centre. Base-flows may contribute to the maintenance of aquatic habitats
and somewhat improve water quality, but not to the degree that freshes and flushing flows will
as they mobilise and remove organic materials that drive stagnation.
4.9.3. Onkaparinga River
• Future monitoring should pay specific attention to the pest species to warn of possible
expansion of these populations under EWPs.
• Specific EWP targets should be developed for diadromous species to provide access to marine
environments for spawning during late autumn-winter, and extended connecting flows for
recolonisation of the catchment during spring.
• EWPs should be designed to maintain water quality levels in pools in lower Onkaparinga
during low flow periods, specifically to overcome saltwater incursion on king tides.
4.9.4. General
• EWP trials should begin as soon as possible to enable the rebuilding of resilient native fish
populations that are able to survive periods of environmental harshness in the future.
• Regular, broad spatial surveys should be considered to support the development of accurate
and realistic water resource and flow allocations for sustaining native fish biodiversity and
ecological sustainability in the WMLR.
• At least three years of post-flow data should be collected using the same sites and
methodology utilised in the present study to allow strong scientific conclusions to be drawn
regarding the role of EWPs in driving observed ecological patterns.

McNeil et al. 2011 Fish and EWPs in the WMLR
207
• EWPs should aim to boost autumn and late spring flows and to ensure that these are of
significant duration to link up with winter dominated flows driven by local catchment rainfall.
• Assessment and management of barriers to migration should also be linked to the re-
establishment of connecting flows for migration to ensure flow provisions are not counteracted
by an inability to respond.
Flow regime is considered a key determinant of aquatic biodiversity in rivers and streams, and can be
seen to influence aquatic biodiversity through four key principals (Bunn and Arthington 2002). These
principals provide a means of summarizing the major findings of the fish monitoring programs.
4.9.5. Flow is a major determinant of physical habitat and therefore biotic composition
In the WMLR, flow is related to a number of aspects of fish habitat:
• Aquatic species have evolved life history strategies primarily in direct response to their natural
flow regimes:
• Most of the native fish in the WMLR possessed life history traits closely linked to flow regime:
• Very large floods (before and after survey period) mobilised sediments, maintained benthic
diversity, prevented vegetation intrusion and formed new pools in all EWP reaches during
natural high rainfall events.
• Autumn-spring baseflow and minimization of cease to flow periods maximized the persistence
of refuge pools throughout summer dry seasons in all EWP reaches. These conditions
seemed to be linked closely to the sustainability mountain galaxias populations.
• Very low flows during seasonal dry periods, (increased cease to flow period, reduced baseflow
in autumn and spring), exacerbated by drought, led to the widespread loss of pools (and
therefore all resident fish) in all EWP reaches except for the lower Torrens where baseflow was
more constant throughout summer.
• Water quality deteriorated in refuge pools during summer dry periods. Marine intrusion drove
salinity levels upwards in the lower Torrens and Onkaparinga during storm surges, leading to
fish kills. Whilst most native species are tolerant of low dissolved oxygen and warm
temperatures, fish health in shrinking pools in the Onkaparinga deteriorated significantly with
disease and malnutrition prevalent in some pools, especially for common galaxias and congolli.
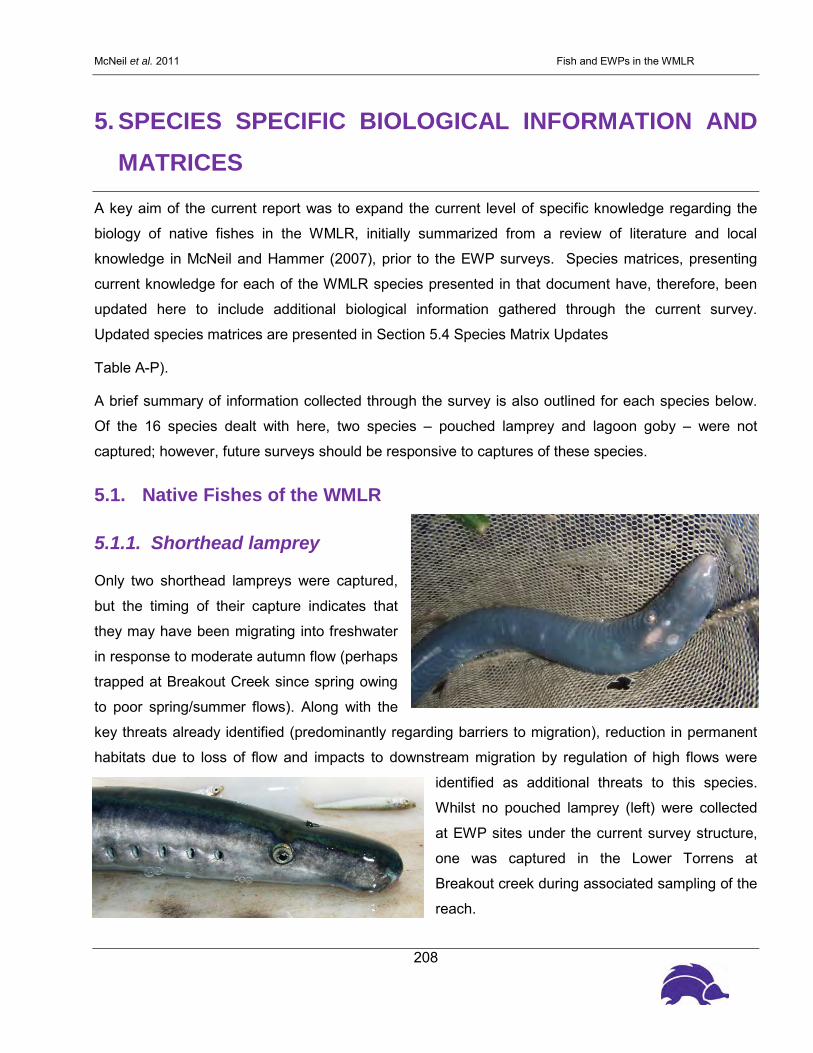
McNeil et al. 2011 Fish and EWPs in the WMLR
208
5. SPECIES SPECIFIC BIOLOGICAL INFORMATION AND MATRICES
A key aim of the current report was to expand the current level of specific knowledge regarding the
biology of native fishes in the WMLR, initially summarized from a review of literature and local
knowledge in McNeil and Hammer (2007), prior to the EWP surveys. Species matrices, presenting
current knowledge for each of the WMLR species presented in that document have, therefore, been
updated here to include additional biological information gathered through the current survey.
Updated species matrices are presented in Section 5.4 Species Matrix Updates
Table A-P).
A brief summary of information collected through the survey is also outlined for each species below.
Of the 16 species dealt with here, two species – pouched lamprey and lagoon goby – were not
captured; however, future surveys should be responsive to captures of these species.
5.1. Native Fishes of the WMLR
5.1.1. Shorthead lamprey
Only two shorthead lampreys were captured,
but the timing of their capture indicates that
they may have been migrating into freshwater
in response to moderate autumn flow (perhaps
trapped at Breakout Creek since spring owing
to poor spring/summer flows). Along with the
key threats already identified (predominantly regarding barriers to migration), reduction in permanent
habitats due to loss of flow and impacts to downstream migration by regulation of high flows were
identified as additional threats to this species.
Whilst no pouched lamprey (left) were collected
at EWP sites under the current survey structure,
one was captured in the Lower Torrens at
Breakout creek during associated sampling of the
reach.

McNeil et al. 2011 Fish and EWPs in the WMLR
209
5.1.2. Shortfinned eel
Two short-finned eels were captured (one each
in the Torrens and Onkaparinga), extending the
known range of this species into the Western
Mount Lofty Ranges. Due to the highly migratory
life history of this valuable species, barriers to
upstream and downstream movement should be
assessed for removal or bypass. Nothing is known about the migratory nature of this species in the
WMLR (i.e. it is likely that natural recruitment is a rare event during strong coastal currents) and future
research should investigate the natural recruitment of this species from east coast Australia.
5.1.3. Freshwater catfish
Freshwater catfish have a healthy,
albeit translocated, population in the
Torrens River. Freshwater catfish utilise
low-flow habitats a pattern confirmed
by strong recruitment following low
winter flow in 2006. Although there wasn’t direct evidence of competition with carp, recruitment of
freshwater catfish and carp were inversely related. This introduced Torrens population is an ideal
study candidate for threatened Murray species given the co-occurrence of both native and introduced
Murray River species, and the non-indigenous nature (and therefore low conservation value) of the
Torrens populations. Future research opportunities exist to investigate life history and recruitment
requirements for this species and to explore the interaction between carp and catfish under varying
flow regimes as a test case for carp management in the Murray River.
5.1.4. Bony Herring
A single bony herring was captured in the upper
Torrens catchment, and is the first record of this
species in the SAG. This is almost certainly the
result of translocation from the neighbouring
Murray River catchment. Whilst the translocation
could be the result of a pelican or duck vector, it is more likely (especially given the good physical

McNeil et al. 2011 Fish and EWPs in the WMLR
210
condition of the specimen) that translocation has occurred through Murray water pipeline, which enters
the Torrens just upstream of the capture site. Conditions in the lower Torrens catchment are quite
suitable for bony herring which could proliferate if a population established there with adverse
consequences for other native species. Assessment of the translocation potential of Murray River
pipelines should immediately be undertaken to counteract the risk of unwanted future species
movements into the WMLR, especially given new invasive species such as weatherloach have
recently moved into the lower Murray where
the pipelines originate.
5.1.5. Climbing galaxias
Climbing galaxias had a limited distribution,
primarily restricted to the upper reaches of
the Torrens and Onkaparinga Rivers. Loss of riffle habitat due to flow restriction is likely to have had a
major impact on their abundance and distribution. Climbing galaxias were not captured at downstream
sites near the estuary and are likely to be a landlocked population in these rivers. Redfin perch and
trout were identified as key threats to their abundance and distribution. Management priorities should
concentrate on re-establishing habitat diversity by managing low flows to maintain riffles and limiting
the distribution and abundance of key predators.
5.1.6. Common galaxias
Common galaxias were captured
in the South Para, Torrens and
Onkaparinga Rivers although their
abundance declined over the
course of the surveys with declining flow and lack of spring connectivity. They showed good
recruitment to lower reaches in spring, but were unable to move further upstream due to flow
restriction. It was difficult to determine the general effect of water quality on abundance, but common
galaxias were absent from pools with extreme high salinity and low dissolved oxygen. The fishway at
the mouth of the Torrens River was effective for fish passage, but numerous other barriers exist in the
Torrens and other rivers to prevent movement to
upstream habitats. The presence of this species
above woodlands weir in the South Para was the
result of translocation by the friends of the Gawler
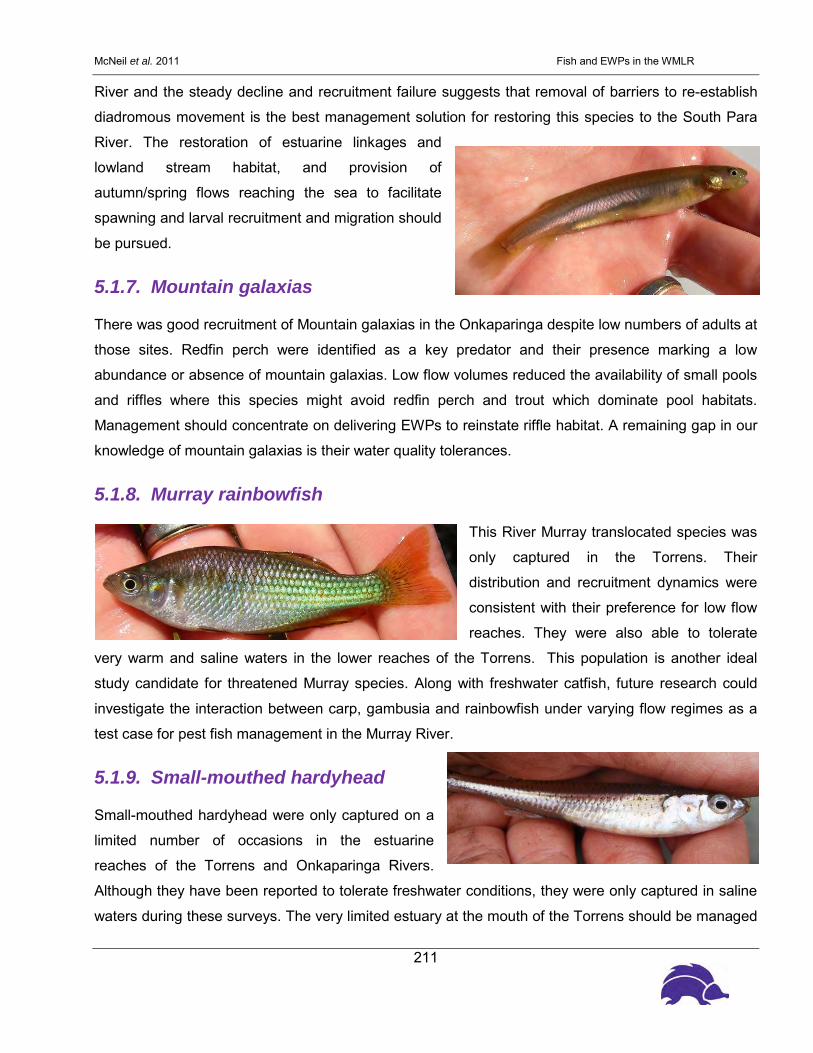
McNeil et al. 2011 Fish and EWPs in the WMLR
211
River and the steady decline and recruitment failure suggests that removal of barriers to re-establish
diadromous movement is the best management solution for restoring this species to the South Para
River. The restoration of estuarine linkages and
lowland stream habitat, and provision of
autumn/spring flows reaching the sea to facilitate
spawning and larval recruitment and migration should
be pursued.
5.1.7. Mountain galaxias
There was good recruitment of Mountain galaxias in the Onkaparinga despite low numbers of adults at
those sites. Redfin perch were identified as a key predator and their presence marking a low
abundance or absence of mountain galaxias. Low flow volumes reduced the availability of small pools
and riffles where this species might avoid redfin perch and trout which dominate pool habitats.
Management should concentrate on delivering EWPs to reinstate riffle habitat. A remaining gap in our
knowledge of mountain galaxias is their water quality tolerances.
5.1.8. Murray rainbowfish
This River Murray translocated species was
only captured in the Torrens. Their
distribution and recruitment dynamics were
consistent with their preference for low flow
reaches. They were also able to tolerate
very warm and saline waters in the lower reaches of the Torrens. This population is another ideal
study candidate for threatened Murray species. Along with freshwater catfish, future research could
investigate the interaction between carp, gambusia and rainbowfish under varying flow regimes as a
test case for pest fish management in the Murray River.
5.1.9. Small-mouthed hardyhead
Small-mouthed hardyhead were only captured on a
limited number of occasions in the estuarine
reaches of the Torrens and Onkaparinga Rivers.
Although they have been reported to tolerate freshwater conditions, they were only captured in saline
waters during these surveys. The very limited estuary at the mouth of the Torrens should be managed

McNeil et al. 2011 Fish and EWPs in the WMLR
212
to protect this and other species from development activities on the metropolitan coast, such as sand
carting, which was observed to disconnect riverine, estuarine and marine reaches on several
occasions. The impacts of coastal management activities on native fish along the Adelaide coast
remain unaddressed.
5.1.10. Congolli
Many of the knowledge gaps identified by McNeil and
Hammer (2007) have been filled or verified during this
survey. Male-female habitat separation was observed
in each river with the larger females occupying
freshwater pools and males occupying the
downstream saline pools or estuary. However, a
unique situation was also observed where ripe males
and females were both aggregated within freshwater
pools in the lower Onkaparinga. The increasing salinity in the lowest pool in the Onkaparinga made it
an increasingly important habitat for juvenile congolli despite poor water quality. Loss of connectivity
and barriers to movement were an issue for spawning and recruitment, especially in the South Para
River where Woodlands Weir remains a significant barrier to all fish movement. Management actions
should be directed at removal or bypass of instream barriers and restoration of estuarine linkages,
restoration of flow for female passage to upstream habitats and restoration of lowland reaches,
particularly the Breakout Creek wetland area in the Torrens.
5.1.11. Carp gudgeon
Another River Murray-Torrens translocation, this species
highlighted its preference for low flow reaches, increasing
abundance as flow decreased in the lower Torrens. It was
absent from areas of higher flow or in the presence of
redfin perch and trout in the upper catchment. It is also another potential population to use as a model
for carp and gambusia interactions in the Murray.
5.1.12. Flathead gudgeon
Flathead gudgeon were the only native species
present at every site and were adaptable to the

McNeil et al. 2011 Fish and EWPs in the WMLR
213
all flow conditions. It appears that this species may benefit from river regulation and degradation, but
habitat complexity and cover remain important. It tolerated poor water quality including high salinity
and low dissolved oxygen conditions. Size frequency analyses indicate that this species may recruit
throughout the year. The main threats to its abundance were predation by redfin perch and
competition and predation by gambusia. Specific management is not required for this common species
but interventions targeted to other species (i.e. reducing the impact of introduced redfin perch and
gambusia and restoration of stream habitats) will also benefit this species. Further research into the
reproductive and recruitment dynamics of this species would be beneficial as a key component of
current ecological structure in WMLR streams.
5.1.13. Dwarf flathead gudgeon
Dwarf flathead gudgeon were only
captured in the Torrens and Onkaparinga
Rivers. This species is potentially a River
Murray translocation, although this
remains unverified, and was present
close to outlets of Murray pipelines in
both rivers. It occupies similar habitats to
the highly tolerant flathead gudgeon, although it was found in higher abundance in the upper reaches
of both rivers. High levels of disease identified in this species may threaten WMLR fishes, particularly
if translocation has occurred. Management should focus on preventing further translocation of this
Murray River species into other streams in the western Mount Lofty Ranges, especially the South Para
River.
5.1.14. Western blue spot goby
This species was captured consistently in low
numbers in the estuarine pool in the
Onkaparinga river and the lower Torrens. It was
tolerant to a broad range of salinities, and it
appears that adults may aggregate in the
estuary in response to freshwater flushes. Key threats remain as the reduced quality of estuarine
habitat, but flows may be essential for triggering spawning aggregations. Further research is required
into general biology, reproductive and recruitment dynamics, distribution and abundance. This species

McNeil et al. 2011 Fish and EWPs in the WMLR
214
would also benefit from further protection of estuarine habitats and restoration of fish passage which
has proved effective in Breakout Creek, restoring this species to that resection of the Torrens.
5.2. Exotic Fishes
5.2.1. Redfin perch
Redfin perch were a common component
of fish assemblages across the WMLR,
particularly in the South Para River, upper
Torrens and Clarendon sites. Redfin perch
were absent from the lower Torrens and
rare in the Onkaparinga except for at
Clarendon Weir. A fierce predator of
native fishes (McDowall 1996) this species
appeared to exclude larger-bodied natives, especially galaxiids, from refuge pools and are likely to
make it difficult for those species to build resilient and viable populations in main channel habitats due
to high levels of predation. A short study was conducted to explore the impact of this species on
flathead gudgeon in the South Para (see Wilson et al 2008) where it was found that diverse prey items
(e.g. Yabbies and water bugs) and harsh summer drying prevented predatory exclusion of native fish
despite high levels of predation. It is important that flow regimes and habitat quality is maintained to
minimize the impact of this species on native fish, however, targeted removal is also recommended.
Caution must be taken not to implement flow regimes (e.g. permanent flow; cool water releases) that
will benefit this species.
5.2.2. Gambusia
Gambusia were widely distributed in the
WMLR. This species is a well established pest
fish that is an aggressive competitor with native
fishes, and commonly dominates shallow and
stable habitats but may be disadvantaged by high flow variability and abundant native fish
assemblages (McNeil 2004, Tonkin et al 2010, McNeil and Schmarr in prep). Accordingly, the species
was absent from the South Para Gorge where extremely high flow velocities occurred prior to surveys
in November 2005. Below the gorge section, however, the species was abundant and connectivity

McNeil et al. 2011 Fish and EWPs in the WMLR
215
provided by constant low flows may facilitate their expansion into the upper reaches. In the
Onkaparinga, abundant native fish populations that included galaxiids, flathead gudgeon, dwarf
flathead gudgeon and congolli were related to lower abundance of gambusia and may provide high
levels of competition. Alternatively, the relatively low abundances of all exotic species through the
lower Onkaparinga may relate more closely to the highly variable flow regime through this gorge
section. For all EWP reaches, it is recommended that highly stable, low flow conditions be avoided,
particularly throughout summer when gambusia populations expand.
5.2.3. Carp
Carp were widespread throughout the Torrens
River and the were found in the Onkaparinga at
Clarendon and South Para below Woodlands
Weir. The highly stable and/or regulated water
regimes in the Torrens are likely to support carp
to a high degree as this species is known to
dominate highly regulated river reaches across south eastern Australia (Gehrke et al. 1995). The
presence of carp below Woodlands Weir serves as a warning that removal of fish passage barriers,
and the provision of more stable flow regimes, may facilitate the movement of this species (as well as
tench and goldfish) into the upper EWP reach in the South Para. Similarly, monitoring in the
Onkaparinga should watch for any expansion of carp in that reach that may result from the delivery of
EWP flows.
5.2.4. Goldfish
Goldfish were scattered throughout lower reaches
of EWP sites, with no goldfish present above Gorge
Weir in the Torrens or Woodlands Weir in the South
Para. Other comments are as for carp, although
potential for ongoing release of this species from the aquarium trade makes it a likely species to
appear regularly in new reaches and catchments despite best management practice for environmental
issues.

McNeil et al. 2011 Fish and EWPs in the WMLR
216
5.2.5. Tench
Tench are patchy and were only found below
Clarendon and Woodlands Weirs. This
introduced fish is likely to have low impact but
may be an indicator of reasonable water
quality. Tench are a documented threat to
native fishes.
5.2.6. Trout
Brown trout and rainbow trout were both
present throughout the mid–upper Torrens
River, predominantly in the Gorge Weir
EWP where they were a dominant
component of the fish fauna. Their impact
on native fauna is likely to be severe as gut
contents found high numbers of native shrimp, fish and Yabbies in all trout sampled. Preferring cool
permanently flowing water, summer low flows are likely to assist in the control of these species, or at
least assist in reducing their impact on native species. Their presence in large pools will likely exclude
native galaxiids which are a primary target prey species (McDowall 2006). Intentional stocking and
translocation of this recreational species provides a threat to native fishes throughout the WMLR,
however it is now illegal for their release in the three target EWP catchments.
5.2.7. Estuarine Fishes
The key species of estuarine fish that were found
to move into freshwater habitats were the black
bream and Tamar goby. Both species moved
into Old Noarlunga Pool 3 after connectivity with
the tidal estuary and persisted in brackish to
fresh conditions, being removed by the subsequent fish kill that occurred in that reach. Both species
should be considered carefully, however when
designing coastal flow volumes, connectivity or
flow regimes

217
5.3. Species Matrix Updates Table 60, A-P. Factors important for maintaining sustainable populations of key fish species of the MLR-model of interactive factors. [No knowledge identified (blank) (2) requires verification for MLR (blue text), (3) low confidence/comprehensiveness (Maroon text), (4) updated information from recent surveys (green text)]
A Life History Stages
Reproduction Recruitment Adult Survival
Pouc
hed
lam
prey
(Geo
tria
aus
tral
is)
Ammocoete larvae burrow into soft substrates and remain for ~3 years. Substrate organic material and chlorophyll related to burrow density.
Marine. Adults die in upstream reaches following spawning.
Food
Environmental Variables
Adults migrate from sea in late winter-summer to spawn in headwater streams. Migration upstream may take up to 16 months. Nests in stony substrates.
Organic material and macrophytes important for burrowing phase. May be restricted to areas of permanent flow and high habitat quality. Migrate downstream to sea, late July after metamorphosis (Feb-July).
Spent adults die in freshwater following spawning. Parasitic phase is unknown, host fish are unknown
Habitat
Temperature influences density of larval burrows. Ammocoetes very tolerant to hypoxia. Intolerant of very high temperatures (30oC+)
Marine
Water Q
uality
Spawning occurs in higher flow headwaters Oct-Nov. Adults may not be able to migrate upstream through extremely turbulent water.
Prefer lower flow habitats for burrows. Marine
Flow
Barriers to upstream migration. Loss/deterioration of upstream spawning sites.
Loss of burrowing habitat. Reduced organic input (riparian vegetation) and macrophytes, increased temperatures around burrowing sites, i.e. Deforestation and flow alteration
Loss of adult marine host species. Survival through upstream spawning migration.
Key Threats
Research Targeted species research: (1) radio tracking of adult upstream migrants to identify instream barriers, spawning sites and larval nests. (2) Assessment of larval nesting habitats, extent and condition. (3) Identify specific target flows and identify barriers for migration. (4) Investigate marine parasitic phase, host species abundances etc. (4) Impact of climate change.
Research Outcomes
• Not captured during surveys, identified during other sampling in Breakout Creek during survey period and should be considered a rare and highly impacted species for the WMLR, or at least for the Torrens catchment.
• Anecdotal evidence collected during survey suggests very high abundance at Breakout Creek in the mid 20th century, of harvestable quantities trapped below weir.
Management (1) Removal of migrational barriers. (2) Environmental flow programs for larval habitat and provision of appropriately timed flows for spring/summer migrations to/from the sea.
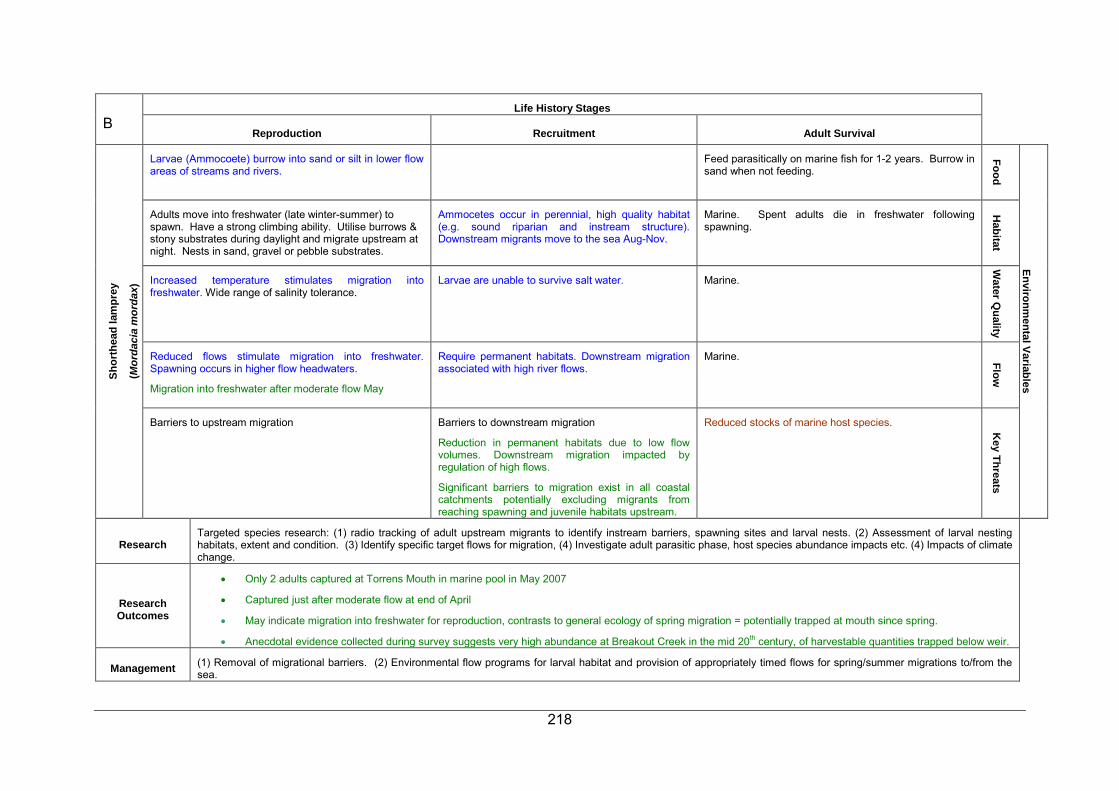
218
B Life History Stages
Reproduction Recruitment Adult Survival
Shor
thea
d la
mpr
ey
(Mor
daci
a m
orda
x)
Larvae (Ammocoete) burrow into sand or silt in lower flow areas of streams and rivers.
Feed parasitically on marine fish for 1-2 years. Burrow in sand when not feeding.
Food
Environmental Variables
Adults move into freshwater (late winter-summer) to spawn. Have a strong climbing ability. Utilise burrows & stony substrates during daylight and migrate upstream at night. Nests in sand, gravel or pebble substrates.
Ammocetes occur in perennial, high quality habitat (e.g. sound riparian and instream structure). Downstream migrants move to the sea Aug-Nov.
Marine. Spent adults die in freshwater following spawning.
Habitat
Increased temperature stimulates migration into freshwater. Wide range of salinity tolerance.
Larvae are unable to survive salt water. Marine.
Water Q
uality
Reduced flows stimulate migration into freshwater. Spawning occurs in higher flow headwaters.
Migration into freshwater after moderate flow May
Require permanent habitats. Downstream migration associated with high river flows.
Marine. Flow
Barriers to upstream migration
Barriers to downstream migration
Reduction in permanent habitats due to low flow volumes. Downstream migration impacted by regulation of high flows.
Significant barriers to migration exist in all coastal catchments potentially excluding migrants from reaching spawning and juvenile habitats upstream.
Reduced stocks of marine host species. Key Threats
Research Targeted species research: (1) radio tracking of adult upstream migrants to identify instream barriers, spawning sites and larval nests. (2) Assessment of larval nesting habitats, extent and condition. (3) Identify specific target flows for migration, (4) Investigate adult parasitic phase, host species abundance impacts etc. (4) Impacts of climate change.
Research Outcomes
• Only 2 adults captured at Torrens Mouth in marine pool in May 2007
• Captured just after moderate flow at end of April
• May indicate migration into freshwater for reproduction, contrasts to general ecology of spring migration = potentially trapped at mouth since spring.
• Anecdotal evidence collected during survey suggests very high abundance at Breakout Creek in the mid 20th century, of harvestable quantities trapped below weir.
Management (1) Removal of migrational barriers. (2) Environmental flow programs for larval habitat and provision of appropriately timed flows for spring/summer migrations to/from the sea.
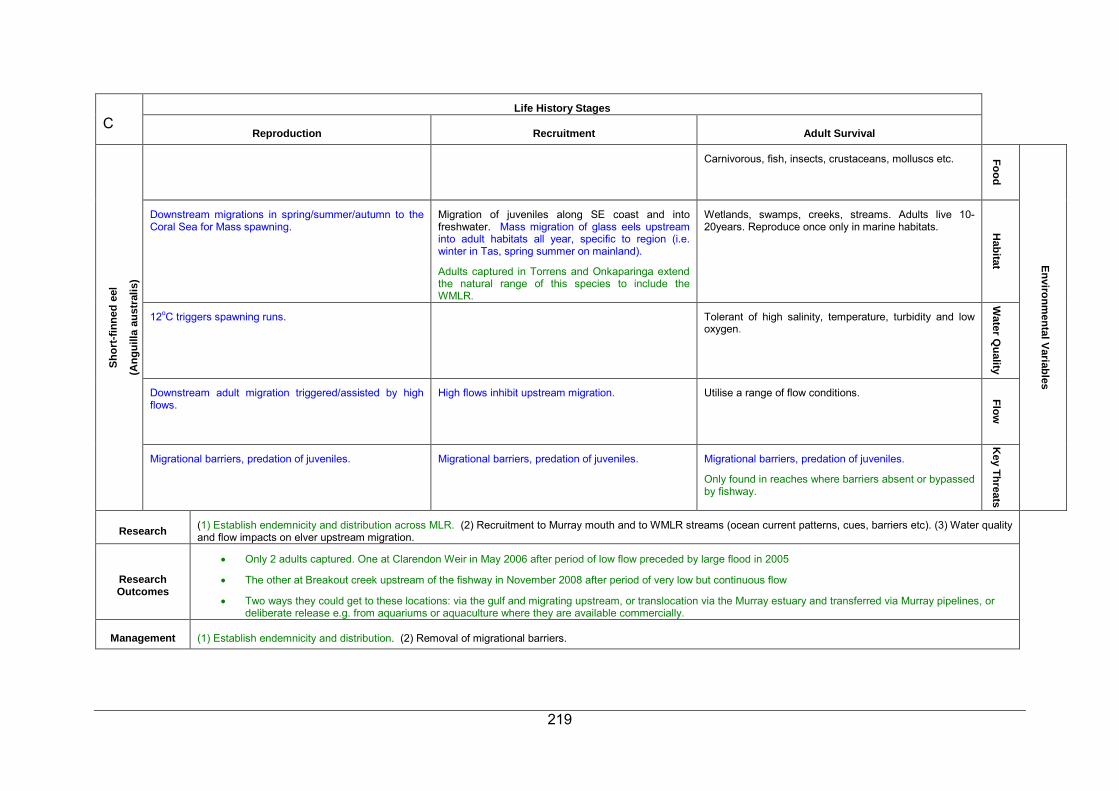
219
C Life History Stages
Reproduction Recruitment Adult Survival
Shor
t-fin
ned
eel
(Ang
uilla
aus
tral
is)
Carnivorous, fish, insects, crustaceans, molluscs etc. Food
Environmental Variables
Downstream migrations in spring/summer/autumn to the Coral Sea for Mass spawning.
Migration of juveniles along SE coast and into freshwater. Mass migration of glass eels upstream into adult habitats all year, specific to region (i.e. winter in Tas, spring summer on mainland).
Adults captured in Torrens and Onkaparinga extend the natural range of this species to include the WMLR.
Wetlands, swamps, creeks, streams. Adults live 10-20years. Reproduce once only in marine habitats. H
abitat
12oC triggers spawning runs. Tolerant of high salinity, temperature, turbidity and low oxygen.
Water Q
uality
Downstream adult migration triggered/assisted by high flows.
High flows inhibit upstream migration. Utilise a range of flow conditions. Flow
Migrational barriers, predation of juveniles. Migrational barriers, predation of juveniles. Migrational barriers, predation of juveniles.
Only found in reaches where barriers absent or bypassed by fishway.
Key Threats
Research (1) Establish endemnicity and distribution across MLR. (2) Recruitment to Murray mouth and to WMLR streams (ocean current patterns, cues, barriers etc). (3) Water quality and flow impacts on elver upstream migration.
Research Outcomes
• Only 2 adults captured. One at Clarendon Weir in May 2006 after period of low flow preceded by large flood in 2005
• The other at Breakout creek upstream of the fishway in November 2008 after period of very low but continuous flow
• Two ways they could get to these locations: via the gulf and migrating upstream, or translocation via the Murray estuary and transferred via Murray pipelines, or deliberate release e.g. from aquariums or aquaculture where they are available commercially.
Management (1) Establish endemnicity and distribution. (2) Removal of migrational barriers.

220
D Life History Stages
Reproduction Recruitment Adult Survival
Fres
hwat
er c
atfis
h
(Tan
danu
s ta
ndan
us)
• Sexual maturity at three years. • Juveniles feed on zooplankton and insect larvae, especially chironomids.
• Benthic carnivores. Eat carp gudgeon, shrimp, molluscs, worms and a wide range of aquatic and terrestrial insects and insect larvae.
Food
Environmental Variables
• Circular nests built into gravel or course sand, often amongst dense macrophyte beds late spring-summer. Nests 0.6-2.0 meters in diameter.
• Juveniles probably remain close to adult habitats, no migrational movements for spawning.
• Juveniles captured in high numbers around aquatic vegetation in restored sections of Breakout Creek in the Torrens.
• Found sluggish waters and lakes, associated with aquatic vegetation. Remain within confined reach as adults. Abundant populations with broad age structure present in sluggish reaches of Breakout Creek around vegetation beds of emergent (Typha, Phragmites) and submerged (Potamageton crispus, Ellodea argentea) macrophytes.
Habitat
• Adults aerate eggs within nests. • Recruitment observed under turbid and warm conditions in larger pools.
• Inhabit turbid streams. Tolerate very high, but not low temperatures. Turbid, warm and possibly polluted water in the lower Torrens highly compatible with catfish.
Water Q
uality
• Rise in flow may induce spawning. Larvae and juveniles caught following freshes in Breakout Creek. If low flows expose nest it is abandoned.
• Best recruitment after period of low flow i.e. winter 2006.
• Utilise low flow habitats. Found in high abundance in low flow habitats in Breakout Creek.
Flow
• Destruction of eggs in nests through water quality or predation of eggs/ larvae. Correlated increase in carp with decrease in catfish.
• Loss of macrophyte cover. Predation of juveniles.
• Translocated populations should not be considered a high priority for species based conservation, but serve as a good indicator species for river health.
• Recreational use in the Torrens observed.
• Loss of macrophyte cover.
• Cold water pollution.
• Potential competition with exotic carp.
• Possible evidence of competition with carp. Good carp recruitment in spring 2007 and 2008, but not good recruitment of catfish.
Key Threats
Research (1) Determine impacts of sedimentation, water quality and predation on eggs in nests. (2) Dependence of larvae and juveniles on macrophytes and related food sources, competition and predation. (3) Impact of flow on spawning and recruitment.
Research Outcomes
• Translocated populations in the Torrens are self-sustaining and abundant.
• Best recruitment after period of low flow i.e. winter 2006.
• Possible evidence of competition with carp. Good carp recruitment in spring 2007 and 2008, but not good recruitment of catfish.
Management Introduced Torrens population ideal study candidate for threatened Murray species, particularly following habitat restoration in Breakout Creek.

221
E Life History Stages
Reproduction Recruitment Adult Survival
Bon
y H
errin
g
(Nem
atal
osa
ereb
i)
Pelagic larvae feed at sea or in lakes. Aquatic & terrestrial invertebrates
Food
Environmental Variables
Omnivorous, algae, insects, crustaceans & detritus. Habitat
Spawn in schools in shallow backwaters in spring and summer. Mature after 1-year high number of small eggs.
Smaller fish in littoral habitats. Open water schools (large masses), lowland rivers and wetlands. Not present in MLR. Identified a single fish in upper Torrens, first record for WMLR.
Water Q
uality
At least 20oC. At least 28oC. Die on mass under low temperatures. Found in cool waters in upper Torrens.
Linked to turbid waters. Up to 38oC. Considered tolerant. Sensitive to cold water. Uncharacteristically upland habitat below Gumeracha weir, and one off single individual from intense sampling, suggests a very recent arrival via pipeline, possibly not self sustaining in such cool upper reaches.
Flow
Larvae found in backwaters and fast flowing anabranches.
Schools in moderately flowing or still waters.
Key Threats
Research (1) Spawning behaviour, habitats, (2) Water quality tolerance of adults, eggs and larvae (3) Role within riverine food webs-importance as a food source for cod, callop, cormorants, pelicans etc.
Research Outcomes
• First record for WMLR identified
• New translocation into Upper Torrens, probably through Water pipeline.
Management
• Do well under current management in Murray.
• Identify translocation pathway and consider modifications to water transfer infrastructure to prevent future translocations by this pathway.
• Monitor for further translocation and establishment of population in Torrens especially in the calmer waters of the lower Torrens catchment.

222
F Life History Stages
Reproduction Recruitment Adult Survival
Clim
bing
gal
axia
s
(Gal
axia
s br
evip
inni
s)
Pelagic larvae feed at sea or in lakes. Aquatic & terrestrial invertebrates
Food
Environmental Variables
Adults migrate to estuaries to spawn, upstream into tributaries in lakes during autumn-winter. Marine (lacustrine) following hatching. Stay at sea for 6 months. No spawning aggregations or ripe adults encountered in near coastal reaches.
Running ripe adults found in riffle habitat in the mid Torrens in May, suggests likely spawning location.
Migration upstream from the sea or lakes landlocked populations. Enter stream mouths on rising tides after ~6months during spring. No juveniles observed moving into coastal rivers during survey. Very few juvenile individuals found in mid reaches of Torrens and Onkaparinga sites.
• Prefer flowing rocky or silt based pools and riffles. Prefer good riparian vegetation and stream canopy. Most abundant in flowing riffles and runs associated with dense, well structured native riparian vegetation communities (redgum, bottlebrush, wattle, tea trees, grasses etc.) in Upper Torrens.
• Likely to be confined largely to upper tributary streams in the WMLR.
Habitat
Migrating juveniles will avoid high turbidity. (BDWD) Prefer cooler temperatures. Data deficient. Captured predominantly in cooler upland reaches of the Torrens.
Water Q
uality
Spawn during high flow events in flooded estuaries-tributaries. Eggs laid on banks above limits of regular stream flow.
Connectivity required in spring–summer for larvae and juveniles re-entering freshwater. Can overcome barriers to migration such as weirs, falls etc.
Prefer lower flows when predation is absent. Not found in larger pools that were dominated by redfin perch and trout, despite being present in intervening riffles during flows.
Flow
Riparian vegetation removal. Association with riparian vegetation in WMLR supports this hypothesis.
• Predation and habitat restriction in prime habitats by redfin perch and trout.
• Barriers to adult and juvenile migration
• Predation and habitat restriction in prime habitats by redfin perch and trout.
• Removal of flowing riffle reaches due to insufficient flow releases.
Key Threats
Research (1) Assessment of local species biology: [(a) Identify distribution in MLR (b) Identify spawning sites, habitat requirements, timing & behaviours for MLR (assess landlocked populations and use of MLR reservoirs for spawning) (c) Assess timing and duration of flows for spawning and recruitment/migration (landlocked and sea-run) (e.g. does diadromy still exist in the MLR)]. (2) Impacts of climate change.
Research Outcomes
• Limited distribution in upper reaches of Onkaparinga and Torrens
• Loss of riffle habitat due to flow restriction
• Not captured at downstream sites, very few juveniles captured at sites with access to marine habitats, assumed to be predominantly landlocked in WMLR.
• Very low abundance or absent when trout and redfin perch are present
Management (1) Promote research. (2) Removal of instream barriers/restoration of estuarine linkages. (3) Protection/restoration of instream and riparian habitat. (4) Environmental flows for spawning and migration.

223
G Life History Stages
Reproduction Recruitment Adult Survival
Com
mon
gal
axia
s
(Gal
axia
s m
acul
atus
)
Feed at sea. Pelagic larvae. Cease feeding during inland migration. Resume feeding in freshwater after reaching adult habitat
Benthic and drift feeders, insects, crustaceans & molluscs, some surface animals.
Food
Environmental Variables
Adults move down to estuaries to spawn during autumn. Landlocked populations may use large lakes in a similar manner and move upstream into tributaries to spawn in groups of 2-4. Eggs laid on bank vegetation in estuaries or tributary streams (landlocked).
Larvae will live in marine habitats for 5-6 months before re-migrating to adult habitats as whitebait
Found at lower elevations. Adults are found in streams, rivers and wetlands Can survive in small pools largely bereft of structure (apart from benthic interstices) over summer. Survival to spawning needs to be 1, 2 or 3 years, adults usually die after spawning.
Habitat
Eggs tolerate wide range of salinity and temperature. Migrating juveniles will avoid high turbidity. Relatively tolerant to wide ranges in salinity, temperature, oxygen & turbidity. Preference for temperatures around 20oC.
Water Q
uality
Connectivity between freshwater and marine habitats is required during spawning period. Larvae carried out to sea/lakes in floodwaters. Reproduction timed with moon phase and tidal patterns. Eggs left on exposed vegetation in first flood/high tide and require a second inundation of bank vegetation. Eggs hatch on re-immersion.
Connectivity between freshwater and marine habitats is required during spring when juveniles migrate upstream. Larvae utilise high flows and associated chemical cues to select rivers for re-entry to freshwater in shoals during high tide in daylight. Juveniles can migrate under high flow velocities and will use fishways and ramps. (Davies et al. 2003)
Adults require refuge pools with reasonable water quality to persist over summer. Flow
No connectivity between marine and freshwater habitats. No connectivity between marine and freshwater habitats. Predation in prime habitats, desiccation of refuge riffles.
Key Threats
Research (1) Investigate impact of barriers and use of fishways (2) Determine spawning & migration patterns for MLR. (3) General biology such as determined length-age relationships.
Research Outcomes
• Woodlands Weir on South Para and Torrens Weir barriers to upstream movement
• Declining abundance with declining flow and lack of spring connectivity in Onkaparinga
• Recruitment to lower reaches in spring
• Difficult to quantify contribution of WQ to decline. Fish absent from lower Onkaparinga pool when WQ unsuitable.
• Fishway at Torrens mouth effective for fish passage but numerous other barriers exist in Torrens for movement to upstream habitat
Management (1) Removal of instream barriers/restoration of estuarine linkages and lowland stream habitat. (2) Provision of autumn/spring flows reaching the sea to facilitate spawning and larval recruitment including migration.

224
H Life History Stages
Reproduction Recruitment Adult Survival
Mou
ntai
n ga
laxi
as
(Gal
axia
s ol
idus
)
Aquatic insects, crustaceans, molluscs, worms, spiders.
Food
Environmental Variables
Adults (1+) may move upstream toward headwaters to spawn in winter-spring but possibly all year round. Eggs are laid around adult habitat beneath rocks. Larvae persist in adult habitats.
(Possibly paired mating units??). Male and Female pairs captured in Sth. Para and Onkaparinga during electrofishing.
Juveniles recruited direct to adult habitats. Movement is restricted to small local ranges. Recruitment events observed in Torrens and Onkaparinga around habitats where adults caught in low numbers during the current or previous season. Little recruitment observed outside of areas where adults caught.
Adults survive within small pools and riffles where trout & redfin perch are absent. Found in low numbers in pools with redfin perch and trout, put usually on margins or in runs/riffles.
Associated with riparian vegetation and instream habitat, leaf litter, debris, macrophytes and cobbles. Highest abundances in cobbled and rocky streams with reasonable riparian condition.
Can persist in larger pools released from predation in ephemeral streams with little structural habitat.
Habitat
High quality flowing water was present for all recruitment sites and events.
Can tolerate moderately high and very low temperatures and poor water quality (fatal to trout). Data deficient (e.g. no temperature or oxygen upper limits known). Predominantly good water quality where caught, not found in harsh shrinking pools during drought, possibly due to redfin perch presence..
Water Q
uality
Ripe adults observed during moderate flows. Recruitment seasonal following winter flows with higher abundances following good spring flows.
Prefer more permanent flowing water or pools with good water quality. Some populations appear to prefer high flow-riffle habitats. Caught almost exclusively in flowing reaches.
Flow
Siltation, reduced leaf litter (riparian deforestation), loss of riffle habitats resulting from flow modification.
Predation of recruits to prime habitats such as larger pools. Recruitment not observed in pools where predatory redfin perch and trout were caught.
Habitat restricted by predation. Loss of riffle habitats due to flow regulation. Clearing of riparian vegetation. Predation by trout and redfin perch. Siltation of rocky and cobbled substrates due to erosion or turbid water transfers via Murray pipelines.
Key Threats
Research (1) Determine distribution, taxonomic status and genetic uniqueness of different populations. (2) Undertake research on local biology, especially (a) flow relationships for spawning and recruitment and (b) juvenile and adult tolerances. (3) Impacts of climate change. (4) Assess predation impacts.
Research Outcomes
• Good recruitment every spring at Brooks Road despite low numbers of adults. Good recruitment in 2/3 springs at Clarendon despite no adults captured
• Redfin perch a major predator on mountain galaxias in all rivers
• Low flows reduced availability of small pools and riffles where redfin perch and trout are usually absent. Therefore reduced habitat and increased interaction with predators.
Management (1) Promote research on biology and environmental relationships (2) Reduce predation impacts in larger streams (3) maintain/enhance habitat values in headwater streams (4) Restoration of lowland stream reaches (i.e. Lower Onkaparinga/tributaries)

225
I Life History Stages
Reproduction Recruitment Adult Survival
Mur
ray
rain
bow
fish
(Mel
anot
aeni
a flu
viat
ilis)
Aquatic insects, crustaceans, molluscs, worms, spiders.
Food
Environmental Variables
Eggs laid on macrophytes Oct-Jan. Recruit successfully to adult habitats associated with lowland reaches and macrophyte beds (emergent and submerged)
Lower Flowing lowland Rivers around macrophyte beds and wetlands. Associated with thick vegetation and habitat complexity. High abundances in Torrens around low flowing, warm reaches around macrophyte beds.
Pelagic schooling <30 individuals.
Habitat
Aquatic macrophytes. Larvae attach to plants before free swimming.
Larvae found in weir pools, flowing creeks and shallow ponds. Recruitment occurred in turbid water, warm temperatures <28oC and very high salinity.
Prefer clear water, low flow and sunlight. Tolerant of turbid water, warm temperatures <28oC and very high salinity.
Water Q
uality
Warming of shallow floodwaters implicated in spawning initiation. Eggs and fry tolerant of high salinity.
<28oC. Moderately salt tolerant. Cold water pollution results in fungal and bacterial infections. Avoid murky water. .
Flow
Low flow. Consistent recruitment in low-flow warm summer conditions
Not Avoid fast flowing waters. Prefer backwaters, billabongs and wetlands.
Key Threats
Research (1) Interactions with other species, native and introduced.
Research Outcomes
• Abundant translocated populations present in the Lower Torrens and Breakout Creek in association with other translocated Murray species (freshwater catfish, carp gudgeon).
• Tolerant of poor WQ in still murky water of lower Torrens and high salinity at estuarine pool on one occasion
• Consistent recruitment in low-flow warm summer conditions
Management Translocated species in Torrens and should not be considered a conservation priority in the WMLR. Translocation impacts within the MLR. Is Control required?

226
J Life History Stages
Reproduction Recruitment Adult Survival
Smal
lmou
thed
har
dyhe
ad
(Ath
erin
osom
a m
icro
stom
a)
Small crustaceans and insects.
Food
Environmental Variables
Submerged structures and macrophytes. New recruits found in October. Mostly estuarine, will inhabit coastal lakes and lagoons. Form large schools. Associated with macrophyte beds (especially Zostera). Life cycle probably only 1 year.
Only found in estuarine reaches of Onkaparinga and Torrens
Habitat
Supposedly intolerant of freshwater but found in freshwater habitats.
Water Q
uality
Flow
Destruction of estuarine habitats (i.e. Murray Estuary). Destruction of estuarine habitats Destruction of estuarine habitats (i.e. Murray Estuary).
Very limited estuarine habitat in Torrens
Key Threats
Research (1) Interactions with other species, native and introduced. (2) The importance or impacts of freshwater flow inputs into the ecology of estuarine species and ecosystems in the WMLR.
Research Outcomes (1) Investigate use of and distribution within freshwater habitats. (2) Determine the impact of the loss of estuarine habitat on the species.
Management Only found in estuarine pools of Onkaparinga and Torrens. Very limited estuarine habitat in Torrens where most were captured in one survey in autumn 2008. Estuarine and freshwater linkages may be critical to sustaining these and other estuarine species.

227
K Life History Stages
Reproduction Recruitment Adult Survival
Con
golli
(Pse
udap
hriti
s ur
vilii
)
Juvenile galaxias and shrimp.
Food
Environmental Variables
Females reproduce ~ 4-6 years old. Spawning takes place around estuaries-marine habitats in August-October (although observed spawning in May in the Onkaparinga 2006). Males present around estuary and lower stream reaches.
• In some seasons, ripe males and females both caught in freshwater habitats in spawning condition in lower Onkaparinga.
• Disappear from Torrens estuary following high flows with subsequent recruitment of juveniles and return of adults.
• Juveniles remain around tidal zone for 9-12 months and gradual move upstream in spring-summer.
• Recruitment observed through the Torrens fishway into freshwater habitats of Breakout creek.
• No recruitment observed for translocated populations (above woodlands weir with no upstream access to the sea) in the South Para River. Landlocked populations therefore not viable.
Prefer slower flowing waters with general habitat preferences. Male-female habitat separation. Males remain around estuaries with females utilising lowland freshwater habitats (decreasing upstream).
Habitat
Tolerant of salt and fresh water Tolerant of salt and fresh water. Found under both conditions in lower Onkaparinga and Torrens.
Tolerant of salt and fresh water, utilise low water quality habitats.
Collapse of water quality in lower Onkaparinga following marine incursion and hypoxia resulted in loss of congolli and large fish kill.
Water Q
uality
High flow induces downstream migration of females to estuaries in April-July. Males move into estuarine fringes away from freshwater flow influence.
Low flows stimulate upstream migration of juveniles. Prefer slower flows, limited ability for dealing with high velocity flows.
Flow
Removal of connectivity between freshwater and estuarine habitats. Recruitment observed following higher flows. Flows essential for breeding, reconnecting males with females.
Loss of connectivity between freshwater and estuarine habitats.
Desiccation of lowland freshwater reaches will remove females.
Key Threats
Research (1) Research on biology – identify spawning behaviour/biology, migration, habitat requirements and flow requirements in MLR (2) Identify population structure and habitat use for males versus females (3) Assess their use of fishways and swimming ability.
Research Outcomes
• Consistent recruitment of juveniles in spring at downstream sites in Onkaparinga and Torrens, but not at all in South Para. Barriers to juvenile movement upstream or females not moving downstream to spawn.
• Lowest Onkaparinga site has become more marine over time and resulted in more juveniles captured there
• Poor WQ at Onkaparinga pool 3 has little effect on Congolli except for the large fish kill event which removed all fish following hypoxic marine incursion event.
Management (1) Removal of instream barriers/restoration of estuarine linkages. (2) Restoration of lowland stream reaches (i.e. Lower Torrens/Break Out Creek).
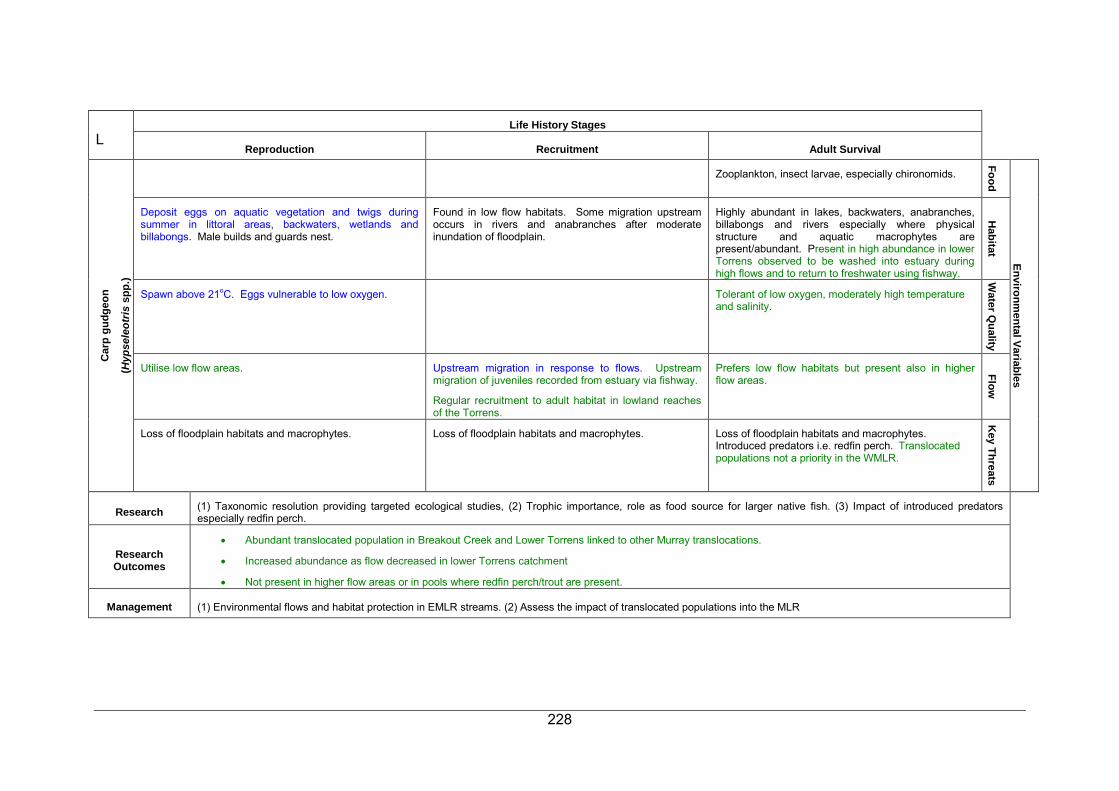
228
L Life History Stages
Reproduction Recruitment Adult Survival
Car
p gu
dgeo
n
(Hyp
sele
otris
spp
.)
Zooplankton, insect larvae, especially chironomids.
Food
Environmental Variables
Deposit eggs on aquatic vegetation and twigs during summer in littoral areas, backwaters, wetlands and billabongs. Male builds and guards nest.
Found in low flow habitats. Some migration upstream occurs in rivers and anabranches after moderate inundation of floodplain.
Highly abundant in lakes, backwaters, anabranches, billabongs and rivers especially where physical structure and aquatic macrophytes are present/abundant. Present in high abundance in lower Torrens observed to be washed into estuary during high flows and to return to freshwater using fishway.
Habitat
Spawn above 21oC. Eggs vulnerable to low oxygen. Tolerant of low oxygen, moderately high temperature and salinity.
Water Q
uality
Utilise low flow areas. Upstream migration in response to flows. Upstream migration of juveniles recorded from estuary via fishway.
Regular recruitment to adult habitat in lowland reaches of the Torrens.
Prefers low flow habitats but present also in higher flow areas.
Flow
Loss of floodplain habitats and macrophytes. Loss of floodplain habitats and macrophytes. Loss of floodplain habitats and macrophytes. Introduced predators i.e. redfin perch. Translocated populations not a priority in the WMLR.
Key Threats
Research (1) Taxonomic resolution providing targeted ecological studies, (2) Trophic importance, role as food source for larger native fish. (3) Impact of introduced predators especially redfin perch.
Research Outcomes
• Abundant translocated population in Breakout Creek and Lower Torrens linked to other Murray translocations.
• Increased abundance as flow decreased in lower Torrens catchment
• Not present in higher flow areas or in pools where redfin perch/trout are present.
Management (1) Environmental flows and habitat protection in EMLR streams. (2) Assess the impact of translocated populations into the MLR

229
M Life History Stages
Reproduction Recruitment Adult Survival
Flat
head
gud
geon
(Phi
lypn
odon
gra
ndic
eps)
Egg clusters attached to structure and guarded/fanned by males.
Larvae are facultative drifters recruiting direct to adult (low flow) habitats.
Adults are predominantly benthic and widely distributed in slower flowing pools, runs, estuaries and wetlands. Emerge from cover (rocks/vegetation) after dark.
Food
Environmental Variables
Recruitment occurred throughout most of the year in the Torrens
May be favoured by habitat degradation, but habitat complexity important.
Habitat
Some recruitment variability at large scales, may not recruit well in high flows.
• Prefers low flow habitats.
• Will persist in low water quality habitats
• Tolerant of high temp & salinity and low O2
Water Q
uality
Predation by redfin perch, competition & predation with gambusia.
• Predation by redfin perch, competition & predation with gambusia.
• Predation by redfin perch found to be ameliorated by poor water quality impacts on redfin perch and trout and relatively intolerance to seasonal harshness.
• Alternative food items such as yabbies, bugs and shrimp also relieve [predation pressure, at least in the South Para (Wilson et al. 2008).
• Predation by redfin perch, desiccation of refuge pools or removal of refuge habitats.
• May be favoured by river regulation and resultant stability.
Flow
Egg clusters attached to structure and guarded/fanned by males.
Larvae are facultative drifters recruiting direct to adult (low flow) habitats. Post-Larvae observed floating around banks through rock and tree root habitat in the South Para.
Adults are predominantly benthic and widely distributed in slower flowing pools, runs, estuaries and wetlands. Emerge from cover (rocks/vegetation) after dark. Appear tolerant of impacts of river regulation and habitat degradation. Abundances appear higher than suggested historically (Scott 1962).
Key Threats
Research (1) Assess general biology, habitat use, spawning and feeding ecology (2) Investigate impact of predation
Research Outcomes
• Common and abundant throughout the WMLR regardless of habitat or flow conditions.
• Abundance directly impacted by redfin perch juveniles, but not as much by larger adult redfin perch
• Seem to be able to recruit at any time of year
• Tolerant of higher salinity in estuarine pool in Onkaparinga
Management (1) Reduce impact of predation (2) Restoration of stream habitats

230
N Life History Stages
Reproduction Recruitment Adult Survival
Dw
arf f
lath
ead
gudg
eon
(Phi
lypn
odon
mac
rost
omus
)
Food
Environmental Variables
Pools or low flow areas in streams and wetlands. Often found near emergent macrophytes on mud, silt or rocky substrates.
Habitat
Utilise similar habitats to the highly tolerant P. grandiceps.
Water Q
uality
Abundance in Onkaparinga peaked following the high flow season of Spring 2005 with high abundance, reducing over consecutive years of drought.
Seem to prefer lower flow habitats such as pools.
Flow
Predation by redfin perch, competition & predation with gambusia
Predation by redfin perch, competition & predation with gambusia
Predation by redfin perch, desiccation of refuge pools or removal of refuge habitats.
Key Threats
Research (1) Assess the endemnicity of this species to MLR (i.e. possibly translocation via Murray pipeline) (2) Assess general biology, habitat use, spawning and feeding ecology
Research Outcomes
• Only found in Torrens and Onkaparinga
• Similar habitats to P. grandiceps, but only found in upper catchment of Torrens and more prevalent in upstream sites of Onkaparinga.
• These pattern support possible translocation through Murray water pipelines that empty into those river channels upstream of both sites.
• Tolerant of higher salinity in estuarine pool in Onkaparinga except for extreme salinity and poor WQ in Autumn 2008.
Management (1) Restoration of stream habitats (2) Reduce translocation potential from inter-basin pipelines.

231
O Life History Stages
Reproduction Recruitment Adult Survival
Wes
tern
blu
e sp
ot g
oby
(Pse
udog
obiu
s ol
orum
)
Food
Environmental Variables
Spawns in upper reaches s of estuary in brackish water. Spawn in early-late spring laying eggs beneath solid structure, male guards nest.
Estuaries and coastal lakes and wetlands, associated with abundant macrophytes. Occurs inland in the North Para system. Benthic on muddy or rocky substrates. Also present in the freshwater reaches of the Lower Torrens at Breakout creek and the Onkaparinga near Old Noarlunga. Possible recolonisation following Torrens fishway.
Habitat
Can tolerate fresh and saline water.
Broad salinity tolerance (1.8-50 mS), appear to prefer saline reaches in the Onkaparinga.
Water Q
uality
Adults aggregate in estuary in response to flow
Flow
Reduced quality of estuarine areas. Loss of permanent pool habitats in North Para (e.g. decline in the condition and pool permanency of Walker Creek)
Key Threats
Research (1) General biology and life history, abundance and distribution
Research Outcomes
• Low numbers captured consistently in lowest of the Onkaparinga sites near estuary
• Broad salinity tolerance (1.8-50 mS)
• Large numbers captured once at Torrens mouth in spring 2006, 2 weeks after a small flushing flow.
Management (1) Protect inland habitat in North Para Catchment, (2) Maintain connectivity between lower Torrens/Onkaparinga and marine habitats – restore estuary for Torrens River.

232
P Life History Stages
Reproduction Recruitment Adult Survival
Lago
on g
oby
(Tas
man
ogob
ius
last
i)
Food
Environmental Variables
Spawns in estuaries, probably beneath structures. Estuaries and coastal lakes and wetlands, benthic on sandy or rocky substrates.
Habitat
Water Q
uality
Flow
Key Threats
Research (1) General biology and life history, abundance and distribution (2) Assesses and determine presence in WMLR (e.g. confirm unverified records from Patawalonga Creek)
Research Outcomes • Not captured at survey sites.
Management Restore and protect estuarine habitat

233
6. REFERENCES
Bald M., Scholz G. (2007b) The process of determining environmental water requirements for the western Mount Lofty Ranges. The Department of Water, Land and Biodiversity Conservation.
Bardsley, D. (2006). There's a change on the way - An integrated assessment of projected climate change impact and adaptation options for natural resource management in the Adelaide and Mount Lofty Ranges region. DWLBC Report 2006/06, Government of South Australia, through the Department of Water and Land Biodiversity Conservation.
Blanch, S.J., Ganf, G.G., Walker, K.F. (1999). Tolerance of riverine plants to flooding and exposure indicated by water regime. Regulated Rivers Research and Management. 15: 1-3. pp43-62.
Bond N., Lake P., Arthington A. (2008) The impacts of drought on freshwater ecosystems: an Australian perspective. Hydrobiologia 600(1),3-16.
Bray, J.R. and Curtis, J.T. (1957). An ordination of the upland forest communities of southern Wisconsin. Ecological Monographs 27: 325-349.
Bunn S., Arthington A. H. (2002) Basic principles and ecological consequences of altered flow regimes for aquatic biodiversity. Environmental Management 30,492-507.
Costelloe, J. F., Reid, J. R. W, Pritchard, J. C., Puckridge, J. T., Bailey, V. E. and Hudson, P. J. (2010) Are alien fish disadvantaged by extremely variable flow regimes in arid-zone rivers? Marine and Freshwater Research. 61, 857–863
Closs G. E., Lake P. S. (1996) Drought, differential mortality and the coexistence of a native and an introduced fish species in a south east Australian intermittent stream. Environmental Biology of Fishes 47(1),17-26.
Davies B., Hall K., Oborne J., Versteegh B. (2003) Fishway design for the Torrens Outlet Weir. Fourth Year Research Project Thesis, University of Adelaide, Adelaide
Gatti S., Hill P., Smith S. (2005) Where’s the water going to come from? Environmental flows for the Onkaparinga River and estuary. . Onkaparinga Catchment Water Management Board, Adelaide, South Australia. Pp 11.
Gehrke, P. C., Brown, P., Schiller, C. B., Moffat, D. B., Bruce, A. M. (1995) River regulation and fish communities in the Murray-Darling river system, Australia. Regulated Rivers: Research and Management. 11 363-375.
Gehrke, P. C., Revell, M. B. and Philby, A. W. (1993) Effects of river redgum Eucalyptus camaldulensis, litter on golden perch, Maquaria ambigua. Journal of fish Biology, 43, 265-279.
Gray S., Howell S., Maxwell S. (2005) Ecological Survey of the Torrens River Wetlands at Breakout Creek and within the Horse Agistnment Area: Intergrated report to the Torrens Catchment Water Management Board. Australian Water Quality Centre, Bolivar.
Hammer M. (2005) Adelaide Hills Fish Inventory: distribution and conservation of freshwater fishes in the Torrens and Patawalonga catchments, South Australia. Report to the Torrens and Patawalonga Catchment Water Management Boards. Native Fish Australia (SA) Inc., Adelaide. pp 44.

234
Hammer M. (2006) Review of fishes in the Onkaparinga Estuary, South Australia. . Aquasave, Adelaide. p9.
Hammer M., Walker K. F. (2004) A catalogue of South Australian freshwater fishes, including new records, range extension and translocations. Transactions of the Royal Society of South Australia 128,85-97.
Hicks D., Hammer M. (2004) Investigation of the impact of barriers on indigenous fish in the River Torrens Catchment: Literature.
Hicks D., Sheldon F. (1998) Biotic Survey of the Wakefield River, for the Mid North Riverine Management Planning Project. Report to the South Australia Department for Environment, Heritage and Aboriginal Affairs. Department of Zoology, University of Adelaide, Adelaide. p64.
Hicks D., Sheldon F. (1999a) Biotic Survey of the Broughton River, for the Mid North Riverine Management Planning Project. Report to the South Australia Department for Environment, Heritage and Aboriginal Affairs. Department of Zoology, University of Adelaide, Adelaide. p71.
Hicks D., Sheldon F. (1999b) Biotic Survey of the Gawler River, for the Mid North Riverine Management Planning Project Report to the South Australia Department for Environment, Heritage and Aboriginal Affairs. University of Adelaide, Adelaide. p90.
Hicks D., Sheldon F. (1999c) Biotic Survey of the Light River, for the Mid North Riverine Management Planning Project Report to the South Australia Department for Environment, Heritage and Aboriginal Affairs. Department of Zoology, University of Adelaide, Adelaide. p68.
Hoese D. F., Reader S. (2006) Description of a new species of Dwarf Philypnodon (Teleostei: Gobidae: Eleotridae) from south-eastern Australia. Memoirs of Museum Victoria 63(1),15-19.
Holmes J. W., Iverson M. B. (1976) Hydrology of the Cowandilla Plains, Adelaide, Before 1836. In 'Natural History of the Adelaide Region.' (Eds C. R. Twidale, M. J. Tyler and B. P. Webb). (Royal Society of South Australia: Adelaide)
Kawalec R., Roberts S. (2005) Review of South Australian State Agency Water Monitoring Activities in the Onkaparinga Catchment. South Australian Department of Water, Land and Biodiversity Conservation: 129.
Lake P. S. (2003) Ecological effects of perturbation by drought in flowing waters. Freshwater Biology 48(7),1161-1172. (doi:10.1046/j.1365-2427.2003.01086.x).
Lintermans M., Cottingham P. (2007) Fish out of water – lessons for managing native fish during drought. Murray-Darling Basin Commission, Canberra, Australia.
Lloyd L. (2000) Environmental water requirements & ecology of the Broughton River, S.A. Report to the South Australian Department of Environment and Heritage.
Lloyd L. N. (2001) Environmental water requirements & ecology of the Light River, S.A. Report to the South Australian Department of Environment and Heritage.
Lloyd N., Quinn G., Thoms M., Arthington A., Gawne B., Humphries P., Walker K., (2003) Does flow modification cause geomorphological and ecological response in rivers? A literature review from an Australian perspective. CRC for Freshwater Ecology, No. Technical report 1/2004.
Mackay, S., Pikusa, E., Arene, S., Edwards, C., Fee, B., Gabas, I., McEvoy, P., McNeil, D., Metzeling, L., Marsh, N., Rooney, G. and Williams, T. (2008). Application of the Ecological Modeller Software Tool to the Werribee River (Victoria) and Onkaparinga River (South Australia). Final Application Project Report. eWater CRC. Canberra. Pp95.

235
Marchetti M. P., Esteban E., Limm M., Kurth R. (2004) Evaluating aspects of larval light trap bias and specificity in the Northern Sacramento River system: do size and color matter. American Fisheries Society Symposium 39,269-279.
Mathews G, Walker G, Mathwin R, Hammer M (2004) Spring tides, galaxias and the River Torrens, South Australia. Fishes of Sahul 19,177-186
McCune, B. and Mefford, M.J. (2006). PC-ORD. Multivariate Analysis of Ecological Data, Version 5.12. (MjM Software Design: Glenden Beach, Oregon, USA).
McDowall R. M. (1988) 'Diadromy in fishes; migrations between freshwater and marine environments.' (Timber Press: Oregon, United States of America)
McDowall, R. M. (2006) Crying wolf, crying foul, or crying shame: alien salmonids and a biodiversity crisis in the southern cool-temperate galaxioid fishes? Reviews in Fish Biology and Fisheries. 16, 233-422.
McInnes, K. L., Suppiah, R., Whetton, P. H., Hennessy, K. J., and Jones, R. N. (2003). Climate change in South Australia. Report on: assessment of climate change, impacts and possible adaptation strategies relevant toSouth Australia. Undertaken for the South Australian Government by the Climate Impact Group, CSIRO Atmospheric Research, Aspendale, Victoria. p. 61.
McNeil D. G. (2004) Ecophysiology and behaviour of Ovens River floodplain fish: hypoxia tolerance and the role of the physicochemical environment in structuring Australian billabong fish communities. PhD Thesis, LaTrobe University, Melbourne, Australia
McNeil D. G., Closs G. P. (2007) Behavioural responses of a south-east Australian floodplain fish community to gradual hypoxia. Freshwater Biology 52, 412–420.
McNeil D. G., Hammer M. (2007) Biological review of the freshwater fishes of the Mount Lofty Ranges. South Australian Research and Development Institute (aquatic sciences), Adelaide. 104pp., No. Publication number: F2006/000335.
McNeil D. G., Fredburg J., Wilson P. J. (2009) Coastal Fishes and Flows in the Onkaparinga and Myponga Rivers. Report to the Adelaide and Mount Lofty Ranges Natural Resource Management Board. South Australian Research and Deevloment Institute, Aquatic Sciences., No. SARDI Publication number F2009/000410-1 76pp.
McNeil, D.G and Schmarr, D.W. (2009) Recovery of Lake Eyre Basin Fishes Following Drought: 2008/09 Fish Survey Report. South Australian Research and Development Institute (Aquatic Sciences), Adelaide, 61pp. SARDI Publication No. F2009/000407-1. SARDI Research Report Series No. 411.
McNeil D. G., Westergaard S., Ye Q. (2010a) Chapter 2. Juvenile salinity tolerance of eight native fish species from the Lower River Murray, South Australia. In influences of salintiy, water quality and hydrology on the early life stages of fishes in the Lower River Murray, South Australia. In 'Influences of salinity, water quality and hydrology on early life stages of fishes in the Lower River Murray, South Australia.' (Eds Q. Ye, K. J. Cheshire and D. G. McNeil) pp. 48-72. (South Australian Research and Development Institute (SARDI), Aquatic Sciences: Adelaide, Australia)
McNeil D. G., Wilson P. J., Fredburg J., Westergaard S. (2010b) Fish Passage at the Breakout Creek Fishway, River Torrens, South Australia. Report to the Adelaide and Mount Lofty Ranges Natural Resources Management Board. South Australian Research and Development Institute (Aquatic sciences) Adelaide. SARDI Publication no. F2009/000409-1. SARDI Research report series no. 440. 25p.

236
McNeil D.G., Alton L.A., Westergaard S. & Ye Q. (2010c) Chapter 3. Larval salinity tolerance of nine native fish species from the Lower River Murray, South Australia. In Influences of salinity, water quality and hydrology on early life stages of fishes in the Lower River Murray, South Australia. (Eds Q. Ye, K.J. Cheshire and D.G. McNeil) pp. 73-102. South Australian Research and Development Institute (Aquatic Sciences), Adelaide. SARDI Publication No. F2009/000470-3. SARDI Research Report Series No. 446.
McNeil D.G., Westergaard S. & Ye Q. (2010d) Chapter 4. The impact of salinity on egg development of four species of native fish from the Lower River Murray, South Australia. In Influences of salinity, water quality and hydrology on early life stages of fishes in the Lower River Murray, South Australia. (Eds Q. Ye, K.J. Cheshire and D.G. McNeil) pp. 103-127. South Australian Research and Development Institute (Aquatic Sciences), Adelaide. SARDI Publication No. F2009/000470-4. SARDI Research Report Series No. 446.
McNeil, D. G, Wilson, P. J, Fredberg, J. F & Westergaard, S. (2010e) Fish Passage at the Breakout Creek Fishway, River Torrens, South Australia. Report to the Adelaide & Mount Lofty Ranges Natural Resources Management Board, South Australian Research Development Institute (Aquatic Sciences) Adelaide. SARDI Publication No. F2009/000409-1. SARDI Research Report Series No. 440.
McNeil, D. G., Hartwell, D., Conallin, A. J., and Stuart, I. G. (2011a) Baseline trials of carp control technologies in wetlands of the lower Lachlan River. A report to the Lachlan Catchment Management Authority and the Invasive Animals Cooperative Research Centre. South Australian Research and Development Institute (Aquatic Sciences), Adelaide. SARDI Publication No. F2010/000615-1; SARDI Research Report Series No. 516. 54pp.
McNeil, D. G., Gehrig S. L., Sharpe C. (2011b) Resistance and Resilience of Murray-Darling Basin Fishes to Drought Disturbance. . Draft report to the Murray-Darling Basin Authority. South Australian Research and Development Institute (Aquatic Sciences), Adelaide, 121pp.
Meffe, G.K. (1984) Effects of abiotic disturbance on coexistence of predator-prey fish species. Ecology 65:1525-1534.
Murphy B. F., Timbal B. (2008) A review of recent climate variability and climate change in southeastern Australia. International Journal of Climatology 28(7),859-879.
Nicol J., Bald M. (2006) In-stream and Riparian Vegetation of the Onkaparinga River between Clarendon Weir and Old Noarlunga. Implications for Environmental Water Provisions. South Australian Research and Development Institute (Aquatic Sciences), Adelaide, SARDI Publication Number RD 04/0199, SARDI Research Report Series No. 170, 62pp.
O'Connor W. G., Koehn J. D. (1998) Spawning of the broad-finned Galaxias, <i>Galaxias brevipinnis</i> Günther (Pisces: Galaxiidae) in coastal streams of southeastern Australia. Ecology of Freshwater Fish 7(2),95-100.
Peterson, I., Masters, Z., Hildrew, A. G. and Ormerod, S. J. (2004) Dispersal of adult aquatic insects in catchments of differing land use. Journal of Applied Ecology. 41, 934–950.
Pikusa E., Bald M. (2005b) Trialing Environmental Water Provisions from SA Water reservoirs in the Western Mount Lofty Ranges. South Australian Department of Water, Land and Biodiversity Conservation, Adelaide. Pp 76.
Poff N. L., Allan J. D., Bain M. B., Karr J. R., Prestegaard K. L., Richter B. D., Sparks R. E., Stromberg J. C. (1997) The natural flow regime: a paradigm for river conservation and restoration. Bioscience 47(11),769-784.

237
Potter I. C. (1970) The life cycles and ecology of Australian lampreys of the genus Mordacia. Journal of Zoology 161,487-511.
Puckridge J. T., Walker K. F., Costelloee J. F. (2000) Hydrological persistence and the ecology of dryland rivers. Regulated Rivers Research and Management 16(5),385-402.
Rowntree J., Hammer M. (2004) Freshwater fish survey of the central urban River Torrens, Adelaide South Australia. Report to the Adelaide city council. Native Fish Australia (SA) Inc., Adelaide. p. 15.
Sainty G. R., Jacobs S. W. L. (1994) '‘Waterplants in Australia’.' (Sainty and Associates, Potts Point, Australia) 416
Schultz, P. (Adelaide and Mount Lofty Ranges Natural Resources Management Board) personal communication.
SKM (2002) Determination of environmental water requirements of the Onkaparinga River catchment. Technical Report V: Fish Survey. Report to the Onkaparinga Catchment Water Management Board, South Australia. Pp 17.
SKM (2003) Determination of environmental water requirements of the Onkaparinga River catchment: Summary Report. Report to the Onkaparinga Catchment Water Management Board, South Australia. Pp 51.
TCWMB (2005) A Catchment Journey to Integrated Natural Resources Managment 1995-2005. In. ' Ed. T. C. W. M. Board). (Torrens Catchment Water Management Board)
Teoh, K.S. (2002) Estimating the impact of current farm dams development on the surface water resources of the Onkaparinga River catchment, South Australia. Department of Water, Land and Biodiversity Conservation Report, DWR 2002/22.
Teoh K. S. (2006b) The impact of farm dam development on the Surface Water Resources of the South Para River Catchment. The Department of Water, Land and Biodiversity Conservation, No. DWLBC 2003/19.
Timbal, B and Jones, D, A. (2008) Future projections of winter rainfall in southeast Australia using a statistical downscaling technique. Climatic Change. 86:165–187
VanLaarhoven J, van der Wielen M (2009) Environmental water requirements for the Mount Lofty Ranges prescribed water resources areas. Department of Water, Land and Biodiversity Conservation & South Australian Murray-Darling Basin Natural Resources Management Board, South Australian Government, Adelaide
Walter M. (2005) South Para Reservoir Release. The Department of Water, Land and Biodiversity Conservation, No. DWLBC 2005/10.
Wilson P. J., McNeil D. G., Gillanders B. M. (2008) Impacts of introduced refin perch on native flathead gudgeons in the South Para River. South Australian Research and Development Institute (Aquatic Sciences), Adelaide, 47pp, No. Publication number F2007/000882-1.
Zeug S. C., Winemiller K. O. (2008) Relationships between hydrology, spatial heterogeneity and fish recruitment dynamics in a temperate floodplain river. River Research and Applications 24(1),90-102.

238
7. APPENDIX 1 – RAW ABUNDANCE CHART
River Site SeasonAcanthopagrus butcheri
Afurcagobias tamarensis
Aldrichetta forsteri
Anguilla australis
Arenigobius bifrenatus
Arripis truttaceus
Atherinosoma microstoma
Carassius auratus
Cyprinus carpio
Engraulis australis
Galaxias brevipinnis
Galaxias maculatus
Galaxias olidus
Gambusia holbrook i Gobiidae
Hypseleotris spp
Hyperlophus vittatus
Liza argentea
Melanotaenia fluviatilis
Mordacia mordax
Nematolosa erebi
Oncorhynchus myk iss
Perca fluviatilis
Phylipnodon grandiceps
Phylipnodon macrostomus
Pseudogobias olorum
Pseudaphritis urvillii
Salmo trutta
Sillaginodes punctatus
Sillago schomburgk ii
Tandanus tandanus
Tetractenos glaber
Tinca tinca
Autumn 2006 0 0 0 0 0 0 0 0 0 0 0 0 0 0 0 0 0 0 0 0 0 0 18 270 0 0 0 0 0 0 0 0 0Spring 2006 0 0 0 0 0 0 0 0 0 0 0 0 0 0 0 0 0 0 0 0 0 0 10 724 0 0 0 0 0 0 0 0 0Autumn 2007 0 0 0 0 0 0 0 0 0 0 0 0 0 0 0 0 0 0 0 0 0 0 0 104 0 0 0 0 0 0 0 0 0Spring 2007 0 0 0 0 0 0 0 0 0 0 0 0 0 0 0 0 0 0 0 0 0 0 1 765 0 0 0 0 0 0 0 0 0Autumn 2008 0 0 0 0 0 0 0 0 0 0 0 0 0 0 0 0 0 0 0 0 0 0 48 2 0 0 0 0 0 0 0 0 0Spring 2008 0 0 0 0 0 0 0 0 0 0 0 0 0 0 0 0 0 0 0 0 0 0 26 24 0 0 0 0 0 0 0 0 0Autumn 2006 0 0 0 0 0 0 0 0 0 0 0 0 0 0 0 0 0 0 0 0 0 0 165 124 0 0 0 0 0 0 0 0 0Spring 2006 0 0 0 0 0 0 0 0 0 0 0 0 0 0 0 0 0 0 0 0 0 0 64 173 0 0 0 0 0 0 0 0 0Autumn 2006 0 0 0 0 0 0 0 0 0 0 0 0 4 205 0 0 0 0 0 0 0 0 3 211 0 0 0 0 0 0 0 0 0Spring 2006 0 0 0 0 0 0 0 0 0 0 0 0 0 2154 0 0 0 0 0 0 0 0 56 341 0 0 0 0 0 0 0 0 0Autumn 2007 0 0 0 0 0 0 0 0 0 0 0 2 0 84 0 0 0 0 0 0 0 0 1 169 0 0 0 0 0 0 0 0 0Spring 2007 0 0 0 0 0 0 0 0 0 0 0 0 0 5542 0 0 0 0 0 0 0 0 56 372 0 0 0 0 0 0 0 0 0Autumn 2008 0 0 0 0 0 0 0 0 0 0 0 0 0 66 0 0 0 0 0 0 0 0 10 2 0 0 0 0 0 0 0 0 0Spring 2008 0 0 0 0 0 0 0 0 0 0 0 0 0 590 0 0 0 0 0 0 0 0 30 49 0 0 0 0 0 0 0 0 0Autumn 2007 0 0 0 0 0 0 0 0 0 0 0 53 0 178 0 0 0 0 0 0 0 0 0 957 0 0 7 0 0 0 0 0 0Spring 2007 0 0 0 0 0 0 0 10 15 0 0 7 0 541 0 0 0 0 0 0 0 0 0 892 0 0 5 0 0 0 0 0 1Autumn 2008 0 0 0 0 0 0 0 0 0 0 0 2 0 1721 0 0 0 0 0 0 0 0 0 1810 0 0 0 0 0 0 0 0 0Spring 2008 0 0 0 0 0 0 0 3 0 0 0 1 0 513 0 0 0 0 0 0 0 0 0 644 0 0 1 0 0 0 0 0 0Autumn 2006 0 0 0 0 0 0 0 0 0 0 0 0 0 17 0 0 0 0 0 0 0 0 55 89 4 0 0 0 0 0 0 0 0Autumn 2007 0 0 0 0 0 0 0 0 5 0 12 0 1 67 0 0 0 0 0 0 0 0 2 42 9 0 0 0 0 0 0 0 0Spring 2007 0 0 0 0 0 0 0 0 1 0 4 0 0 4 0 0 0 0 0 0 0 0 6 1 1 0 0 0 0 0 0 0 0Autumn 2008 0 0 0 0 0 0 0 0 2 0 0 0 0 2027 0 0 0 0 0 0 0 0 9 16 28 0 0 0 0 0 0 0 0Spring 2008 0 0 0 0 0 0 0 0 7 0 6 0 6 21 0 0 0 0 0 0 0 0 7 13 3 0 0 0 0 0 0 0 0Autumn 2006 0 0 0 0 0 0 0 0 2 0 0 1 10 0 0 0 0 0 0 0 0 0 10 128 0 0 0 18 0 0 0 0 0Spring 2006 0 0 0 0 0 0 0 0 1 0 0 0 0 0 0 0 0 0 0 0 0 1 15 323 0 0 0 11 0 0 0 0 0Autumn 2007 0 0 0 0 0 0 0 0 0 0 0 2 0 0 0 0 0 0 0 0 0 0 164 112 0 0 0 9 0 0 0 0 0Spring 2007 0 0 0 0 0 0 0 0 0 0 0 0 0 0 0 0 0 0 0 0 0 6 29 28 0 0 1 2 0 0 0 0 0Autumn 2008 0 0 0 0 0 0 0 0 1 0 0 0 0 0 0 0 0 0 0 0 0 0 12 405 1 0 0 2 0 0 0 0 0Spring 2008 0 0 0 0 0 0 0 0 4 0 0 0 2 17 0 0 0 0 0 0 0 0 8 19 2 0 0 0 0 0 0 0 0Autumn 2006 0 0 0 0 0 0 0 0 0 0 0 0 0 83 0 0 0 0 0 0 0 0 16 3155 55 0 0 0 0 0 0 0 0Autumn 2007 0 0 0 0 0 0 0 0 0 0 0 0 3 37 0 0 0 0 0 0 0 0 10 8 1 0 0 0 0 0 0 0 0Spring 2007 0 0 0 0 0 0 0 0 1 0 1 0 4 7 0 0 0 0 0 0 0 0 28 5 1 0 0 0 0 0 0 0 0Autumn 2008 0 0 0 0 0 0 0 0 0 0 0 0 4 483 0 0 0 0 0 0 1 0 39 436 0 0 0 0 0 0 0 0 0Spring 2008 0 0 0 0 0 0 0 0 0 0 0 0 0 0 0 0 0 0 0 0 0 0 10 145 0 0 0 12 0 0 0 0 0Autumn 2006 0 0 0 0 0 0 0 0 0 0 0 0 3 262 0 25 0 0 0 0 0 0 0 401 0 0 0 0 0 0 0 0 0Spring 2006 0 0 0 0 0 0 0 0 0 0 1 0 10 102 0 18 0 0 0 0 0 0 0 277 0 0 0 0 0 0 0 0 0Autumn 2007 0 0 0 0 0 0 0 13 0 0 0 0 1 2548 0 30 0 0 0 0 0 0 0 818 0 0 0 0 0 0 0 0 0Spring 2007 0 0 0 0 0 0 0 1 2 0 0 3 0 413 0 25 0 0 0 0 0 0 0 370 0 0 0 1 0 0 1 0 0Autumn 2008 0 0 0 0 0 0 0 1 0 0 0 0 0 2482 0 72 0 0 0 0 0 0 0 792 0 0 0 0 0 0 0 0 0Spring 2008 0 0 0 0 0 0 0 8 15 0 0 0 3 222 0 36 0 0 0 0 0 0 0 531 0 0 0 0 0 0 0 0 0Autumn 2006 3 12 1 0 0 0 0 152 44 0 0 111 0 93 0 1152 0 14 870 0 0 0 0 773 0 0 20 0 0 0 2 0 0Spring 2006 2 1 3 0 0 0 0 6 880 0 0 61 0 39 0 4005 0 66 193 0 0 0 0 5873 0 20 9 0 0 0 51 0 0Autumn 2007 31 0 21 0 1 1 0 0 13 1 0 87 0 1935 0 3733 0 524 979 2 0 0 0 2607 0 0 1 0 0 1 94 2 0Spring 2007 1 0 55 0 0 4 0 14 2499 0 0 56 0 70 2 4542 80 8 555 0 0 0 0 767 0 0 58 0 0 0 7 82 0Autumn 2008 0 1 28 0 0 0 20 0 5 0 0 2 0 1465 1 6365 0 4 886 0 0 0 0 1048 0 0 7 0 5 23 9 0 0Spring 2008 0 0 112 1 0 2 1 5 1290 0 0 609 0 18 0 7471 3 2 135 0 0 0 0 691 0 0 66 0 0 0 25 1 0Autumn 2006 0 0 0 1 0 0 0 2 1 0 0 3 0 136 0 0 0 0 0 0 0 0 30 1969 118 0 0 0 0 0 0 0 1Spring 2006 0 0 0 0 0 0 0 0 0 0 0 4 11 115 0 0 0 0 0 0 0 0 26 320 39 0 0 0 0 0 0 0 0Autumn 2007 0 0 0 0 0 0 0 0 2 0 0 1 0 1063 0 0 0 0 0 0 0 0 114 789 6 0 0 0 0 0 0 0 0Spring 2007 0 0 0 0 0 0 0 1 0 0 1 0 0 30 0 0 0 0 0 0 0 0 975 60 16 0 0 0 0 0 0 0 1Autumn 2008 0 0 0 0 0 0 0 0 0 0 1 0 0 767 0 0 0 0 0 0 0 0 63 369 21 0 0 0 0 0 0 0 0Spring 2008 0 0 0 0 0 0 0 1 1 0 0 0 32 302 0 0 0 0 0 0 0 0 189 100 13 0 0 0 0 0 0 0 1Autumn 2006 0 0 0 0 0 0 0 5 0 0 0 7 17 1841 0 0 0 0 0 0 0 0 0 692 1275 0 0 0 0 0 0 0 0Spring 2006 0 0 0 0 0 0 0 7 0 0 1 128 600 358 0 0 0 0 0 0 0 0 2 549 790 0 0 0 0 0 0 0 0Autumn 2007 0 0 0 0 0 0 0 0 0 0 0 34 8 5914 0 0 0 0 0 0 0 0 2 2087 321 0 0 0 0 0 0 0 0Spring 2007 0 0 0 0 0 0 0 0 0 0 0 1 65 192 0 0 0 0 0 0 0 0 0 1046 132 0 0 0 0 0 0 0 0Autumn 2008 0 0 0 0 0 0 0 1 0 0 0 1 3 1587 0 0 0 0 0 0 0 0 0 1737 103 0 0 0 0 0 0 0 0Spring 2008 0 0 0 0 0 0 0 0 0 0 0 0 177 108 0 0 0 0 0 0 0 0 0 700 218 0 0 0 0 0 0 0 0Autumn 2006 40 24 0 0 0 0 0 0 0 0 0 2246 0 7 0 0 0 3 0 0 0 0 0 76 0 2 209 0 0 0 0 0 0Spring 2006 1 0 0 0 0 0 0 0 0 0 0 5022 0 8 0 0 0 0 0 0 0 0 0 159 12 2 277 0 0 0 0 0 0Autumn 2007 4 4 0 0 1 0 0 0 0 0 0 1801 0 348 0 0 0 15 0 0 0 0 0 190 4 1 223 0 0 0 0 0 0Spring 2007 1 0 0 0 0 0 0 0 0 0 0 285 0 0 0 0 0 4 0 0 0 0 0 166 10 2 295 0 0 0 0 0 0Autumn 2008 0 0 0 0 0 0 0 0 0 0 0 1218 0 257 0 0 0 0 0 0 0 0 0 141 2 0 141 0 0 0 0 0 0Spring 2008 255 0 1 0 0 0 1 0 0 0 0 1781 0 52 0 0 0 1 0 0 0 0 0 96 8 1 998 0 0 0 0 0 0
South
Para
Para
Wirra
S.P. Weir
Nola
ns
Woodla
nds
Weir
Cudle
e C
reek
Old
Noarlunga
Gorg
e W
eir
Bre
akout
Cre
ek
Cla
rendon
Bro
oks R
oad
Onkaparinga
Torr
ens
Gum
era
cha
Weir
Silk
e's
Road
Top Related