


Languages
Pages
Legal


FINITE ELEMENT ANALYSIS (FEA) IMPLEMENTATION OF THERMAL BARRIER COATING (TBC) LIFETIME
PREDICTION METHODS
by
Hassan Mohamed
B. S. in Engineering, Massachusetts Institute of Technology, 2009
Submitted to the Graduate Faculty of
Swanson School of Engineering in partial fulfillment
of the requirements for the degree of
Master of Science
University of Pittsburgh
2013

ii
UNIVERSITY OF PITTSBURGH
SWANSON SCHOOL OF ENGINEERING
This thesis was presented
by
Hassan Mohamed
It was defended on
December 20th, 2012
and approved by
William S. Slaughter, PhD, Associate Professor, Department of Mechanical Engineering and
Materials Science
Anne M. Robertson, PhD, Associate Professor, Department of Mechanical Engineering and
Materials Science
Patrick Smolinski, PhD, Associate Professor, Department of Mechanical Engineering and
Materials Science
Thesis Advisor: William S. Slaughter, PhD, Associate Professor, Department of Mechanical
Engineering and Materials Science

iii
Copyright © by Hassan Mohamed
2013

iv
Thermal Barrier Coatings (TBC) is one of the most important insulation components of an
advanced turbine. It is expected to operate at temperature conditions as high as 1760ºC. The
main objective of this work is to investigate four available methods in predicting the lifespan of
the TBC layer and its practicality in finite element analysis (FEA) computation. The four
methods discussed are TGO Thickness Calculation, Elasticity and Creep Effect Analysis, A
Coupled Oxidation Constitutive Approach and Fracture Mechanics Method. The predicted
results obtained are compared with experimental data provided by Limarga [10]. The
implementations of TGO Thickness Calculation as well as Elasticity and Creep Effect Analysis
in finite element computation have shown a promising result such as local von Mises stress
distribution on each layer in TBC (top coat, TGO and bond coat). This simulation result can
provide a good comparison data for future experimental work.
FINITE ELEMENT ANALYSIS (FEA) IMPLEMENTATION OF THERMAL BARRIER COATING (TBC) LIFETIME PREDICTION METHODS
Hassan Mohamed, M.S.
University of Pittsburgh, 2013

v
TABLE OF CONTENTS
NOMENCLATURE ..................................................................................................................... X
ACKNOWLEDGEMENTS ..................................................................................................... XII
1.0 INTRODUCTION ........................................................................................................ 1
2.0 BACKGROUND .......................................................................................................... 3
2.1 CERAMIC TOP COAT LAYER ....................................................................... 4
2.1.1 ELECTRON-BEAM PHYSICAL-VAPOR DEPOSITED TBC .............. 6
2.1.2 AIR-PLASMA-SPRAYED TBC ................................................................. 7
2.2 BOND COAT LAYER ........................................................................................ 8
2.3 THERMAL GROWTH OXIDATION LAYER ............................................... 9
3.0 METHODS ................................................................................................................. 10
3.1 TGO THICKNESS CALCULATION ............................................................. 10
3.2 ELASTICITY AND CREEP EFFECT ANALYSIS ...................................... 12
3.3 A COUPLED OXIDATION CONSTITUTIVE APPROACH ...................... 14
3.3.1 OXIDATION OF TWO PHASE METALLIC SYSTEM ....................... 15
3.3.2 FORMULATION OF STRESS-DIFFUSION EQUATION ................... 17
3.4 FRACTURE MECHANICS APPROACH...................................................... 19
4.0 CHALLENGES .......................................................................................................... 21
5.0 FINITE ELEMENT IMPLEMENTATION ............................................................ 23

vi
5.1 MODELING PROCEDURE ............................................................................ 23
5.2 PRELIMINARY VERIFICATION OF SIMULATION ............................... 24
6.0 RESULTS ................................................................................................................... 30
6.1 RESULT: TGO THICKNESS CALCULATION .......................................... 30
6.2 RESULT: LOCAL STRESS DISTRIBUTION ............................................. 32
6.3 FAILURE CRITERIA ...................................................................................... 35
7.0 SUMMARY AND CONCLUSION ........................................................................... 36
APPENDIX A .............................................................................................................................. 39
APPENDIX B .............................................................................................................................. 41
BIBLIOGRAPHY ....................................................................................................................... 49

vii
LIST OF TABLES
Table 1: Room temperature properties of YSZ top coats [1].......................................................... 7
Table 2: Mechanical properties of NiCrAlY bond coat at room temperature. ............................... 8
Table 3: Mechanical properties of TGO layer at room temperature. .............................................. 9
Table 4: Creep properties for top coat (YSZ), TGO and bond coat (NiCoCrAlY) layers. ........... 12
Table 5: Material properties of TBC layers used in finite element analysis [11]. ........................ 13
Table 6: TGO thickness calculation based on Echsler's and Busso's formulations ...................... 31

viii
LIST OF FIGURES
Figure 1: a) Microstructure of a typical plasma sprayed thermal barrier coating after 500 hours
oxidation at 950ºC (Busso [3]). b) A typical microstructure of an EB-PVD TBC
system after 700 hours at 1000⁰C (Busso[6]). ............................................................... 4
Figure 2: Oxidation process on the multiphase Ni-metallic bond coat [7]. .................................. 15
Figure 3: a) Model of a local TBC layer with a pre-existing crack. b) A circle-shaped model of a
local TBC layer at the peak of undulation (imperfection) [8,9]. .................................. 20
Figure 4: SHELL element for thin layers can be directly meshed directly to SOLID thermal
elements with thicker volume. ...................................................................................... 24
Figure 5: Experimental Setup for TBC coupon heating process [10]. .......................................... 25
Figure 6: Stress (von Mises) distribution within TBC layers during heating process (t = 60
seconds). ....................................................................................................................... 26
Figure 7: Stress (von Mises) distribution within TBC layers at the end of holding period (t = 300
seconds). ....................................................................................................................... 27
Figure 8: Evolution of stresses within the TBC layers and the temperature difference between TC
surface and BC/TGO interface. .................................................................................... 28
Figure 9: TGO thickness plot using Busso's and Echsler's models for operating temperature
1100ºC. ......................................................................................................................... 30

ix
Figure 10: TGO thickness contour plots on a turbine blade at temperature of 1100ºC for 1000
hours. a)Echsler's model. b)Busso's model. ................................................................ 32
Figure 11: Local von Mises stress distribution on TC, TGO and BC layers at temperature of
a)800ºC b)1100ºC c)1300ºC after 730 hours. ............................................................ 33
Figure 12: Maximum local von Mises stress for each TBC layer including super alloy surface. 34
Figure 13: Contour plot of damage parameter D on each layer of TBC at 800ºC and 730 hours. 35

x
NOMENCLATURE
α Thermal expansion coefficient, K-1
A0 Proportionality constant, µm-s-m (1 µm-s-m)
E Young's Modulus, N·m-2
D Damage parameter based on elastic failure theories
eVT Mean local dilatational strain due to transformation of f2
f1ini Initial oxidation resistant phase volume fraction
f2ini Initial oxidation-prone phase volume fraction
f2 Unoxidized fraction of phase 2 f2ini volume fraction
f3 New metallic phase of volume fraction
fox Primary oxide volume fraction
h Thickness, m
hox TGO Thickness due to external oxidation, m
hin TGO Thickness due to internal oxidation, m
k Thermal conductivity, Wm-1K-1
R Universal gas constant
rox Final volume fraction of the oxide in the oxidized Phase 2
T Temperature, K
t Time, s

xi
v Poisson ratio
θ Absolute temperature, K
θR Reference temperature (2424 K)
m Growth exponent (0.332)

xii
ACKNOWLEDGEMENTS
I would like to thank my advisor, Dr. William S. Slaughter, for his patience and guidance
throughout the course of my research, and for giving me the exceptional support and opportunity
to continue my graduate studies as well as providing me with an outstanding atmosphere for
research.
I would also like to thank Dr. Ventzi Karaivanov, who greatly contributed to my growth
as a researcher and to better understand the research. I am grateful to the members of my thesis
defense committee, Dr. Anne M. Robertson and Dr. Patrick Smolinski.
My deepest gratitude to all faculty and students at the Department of Mechanical
Engineering and Materials Science.
Last but not least to my wife Fazliyana Zaabar and our families who continuously
provide their supports and love.
1
1.0 INTRODUCTION
In the next generation of power plant technology, both oxy fuel and hydrogen fuel may be
utilized as the substitute for current combustion technology. Both future technologies in power
generation may enable advanced turbines to operate more efficiently but at a significantly higher
temperature condition compared to today's current power plant condition. Such advanced
turbines with oxy fuel or hydrogen fuel operate approximately up to 1760 ⁰C, while the current
coal-fueled power plants operate at a temperature only up to 900 ⁰C. Due to the high temperature
operating condition, these technologies may require a change in its material design. One of the
most important components in a power plant that will be affected is the turbine blades, since the
availability of the power plant mainly depends on the lifespan of the blades.
The materials used to build turbine blades will likely require high temperature resistance
in order to withstand such conditions. One of the potential means of protecting the blades is by
applying a thermal barrier coating (TBC) on their surfaces. Such a coating may help to protect
the nickel based super alloy blade from hot gas steam. Nevertheless, the TBC layer is also in
contact with both the increasing operating metal temperature and the kinetics of the base
material, each of which gradually degrades TBC durability, exposing itself to damage failures
such as undulation, spallation, and cracking.
Thus this project will study the thermomechanics of the TBC layer in order to predict its
lifespan before failure occurs. Several approaches in modeling the TBC lifetime have been

2
identified and applied in a finite element computer simulation. This paper intends to discuss four
damage modeling approaches: TGO thickness calculation, elasticity and creep effect of TBC, a
coupled oxidation-constitutive approach and fracture mechanics approach. Of the methods, only
two techniques, TGO thickness calculation and elasticity and creep effect of TBC, are employed
in the finite element analysis.

3
2.0 BACKGROUND
Thermal Barrier Coating is widely used in aircraft and industrial gas turbine engines.
Commercial manufactured TBC system consists of two layers, a ceramic top coat and underlying
metallic bond coat. The top coat is a composition of yttria-stabilized zirconia (YSZ) that can be
composed by air plasma spraying (APS) or electron-beam physical vapor deposition (EB-PVD).
The top coat has low thermal conductivity, high oxygen permeability, and relatively high
coefficient of thermal expansion. Due to its low thermal conductivity characteristic, its main
function is to provide a thermal insulation on the turbine blades surface from the hot gas steam.
The metallic bond coat is normally made of MCrAlY overlay or a platinum-
modified diffusion aluminide (β-NiAl-Pt). The work on this study mainly focuses on APS TBC
system with MCrAlY bond coat. Since the top coat has very high oxygen permeability while the
bond coat is rich with aluminum properties, both layers inevitably form a protective, thermally
grown oxide (TGO) scale of α-Al2O3 during thermal operation. This TGO scale provides strong
attachment between the YSZ top layer and metallic bond coat layer.
All the layers existed in TBC system equip the TBC system with the capability of
thermal insulation as well as oxidation resistant to protect nickel-based super alloy metal below
it. TBC systems are able to create high temperature drop from about 140⁰C up to 250⁰C with
cooling systems, which subsequently reduces the metal operating temperature [1]. Nevertheless,
the TGO is gradually thickening over the period of time during high temperature exposure.

4
Hence, the crucial failures that associate with the TBC system are typically spallation and
cracking of the thickening thermal growth oxidation (TGO) scale. Majority of the reviewed
papers, then, agree that thermal growth oxidation (TGO) layer that is formed due to bond coat
oxidation and interdiffusion with metallic bond coat strongly contributes to such failures. The
following section will discuss the constitutes of the TBC systems in more details.
Figure 1: a) Microstructure of a typical plasma sprayed thermal barrier coating after 500 hours oxidation at
950ºC (Busso [3]). b) A typical microstructure of an EB-PVD TBC system after 700 hours at 1000⁰C (Busso[6]).
2.1 CERAMIC TOP COAT LAYER
The layer is made of Y2O3 (yttria) stabilized ZrO2 (zirconia). Y2O3 is found to be empirically
suitable to stabilize ZrO2 compared to other different oxides (MgO, CeO2, Sc2O3, In2O3, CaO)
because of its structure that can exist in three different polymorphs such as monoclinic,
5
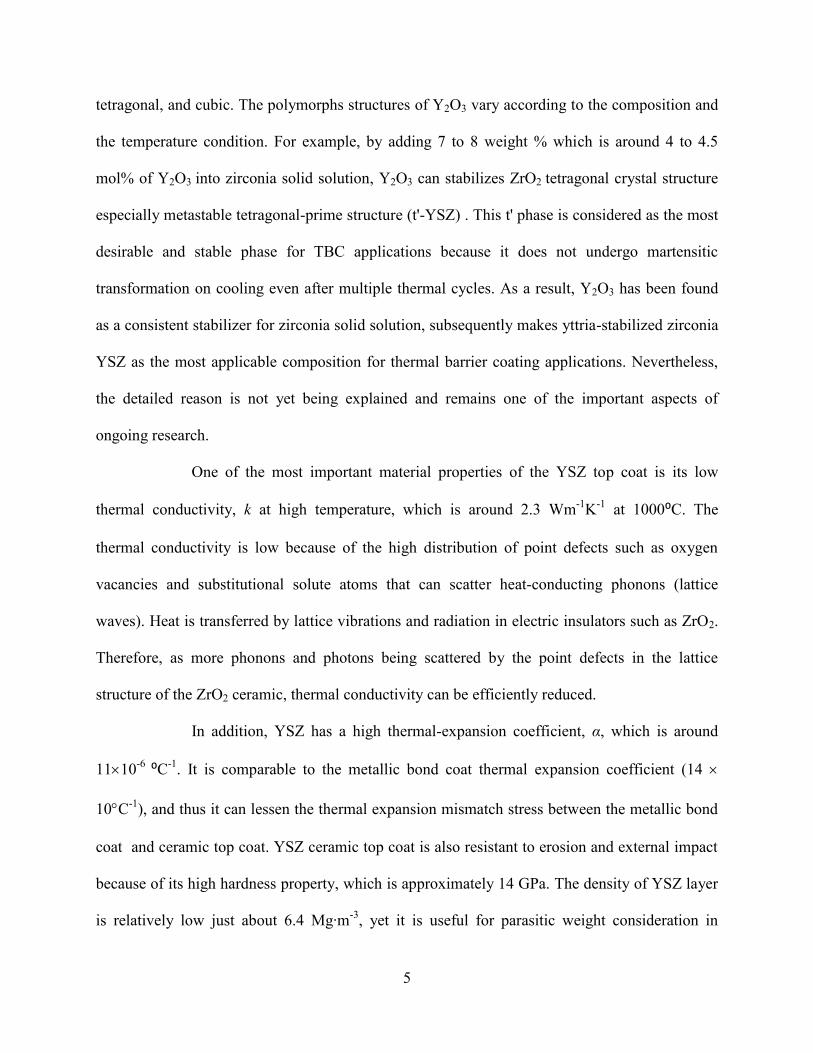
tetragonal, and cubic. The polymorphs structures of Y2O3 vary according to the composition and
the temperature condition. For example, by adding 7 to 8 weight % which is around 4 to 4.5
mol% of Y2O3 into zirconia solid solution, Y2O3 can stabilizes ZrO2 tetragonal crystal structure
especially metastable tetragonal-prime structure (t'-YSZ) . This t' phase is considered as the most
desirable and stable phase for TBC applications because it does not undergo martensitic
transformation on cooling even after multiple thermal cycles. As a result, Y2O3 has been found
as a consistent stabilizer for zirconia solid solution, subsequently makes yttria-stabilized zirconia
YSZ as the most applicable composition for thermal barrier coating applications. Nevertheless,
the detailed reason is not yet being explained and remains one of the important aspects of
ongoing research.
One of the most important material properties of the YSZ top coat is its low
thermal conductivity, k at high temperature, which is around 2.3 Wm-1K-1 at 1000⁰C. The
thermal conductivity is low because of the high distribution of point defects such as oxygen
vacancies and substitutional solute atoms that can scatter heat-conducting phonons (lattice
waves). Heat is transferred by lattice vibrations and radiation in electric insulators such as ZrO2.
Therefore, as more phonons and photons being scattered by the point defects in the lattice
structure of the ZrO2 ceramic, thermal conductivity can be efficiently reduced.
In addition, YSZ has a high thermal-expansion coefficient, α, which is around
1110-6 ⁰C-1. It is comparable to the metallic bond coat thermal expansion coefficient (14
10C-1), and thus it can lessen the thermal expansion mismatch stress between the metallic bond
coat and ceramic top coat. YSZ ceramic top coat is also resistant to erosion and external impact
because of its high hardness property, which is approximately 14 GPa. The density of YSZ layer
is relatively low just about 6.4 Mg·m-3, yet it is useful for parasitic weight consideration in

6
moving engine components. Another crucial aspect of the YSZ top coat is its high melting point.
This ceramic layer is resistant to elevated temperature up to approximately ~2700 ⁰C which
makes YSZ as the most significant component in TBC system. There are two most important
types of YSZ top layer coating depositions, air plasma spraying (APS) and electric-beam
physical vapor deposition (EB-PVD). This paper, however, focuses on the APS TBC system life
damage simulation since it is commonly used in power plant turbines.
2.1.1 ELECTRON-BEAM PHYSICAL-VAPOR DEPOSITED TBC
The EB-PVD top coat is approximately 125 µm thick. The microstructural features of the top
coat consist of a thin region on polycrystalline YSZ with equiaxed grains near the ceramic/metal
interface. The EB-PVD top coat is deposited into columns of YSZ grains with diameter of 2 to
10µm. The columnar YSZ grains grow outwardly from the equiaxed-grain region to the top
surface. Within the columnar YSZ grains, there are nanometer-scale porosity, and channels,
normal to the ceramic/metal interface that separates the YSZ columns. This columnar grains
separation can disconnect at elevated temperature, alleviating the effect from the stress that rises
from thermal expansion mismatch. This behavior is known as "strain tolerance”. The EB-PVD
top coat is smoother than APS deposition. Plus, it is more durable and expensive compared to
APS case. Thus, it is typically used in the most harsh temperature condition like in aircraft
engines.

7
2.1.2 AIR-PLASMA-SPRAYED TBC
Unlike EB-PVD top coat, a typical APS top coat is slightly thicker than EB-PVD top coat with a
thickness of 300 µm to 600µm. The APS top coat structure consists of "splat" grain morphology
which each "splat" has 1 to 5 µm thickness and about 200 to 400 µm diameter. Besides inter-
"splat" boundaries, there are also cracks that exists parallel to the ceramic/metal, creating 15 to
25 vol% porosity within the APS TBC that contributes to low thermal conductivity and low
elastic modulus of the system.
The weakness of the APS TBC is the undulating nature of the ceramic/metal interface
that is actually needed in sticking together the top coat and the metal bond coat. This nature is
found to be the cause of the undulation failures due to the stress it creates. The commercial
production cost of APS system is relatively low. Hence, it becomes a preferable choice for
applications that operate in slightly lower temperature condition and fewer thermal cycles such
as in conventional power plant gas-turbine engines. However, the thermal-cycle life of APS top
coat is usually shorter than EB-PVD TBC's live because of the growing microstructural defects
parallel to the interface and also the roughness of the interface within the APS TBC. Table 1
below shows the material properties comparison of APS and EB-PVD TC systems at a room
temperature.
Table 1: Room temperature properties of YSZ top coats [1].
Property Deposition Method APS EB-PVD
Thermal Conductivity (Wm-1 K-1) 1.5-1.9 0.8-1.1 Surface Roughness, µm 0.5-1 4-10 Adhesion Strength, (MPa) 400 20-40 Young's Modulus (GPa) 90 200 Erosion rate (normalized to PVD) 1 7

8
2.2 BOND COAT LAYER
Metallic coatings for super alloys are typically NiCrAlY type which contains 15 to 25 weight %
Chromium (Cr), 10-15% Aluminum (Al), and 0.2-0.5% Yttrium (Y) and β-NiAl phase. The
bond coat has a typical thickness of 40 to 100µm, depending on the deposition method. Similar
to YSZ top coat deposition, the metallic coatings are commonly deposited by using EB-PVD
method or low pressure plasma spraying (LPPS) in today’s gas turbines applications. The LPPS
process is relatively cheaper than EB-PVD and becomes a favorable selection. Nonetheless, EB-
PVD has a quality advantage over LPPS.
The key physical property of the bond coat is its oxidation behavior. The metallic bond
coat should be able to oxidize in order to form a nonporous and adherent oxide layer, which is
called thermal growth oxidation layer. Therefore, the composition, microstructure, and surface
condition of metallic bond coat is considered important to study in order to observe its influence
on a TGO formation. The function of TGO layer is discussed in more detail in section 2.3
Thermal Growth Oxidation layer. Table 2 below shows the mechanical properties of NiCrAlY
bond coat at room temperature.
Table 2: Mechanical properties of NiCrAlY bond coat at room temperature.
Properties Values Young's Modulus, E (GPa) 200 Poisson Ratio 0.3
Thermal Expansion Coefficient, α ( 10-6, ⁰C-1) 12.3
Material Strength, σY (MPa) 226

9
2.3 THERMAL GROWTH OXIDATION LAYER
The thermal growth oxidation layer α-Al2O3 is formed during the thermal operation and the
oxidation of the metallic bond coat. The Al in bond coat slowly depletes and thickens the TGO
layer. This TGO layer is considered the most crucial layer in the TBC system. Its growth during
the thermal operation is responsible for the spallation failure of TBC system in many ways. One
of the causes is from the stresses created inside the TGO. As the TGO thickens, the volume
expands and at the same time the volume expansion is restrained by the top coat and bond coat
layers. The restriction creates compressive "growth" stress (< 1 GPa) within the TGO.
Another source of stress is from thermal expansion mismatch between the TGO and the
bond coat during cooling process. This thermal compressive residual stress is quite high as it can
reach a maximum stress value that is about 2 to 6 GPa when the TGO is cooled down to ambient
temperature. All these internal stresses can initiate and aggravate the development of micro
cracks inside the TGO during thermal operation. As a result, total damage failure due to TBC
spallation will occur from micro cracks coalescence. Thus, one way that can be used to predict
the damage failure of TBC is by investigating the stresses created inside the TGO layer. Table 3
below shows the mechanical properties of TGO layer at room temperature.
Table 3: Mechanical properties of TGO layer at room temperature.
Properties Values Young's Modulus, E (GPa) 400 Poisson Ratio 0.18
Thermal Expansion Coefficient, α ( 10-6, ⁰C-1) 8
Material Strength, σY (MPa) 97

10
3.0 METHODS
Four methods that are used to predict the life span of the TBC system before it fails are:
1) TGO Thickness Calculation,
2) Creep Effect and Elasticity Analysis,
2) Coupled Oxidation Constitutive Approach, and
3) Fracture Mechanics.
All these methods are discussed except for Coupled Oxidation Constitutive Approach and
Fracture Mechanics, both of which will not be analyzed using computer simulation because of
modeling difficulty as is explained later.
3.1 TGO THICKNESS CALCULATION
This method is based on the calculation of the thickness of TGO formed during the oxidation and
interdiffusion processes between the top coat layer and the bond coat layer. Most reviewed
papers, [1] to [11], are in agreement that the thickening of the TGO layer being formed increases
the tendency of cracking and spallation of the whole TBC system as its growth causes
progressive aluminum depletion from the metallic bond coat. A critical thickness is then defined
as the thickness of which the TBC layers completely spalls from the metal surface. In Busso's

11
model [4], the TGO thickness is calculated as a function of operating temperature as shown
below.
ℎ = -𝐴 𝑡 exp −
In a later experimentation by Echsler [2], the TGO thickness calculation is separated into
an outward oxidation and an inward oxidation of the TGO layer as shown in the equations (2)
and (3) respectively,
ℎ (𝑡, 𝑇) = -𝐾 (T) ,
ℎ (𝑡, 𝑇) = -𝐵 (T) .
The values for variables in Echsler’s and Busso’s equations (1), (2) and (3) are listed in
references [2] and [4]. We decide to implement equations (1) and (2) to show the applicability of
this method in finite element computation because the equations are dimensionally correct and
straightforward to use on a finite element model.
However, there is no conclusive agreement between the studies on the critical thickness
of the TGO scale. In Busso's paper [4] it is reported that the critical thickness is as low as 10 µm,
while Echsler reported the thickness before failure at 12 µm. Furthermore, the critical TGO
thickness typically varies depending on the type of application and operating condition. As a
result, the TGO thickness calculation becomes a less favorable TBC lifetime prediction method
to satisfy all operating conditions.
(1)
(2)
(3)

12
3.2 ELASTICITY AND CREEP EFFECT ANALYSIS
The thermal stress distribution of the coating layers operating in high temperature conditions can
be studied by performing finite element computation. During the extreme operating temperature,
creep damage is considered as one of the main contributors to the presence of stress and TBC
failure. Hence, the creep behavior of all the layers - top coat (YSZ), TGO and bond coat
(NiCoCrAlY) - are analyzed by using a Norton power-law equation as shown below,
𝜀̇ = 𝐴𝜎 e( )
The values for the creep properties A, Q and n for each layer are listed in Table 4 below
Table 4: Creep properties for top coat (YSZ), TGO and bond coat (NiCoCrAlY) layers.
Material A (s-1 MPa-n)
Q (kJ/mol) n
YSZ 1010 625 4
TGO 6.8 x 10³ 424 1
NiCoCrAlY 1012 500 3
The analysis mainly focuses on the elasticity effect of the layers. The material properties
of the layers at different temperatures are listed in Table 5. All these values will be utilized in the
computation of thermal stress distribution within the coating layer.
(5)

13
Table 5: Material properties of TBC layers used in finite element analysis [11].
Material T (ºC)
E (GPa) ν
Yield Strength (MPa)
Density (kg/m3)
CTE (ppm/ ºC)
Thermal conductivity
(W/mK)
Specific Heat
(J/kg K)
NiCrAlY
800 900 1000 1100
117 100 74 41
0.3 191 92 52
7320 16.30 16.94 17.51 17.99
24
34
674
712
TGO 25
1000 1300
360 0.25 100 100
3970 8.00 20.00 790
YSZ 25 500 1000
50 0.25 5100 10.00 9.64 10.34
0.70 0.70 0.70
479 445 445
In this finite element computation, several assumptions are made to simplify the
simulation process. Firstly, all interfaces such as top coat/TGO, TGO/bond coat and bond
coat/super alloy are assumed to have a perfect bonding. In addition, the interfaces are assumed to
be flat, neglecting the effects of the grain and roughness between the surfaces. Another
assumption made is that the stress relaxation due to cracking is not taken into consideration.
Additionally, we assume the top coat, bond coat and TGO layers have isotropic material
properties. However, this assumption is not entirely correct because the ceramic top coat for
example, has a “splat” shape and the TGO layer has a unique shape as TGO depends on
uncontrolled oxidation process. Hence, the material properties of each layer may significantly
depend on directions. Nevertheless, due to limited information obtained on material properties of
all the layers, we decide to assume their material properties to be isotropic for the present.
To perform the finite element simulation, the primary software used in this work is
ANSYS. The finite element analysis first investigates the thermal stress on a small block element
that only consists of the three layers, YSZ, TGO and NiCoCrAly with a uniform high ambient
temperature as the boundary condition. This will open up possibilities of more sophisticated 3D

14
models of turbine blades with heat convection as a boundary condition. The result of the
simulation is able to give a better representation of the thermal stress distribution within the
coating. The stress distribution will be used to evaluate the TBC failure based on the failure
criteria that we have defined as the ratio of local stress, σlocal to failure stress, σf, which is the
material strength of the coating.
3.3 A COUPLED OXIDATION CONSTITUTIVE APPROACH
A coupled oxidation constitutive approach is a continuum mechanics-based mechanistic study
that takes into account the effects of local stresses induced by oxidation, sintering process and
thermomechanical loading on the overall APS-TBC damage evaluation. This method is
suggested to explain the effect of phase transformations caused by local external and internal
oxidation process through a multi-phase solid on the constitutive behavior of bond coat such as
the local volumetric expansion of the new formed oxide layer. By using finite element analysis
on a unit cell of a TBC layer, the stress distribution due to internal and external oxidation is
observed. The steps of this method consist of:
1. Finding the value of an applicable stress measure, such as the maximum principal stress
σMPS or the normal traction stress σNT acting on the interface that drives the crack
nucleation and propagation.
2. Failure occurs when the stress measure reaches the failure stress σf (a TBC material
property).

15
3.3.1 OXIDATION OF TWO PHASE METALLIC SYSTEM
The microstructural changes inside the oxidized multiphase Ni-base metallic bond coat interlayer
needs to be investigated in order to resolve the limiting stress condition for micro crack initiation
in the TGO layer.
Figure 2: Oxidation process on the multiphase Ni-metallic bond coat [7].
To formulate oxidation process, two solid phase system consisted of oxidation resistant
phase, f1ini and an oxidation-prone phase, f2
ini are considered as phases that existed in the initial
volume fractions which are also assumed to be isotropically homogenous grain aggregates.
When the oxidation process starts, a new layer is formed beneath the ceramic/metal interface
which is recognized as internal oxidation zone (IOZ) where it consists of four different phases
which are oxidation resistant phase, f1ini, fraction of oxidation-prone phase which has not
oxidized, f2, fraction of oxidation products consisting of the primary oxide, fox, as well as a
fraction of new metallic phase of volume fraction, f3. All these four volume fractions make up
the whole volume within the internal oxidation zone as defined below.

16
𝑓 + 𝑓 + 𝑓 + 𝑓 = 1
The constituents of the IOZ remain as the unsteady four phases as defined above until the
primary oxidation is done. After the completion, two solid phase matrix of volume fractions
which are oxidation resistant phase, f1ini and final product of newly formed metallic phase of
volume fraction, f3f coexist within the IOZ in a steady state population either in large oxide or
finely dispersed aggregates.
𝑓 + 𝑓 = 1
By introducing a new internal state variable, f, which corresponds to a normalized fraction of the
oxidizing phase, each variable in Eq. 6 can be expressed as below.
𝑓 = (1 − 𝑓)𝑓 ,
𝑓 = 𝑓𝑓 ,
𝑓 = 𝑓𝑓 ,
where f can vary in value from 0 to 1, which is from the time before the oxidation begins to the
primary oxidation ends respectively. The final state of the primary oxide of volume fraction, foxf
is defined as in Eq. 11,
𝑓 = 𝑟 ∆( ∆ )
where rox is the final volume fraction in the oxidized Phase 2, and Δfox is defined as,
∆𝑓 = 𝑙𝑛 1 + 𝑓 [exp(3𝑒 ) − 1] .
(6)
(7)
(8)
(9)
(10)
(11)
(12)

17
In the Eq. 11, eVT is the mean local dilatational strain induced by the transformation of Phase 2,
f2. Lastly, the final volume fraction metallic phase, f3f can be defined as,
𝑓 = 1 − 𝑓 − 𝑓 .
The information of volume fractions throughout the oxidation process is really useful in
understanding the mechanical behavior of the material constituents within the TGO layer and
describing the stress-strain properties of the materials.
3.3.2 FORMULATION OF STRESS-DIFFUSION EQUATION
The aggregated stress, T that builds up within the TGO layer can be modeled using hypoeleastic
formula which can be expressed in terms of the Jaumann derivate of stress T, as shown below,
𝐓⏞∇
= ℒ[𝐃 − 𝐃𝐢𝐧] − 3𝜅𝛼�̇�𝟏
where D is the stretching tensor,Din the inelastic strecthing tensor associate with the deformation,
�̇�, the rate of change of absolute temperature, α the thermal expansion coefficient. This
formulation takes into account the effect of diffusion of oxidant species through the metal, the
oxidation of its oxidation-prone phase and the effect of the local volumetric expansion of oxide
it inelastic strain as well residual stress. In general, the Jaumann deribvative of the stress is
expressed as in Eq. 15.
𝐓⏞𝛁
= �̇� −𝐖𝐓 + 𝐓𝐖
where W is the total material spin. The inelastic stretching tensor in Eq. 14 is associated with the
average inelastic stretching tensor rate due to creep, Dcr, and a non-recoverable deformation rate
due to the oxidation of one of the metallic phase, Dtr , as shown below.
(13)
(14)
(15)

18
𝐃𝐢𝐧 = 𝐃𝐜𝐫 − 𝐃𝐭𝐫
where Dcr represents the volume fraction weighted sum of the individual components of each
phase, �̇�𝒊𝒄𝒓as presented below,
𝐃𝐜𝐫 = ∑ 𝑓 �̇�𝒊𝒄𝒓𝐢
and Dtr is controlled by the rate of change of the internal oxidation 𝑓̇ ,
𝐃𝐭𝐫 = 𝑓 𝑓̇ 𝑃 𝐓′
𝐒 + 𝑒 𝟏
𝑓̇ = (1 − 𝑓)�̇� 𝑉 for 𝐶 ≥ 𝐶 else 𝑓̇ = 0,
where in Eq. 18, P is a shape coefficient of the oxide particles, 𝑆 the norm component of the
stress tensor and T' is the deviatoric component of T. Whereas in Eq. 19, which is based on
nucleation kinetics, �̇� and �̇� are the rate of increase of oxide precipitates per unit volume and
the average volume of each oxide particle, respectively. The local oxygen concentration is
denoted as CO and the temperature-dependent critical concentration is assigned with COcr, which
is calibrated from oxidation data. Then, a stress tensor rate that accounts each oxidizing and non-
oxidizing phase, �̇� is introduced as,
�̇� = �̇� + 2𝜇(1 − 𝛽) 𝐃𝐜𝐫 − �̇�𝒊𝒄𝒓 − �̇�𝐢
where µ is the viscosity, β the Eshleby's elastic accommodation factor and Ai is introduced as an
additional interphase accommodation tensorial variables in order to describe the interaction
between coexisting phases such as elastic oxide and creeping metallic phases. The rate of change
of Ai is then defined as,
�̇�𝐢 = 𝐻(𝑓, 𝜃) ∑ 𝑓 𝐒 �̇̃� − 𝐒 �̇̃�
where 𝐻(𝑓, 𝜃) is a dimensionless homogenization function that is calibrated from experimental
data and Finite Element calculation, which is provided in Busso's paper (Journal de Physique). In
(16)
(18)
(19)
(20)
(21)
(17)

19
Eq. 21, Si is another phase accommodation variable tensor for each phase that is defined as
below.
�̇�𝐢 = �̇�𝒊𝒄𝒓 − 𝐻(𝑓, 𝜃)𝐒 �̇̃�
The stress of oxidizing and non-oxidizing phase, σi formula is later written in Fortran code in
order to be applied numerically in ANSYS.
This formulation work, however, does not account the effects of interdiffusion processes
that are driven by concentration gradient between the metallic coating and the substrate on the
composition of the oxidized material and on the coating microstructure for the sake of
simplification. The interdiffusion process is identified to have the ability to raise the oxide
volume fraction up to 100% of the oxidized material and this may result in local stress
increment. Nonetheless, the effects of interdiffusion processes are still neglected since the
interdiffusion time is considered longer than primary oxidation time, the time taken to diminish
all the NiAl phase of Al in a NiCoCrAly bond coat layer [12]. Thus, it is reasonable to assume
that those effects may be less significant than the primary oxidation as discussed in Busso’s
paper [3].
3.4 FRACTURE MECHANICS APPROACH
There are several papers [8, 9, 21, 22] that introduce fracture mechanics as a practical method to
determine the damage criteria of TBC layers. This approach uses the calculation of the stress and
stress intensity factor, K, on a local crack area, where focus is placed only on a small local part
instead of the entire component. The steps consist of determining a certain model shape on the
local area that already has a pre-existing crack as shown in Fig. 3(a). The crack that exists within
(22)

20
the TBC layer is important in calculating the stress intensity factor, K, for a given loading value.
The value of K can also be later used in determining energy release rate, G. To decide failure, the
value of K of the material is compared with the model’s fracture toughness property, KIC.
Another method of modeling is to locally define a circle-shaped model around the peak
of undulation as shown in Fig. 3(b). By doing so, stress calculation within the TGO layer can be
simplified and defined as hoop stress. Hence, using the simplified stress definition, the maximum
normal and acting stress can be calculated and compared to the yield strength of the TGO layer.
Figure 3: a) Model of a local TBC layer with a pre-existing crack. b) A circle-shaped model of a local TBC
layer at the peak of undulation (imperfection) [8,9].
This method is relatively reliable with the condition that a crack location is known or the
undulation behavior (amplitude and wavelength) is given from experiment. Unfortunately, this
approach has its own limitation, as it does not fulfill this project’s main purpose. As indicated
earlier, this paper intends to predict the lifetime of the TBC layer from the beginning of the
turbine’s operation without having any pre-existing crack or undulations. In addition, the crack
models of the TBC always vary between reviewed papers. Thus, due to all these restrictions, this
method will not be applied in our computer simulation.

21
4.0 CHALLENGES
One of the main challenges in this project is to find the material properties of each TBC layer
(TC, TGO and BC) such as its thermal conductivity and elastic modulus. The process presents a
challenge because the information obtained from previous experiments and studies are
insufficient. This is because some of the experimental data does not provide important material
properties that are temperature dependent. On top of that, material properties of the specimen
obtained from experiment may differ as it depends on the grain size and roughness of the TBC
surface as well. A comprehensive finding is required in order to adequately gather information of
the layers.
Another challenge is to ensure the method that will be chosen from the selection above
can be easily implemented in finite element (FE) computation. In conducting the finite element
analysis, we have to consider what type of assumptions and limitations that has to be made in
order to get a reasonable result that can be compared to any hands on experiment. We would also
like to ensure the FEA modeling suggested can be incorporated into a much more complicated
thermal application such as commercial turbine blade in an extreme temperature condition. If the
method chosen is too complex, it will be very complicated to implement in finite element
computation and we may end up with inaccurate results. For example, a coupled oxidation
constitutive approach as discussed earlier is considered difficult to carry out as it involves three
types of analysis - diffusion or oxidation process, thermal analysis and structural analysis. This is

22
not possible via a basic ANSYS application because the software is limited to a coupled analysis
such as thermal-structural analysis only. An additional process would require complicated
programming and customization.
The last challenge is to make sure that the method selected may serve our research
group’s purpose in predicting the lifetime of the TBC of a turbine blade application from the start
of its operation. In the beginning of a TBC’s life, fractures do not yet form as they normally
occur after a few hundred hours of thermal operation. Hence, we would like to choose a method
that will not depend on fracture or crack behavior. The fracture mechanics method is not a viable
option because we intend to use an all encompassing method that can provide a quick and
practical solution to model TBC layers regardless of its operating conditions and the complexity
of its 3-D geometry.

23
5.0 FINITE ELEMENT IMPLEMENTATION
5.1 MODELING PROCEDURE
In finite element modeling, we model a three-dimensional square supper alloy coupon with its
top surface shielded by a layer of TBC. The solid model is meshed with a conventional
SOLID70 element while the SHELL132 element that is used for TBC layer consists of top coat,
BC and TGO. SHELL132 is selected due to its reliability in thin layer application. In addition, it
provides an option for users to directly mesh SHELL elements with SOLID elements that have
significantly different thickness and volume as shown in Figure 4. Application of SHELL132
elements may increase computational speed while maintaining the simulation stability of the
multi-layered insulation. As can be seen in Figure 4, we assign SHELL132 element with three
layers that correspond to top coat, TGO and bond coat layers. In addition, SHELL132 element
allows user to improve the accuracy of simulation results by simply stacking more layers within
the element.

24
Figure 4: SHELL element for thin layers can be directly meshed directly to SOLID thermal elements with
thicker volume.
5.2 PRELIMINARY VERIFICATION OF SIMULATION
The first process is to check whether the computer simulation of TBC layers can produce a
credible result. Verification is done by comparing our simulation result with experimental data
obtained by Limarga [10]. In his study, as shown in Figure 5, a small coupon of TBC is
gradually heated up until it reaches 1200 ˚C for 60 seconds. Then the coupon is held for another
240 seconds, allowing the heat to distribute throughout the coupon. In the experiment, the stress
distribution on the TBC layer is measured using Raman spectroscopy.
Top Coat
Bond Coat TGO
Super alloy

25
Figure 5: Experimental Setup for TBC coupon heating process [10].
In our finite element simulation, only one fourth of the coupon will be modeled as it
allows us to apply sufficient thermal boundary conditions in the simulation such as zero heat flux
at the lines of symmetry.
We apply heat at a temperature of 1200 ºC on the top layer of the model in thermal
analysis and later observe the local stress on each layer during structural analysis. Below is the
results obtained from the simulation. Figure 6 shows the distribution of stress on each layer
within the TBC (TC, TC/TGO interface, BC/TGO interface) at time t = 60 seconds where the
coupon reaches a temperature of 1200 ºC. Figure 7 shows the distribution of stress at time 300
seconds after the coupon is held to allow distribution of heat throughout the layers.

26
Figure 6: Stress (von Mises) distribution within TBC layers during heating process (t = 60 seconds).
(Pascal) 5.00 × 10⁶ 22.2 × 10⁶ 44.4 × 10⁶ 66.7 × 10⁶ 88.9 × 10⁶ 111.0 × 10⁶ 133.0 × 10⁶ 156.0 × 10⁶ 178.0× 10⁶
200.0 × 10⁶
Layer 1: Top Coat (TC)
Layer 3: BC/TGO surface
Layer 2: TC/TGO

27
Figure 7: Stress (von Mises) distribution within TBC layers at the end of holding period (t = 300 seconds).
(Pascal) 5.00 × 10⁶ 22.2 × 10⁶ 44.4 × 10⁶ 66.7 × 10⁶ 88.9 × 10⁶ 111.0 × 10⁶ 133.0 × 10⁶ 156.0 × 10⁶ 178.0× 10⁶
200.0 × 10⁶
Layer 1: Top Coat (TC)
Layer 3: BC/TGO surface
Layer 2: TC/TGO interface

28
Result above shows that in general, the bond coat layer has a higher stress distribution
compared to the top coat surface and TC/TGO interface. By comparing Fig. 6 and 7, it is
interesting to note that the stress value is higher at the end of the heating process where the
temperature difference between the top coat layer and bond coat layer is still high. As it reaches
240 seconds, temperature difference stabilizes at 400ºC while maximum von Mises stress value
gradually drops.
Figure 8: Evolution of stresses within the TBC layers and the temperature difference between TC surface
and BC/TGO interface.
0
20
40
60
80
100
120
140
160
180
0 20 40 60 80 100 120 140 160 180 200 220 240 260 280 300 320
Stre
ss (M
Pa)
Time (s)
Comp: BC/TGO surface Comp: TC Surface Exp: BC/TGO interface Exp: TC surface
0
100
200
300
400
500
600
700
0 20 40 60 80 100 120 140 160 180 200 220 240 260 280 300 320
Tem
p. D
iff, Δ
T TBC
(°C
)
Time (s)

29
During the heating process, from time 0 to 60 seconds, the temperature difference, ΔT,
between the top TC surface and lower BC surface is as high as 600ºC. During the holding period
of 240 seconds the temperature drop slowly decreases as the BC layer picks up heat. Also, the
temperature difference slowly drops and stabilizes at ΔT = 400ºC. The Raman measurement
from the experimental data indicates that the measured stresses in the coating are smaller than
our predicted finite element analysis as shown in Figure 8. Nevertheless, the stress behavior does
agree with experimental results where the stresses increase quite linearly during heating and
slowly drop as the temperature difference, ΔT decreases during the holding process. The
agreement obtained in this preliminary simulation gives us the confidence to further apply our
finite element computation for both TGO thickness calculation as well as elasticity and creep
effect analysis.

30
6.0 RESULTS
6.1 RESULT: TGO THICKNESS CALCULATION
Equations (1), (2) and (3) are used to calculate the final thickness of the TBC layer. TGO
thickness vs. time plot was obtained in Figure 5 below.
Figure 9: TGO thickness plot using Busso's and Echsler's models for operating temperature 1100ºC.

31
The graph shows that Echsler’s thickness formulation expects higher thickness on the
outside surface compared to Basso’s thickness calculation. After 8000 hours of operation at
temperature of 1100ºC, the thickness of the TGO is listed below,
Table 6: TGO thickness calculation based on Echsler's and Busso's formulations
Methods Thickness (µm)
Echsler’s Inward 1.3
Echsler’s Outward 2.5
Busso 2.2
The thickness of TBC layer increases with increasing operation time and lifetime. In
addition, all formulations predict a thickness value of TGO below the critical thickness values as
mentioned earlier that is around 10 to 12 µm. Since the simulation only runs for a period of 8000
hours, we can observe that the thickness obtained is also below Karaivanov’s simulation [11] of
TBC thickness, which is around 12.6 µm for 1600 hours operation.
The equations (1), (2) and (3) can be implemented in Ansys post-processing. This process
can be applied on any 3-D geometry of thermal applications. The model used is a turbine blade
model overlaid with SHELL132. Below is the result of the simulation on a turbine blade that is
operating at a temperature of 1100ºC for 1000 hours only. The simulation result expects lower
TGO thickness since the operating period is short.

32
Figure 10: TGO thickness contour plots on a turbine blade at temperature of 1100ºC for 1000 hours.
a)Echsler's model. b)Busso's model.
Most of the reviewed papers recognize that the thickness of the TGO layer seems to be
one of the most important factors in determining a TBC’s lifetime. The method appears simple
and plausible. Unfortunately, it lacks any clear and defining failure criteria. Hence, to depend
only on the TGO thickness calculation for TBC lifetime prediction may be insufficient.
6.2 RESULT: LOCAL STRESS DISTRIBUTION
To implement the creep effect and elasticity method, we assume the thickness of the TGO to be
constant at 3 µm, while the thicknesses for bond coat and top coat (YSZ) layers are set to 150
µm and 500 µm respectively. The simulation is run at a steady state for 700 hours at operating
temperatures of 800ºC and 1100ºC and 1300ºC. Figure 11 below shows the local stress
distribution on each layer.
0.3 0.65 1.011 1.367 1.722 2.078 2.433 2.789 3.144 3.5 (µm)
a) b)

33
Figure 11: Local von Mises stress distribution on TC, TGO and BC layers at temperature of a)800ºC
b)1100ºC c)1300ºC after 730 hours.
a)
Top Coat TGO Bond Coat
0.1 44.5 88.9 133 178 222 267 311 356 400 (× 106 Pa)
b)
c)

34
To better understand the stress distribution for each layer, we plot the maximum local von Mises
stress for each layer and compare it at different operating temperatures (880ºC, 1100ºC and
1300ºC).
Figure 12: Maximum local von Mises stress for each TBC layer including super alloy surface.
The result shows that the stress is higher on TGO layer in comparison to other layers
regardless of operating temperatures. As the operating temperature increases, the local stress also
increases. The maximum local stresses in the result are still lower than maximum local stress
reported in Hsueh et. al work [27]. The result also shows that the stresses in the TBC layer are in
the range of 5 MPa to 400 MPa, which is a reasonable value as we discussed earlier in the
preliminary verification process. The super alloy has the lowest local stress value, which might
be because the TBC layer protects it thermally. Overall, this result is very useful as it can be used
in comparing with future experimental data.
0
50
100
150
200
250
300
350
400
450
800 °C 1100 °C 1300 °C
Max
imum
Loc
al S
tres
s (M
Pa)
Temperature (°C)
Super alloy Suface BC Surface TGO surface TC Surface

35
6.3 FAILURE CRITERIA
In this study the failure criteria used is simply based on maximum yield stress due to the
limitation of our FEA, which is only in elastic region. We create a condition which can signal for
impending failure when the any of the TBC layers such as TGO, BC, TC has local von Mises
stress that is multiple times higher than its yield strength, depending on the safety factor assigned
on a design. Hence, this criteria is incorporated in ANSYS by setting manually the formula
below
𝐷 =𝜎
𝐹𝑂𝑆 × 𝜎
where value D is the damage parameter, FOS is the safety factor with a typical value of 3 to 6.5
for general NASA turbine blade or any thermal application and σY is the yield strength.
Based on equation (23), if D is larger than 1, it means one of the TBC layers has yield
and may possibly experience an impending failure. This failure theory however may be replaced
with other suitable failure indicators depending on various needs. Figure 13 below shows the
damage D parameter contour plot for TBC layer operating at 800ºC for 730 hours.
Figure 13: Contour plot of damage parameter D on each layer of TBC at 800ºC and 730 hours.
(23)
0.01 0.075 0.141 0.207 0.272 0.338 0.403 0.469 0.534 0.6

36
7.0 SUMMARY AND CONCLUSION
There are four available methods to predict lifetime of TBC layers as discussed in this work. Of
all the methods, TGO thickness calculation and creep effect and elasticity analysis are used in
finite element analysis because both methods are applicable to finite element computation and
can serve the purpose of our project.
TGO thickness calculation method applied in finite element computation is improved
upon from the previous work done by Karaivanov [11] as the calculation of the thickness is now
based on the particular layer of TBC instead of just the alloy layer. The result obtained is
promising but it does not have detailed information on the behavior of each TBC layer such as
stress distribution. In addition, the method still currently does not have one specific critical
thickness value when the TBC happens to fail as current research work provides different views
on critical thickness value.
The simulation results of the creep and elasticity analysis are, generally, in agreement
with experimental data obtained from Limarga’s work [10] as the stress values of the layers are
considered within a reasonable range. The simulation result, however, may have overestimated
the value of stresses on each of TBC layers as it does not consider grain roughness of each
surface and various significant effects that occur within the TBC layer such as sintering and
cracking effects. The effect of cracking may result in changes to the elastic modulus of the TBC

37
layer. As a result, the random location of cracks within the layer may create nonuniform stress
distribution.
In addition the presence of crack may release some stresses, lowering the local stress
values within the layers. On the other hand, sintering, which usually occurs at a higher rate, may
increase thermal conductivity and elastic modulus of the TBC layer. The presence of both
sintering and cracking may create complex elastic modulus and stress behavior within the
coating. Besides, the constitutive behavior of sintering is less known while the cracking behavior
is highly dependent on rough grain as well as temperature, making the study more complex and
beyond the scope of our study. Thus, it is very important to understand the slight discrepancy of
the simulation result due to the limitations mentioned above before applying it into finite element
computation.
To overcome this shortage, more advanced yet complex methods like A Coupled
Oxidation Constitutive Approach may need to be used in order to improve stress prediction of
TBC layers. Nevertheless, the research has shown that the TBC layers can be easily modeled in
finite element computation and may still be useful with other thermal application such as turbine
blades.
Moreover, it is important to consider that in this simulation, we have assumed that all the
layers (top coat, bond coat, TGO) have isotropic material properties. The assumption is made
due to limited experimental data of the layers. The calculation of local stresses can be
significantly affected from the assumption. Hence, to improve our results, more defined material
properties of TBC are required.
To obtain accurate results, one of the important computational aspects that needs to be
considered is mesh refinement. As shown in Fig. 11 and 13, the stress distribution on the TBC

38
surface is not entirely uniform as there is a significant variation in stress value between bright
spots and their surroundings. These bright spots have higher stress values from the surroundings.
The spots are essentially the SHELL132 (TBC) elements that are perfectly attached with the
SOLID70 (super alloy) elements underneath. These bright spots give more reasonable stress
values. On the other hand, the darker surrounding areas are the SHELL132 (TBC) elements that
are not completely attached to SOLID70 (super alloy) elements. As a result, the stress values of
these darker areas are relatively low and may not be quite precise. To overcome this problem,
one method includes refining the mesh. Mesh refinement will create more SHELL132 elements,
allowing higher number of SHELL132 elements to be attached with SOLID70 elements.
However, due to the constraint of our computer’s processing capability, only a restricted number
of SHELL32 elements can be generated, resulting in less amount of SHELL132 elements that
can be connected with SOLID70 elements.
For future studies, data from this experimental analysis can be of benefit so that more
experimental data for this specific case can be obtained and be used to verify the validity of the
simulation result. Overall, the finite element computation seems successful to the point where it
manages to predict stress behavior that occurs within each TBC layer.

39
APPENDIX A
SAMPLE ANSYS INPUT FOR POST-PROCESSING
! Echsler Outward Oxidation !--------------------------------------------------------------- /POST1 SUSEL,S, !Create Local CS at WP Origin CSWPLA,9999 SUSEL,ALL, SUSEL,ALL, ETABLE,temp,TEMP, !* ETABLE,,ERASE,1 ETABLE,T1,TEMP, !* PLETAB,T1,AVG PLETAB,T1,NOAV SEXP,EXP1,T1, ,-1,1, SMULT,MUL1,EXP1, ,-8385.14,1, SEXP,MUL2,MUL1, ,2,1, SEXP,MUL3,MUL1, ,3,1, SEXP,MUL4,MUL1, ,4,1, SADD,ADD1,MUL1,MUL2,1,0.166667,1, ETABLE,,ERASE,7 SADD,ADD1,MUL1,MUL2,1,0.5,1, SADD,ADD2,MUL3,MUL4,0.166667,0.041667,0, SADD,ADDTotal,ADD1,ADD2,1,1,0, SMULT,TGO,ADDTOTAL, ,0.005843,1, PLETAB,TGO,NOAV !--------------------------------------------------
!Busso Calulation SADD,STEP2ADD,EXP1, ,1,1,-0.000413, SMULT,STEP3MUL,STEP2ADD, ,-9224.88,1, SEXP,STEP3MUL2,STEP3MUL, ,2,1, SEXP,STEP3MUL3,STEP3MUL, ,3,1, SEXP,STEP3MUL4,STEP3MUL, ,4,1, /DIST,1,1.08222638492,1 /REP,FAST /DIST,1,0.924021086472,1 /REP,FAST ETABLE,REFL ETABLE, ,TF,X !* ETABLE,,ERASE,13 SEXP,STEP3MUL2,STEP3MUL, ,2,1, SEXP,KUASA2,STEP3MUL, ,2,1, SEXP,KUASA3,STEP3MUL, ,3,1, SEXP,KUASA4,STEP3MUL, ,4,1, SADD,STEP4ADD1,STEP3MUL,KUASA2,1,0.5,0, ETABLE,,ERASE,16 ETABLE,,ERASE,12 ETABLE,,ERASE,15 ETABLE,,ERASE,14 ETABLE,,ERASE,13

40
SMULT,KUASA1,STEP2ADD, ,-9224.88,1, SEXP,KUASA2,KUASA1, ,2,1, SEXP,KUASA3,KUASA1, ,3,1, SEXP,KUASA4,KUASA1, ,4,1, SADD,TAMBAH1,KUASA1,KUASA2,1,0.5,0, SADD,TAMBAH2,KUASA3,KUASA4,0.16667,0.041667,0, SADD,TOTAL,TAMBAH1,TAMBAH2,1,1,1, SMULT,TGOBUSSO,TOTAL, ,0.000216,1, PLETAB,TGOBUSSO,NOAV !* /CONT,1,9,AUTO /REPLOT !* SMULT,TGOBMOD,TGOBUSSO, ,100,1, PLETAB,TGOBMOD,NOAV !*

41
APPENDIX B
SAMPLE ANSYS INPUT FOR SIMULATION
!------------------create block-------------------
/PREP7
BLOCK,0,100,0,1000,0,100, !--------Super Alloy mat. properties --------- /REP,FAST mat,1 MPTEMP,,,,,,,, MPTEMP,1,373 MPTEMP,2,473 MPTEMP,3,573 MPTEMP,4,673 MPTEMP,5,773 MPTEMP,6,873 MPTEMP,7,973 MPTEMP,8,1073 MPTEMP,9,1173 MPTEMP,10,1273 MPTEMP,11,1373 MPTEMP,12,1473 MPTEMP,13,1573 MPDATA,KXX,1,,9 MPDATA,KXX,1,,10 MPDATA,KXX,1,,12 MPDATA,KXX,1,,13 MPDATA,KXX,1,,15
MPDATA,KXX,1,,16 MPDATA,KXX,1,,19 MPDATA,KXX,1,,22.5 MPDATA,KXX,1,,25 MPDATA,KXX,1,,27.5 MPDATA,KXX,1,,35 MPDATA,KXX,1,,50 MPDATA,KXX,1,,45 MPDATA,Kyy,1,,9 MPDATA,Kyy,1,,10 MPDATA,Kyy,1,,12 MPDATA,Kyy,1,,13 MPDATA,Kyy,1,,15 MPDATA,Kyy,1,,16 MPDATA,Kyy,1,,19 MPDATA,Kyy,1,,22.5 MPDATA,Kyy,1,,25 MPDATA,Kyy,1,,27.5 MPDATA,Kyy,1,,35 MPDATA,Kyy,1,,50 MPDATA,Kyy,1,,45 MPDATA,Kzz,1,,9 MPDATA,Kzz,1,,10
MPDATA,Kzz,1,,12 MPDATA,Kzz,1,,13 MPDATA,Kzz,1,,15 MPDATA,Kzz,1,,16 MPDATA,Kzz,1,,19 MPDATA,Kzz,1,,22.5
42
MPDATA,Kzz,1,,25 MPDATA,Kzz,1,,27.5 MPDATA,Kzz,1,,35 MPDATA,Kzz,1,,50 MPDATA,Kzz,1,,45 MP,C,1,,630 MPTEMP,,,,,,,, MPTEMP,1,300 MPTEMP,2,473 MPTEMP,3,673 MPTEMP,4,873 MPTEMP,5,1073 MPTEMP,6,1273 MPTEMP,7,1373 MPDATA,EX,1,,125e+9 MPDATA,EY,1,,125e+9 MPDATA,EZ,1,,125e+9 MPDATA,PRXY,1,,.3875 MPDATA,PRYZ,1,,.3875 MPDATA,PRXZ,1,,.3875 MPDATA,GXY,1,,119e+9 MPDATA,GYZ,1,,119e+9 MPDATA,GXZ,1,,119e+9 MPDATA,EX,1,,118e+9 MPDATA,EY,1,,118e+9 MPDATA,EZ,1,,118e+9 MPDATA,PRXY,1,,.38 MPDATA,PRYZ,1,,.38 MPDATA,PRXZ,1,,.38 MPDATA,GXY,1,,112e+9 MPDATA,GYZ,1,,112e+9 MPDATA,GXZ,1,,112e+9 MPDATA,EX,1,,110e+9 MPDATA,EY,1,,110e+9 MPDATA,EZ,1,,110e+9 MPDATA,PRXY,1,,.379 MPDATA,PRYZ,1,,.379 MPDATA,PRXZ,1,,.379 MPDATA,GXY,1,,106e+9 MPDATA,GYZ,1,,106e+9 MPDATA,GXZ,1,,106e+9 MPDATA,EX,1,,104e+9 MPDATA,EY,1,,104e+9 MPDATA,EZ,1,,104e+9
MPDATA,EZ,1,,104e+9 MPDATA,PRXY,1,,.38 MPDATA,PRYZ,1,,.38 MPDATA,PRXZ,1,,.38 MPDATA,GXY,1,,98e+9 MPDATA,GYZ,1,,98e+9 MPDATA,GXZ,1,,98e+9 MPDATA,EX,1,,97e+9 MPDATA,EY,1,,97e+9 MPDATA,EZ,1,,97e+9 MPDATA,PRXY,1,,.381 MPDATA,PRYZ,1,,.381 MPDATA,PRXZ,1,,.381 MPDATA,GXY,1,,91.7e+9 MPDATA,GYZ,1,,91.7e+9 MPDATA,GXZ,1,,91.7e+9 MPDATA,EX,1,,90e+9 MPDATA,EY,1,,90e+9 MPDATA,EZ,1,,90e+9 MPDATA,PRXY,1,,.38 MPDATA,PRYZ,1,,.38 MPDATA,PRXZ,1,,.38 MPDATA,GXY,1,,85e+9 MPDATA,GYZ,1,,85e+9 MPDATA,GXZ,1,,85e+9 MPDATA,EX,1,,86e+9 MPDATA,EY,1,,86e+9 MPDATA,EZ,1,,86e+9 MPDATA,PRXY,1,,.38 MPDATA,PRYZ,1,,.38 MPDATA,PRXZ,1,,.38 MPDATA,GXY,1,,82e+9 MPDATA,GYZ,1,,82e+9 MPDATA,GXZ,1,,82e+9 !* MPTEMP,,,,,,,, MPTEMP,1,300 MPTEMP,2,373 MPTEMP,3,473 MPTEMP,4,573 MPTEMP,5,673 MPTEMP,6,773 MPTEMP,7,873 MPTEMP,8,973 MPTEMP,9,1073

43
MPTEMP,10,1173 MPTEMP,11,1273 MPTEMP,12,1373 MPTEMP,13,1473 MPTEMP,14,1573 MPTEMP,15,1673 MPTEMP,16,1773 MPDATA,DENS,1,,8700 MPDATA,DENS,1,,8665 MPDATA,DENS,1,,8618 MPDATA,DENS,1,,8572 MPDATA,DENS,1,,8525 MPDATA,DENS,1,,8479 MPDATA,DENS,1,,8433 MPDATA,DENS,1,,8387 MPDATA,DENS,1,,8342 MPDATA,DENS,1,,8296 MPDATA,DENS,1,,8251 MPDATA,DENS,1,,8206 MPDATA,DENS,1,,8161 MPDATA,DENS,1,,8116 MPDATA,DENS,1,,7736 MPDATA,DENS,1,,7646 !* MPTEMP,,,,,,,, MPTEMP,1,300 MPTEMP,2,1573 UIMP,1,REFT,,,300 MPDATA,ALPX,1,,18.8e-6 MPDATA,ALPX,1,,18.8e-6 MPDATA,ALPy,1,,18.8e-6 MPDATA,ALPy,1,,18.8e-6 MPDATA,ALPz,1,,18.8e-6 MPDATA,ALPz,1,,18.8e-6 !* ET,1,SOLID87 !*
!------ TBC material properties ------------- !IN-738 nickel based super alloy /PREP7 !* MPTEMP,,,,,,,, MPTEMP,1,273 MPTEMP,2,923.15 MPTEMP,3,1073.15 MPTEMP,4,1173.15 MPTEMP,5,1273.15 MPDATA,KXX,1,,8.72 MPDATA,KXX,1,,19.66 MPDATA,KXX,1,,22.28 MPDATA,KXX,1,,24.03 MPDATA,KXX,1,,25.78 MPTEMP,,,,,,,, MPTEMP,1,273 MPTEMP,2,923.15 MPTEMP,3,1073.15 MPTEMP,4,1173.15 MPTEMP,5,1273.15 MPDATA,C,1,,428 MPDATA,C,1,,594 MPDATA,C,1,,636 MPDATA,C,1,,675 MPDATA,C,1,,727 MPTEMP,,,,,,,, MPTEMP,1,0 MPDATA,DENS,1,,8500 MPTEMP,,,,,,,, MPTEMP,1,273 MPTEMP,2,923.15 MPTEMP,3,1073.15 MPTEMP,4,1173.15 MPTEMP,5,1273.15 UIMP,1,REFT,,,273 MPDATA,CTEX,1,,11.44 MPDATA,CTEX,1,,14.44 MPDATA,CTEX,1,,15.16 MPDATA,CTEX,1,,15.64 MPDATA,CTEX,1,,16.12

44
MPTEMP,,,,,,,, MPTEMP,1,0 MPDE,DENS,1 MPDATA,DENS,1,,8500 MPTEMP,,,,,,,, MPTEMP,1,273 MPTEMP,2,923.15 MPTEMP,3,1073.15 MPTEMP,4,1173.15 MPTEMP,5,1273.15 MPDATA,EX,1,,202E9 MPDATA,EX,1,,165E9 MPDATA,EX,1,,156E9 MPDATA,EX,1,,150E9 MPDATA,EX,1,,144E9 MPDATA,PRXY,1,,0.3 MPDATA,PRXY,1,,0.3 MPDATA,PRXY,1,,0.3 MPDATA,PRXY,1,,0.3 MPDATA,PRXY,1,,0.3 MPTEMP,,,,,,,, MPTEMP,1,273 MPTEMP,2,923.15 MPTEMP,3,1073.2 MPTEMP,4,1173.2 MPTEMP,5,1273.2 MPDE,EX,1 MPDE,PRXY,1 MPDATA,EX,1,,2.02E+011 MPDATA,EX,1,,1.65E+011 MPDATA,EX,1,,1.56E+011 MPDATA,EX,1,,1.5E+011 MPDATA,EX,1,,1.44E+011 MPDATA,PRXY,1,,0.3 MPDATA,PRXY,1,,0.3 MPDATA,PRXY,1,,0.3 MPDATA,PRXY,1,,0.3 MPDATA,PRXY,1,,0.3
!NiCrAlY bond coat !------------------ !* MPTEMP,,,,,,,, MPTEMP,1,273 MPTEMP,2,773.15 MPTEMP,3,873.15 MPTEMP,4,973.15 MPTEMP,5,1073.15 MPTEMP,6,1173.15 MPTEMP,7,1273.015 MPTEMP,8,1373.15 MPDATA,EX,2,,152E9 MPDATA,EX,2,,136E9 MPDATA,EX,2,,133E9 MPDATA,EX,2,,128E9 MPDATA,EX,2,,117E9 MPDATA,EX,2,,100E9 MPDATA,EX,2,,74E9 MPDATA,EX,2,,41E9 MPDATA,PRXY,2,,0.3 MPDATA,PRXY,2,,0.3 MPDATA,PRXY,2,,0.3 MPDATA,PRXY,2,,0.3 MPDATA,PRXY,2,,0.3 MPDATA,PRXY,2,,0.3 MPDATA,PRXY,2,,0.3 MPDATA,PRXY,2,,0.3 MPTEMP,,,,,,,, MPTEMP,1,0 MPDATA,DENS,2,,7320 MPTEMP,,,,,,,, MPTEMP,1,273 MPTEMP,2,773.15 MPTEMP,3,873.15 MPTEMP,4,973.15 MPTEMP,5,1073.15 MPTEMP,6,1173.15 MPTEMP,7,1273.15 MPTEMP,8,1373.15 UIMP,2,REFT,,,273 MPDATA,CTEX,2,,12.59 MPDATA,CTEX,2,,14.33 MPDATA,CTEX,2,,14.97 MPDATA,CTEX,2,,15.64

45
MPDATA,CTEX,2,,16.30 MPDATA,CTEX,2,,16.94 MPDATA,CTEX,2,,17.51 MPDATA,CTEX,2,,17.99 MPTEMP,,,,,,,, MPTEMP,1,773.15 MPTEMP,2,1173.15 MPDATA,KXX,2,,21 MPDATA,KXX,2,,24 MPTEMP,,,,,,,, MPTEMP,1,773.15 MPTEMP,2,1173.15 MPTEMP,3,1373.15 MPDATA,C,2,,628 MPDATA,C,2,,674 MPDATA,C,2,,712 MPTEMP,,,,,,,, MPTEMP,1,773.15 MPTEMP,2,1173.2 MPTEMP,3,1373.15 MPDE,KXX,2 MPDATA,KXX,2,,21 MPDATA,KXX,2,,24 MPDATA,KXX,2,,34 TB,CREE,2,1,3,10 TBTEMP,0 TBDATA,,10E12,3,6.014E4,,, !TGO !------ MPTEMP,,,,,,,, MPTEMP,1,273 MPDATA,EX,3,,360E9 MPDATA,PRXY,3,,0.25 MPTEMP,,,,,,,, MPTEMP,1,0 MPDE,EX,3 MPDE,PRXY,3 MPDATA,EX,3,,3.6E+011 MPDATA,PRXY,3,,0.25 MPTEMP,,,,,,,, MPTEMP,1,0 MPDE,EX,3
MPDE,PRXY,3 MPDATA,EX,3,,3.6E+011 MPDATA,PRXY,3,,0.25 MPTEMP,,,,,,,, MPTEMP,1,0 MPDATA,DENS,3,,3970 MPTEMP,,,,,,,, MPTEMP,1,0 UIMP,3,REFT,,,273 MPDATA,CTEX,3,,8.00 MPTEMP,,,,,,,, MPTEMP,1,0 MPDATA,C,3,,790 TB,CREE,3,1,3,10 TBTEMP,0 TBDATA,,6.8E3,1,5.1E4,,, MPDATA,KXX,3,,20 !YSZ !------ MPTEMP,,,,,,,, MPTEMP,1,0 MPDATA,EX,4,,50E9 MPDATA,PRXY,4,,0.25 MPTEMP,,,,,,,, MPTEMP,1,0 MPDATA,DENS,4,,5100 MPTEMP,,,,,,,, MPTEMP,1,273 MPTEMP,2,773.15 MPTEMP,3,1273.15 UIMP,4,REFT,,,273 MPDATA,CTEX,4,,10.00 MPDATA,CTEX,4,,9.64 MPDATA,CTEX,4,,10.34 MPTEMP,,,,,,,, MPTEMP,1,0 MPDATA,KXX,4,,0.70 MPTEMP,,,,,,,, MPTEMP,1,273 MPTEMP,2,773.15 MPTEMP,3,1273.15 MPDATA,C,4,,479 MPDATA,C,4,,445

46
TB,CREE,4,1,3,10 TBTEMP,0 TBDATA,,10E10,4,7.517E4,,, !------------Create Section ---------------------- /REPLO sect,234,shell,,TBC secdata, 0.00015,2,0,3 secdata, 3e-006,3,0,3 secdata, 0.0005,4,0,3 secoffset,BOT seccontrol,0,0,0, 0, 1, 1, 1 APLOT sect,234,shell,,TBC secdata, 0.00015,2,0,3 secdata, 3e-006,3,0,3 secdata, 0.0005,4,0,3 secoffset,TOP seccontrol,0,0,0, 0, 1, 1, 1 amesh,234 sect,234,shell,,TBC secdata, 0.00015,2,0,3 secdata, 3e-006,3,0,3 secdata, 0.0005,4,0,3 secoffset,MID seccontrol,0,0,0, 0, 1, 1, 1 !------------Change Physics --------------------- PHYSICS,WRITE,thermal, , , PHYSICS,CLEAR ETCHG,TTS mat,1 !Insert Material properties as shown above PHYSICS,WRITE,struc, , , PHYSICS,CLEAR /COM, CONTACT PAIR CREATION - START CM,_NODECM,NODE CM,_ELEMCM,ELEM CM,_KPCM,KP CM,_LINECM,LINE
CM,_AREACM,AREA CM,_VOLUCM,VOLU /GSAV,cwz,gsav,,temp MP,MU,1, MAT,1 MP,EMIS,1, R,3 REAL,3 ET,3,170 ET,4,174 R,3,,,1.0,0.1,0, RMORE,,,1.0E20,0.0,1.0, RMORE,0.0,0,1.0,,1.0,0.5 RMORE,0,1.0,1.0,0.0,,1.0 KEYOPT,4,4,2 KEYOPT,4,5,0 KEYOPT,4,7,0 KEYOPT,4,8,0 KEYOPT,4,9,0 KEYOPT,4,10,2 KEYOPT,4,11,1 KEYOPT,4,12,5 KEYOPT,4,2,2 KEYOPT,3,5,4 KEYOPT,4,1,2 ! Generate the target surface ASEL,S,,,2 CM,_TARGET,AREA TYPE,3 NSLA,S,1 ESLN,S,0 ESLL,U ESEL,U,ENAME,,188,189 NSLE,A,CT2 ESURF CMSEL,S,_ELEMCM ! Generate the contact surface ASEL,S,,,7 CM,_CONTACT,AREA TYPE,4 NSLA,S,1 ESLN,S,0 NSLE,A,CT2 ! CZMESH patch (fsk qt-40109 8/2008) ESURF

47
*SET,_REALID,3 ALLSEL ESEL,ALL ESEL,S,TYPE,,3 ESEL,A,TYPE,,4 ESEL,R,REAL,,3 /PSYMB,ESYS,1 /PNUM,TYPE,1 /NUM,1 EPLOT ESEL,ALL ESEL,S,TYPE,,3 ESEL,A,TYPE,,4 ESEL,R,REAL,,3 CMSEL,A,_NODECM CMDEL,_NODECM CMSEL,A,_ELEMCM CMDEL,_ELEMCM CMSEL,S,_KPCM CMDEL,_KPCM CMSEL,S,_LINECM CMDEL,_LINECM CMSEL,S,_AREACM CMDEL,_AREACM CMSEL,S,_VOLUCM CMDEL,_VOLUCM /GRES,cwz,gsav CMDEL,_TARGET CMDEL,_CONTACT /COM, CONTACT PAIR CREATION – END
!-------------------solution part--------------------- ! Start Thermal Analysis /PREP7 PHYSICS,READ,THERMAL FINISH /SOL PHYSICS,READ,THERMAL !Define heat Flux = 0 !Define heat convection SFA,P51X,1,CONV,3000,800 ! static solution /solu allsel solcontrol,on rescontrol,,all,last,1 rate, off delt,2.0e-8,1.0e-9,2.0e-8 time, 2.0e-8 !EQSLV,front EQSLV,PCG,1E-8 solve !Start structural analysis PHYSICS,CLEAR PHYSICS,READ,STRUC LDREAD,TEMP,,, , ,'layer800_update','rth',' !Apply displacement constraint ! static solution /solu allsel solcontrol,on rescontrol,,all,last,1 rate, off delt,2.0e-8,1.0e-9,2.0e-8 time, 2.0e-8 !EQSLV,front EQSLV,PCG,1E-8 solve
48
!Rate Solution (restart) antyp,,rest,1,1 solcontrol,on rate, on neqit,10 delt,0.25,1e-9,5.0 time,24.0 solve !-----------------view angle------------------------------- !For general post processing /VIEW,1,,-1 /ANG,1 /REP,FAST /AUTO,1 /REP,FAST /ZOOM,1,SCRN,0.323713,0.741848,0.125838,0.753261 /ANG,1,30,YS,1 /REP,FAST /REP,FAST /VIEW, 1, -0.244598432585 , -0.657224101439 , 0.712901176367 /ANG, 1, 34.2994532793 /REPLO /VIEW, 1, -0.220386199483 , -0.549338069395 , 0.806013404721 /ANG, 1, 31.7989066865 /REPLO !-----------------------------End------------------------------

49
BIBLIOGRAPHY
[1] Gleeson, B., Thermal Barrier Coatings for Aeroengine Applications, Journal of Propulsion and Power, 2006, Vol. 22, No 2.
[2] Echsler, H., Renusch, D., Schutze, M., Bond Coat Oxidation and its Significance for Life Expectancy of Thermal Barrier Coating Systems, Material Science and Technology, 2004, Vol. 20, pp. 307-318.
[3] Busso, E.P., Lin J., Sakurai, S., Nakayama, M., A Mechanistic Study of Oxidation-
Induced Degradation in a Plasma-Sprayed Thermal Barrier Coating System. Part I: Model Formulation, Acta Mater, 2001;49:1515-1528.
[4] Busso, E.P., Lin, J., Sakurai, S., Nakayama, M., A Mechanistic Study of Oxidation-
Induced Degradation in a Plasma-Sprayed Thermal Barrier Coating System. Part II: Life Prediction Model, Acta Mater 2001;49/9:1529-1536.
[5] Busso, E.P., Qian, Z.Q., A Mechanistic Study of Microcracking in Transversely Isotropic
Ceramic-Metal Systems, Acta Mater 2006;52:325-338.
[6] Busso, E.P., Wright, L., Evans, H.E., McCartney, L.N., Saunders, S.R.J., Osgerby, S., Nunn, J., A Physics-Based Life Prediction Methodology for Thermal Barrier Coating Systems. Acta Mater 2007:55:1491-503.
[7] Busso, E.P. Oxidation-Induced Stresses in Ceramic-Metal Interfaces. J. Phys. IV. France
9, 1999.
[8] He, M.Y., Hutchinson, J.W., Evans, A.G., Simulation of Stresses and Delamination in a Plasma-Sprayed Thermal Barrier System upon Thermal Cycling, Master Sci. Eng. A 2003;345:172-8.
[9] He, M.Y., Hutchinson, J.W., Evans, A.G., Mechanics-Based Scaling Laws for The
Durability of Thermal Barrier Coatings, Materials Science 45 2001:46:249-71.
[10] Limarga, A. M., VaBen, R., and Clarke, D.R., Stress Distributions in Plasma-Sprayed Thermal barrier Coatings Under Thermal Cycling in a Temperature Gradient, Journal of Applied Mechanics. Vol. 78, January 2011.
[11] Karaivanov, V., Lifetime Prediction Modeling Of Airfoils For Advanced Power
Generation, PhD Thesis, University of Pittsburgh, 2009.

50
[12] Brodin, H., Jinnestrand, M., Johannssin, S., and Sjostrom, S., Thermal Barrier Coating Fatigue Life Assessment, Siemens Publication.
[13] Wang, J.S. and Evans, A.G. Measurement and Analysis of Buckling and Buckle
Propagation in Compressed Oxide Layers on Superalloy Substrates, Acta Mater, V. 46 (1998), pp.4993-5005.
[14] Budianski, B. and Wu, T. Theoretical of Plastic Strain in Polycrystals, Proc. 4th US Nat.
Congr. Appl. Mech., 1962, p. 1175.
[15] Mucke, R. A Viscoplastic Modeling Approach or MCrAlY Protective Coatings for Gas Turbine Applications, Baden Switzerland.
[16] Ahrens, M., Lampenscherf, S., Vassen, R., and Stover, D., Sintering and Creep Processes
in Plasma-Sprayed TBCs, J. Thermal Spray Technology, 2004, 13 pp. 432-442.
[17] Schwarzer, J., and Vohringer, O., High Temperature Deformation Behavior of the Bondcoat Alloy PWA 1370, Advanced Engineering Material, 2003, pp. 490-493.
[18] Brindley, W. J., and Whittenberger, J. D., Stress Relaxation of Low Pressure Plasma-
Sprayed NiCrAlY Alloy, Material Science Engineering A, 1993, 163, pp. 33-41.
[19] Demasi, J. T., Sheffler, K. D., and Ortiz, M., Thermal Barrier Coating Life Prediction Model Development, NASA Technical Report No. 182230, Cleveland, OH, 1989.
[20] Bednarz, P., Finite Element Simulation of Stress Evolution in Thermal Barrier Coating
Systems, Ph.D. Thesis, Forschungszentrum Jülich GesmbH, Jülich, 2006.
[21] Busso, E. P., Qian, Z. Q., Taylor, M.P., and Evans, H. E., The Influence of Bondcoat and Topcoat Mechanical Properties on Stress Development in Thermal Barrier Coating Systems, Acta Mater., 2009, Vol. 57, pp. 2349-2361.
[22] VaBen, R., Kerkhoff, G., and Stover, D., 2001, Development of Micromechanical Life
Prediction Model for Plasma Sprayed Thermal Barrier Coating, Material Science Engineering A, 303, pp. 100-109.
[23] Nelson, T. and Wang E., Reliable FE-Modeling with ANSYS, CADFEM GesmbH,
Munich, Germany.
[24] Zaretsky, E. V., Litt, J.S., Hendricks R.C., Determination of Turbine Blade Life from Engine Field Data, NASA Glenn Research Center, Cleveland.
[25] Manet, V., The Use of Ansys To Calculate Sandwich Structures, Composites Science and
Technology 58, 12 (1998) 1899-1905, hal-00659205, Ver. 1 – 26.

51
[26] Johnson, D. H., Principles of Simulating Contact Between Parts using ANSYS, Penn State–Erie University, Erie, Pennsylvania.
[27] Metrisin, J. T., Guidelines for Obtaining Contact Convergence, Turbomachinery, Florida
Turbine Technologis Inc. 2008 International ANSYS Conference.
[28] Anisotropic Behavior Yield Criterion Failure Criteria, Review of Yield/Failure Criteria, ANSYS Newsletter.
[29] Hsueh, C. H., and Fuller, E.R., Analytical Modeling Of Oxide Thickness Effects On
Residual Stresses In Thermal Barrier Coatings, Oak Ridge National Laboratory, Oak Ridge, Tennessee 37831-6068 National Institute of Standards and Technology, Gaithersburg, Maryland 2008.
[30] Nitin, P., Padture, et al. Thermal Barrier Coatings for Gas-Turbine Engine Applications, Science 2002:296.
Top Related