


Languages
Pages
Legal


2
FINANCIAL PERFORMANCE HIGHLIGHTS
Revenue +29% R12.4 billion
from continuing operations
Normalised headline earnings +29% R2.4 billion
from continuing operations
Normalised diluted headline earnings per share +20% 523.3 cents
from continuing operations
Capital distribution to shareholders +50% 105.0 cents

3
GROWTH RECORD SINCE LISTING from Continuing Operations
73 353 936 1,104 1,561 1,890 2,202
2,815 3,449
4,026 4,682
8,441 9,619
12,383
1998 1999 2000 2001 2002 2003 2004 2005 2006 2007 2008 2009 2010 2011
Growth in Revenue since Listing CAGR = Revenue 48%
R'm
illio
ns
14 72 211 300 416 501 632 833 987
1,198 1,314
2,269 2,633
3,411
1998 1999 2000 2001 2002 2003 2004 2005 2006 2007 2008 2009 2010* 2011*
Growth in EBITA since Listing CAGR = EBITA 53%
R'm
illio
ns
R'm
illio
ns
* 2010 and 2011 EBITA are normalised EBITA
4 17 26 47 63 79 104
138 185
210 226
378
456
544
1998 1999 2000 2001 2002 2003 2004 2005 2006 2007 2008 2009 2010* 2011*
Growth in HEPS since Listing CAGR = HEPS 46%
Ce
nts
pe
r Sh
are
* 2010 and 2011 HEPS are normalised HEPS

4
Year Ended 30 June 2010
R million
Year Ended 30 June 2011
R million
% Change
ABRIDGED INCOME STATEMENT
Continuing Operations
Revenue 12 383 9 619 +29%
Gross profit 5 614 4 476 +25%
Net operating expenses (2 322) (1 851)
EBITA 3 292 2 625 +25%
Amortisation (143) (101)
Operating profit 3 149 2 524 +25%
Net funding costs (412) (365)
Share of after tax loss of associates - (2)
Profit before tax 2 737 2 157 +27%
Tax (582) (458)
Profit after tax from continuing operations 2 155 1 699 +27%
Profit after tax from discontinued operations 434 280
Profit for the year 2 589 1 979 +31%
EPS 595.5 cents 494.9 cents +20%

5
Unadjusted Year Ended
30 June 2011 R million
Year Ended 30 June 2010
R million
Year Ended 30 June 2011
R million
% Change
ADJUSTED INCOME STATEMENT
CONTINUING OPERATIONS
Revenue 12 383 12 383 9 619 +29%
Gross profit 5 614 5 614 4 476 +25%
Net operating expenses (2 322) (2 126) (1 739)
EBITA 3 292 3 488 2 737 +27%
Amortisation (143) (143) (101)
Operating profit 3 149 3 345 2 636 +27%
Net funding costs (412) (376) (356)
Share of after tax loss of associates - - (2)
Profit before tax 2 737 2 969 2 278 +30%
Tax (582) (602) (457)
Profit after tax 2 155 2 367 1 821 +30%
Normalised HEPS 544.3 cents 455.7 cents +19%
Diluted normalised HEPS 523.3 cents 437.7 cents +20%
* * Adjusted for headline earnings adjustments and to add back transaction and restructuring costs
6
BENCHMARKING PERFORMANCE EXPECTATIONS
CONTINUING DISCONTINUED TOTAL
R millions R millions R millions
Revenue 12 383 494 12 877
Normalised operating profit 3 268 58 3 326
Normalised headline earnings 2 357 44 2 401
Normalised headline earnings per share 544 cents 10 cents 554 cents
Diluted normalised headline earnings per share 523 cents 10 cents 533 cents

7
DISCONTINUED OPERATIONS BY BUSINESS SEGMENT
SA SSA INTERNATIONAL TOTAL
R millions R millions R millions R millions
Discontinued revenue 67 - 427 494
Discontinued normalised operating profit 2 - 56 58
Discontinued normalised headline earnings 1 - 43 44

8
REVENUE FROM CONTINUING OPERATIONS
0
1000
2000
3000
4000
5000
6000
SA Pharma SA Consumer Sub-Saharan Africa Asia Pacific Latin America Rest of the World
2010 2011
According to Customer Geography
+15%
+3% +43%
+122%
+19%
+12%
R m
illio
ns

9
GROUP OPERATING MARGIN
26.9% 27.2% 27.1%
26.4%
20%
21%
22%
23%
24%
25%
26%
27%
28%
29%
30%
2008 2009 2010 2011
Based on Gross Revenue and Adjusted Operating Profit
Operating margin generally stable

10
REGIONAL PERFORMANCE : SOUTH AFRICAN BUSINESS
48%
2011
Gross Revenue
55%
2010
55%
2011
60%
2010
Adjusted Operating Profit
4,309
5,575
6,296
2009 2010 2011
Gross Revenue
R m
illio
ns
+29% +13%
1,102
1,639
1,934
2009 2010 2011
Adjusted Operating Profit
R m
illio
ns
+49% +18%
25.6%
29.4% 30.7%
2009 2010 2011
Operating Margin based on Gross Revenue and Adjusted Operating Profit
from Continuing Operations

11
REGIONAL PERFORMANCE : SUB-SAHARAN AFRICA
10%
2011
Gross Revenue
9%
2010
5%
2011
3%
2010
Adjusted Operating Profit
931 910
1,301
2009 2010 2011
Gross Revenue
R m
illio
ns
-2% +43%
178
72
177
2009 2010 2011
Adjusted Operating Profit
R m
illio
ns
-60% +145% 19.2%
7.9%
13.6%
2009 2010 2011
Operating Margin based on Gross Revenue and Adjusted Operating Profit

12
REGIONAL PERFORMANCE : INTERNATIONAL
42%
2011
Gross Revenue
36%
2010
40%
2011
37%
2010
Adjusted Operating Profit
3,201 3,603
5,617
2009 2010 2011
Gross Revenue
R m
illio
ns
+13% +56%
1,014 1,023
1,377
2009 2010 2011
Adjusted Operating Profit
R m
illio
ns
+1% +35%
31.7% 28.4%
24.5%
2009 2010 2011
Operating Margin based on Gross Revenue and Adjusted Operating Profit

13
DISPOSALS & OTHER DISCONTINUED BUSINESSES
• Onco Laboratories Limited Disposed of with effect from 1 February 2011 Proceeds of R602 million Profit on disposal of R368 million
• Balance of Co-pharma Limited Disposed of with effect from 1 July 2010 Proceeds of R26 million Profit on disposal of R7 million
• Products acquired from GSK for territories of India, Pakistan, Bangladesh, Sri Lanka and Afghanistan Disposed of with effect from 1 June 2011 Proceeds of R115 million Neutral profit
• Campos facility and related hospital products in Brazil Disposal completed 1 July 2011 Classified as “Held for sale” Proceeds of approximately R450 million
• Personal care brands Various completed disposals Includes Playboy, Vinolia and Formule Naturelle Proceeds of R38 million Toothpaste brands agreement signed last week Classified as “Held for sale” Proceeds of R70 million plus stock

14
OPERATING CASH FLOWS
2011 Rm
2010 Rm
Change
Cash operating profit 3 845 3 269
Changes in working capital (463) (344)
Cash generated from operations 3 382 2 925
Net finance costs paid (401) (427)
Tax paid (535) (465)
Cash generated from operations 2 446 2 033 +20%
Normalised operating cash flow per share from continuing operations
580.8 cents 473.0 cents +23%
Operating profit to cash flow conversion rate 107% 104%
Working capital as a percentage of Revenue* * annualised
22.5% 25.3%
Discontinued operations (44) (138)
Normalisation adjustments 112 6
Normalised cash generated from continuing operations 2514 1 901 +32%

15
ABRIDGED BALANCE SHEET
Year Ended June 2011
Year Ended June 2010
R'm R'm Assets Non-current assets 17 423 12 178
Tangible fixed assets 3 652 3 012
Goodwill 4 627 456
Intangible assets 8 917 8 610
Other non-current assets 227 100
Current assets 6 335 4 683
Cash 3 039 2 940 26 797 19 801
Equity and Liabilities Capital and reserves 13 287 10 886
Non-current liabilities 5 302 3 086
Preference shares-liability 381 387
Long term interest bearing debt 4 249 2 260
Other non-current liabilities 672 439
Short term interest bearing debt 5 138 3 720
Other current liabilities 3 070 2 109 26 797 19 801

16
INVESTMENT IN PROPERTY PLANT & EQUIPMENT
More than R2.5 billion in 5 years
R’ m
illio
n
289
382
630 636 651
2007 2008 2009 2010 2011
60 75
119
168
215
0
100
200
300
400
500
600
700
Depreciation Capital Expenditure

17
DEBT & LIQUIDITY TRENDS
60%
40% 48% 52%
Equity Debt
76%
24%
66%
34%
R'm
illio
ns
709 652
1,292
2,033 2,446
977
2,011
4,432
3,428
6,729
2007 2008 2009 2010 2011
Net cash flow from operating activities Net debt
71%
29%
18
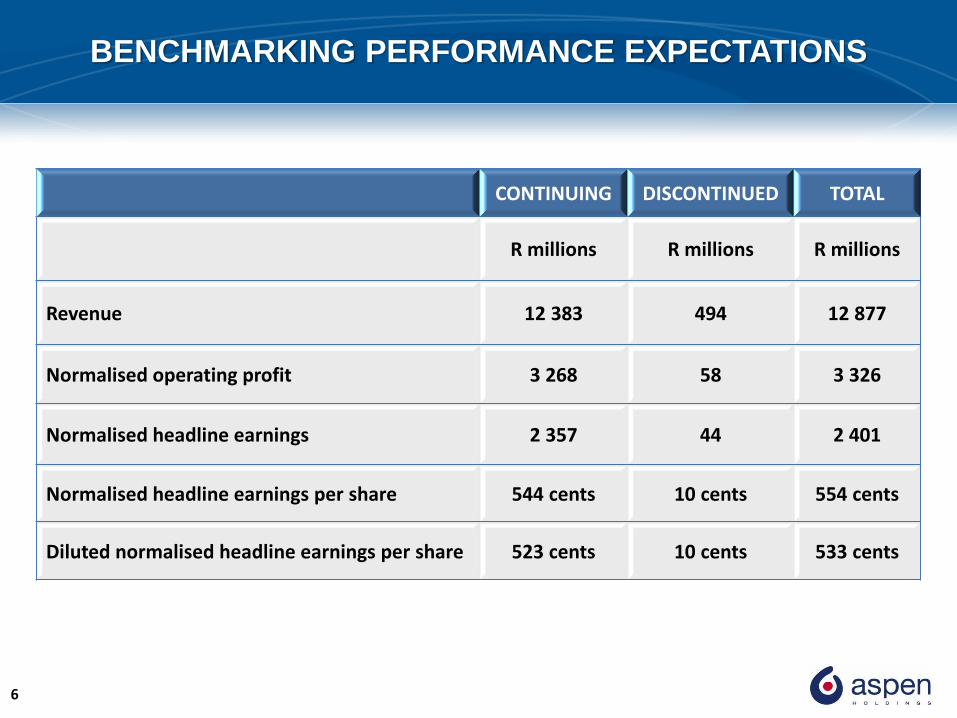
BORROWINGS ARRANGEMENTS
New arrangements have been agreed in
principle with our funders
Agreements due to be signed by end of the
month
• 3 separate “debt pools” independent of one
another
• Unsecured funding
• Holding company guarantee only in regional
debt pool
SA / SSA
R3.5 billion
International
R1.8 billion
Asia Pacific R1.0 billion
Total R6.3 billion
Each region is able to access and raise
its own debt independently.
Blended cost of finance approximately 7%,
variable with LIBOR, JIBAR etc.

19
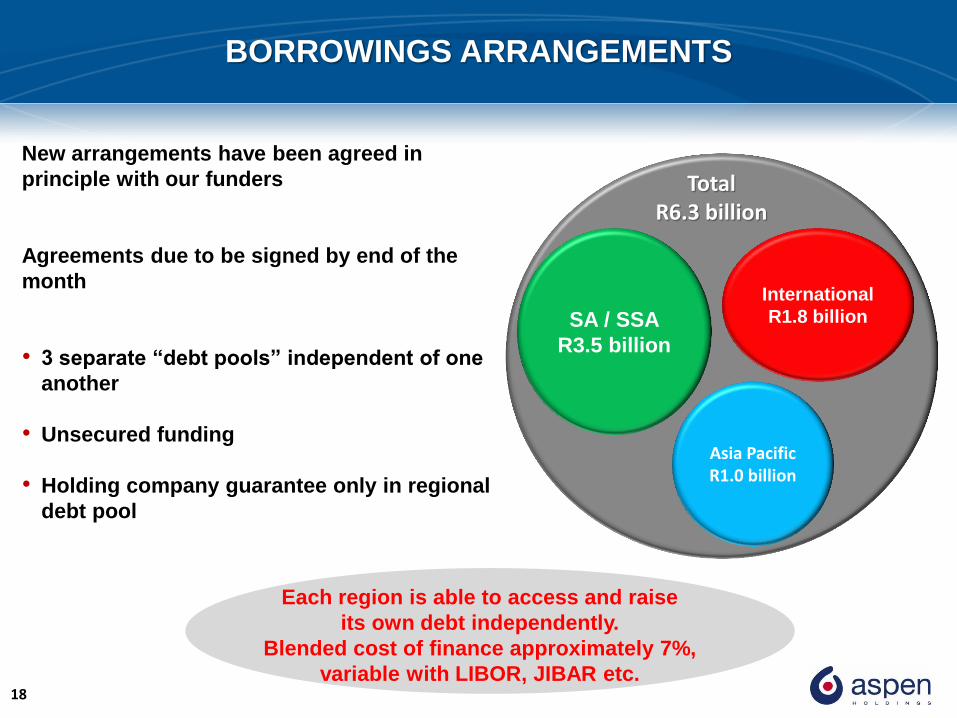
SIGMA ACQUISITION
• Completed on 31 January 2011
• Purchase consideration reduced from AUD900 million to AUD863 million (R6.1 billion) Based on value of take-on of working capital
• Cash outflow reduced by further R169 million due to favourable cash flow hedge
• Detailed exercise conducted to fairly value assets and liabilities acquired
• Goodwill of R4.0 billion Benefits of consolidation
Expected savings in cost of goods
• Integration plan almost complete and successful beyond expectations
20
SIGMA ACQUISITION
• Asia Pacific will be reported as a separate region in the forthcoming year 2011 Revenue : R3.0 billion
2011 Adjusted operating profit : R0.6 billion
WE SAID WE DID
• HEPS close to neutral
• Transaction and restructuring costs of more than R100 million likely
• Net debt of approximately R7 billion
• Gearing of 35% - 40%
HEPS positive
Transaction and restructuring cost of R136 million
Net debt of R6.7 billion
Gearing of 34%

21
DISTRIBUTION OF FUND MANAGERS
South Africa 38%
North America
35%
Middle East 1%
Asia Pacific 3%
Europe 23%
As at December 2010
South Africa 44%
North America
29%
Middle East 0.4%
Asia Pacific 2%
Europe 25%
As at June 2010
South Africa 54%
North America
23%
Middle East 1%
Asia Pacific 3%
Europe 19%
As at June 2011
The Bokke are back!

22
ASPEN ~ OUR HISTORY SO FAR
• From start up in 1996 to largest pharma company in South African market Number 1 in public and private market
1 in 4 scripts dispensed is for Aspen medicine
• Largest in Sub-Saharan Africa Collaboration number 1 pharma company in Sub-Saharan Africa
Number 1 generic player across East Africa
• From a 2001 start up operation in Australia Number 1 by scripts dispensed
Sales of R15 million per day
• 13 years of unbroken growth From zero to R10 million per day of operating profit
• Globally now a top 10 generic player Largest generic manufacturer in the southern hemisphere
Competitive even against Asians
• First accreditation by FDA of tentatively approved generic ARV Beat all other global competitors
Responsible for about 1 million African lives
• Our CSI touches over 800 000 lives

23
ASPEN’S FOCUS
• Aspen legacy in South Africa stretches back to 1850 and to the original Lennon brand
• Aspen’s business has evolved globally over the past decade – now the leading generic
manufacturer in the southern hemisphere
• To achieve our objectives for quality, affordable healthcare primarily into the emerging
markets, we have and are focussing on
Significant upgrade of manufacturing capability, quality and capacity
Economies of scale
Establishing representation and distribution platforms across emerging markets
Establishing partnerships with both multinationals and Asian developers / manufacturers
Selecting management teams that are decisive and entrepreneurial
Centralised bureaucracy has no place here!
To rest is to rust
Is Aspen targeting the right market segments?
Quality Affordable Medicine for All

24
SPENDING GROWTH FELL BY $20 BILLION IN 2010, MOSTLY
OCCURRING IN THE DEVELOPED MARKETS
IMS Global Market Prognosis
Global Growth : 2002 - 2010

25
PHARMERGING MARKETS AND GENERICS ARE THE ONLY
DRIVERS OF GROWTH
Components of Change in Total Spending
IMS Global Market Prognosis

26
AN ACCELERATED SHIFT IN SPENDING ON
GENERICS IS EXPECTED
IMS Global Market Prognosis
Spending by Segment
27
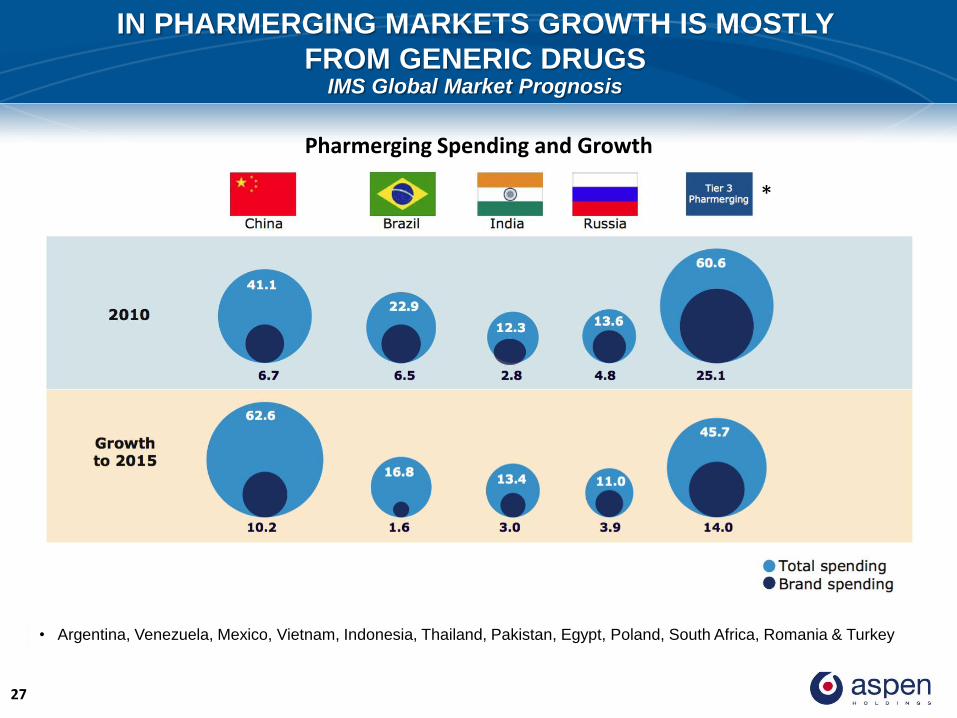
IN PHARMERGING MARKETS GROWTH IS MOSTLY
FROM GENERIC DRUGS
*
• Argentina, Venezuela, Mexico, Vietnam, Indonesia, Thailand, Pakistan, Egypt, Poland, South Africa, Romania & Turkey
Pharmerging Spending and Growth
IMS Global Market Prognosis

28
ASPEN IN THE SOUTH AFRICAN MARKET MAT Share Value
16.8 16.9 17.0 17.1 17.1 17.1 17.1 17.1 17.0 17.0 16.8 16.8 16.6
10.0 10.0 9.9 9.9 9.9 9.9 10.0 9.9 9.9 9.8 9.8 9.7 9.7
7.6 7.6 7.6 7.6 7.5 7.5 7.5 7.5 7.6 7.6 7.7 7.5 7.7
6.9 6.8 6.8 6.7 6.7 6.7 6.6 6.6 6.6 6.5 6.4 6.4 6.4
4.9 5.0 5.0 5.1 5.1 5.1 5.1 5.1 5.2 5.3 5.3 5.2 5.2
4.0 4.0 4.0 3.9 3.9 3.9 3.9 3.9 3.9 3.9 3.9 4.0 4.0
3.8 3.8 3.7 3.7 3.7 3.7 3.7 3.7 3.6 3.6 3.6 3.6 3.7
-
2.0
4.0
6.0
8.0
10.0
12.0
14.0
16.0
18.0
Jun-10 Jul-10 Aug-10 Sep-10 Oct-10 Nov-10 Dec-10 Jan-11 Feb-11 Mar-11 Apr-11 May-11 Jun-11
Aspen Adcock Ingram Sanofi Pfizer Novartis
Cipla Medpro AstraZeneca Merck & Co Johnson & Johnson Roche
Pe
rce
nta
ge s
har
e o
f th
e m
arke
t

29
ASPEN IN THE SOUTH AFRICAN MARKET
The March 2011 Campbell Belman Confidence Predictor showed Aspen as the leading pharmaceutical company in South Africa
2011 2010 2009
Pharmacy 1 1 2
Managed Healthcare Providers 1 1 5
Managed Healthcare Funders 1 1 5

30
ASPEN IN THE SOUTH AFRICAN MARKET Campbell Belman Results Peer Review – December 2010
Campbell Belman research conducted amongst 138 Asset Managers, 58 Analysts and 12 Members of the Financial Media
0
10
20
30
40
50
60
70
80ASPEN ADCOCK CIPLA
Is fin
ancia
lly
sound &
secure
Has a
str
ong
cash flo
w
Has c
learl
y d
efi
ned
ob
jecti
ve/s
trate
gy
Is a
well
man
ag
ed
co
mp
an
y
Is r
eputa
ble
, honest
and tru
stw
ort
hy
Belie
ves in
full
dis
clo
sure
Makes e
ffective
use o
f capital
Co.
report
s r
eflect
co. perf
orm
ance
Has in
here
ntl
y s
tro
ng
pro
du
cts
/serv
ices
Ale
rt t
o n
ew
id
eas
for
pro
fita
bil
ity
Has a
n e
ffecti
ve
ch
ief
exe
cu
tiv
e
Has a
cle
ar
ed
ge
ov
er
its c
om
peti
tors
Is f
inan
cia
lly
so
un
d &
secu
re
Co
. re
po
rts r
efl
ect
Co
. p
erf
orm
an
ce
Has s
tro
ng
cash
flo
w
Is r
ep
uta
ble
, h
on
est
& t
rustw
ort
hy
Has c
learl
y d
efi
ned
ob
jecti
ve/s
trate
gy
Is a
well
man
ag
ed
co
mp
an
y
Believ
es in
fu
ll
dis
clo
su
re
Co
mm
un
icate
s w
ell
wit
h in
vesto
rs
Makes e
ffecti
ve
use o
f cap
ital
Has in
here
ntl
y s
tro
ng
pro
du
cts
/serv
ices
Ale
rt t
o n
ew
id
eas
for
pro
fita
bilit
y
Has a
n e
ffecti
ve
Ch
ief
Execu
tiv
e

31
ASPEN IN THE SOUTH AFRICAN MARKET Campbell Belman Results Peer Review – December 2010 continued
Campbell Belman research conducted amongst 138 Asset Managers, 58 Analysts and 12 Members of the Financial Media
0
10
20
30
40
50
60
70ASPEN ADCOCK CIPLA
Feel co
nfi
den
t in
its
lon
g t
erm
fu
ture
Ch
ief
execu
tiv
e is
a s
traig
ht
talk
er
Has a
cle
ar
ed
ge
Ov
er
its c
om
peti
tors
Sen
ior
man
ag
em
en
t
accessib
le
Str
on
g g
row
th
po
ten
tial
Main
tain
s b
ala
nce
be
tween
ris
k &
retu
rn
Co
mp
an
y r
esu
lts
matc
h e
xp
ecta
tio
ns
Has g
oo
d r
ela
tio
nsh
ips
wit
h g
ov
ern
men
t
Pra
cti
ces c
sr
wit
ho
ut
detr
acti
ng
ap
peal
Has a
go
od
reco
rd
of
lab
ou
r re
lati
on
s
Qu
ality
of
its
peo
ple
im
pre
ssiv
e
Has e
xcellen
t
inv
esto
r re
lati
on
s
32
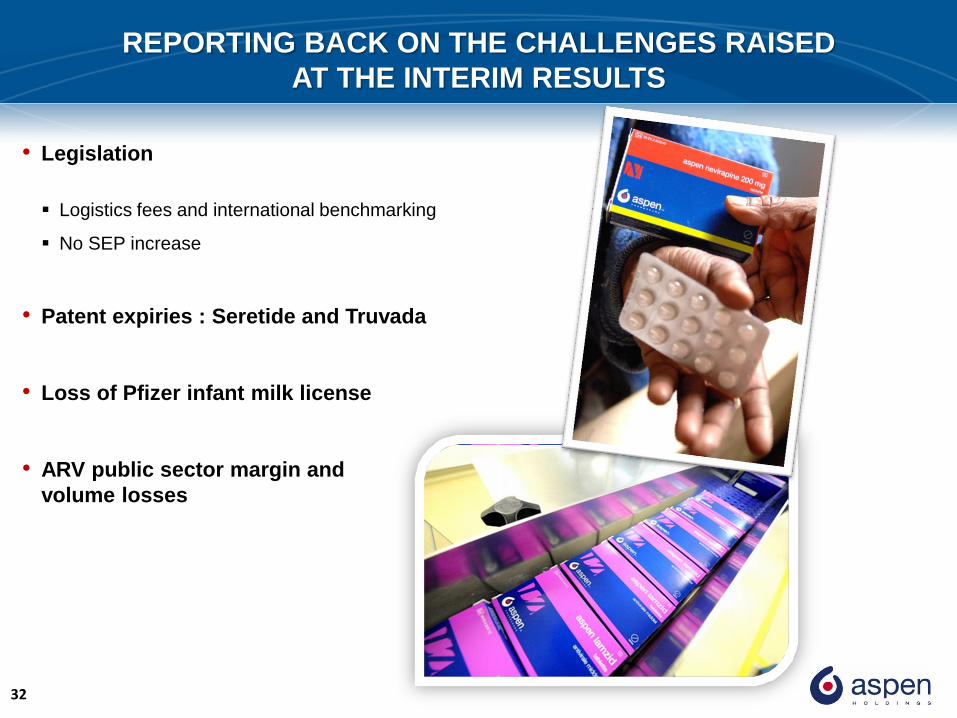
REPORTING BACK ON THE CHALLENGES RAISED
AT THE INTERIM RESULTS
• Legislation
Logistics fees and international benchmarking
No SEP increase
• Patent expiries : Seretide and Truvada
• Loss of Pfizer infant milk license
• ARV public sector margin and
volume losses

33
LEGISLATION
• Impact on originator products
• Comprehensive submission from PTG Focus is on access
Significant industry push back
• Impact still uncertain
• Shared with GSK
• Unlikely to be material to Aspen
• Regulator has conceded quantum is low and has withdrawn and intends re-issuing the
Gazette
Too early to comment on likely outcomes
Aspen does not anticipate significant downside
Extract figure 10.1 from the Government Gazette
Page 60 – 17 December 2010

34
LEGISLATIVE CHALLENGES
• Currency impact
• Local CPI factors
• Currency risk FECs provide some relief
• Volume growth to drive sales Margin percentage still effected, but absolute margin can be protected
• Facility costs Increased local volume
Shift of international volumes to South Africa
Assessing movement away from Eskom to solar – feasibility being performed
• SEP is a currency roller coaster The Rand’s relative strength will continue to influence local producers’ versus importers’ competitiveness
No SEP Increase – Margin Pressure for Local Producers
In spite of above challenges, volume increases, efficiencies &
cost containment will maintain margins

35
PATENT EXPIRATION OF TRUVADA / SERETIDE
2011 Sales : R150 million
2012 Forecast sales : R50 million
Most sales lost to launch of Atripla • First once a day three in one regimen
• Sales also lost to generics
Aspen generic forecast to sell R40 million
Awaiting registration of generic triple combination
2011 Sales : R150 million
Stellar performance of brand defence
Unit share of Seretide post patent and
Foxair > Seretide pre patent
Value also inclining, gap nearly closed

36
SERETIDE & FOXAIR UNIT PERFORMANCE
0
10,000
20,000
30,000
40,000
50,000
60,000
July August September October November December January February March April May June
FOXAIR SEREFLO HFA SERETIDE SERETIDE & FOXAIR SERETIDE PY AVE

37
SERETIDE & FOXAIR VALUE PERFORMANCE
0
2,000,000
4,000,000
6,000,000
8,000,000
10,000,000
12,000,000
14,000,000
16,000,000
July August September October November December January February March April May June
FOXAIR SEREFLO HFA SERETIDE SERETIDE & FOXAIR SERETIDE PY AVE

38
ANTIRETROVIRALS (ARVs)
• How much do ARVs costs? Triple combinations cost R50 - R100 per person per month
• The ARV cost for 1 million people on treatment therefore cost government about
R1 billion
Estimated lives on treatment is 1.3 million with a intention to double CD4 count now lowered
In last 4 months ARV turnover has slumped to 30% -50% of that anticipated Significant receipts of donor funded stock Last PEPFAR orders Government intimated situation will normalise within a few months
Profits are slim and real value for Aspen is in the recovery of overheads in the manufacturing facility Impact on sales material particularly H1 South African sales growth a challenge (H1 H2 )
• Key issues for Aspen is not margin loss, but facility structured for volumes forecast If volumes follow as promised – no issues If not, restructure needed to take out about R3 million per month of volume related costs
Material negative impact on sales line – particularly H1
Potential operational disruption – greatest challenge

39
IN DEFENCE OF OUR INFANT MILK FORMULA BUSINESS
• Pfizer license lost Sales R250 million
• Aspen has its own brand Infacare Infacare is larger than the Pfizer brand in South Africa
Infacare Gold range launched
Manufacturing / formulation expertise
Making strong in-roads into premium market
• Aspen has much spare local capacity Capacity enhancement post the explosion
Elected not to make the Pfizer brand
Aspen opted rather to tender
Competitors Abbott / Nestle
• 3 year tender was successful beyond all expectations Awarded 100% of 7 material tender items
Value being ascertained
Sales to start October
Annualised sales and margin anticipated to cover entire Pfizer gap
Largest impact H2
Succeeded beyond expectations – next step – going global!

40
ASPEN & THE SOUTH AFRICAN MARKET Market Performance
Other R0.68bn (R0.64bn)
Ethical/Branded R11.76bn
(R11.46bn)
Generics R5.16bn (R4.57bn)
OTC R5.92bn (R5.47bn)
Units growth 2.44% (7.08%) – driven by generic volume growth
Total Private Market as at June 2011 R23.52bn
(June 2010: R22.14bn)

41
ASPEN & THE SOUTH AFRICAN MARKET MAT Market Growth – July 2010 – June 2011
10.7
9.6
8.9
9.8
8.9 8.4 8.4
10.0 9.7
8.6
4.7
6.3
9.5
8.5 7.9
8.8
7.7
6.9 6.7
7.7
6.9
5.6
0.8
2.6
14.5
13.5 12.8
13.6 13.0 12.9
13.3
15.3 15.4
14.2
11.1
13.1
11.4
10.2
9.0
10.1
8.8 8.8 9.0
11.1 11.4
10.7
7.4
8.1
0
2
4
6
8
10
12
14
16
18
Jul-10 Aug-10 Sep-10 Oct-10 Nov-10 Dec-10 Jan-11 Feb-11 Mar-11 Apr-11 May-11 Jun-11
MARKET ETHICAL GENERIC OTC

42
ASPEN & THE SOUTH AFRICAN MARKET Total Aspen & Portfolio MAT Growth - July 2010 – June 2011
13.0 13.2 12.9 13.1 12.2
11.3 12.3 12.3
11.9
9.3
5.2 5.2
18.6 18.8 18.2 18.3
15.4
13.0 12.7
11.0
9.2
5.2
-1.7
-4.1
11.6
12.9 13.6
14.3 14.3 14.6
17.1 17.8 18.1
15.3
11.7
13.6
13.0
11.3 10.5
8.9 8.0
7.0 7.7
8.6 8.3
6.7
4.8 5.1
-10.0
-5.0
0.0
5.0
10.0
15.0
20.0
Jul-10 Aug-10 Sep-10 Oct-10 Nov-10 Dec-10 Jan-11 Feb-11 Mar-11 Apr-11 May-11 Jun-11
MARKET ETHICAL GENERIC OTC
Outpacing
the market
generically
Seretide
Truvada
effect

43
ASPEN & THE SOUTH AFRICAN MARKET
MAT Value Share of the Generics Market
June 2011 : R5.16bn (June 2010 : R4.57bn)
Aspen 31%
Cipla Medpro 16% Adcock Ingram 10%
Other 10%
Novartis 9%
Daiichi Sankyo 5%
Servier 4%
Lupin 4%
Sanofi Aventis 3%
Mylan 2% Pfizer 2% Pharmaplan 2%
Ranbaxy 1% Dr Reddys 1%

44
ASPEN & THE SOUTH AFRICAN MARKET Ethical vs Generic Split – MAT Value Share
28
%
28
%
28
%
28
%
28
%
28
%
28
%
28
%
28
%
28
%
28
%
28
%
28
%
29
%
29
%
29
%
29
%
29
%
29
%
29
%
29
%
30
%
30
%
30
%
31
%
72
%
72
%
72
%
72
%
72
%
72
%
72
%
72
%
72
%
72
%
72
%
72
%
72
%
71
%
71
%
71
%
71
%
71
%
71
%
71
%
71
%
70
%
70
%
70
%
69
%
GENERIC ETHICAL
Per
cen
tage

45
ASPEN & THE SOUTH AFRICAN MARKET Ethical vs Generic Split – MAT Counting Unit Share
Generics have a 61% volume share but 31% value share
58
%
58
%
58
%
58
%
59
%
59
%
59
%
59
%
59
%
59
%
59
%
59
%
59
%
59
%
59
%
60
%
60
%
60
%
60
%
60
%
60
%
61
%
61
%
61
%
61
%
42
%
42
%
42
%
42
%
41
%
41
%
41
%
41
%
41
%
41
%
41
%
41
%
41
%
41
%
41
%
40
%
40
%
40
%
40
%
40
%
40
%
39
%
39
%
39
%
39
%
GENERIC ETHICAL
Per
cen
tage

46
IMS ~ BRAND CLASSIFICATION CRITERIA
Ethicals / Branded
Generics
OTC
Nutritionals
Vaccines
Excluded
Products that are / were patent protected
Schedule 3-7 products that were never patent protected
Dual / second brands also included here
Schedule 0-2 products
Unscheduled and proprietary brands
Infant milk formula
Vaccines
Diagnostics / Devices / Hospital solutions
Reclassification can effect individual market sectors. However the total shares are not effected and trends in the individual market sector have been adjusted retrospectively.

47
FURTHER FACTORS FOR CONSIDERATION
IN SOUTH AFRICA
• Patent losses aside, Aspen’s base private pharma business has grown 16% by value Organic and new product launches
• Trust in the Aspen brand Aspen highly rated by Managed Healthcare Funders and Providers as well as GP’s
Target market getting focus
Aspen has the best people
• Preferential procurement legislation favours local manufacturers Pharmaceuticals sector designed for local procurement with effect December 2011
Alignment to BBBEE
• Cost competitiveness due to manufacturing efficiencies Global volumes drive down local costs
Improved public sector opportunities
• Value and relevance of product pipeline Serial launch mentality
48
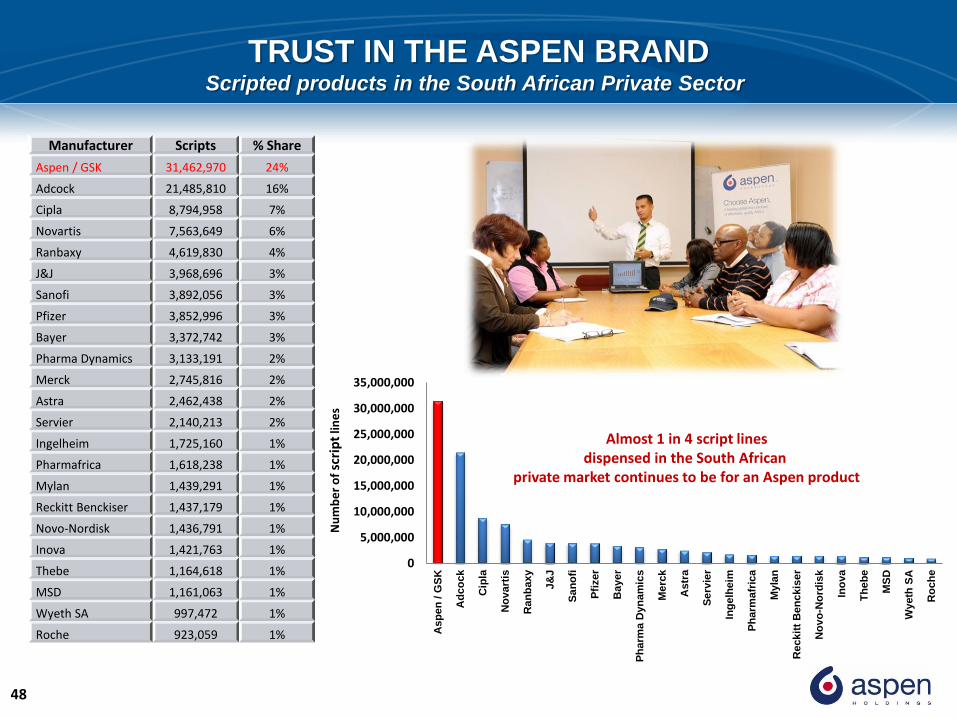
TRUST IN THE ASPEN BRAND Scripted products in the South African Private Sector
Almost 1 in 4 script lines dispensed in the South African
private market continues to be for an Aspen product
Nu
mb
er
of
scri
pt
line
s
0
5,000,000
10,000,000
15,000,000
20,000,000
25,000,000
30,000,000
35,000,000
Asp
en
/ G
SK
Ad
co
ck
Cip
la
No
vart
is
Ran
ba
xy
J&
J
Sa
no
fi
Pfi
zer
Bayer
Ph
arm
a D
yn
am
ics
Me
rck
Astr
a
Se
rvie
r
Ing
elh
eim
Ph
arm
afr
ica
My
lan
Reckit
t B
en
ckis
er
No
vo
-No
rdis
k
Ino
va
Th
eb
e
MS
D
Wyeth
SA
Ro
ch
e
Manufacturer Scripts % Share
Aspen / GSK 31,462,970 24%
Adcock 21,485,810 16%
Cipla 8,794,958 7%
Novartis 7,563,649 6%
Ranbaxy 4,619,830 4%
J&J 3,968,696 3%
Sanofi 3,892,056 3%
Pfizer 3,852,996 3%
Bayer 3,372,742 3%
Pharma Dynamics 3,133,191 2%
Merck 2,745,816 2%
Astra 2,462,438 2%
Servier 2,140,213 2%
Ingelheim 1,725,160 1%
Pharmafrica 1,618,238 1%
Mylan 1,439,291 1%
Reckitt Benckiser 1,437,179 1%
Novo-Nordisk 1,436,791 1%
Inova 1,421,763 1%
Thebe 1,164,618 1%
MSD 1,161,063 1%
Wyeth SA 997,472 1%
Roche 923,059 1%

49
PREFERENTIAL PROCUREMENT (PP)
• Current PP legislation has little or no alignment to BEE or local production
• This has often benefited imports over local production
• Public listed companies enjoyed no procurement benefit or empowerment credentials
• Regulations amended on 8 June 2011 and become effective on 7 December 2011
Certain sectors and products designated to local procurement
Pharmaceuticals will be designated
Designated tenders / products will be set aside for local production according to local content
Public procurement will be aligned to BEE scorecard
This will improve the quantum of local procurement, level playing
fields for listed entities, reward those companies with superior
BEE credentials and provide greater certainty on tender volumes

50
ASPEN’S MANUFACTURING COMPETITIVE ADVANTAGES
• Aspen’s strength lies in its ability to supply complexity and high volumes of products
reliably and cost competitively
• Manufacturing capabilities at the Port Elizabeth and East London facilities have been
rationalised
• Homogenous products types are produced at designated facilities
• Manufacturing capacity in the tabletting can be nearly trebled with only a small
increase in incremental variable costs
• Sufficient manufacturing capacity exists to produce required volumes for the domestic
and international market as well as to accommodate the introduction of international
brands
Manufacturing Capacity & Capability is aligned to the Group’s Growth Strategy
51
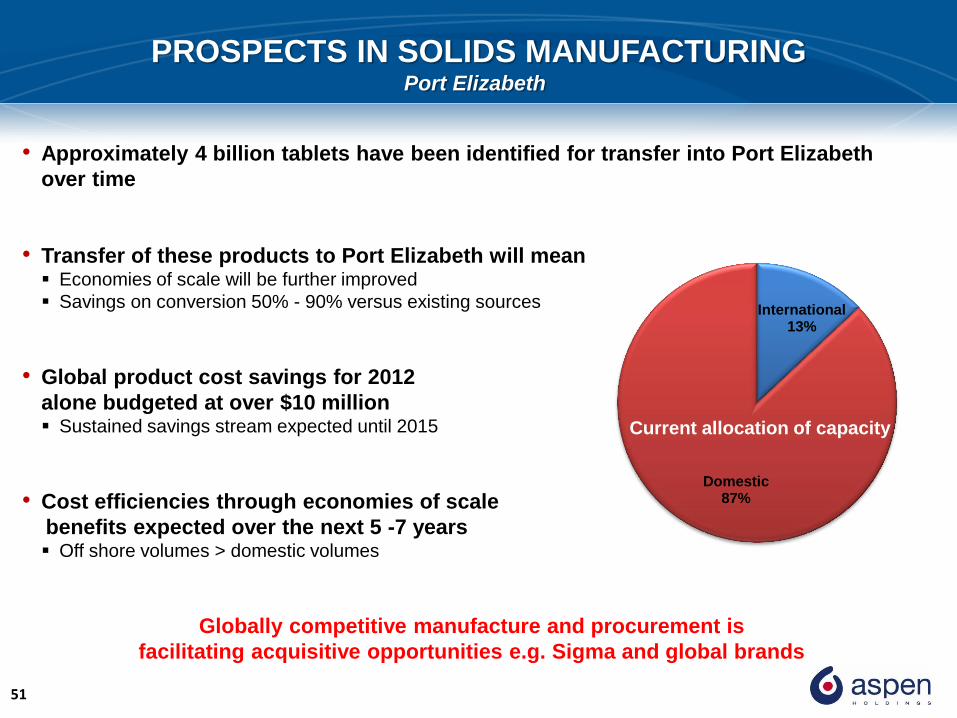
PROSPECTS IN SOLIDS MANUFACTURING
• Approximately 4 billion tablets have been identified for transfer into Port Elizabeth
over time
• Transfer of these products to Port Elizabeth will mean Economies of scale will be further improved
Savings on conversion 50% - 90% versus existing sources
• Global product cost savings for 2012
alone budgeted at over $10 million Sustained savings stream expected until 2015
• Cost efficiencies through economies of scale
benefits expected over the next 5 -7 years Off shore volumes > domestic volumes
Globally competitive manufacture and procurement is
facilitating acquisitive opportunities e.g. Sigma and global brands
Port Elizabeth
International 13%
Domestic 87%
Current allocation of capacity

52
COST COMPETITIVENESS Aspen in the South African Public Sector
2010 ARV Tender 2009 Solid Dosage Tender
A decade of Public Sector service leadership
Aspen 41%
Sonke 22%
Cipla Medpro 10%
Abbott 10%
Cipla 5%
Adcock 4%
Strides 4% Aurobindo 3%
Specpharm 1%
MSD 0%
Aspen 30%
Other 25%
Multinationals 19%
Biogaran 5%
Gulf Drug 4%
Cipla 3%
Daiichi Sankyo 3%
Adcock 3% Biotech 2%
Pharmachem 2% Sandoz 2% Dezzo 2%
Aspen 24%
Sanofi 18%
Dezzo 15% Pharmachem 7%
Be-Tabs 6%
Sandoz 6%
Merck 6%
Fresenius Kabi 3%
Ranbaxy 3%
Astra Zeneca 3%
Other 9% 2011 TB & Antibiotics
Infacare 1
Infacare 2
Melegi Acidified
Infacare Soya 1
Infacare Soya 2
Infacare Nurture
Infacare Anti-reflux
2011 Infant Nutritionals Tender – RT 9/01
Aspen won 100% of all powdered formulations on all tender categories in which Aspen participated.
Gauteng still needs to be awarded

53
NEW PRODUCT LAUNCHES – JUNE 2011 Value and Number of New Product Launches per Company
17
10
4
5
4 4
7
2
1
2
Value of Products Launched 0-12 months No. of Products launched 0-12 months

54
SUB-SAHARAN AFRICA
• Robust demand
• Rolling out more representation Support growing generic business Reps into Nigeria
• Dossier progress Dispatched 334 of 813 73 of the above for Nigeria, Kenya and Ghana
• Started receiving registrations - launches expected from January 2012 include Carvedilol and Rosuvastatin – Nigeria Metformin ER in Ghana
• Restructuring paying dividends
• Reliance on the public sector has been reduced significantly Tender business from 41% to 24% in 2011 Growth in the private sector business through focussed promotional efforts and new product launches Private market sales increased by 37% in 2011
Export business has grown to represent approximately 10% of Shelys Africa revenue
Sales for the region R1.3bn
and operating income at
R178m. Nearly 80% of sales
through the Collaboration
Africa is growing and pioneering now paying dividends
Now the leading pharma company in Sub-Saharan Africa

55
THE ASPEN DNA - TO REST IS TO RUST
“Every morning in Africa a gazelle wakes up. It knows it must move faster than the lion
or it will not survive. Every morning a lion wakes up and it knows it must move faster
than the slowest gazelle or it will starve. It does not matter if you are the lion or the
gazelle, when the sun comes up, you better be moving!
Not only are time zones different, but lions are mainly nocturnal – so you need to keep
moving night and day. Stay vigilant and be wary of anything that eats while you sleep!
Growing our international business has taken a supreme effort
and much sacrifice, but the contribution is now here for you all to see
The Aspen DNA per our Australian Team
Correction on Aspen DNA from South Africa
56
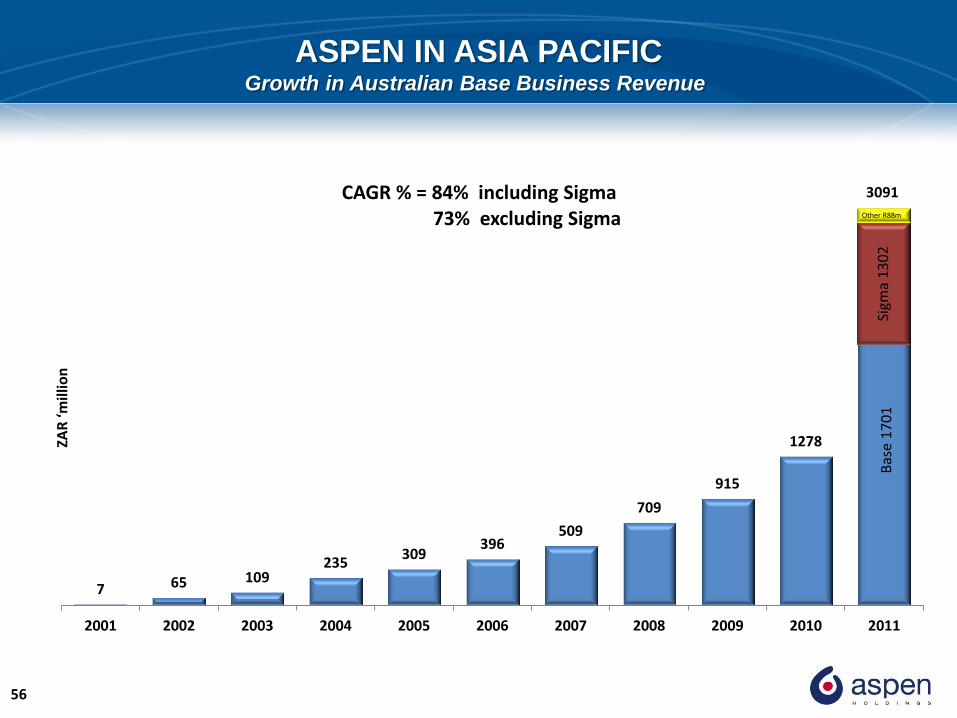
ASPEN IN ASIA PACIFIC Growth in Australian Base Business Revenue
ZAR
‘mill
ion
7 65 109 235
309 396
509
709
915
1278
3090
2001 2002 2003 2004 2005 2006 2007 2008 2009 2010 2011
CAGR % = 84% including Sigma 73% excluding Sigma
Sigm
a 1
30
2
Bas
e 1
70
1
Other R88m
3091

57
ASPEN IN ASIA PACIFIC
• 2001 start up
• 2011
• Aspen field force rated most effective and highly regarded –
independent survey by Cegedim
• Anticipated annualised sales over $700 million
• 800 employees
• Asian growth strategy central to region
• Herron brand voted by Readers Digest readers as one of the
pharma industry’s most trusted brands Part of our regional infant milk strategy
• Sigma integration is progressing well
Highlights in Australia
1 in 7 scripts for Aspen product
Number 1 by sales volume ex-pharmacy
Number 1 by prescriptions written
Number 7 by sales value

58
ASPEN IN ASIA PACIFIC (includes Sigma)
Rank Manufacturer No. of scripts % Share
1 Aspen Australia 17,947,615 13.92
2 Generic* 15,515,883 12.04
3 GlaxoSmithKline 13,284,020 10.30
4 Sanofi-Aventis 11,662,125 9.05
5 Alphapharm 8,932,342 6.93
6 Pfizer 8,535,945 6.62
7 AstraZeneca 8,085,928 6.27
8 MSD 4,449,315 3.45
9 Boehringer Ingelheim 3,513,038 2.73
10 Servier 3,010,859 2.34
11 Bristolmyer/Squibb 2,639,561 2.05
12 CSL 2,602,198 2.02
13 Mundipharma 2,591,439 2.01
14 Bayer Schering 2,352,647 1.82
15 Roche 2,216,925 1.72
16 Novartis 2,009,080 1.56
17 Wyeth 1,749,989 1.36
18 Janssen Cilag 1,582,680 1.23
19 Solvay Pharm 1,362,457 1.06
20 Others 14,873,294 11.54
Total 128,917,340 100.00
Aspen base business continues
to perform. Growth in sales
of 33% to R1.7 billion
Currently Australia represents majority
of Asia Pacific sales
Our team that leads >$700 million was the
same team that led a $7 million in 2001
Source IMS December 2010
The “A Team”

59
INTEGRATION PROCESS
Manufacturing
Sites
Tennyson – Brisbane – closed and sold
Croydon Research Drive – Melbourne – to be closed in H1 2012
Noble Park – Melbourne – phased closure – bulk in 2012
Distribution
Sites
Distribution outsourced / transferred or closed
Mansfield / Merrindale in Croydon – transferred to third party
Operational consolidation includes
• Key work streams for integration include Operations
Information Technology
Sales and Administration
Procurement
All going according to plan

60
INTEGRATION PROCESS Q
uality
Assu
ran
ce
& Q
uality
Co
mp
lian
ce
Croydon QA
Noble Park QA
Dandenong QA
Dandenong Quality Compliance
To be consolidated into single entity
Qu
ali
ty
Co
ntr
ol
Croydon
Noble Park
Dandenong
Also to be consolidated
Oth
er
Croydon Head Office
55000m2 site To be closed and sold

61
CONSOLIDATION / INTEGRATION PROCESS
• Leaner business Shaped for future competitiveness
• Manufacture concentrated at Dandenong in Melbourne
• Will meet all stringent regulatory requirements
• Central to strategy for roll out of quality product into
Asia Pacific Japanese requirements challenging
• Improved focus to the business Outsource manufacture / distribution options means business now focussed on harnessing commercial
strengths
• Local manufacturing opportunities include Liquids / creams
Consumer / OTC
Made in Australia
Local packing
Manufacture for Asia including Japan
Sustainable business model
62
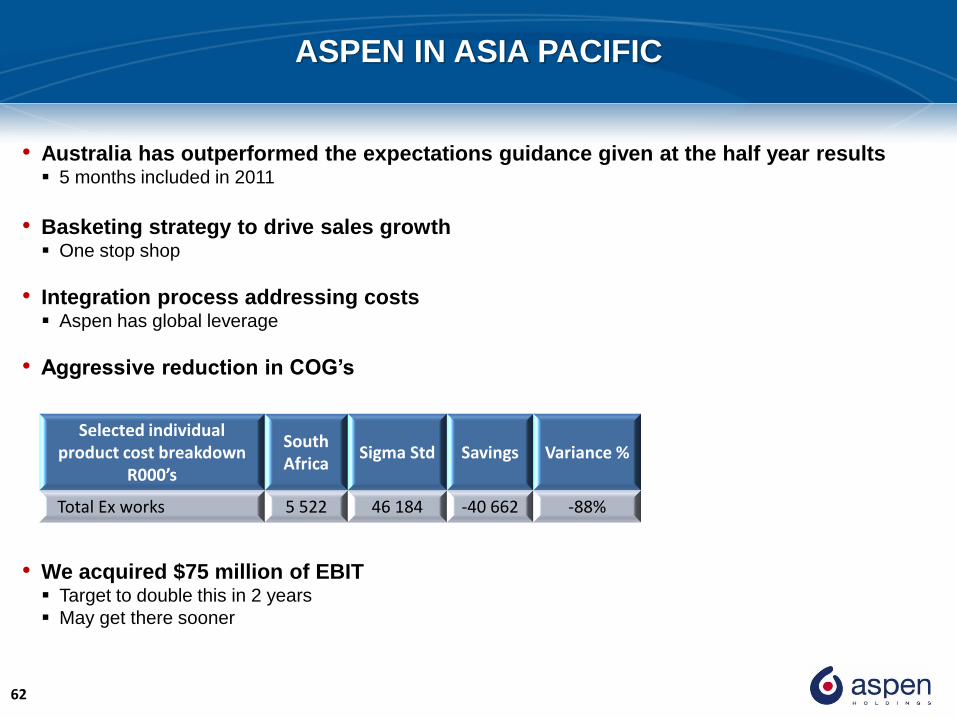
ASPEN IN ASIA PACIFIC
• Australia has outperformed the expectations guidance given at the half year results 5 months included in 2011
• Basketing strategy to drive sales growth One stop shop
• Integration process addressing costs Aspen has global leverage
• Aggressive reduction in COG’s
• We acquired $75 million of EBIT Target to double this in 2 years
May get there sooner
Selected individual product cost breakdown
R000’s
South Africa
Sigma Std Savings Variance %
Total Ex works 5 522 46 184 -40 662 -88%

63
ASPEN IN ASIA PACIFIC
• Australia launch pad for growth into Asia Quality well accepted
• Intention is to convert third party structures into Aspen controlled
and managed representation Needs critical mass
• A CEO has been appointed for the Philippines Marcelina T. Itchon
• 80 - 100 representatives will be employed Expect to be online by Q1 2012
• Additional regional territorial roll out to be expected
Asian Roll Out Begins

64
SAD vs SIGMA The Parallels
Comments
“When the mouse swallows the
elephant it tends to get indigestion”
There can only be one result.
“They have overpaid. There are no
obvious synergies.”
Results
We acquired R123 million of profit.
We doubled it the following year.
We had neither scale nor global
manufacturing skills
Comments
“South African companies fail in Australia”.
“This one will be a bridge too
far for Aspen”
Results
We are also on track to double.
Given our relative base in Australia and
global manufacturing skills, the task is
easier and the numbers are just that
much larger!
Great teams – superior results
Go you good things!

65
LATIN AMERICA
• Market size R$33 billion ($21 billion) 7 times the size of South Africa
• Fragmented 60 000 pharmacies and 400 wholesalers
• Market growing at 19% High priced market
• Social pyramid shifting annually!

66
LATIN AMERICA
• Foundations finally in place on which to build an Aspen style business
• Appointed highly energetic CEO for Brazil Alexandre Franca
Ex-BMS Executive : Sales & Marketing
Has Aspen DNA
Passionate, focussed, decisive and driven
• Cellofarm renamed Aspen
• Business transformed 100% Public sector 20% commodities
Zylpen / Heptron sold to Strides
Emphasis on brand building and organic pipeline
Sales growth of 25% achieved
• Acquisitive / partnering opportunities being explored • Local brands R$12 million acquired

67
LATIN AMERICA Average price level in Brazil & Mexico higher than in other Pharmerging Markets
Average Standard Unit Price – Retail (US$ / Unit) 0.66
0.42 0.40
0.34 0.33 0.32 0.30
0.18
0.28
0.23 0.23
0.08 0.06
0.04
USA Germany Italy France Spain Japan Canada UK Mexico Turkey Brazil Russia SouthKorea
India
Ave
rage
Pri
ce (
US$
)
G8 Pharmerging
Source : IMS / MIDAS – QTR April 2009

68
LATIN AMERICA
• Mexico market size US$ 7.7 billion Aspen ranked 50th
• Venezuela market size US$ 6.2 billion Aspen ranked 78th
• Consolidated the geography under Mexico Simplified supply chain
Rationalise pack presentations
Assisted with MOQ
• Markets generally have high prices Prefer brands / branded generics
• Opportunities being actively explored for products and partnering Organic pipeline sales flow from 2012
Brazil 54%
Mexico 24%
Venezuela 11%
ROLA 11%
Latam Sales R925m

69
SUMMARY & PROSPECTS
• Expect another year of solid growth for Aspen Growth drivers largely offshore Primarily the Asia Pacific region
• South African business has performed and shown resilience Challenges raised at interims blunted Patented products and infant milks aggressively defended Strong volume growth
• South African prospects Relative performance to improve throughout the year
• H1 Sales negatively impacted by ARV off takes Donor effect
Last year still had full IMF, ARVs and patented products Strike Organic volume growth from base business
• H2 ARVs to “normalise” Donor stock washout
Lesser impact on IMF, ARVs and patented products Full effect of the IMF tender No strike! Organic volume growth from base business Potential SEP price impact (0% - 4%)

70
SUMMARY & PROSPECTS
• Organic pipeline to retain our leadership position and drive growth
• Opportunity for additional collaborations with multinationals
• Focus on maintaining the underlying pharma base growth rates at the 16% achieved last year
• Growth of this region to drive Group sales numbers through Leveraging basket of products Roll out of pipeline
• Sigma included for 12 months
• Synergetic savings Cost of goods and integration cost savings Expect savings over 3 years
• Anticipated aggressive regional roll out Philippines to have Aspen representation before financial year end
• Both regions now on track Anticipate both organic and inorganic growth
• Markets enjoy strong underlying growth fundamentals Classic emerging market make up

71
SUMMARY & PROSPECTS
• Competitive edge that often underpins deal success
• Anticipate increased economies of scale in South African facilities Drive improved COGs 5- 7 year opportunity
• Organic pipeline strong in all regions
• Strong cash generation
• Reducing debt, scope for additional gearing
• Strong probability of further corporate activity and / or alliances Aspen’s expanding regional platform makes us a compelling partnership option for both multinationals
and exporters
• Relative exchange rates – effect local versus offshore component Regardless believe offshore component will be larger in 2012
• Anticipate another year of real growth Primary drivers are organic South African growth blunted by slow ARV off takes Sigma to contribute for 12 months Inorganic opportunities
Top Related