


Languages
Pages
Legal


Fasset Sector Survey 2016 FINAL REPORT: 29 September 2017
Fasset Sector Survey 2016
Final Report
29 September 2017

Fasset Sector Survey 2016 FINAL REPORT: 29 September 2017
-i-
Fasset Sector Survey 2016
Prepared for
SETA for Finance, Accounting, Management and other Financial Services (Fasset)
Prepared by
Underhill Corporate Solutions (UCS)
Project Manager & Lead Researcher: Edmore Mahembe
Pretoria, South Africa
September, 2017
Contact Details:
Edmore Mahembe Suite No. SF02, 2nd Floor,
Hatfield Gables (Hatmed Office Park), 484 Hilda Street, Hatfield,
Pretoria, South Africa, 0083. Cell: +27 (0)83 757 3733
Phone: +27 (0)12 751 3237 Fax: 086 540 7052/
086 639 8976 E-mail: [email protected]
[email protected] Website: www.underhillsolutions.co.za

Fasset Sector Survey 2016 FINAL REPORT: 29 September 2017
-ii-
TABLE OF CONTENTS
EXECUTIVE SUMMARY ................................................................................................... iii 1 INTRODUCTION ........................................................................................................... 8
1.1 Introduction and Background .................................................................................. 8 1.2 Overall Aim of the Sector Survey ............................................................................ 8 1.3 Sector Survey Objectives ........................................................................................ 9 1.4 Sector Survey Methodology .................................................................................... 9
1.4.1. Employer survey ............................................................................................ 11
1.4.2. Survey of professional bodies ........................................................................ 12
1.4.3. Survey of training providers ........................................................................... 13
1.4.4. Survey of Learners ........................................................................................ 14
1.5 Classification Systems used in the Sector Survey ................................................. 14 1.5.1. Subsectors ..................................................................................................... 14
1.5.2. Organising framework for occupations ........................................................... 15
1.6 Presentation of the Research Findings ................................................................. 16 2 PROFILE OF ORGANISATIONS AND EMPLOYEES ................................................ 18
2.1 Introduction ........................................................................................................... 18 2.2 Employer Profile ................................................................................................... 18
2.2.1. Levy-paying and non-levy-paying organisations ............................................. 18
2.2.2. Employer population and sample size ............................................................ 18
2.2.3. Number of organisations in the sector ............................................................ 18
2.2.4. Size and number of organisations represented in each sub-sector ................ 19
2.2.5. Geographical distribution ............................................................................... 21
2.3 Employee Profile ................................................................................................... 22 2.3.1. Introduction .................................................................................................... 22
2.3.2. Total employment .......................................................................................... 22
2.3.3. Employment by sub-sector............................................................................. 23
2.3.4. Employment by organisation size ................................................................... 23
2.3.5. Gender and Population Group ....................................................................... 24
2.3.6. Employment by disability status ..................................................................... 27
2.3.7. Employment by occupational category ........................................................... 28
2.3.8. Employees by age ......................................................................................... 30
2.3.9. Employees by education levels ...................................................................... 31
2.3.10. Employment by professional occupational categories .................................... 32
2.4 Conclusion ............................................................................................................ 34 3 SURVEY OF PROFESSIONAL BODIES .................................................................... 36
3.1 Introduction ........................................................................................................... 36 3.2 Data Collection and Profile of Respondents .......................................................... 36
3.2.1. Data collection ............................................................................................... 36
3.2.2. Positions of respondents ................................................................................ 36
3.3 Brief Profile of Professional Bodies Surveyed ....................................................... 37 3.3.1. Association for the Advancement of Black Accountants of Southern Africa .... 37
3.3.2. Association of Accounting Technicians (South Africa) .................................... 37
3.3.3. Association of Certified Fraud Examiners - South African Chapter ................. 38
3.3.4. Association of Chartered Certified Accountants ............................................. 38
3.3.5. Chartered Institute of Management Accountants ........................................... 38

Fasset Sector Survey 2016 FINAL REPORT: 29 September 2017
-iii-
3.3.6. Chartered Secretaries Southern Africa........................................................... 39
3.3.7. Institute of Internal Auditors South Africa ....................................................... 39
3.3.8. South African Institute of Chartered Accountants ........................................... 39
3.3.9. South African Institute of Professional Accountants ....................................... 40
3.3.10. South African Institute of Stockbrokers .......................................................... 40
3.3.11. South African Institute of Tax Professionals ................................................... 40
3.3.12. Southern African Institute for Business Accountants ...................................... 40
3.3.13. Southern African Institute of Government Auditors ........................................ 41
3.3.14. Institute of Accounting and Commerce........................................................... 41
3.3.15. Institute of Certified Bookkeepers and Institute of Certified Bookkeepers and
Accountants ................................................................................................................. 41
3.4 Discussion of Survey Results ................................................................................ 42 3.4.1. Organisational capacity .................................................................................. 42
3.4.2. SDL and Fasset-registered learnership status ............................................... 42
3.4.3. Qualifications and designations ..................................................................... 43
3.4.4. Bridging programs ......................................................................................... 46
3.4.5. Scarce skills ................................................................................................... 47
3.4.6. Initiatives by Professional Bodies to support skills development .................... 49
3.4.7. Fasset-funded projects .................................................................................. 51
3.4.8. Change drivers which might impact the sector ............................................... 53
3.4.9. Future plans ................................................................................................... 56
3.4.10. Challenges and suggested solutions .............................................................. 56
3.4.11. Recommendation for further research ............................................................ 61
4 SURVEY OF EDUCATION AND TRAINING PROVIDERS ......................................... 63
4.1 Introduction ........................................................................................................... 63 4.2 Survey of Universities and TVET Colleges ............................................................ 63
4.2.1. Data collection ............................................................................................... 63
4.2.2. Qualifications ................................................................................................. 65
4.2.3. Institutional Capacity ...................................................................................... 67
4.2.4. Effectiveness of department initiatives ........................................................... 70
4.2.5. Future plans ................................................................................................... 72
4.2.6. Growth expectations ...................................................................................... 75
4.2.7. Partnerships and linkages .............................................................................. 75
4.2.8. Fasset-related research efforts ...................................................................... 76
4.2.9. Fasset-funded projects .................................................................................. 76
4.2.10. Scarce Skills Training Perspective ................................................................. 76
4.2.11. Critical skills gaps-Training provider perspective ............................................ 78
4.2.12. Anticipated sector challenges ........................................................................ 81
4.2.13. Productivity and work performance ................................................................ 82
4.2.14. Fasset initiatives in the HEI sector ................................................................. 82
4.2.15. Conclusion ..................................................................................................... 83
4.3 Survey of Workplace Training Providers ............................................................... 84 4.3.1. Introduction .................................................................................................... 84
4.3.2. Profile of Workplace Training Providers ......................................................... 84
4.3.3. Size of Workplace Training Providers ............................................................ 85
4.3.4. Motivation for the provision of learnerships .................................................... 85
4.3.5. Effectiveness of workplace initiatives ............................................................. 86
4.3.6. Impact of Fasset interventions ....................................................................... 88

Fasset Sector Survey 2016 FINAL REPORT: 29 September 2017
-iv-
4.3.7. Challenges in the provision of learnerships .................................................... 90
4.3.8. Factors affecting learner productivity ............................................................. 93
4.3.9. Learnership costs .......................................................................................... 94
4.3.10. Anticipated sector challenges ........................................................................ 96
4.3.11. Scarce skills ................................................................................................... 97
4.3.12. Critical skills gaps .......................................................................................... 98
4.3.13. Future skills needs ......................................................................................... 98
4.3.14. Supply of skills to the sector ........................................................................... 99
4.3.15. Sector outlook and change drivers ................................................................. 99
4.3.16. Expected Role of Fasset in the sector ............................................................ 99
4.4 Conclusion .......................................................................................................... 100 5 SURVEY OF LEARNERS ......................................................................................... 102
5.1 Introduction ......................................................................................................... 102 5.2 Learner Database and Sample Sizes .................................................................. 102 5.3 Profile of Learners Surveyed ............................................................................... 102
5.3.1. Learners by gender and race ....................................................................... 102
5.3.2. Learners by age ........................................................................................... 103
5.3.3. Geographic distribution of learners .............................................................. 103
5.3.4. Education and skills levels ........................................................................... 104
5.3.5. Learnership types ........................................................................................ 105
5.3.6. Learner salaries ........................................................................................... 106
5.4 Perceptions and Experiences of Training ............................................................ 106 5.4.1. Practical experience ..................................................................................... 108
5.4.2. Soft skills ..................................................................................................... 110
5.4.3. Technical skills ............................................................................................. 111
5.4.4. Challenges faced during learnership ............................................................ 111
5.5 Access to Education and Training ....................................................................... 112 5.5.1. Workplace interventions ............................................................................... 112
5.5.2. Learner dropout ........................................................................................... 113
5.6 Career Progression and Future Plans ................................................................. 114 5.7 Conclusion .......................................................................................................... 115
6 SUPPLY OF SKILLS ................................................................................................ 116
6.1 Introduction ......................................................................................................... 116 6.2 Basic Education .................................................................................................. 116 6.3 Technical Vocational Education and Training Sector .......................................... 118
6.3.1. Introduction .................................................................................................. 118
6.3.2. Completion rates in Public and Private TVET colleges ................................. 119
6.4 Higher Education and Training ............................................................................ 121 6.4.1. Introduction .................................................................................................. 121
6.4.2. Accounting and Bachelor of Commerce graduates ...................................... 122
6.5 Development of Professionals ............................................................................ 129 6.5.1. Professional Bodies ..................................................................................... 129
6.5.2. Fasset-registered Learnerships ................................................................... 131
6.5.3. Fasset interventions at HET level ................................................................. 134
6.6 Conclusion .......................................................................................................... 135 7 SKILLS DEMAND & SKILLS SHORTAGES ............................................................ 136
7.1 Introduction ......................................................................................................... 136 7.2 Extent and Nature of Demand ............................................................................. 136
7.2.1. Changes in employment .............................................................................. 136

Fasset Sector Survey 2016 FINAL REPORT: 29 September 2017
-v-
7.2.2. Professional bodies’ views on the demand for skills in the sector ................. 140
7.3 Skills Shortages in the Sector ............................................................................. 144 7.3.1. Retention of staff .......................................................................................... 144
7.3.2. Employment Equity ...................................................................................... 144
7.3.3. Scarce skills ................................................................................................. 149
7.3.4. Employer interventions ................................................................................ 162
7.4 Conclusion .......................................................................................................... 164 8 LABOUR DEMAND AND PROJECTIONS ............................................................... 165
8.1 Introduction ......................................................................................................... 165 8.2 Employment Trends ............................................................................................ 165 8.3 Staff Turnover ..................................................................................................... 166 8.4 Employers’ Views on the Past and Future Growth of the Sector ......................... 167 8.5 Expectations of the Employment Changes in the next 5 Years ........................... 168 8.6 Occupational Categories whose Employment Will Increase or Decrease ............ 168 8.7 Factors Impacting on the Demand for Skills ........................................................ 169 8.8 Forecasting of the Demand for Skills in the Sector .............................................. 170
8.8.1. Demand forecasting model .......................................................................... 170
8.8.2. Scenarios used in forecasts ......................................................................... 173
8.8.3. Results of the model for projection of total employment in the sector ........... 174
8.8.4. Results of the model for projection by Occupational Categories .................. 175
8.9 Conclusion .......................................................................................................... 175 9 CONCLUSION .......................................................................................................... 177
9.1 Introduction ......................................................................................................... 177 9.2 Organisations in the Sector ................................................................................. 178 9.3 Employment in the Sector ................................................................................... 178 9.4 Profile of the Sector ............................................................................................ 179 9.5 Transformation of the Sector ............................................................................... 179 9.6 Professional Bodies in the Sector ....................................................................... 180 9.7 Skills Shortages in the Sector ............................................................................. 180 9.8 The Supply of Skills to the Sector ....................................................................... 181 9.9 Research Capacity and Needs............................................................................ 182 9.10 Stakeholders Expectations from FASSET ........................................................... 183
ANNEXURE A: METHODOLGY USED IN CALCULATION OF WEIGHTS ...................... 184
ANNEXURE B: PROJECTIONS OF EMPLOYMENT BY DIFFERENT OCCUPATIONS . 186
LIST OF TABLES
Table 1-1: Comparison of Population and Sample Sizes ..................................................... 10
Table 1-2: Targeted Versus Actual Sample Sizes ............................................................... 10
Table 1-3 Sub-sector demarcation ...................................................................................... 15
Table 2-1: Profile of Fasset organisations by sub-sector and size ....................................... 20
Table 2-2: Geographical location of organisations in the sector .......................................... 21
Table 2-3: Profile of Fasset employment by sub-sector ....................................................... 23
Table 2-4: Profile of employment by sub-sector .................................................................. 24
Table 2-5: Average employment by organisation size ......................................................... 24
Table 2-6: Number of employees with a disability ............................................................... 27

Fasset Sector Survey 2016 FINAL REPORT: 29 September 2017
-vi-
Table 2-7: Occupational Categories by Population Group ................................................... 29
Table 2-8: Professional Occupations ................................................................................... 32
Table 3-1: Status of SDL and Fasset-registered learnerships ............................................. 42
Table 3-2: Learnership development and provider accreditation ......................................... 43
Table 3-3 Learnerships, designations and NQF levels ........................................................ 44
Table 3-4: Main skills development challenges faced by professional bodies ...................... 57
Table 4-1: Universities Surveyed ........................................................................................ 63
Table 4-2: Public TVET colleges Surveyed for the Study .................................................... 64
Table 4-3: Private TVET colleges Surveyed for the Study ................................................... 64
Table 4-4: Summary of University Strategies to Address Qualification Challenges ............. 66
Table 4-5: Summary of Public TVET Strategies to Address Qualification Challenges ......... 67
Table 4-6: University Qualification Plans ............................................................................. 74
Table 4-7: University Respondent Intervention Strategies ................................................... 74
Table 4-8: Scarce Skills According to Universities ............................................................... 77
Table 4-9: Scarce Skills According to Public TVET colleges ............................................... 77
Table 4-10: Critical Skills Gaps According to Universities ................................................... 78
Table 4-11: Critical Skills Gaps According to Private TVET colleges ................................... 78
Table 4-12: Reasons for Critical Skill Gaps According to Universities ................................. 79
Table 4-13: Reasons for Critical Skills Gaps According to Public TVET Colleges Respondents
........................................................................................................................................... 79
Table 4-14: Future Skills Demand According to Public TVET colleges ................................ 80
Table 4-15: Occupational Skills Gaps According to Universities .......................................... 81
Table 4-16: Profile of WTPs Surveyed by Subsector ........................................................... 84
Table 4-17: Profile of Workplace Training Providers Surveyed by Sub-sector ..................... 85
Table 4-18: Respondent Perceptions on the Impact of Fasset Interventions ....................... 88
Table 4-19: Factors Affecting Learner Productivity .............................................................. 94
Table 4-20: Distribution of Fasset-Related Learnership Programs ...................................... 95
Table 4-21: Perceptions on Adequacy of Grants ................................................................. 95
Table 4-22: Perceptions on Anticipated Sector Challenges ................................................. 96
Table 4-23: Respondent views on the expected role of Fasset ......................................... 100
Table 5-1: Gender and Race ............................................................................................. 103
Table 5-2: Age of Fasset learners surveyed ...................................................................... 103
Table 6-1: Grade 9 Mathematics pass rates in South Africa (as determined by the ANA) . 117
Table 6-2: Matric completion and pass rates for Mathematics and Accounting in South Africa
......................................................................................................................................... 117
Table 6-3: Completion rates in Public and Private TVET colleges ..................................... 120

Fasset Sector Survey 2016 FINAL REPORT: 29 September 2017
-vii-
Table 6-4: Graduate numbers in Accounting according to NQF level for 2004 and 2011-2015
......................................................................................................................................... 122
Table 6-5: Graduate Numbers in Accounting, by race for 2004 and 2010-2015 ................ 123
Table 6-6: Graduate Numbers in Accounting for 2004 and 2011-2015, by gender ............ 124
Table 6-7: Graduate numbers in Commerce, Business Management and Business
Administration qualifications according to NQF level for 2004 and 2011-2015 .................. 126
Table 6-8: Graduate numbers in Commerce, Business Management and Business
Administration qualifications for 2004 and 2011-2015, by race .......................................... 127
Table 6-9: Graduate numbers in Commerce, Business Management and Business
Administration qualifications for 2004 and 2011-2015, by gender ..................................... 128
Table 6-10: Number of Chartered Accountants registered with SAICA: 2010-2016 ........... 130
Table 6-11: CAs by race ................................................................................................... 130
Table 6-12: Learnerships completed in 2016 .................................................................... 132
Table 7-1: Expectations in employment by sub-sector ...................................................... 138
Table 7-2 Employment increases by occupational category .............................................. 139
Table 7-3: Increases in employment by OFO code ........................................................... 140
Table 7-4 Skills most in demand in the next 5 years ......................................................... 140
Table 7-5: Organisations facing challenges to retain staff by Sub-sector........................... 144
Table 7-6: Organisations struggling to retain Black African, Indian and Coloured by Sub-sector
......................................................................................................................................... 145
Table 7-7: Challenges faced by Organisations in retaining Black Africa, Indian and Coloured
by occupations .................................................................................................................. 145
Table 7-8: Other Challenges faced by Organisations in retaining Black Africa, Indian and
Coloured by occupations ................................................................................................... 146
Table 7-9: Occupations which organisations struggle to fill with Black African................... 147
Table 7-10: Organisations with difficulties to fill vacancies by sub-sector .......................... 150
Table 7-11: Occupations for which skills shortages are experienced by employers in the sector
......................................................................................................................................... 151
Table 7-12: Managerial occupations for which skills shortages are experienced ............... 151
Table 7-13: Professional occupations for which skills shortages are experienced ............. 152
Table 7-14: Technicians and Associate Professional occupations for which skills shortages
are experienced ................................................................................................................ 154
Table 7-15: Clerical Support Workers occupations for which skills shortages are experienced
......................................................................................................................................... 154
Table 8-1: Changes in employment 2012-2016 per subsector .......................................... 166
Table 8-2: Reasons for Staff Turnover .............................................................................. 167
Table 8-3: Changes in employment over the last 2 (two) years ......................................... 167

Fasset Sector Survey 2016 FINAL REPORT: 29 September 2017
-viii-
Table 8-4: Expectations of Employment changes in the next 5 years ................................ 168
Table 8-5: Occupational categories whose employment will increase or decrease ............ 169
Table 8-6: Reasons for change in employment ................................................................. 169
Table 8-7: Categories of variables to be used ................................................................... 171
Table 8-8: Scenarios used for the Forecasts ..................................................................... 173
Table 8-9: Labour demand projections for 2016-2021 ....................................................... 174
LIST OF FIGURES
Figure 2-1: Number of organisations in the sector ............................................................... 19
Figure 2-2: Fasset companies by sub-sector from 2002-2016 ............................................. 21
Figure 2-3: Total employment ............................................................................................. 22
Figure 2-4: Employment by gender ..................................................................................... 25
Figure 2-5: Employment by gender ..................................................................................... 25
Figure 2-6: Employment by population group ...................................................................... 26
Figure 2-7: Employment by population group from 2002 to 2016 ........................................ 27
Figure 2-8: Distribution of employment by occupational category ........................................ 28
Figure 2-9: Occupational Categories by Gender ................................................................. 29
Figure 2-10: Composition of employees by Managerial Occupation .................................... 30
Figure 2-11: Age of employees ........................................................................................... 31
Figure 2-12: Employment by education level ....................................................................... 32
Figure 2-13: Technician and Associate Professional Occupations ...................................... 33
Figure 2-14: Clerical Occupations ....................................................................................... 34
Figure 3-1: Positions held by interviewees .......................................................................... 37
Figure 4-1: Public TVET College plans on qualifications and courses to be offered ............ 73
Figure 4-2: Future Support Strategies for Public TVET colleges ......................................... 73
Figure 4-3: Motivation for Provision of Learnerships ........................................................... 86
Figure 4-4: Learner Financial Constraints ........................................................................... 92
Figure 4-5: Respondent Perceptions on Education Standards ............................................ 93
Figure 5-1: Geographical distribution of Fasset learners surveyed .................................... 104
Figure 5-2: Learners surveyed by education level ............................................................. 105
Figure 5-3: Learnership type ............................................................................................. 105
Figure 5-4: Gross monthly salary per learner .................................................................... 106
Figure 5-5: What training have you received so far? ......................................................... 107
Figure 5-6: Additional training that learners may still need ................................................ 108
Figure 5-7: Learner scores for practical experience .......................................................... 109

Fasset Sector Survey 2016 FINAL REPORT: 29 September 2017
-ix-
Figure 5-8: Learner scores for soft skills attainment .......................................................... 110
Figure 5-9: Learner scores for technical skills attainment .................................................. 111
Figure 5-10: Challenges encountered during learnership .................................................. 112
Figure 5-11: Learner scores for workplace initiatives ........................................................ 113
Figure 5-12: Learners' perceptions on employment prospects after learnership ................ 114
Figure 5-13: Learner plans post-learnership ...................................................................... 115
Figure 6-1: Graduates in Business and Financial Management from Public and Private TVET
colleges............................................................................................................................. 119
Figure 6-2: Completion rates for 2013-2014 in Business Management by gender ............. 120
Figure 6-3: Completion rates for 2013-2014 in Financial Management by gender ............. 121
Figure 6-4: CAs by gender ................................................................................................ 131
Figure 6-5: Learnerships completed in 2016, by gender .................................................... 134
Figure 7-1: Changes in employment in the last 2 years ..................................................... 136
Figure 7-2: Changes in employment (percentage) in the last 2 years ................................ 137
Figure 7-3: Reasons for change in employment (%).......................................................... 138
Figure 7-4: Organisations struggling to fill positions with Black African ............................. 147
Figure 7-5: Reasons why organisations do not fill with Black African ................................ 149
Figure 7-6: Most common critical skills gaps found across occupations ............................ 160
Figure 7-7: Organisations involved in interventions to increase the number of people with
scarce skills ...................................................................................................................... 163
Figure 7-8: Interventions undertaken to increase the number of people with scarce skills . 163
Figure 8-1: Employment Trends ........................................................................................ 165

Fasset Sector Survey 2016 FINAL REPORT: 29 September 2017
-i-
ACRONYMS
Abbreviation Definition AAG Average Annual Growth rate AAT(SA) Association of Accounting Technicians South Africa ABASA Association for the Advancement of Black Accountants ACCA Association for Chartered Certified Accountants ACFESA Association for Certified Fraud Examiners South Africa AMG Assessor and Moderator Grant ANSCO Australian and New Zealand Standard Classification of Occupations APC Assessment of Professional Competence ATR Annual Training Report BEE Black Economic Empowerment CA Chartered Accountant CCA Chartered Certified Accountant CEO Chief Executive Officer CESM Classification of Educational Subject Matter CFA Chartered Financial Analyst CIMA Chartered Institute of Management Accountants CPD Continuous Professional Development CSSA Chartered Secretaries Southern Africa CTA Certificate in the Theory of Accounting DHET Department of Higher Education and Training DoL Department of Labour DSRS Disproportionate Stratified Random Sampling EEP Employment Equity Plan ETDP Education and Training Practices Sector Education and Authority Fasset Finance and Accounting Services Sector Education and Training Authority HDI Historically Disadvantaged Individuals HEI Higher Education Institution HEMIS Higher Education Management Information System HSRC Human Sciences Research Council IACSA Institute of Accounting and Commerce ICB Institute of Certified Bookkeepers ICBA Institute of Certified Bookkeepers and Accountants ICM Institute of Credit Management IIASA Institute of Internal Auditors of South Africa ILO International Labour Organisation IMFO Institute of Municipal Finance Officers IRBA Independent Regulatory Board of Auditors ISCO International Standard Classification of Occupations ITC Initial Test of Competence LCG Learnership Cash Grant
MICT Media, Information and Communication Technologies Sector Education Training Authority
NA National Accounts NCS New Curriculum Statement NLPs Non-Levy Payers NQF National Qualifications Framework NSC National Senior Certificate NSDS National Skills Development NSFAS National Student Financial Aid Loan Repayment Grant NSF National Skills Fund OFO Organising Framework for Occupations PDI Previously Disadvantaged Individual

Fasset Sector Survey 2016 FINAL REPORT: 29 September 2017
-ii-
Abbreviation Definition PE Professional Evaluation PG PIVOTAL Grant
PIVOTAL Professional, Vocational, Technical and Academic Learning Programs that result in qualifications or part qualification on the NQF
PoE Portfolio of Evidence QA Quality Assurance QCTO Quality Council for Trades and Occupations RMIT Royal Melbourne Institute of Technology University RPL Recognition of Prior Learning SAIBA Southern African Institute for Business Accountants SAICA South African Institute for Chartered Accountants SAIGA Southern African Institute of Government Auditors SAIPA South African Institute of Professional Accountants SAIS South African Institute of Stockbrokers SAIT South African Institute for Tax Practitioners SAPSE South African Post-Secondary Education System SAQA South African Qualifications Authority SARS South African Revenue Service SCG Strategic Cash Grant SDF Skills Development Facilitator SDL Skills Development Levy SETA Sector Education and Training Authority SIC Standard Industrial Classification SMME Small, Medium and Micro-sized Enterprises SOC Standard Occupational Classification SS Sector Survey SSA Statistics South Africa SSP Sector Skills Plan TCA Thematic Content Analysis TOT Terms of Reference TVET Technical and Vocational Education and Training UNISA University of South Africa UCS Underhill Corporate Solutions WSP Workplace Skills Plan WTP Workplace Training Provider

Fasset Sector Survey 2016 FINAL REPORT: 29 September 2017
-iii-
EXECUTIVE SUMMARY
This survey is the fourth comprehensive Sector Survey (SS) commissioned by the Finance
and Accounting Services Sector Education and Training Authority (Fasset). The SS was con-
ducted in the 2016/2017 financial year and its overall aim was to provide Fasset with an up-
to-date and comprehensive picture of its sector including:
the employer organisations in the sector;
employees working in the sector;
the professional bodies active in the sector;
relevant education and training providers in the sector;
learners entering, and already in, the sector;
the demand for and supply of labour to the sector, including an analysis of scarce
skills and stakeholders’ views on key issues relevant to skills planning in the sector;
and
the overall labour demand and supply status in the sector, with specific emphasis on
skills shortages and mis-matches in demand and supply which requires rectification.
The current SS arises amidst a range of changes, including the extension of the existence of
the 21 (twenty one) Sector Education and Training Authorities (SETAs) to 31 March 2020 and
the corresponding extension of the National Skills Development (NSDS) III (Government Ga-
zette, 2016).The SS consists of a survey of employers, a survey of professional bodies, a
training provider survey and a learner survey. Information from all 4 (four) SSs is integrated in
this report.
PROFILE OF THE SECTOR
In 2016 the estimate of the total number of organisations in the sector was 5, 042 (five thou-
sand and forty two). Most of the organisations are in Accounting, Bookkeeping, Auditing and
Tax Services firms followed by Business and Management Consulting Services and Stock-
broking. The majority of organisations in the sector are small (94, 8%) whilst large organisa-
tions only constitutes 2, 0% with the remainder being that of medium-sized organisations.
In terms of geographic location of organisations in the sector most organisations are in Gaut-
eng (38, 6%), Western Cape (29, 5%) and KwaZulu-Natal (11, 9%). The Northern Cape Prov-
ince and the Limpopo province have much lower levels of representivity, being 1% and 1, 8%
respectively. Provinces with the largest number of organisations are also the provinces with
the largest number of employees in the sector. Gauteng, Western Cape and KwaZulu-Natal
also lead with 56%, 21, 5% and 9, 3% of employees respectively while Limpopo and Northern
Cape are the provinces with the fewest number of employees in the sector only employing
1, 9% and 0, 9% respectively.
Employment in the sector has been increasing since the first SS was completed in 2002. Cur-
rently, employment in the sector consists of 138, 578 (one hundred and thirty eight thousand
five hundred and seventy eight) employees which is an increase from 135, 430 (one hundred
and thirty five thousand four hundred and thirty) employees in 2012. However, the rate of
increase slowed down between 2012 and 2016. On average the total employment rate has
Fasset Sector Survey 2016 FINAL REPORT: 29 September 2017
-iv-
been increasing by an average of 5, 5% per year between 2002 and 2008 and 3, 1% per year
between 2008 and 2012. However, between 2012 and 2016 the rate of growth had slowed
down to an average of 0, 5% per year.
Although transformation remains a challenge for the sector, some progress has been made
since the second SS in 2007. Whites’ share in employment has dropped from 66% in 2002 to
36, 4% in 2016. On the other hand Black Africans employed in the sector increased from
approximately 17% in 2002 to 37, 4% in 2016.
The majority (62, 9%) of employees in the sector have post-school qualifications. 37.4% of
employees in the sector are holders of a National Qualifications Framework (NQF) Level 4
qualification, followed by 28, 8% who have achieved NQF Level 7 qualification. The smallest
number of employees fall into the lowest educational categories, being NQF Levels 1, 2 and
3 with a combined percentage of 2, 3%, which is a consistent reflection over the years of the
sector’s need for a highly-qualified workforce.
The qualifications required are linked to the occupational composition of the sector. Profes-
sionals form the largest occupational group, with 40, 2% of the workforce employed in profes-
sional occupations. The second largest occupational group is Clerical Support Workers
(29, 9%), followed by Managers (14, 2%) and Technicians & Associate Professionals (10, 7%).
Employees in the sector are relatively young, with 55 % of them being 35 (thirty five) years old
or younger. Only 6, 7% of the employees are over the age of 56 (fifty six) years. The majority
of employees in the sector are female. The percentage of male employees fluctuates between
38, 6% and 46, 4% while the percentage of female employees fluctuates between 53, 6% and
61, 4%. The sector does not employ large numbers of people with disabilities. The employees
with disabilities reported by employers numbered 954 (nine hundred and fifty four)– only 0, 7%
of total employment.
PROFESSIONAL BODIES IN THE SECTOR
Chapter 3 of this report provides an overview of the role and functions of 16 (sixteen) profes-
sional bodies that are active in the sector. A large portion of the workers in the sector are
members of organised professions and are represented by these bodies. The professional
bodies in turn perform self-regulatory and professional functions to uphold practice standards,
enhance quality of services and protect the broader public against unscrupulous practitioners.
By upholding standards in the sector the professional bodies make an important contribution
to strengthen investor confidence in the economy.
A complex combination of qualifications awarded by professional bodies and conferred by
public and private higher institutions is used in the sector. Several professional bodies confer
upon their members qualifications that are registered on the NQF. It is common practice that
qualifications, professional designations and membership of the professional bodies are inter-
linked. Most of these qualifications require workplace experience in addition to academic train-
ing, and many are registered as learnerships with Fasset and other SETAs. Quality assurance
of the majority of qualifications in the sector is managed by the professional bodies in partner-
ship with Fasset.

Fasset Sector Survey 2016 FINAL REPORT: 29 September 2017
-v-
In addition to the development of education and training programs for their particular designa-
tions, professional bodies are also involved in functions which support this primary role. Some
of the initiatives which they are undertaking are enhancing output rates by providing learners
with mentorship and tutoring in the form of short courses, refresher and revision classes;
providing financial support to learners in the form of bursaries aimed at high-achieving Matric
students from low-income households; providing access to learnership opportunities by using
their networks to connect learners with employers; providing graduate placement through net-
working, appointing register and posting of job opportunities on their websites; providing Con-
tinuous Professional Development (CPD) through publishing newsletters for their members,
organising workshops on sector and profession updates as well as facilitating opportunities
for CPD. Some professional bodies are of the view that the Recognition of Prior Learning
(RPL) is a valid form of knowledge and a skills set which contributes to the completion of
qualifications and the awarding of designations.
SKILLS SHORTAGES IN THE SECTOR
One of Fasset’s key responsibilities is to monitor the skills demand and supply in its sector
and to identify mismatches in the labour market. Chapter 7 of this report looks at market de-
mand and the skills shortages experienced by employers and observed by professional bod-
ies. The term “skills shortages” is used to refer to both the quantitative mismatches between
demand and supply in the labour market and qualitative deficiencies within the skills sets of
employees.
Skills shortages typically manifest in high staff turnover rates and difficulties experienced by
employers to retain certain categories of staff. In order to gauge the nature and extent of skills
shortages experienced in the sector, employers were asked to identify the occupations in
which they find it difficult to find suitable employees. They were also asked about the number
of vacancies in their organisations in those occupations. According to the employers, a total
of 3, 573 (three thousand five hundred and seventy three) people would be needed to fill
vacancies in occupations in which there seemed to be a scarcity of qualified people. These
vacancies are composed of Managerial (640) (six hundred and forty); Professionals (2, 633)
(two thousand six hundred and thirty three); Technicians & Associate Professionals (186) (one
hundred and eight six); and Clerical Support Workers (114) (one hundred and fourteen).
Poor quality teaching, low Matric pass rates, poor Mathematics competency levels and a lack
of adequate career guidance were the predominant reasons cited by professional bodies for
the various scarce skills in the sector. A lack of funding to address these 4 (four) factors was
believed to compound the problem.
The majority of organisations (63, 4%) reported that they offer learnership programs to ad-
dress scarce skills. Learnerships are popular as they offer learners critical skills that are es-
sential to the workplace as well as practical experience relating to the work environment.
Learners also have a better chance of being employed as they can easily adjust to the work
environment because they are also taught other important skills such as social and communi-
cation skills. Other interventions used by organisations in the sector are bursaries (17, 1%),
Workplace Training (7, 3%), Mentorships (4, 9%) and Bridging Programs (4, 9%).

Fasset Sector Survey 2016 FINAL REPORT: 29 September 2017
-vi-
FUTURE SKILLS NEEDS
The future skills needs of the sector are first viewed from a quantitative perspective. Compared
to growth over the past 2 (two) years, more organisations in the sector expect growth in em-
ployment in the next 5 (five) years. Approximately one quarter of organisations expect to ap-
point more staff because of business growth or expansion, expertise required in new areas,
new business opportunities in the accounting field and growing client bases. Organisations in
the sector also aim to overcome the current shortages of skilled and experienced staff.
The second perspective on future skills needs is qualitative and refers to changes in the skills
sets that will be required from employees in the sector. Major changes in the financial and
business environment are impacting the skills sets and technical knowledge required by work-
ers in the sector. New legislation for organisations introduced different rules and standards for
auditing and governance of organisations, as well as for the statutory reporting required of
organisations. As a result of new consumer-centric legislation, many organisations are com-
pelled to change the way they interact with the public, recognise consumers’ rights and protect
personal data. The worldwide need for improved corporate governance, risk management and
compliance with regulatory requirements is also driving the demand for more skills in the fields
of finance, accounting, internal auditing, corporate governance and risk management. Factors
such as the increasing complexity of business and the widening of the tax net are driving the
need for more tax practitioners and tax specialists.
RESEARCH NEEDS IN THE SECTOR
The SS also assessed the research capacity and research needs in the sector. This area of
focus was included because of the emphasis that the NSDS III places on research and the
SETAs’ responsibilities regarding the development of research capacity in the country. A re-
view of respondent comments at both university and TVET colleges indicates that research
efforts are not at the level where they should be. Most of the research referred to is focusing
on academic outputs at Masters and PhD level. From the responses, it is also apparent that
research is currently considered an underfunded mandate with respondents indicating that
they would like more funding and guidance by the sector on areas to focus on.
Current funders include some banks for Research Chairs and the National Research Fund
focusing on specific projects. Respondents indicated that they would like more funding for
research, guidance from Fasset on research areas that are of sectoral interest as well as
training on how to handle research. The need for research capacity building through training
features more prominently at TVET college level. Other issues mentioned include the need for
assistance from Fasset in publicising research outputs and having road shows to publicise
available funding windows for research.
Areas which professional bodies believed that research was needed, and which Fasset could
initiate and fund on behalf of and for the benefit of the sector’s stakeholders, include research
on the future impact of technology; impact of regulation; development of integrated thinking
skills in new graduates and junior professionals; impact of withdrawal of funding from certain
projects such as work readiness programs and learnerships; career guidance as they is need
to research into effective ways in disseminating informative details on different career options
available. Other areas which professional bodies suggested for future research concerns how

Fasset Sector Survey 2016 FINAL REPORT: 29 September 2017
-vii-
to build a network of retirees who can mentor learners; how to make CPD more relevant, rather
than a compliance exercise; the impact of language barriers on learners; determine the aver-
age company’s ratio of higher to lower level finance skills; and whether the Quality Council for
Trades and Occupations (QCTO) model is workable.
STAKEHOLDERS’ EXPECTATIONS FROM FASSET
As the main driver of skills development in the sector, Fasset carries an enormous responsi-
bility in ensuring that the myriad of skill challenges are not only identified but also managed.
From the respondents perspective, the 3 (three) key roles that Fasset ought to play relate to
offering better training opportunities and specific courses focused on addressing specific skills
shortage areas and, perhaps more importantly, providing funding. The majority of respondents
(33%) would like Fasset to offer better training opportunities while 19% would like it to offer
specific training courses. This information is critical in sector skills planning and in ensuring
skills development initiatives focus on areas of strategic importance to stakeholders. The ar-
eas highlighted are at the core of the SETA skills mandate and therefore need further investi-
gation to clarify the specific expectations of the stakeholders.

Fasset Sector Survey 2016 FINAL REPORT: 29 September 2017
8
1 INTRODUCTION
1.1 Introduction and Background
Fasset is the SETA for the Finance and Accounting Services Sector (the sector). Fasset was
established in March 2000 in terms of the Skills Development Act (Act 97 of 1998) (SDA). In
2001 Fasset started collecting and analysing labour market information on the sector and has
continued to do so ever since. The reason for the collection of labour market information is to
inform Fasset’s skills planning and funding decisions. The information also serves to monitor
transformation in the sector.
It is against this background that Fasset conceptualised and commissioned several compre-
hensive SSs over the years. This survey is the fourth comprehensive SS commissioned by
Fasset. The first comprehensive SS was conducted in 2002 and included surveys of employ-
ers, professional bodies, education and training providers, and learners in the sector. After
several changes in the sector, such as the skills development levy (SDL) threshold which was
increased from R 250 000,00 to R 500 000,00, the second comprehensive SS was conducted
in 2007. The third comprehensive SS was conducted in 2012 in the (NSDS) III dispensation.
The current SS arises amidst a range of changes, including the extension of the existence of
the 21 (twenty one) SETAs to 31 March 2020 and the corresponding extension of the NSDS
III (Government Gazette, 2016)1.
1.2 Overall Aim of the Sector Survey
The overall objective of this SS is to provide Fasset with an up-to-date and comprehensive
analysis of the sector, including:
the employer organisations in the sector;
employees working in the sector;
the professional bodies active in the sector;
relevant education and training providers in the sector;
learners entering, and already in, the sector;
the demand for and supply of labour to the sector, including an analysis of scarce
skills and stakeholders’ views on key issues relevant to skills planning in the sector;
and
the overall labour demand and supply status in the sector, with specific emphasis on
skills shortages and mis-matches in demand and supply which requires rectification.
1 http://www.dhet.gov.za/SitePages/DocGazette.aspx

Fasset Sector Survey 2016 FINAL REPORT: 29 September 2017
9
1.3 Sector Survey Objectives
According to terms of reference (TOR), the main objective of the SS was to present the ‘current
picture of the Fasset sector’ by having regard to employers, professional bodies, education
and training providers, learners, skills shortages in the sector and a demand and supply anal-
ysis. The SS is also required to highlight skills deficits and skills priorities. The specific objec-
tives in relation to each component of the SS as set out above are outlined below:
1. The Employer survey focuses on an accurate profile of the sector and its constituent
sub-sectors. This includes a determination of skills needs and priorities as perceived
by employers.
2. The Professional Body survey focuses on professional bodies operating in the sector,
establishing a profile of the organisations and their role in the sector. The survey also
explores the insights and perspectives of professional bodies on skills development in
the sector.
3. The Training Provider survey focuses on 3 (three) components, namely a survey of
universities, Technical and Vocational Education and Training (TVET) colleges (both
public and private) and a survey of workplace training providers.
4. The Learner survey focuses on trends in the senior certificate examinations, learner
experiences regarding workplace training and challenges experienced during the
learnership, including those that may lead to premature termination of the learnership.
5. The Scarce Skills and Skills Shortages survey focuses on 2 (two) components, namely
skills shortages and future skills needs of the sector. The emphasis is on employer and
professional body experiences insofar as scarce skills and future growth of the sector
is concerned. The survey also identifies changes that might have an impact on the
demand of skills.
6. The Demand and Supply Analysis survey focuses on research on the future demand
for and supply of labour to the sector. The emphasis is on demand and supply analysis,
skills demand forecasting and employment growth and the changing occupational
composition of employment.
1.4 Sector Survey Methodology
Table 1-1 below is a summary of population and sample sizes from the 3 (three) previous SSs
as well as the targeted sample sizes for the 2016 SS. Table 1-1 illustrates that both the em-
ployer population and the sample sizes have seen a decrease. In order to easily compare the
current SS and previous SSs, the targeted sample sizes for 2016 did not differ significantly
from the 2012 SS except where the population size has changed (or was unknown), such as
the private TVET colleges.

Fasset Sector Survey 2016 FINAL REPORT: 29 September 2017
10
Table 1-1: Comparison of Population and Sample Sizes
Sur-
vey
Sub-
Cate-
gory
Population Sample Size Sector Survey 2016
2002 2008 2012 2002 2008 2012 Popu-
lation
Targeted
sample
size
Employers 10 000 6 210 5 000 1 261 1 033 848 5 042 857
Professional Bod-
ies 15 14 21 14 14 16 20 16
Train-
ing
Pro-
viders
Public
TVET - - 50 - - 23 50 36
Pvt
TVET - - - - - - - 10
HEIs - - 23 - - 12 23 17
Work-
place - - - 50 25 122 694 116
Learners - - - 59 50 162 581 173
TOTAL 1 384 1 122 1 183 6 410 1 225
Table 1-2 below is a comparison of the targeted and actual (realised) sample sizes as well as
variance in respect of the employers, workplace training providers (WTP), public and private
TVET colleges and the Higher Education Institutions (HEI). The main reason for the HEI sur-
vey targets not being met was because the SS coincided with the “#FeesMustFall” campaign.
This campaign gathered momentum during between August and November 2016 which led to
some HEIs and TVET colleges to be closed. Survey targets were met in respect of the profes-
sional bodies and private TVET colleges. The learner’s survey exceeded the targeted sample
size.
Table 1-2: Targeted Versus Actual Sample Sizes
Survey Targeted
Sample Size
Actual / Realised
Sample Size
Variance Response
Rate
Employer 857 780 -77 91%
Learners 173 203 30 117%
Workplace Training Provider 116 110 -6 95%
Professional body 16 16 0 100%
Public TVET colleges 36 22 -14 61%
Private TVET colleges 10 10 0 100%
HEIs 17 12 -5 71%
Total 1 225 1 153 -72 94%
Detailed sample stratification, sample size designs, selections, and data collection methods
employed are discussed below under each SS.

Fasset Sector Survey 2016 FINAL REPORT: 29 September 2017
11
1.4.1. Employer survey
1.4.1.1. Sample size and sampling method
Table 1-1 shows that the employer population sizes for 2002, 2008 and 2012 were 10, 000
(ten thousand), 6, 210 (six thousand two hundred and ten) and 5, 000 (five thousand) respec-
tively. The corresponding sample sizes were 1, 261 (one thousand two hundred and sixty
one), 1, 033 (one thousand and thirty three) and 848 (eight hundred and forty eight) for 2002,
2008 and 2012 respectively. The targeted sample size for the 2016 employer survey was 857
(eight hundred and fifty seven). The sample size was based on the estimated population size
of 5, 042 (five thousand and forty two). This sample size ensures proportionality and compa-
rability with the 2012 SS, which was 17% of the total population. The actual (realised) sample
size was 780 (seven hundred and eighty), which is 15% of the population size.
The SS used the disproportionate stratified random sampling (DSRS) method to determine
the sample size of each stratum. The DSRS is a method in which the size of the sample drawn
from a particular stratum is not proportional to the relative size of that stratum. For example, a
stratum could be large organisations (more than 150 (one hundred and fifty) employees),
which may account for less than 1% of all organisations in the database, although they account
for more than 80% of employees and levies paid to the SETA. In this case, a disproportionate
sample was used to represent the large organisations to reflect their levies rather than the
number of organisations only. To compensate for the disproportionate sampling, the employer
survey data will be weighted in line with the previous SS’s weighting method for comparability.
The approach in respect of employer sample size design included:
review of the Fasset database of registered employers;
stratification (grouping) of registered employers according to province, sub-sector, or-
ganisation size, and SDL-paying status;
determination of the sample size using the DSRS method; and
selecting the sampled registered employers using random sampling (Excel random
number generator) within the stratified groups.
Organisations that could not be reached or refused to participate were replaced by organisa-
tions from a sample drawn in a similar manner to the original sample. Due to the lower re-
sponse rate, the data collection team extended the survey to all organisations in the Fasset
employer database.
Included in the employer sample are:
all state departments in the database, as well as the South African Revenue Service
(SARS); and
organisations that are levy-exempt (non-levy paying organisations), because of their
size (they have payrolls of less than R500 000.00 per year).

Fasset Sector Survey 2016 FINAL REPORT: 29 September 2017
12
1.4.1.2. Data collection
2 (two) identical sets of semi-structured questionnaires were designed and tested. The first
questionnaire was presented in Microsoft Word, and was used mainly for face-to-face inter-
views. The second questionnaire was presented online using Survey Monkey. The data col-
lection methods employed in the employer survey included face-to-face, telephonic, and elec-
tronic interviews. The large organisations (150 (one hundred and fifty) and more employees)
were interviewed in person by researchers and senior field workers. Smaller organisations
were interviewed telephonically or in person. The majority of respondents preferred to com-
plete the questionnaire online rather than participate in face-to-face interviews or complete an
e-mailed questionnaire. There were 500 (five hundred) online and 280 (two hundred and
eighty) hard copy questionnaires that were completed. A total of 780 (seven hundred and
eighty) employer organisations participated in the survey.
Questions on the survey instrument covered the objectives specified above. Employers were
also asked to provide individual records of each employee in the organisation, with the bio-
graphical and occupational detail required for the employee profile of the sector. The individual
records of employees were submitted according to the variables specified by the researchers
and agreed to by Fasset. Care was taken to protect the identity of individual employees. Other
than biographical descriptors, such as gender, race and age, the records did not contain any
information through which people can be identified.
1.4.1.3. Data capturing and analysis
All the responses were captured in Survey Monkey2, which is an online survey data capturing
and analysis tool. Before capturing, all the open-ended questions were coded. Occupational
data was coded according to the Organising Framework for Occupations (OFO), a copy of
which was given to the research team by Fasset. Sample data was weighted in order to ex-
trapolate the information to the sector. The methodology used in calculating and assigning
weights is explained in Annexure A. The data analysis was completed using both Survey Mon-
key and Microsoft Excel.
1.4.2. Survey of professional bodies
1.4.2.1. Sample size and sampling method
The professional body population sizes for the 2002, 2008 and 2012 were 15 (fifteen), 14
(fourteen) and 21 (twenty one) respectively and the corresponding sample sizes were 14 (four-
teen), 14 (fourteen) and16 (sixteen) respectively. According to Fasset, there were19 (nine-
teen) active professional bodies in the sector in 2016. All 19 (nineteen) professional bodies
were included in the sample, and a total of 16 (sixteen) availed their time for interviews.
2 https://www.surveymonkey.com/

Fasset Sector Survey 2016 FINAL REPORT: 29 September 2017
13
1.4.2.2. Data collection
The data collection instrument used for the professional body survey was a semi-structured
questionnaire. The data collection method used was face-to-face interviews conducted by
senior researchers. The targeted respondents were chief executives or senior officials. In
many instances, the questionnaire was emailed to the respondents before the interview so
that they could prepare for the interview.
1.4.2.3. Data capturing and analysis
The main type of data obtained from the professional body interviews was qualitative, which
came through detailed probing and open discussions. Detailed transcripts of the interviews
were kept by the interviewers and the data was analysed using a technique known as thematic
content analysis (TCA).
1.4.3. Survey of training providers
1.4.3.1. Sample size and sampling method
The population of HEIs, TVET colleges and WTPs was not clearly defined in the previous SSs.
The 2012 SSs however indicated that there were 50 (fifty) public TVET colleges and 23 (twenty
three) HEIs. As shown in Table 1-1, the sample sizes for the WTPs for 2002, 2008 and 2012
SS were 50 (fifty), 25 (twenty five) and122 (one hundred and twenty two) respectively. This
SS has 4 (four) clearly defined categories, namely HEIs, public TVET colleges, private TVET
colleges and WTPs.
The HEIs’ and TVET colleges’ databases were stratified according to province and type of
qualifications/learnerships offered while the WTPs were stratified the same way as the em-
ployer database. The targeted sample sizes for public TVET colleges and HEIs were 36 (thirty
six) and17 (seventeen) respectively. Since the total population size for the private TVET col-
leges had been interviewed in the previous SSs, the research team targeted 10 (ten) private
TVET colleges which were active in providing / receiving training in the Fasset-related qualifi-
cations. 110 (one hundred and ten) WTPs completed the survey compared to the targeted
sample of 116 (one hundred and sixteen) (see Table 1-2).
1.4.3.2. Data collection
The survey employed semi-structured interviews and secondary research. The survey re-
spondents for HEIs and TVET colleges were mainly deans of faculties, heads of departments
and other senior staff members. The data collection methods for HEIs and the majority of the
TVET colleges was in-depth face-to-face interviews, and the interviews were conducted by
senior researchers. Data collection methods for WTPs included electronic interviews (through
Survey Monkey), email/fax and telephonic interviews conducted by fieldworkers.

Fasset Sector Survey 2016 FINAL REPORT: 29 September 2017
14
1.4.3.3. Data capturing and analysis
All the responses were captured in Survey Monkey and all the open-ended questions were
coded first. Occupational data was coded according to the OFO codes. Quantitative data anal-
ysis was completed using both Survey Monkey and Microsoft Excel while qualitative data was
analysed through TCA.
1.4.4. Survey of Learners
1.4.4.1. Sample size and sampling method
The population of learners was not clearly defined in the previous SSs. However, as indicated
in Table 1-1, the learner sample sizes for 2002, 2008 and 2012 SSs were 59 (fifty nine), 50
(fifty) and162 (one hundred and sixty two) respectively. The total population for learners on
the databases obtained from Fasset, namely Learnership Cash Grant (LCG) and National
Student Financial Aid Loan Repayment Grant (NSFAS) was 581 (five hundred and eighty
one). The sampling method used was stratified random sampling. The learner databases were
stratified (grouped) according to province, learnership type, SDL status, size of organisation,
and subsector. The targeted sample size was 173 (one hundred and seventy three) and the
actual (realised) sample size was 203 (two hundred and three), thereby exceeding the target
by 15%.
1.4.4.2. Data collection
Data collection methods used in the learner survey included electronic interviews (through
Survey Monkey) and telephonic interviews, which were conducted by call centre agents from
the Underhill Corporate Solutions (UCS) offices in Pretoria.
1.4.4.3. Data capturing and analysis
The learner survey was mainly quantitative in nature, with a few open-ended questions. All
the responses were captured in Survey Monkey and all the open-ended questions were coded
first. Quantitative data analysis was completed using both Survey Monkey and Microsoft Ex-
cel.
1.5 Classification Systems used in the Sector Survey
1.5.1. Subsectors
The sector is demarcated according to the Standard Industrial Classification (SIC), which is
an economic classification system that is used in the National Accounts (NA) and in several
of Statistics South Africa’s (SSA) surveys. The sector includes16 (sixteen) SIC codes at the
five-digit level. To simplify the analysis, Fasset has grouped the SIC codes into 7 (seven)
subsectors. The SIC codes, the economic activities that they represent and the clustering of
SIC codes into sub-sectors are depicted in Table 1-3.

Fasset Sector Survey 2016 FINAL REPORT: 29 September 2017
15
Table 1-3 Sub-sector demarcation
SIC
Code SIC Description Subsector
81904
88103
Investment Entities & Trusts
Company Secretary Services
Investment Entities & Trusts
Company Secretary Services
83110
83120
83121
88102
Administration of Financial Markets
Security-dealing Activities
Stockbroking
Asset Portfolio Management
Stockbroking & Financial Mar-
kets
83180 Development Corporations & Organisations Development Organisations
88101
88120
88121
88122
88123
Tax Services
Accounting, Bookkeeping & Auditing Activi-
ties
Tax Consultancy Activities of Accountants &
Auditors registered in terms of the Public Ac-
countants & Auditors Act
Activities of Cost & Management Account-
ants
Bookkeeping Activities, including Relevant
Data Processing & Tabulating Activities
Accounting, Bookkeeping, Au-
diting & Tax Services
83190 Activities Auxiliary to Financial Intermedia-
tion
Activities Auxiliary to Financial
Intermediation
88140 Business & Management Consulting Ser-
vices
Business & Management Con-
sulting Services
91108
9110E
South African Revenue Service (SARS)
National Treasury
Provincial Treasuries
SARS & Government Depart-
ments
It is important to note that the sub-sector demarcation used in this SS, as per column 3 (three)
in table 1-3 above, is not “pure”, as many organisations are involved in more than one type of
activity. Organisations were assigned to a sub-sector on the basis of their own choice of ‘main’
business activity. The previous SSs used the same classification.
1.5.2. Organising framework for occupations
As indicated previously in this SS, all the occupational information has been coded and is
reported on according to OFO Version 2012. The OFO is an occupational classification system
that was introduced by the Department of Labour (DoL) in 2006 for the identification and re-
porting of scarce and critical skills. The OFO that was introduced at that time was based on
an occupational classification system developed by Australia and New Zealand – the Austral-
ian and New Zealand Standard Classification of Occupations (ANSCO). That classification
system differed substantially from the Standard Occupational Classification (SOC) that was
used before 2006 by the SETAs.
The OFO that was based on ANSCO was used in the 2007 SS conducted by Fasset. In 2010
the South African government decided to change the structure of the OFO, to align it to the

Fasset Sector Survey 2016 FINAL REPORT: 29 September 2017
16
International Classification of Occupations (ISCO) which is the classification system used by
the International Labour Organisation (ILO). The original OFO (prior to 2010) and the one
based on ISCO (post 2010) differ substantially, even at the level of major occupation groups.
For this reason, the occupational data from the 2 (two) SSs should be compared with great
care.
The OFO classifies occupations on the basis of a combination of skill level and skill speciali-
sation. The term “skill” denotes the competencies generally required for the proficient perfor-
mance of the set of tasks associated with an occupation. The skill level of an occupation refers
to the level or amount of formal education and/or training, the amount of previous experience
and the amount of on-the-job training that are usually required to perform the set of tasks in
that occupation competently. The skill specialisation of an occupation is a function of the field
of knowledge required, the tools and equipment used, the materials worked on and the goods
and services provided in an occupation.
The OFO divides occupations into major (one digit), sub-major (two digit), minor (three digit)
and unit (four digit) groupings. Occupations (six digits) are sub-divisions of the unit grouping
and can further be sub-divided into specialisations or jobs. In this report, occupational infor-
mation is reported at the major group and at the occupational level.
1.6 Presentation of the Research Findings
Chapter 2 of this report provides the profile of organisations and employees in the sectors.
The first sub-section gives an overview of the organisations in the sector and the second sub-
section gives a detailed description of the employees in the sector.
Chapter 3 offers an overview of professional bodies that are active in the sector. The main
source of this information is in-depth interviews conducted during the professional body’s sur-
vey. The focus of this description is on the skills development initiatives and activities in which
the professional bodies are involved. The chapter also provides possible change drivers,
which professional bodies felt might impact the sector in the medium and long term.
In Chapter 4, a detailed discussion of education and training provider’s survey is provided.
The survey included HEIs, private and public TVET colleges and WTPs. The chapter con-
cludes by looking at the scarce and critical skills as perceived by the WTPs. This is very in-
sightful information when compared to the views of employers.
Chapter 5 discusses the results of the learner survey. The chapter explores learners’ percep-
tions on theoretical and workplace training, access to education, career progression and chal-
lenges which might lead to learner dropout.
Chapter 6 presents an analysis of the pipeline of the supply of skills to the sector. The main
source of data is secondary research, and it offers education training output trends for basic
education, the TVET sector, universities, professional bodies and Fasset funded programs.
Only education and training relevant to the sector are discussed.

Fasset Sector Survey 2016 FINAL REPORT: 29 September 2017
17
Chapter 7 deals with demand for skills and skills shortages (also known as scarce skills) in
the sector. Stakeholders’ views on the future demand for skills in the sector are discussed.
Chapter 8 presents the labour demand and projection model. The chapter starts with employ-
ment trend analysis before discussing the econometric model and projections.

Fasset Sector Survey 2016 FINAL REPORT: 29 September 2017
18
2 PROFILE OF ORGANISATIONS AND EMPLOYEES
2.1 Introduction
The purpose of this chapter is to provide an overview of the organisations and employees in
the sector. One of the key objectives of each of the SS has been and is to obtain a profile of
employment in the sector.
The chapter is mainly based on data obtained through the employer survey. As indicated in
the previous chapter, a total of 780 (seven hundred and eighty) organisations participated in
the employer survey. Most of them also submitted individual employee records containing
biographical, occupational and educational information to the researchers for analysis. The
data is supplemented by the Workplace Skills Plan (WSP) data for 2016, obtained from Fas-
set.
2.2 Employer Profile
2.2.1. Levy-paying and non-levy-paying organisations
Levy-paying organisations include all organisations that fall within the levy threshold and con-
sequently pay the SDL to Fasset. The levy threshold refers to a threshold set by the South
African government from time to time to determine which organisations are obliged to pay the
SDL and which organisations are exempt. The levy threshold is currently ‘a payroll of
R500 000.00 per annum’. None non-levy paying organisations include government depart-
ments and/or organisations with payrolls smaller than R500 000.00 per annum.
2.2.2. Employer population and sample size
Fasset’s database of employers was used as the sample frame (population) for this survey.
The employer profile presented in this chapter accordingly represents the employers found on
the database. Fasset’s original database contained a population size of 6,646 (six thousand
six hundred and forty six) organisations, however this was adjusted to 5,042 (five thousand
and forty two) after removing duplicate organisations, organisations that have closed down or
moved to another SETA/sector as well as those organisations which were not traceable owing
to incorrect, missing or outdated information which totalled 1,604 (one thousand six hundred
and four).
2.2.3. Number of organisations in the sector
Figure 2-1 shows the number of organisations in the sector from 2002 to 2016, which covers
the previous 4 (four) SSs. It is evident that the number of organisations based on the SSs has
reduced from 7,213 (seven thousand two hundred and thirteen) in 2002 to 4,254 (four thou-
sand two hundred and fifty four) in 2012. In 2016 the number of organisations increased to
5,042 (five thousand and forty two).

Fasset Sector Survey 2016 FINAL REPORT: 29 September 2017
19
Figure 2-1: Number of organisations in the sector
Source: Sector Survey, 2016 and previous Sector Surveys (2012, 2008, and 2002)
Table 2-1 below sub-divides the 5,042 (five thousand and forty two) organisations in the 2016
SS into sub-sectors.
2.2.4. Size and number of organisations represented in each sub-sector
Table 2-1 shows an overview of organisations in the sector by sub-sector and size across all
8 (eight) sub-sectors. Most of the organisations (51, 1%) are Accounting, Bookkeeping, audit-
ing and Tax services firms followed by Business and Management Consulting Services and
Stockbroking which constitute 12, 8% and 9, 1% respectively. The table also shows that the
majority of organisations in the sector are small (94, 8%) whilst large organisations only con-
stitutes 2, 0% with the remainder being that of medium-sized organisations.
7213
6210
4254
5042
0
1000
2000
3000
4000
5000
6000
7000
8000
2002 2008 2012 2016
No
. o
f O
rgan
isati
on
s

Fasset Sector Survey 2016 FINAL REPORT: 29 September 2017
20
Table 2-1: Profile of Fasset organisations by sub-sector and size
Sub-sector
Large
Me-dium
Small
Total per sub-sector
Total num-ber of or-
ganisations
Percentage of organisa-tions to total
Investment Entities and Trusts and Company Secretary Ser-vices
9 13 405 427 8,47%
Stockbroking and Financial Mar-kets
21 29 407 457 9,06%
Development Organisations 4 2 48 54 1,07%
Accounting, Bookkeeping, Au-diting and Tax Services
26 58 2492 2576 51,09%
Business and Management Consulting Services
16 21 608 645 12,79%
Activities Auxiliary to Financial Intermediation
15 12 293 320 6,35%
SARS and Government Departments
9 9 0,18%
Unspecified 3 12 539 554 10,99%
Total 103 147 4792 5042 100
Percentage 2,0% 2,9% 94,8% 100% 100%
Source: Sector Survey (2012)
The results are consistent with the findings of previous SSs where Accounting, Bookkeeping,
Auditing and Tax Services have maintained their biggest share in terms of the number of or-
ganisations in the sector though the numbers fluctuated between 44% and 63%.
However, Figure 2-2 shows that Investment Entities and Trusts and Company Secretary Ser-
vices and Activities Auxiliary to Financial Intermediation had proportions of their organisations
decreasing from 20% to 8, 4% and from 14% to 6, 4% respectively between 2002 and 2016.

Fasset Sector Survey 2016 FINAL REPORT: 29 September 2017
21
Figure 2-2: Fasset companies by sub-sector from 2002-2016
Source: Sector Survey (2016) and previous Sector Surveys (2012, 2008, and 2002)
As shown in Figure 2-2, Business and Management Consulting Services has more than dou-
bled over the years from 6% to 12, 8% over the same period.
2.2.5. Geographical distribution
Table 2-2 shows the geographic location of organisations in the sector. The table shows that
the organisations are mostly located within the provinces of Gauteng (38, 6%), Western Cape
(29, 5%) and KwaZulu-Natal (11, 9%). The Northern Cape province and the Limpopo province
have much lower levels of representivity, being 1% and 1, 8% respectively.
Table 2-2: Geographical location of organisations in the sector
Province Total organisa-
tions % of sector employers
Total employ-
ees
% of sector employment
Eastern Cape 321 6,4% 5 006 3,6%
Free State 198 3,9% 2 894 2,1%
Gauteng 1 944 38,6% 77 595 56,0%
KwaZulu-Natal 599 11,9% 12 836 9,3%
Limpopo 90 1,8% 2 676 1,9%
Mpumalanga 158 3,1% 3 124 2,3%
North West 160 3,2% 3 401 2,5%
Northern Cape 52 1,0% 1 255 0,9%
Western Cape 1 488 29,5% 29 792 21,5%
SA National (in SA but province not specified)
32 0,6% 0 0,0%
20%
13%
3%
44%
6% 1
4%
0.0
%10.0
%
10.1
%
4.6
%
63.0
%
6.7
%
5.6
%
0.1
%10.4
%
12.3
%
2.3
%
48.7
%
10.6
%
15.6
%
0.1
%8.5
%
9.1
%
1.1
%
51.1
%
12.8
%
6.4
%
0.2
%
0%10%20%30%40%50%60%70%
InvestmentEntities andTrusts andCompanySecretaryServices
Stockbrokingand Financial
Markets
DevelopmentOrganisations
Accounting,Bookkeeping,Auditing andTax Services
Business andManagement
ConsultingServices
ActivitiesAuxiliary to
Financial
SARS andGovernmentDepartments
Per
cen
tage
(%)
2002 2008 2012 2016

Fasset Sector Survey 2016 FINAL REPORT: 29 September 2017
22
Province Total organisa-
tions % of sector employers
Total employ-
ees
% of sector employment
Total 5 042 100% 138 578 100%
Source: Sector Survey (2016) and FASSET weighted WSP (2016)
Table 2-2 also shows that the provinces with the largest number of organisations are also the
provinces with the largest number of employees in the sector. Gauteng, Western Cape and
KwaZulu-Natal also lead with 56%, 21, 5% and 9, 3% of employees respectively while Lim-
popo and Northern Cape are the provinces with the fewest number of employees in the sector
only employing 1, 9% and 0, 9% respectively.
2.3 Employee Profile
2.3.1. Introduction
This section highlights the profile of the labour market in terms of total employment, provincial
distribution, gender, race, age, occupation and educational levels. The section was informed
by the weighted findings of the organisations which participated in the SS, to reflect the sector
as a whole.
2.3.2. Total employment
Figure 2-3 shows that employment in the sector has been increasing since the first SS was
completed in 2002. However, the rate of increase slowed down between 2012 and 2016. On
average the total employment rate has been increasing by an average of 5, 5% per year be-
tween 2002 and 2008 and 3, 1% per year between 2008 and 2012. However, between 2012
and 2016 the rate of growth had slowed down to an average of 0, 5% per year.
Figure 2-3: Total employment
Source: Sector Survey (2016) and previous Sector Surveys (2012, 2008, and 2002)
91960
117356
135430 138578
0
20000
40000
60000
80000
100000
120000
140000
160000
2002 2008 2012 2016
No
. o
f E
mp
loyees

Fasset Sector Survey 2016 FINAL REPORT: 29 September 2017
23
2.3.3. Employment by sub-sector
Table 2-3 shows total employment in the sector by sub-sector. It shows that the majority of
employees (39, 7%) work in Accounting, Bookkeeping, Auditing and Tax Services... This is
supported by the fact that 51, 1% of employers are in this sector too. This is followed by Ac-
tivities Auxiliary to Financial Intermediation, Stockbroking and Financial Markets and SARS
and Government Departments sub-sectors which employ 15, 2%, 13, 8% and 13, 5% respec-
tively.
Table 2-3: Profile of Fasset employment by sub-sector
Sub-sector
Total per sub-sector
Number of em-ployees
Percentage of employees to to-tal employment in sector
Investment Entities and Trusts and Company Secretary Ser-vices
6 503 4,7%
Stockbroking and Financial Mar-kets
19 063 13,8%
Development Organisations 397 0,3%
Accounting, Bookkeeping, Au-diting and Tax Services
54 965 39,7%
Business and Management Consulting Services
17 999 13,0%
Activities Auxiliary to Financial Intermediation
21 006 15,2%
SARS and Government Departments
18 645 13,5%
Total 138 578 100%
Source: Sector Survey (2016)
Table 2-3 also shows that the Development Organisations sub-sector is the smallest of all
sub-sectors in terms of employment as it only employs 0,3% of the total employees in the
sector .
2.3.4. Employment by organisation size
Table 2-4 shows total employment in the sector by organisation size. Although it was high-
lighted in Table 2-1 that large companies constitute a very small percentage of the sector’s
employer population, Table 2-4 however, shows that they constitute 69,9% of employment
which has increased by 17% from the 2012 SS .

Fasset Sector Survey 2016 FINAL REPORT: 29 September 2017
24
Table 2-4: Profile of employment by sub-sector
Organisation size
Total per organisation size
Number of employees Percentage of employees to
total employment in sector
Large 96 811 69,9%
Medium 9 526 6,9%
Small 32 031 23,1%
NLP 130 0,1%
Total 138 578 100%
Source: Sector Survey (2016) and FASSET weighted WSP (2016)
The SS reveals that average employment per organisation varies considerably according to
organisational size. Even where the two smallest categories are concerned, Table 2-5 shows
that small organisations employ an average of 14 people, while NLP organisations employ an
average of 5 people.
Table 2-5: Average employment by organisation size
Organisation size
Average employment per organisation
Large 1 340
Medium 83
Small 14
NLP 5
Total 1442
Source: Sector Survey (2016) and FASSET weighted WSP (2016)
2.3.5. Gender and Population Group
The gender distribution of employees in the sector is shown in Figure 2-4. There is a higher
percentage of females who constitute 60% of the total employment while males account for
40%.

Fasset Sector Survey 2016 FINAL REPORT: 29 September 2017
25
Figure 2-4: Employment by gender
Source: Sector Survey (2016)
Figure 2-5 shows that between 2002 and 2016, the majority of employees in the sector are
female. The percentage of male employees fluctuates between 38, 6% and 46, 4% while the
percentage of female employees fluctuates between 53, 6% and 61, 4%.
Figure 2-5: Employment by gender
Source: Sector Survey (2016) and previous Sector Surveys (2012, 2008, and 2002)
Figure 2-6 shows the composition of the four race groups in the sector. The majority of em-
ployees in the sector are Black Africans (37, 4%), followed by Whites (36.4%), then Coloureds
(12, 7%) and then Indians (9, 4%).
60%
40%
Female Male
44%46%
39% 40%
56%54%
61% 60%
0%
10%
20%
30%
40%
50%
60%
70%
2002 2008 2012 2016
Perc
enta
ge(%
)
Male Female

Fasset Sector Survey 2016 FINAL REPORT: 29 September 2017
26
Figure 2-6: Employment by population group
Source: Sector Survey (2016)
Figure 2-7 compares the composition of the four race groups in the sector for the period be-
tween 2002 and 2016. It shows that the percentage of Black Africans employed in the sector
has increased from 17% in 2002 to 37, 4% in 2016 while that of Whites has decreased fro66%
to 36, 4%. The percentage of Coloureds employed in the sector has also increased from 8%
in 2002 to 12, 7% in 2016 while that of Indians has decreased from 10% in 2002 to 9, 4 % in
2016.
37.4%
12.7%
9.4%
36.4%
4.1%
0.0%0.0%
5.0%
10.0%
15.0%
20.0%
25.0%
30.0%
35.0%
40.0%
Black African Coloured Indian/Asian White Other Unspecified
Per
cen
tage
(%)

Fasset Sector Survey 2016 FINAL REPORT: 29 September 2017
27
Figure 2-7: Employment by population group from 2002 to 2016
Source: Sector Survey (2016) and previous Sector Surveys (2012, 2008, and 2002)
2.3.6. Employment by disability status
Table 2-6 shows that a small minority (0, 7%) of employees in the sector have disclosed a
disability status.
Table 2-6: Number of employees with a disability
Disability status
Number of disabled persons
working in the sector
Percentage
2002 552 0.6%
2008 939 0.8%
2012 330 0.2%
2016 954 0.7%
Source: Fasset Sector Survey, 2016 and previous survey reports of 2002, 2008, and 2012
Table 2-6 shows that the sector employs very few disabled people. The percentage of em-
ployees with disabilities ranges between 0, 2% and 0, 8% in the SSs conducted between 2002
and 2016.
17%
8% 1
0%
66%
31.4
%
7.6
%
7.8
%
53.2
%
30.9
%
10.8
%
8.5
%
49.8
%
37.4
%
12.7
%
9.4
%
36.4
%
4.1
%
0%
10%
20%
30%
40%
50%
60%
70%
Black African Coloured Indian White Other
Per
cen
tage
(%)
2002 2008 2012 2016

Fasset Sector Survey 2016 FINAL REPORT: 29 September 2017
28
2.3.7. Employment by occupational category
Figure 2-8 shows the occupational category distribution of total employees in the sector. The
occupational categories are classified into eight major groups as defined in the OFO. The
majority of employees (40, 2%) in the sector are classified as professionals followed by clerical
support workers, then managers and then technicians and associate professionals who con-
stitute 29, 9%, 14, 2% and 10, 7% of the total employees in the sector respectively. Elementary
occupations, Plant and Machinery Operators and Assemblers, Skilled Agricultural Forestry,
Fishery, Craft and Related Trades Workers as well as Service and Sales Workers constitute
a small percentage of the total employees, being 5% of the total.
Figure 2-8: Distribution of employment by occupational category
Source: Calculated from Fasset WSP/ATR Submission (2016)
Figure 2-9 below shows that females constitute the majority of employees in the Clerical Sup-
port Workers category (39, 6%), and comprise a relatively high percentage in the Profession-
als (34, 8%) and Technicians and Associate Professionals (10, 9%) categories.
14.2%
40.2%
10.7%
29.9%
1.8%
0.2%
0.6%
2.4%
0.0% 5.0% 10.0% 15.0% 20.0% 25.0% 30.0% 35.0% 40.0% 45.0%
Managers
Professionals
Technicians & Associate Professionals
Clerical Support Workers
Service and Sales Workers
Skilled Agricultural, Forestry, Fishery, Craft and…
Plant and Machinery Operators and Assemblers
Elementary Occupations
Percentage(%)

Fasset Sector Survey 2016 FINAL REPORT: 29 September 2017
29
Figure 2-9: Occupational Categories by Gender
Source: Calculated from Fasset WSP/ATR Submission (2016)
Table 2-7 shows that, overall, Black Africans comprise the majority (38.0%) of the sector’s
employees followed by Whites (35.8%), then Coloureds (12.5%) and then Indians (9.5%).
Black Africans constitute the majority of employees in most occupational categories, including
Clerical Support Workers; and Technicians and Associate Professionals. However, Whites
comprise the majority in the Managers (8.1%) and Professionals (16.3%) categories with Black
Africans comprising 2, 8% and 14, 2% in those respective categories.
Table 2-7: Occupational Categories by Population Group
Occupational Categories
Population group
Black Afri-can
Col-oured
Indian/ Asian
White Other Total
Managers 20 10 11 57 2 100
Professionals 35 7 12 40 6 100
Technicians and Associate Pro-fessionals
41 11 9 37 1 100
Clerical Support Workers 47 22 6 23 2 100
Service and Sales Workers 25 6 13 13 44 100
Skilled Agricultural, Forestry, Fishery, Craft and Related Trades Workers
50 0 0 50 0 100
Plant and Machine Operators and Assemblers
33 17 0 17 33 100
Elementary Occupations 79 13 0 4 4 100 Source: Calculated from Fasset WSP/ATR Submission (2016)
10.7
%
34.8
%
10.9
%
39.6
%
1.3
%
0.0
%
0.1
%
2.5
%
16.8
%
50.2
%
10.4
% 17.0
%
2.7
%
0.4
%
0.8
%
1.7
%
12.9
%
41.2
%
10.6
%
31.2
%
1.8
%
0.2
%
0.4
%
1.7
%
0.0%
10.0%
20.0%
30.0%
40.0%
50.0%
60.0%
Managers Professionals Technicians& Associate
Professionals
ClericalSupportWorkers
Service andSales
Workers
SkilledAgricultural,
Forestry,Fishery, Craftand Related
TradesWorkers
Plant andMachineryOperators
andAssemblers
ElementaryOccupations
Per
cen
tage
(%)
Female Male Total

Fasset Sector Survey 2016 FINAL REPORT: 29 September 2017
30
A closer review of the occupational categories reveals the ten most prominent occupations
within each category. The specific occupations that make up the four main occupational
groups in the sector can be seen in the Figure 2-10.
Figure 2-10: Composition of employees by Managerial Occupation
Source: Calculated from Fasset WSP/ATR Submission (2016)
As shown on Figure 2-10, the occupational group Managers consists mostly of Directors (22,
1%), followed by Corporate General Managers (12.8%) Program or Project Managers (8, 7%),
Finance Managers (6, 9%) and Internal Audit Managers (6, 0%).
2.3.8. Employees by age
Figure 2-11 shows the age distribution of employees in the sector. The figure shows that the
majority (40%) of the employees in the sector are between 26 (twenty six) and 35 (thirty five)
years of age. Employees in the sector are relatively young, with 55 % of them being 35 (thirty
five) years old or younger. Only 6.7 % of the employees are over the age of 56 (fifty six) years.
1.7%
2.0%
15.0%
3.4%
3.9%
6.0%
6.9%
8.7%
22.1%
0.0% 5.0% 10.0% 15.0% 20.0% 25.0%
Customer Service Manager (122105)
Personnel/Human Resource Manager (121201)
Corporate General Manager (121901)
Call or Contact Centre Manager (143905)
General Manager Public Service (111202)
Internal Audit Manager (121104)
Finance Manager (121101)
Programme or Project Manager (121905)
Director (Enterprise / Organisation) (112101)
Percentage(%)

Fasset Sector Survey 2016 FINAL REPORT: 29 September 2017
31
Figure 2-11: Age of employees
Source: Calculated from Fasset WSP/ATR Submission (2016)
2.3.9. Employees by education levels
Figure 2-12 reveals that the highest percentage, being 37,4% of employees in the sector have
achieved the equivalent of a NQF Level 4 qualification, followed by 28,8% who have achieved
NQF Level 7 qualification. The smallest number of employees fall into the lowest educational
categories, being NQF Levels 1, 2 and 3 with a combined percentage of 2, 3%, which has
been a consistent reflection over the years of the sector’s need for a highly-qualified workforce.
15%
40%
25%
14%
6%
0.0%
5.0%
10.0%
15.0%
20.0%
25.0%
30.0%
35.0%
40.0%
45.0%
<= 25 years 26 – 35 years 36 – 45 years 46 – 55 years 56 – 65 years
Per
cen
tage
s(%
)

Fasset Sector Survey 2016 FINAL REPORT: 29 September 2017
32
Figure 2-12: Employment by education level
Source: Calculated from Fasset WSP/ATR Submission (2016)
2.3.10. Employment by professional occupational categories
Table 2-8 shows the professional occupational categories by OFO Codes. Results shows that
the majority of the professionals in the sector are External Auditors who comprise 25, 7% of
the total, followed by Accountants (defined as Accountant General; Accountant in Practice;
Trainee Accountant; Financial Accountant and Forensic Accountant) who comprise 18, and
8% of the total. The third largest professional occupation is Management Consultant who com-
prise 14, 6% of the total. The other professional categories are Financial Investment Advisor;
Internal Auditor; and Tax Professional who constitute 2, 5%; 2, 6%; and 2, 8% of the total
respectively.
Table 2-8: Professional Occupations
Occupation OFO Code N %
External Auditor 241104 11 344 25,7%
Accountant (General) 241101 8 309
18,8%
Accountant in Practice 241106
Trainee Accountant 241106
Financial Accountant 241107
Forensic Accountant 241108
Management Consultant 242101 6 455 14,6%
Tax Professional 241103 1 256 2,8%
Internal Auditor 242211 1 140 2,6%
Financial Investment Advisor 241301 1 113 2,5%
Source: Calculated from Fasset WSP/ATR Submission (2016)
1.0% 0.6% 0.7%
34.7%
7.0%
10.1%
28.8%
14.9%
2.0%0.1%
0.0%
5.0%
10.0%
15.0%
20.0%
25.0%
30.0%
35.0%
40.0%
NQF Level1
NQF Level2
NQF Level3
NQF Level4
NQF Level5
NQF Level6
NQF Level7
NQF Level8
NQF Level9
NQF Level10

Fasset Sector Survey 2016 FINAL REPORT: 29 September 2017
33
Figure 2-13 shows the categories of Technicians and Associate Professional occupations.
Custom Officers, Personal Assistants and Office Supervisors form the largest component of
this occupational category with 23,8%; 19,1% and 11,5% respectively while Insurance Bro-
kers, Business Support Coordinators and Taxation Inspectors have fewer employees in this
category and range from 4,4% to 4,7%.
Figure 2-13: Technician and Associate Professional Occupations
Source: Calculated from Fasset WSP/ATR Submission (2016)
Figure 2-14 shows that the occupational group Clerical Support Workers, which consists of
Call Centre Agents (17, 5%) Accounts Clerks (16, 4%), General Clerk (10, 4%) is the largest
category whilst Inbound Contact Centre Consultants (1, 8%) and Clerks (3, 3%) are the small-
est category.
4.4%
4.6%
4.7%
5.8%
7.1%
8.8%
10.1%
11.5%
19.1%
23.8%
0.0% 5.0% 10.0% 15.0% 20.0% 25.0%
Insurance Broker (332102)
Business Support Coordinator (333910)
Taxation Inspector (335201)
Safety Inspector (325705)
Fossil Power Plant Process Controller (313102)
Bookkeeper (331301)
Office Administrator (334102)
Office Supervisor (334101)
Personal Assistant (334302)
Customs Officer (335101)
% Employees

Fasset Sector Survey 2016 FINAL REPORT: 29 September 2017
34
Figure 2-14: Clerical Occupations
Source: Calculated from Fasset WSP/ATR Submission (2016)
2.4 Conclusion
This chapter has looked at broad overview of the organisations and employees in the sector.
The estimated number of organisations in the sector is 5,042 (five thousand and forty two).
The study reveals that the majority of organisations s in the sector employ fewer than 50 (fifty)
people (these are defined as “small” organisations). The number of small organisations has
increased over the years. The majority of employees in the sector are employed in medium
and large private organisations. There are also a significant number of employees employed
by large public sector organisations. The differing sizes of organisations within the sector re-
quires a balance when addressing the needs and interests of the sector.
Geographically, the sector is unevenly distributed, with more than half of the employees being
highly concentrated in the Gauteng and Western Cape provinces where most companies are
located. Accounting, Bookkeeping, Auditing and Tax Services remains the largest sub-sector
in terms of employment levels and number of organisations in the sector whilst Development
Organisations is the smallest sub-sector.
Employees in the sector are mostly skilled with post-matric qualifications. Employment is also
concentrated in the more skilled occupational categories with the majority of employees hav-
ing attained NQF Level 4. Skills development strategies ought therefore to focus on NQF lev-
els 5 and upwards.
The race and gender profile of the sector shows some significant improvements from the pre-
vious years. Black African and female employees are now in the majority. However, measures
1.8%
3.3%
4.8%
4.9%
5.6%
6.2%
9.9%
10.4%
16.4%
17.5%
0.0% 2.0% 4.0% 6.0% 8.0% 10.0% 12.0% 14.0% 16.0% 18.0% 20.0%
Inbound Contact Center Consultant (422201)
Clerk (411101)
Program or Project Administrators (441903)
Insurance Administrator (431201)
Data Entry Operator (413201)
Debt Collector (421401)
Call or Contact Centre Agent (422206)
General Clerk (411101)
Accounts Clerk (431101)
Call Centre Agent (422206)
% Employees

Fasset Sector Survey 2016 FINAL REPORT: 29 September 2017
35
need to be put in place to ensure that more Black Africans occupy the Managerial and Profes-
sional positions and more females occupy positions which are superior to the Clerical Support
positions.
The sector currently employs only a very small number of people with disabilities. The type of
work performed in the sector provides any opportunity for people who live with disabilities to
earn a livelihood. The sector ought, therefore to encourage employers to focus on creating
employment opportunities for people with disabilities...

Fasset Sector Survey 2016 FINAL REPORT: 29 September 2017
36
3 SURVEY OF PROFESSIONAL BODIES
3.1 Introduction
This chapter focuses on the professional bodies who are active in the sector. The chapter will
provide an overview of professional bodies surveyed, the nature of their involvement in the
provision of education and training to the sector, their views on scarce skills and the critical
skills gaps. The chapter will also discuss the plans by professional bodies to enhance the skills
base of the sector as well as the changes and challenges which are anticipated in the sector.
3.2 Data Collection and Profile of Respondents
3.2.1. Data collection
The data collection phase for professional bodies took place during September and October
2016, with a total of 16 (sixteen) professional bodies (out of the 19 (nineteen) active in the
sector) availing their time for interviews. 13 (thirteen) of the professional bodies interviewed
are based in Gauteng, in either Johannesburg or Pretoria. 3 (three) of the professional bodies
interviewed are based in the Western Cape, all of them in Cape Town.
3.2.2. Positions of respondents
All of the professional body interviewees were senior staff members. Figure 3-1 shows the
breakdown. A total of 6 (six) respondents were the CEOs, 3 (three) were the Presidents or
Head, 1 (one) the Vice President, while the remaining 6 (six) were either senior executives or
senior managers directly involved with professional development, education and training.

Fasset Sector Survey 2016 FINAL REPORT: 29 September 2017
37
Figure 3-1: Positions held by interviewees
Source: Sector Survey (2016)
3.3 Brief Profile of Professional Bodies Surveyed
3.3.1. Association for the Advancement of Black Accountants of Southern Africa
The Association for the Advancement of Black Accountants of Southern Africa (ABASA) aims
to redress inequalities in the accounting profession by reviewing the challenges which limit
access to the profession for black South Africans at school and university level, and contrib-
utes to addressing them by embarking on and disseminating information on programs and
activities which enable access. ABASA does not exist to duplicate the efforts and achieve-
ments of other professional bodies, and, while it has a strong partnership with the South Afri-
can Institute of Chartered Accountants (SAICA) and the South African Institute of Professional
Accountants (SAIPA), it pursues transformation in all accounting professions.
ABASA facilitates collaboration of school and university initiatives aimed at removing barriers
to successful matric and university completion by black students. It also provides structural
and academic support to trainees for university and qualifying exams and equips and empow-
ers junior to senior black management to effectively lead within the accounting profession.
3.3.2. Association of Accounting Technicians (South Africa)
The Association of Accounting Technicians (South Africa) (AAT (SA)) is a partnership between
the South African Institute of Charted Accountants (SAICA) and the Association of Accounting
Technicians (AAT) to educate, develop, regulate and support accounting technicians. AAT
(SA) is also a part of one of the world’s leading membership organisations for accounting
professionals, The Association of Accounting Technicians. Accounting technician’s work at all
levels of finance, from accounts clerks to directors of large organisations.
Senior Manager:Educatio
n & Training , 6
President/Head, 3Vice President, 1
CEO, 6 Senior Manager:Education & Training
President/Head
Vice President
CEO

Fasset Sector Survey 2016 FINAL REPORT: 29 September 2017
38
AAT (SA)’s primary goals for the next 5 (five) years are to increase its membership base,
attract funding for students, and develop training material that is both current and relevant for
the South African industry’s changing demands and which will allow professionals to progress
in their careers by benefiting from a sound base of both theoretical knowledge and workplace
training.
3.3.3. Association of Certified Fraud Examiners - South African Chapter
The Association of Certified Fraud Examiners - South African Chapter (ACFESA) is part of a
global body representing and governing fraud examination professionals in South Africa. It is
the world's largest anti-fraud and white-collar crime organisation and provides comprehensive
training and education in these areas. Its members focus on the exposition and reduction of
white-collar crime.
Over the next five years, the ACFESA will be focusing on increasing access to training for
potential students. In light of the implications of fraud, this is viewed as an area being threat-
ened by under-funding. The ACFESA also has a strict focus on regulation of its members,
including disciplining them when necessary to ensure ongoing public confidence in the pro-
fession. The body will also be focusing on increasing its membership base.
3.3.4. Association of Chartered Certified Accountants
The Association of Chartered Certified Accountants (ACCA) is part of a global body which
allows its members to work internationally through its network of employers as well as its
members’ compliance with regulation and standards worldwide. Students may opt to study the
programs through the ACCA’s approved learning partners, or through a self-study approach.
Over the next five years, the ACCA will be focusing on member advocacy to ensure that more
of the South African industry is aware of the credentials and standing of their professionals,
on adapting its curricula to ensure relevance to industry and on providing input into policy and
legislation where the accounting profession in general is concerned. Strong engagement is
taking place with the QCTO which is currently influencing all professional bodies’ programs in
terms of structure and content.
3.3.5. Chartered Institute of Management Accountants
The Chartered Institute of Management Accountants (CIMA) in South Africa is part of the
world’s largest professional body of management accountants. The CIMA qualification has
been designed to blend management accounting, financial accounting and business-focused
subjects to ensure relevance to industry and an ability to think holistically for relevance to
business. To this end, CIMA has introduced the case study approach for each of its three
levels to stimulate integrated thinking from its students and develop the ability to apply theo-
retical knowledge to practice. The CIMA has a flexible syllabus allowing students to complete
its levels at their own pace. Furthermore, students are able to choose when they wish to write
an exam, at one of the Pearson VUE test centres on the country.

Fasset Sector Survey 2016 FINAL REPORT: 29 September 2017
39
Their main areas of focus over the next five years will be on increasing its membership base
and the professional training of management accountants in South Africa as well as through-
out Africa.
3.3.6. Chartered Secretaries Southern Africa
Chartered Secretaries Southern Africa (CSSA) is the professional body for the enabling of
company secretaryship as well as the leading commentator and thought leader in Southern
Africa on corporate governance matters. CSSA is part of a global body for Chartered Secre-
taries, thereby offering its members an international qualification recognised in more than 70
countries.
Over the next five years CSSA will be focusing on the enabling of corporate governance and
in the setting of governance standards. It will also be providing input and expertise on the
regulation of areas of governance. In the same vein, it will continue to be a leading voice for
the instilling of ethics and values at education level for learners wishing to pursue professions
which involve governance and compliance. Much effort will be focused on adapting its pro-
grams to the structural and content requirements of the QCTO.
3.3.7. Institute of Internal Auditors South Africa
The Institute of Internal Auditors South Africa (IIASA) is part of an international network rep-
resenting the interests of Internal Auditors worldwide. As a part of this international network,
the IIASA accordingly upholds, enables and supports the Code of Ethics and the International
Standards for the Professional Practice of Internal Auditing, both considered to be the funda-
mental tenets of the profession.
Over the next five years the IIASA will be focusing on the professionalisation of the profession,
primarily through advocacy on the importance of regulation to ensure that employers are re-
ceiving services from their internal auditors that are of a high standard as well as applicable
to their businesses and environments. Another priority area of focus will be in increasing its
level of technical support to members.
3.3.8. South African Institute of Chartered Accountants
SAICA is well known as one of the leading professional bodies in the world. It aims to serve
the interests of the chartered accounting profession and its members in South Africa by up-
holding and enabling high professional standards.
Over the next five years SAICA will continue to uphold the standards of the profession for
which it has become known. In line with this, the professional body will continue to prioritise
the provision of input into policy and legislation and thereby aim to influence outcomes which
could impact the profession and industry. Transformation will remain a priority area for SAICA
over the next few years, the objective of which is to ensure that the demographic makeup of
its membership reflects the South African population.

Fasset Sector Survey 2016 FINAL REPORT: 29 September 2017
40
3.3.9. South African Institute of Professional Accountants
SAIPA represents qualified Professional Accountants (SA) in practice, commerce and indus-
try, academia and the public sector. Its main activities are the regulation of Professional Ac-
countants (SA) to ensure that its members are compliant with the constitution and IFAC re-
quirements, monitoring trainee learnerships as requirements for entry to membership, as well
as evaluating their assessments and providing CPD to members that is both sufficient and of
a high standard.
SAIPA’s main areas of strategic focus over the next five years will be the development of
training which is relevant to industry and produces work-ready graduates, as well as the pro-
vision of quality assurance for its professional designations.
3.3.10. South African Institute of Stockbrokers
The South African Institute of Stockbrokers (SAIS) is the industry and professional body for
the South African financial markets. It represents all financial market role-players in South
Africa, and is involved in advocating for and influencing decisions which impact both the in-
dustry and its employees. SAIS keeps abreast with the regular changes being made in the
international financial markets, in turn keeping its members up-to-date in order to ensure com-
pliance with international standards and practices. This also requires a high level of adapta-
bility in its training for learners as well as CPD programs, ensuring a skilled, competent and
capacitated workforce.
Over the next five years SAIS will be focusing primarily on advocacy for its members, training
development which includes the setting of standards for entry into the stockbroking profession
and the setting and administering of entry exams for new professionals and transformation of
its membership base to better reflect the demographics of the South African population.
3.3.11. South African Institute of Tax Professionals
The South African Institute of Tax Professionals (SAIT) is a recognised professional body
focusing only on taxation. It represents a community of tax experts who provide services to
numerous sectors including finance, accounting, economics and law. Through its specific fo-
cus on taxation, the SAIT develops standards of tax in the areas of education, compliance,
performance and monitoring. It provides advocacy services for its members, but also protects
the public interest through disciplinary functions where misconduct has occurred.
Over the next five years the SAIT will be focusing on the setting of standards in membership;
the upskilling of tax technicians to become in line with SARS requirements and training devel-
opment for new occupational qualifications.
3.3.12. Southern African Institute for Business Accountants
The Southern African Institute for Business Accountants (SAIBA) is a voluntary accounting
membership body, with 50% of its members being employed in business, the public sector or

Fasset Sector Survey 2016 FINAL REPORT: 29 September 2017
41
academia, and the remainder managing their own accountancy practices in the private sector.
SAIBA affords designatory letters to qualifying members to enable them to practise as well as
improve their skills and knowledge through its CPD programs and community events. It pro-
motes and enforces appropriate standards of competence, practice and conduct to protect the
public as well as to build public trust. It also aims to influence the development of national and
international policy to ensure that members are free to pursue their careers and career ambi-
tions to the fullest extent possible.
Over the next five years SAIBA will be focusing on building its community, broadening its
network of partners and developing programs relevant to industry and which capacitate both
learners and members.
3.3.13. Southern African Institute of Government Auditors
The Southern African Institute of Government Auditors (SAIGA) is a professional body which
aims to advance all aspects of accountability and auditing, but with a special focus on the
public sector. The Auditor-General South Africa (AGSA) recognises SAIGA’s Registered Gov-
ernment Auditor (RGA) qualification as a professional qualification in the Auditor-General Of-
fice. SAIGA’s members uphold The International Organisation of Supreme Audit Institution’s
(INTOSAI) Code of Ethics for Public Sector Auditors.
SAIGA is addressing the shortage of public sector-specific skills in the country through its
priority focus on the development of public sector auditing skills through its RGA qualification,
its preparatory program for the qualifying exams, as well as by conducting research into the
challenges faced by the auditing profession in the public sector.
3.3.14. Institute of Accounting and Commerce
The activities of the Institute of Accounting and Commerce (IAC) (formerly the Institute of Ad-
ministration and Commerce) are primarily to register and represent accounting and taxation
members, to provide statutory policing in order to ensure adherence to academic requirements
and CPD, and to undertake disciplinary procedures where there are complaints from the public
with regard to any of its members.
Over the next five years the IAC will be focusing on facilitating access to high quality and
relevant workplace training, on facilitating relevant CPD for its members, and on facilitating
industry collaboration.
3.3.15. Institute of Certified Bookkeepers and Institute of Certified Bookkeepers and
Accountants
The Institute of Certified Bookkeepers (ICB) and the Institute of Certified Bookkeepers and
Accountants (ICBA) work together because of common goals and complimentary roles. The
ICBA is the membership body and has no registered qualifications while the ICB is the as-
sessing body and has no designations. The learnerships are managed through the ICB, and
the designations are awarded to successful learners if they register with the ICBA - which is

Fasset Sector Survey 2016 FINAL REPORT: 29 September 2017
42
not compulsory. They are both professional bodies for bookkeepers, accountants, office ad-
ministrators and financial managers in Southern Africa.
Priority areas include the development of qualifications which are relevant to industry and of
a high standard, setting and moderating of examinations, accrediting training providers, advo-
cacy on behalf of its members, and the provision of quality assurance for QCTO.
3.4 Discussion of Survey Results
3.4.1. Organisational capacity
12 (twelve) of the 16 (sixteen) professional bodies stated that their capacity, in terms human
resources, finances and physical infrastructure were sufficient. The remaining 4 (four) stated
that they needed to increase their staff base and infrastructure owing to membership growth.
The 13 (thirteen) professional bodies who were experiencing member growth based this suc-
cess on its lobbying activities and aggressive marketing efforts to both professionals in the
sector and learners. 1 (one) professional body stated that their membership base had de-
creased owing to deregistration of members who had contravened the standards of the pro-
fession.
3.4.2. SDL and Fasset-registered learnership status
Table 3-1 below highlights the SDL and Fasset-registered learnership status for each of the
sixteen professional bodies interviewed.
Table 3-1: Status of SDL and Fasset-registered learnerships
Name of Profes-
sional Body
Fasset Employer
(SDL paid to Fasset)
Learnerships regis-
tered with Fasset
ABASA No No
(does not develop learn-
erships)
AAT(SA) Yes
(part of SAICA’s SDL)
Yes
ACFESA Yes Yes
ACCA No Yes
CIMA Yes Yes
CSSA Yes Yes
IAC Yes No
ICB Yes Yes
ICBA No No
(does not develop learn-
erships)
IIASA Yes Yes

Fasset Sector Survey 2016 FINAL REPORT: 29 September 2017
43
Name of Profes-
sional Body
Fasset Employer
(SDL paid to Fasset)
Learnerships regis-
tered with Fasset
SAICA Yes Yes
SAIPA Yes Yes
SAIS Yes Yes
SAIT No
(with W&RSETA and have been trying for a
long time to switch to Fasset)
Yes
SAIBA Yes No
(Cooperation agree-
ment with CIMA)
SAIGA Yes No
Source: Sector Survey (2016)
3.4.3. Qualifications and designations
According to the South African Qualifications Authority (SAQA), registered professional bodies
are able to assess and accredit suitable education and training providers and be involved in
the development of learning programs offered by education and training providers. While they
are unable to provide the training themselves, they can set and administer their own assess-
ments and board examinations.
All except 2 (two) of the professional bodies are involved in the development and/or accredi-
tation of programs and learnerships which lead to designations. In terms of program develop-
ment, most professional bodies are actively involved in developing their own learnerships
which lead to a particular designation, some of which are part of a career pathway to achieving
the highest designation in their suite of offerings. These professional bodies will then accredit
training providers to offer their qualifications. Accreditation means that the professional body
is satisfied that the training provider has the appropriate resources to deliver a particular pro-
gram at the professional body’s required standards, the completion of which for a learner is a
stepping stone towards achieving that professional body’s designation.
Some of the professional bodies also accredit other institutions’ programs which then form
part of the career pathway to achieving the professional body’s designation. Table 3-2 sum-
marises the professional bodies who develop programs and accredit institutions’ programs,
as well as those who accredit other institutions’ programs.
Table 3-2: Learnership development and provider accreditation
Name of Professional
Body
Develop own learnerships and
accredit training providers to
deliver them
Accredit other institu-
tions’ programs which
form part of career path-
way to professional
body’s designation
AAT(SA) Yes No
ACFESA Yes Yes

Fasset Sector Survey 2016 FINAL REPORT: 29 September 2017
44
Name of Professional
Body
Develop own learnerships and
accredit training providers to
deliver them
Accredit other institu-
tions’ programs which
form part of career path-
way to professional
body’s designation
ACCA Yes No
CIMA Yes Yes
CSSA Yes No
IAC Yes Yes
ICB Yes No
ICBA No Yes
IIASA Yes No
SAICA Yes Yes
SAIPA Yes Yes
SAIS Yes Yes
SAIT Yes No
SAIBA No Yes
SAIGA Yes No
Source: Sector Survey (2016)
SAQA-recognised professional bodies are required to include as an initial requirement, an
underlying qualification/s. Fasset’s professional bodies’ minimum requirements for admission
differ from each other and usually span numerous NQF levels. The professional bodies which
offer more than one designation have as their minimum admission requirements either a 3-
year degree, one of their lower-level designations, or in some cases a national diploma. Lower-
level designations usually require at least a Matric qualification, but exceptions are made in
some cases. Almost all professional bodies offer more than one designation, one usually
being the highest level that can be achieved in their particular profession, with the others being
qualifications in themselves but also stepping stones towards achievement of the body’s high-
est level.
Table 3-3 summarises the professional bodies’ Fasset-registered learnerships and their des-
ignations. It also shows the NQF levels which can be achieved by learners studying towards
their designations. They have a broad range, from level 3 – 8, with the majority (75%) of pro-
fessional bodies offering designations up to at least NQF level 7. Lower-level designations
generally take one year to complete, while the higher-level designations generally take 2 (two)
years or more to complete, after minimum admission requirements have been met.
Table 3-3 Learnerships, designations and NQF levels
Name of Profes-sional Body
Number of learnerships registered with Fasset
Designations NQF levels spanned across learnerships and/or designa-tions
AAT(SA) 5 1. Fellow Member AAT(SA) – FMAAT(SA)
2. Member AAT(SA) –
3 - 5

Fasset Sector Survey 2016 FINAL REPORT: 29 September 2017
45
Name of Profes-sional Body
Number of learnerships registered with Fasset
Designations NQF levels spanned across learnerships and/or designa-tions
MAAT(SA)
ACFESA 1 1. Certified Fraud Examiner (CFE)
7
ACCA 2 1. Chartered Certified Ac-countant (CCA)
2. Certified Accounting Tech-nician (CAT)
5 - 8
CIMA 3 1. Chartered Global Manage-ment Accountant (CGMA)
2. Associate of The Chartered Institute of Management Ac-countants (ACMA)
3. Fellow of The Chartered In-stitute of Management Ac-countants (FCMA)
5 - 7
CSSA 4 1. Associate member of Char-tered Secretaries Southern Africa (ACIS)
2. Fellow member of Char-tered Secretaries Southern Africa (FCIS)
3. Graduate of Chartered Sec-retaries Southern Africa (GradICSA)
6 - 8
IAC 1 1. Accounting Officer 2. Financial Accountant in
Commerce 3. Technical Accountant
6 - 7
ICB 8 None 3 - 6
ICBA N/A 1. Certified Junior Bookkeeper 2. Certified Public Accounts
Administrator 3. Certified Senior Bookkeeper 4. Certified Small Business Fi-
nancial Manager 5. Certified Technical Finan-
cial Accountant 6. Certified Technical Public
Accountant 7. Certified Junior Office Ad-
ministrator 8. Certified Senior Office Ad-
ministrator 9. Certified Financial Account-
ant 10. Certified Office Manager
N/A
IIASA 1 1. Internal Audit Technician (IAT)
8

Fasset Sector Survey 2016 FINAL REPORT: 29 September 2017
46
Name of Profes-sional Body
Number of learnerships registered with Fasset
Designations NQF levels spanned across learnerships and/or designa-tions
2. Professional Internal Audi-tor (PIA)
3. Certified Internal Auditor (CIA)
SAICA 1 1. Chartered Accountant (SA) 2. Associate General Account-
ant (SA)
7 - 8
SAIPA 2 1. Professional Accountant (SA)
2. Accounting Technician (SA) 3. Professional Tax Specialist
(SA) 4. Professional Tax Practi-
tioner (SA) 5. Professional Tax Techni-
cian (SA)
7 - 8
SAIS 1 1. Financial Markets Practi-tioner
2. Stockbroker
7
SAIT 2 1. Master Tax Practitioner (SA)
2. General Tax Practitioner (SA)
3. Tax Technician (SA) 4. Tax Clerk and Administrator
(SA)
6 - 8
SAIBA None 1. Business Accountant (BA) (SA)
2. Business Accountant in Practice (BAP) (SA)
3. Certified Business Account-ant (CBA) (SA)
4. Certified Financial Officer (CFO)(SA)
6 – 9 (designations)
SAIGA None 1. Registered Government Au-ditor
8
Source: Fasset Sector Survey, 2016
3.4.4. Bridging programs
4 (four) professional bodies are also active in the development of bridging or preparatory pro-
grams with short courses that focus on some of the fundamental concepts of the profession,
the aim of which is to increase access to their program offerings, with an intended by-product
of seeing an increase in throughput rates as well.

Fasset Sector Survey 2016 FINAL REPORT: 29 September 2017
47
The ACCA has a bridging program in place called ACCA-X, a year-long, on-line learning plat-
form that can be accessed by anyone. It is mainly used by learners wanting to access the
body’s lower-level designation, the Certified Accounting Technician (CAT). Matriculants with
poor Mathematics and Accounting can access this bridging program, as it covers subjects
such as basic accounting and finance. The ACCA offers this platform at no cost. Learners
only need to pay if they want to receive certification for their modules in order to continue
further with the accounting profession. In July 2016 the body partnered with the Gauteng City
Region Academy (GCRA) to finance the exams for 250 learners. It runs until December 2017,
so it is not yet possible to evaluate its impact.
The AAT (SA) has a bridging program called the Access program which is an introductory
qualification for those who will benefit from learning the basics of accounting and business
communication. It was developed for students who want to progress to achieve the full AAT
Accounting Technician Qualification but who, perhaps, need to develop skills in mathematics
and English. The impact of this bridging program has not yet been evaluated, but the profes-
sional body has plans to do an impact study in 2017.
The SAIT offers a short course in basic taxation through a series of webinars in order to edu-
cate potential students in the fundamental principles and concepts of taxation in order to ena-
ble them to access its learnerships. Target beneficiaries are those in possession of an NQF
level four or five.
A bridging program as well as a conversion course is in place for those who have not com-
pleted SAICA-accredited degrees. Learners access these programs directly with the universi-
ties who offer the bridging programs themselves. SAICA does not drive this programme and
students pay for them themselves or can apply for bursaries. Throughput rates have so far
been very low on these programs.
3.4.5. Scarce skills
As can be seen from the employee profile in chapter one, a high proportion of employees in
the sector are professionals and managers. Scarce skills experienced by employers span a
variety of occupations and NQF levels in the professional and managerial categories, most of
which fall within the ambit of the sector’s professional bodies. During interviews, professional
bodies tended to focus on their own professions when scarce skills were discussed, as these
were the occupations most familiar to them. Most professional bodies considered their partic-
ular occupations as scarce to the sector, so this section will focus on their reasons for the
shortages and the required interventions to address them.
3.4.5.1. Reasons for occupational shortages and required interventions
Poor quality teaching, low Matric pass rates, poor mathematics competency levels and a lack
of adequate career guidance were the predominant reasons professional bodies cited for the
various scarce skills being faced by the sector. A lack of funding to address these factors was
believed to be a challenge.

Fasset Sector Survey 2016 FINAL REPORT: 29 September 2017
48
3.4.5.2. Career guidance
13 (thirteen) of the 16 (sixteen) professional bodies interviewed are involved in career guid-
ance initiatives where high school and university learners are concerned. While just under half
of them make unpartnered visits to schools and universities to provide information on their
particular profession and designation pathways, the most common form of involvement was
by attending large career exhibitions organised by other stakeholders. Only 1 (one) profes-
sional body visits TVET colleges to offer career guidance to learners.
3.4.5.3. Matric Mathematics
Mathematics is seen as one of the most important fundamental subjects for the sector. Not
only is the skill of working well with numbers a crucial element for all of the sector’s core
occupations, professional bodies interviewed agreed that it is the one subject at school level
which facilitates the development of some of the sector’s essential soft skills, being critical
thinking and analytical skills. It is clear from the research referred to in chapter 4 that a
learner’s mathematics competence level is often a predictor of likely access to university, re-
inforcing the value of the subject. 5 (five) of the sector’s professional bodies have initiatives in
place which aim to address this challenge. 2 (two) organisations arrange mathematics camps
for learners who attend certain high schools, where tutoring is the focus of an intensive few
days for learners. Two organisations encourage their members and trainees to volunteer their
time to tutor learners at chosen schools who are struggling with Matric mathematics while
another organisation has developed self-teaching tools which learners are able to access in
order to work through fundamental mathematics concepts and common challenges.
However, South Africa faces such a massive challenge in this area that most (11 (eleven)) of
the professional bodies tend to focus on efforts related to those already pursuing their partic-
ular professions.
3.4.5.4. NQF levels under 6
2 (two) professional bodies whose designations fall between NQF levels 3 and 5 expressed
concern over Fasset’s recent policy change to direct funding efforts to learnerships and initia-
tives which focus only on qualifications that fall on NQF level 6 and above, stating that there
is a negative impact on learners’ access to education and training in the sector. Fasset’s
changes were introduced as a result of the sector’s scarce skills list consistently being domi-
nated by the higher-level occupations, as well as the Department of Higher Education and
Training’s (DHET) proposed changes to the SETA landscape which could be executed in as
early as 2018. Fasset believed that the uncertainty regarding the latter necessitated a radical
priority shift to ensure that as much impact as possible could be made in the sector, leading
to the implementation of the #LastingLegacy campaign. The two professional bodies’ com-
ments echoed a few large employers’ concerns over the establishment of workplace programs
which were developed and implemented for employees in response to Fasset’s earlier funding
incentives which spanned all NQF levels, as well as the argument that occupations on lower
NQF levels are necessary skills pipe-lines for the sector. It is also believed that this moratorium
on funding inhibits access to education for learners who may use lower-level designations as
a career pathway to higher-level occupations, some of which may be scarce in the sector.

Fasset Sector Survey 2016 FINAL REPORT: 29 September 2017
49
3.4.5.5. Other factors
Other factors which were considered inhibitors to increasing access to high quality education
and training for learners included changing governmental policies, skills development priori-
ties, negative mind sets towards transformation and a lack of workplace training, with the latter
two believed to be inter-related.
6 (Six) professional bodies also highlighted that globalisation has led to the ongoing emigration
of many high-level South Africans, wedging a further skills gaps in the sector. This was a
particular concern to the professional bodies, as they believed that until the quality of basic
education is resolved and its provision made equal to all learners, the economy cannot afford
to lose its few senior people.
Since most of these pervasive problems either fall largely within the ambit of basic education
or are exogenous factors, professional bodies focus mostly on mitigating some of the effects
on their own occupations.
3.4.6. Initiatives by Professional Bodies to support skills development
In addition to the development of education and training programs for their particular designa-
tions, professional bodies are involved in functions which support this primary role. Some of
these initiatives are discussed below.
3.4.6.1. Enhancing output rates
14 (fourteen) out of the 16 (sixteen) professional bodies interviewed have programs in place
to enhance the output rates of students pursuing their designations. Most of the qualifications
are considered difficult, especially if learners do not have a strong mathematics foundation.
These 14 (fourteen) organisations make available to their learners a combination of mentor-
ship and tutoring in the form of short courses, refresher and revision classes.
It is believed that some learners drop out owing to a late realisation sometime during the
course of their studies that the profession is not well-suited to them. Professional bodies were
not able to quantify the magnitude of this factor, but many of them stated anecdotally that a
lack of career guidance in high schools is one of the few reasons, together with qualification
difficulty, why dropout rates at universities are so high. It is an area which some mentioned
they have very little control over, especially since professional bodies’ career guidance initia-
tives do not reach a sufficient number high school learners in the country, and there is only a
finite amount of time and resources to focus on their own professions.
3.4.6.2. Available financial support to learners
10 (ten) of the 16 (sixteen) professional bodies interviewed stated that they do not have any
financial support programs in place for learners. Of the 6 (six) which do, 4 (four) of them have
bursary schemes in place, most of which are aimed at a few high-achieving Matric students
from low-income households.

Fasset Sector Survey 2016 FINAL REPORT: 29 September 2017
50
3.4.6.3. Access to learnership opportunities
The lack of workplace readiness programs and workplace experience opportunities were high-
lighted by the vast majority of professional bodies as being one of the biggest challenges for
employers in the sector. Not surprisingly then, access to learnership opportunities is consid-
ered to be one of the critical ways of bridging this gap for learners and employers alike. Most
professional bodies offer only a facilitative role in the area of workplace experience opportu-
nities, using their networks to connect learners with employers.
3.4.6.4. Placement of graduates in the labour market
Only a facilitation role is provided by the majority of professional bodies where graduate place-
ment is concerned (the remaining have no initiatives in place in this area). This is done through
networking, an appointment register and the posting of job opportunities on their website.
3.4.6.5. Continuing Professional Development
13 (thirteen) out of the 16 (sixteen) professional bodies interviewed publish newsletters for
their members and organise workshops on sector and profession updates, as well as facilitate
opportunities for CPD. Insofar as CPD is concerned,, SAQA requires that professional bodies
in South Africa set the criteria for, promote and monitor CPD for their members. They therefore
assume an important leadership as well as facilitative role in this area. Most CPD initiatives
are in the form of workshops, webinars, conferences and short courses.
Additionally, the professional bodies are also involved in efforts for learners and non-members,
which are aimed at increasing access to their membership and designations, as well as in-
creasing throughput rates where there is often a high failure rate and so learners are unable
to progress to the next level of their particular qualification.
3.4.6.6. Recognition of Prior Learning
According to SAQA, RPL is a process through which formal, non-formal and informal learning
are measured, mediated for recognition across different contexts and certified against the re-
quirements for credit, access, inclusion or advancement in the formal education and training
system or workplace. All professional bodies, with the exception of one, recognise RPL as a
valid form of knowledge and skill set which may contribute to the completion of qualifications
and the awarding of designations. Some professional bodies have created a team of asses-
sors who have a standard set of criteria which is used to make informed decisions about a
candidate’s RPL-worthiness, while others assess each individual’s Portfolio of Evidence (PoE)
on a case-by-case basis. The professional body which does not recognise RPL believes that
there is no adequate substitute for formal learning, as individuals require strong theoretical
foundations on which to build new knowledge.

Fasset Sector Survey 2016 FINAL REPORT: 29 September 2017
51
3.4.7. Fasset-funded projects
Given that some of the challenges highlighted in previous sections are not new challenges,
Fasset has partnered with 4 (four) professional bodies to help bridge some of the more con-
cerning skills gaps. These are dealt with below.
3.4.7.1. ACCA
ACCA conducted a project with Fasset as a funding partner, called “Mpumelelo”, an 18-month
project the purpose of which was to address the fact that accountancy/finance in its broader
sense is consistently listed as a scarce skill. It aimed to facilitate access to the accounting
profession through ACCA’s open learning access model to those who would otherwise not
afford to further their studies in this field. A total of 60 (sixty) Black African youths were chosen
for the project, with the minimum admission requirements being an ACCA-accredited finance
degree, having been completed not more than two years previously. The students were also
thoroughly screened through interviews to ensure that being a Chartered Certified Accountant
(CCA) was their ultimate goal.
So far, 48% of the learners have become affiliates, and will qualify as CCAs when their prac-
tical experience is completed. The remaining students are left with an average of two modules
which will be completed on a self-finance basis. There was a 10% drop-out rate due to per-
sonal reasons on the part of the learners.
ACCA deemed the project a success, as it is believed that the absence of it would have led to
lower throughput rates. It has also resulted in a 90% employment uptake. Its key success
factors are perceived to be:
Peer mentor program;
ACCA member mentor program; and
Group session tutoring and revision sessions.
3.4.7.2. ICB
Fasset joined the ICB as a funding partner for an 18-month project in 2015-16 called the
Khanyisa Training Program, the purpose of which was to provide 50 (fifty) Black African learn-
ers from disadvantaged backgrounds in Johannesburg and George with support to complete
3 levels of qualifications culminating in NQF Level 6 as a financial accountant with a National
Diploma in Financial Accounting. Once qualified with the NQF Level 6 qualification, learners
would then be able to further their studies if they wished to through other professional bodies,
such as the ACCA, CIMA, CSSA, SAIBA and SAIT. As minimum admission requirements, the
learners had to possess a Matric qualification or had dropped out of university.
Besides the relevant technical and academic training, the training provider focused on provid-
ing life skills, work readiness and personal finance management.
One of the project’s challenges was that some of the learners had historical weaknesses in
terms of English, Mathematics and Accounting. This resulted in additional training time and
remedial upskilling being required during the project.

Fasset Sector Survey 2016 FINAL REPORT: 29 September 2017
52
The ICB and its training provider had as its target to assist in finding employment for at least
70% of the learners. At the time of writing this SS, 55% of the Gauteng learners have been
employed whilst 44% of the George learners have been employed.
3.4.7.3. SAICA
Fasset joined SAICA as a funding partner for a project called “Thuthuka CTA Distance Learn-
ing Support Project”. SAICA spearheads The Thuthuka UNISA Support Program through the
Thuthuka Education Upliftment Fund, a Non-Profit Organisation established in 2002. The prin-
cipal activities of are to establish and maintain structures for carrying out and promoting skills
development activities, which contributes to transformation of SAICA’s membership de-
mographics as well as of the Chartered Accountancy profession. The aim is that the member-
ship of the profession will eventually reflect the country’s population demographics, in terms
of race and gender.
The Thuthuka CTA Distance Learning Support Project took place from January 2015 to De-
cember 2015 and cost a total of R16 323 560.00. The purpose of the project was to increase
the Certificate in the Theory of Accounting (CTA) throughput rates of Black African candidates
studying the CTA through the University of South Africa (UNISA) by the provision of structured
support classes in the form of lectures. These learners would otherwise not have had access
to such an educational model as UNISA requires a self-study learning format.
The project’s minimum admission requirements for CTA level 1 selection were that learners
had passed all third year subjects in one year. Repeat students were accepted if they had
achieved a minimum average of 40% for all CTA level 1 subjects. Where CTA level 2 selection
was concerned, minimum requirements were that learners had passed all CTA level 1 subjects
in one year. Repeat students were accepted if they had achieved a minimum average of 40%
for all CTA level 2 subjects.
A total of 388 students were supported by the Thuthuka project across levels 1 and 2, showing
an average throughput rate of 34%. This is higher than the total UNISA cohort who achieved
a 30% throughput rate. SAICA believes the key success factor to this result was the engage-
ment and support provided to students in the lectures, which other students are not able to
access.
3.4.7.4. SAIPA
Fasset joined SAIPA as a funding partner for SAIPA’s “Project Achiever” project, which started
in August 2015 and ended in March 2017. SAIPA is spearheading solutions to resolve the
challenges which have led to a critical shortage of graduates with the ability to think in an
integrated manner and apply theoretical knowledge. The project is driven by competency-
based education principles combined with a business approach through the integration of sub-
jects. This ideally leads to the enhancement of an individual’s ability to holistically apply tech-
nical information to find simple solutions for complex problems.

Fasset Sector Survey 2016 FINAL REPORT: 29 September 2017
53
The project targeted Black African learners studying the SAIPA learnerships, namely the Pro-
fessional Accountant in Practice and Professional Accountant in Commerce & Industry learn-
erships. The main objective was the tutoring of these learners in order to increase the through-
put rate of those writing the final Professional Evaluation (PE) assessment. Applicants needed
to have met the academic and practical experience criteria of the learnerships, and were left
only with writing the PE assessment. RPL candidates with the requisite knowledge and expe-
rience were also accepted. 4 (four) groups completed the program, with a total of 530 (five
hundred and thirty) learners on the program.
The number of trainees who successfully completed the program to become a professional
accountant has changed the composition of SAIPA’s PE assessment from 28%:72% in favour
of non-SAIPA trainees (other candidates who apply to become members of SAIPA but who
have not followed the SAIPA learnership) to 50%:50%. The project has also succeeded in
changing the demographics of SAIPA’s membership of Black Africans from 27% to 36%.
Learners on the project were also shown to have developed the following skills:
integration of knowledge for practical application – general competence;
higher order thinking – critical thinking and problem solving;
analytical skills for the comprehension and analysis of business problems/issues;
report writing skills;
effective business communication skills;
inter-personal skills; and
presentation skills.
SAIPA believes that the project’s key success factor lies in its teaching methodology, specifi-
cally:
competency-based education, i.e. developing the skills to engage with academic ma-
terial. Higher order skills are developed such as critical reading & thinking as well as
problem solving skills;
integrated teaching where the boundaries of subjects are removed and business situ-
ations are analysed to develop holistic solutions;
group working in the format of workshopping which allowed the candidates to debate
and share practical and technical experience, thereby developing group dynamic and
communication skills; and
the structure and design of the material used focuses on the learning process rather
than the content (student-centred approach).
3.4.8. Change drivers which might impact the sector
Professional bodies were asked about their views on the change drivers either currently im-
pacting the sector, or having the potential to do so within the next 5 (five) years, with a specific
emphasis on those which could impact either skills demand and/or supply.

Fasset Sector Survey 2016 FINAL REPORT: 29 September 2017
54
3.4.8.1. Technology
The impact of the advances in technology on skills demand were mentioned by 7 (seven)
professional bodies. The transformation from manual to automated processing will likely see
some jobs lost in the financial services industry, but questions remain regarding the real impact
and which categories of professionals will be affected the most. While there may be a loss
seen in some jobs, one of the CEOs interviewed cited a report published in 2015 by the Royal
Melbourne Institute of Technology University (RMIT) and Chartered Accountants Australia and
New Zealand called “Future proofing the profession: preparing business leaders and finance
professionals for 2025” which concluded that there will be a major growth in ‘interaction jobs’,
a direct effect of increasing automation. These are jobs that cannot easily be outsourced or
automated because people in these roles require high levels of analytical skills, reasoning and
judgement. As already mentioned under the section on critical skills gaps, the ability to man-
age non-routine tasks and be strong in creative problem-solving will become increasingly im-
portant to the sector.
It is generally believed, however, that not just new graduates will need to up-skill, but also
established financial professionals. Upskilling is a considerable challenge and that is where
professional bodies play a major role by providing relevant life-long learning. However, most
professional bodies were in agreement that it is difficult to understand exactly how each of the
different professions will need to adapt to imminent technologies. As will be seen in a later
section of this chapter, professional bodies are aware of this already-very-familiar narrative
regarding technology, and ideally now need comprehensive research to be undertaken which
can explain in detail how the researchers and developers’ innovations are expected to disrupt
the sector and affect its professions. Their comments expressed the need to prepare timeously
for what the future financial professional needs to look like and be skilled in.
3.4.8.2. Globalisation
As mentioned under the section on scarce skills, six professional bodies highlighted that glob-
alisation has led to the ongoing emigration of many high-level South Africans, responsible in
part for the scarcity of certain occupations. This was a particular concern to the professional
bodies, as until the quality of basic education is resolved and its provision made equal to all
learners, the economy cannot afford to lose its few senior people.
The report referred to above, “Future proofing the profession: preparing business leaders and
finance professionals for 2025” also points to an increase in the global demand for account-
ants, coupled with a decline in supply. Worldwide, there has been growth in both high-skilled
and low-skilled jobs, but almost no growth at any time in middle-skilled jobs. This has resulted
in the polarisation of work where, in a connected world, unless you are world-class in your
chosen field you will face huge competition with a global pool of workers. But if you are among
the best then you can access a global market fairly easily. Considering the relatively small
pool of professionals which South Africa is producing, professionals who are indeed rated
among the best in the world, this is an area of which South Africa’s economy is presently on
the losing end.

Fasset Sector Survey 2016 FINAL REPORT: 29 September 2017
55
3.4.8.3. University students protests
The interviews with professional bodies took place in September and October 2016, at the
height of the university “#FeesMustFall” protests around the country, when some of the uni-
versities had either suspended classes and/or had closed their campuses indefinitely. It was
thus unsurprising that this was highlighted as a concerning change driver by most interview-
ees. Many respondents agreed that the worst-case scenario would be students losing a few
years in their studies, which could destabilise the sector. The current universities would need
to make massive budget cuts, with one of the likely casualties being research. An increased
number of private universities would also start to emerge, head-hunting many of the public
universities’ best human resources. This would ultimately lead to South Africa’s public univer-
sities facing downgrades in the eyes of the global community. While it will take time for this
scenario to play out, it would be accompanied by the fear that this may wedge an even greater
gap in higher education between those who can afford a high quality education and the ma-
jority who rely on government subsidisation. Challenges as discussed in this document may
become exacerbated, while the efforts currently being taken to resolve them may require ex-
ponentially increasing pressure on employers, professional bodies and government to expand
access to high quality education for all, but with the same limited resources.
3.4.8.4. Sector regulation
In 2005, the Auditing Profession Act (Act 26 of 2005) separated the regulatory framework of
the auditing part of the profession from the accounting part of the profession. This is believed
to have led to the issuing of fewer incorrect opinions on the part of external auditors. Up to the
present day, the non-auditing part of the profession remains less regulated. However, in 2013,
South Africa’s then Minister of Finance invited the World Bank to determine whether South
Africa could further improve the auditing and accounting landscape, and aimed to ascertain
whether all accountants should become subject to regulation. The World Bank issued a report
recommending the full regulation of accountants, the reason being that they were starting to
do a lot of work that only external auditors were permitted to do in the past.
While the services of professional bodies do incorporate most regulatory functions such as
the monitoring of performance and behaviour, standards setting and disciplinary action, these
relate to their own members only and stakeholders in favour of a “super regulator” argue that
certain standards have to be met across the different accounting professions as well. This
could include regulation over minimum education and CPD requirements, potentially affecting
numerous accounting professionals who will need to adapt to these or risk having their desig-
nations removed.
While it is still uncertain what the entire range of implications will be if a super regulator is
indeed introduced, full regulation of the accounting profession may also mean that all practi-
tioners referring to themselves as accountants will need to become members of a professional
body. Currently they do not have to unless they want a particular designation. Since member-
ship of a professional body requires proof of meeting minimum requirements, full regulation of
the profession would necessitate broad action and adaptation by non-members, particularly
where education, workplace experience and professional body qualifying exams are con-
cerned.

Fasset Sector Survey 2016 FINAL REPORT: 29 September 2017
56
3.4.8.5. The Quality Council for Trades and Occupations
According to SAQA, when a professional body wishes to give formal recognition to an occu-
pational qualification as a precondition for the issuing of its designation, it must enter into a
formal agreement with the QCTO to attain the authority to develop and/or quality assure the
occupational qualification. This process is also important if a professional body or an employer
wishes to access funding from Fasset or other government bodies for learners pursuing their
designations. As the QCTO model is relatively new and its policies are still unfolding, there
remains much uncertainty in the sector with regard to if and how professional bodies need to
adapt their own qualifications accordingly to fit QCTO’s requirements. Two professional bodies
also expressed a concern regarding whether the qualifications offered by professional bodies
working on similar NQF levels will be allowed to continue independently, or if the QCTO will
require a standardisation across them. There are also fears that the transitionary period may
cause delays in qualification attainment and therefore the time within which an individual will
be able to begin practising formally in their profession.
3.4.9. Future plans
The future plans of 80% of the professional bodies include a continuing primary focus on train-
ing and development. Partnerships will be key to this focus. Universities and other approved
training centres are important as the providers of their qualifications as well as gaining access
to their students for the provision of career awareness. Other professional bodies are im-
portant for cross-training opportunities and the recognition of qualifications between their des-
ignations. Government organisations such as SETAs are important because, many joint initi-
atives as well as lobbying on behalf of their members and providing input into legislation is
possible.
Additionally, 5 (five) Professional bodies will also be focusing on transformation, while another
four will increase efforts on lobbying, advocacy and collaboration for the benefit of their mem-
bers, learners and potential members. 4 (four) Professional bodies will be gearing up re-
sources to increase their membership base and broaden their network. Other focus areas for
a few of the professional bodies include Small, Medium and Micro-Sized Enterprises (SMME)
business owners, school-leavers, quality assurance and registering qualifications with the
QCTO.
9 (nine) Professional bodies are planning to develop new programs, 4 (four) of which will be
learnerships leading to designations, while others will be short courses in specialised fields,
namely transfer pricing, data analytics and public sector. 1 (one) of them is a bridging program
which will be designed for learners studying at a TVET college who would like to access the
career pathway of 1 (one) of the professional body’s lower designations.
3.4.10. Challenges and suggested solutions
3.4.10.1. Challenges faced by professional bodies
Table 3-4 highlights the biggest challenges faced by each of the professional bodies where
development of scarce skills is concerned.

Fasset Sector Survey 2016 FINAL REPORT: 29 September 2017
57
Table 3-4: Main skills development challenges faced by professional bodies
Professional Body 1st challenge 2nd challenge 3rd challenge
ABASA Language and cul-
tural barriers at ed-
ucation level, limit-
ing the ability to
learn
Subjectivity ap-
plied in the perfor-
mance appraisal
process, thus re-
moving objective
and fair assess-
ment of a person's
development
Lack of accessible
and sufficient tutor-
ing
AATSA Lack of funding for
learnerships on
NQF levels 5 and
below
Lack of funding for
work-readiness
programs
Lack of application
skills & integrated
thinking abilities
ACFESA Lack of funding for
learnership
Lack of adequate
career guidance
The lack of individ-
uals with enquiring
& analytical skills
ACCA Lack of adequate
career guidance
Lack of application
skills & integrated
thinking abilities
Lack of funding.
Related to this is
that SETA funding
models are per-
ceived to be not
conducive to re-
sponding to and
mitigating identi-
fied skills short-
ages
CIMA Lack of application
skills & integrated
thinking abilities
Lack of adequate
career guidance
Poor numeracy
skills
CSSA Developing people
with combination
skills (technical,
business & soft
skills)
The lack of individ-
uals with
knowledge of gov-
ernance and com-
pliance
Lack of adequate
career guidance
IAC Standards are
dropping at all lev-
els of education
Lack of adequate
career guidance
Difficulty of qualifi-
cations
ICB Lack of funding for
learnerships on
NQF levels 5 and
below
Lack of adequate
career guidance
Poor numeracy
skills
ICBA Lack of funding for
learnerships on
Lack of adequate
career guidance
Poor numeracy
skills

Fasset Sector Survey 2016 FINAL REPORT: 29 September 2017
58
Professional Body 1st challenge 2nd challenge 3rd challenge
NQF levels 5 and
below
IIASA Lack of adequate
career guidance
Profession is not
regulated – difficult
for stakeholders to
understand and
accept that IAs
need to meet cer-
tain requirements
Lack of funding
SAICA Low throughput
rates for B.Com
degrees and the
post graduate de-
gree (CTA)
Low numbers of
high school learn-
ers passing Mathe-
matics with 60% or
more
Lack of adequate
career guidance
SAIPA The extent to which
technology will re-
place the role of
the professional
Lack of application
skills & integrated
thinking abilities
Lack of adequate
career guidance
SAIS Lack of transfor-
mation in the sec-
tor
Lack of adequate
career guidance
Lack of application
skills & integrated
thinking abilities
SAIT Lack of work-readi-
ness
Lack of ethics Lack of application
skills & integrated
thinking abilities
SAIBA Lack of application
skills & integrated
thinking abilities
Lack of skills in
new technologies
Developing people
with combination
skills (technical,
business & soft
skills)
SAIGA Lack of public sec-
tor-specific educa-
tion
Lack of application
skills & integrated
thinking abilities
Lack of business
acumen
Source: Sector Survey (2016)
Table 3-4 above shows that the five most prominent skills development challenges faced by
the 16 (sixteen) professional bodies are:
lack of adequate career guidance;
lack of application skills and integrated thinking abilities;
developing people with combination skills (technical, business & soft skills);
lack of funding (for work-readiness programs and learnerships); and
poor numeracy skills.

Fasset Sector Survey 2016 FINAL REPORT: 29 September 2017
59
3.4.10.2. Suggested solutions to identified challenges
The sections which follow are a consolidation of the suggestions put forward by the profes-
sional bodies interviewed, in mitigation of these challenges, as well as others mentioned in
earlier sections of this chapter.
3.4.10.2.1. Learnerships and mentorship
Owing to the large gap which professional bodies stated exists between theory and practice,
nine of them believed that an increase in access to learnerships was one of the most critical
needs in the sector, with more funding and facilitation by Fasset directed towards this.
Directly related to this were the comments from 2 (two) professional bodies which highlighted
the need to increase access to relevant one-on-one mentorship in the workplace. Many or-
ganisations struggle to provide this adequately owing to their senior staff having limited time
to do so at the level required. Fasset may be able to provide a better mechanism for learners
and graduates to access mentorship. 1 (one) of the professional bodies suggested the initia-
tion of a network of retirees for this purpose, as their time and many years of experience could
allow for dedicated mentoring of learners and new graduates.
3.4.10.2.2. Work-readiness programs
As mentioned under the section on critical skills gaps which span more than 1 (one) occupa-
tion, one of the professional bodies’ biggest concerns was how unprepared graduates are for
the world of work, from general business communication skills to appropriate attire and con-
duct, as well as considerable lack of confidence which hampers an individual’s ability to take
initiative and even to ask for assistance when needed. Both employers and professional bod-
ies made reference to the effectiveness of the work-readiness program that Fasset used to
fund, and some expressed a desire to see the SETA returning funding to the initiative again.
In addition to these programs leading to more well-rounded workers, it was also believed that
increased levels of self-confidence and assertiveness would likely lead to increased produc-
tivity in the workplace.
3.4.10.2.3. Funding: projects and other designations
Of the 9 (nine) professional bodies who spoke about the need for funding, 6 (six) of them felt
that Fasset could direct a portion of its financial resources to different designations in the sec-
tor, to increase the available options to learners. Three of the professional bodies spoke spe-
cifically about the need for increased project-based funding, which is normally aimed at in-
creasing throughput rates and are considered very successful at doing so.
3.4.10.2.4. Soft skills workshops
The lack of application skills with integrated thinking ability, together with critical thinking skills,
were the soft skills of most concern to professional bodies, and were mentioned by almost all

Fasset Sector Survey 2016 FINAL REPORT: 29 September 2017
60
of them. Discussions around mitigating the issue involved facilitating conversations with edu-
cation and training institutions to introduce a more integrated way of teaching and assessing
learners, as well as workshops and using the platform of work-readiness programs were held.
Other soft skills of concern included negotiation, decision-making, management skills and eth-
ics – all of which could be developed during workshops. 1 (one) of the professional bodies
cautioned that 1 (one) workshop alone in 1 (one) of these areas would not adequately develop
the particular skill. It was emphasised that refresher courses would be needed to embed the
learnings and develop the skill robustly.
3.4.10.2.5. Career guidance
Almost all professional bodies expressed concern at the lack of adequate levels of informative
career guidance at high school level. This was on the top 3 (three) list of biggest skills devel-
opment challenges for the vast majority of professional bodies (see Table 3.5). Stakeholders
in the sector widely believe that career guidance initiatives should be taking place before
Grade 10, before learners need to decide their subjects, including whether or not to drop Math-
ematics and replace it with Mathematics Literacy. There is a lack of informative career guid-
ance for the majority of the population which would help a person understand the variety of
career options and career progression opportunities that are available. Those professional
bodies who piggyback on and participate in career events, or even those who are able to
create their own career awareness campaigns, have limited human and financial resources to
resolve this on the scale that is required. It was believed that there is a distinct lack of aware-
ness in and/or information about the following professions: forensic practitioner, company sec-
retary, internal auditor, investment analyst, trader and certain types of accountant.
Professional bodies emphasised the role of career guidance in creating awareness and
knowledge around the diverse finance and accounting career options available, as well as in
providing information on the importance of pursuing Mathematics and Science until Grade 12
(including the consequences on future career prospects if not done). Career guidance events
should provide sufficient detail so that a person is empowered to make an informed decision
regarding their future career. 12 (twelve) professional bodies believed that increased access
to comprehensive career guidance would lead to a significantly increased likelihood of individ-
uals choosing a career path which most appealed to them, one which they will enjoy studying
and practising, thereby reducing dropout rates, avoiding career changes and unnecessary
training expenditure at a later stage, as well as increasing productivity levels in the workplace.
3.4.10.2.6. SETA landscape and policy changes
At the end of 2015 the Minister of the DHET tabled a proposal for the radical restructuring of
the SETAs, as early as March 2018. As mentioned in the previous section on scarce skills,
this was one of the major catalysts in Fasset’s decision to prioritise higher NQF levels as well
as remove funding of certain initiatives such as work-readiness programs. While some factors
impacting SETAs are indeed exogenous in nature, and SETAs are therefore not in control of
the outcomes, two professional bodies expressed frustration over dramatic policy changes
that are enforced suddenly and with immediate effect, and without prior consultation with sec-
tor stakeholders. They felt that it disrupted efforts which had taken much time and resources
to implement. In December 2016 (after the data collection phase of this sector survey had

Fasset Sector Survey 2016 FINAL REPORT: 29 September 2017
61
concluded but before analysis and report-writing began) the Minister of the DHET extended
the current mandates and structures of the country’s 21 (twenty one) SETAs by another 2
(two) years beyond March 2018, to 31 March 2020, which could pave the way for a possible
return of Fasset funding for projects and programs considered effective by the sector’s stake-
holders.
3.4.11. Recommendation for further research
Areas which professional bodies believed that research was needed, and which Fasset could
initiate and fund on behalf of and for the benefit of the sector’s stakeholders, include:
3.4.11.1. Future impact of technology
As mentioned under the section on change drivers, professional bodies are aware that tech-
nology is currently, and will continue to, affect numerous professions within the sector. How-
ever, much of the narrative on technology is fairly vague and professional bodies expressed
a need for comprehensive research to be undertaken which can explain in detail how the
researchers and developers’ innovations are expected to disrupt the sector and exactly how
they will affect its professions. The findings will help them to prepare timeously for what the
future financial professional needs to look like and be skilled in.
3.4.11.2. Impact of regulation
One of the potential change drivers is the sector’s current debates on the introduction of a
“super regulator”. A few professional bodies felt it important that research be done in advance
of this possibility, in order to start constructive debates around what the required action points
will be should this go ahead, particularly with regard to possible upskilling and reskilling, in
order to prepare accordingly.
3.4.11.3. Development of integrated thinking skills
Many of the occupations listed in the critical skills gap section were highlighted for the lack of
integrated/critical thinking abilities in new graduates and junior professionals. As seen from
the same section, many of the high-level occupations in the sector are evolving to encompass
strategic and advisory roles, requiring professionals to becoming increasingly “big picture”
thinkers, as well as possessing interpersonal skills and solid business acumen. This requires
an integrated thinking approach, and many professional bodies felt that research could be
done on how to successfully incorporate this into teaching methods, curricula and assess-
ments at university level, by considering best practice and innovative models around the world.
3.4.11.4. Impact of withdrawal of funding
A handful of professional bodies, which echoed some employers’ concerns, believed that Fas-
set should consider conducting an assessment on the impact of their decision to withdraw
funding from certain projects, for example work-readiness programs and learnerships targeted
at NQF levels 5 and lower. Their experiences were showing that these initiatives had made a

Fasset Sector Survey 2016 FINAL REPORT: 29 September 2017
62
large impact in the sector. Work-readiness programs was the initiative which was emphasised
by the majority of this group of professional bodies.
3.4.11.5. Career guidance
Most stakeholders in the sector, including professional bodies, focus on their own areas of
specialisation and therefore any career guidance initiative taken focuses only on these skills.
Those who do not take part in any career guidance activities are usually resource-constrained
where finances and human resources are concerned. Furthermore, it was expressed by many
of the professional bodies that most career guidance efforts, whether sector-specific or other-
wise, have inadequate and limited information for learners, for example on the vast array of
finance and accounting careers available in the sector. A few professional bodies expressed
the need for research into more effective ways to disseminate adequate and informative de-
tails on the different career options available, as well as how to extend the reach of these
initiatives to significantly more high school learners.
3.4.11.6. Other research requirements
The following is a list of the less common suggestions from professional bodies where re-
search requirements is concerned:
how to build a network of retirees who can mentor learners;
how to make CPD more relevant, rather than a compliance exercise;
the impact of language barriers on learners;
determine the average company’s ratio of higher to lower level finance skills; and
is the QCTO model workable?

Fasset Sector Survey 2016 FINAL REPORT: 29 September 2017
63
4 SURVEY OF EDUCATION AND TRAINING PROVIDERS
4.1 Introduction
The skills required for the sector are produced at school, TVET colleges, private training pro-
viders, universities and workplaces. This chapter focuses primarily on understanding the ed-
ucation and training providers in the sector. At a high level, the following elements will be
discussed:
organisational capacity to produce the skills required for the sector;
challenges in the provision of education and training from the perspectives of the sec-
tor’s education and training providers; and
recommendations to improve education and training in the sector.
4.2 Survey of Universities and TVET Colleges
4.2.1. Data collection
The data collection phase of the SS predominantly took place during September and October
2016, which was during the height of the “#FeesMust-Fall” student protests at the majority of
the universities around the country which resulted in suspension of classes and / or complete
closures. This resulted in 13 (thirteen) out of a possible 24 (twenty four) Accounting and Com-
merce Departments being e interviewed Table 4-1 indicates the names and provincial distri-
bution of universities that participated in the survey. Upon the resumption of the normal time-
table, the prospective interviewees from the remaining 11 (eleven) universities were not avail-
able due to lost time as a result of the protests. .
Table 4-1: Universities Surveyed
University Province
Rhodes University Eastern Cape
University of Fort Hare Eastern Cape
Walter Sisulu University of Technology Eastern Cape
University of South Africa Gauteng
Tshwane University of Technology Gauteng
Vaal University of Technology Gauteng
University of Zululand KwaZulu-Natal
Mangosuthu University of Technology KwaZulu-Natal
North West University North West
Cape Peninsula University of Technology Western Cape
University of Cape Town Western Cape
University of the Western Cape Western Cape
Sol Plaatjie University Northern Cape
Source: Sector Survey (2016)

Fasset Sector Survey 2016 FINAL REPORT: 29 September 2017
64
Of the 13 (thirteen) universities whose representatives were successfully interviewed, the in-
terviewees were either the Deans of the Commerce faculties, or the Heads of the Accounting
Departments. 22 (twenty two) public TVET colleges, and 8 (eight) private TVET colleges were
interviewed. Most interviewees were Principals, Deputy Principals and Heads of Department.
Table 4-2 indicates the names and provincial distribution of public colleges who participated
in the survey.
Table 4-2: Public TVET colleges Surveyed for the Study
Public TVET college Province
Eastcape Midlands College Eastern Cape
Port Elizabeth College Eastern Cape
King Hintsa TVET College Eastern Cape
Buffalo City TVET College Eastern Cape
King Sebata Dalindyebo TVET College Eastern Cape
Lovedale TVET College Eastern Cape
Goldfields TVET College Free State
Motheo TVET College Free State
Maluti TVET College Free State
Tshwane South TVET College Gauteng
Westcol TVET College Gauteng
Ekurhuleni East TVET College Gauteng
Umfolozi TVET College KwaZulu-Natal
UMgungundlovu TVET College KwaZulu-Natal
Coastal TVET College KwaZulu-Natal
Elangeni TVET College KwaZulu-Natal
Vuselela TVET College North West
Northern Cape Urban TVET College Northern Cape
College of Cape Town Western Cape
Intec College Western Cape
Northlink College Western Cape
False Bay TVET College Western Cape
Source: Sector Survey (2016)
Private colleges included in the survey, together with their provincial distribution, are as listed
in Table 4-3.
Table 4-3: Private TVET colleges Surveyed for the Study
Private TVET college Province
Damelin College Gauteng
Boston City Campus and Business Col-
lege
Gauteng
Pretoria Technical College Gauteng
Sage Africa Gauteng

Fasset Sector Survey 2016 FINAL REPORT: 29 September 2017
65
Private TVET college Province
Birnam Business College Gauteng
Richfield Graduate Institute of Technol-
ogy
KwaZulu-Natal
Varsity College KwaZulu-Natal
Compass Academy of Learning Limpopo
Source: Sector Survey (2016)
4.2.2. Qualifications
A broad range of Fasset -related programs are offered by universities. University survey re-
spondents indicated that their institutions offer diplomas and degrees in the following Fasset-
related programs:
Business Management, Administration and Operations;
Accounting and related services;
Business and Corporate Communications;
Economics;
Finance and Financial Management;
Real Estate; and
Taxation.
For universities, these programs are offered from Diploma to PhD levels with the majority of
students studying for undergraduate degrees. At TVET colleges, programs offered include the
following:
National Certificates in Finance, Economics and Accounting;
N4-N6 in Financial Management;
N4-N6 in Business Management;
Accounting Technician Certificates and Diplomas; and
Certificates and Diplomas in Bookkeeping.
Although the nature of challenges faced may vary, both universities and TVET colleges face
a plethora of issues in implementing Fasset-related qualifications. These challenges encom-
pass, amongst others, the adequacy and qualification of lecturers, study content and curricu-
lum relevance, finance for learners, placement for practical work exposure and graduate ac-
cess to employment. If not properly addressed, all these issues have a potential of undermin-
ing the quality of education and may result in students attaining deficient qualifications that
may leave them disadvantaged in the employment market place. A comparative analysis of
responses across a spectrum of these issues from survey respondents at universities and
public colleges reveals some interesting insights.
On the issue of challenges faced with respect to lecturers, 38% of survey respondents from
universities indicated that lecturers are inadequate. For public TVET colleges, a slightly more
positive response was received from those respondents where 50% did not think their institu-
tions have a problem with lecturers. Given the level of qualification of university lecturers, it
seems plausible to assume that universities may have a more difficult task of recruiting and
retaining skills than TVET colleges. This would perhaps explain the different perceptions in
terms of the adequacy of lecturing staff. In respect of study content and curriculum relevance
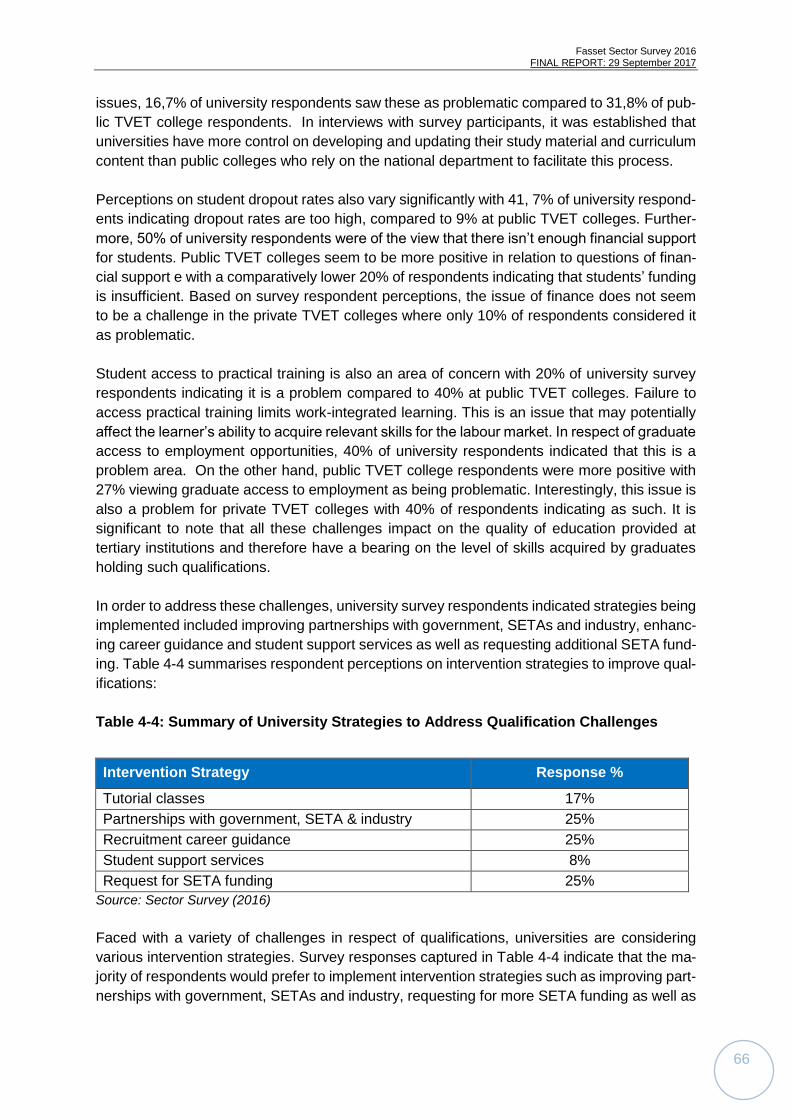
Fasset Sector Survey 2016 FINAL REPORT: 29 September 2017
66
issues, 16,7% of university respondents saw these as problematic compared to 31,8% of pub-
lic TVET college respondents. In interviews with survey participants, it was established that
universities have more control on developing and updating their study material and curriculum
content than public colleges who rely on the national department to facilitate this process.
Perceptions on student dropout rates also vary significantly with 41, 7% of university respond-
ents indicating dropout rates are too high, compared to 9% at public TVET colleges. Further-
more, 50% of university respondents were of the view that there isn’t enough financial support
for students. Public TVET colleges seem to be more positive in relation to questions of finan-
cial support e with a comparatively lower 20% of respondents indicating that students’ funding
is insufficient. Based on survey respondent perceptions, the issue of finance does not seem
to be a challenge in the private TVET colleges where only 10% of respondents considered it
as problematic.
Student access to practical training is also an area of concern with 20% of university survey
respondents indicating it is a problem compared to 40% at public TVET colleges. Failure to
access practical training limits work-integrated learning. This is an issue that may potentially
affect the learner’s ability to acquire relevant skills for the labour market. In respect of graduate
access to employment opportunities, 40% of university respondents indicated that this is a
problem area. On the other hand, public TVET college respondents were more positive with
27% viewing graduate access to employment as being problematic. Interestingly, this issue is
also a problem for private TVET colleges with 40% of respondents indicating as such. It is
significant to note that all these challenges impact on the quality of education provided at
tertiary institutions and therefore have a bearing on the level of skills acquired by graduates
holding such qualifications.
In order to address these challenges, university survey respondents indicated strategies being
implemented included improving partnerships with government, SETAs and industry, enhanc-
ing career guidance and student support services as well as requesting additional SETA fund-
ing. Table 4-4 summarises respondent perceptions on intervention strategies to improve qual-
ifications:
Table 4-4: Summary of University Strategies to Address Qualification Challenges
Intervention Strategy Response %
Tutorial classes 17%
Partnerships with government, SETA & industry 25%
Recruitment career guidance 25%
Student support services 8%
Request for SETA funding 25%
Source: Sector Survey (2016)
Faced with a variety of challenges in respect of qualifications, universities are considering
various intervention strategies. Survey responses captured in Table 4-4 indicate that the ma-
jority of respondents would prefer to implement intervention strategies such as improving part-
nerships with government, SETAs and industry, requesting for more SETA funding as well as

Fasset Sector Survey 2016 FINAL REPORT: 29 September 2017
67
offering more career guidance. Given the diversity of challenges faced, it would however be
safe to conclude that better results could be realized through implementation of a variety of
strategies.
At TVET colleges, respondents indicated that strategies highlighted in the following table were
in place to address challenges, as summarised in Table 4-5.
Table 4-5: Summary of Public TVET Strategies to Address Qualification Challenges
Intervention Strategy Response %
Lecturer capacity building 9,1%
Partnerships with government, SETA & industry 18,2%
Recruitment career guidance 9,1%
Re-assessment of learners 13,6%
Student support services 27,3%
Request for SETA funding 13,6%
Source: Sector Survey (2016)
The summary of respondent perceptions in Table 4-5 indicates that public TVET colleges con-
sider improving student support services as key to improving qualifications. Also considered
critical is improving partnerships with government, SETAs and industry, re-assessment of
learners and requesting additional funding from the SETA. As noted in respect of universities,
an effective intervention strategy would be one that takes into account the variety of issues
faced by different institutions and thus implementing specific intervention strategies to address
them.
4.2.3. Institutional Capacity
4.2.3.1. Lecturing staff
4.2.3.1.1. Universities
Results indicate that the quality of lecturing staff is a challenge for both universities and TVET
colleges. Although 50% of respondents from universities felt they had adequate capacity of
lecturing staff, 38% indicated that capacity was inadequate. For some universities challenges
revolve around the ability to attract and retain suitably qualified expertise particularly Chartered
Accountants. In most cases qualified Chartered Accountants prefer to pursue opportunities in
other organisations, rather than take up a lecturing job at a university. This could be related to
issue of salaries and career opportunities available in the broader economy, compounded by
scarcity of accountants generally. To counter this challenge, some institutions have suggested
that consideration be made for top-up salaries for lecturing staff as a way of improving reten-
tion in the public sector.
Equally important for universities is the quality of lecturing staff in terms of their depth of ex-
perience and ability to integrate theory and practice. Some universities indicated that a signif-
icant proportion of their lecturing staff has never worked elsewhere and this tends to limit their

Fasset Sector Survey 2016 FINAL REPORT: 29 September 2017
68
ability in integrating theory with relevant industry practice. As a remedial measure, it was sug-
gested that opportunities be explored to identify employers who can accommodate lecturing
staff on attachment over vacations for practical work experience.
The quality of lecturing staff is also affected by lack of relevant soft skills training prior to en-
gagement. It was indicated that some lecturers lacked basic presentation and research skills
which in turn affects their ability to deliver lectures effectively. This skills gap is emanating from
the fact that lecturers are not employed for their teaching skills but rather on the basis of the
academic certificates they hold from universities. It was observed that unlike arts and social
science disciplines, Accountants are generally not well trained in soft skills and they therefore
lack these essential skills as lecturers. A specific training program will be necessary to close
this training gap.
4.2.3.1.2. TVET colleges
To a large extent, the issues facing TVET colleges regarding quality of lecturing staff mirror
those found at universities. Although 86% of respondents at public TVET colleges indicated
that they have adequate capacity in terms of lecturing staff, the challenge relates to retaining
qualified and experienced employees. As a result of competition from other organisations,
employment in TVET colleges is largely seen as a stepping stone by most university gradu-
ates. Lecturers at TVET colleges also lack practical work exposure in other organisations and
this affects their ability to integrate theory with relevant industry practice. The need for skills
development for lecturers at public TVET colleges is clearly reflected when one analyses re-
spondent views on future training requirements discussed later in this report. As part of the
intervention strategies, more than 30% of respondents would like to up-skill their lecturers.
4.2.3.2. Infrastructure
4.2.3.2.1. Universities
Availability of infrastructure is a problem for the majority of university survey respondents. Only
50% of respondents indicated that infrastructure was adequate. The problem is rooted in the
rapid expansion in student intake levels which has unfortunately not been matched by infra-
structure growth. This has undoubtedly created infrastructure bottlenecks for student lecture
rooms, facilities and lecturer offices. As a result of limited operational budgets, maintaining
available infrastructure is also a challenge. One office block visited had no working lifts and
the researcher had to climb a number of steps to get to the meeting venue. While good for a
healthy lifestyle, this must be a frustrating experience for lecturers that have no choice every
day they report for duty.
4.2.3.2.2. TVET Colleges
As with universities, public TVET colleges are also experiencing infrastructure challenges em-
anating from the exponential increase in demand for tertiary education. 54% of respondents
were however slightly more positive and indicated that their infrastructure was adequate for
current needs. This must be viewed against 31, 8% who felt that infrastructure was insufficient.

Fasset Sector Survey 2016 FINAL REPORT: 29 September 2017
69
However, any observant visitor to public TVET colleges cannot ignore the large student pop-
ulation numbers on each campus. In 1 (one) TVET college visited in KwaZulu-Natal, the re-
searcher noted the large student population... Respondents confirmed that, infrastructure at
public TVET colleges is under pressure. It may collapse in the near future unless the South
African government continues to invest in college capital projects. It must however be recog-
nized that over the past few years the South African government has invested extensively in
public TVET colleges with a view to improve infrastructure. In light of this observation, it is safe
to conclude that current infrastructure challenges are more to do with the large student num-
bers rather than lack of trying by the South African government.
Interestingly, a different atmosphere was observed at private TVET colleges, an issue that
might be related to cost barriers and not lack of demand for education facilities. A private TVET
college visited in Durban exhibited a welcoming atmosphere with student numbers seemingly
proportionate to available infrastructure. The buildings were neat and gardens well main-
tained, a far cry from what was observed at some public institutions. However, only 50% of
respondents at private TVET colleges indicated that infrastructure was adequate for their
needs.
4.2.3.3. Administrative staff
4.2.3.3.1. Universities
Lack of adequate financial resources has constrained the ability of universities and public
TVET colleges alike from employing adequate staff complements to provide administrative
support to their institutions. Respondents at both institutions indicated this was an area of
need and that capacity is constrained by inadequate resources. For universities, 50% of sur-
vey respondents indicated their administrative staff complement was adequate.
4.2.3.3.2. TVET Colleges
At public TVET colleges, only 31, 8% of respondents indicated that administrative support staff
was adequate. 50% of respondents from public TVET colleges felt that administrative support
staff was inadequate for their college needs. In difficult times, it is a fact that when organisa-
tional resources are inadequate support services are usually the ones that gets the first cut
before one looks at core functions. It is therefore hardly surprising that administrative staff
complements at public educational institutions are already exhibiting signs of strangulation
consistent with inadequate financial support. On the other hand, private TVET colleges were
slightly positive on the adequacy of their administrative support functions with 50% of respond-
ents indicating this position.
4.2.3.4. Financial Resources
Given financial challenges facing the national fiscus, the exponential increase in student intake
at both universities and public TVET colleges (“public institutions”) has not been matched with
adequate financial resources. For both public institutions, respondents affirmatively indicated

Fasset Sector Survey 2016 FINAL REPORT: 29 September 2017
70
that there are inadequate financial resources for the demands at hand. At public TVET col-
leges, as much as 54, 5% of the respondents indicated that financial resources were inade-
quate for their needs. For universities, 57% of respondents indicated that financial resources
were adequate. This inadequacy has led to various challenges such as low operational budg-
ets which in turn constrains effective running of institutions. The current drive for a no-fee
regime at universities will no doubt exacerbate institutional financial challenges and thus put
further pressure on them in fulfilling their mandates.
Based on survey respondent perceptions, financial resources are also a constraint for private
TVET colleges. Only 50% of respondents indicated that financial resources were adequate for
their needs. It must however be appreciated that private TVET colleges normally charge higher
fees than public institutions (and therefore presumably enjoy better margins) and may not
have the challenge of poor debt recovery that public institutions are sometimes burdened with.
4.2.4. Effectiveness of department initiatives
4.2.4.1. Career guidance at school
Career guidance in schools is viewed as problematic by both universities and TVET colleges.
For universities, only 20% of respondents felt career guidance initiatives were “very effective”,
while 30% felt they were “somewhat effective”. At public TVET colleges only 27% of the re-
spondents are of the view that career guidance initiatives at school are effective, with 45%
responding that they are “somewhat effective”. It is however clear from comments received
that there is a feeling that much more needs to be done to improve in this area. Respondent
perceptions are that some school leavers still start tertiary education without clear career plans
and hence the need for more career guidance at high school level. Admittedly, there are some
institutions that recognise that a lot of effort has already gone into career guidance and they
can now confidently say this is now very effective. However, when one looks at the totality of
responses the dominant theme is that this as an area of concern requiring more intervention.
At private TVET colleges, only 20% felt career guidance initiatives were effective, with 30% of
respondents indicating that they were “somewhat effective”.
4.2.4.2. Matric output rates with Mathematics Higher Grade
Universities and TVET colleges are unanimous in their view that pure Mathematics pass rates
at Matric level is poor. This poor pass rate in Mathematics tends to limit the pool of qualifying
students for Fasset-related programs. For those who enrol for study programs that require a
strong Mathematics background, which they do not possess, the probability of dropping out at
tertiary level is enhanced. In their comments respondents also blamed poor teaching skills at
high schools and in particular the tendency by teachers to encourage learners to opt for Math-
ematics Literacy. Only 30% of university respondents felt interventions to improve Matric out-
put with Mathematics at Higher Grade level were “somehow effective”, and none indicated
that they were “effective”. At public TVET colleges, only 4, 5% of respondents indicated that
interventions on Matric output rates with pure Mathematics at a Higher Grade level were “very
effective”, with 18% saying they were “somewhat effective”. In comparison, none of the re-
spondents from private TVET colleges indicated strategies on Mathematics output rates at
Higher Grade level were “very effective” while only 30% felt they were “somewhat effective”.

Fasset Sector Survey 2016 FINAL REPORT: 29 September 2017
71
In totality, these responses indicate a lot still needs to be done to improve Mathematics output
rates at high school level.
4.2.4.3. Minimising dropout rate and enhancing output at institutions
Minimising drop-out rates is a challenge for tertiary institutions. Only 18% of respondents at
public TVET Colleges indicated that the strategies were “very effective”, with 59% of the view
that they were “somewhat effective”. For private TVET colleges, 30% were of the view that
strategies were “very effective” while another 30% felt current strategies were “somewhat ef-
fective”. These responses indicate that much more needs to be done especially given the fact
that empirical evidence still suggests that dropout rates are unsustainably high at tertiary in-
stitutions, especially at universities. Interestingly, responses on this question were similar for
universities and TVET Colleges. Only 30% respondents from universities felt the strategies for
minimising drop-out rates were “very effective” at their institutions, with 30% indicating they
were “somewhat effective”. However, some universities had a more positive response on this
question. There is no doubt that a lot is being done to improve student throughput rates alt-
hough the results are yet to corroborate these efforts.
4.2.4.4. Available financial support to learners/students
Given the toxic atmosphere in which this survey was conducted with the “#FeesMustFall”
campaign in full swing, it is hardly surprising that most respondents raised issues relating to
the financial challenges affecting learners. Only 10% of respondents from universities indi-
cated that available financial support was “very effective”, with 20% responding that it was
“somehow effective”. The response from public TVET colleges was more positive with 40, 9%
indicating that it was “very effective” and 36% responding that it was “somewhat effective”.
These responses indicate that while there is recognition of the South African government ef-
forts at providing financial support to tertiary institutions, more still needs to be done. Concerns
were raised regarding the inadequacy of funding to cover student needs such as accommo-
dation and transport. Private TVET colleges were however more negative in their response
with only 10% of respondents indicating the initiatives were “very effective” whereas 20% re-
sponded that they were “somehow effective”. To a large extent, respondent perceptions reflect
the success of government efforts at improving student financial access to financial resources
through NSFAS funding.
4.2.4.5. Access to learnership (workplace learning) opportunities
Access to workplace learning opportunities is a challenge for tertiary institutions at all levels.
Faced with an economy showing a lacklustre growth, it is hardly surprising that fewer organi-
sations have an appetite to accommodate students for workplace learning opportunities. This
is reflected in only 41% of public TVET college respondents indicating that access to learner-
ship opportunities were “very effective”. For private TVET colleges, only 20% were of the view
that access to learnership opportunities was “very effective”. For universities, only 20% of re-
spondents view the initiative as being “very effective” and 20% as being “somewhat effective”.
What seems evident though is that learners from public TVET colleges have a much better
chance at workplace learning opportunities than their counterparts at universities.

Fasset Sector Survey 2016 FINAL REPORT: 29 September 2017
72
4.2.4.6. Placement of graduates in the labour market
Graduate placement is a challenge confronting universities and TVET colleges alike. At public
TVET colleges, 27, 27% of the respondents felt departmental strategies were “very effective”
whereas 45, 45% thought they were “somewhat effective”. None of the respondents from uni-
versities indicated that initiatives were “very effective”, while 40% were of the view that they
were “somewhat effective”. Responses from private TVET colleges are even more negative
with none indicating strategies are “very effective” while 40% indicated they were “somewhat
effective”. These results may be confirming what is generally known about the poor rate of
graduate absorption by the economy. However, it has to be noted that most respondents do
not have a tracking system on their graduates and it is therefore difficult for them to know who
of them have been employed at any specific time. Across the spectrum, respondents however
acknowledge the difficulties faced in the labour market by some of their graduates. Graduate
absorption in the labour market is influenced by a number of factors including the fit between
their qualifications and the rate of growth of the economy. Both factors may be contributing to
the low placement of graduates in the local labour market.
4.2.5. Future plans
4.2.5.1. TVET colleges
Responses from public TVET colleges regarding their future plans in terms of courses/qualifi-
cations they desire to offer reveals an interesting pattern as depicted in the graph below. Evi-
dently, a high proportion of respondents would like to have course offerings designed to up-
skill lecturing staff. In a way, this may be confirmation of concerns regarding the existing ca-
pacity of TVET college lecturers. There is also a desire to have programs that grow skills in
the area of learner support services, a factor that also resonates with current needs at tertiary
institutions. In comparison, in private TVET colleges the strongest desire is to add new QCTO
occupation qualifications, improve learner support services as well as improving academic
infrastructure.

Fasset Sector Survey 2016 FINAL REPORT: 29 September 2017
73
Figure 4-1: Public TVET College plans on qualifications and courses to be offered
Source: Sector Survey (2016)
As shown in Figure 4-1 the findings demonstrate that public TVET colleges consider capacity
building programs for lecturing staff to be a critical strategic issue. Also important are issues
of learner support services, partnerships with other institutions of higher learning and devel-
opment of college infrastructure.
In terms of future support strategies of relevance to the sector, respondents from public TVET
colleges indicated preferences depicted in Figure 4-2.
Figure 4-2: Future Support Strategies for Public TVET colleges
Source: Sector Survey (2016)
Based on the above responses in Figure 4-2, it is again clear that lecturer capacity is an area
of concern at public TVET colleges and will need a specific intervention strategy to address.
13.0%
34.8%
13.0%
13.0%
4.3%
17.4%
4.3%
0.0% 5.0% 10.0% 15.0% 20.0% 25.0% 30.0% 35.0% 40.0%
Accounting technician
Up skilling of lecturers and staff
Improve academic infrastructure
Partnerships with other learning institutions
Provision of learnerships and apprenticeships
Learner support services
Add new QCTO occupation qualifications
Percentage(%)
16.7%
23.3%
16.7%
13.3%
6.7%
13.3%
10.0%
0.0% 5.0% 10.0% 15.0% 20.0% 25.0%
Funding
Up skilling of lecturers and staff
Improve academic infrastructure
Partnerships with other learning institutions
Provision of learnerships and apprenticeships
Aligment of curriculum with industry
Introduction workbased training programmes
Percentage(%)

Fasset Sector Survey 2016 FINAL REPORT: 29 September 2017
74
In terms of current qualifications requiring further development, public TVET colleges indicated
that they would like improvement in Financial Management and Financial Accounting courses.
Private TVET colleges also indicated their need as being in finance related courses as well as
in improving English and Mathematics literacy.
4.2.5.2. Universities
In respect of qualifications they intend to develop, universities indicated the following scenario
shown in Table 4-6
Table 4-6: University Qualification Plans
Qualification % response
Post-Graduate Diploma in Tax 3%
BCom Entrepreneur/Accounting/Finance/Economics 17%
Diploma in Accounting & Diploma in Finance Accounting 11%
Post-Graduate Diploma in Accounting 8%
PhD Cost and Management Accounting 6%
Masters in Internal Auditing & Management Accounting 6%
Advanced Diploma in Cost Management and Accounting 8%
Source: Sector Survey (2016)
From the responses depicted in Table 4-6 indications are that universities will be putting a lot
of their energy into developing Bachelor of Commerce qualifications. Diplomas in Accounting
and Finance are also in focus as well as Post-Graduate Diplomas in Accounting. Only 6% of
respondents are planning to offer PhD programs in Accounting, a relatively low response rate
given challenges faced with recruiting and retaining qualified lecturers discussed in this SS. It
is important that development of qualifications be guided by intentions to align with industry
demand and the requirements of best practice.
In terms of intervention strategies, universities respondent perceptions are indicated in Table
4-7:
Table 4-7: University Respondent Intervention Strategies
Intervention Strategy Response %
Funding 19%
Up- skilling of lecturers and staff 19%
Improve academic infrastructure 13%
Partnerships with other learning institutions 13%
Provision of learnerships and apprenticeships 13%
Learner support services 6%
Alignment of curriculum with industry 13%
Introduction of work-based training programs 6%
Source: Sector Survey (2016)

Fasset Sector Survey 2016 FINAL REPORT: 29 September 2017
75
As one would expect given the current “#FeesMustFall” environment, issues of funding have
shown a significant presence with 19% of respondents indicating this as a key focus area.
Also significant for universities is the issue of lecturer development, which reflects current
concerns with regard to the shortage of suitably qualified lecturers for universities. As indicated
in this report, most respondents expressed the view that most lecturers lack soft skills to ena-
ble them to do their jobs effectively. Lecturers need a special intervention to equip them with
competencies in areas such as negotiation and presentation skills. From the table above, other
issues of concern for universities include those of improving academic infrastructure, partner-
ships with other learning institutions, access to workplace learning opportunities and alignment
of the curriculum with industry requirements. These interventions will all be critical in ensuring
that the learning environment is appropriate for effective learning to take place, while also
enhancing alignment between graduate skills and employer requirements. These are critical
issues in addressing not only university graduate throughput but also in tackling the challenge
of graduate unemployment.
4.2.6. Growth expectations
A review of growth expectations indicates that 50% of respondents from universities indicated
they anticipate growth in demand for their Fasset-related programs, with 25% of them fore-
casting growth rates between 21-25%. Significantly, 25% of this growth is expected to be in
Diplomas in Accounting/Financial Accounting and 16% in Auditing. In terms of anticipated in-
crease in resources and infrastructure, 41% of university respondents had a positive response.
They saw growth being the result of both demand from students and the economy. There
seems to be a shift in focus from degree programs to Diplomas, perhaps reflecting market
demand from in-service personnel. 51% of public TVET college respondents are forecasting
a growth of more than 18% for Fasset-related programs. As with universities, the highest de-
mand is expected to be in financial accounting-related programs. 50% of respondents from
private TVET colleges also anticipate increased demand for Fasset related programs. For
these institutions, the highest demand area is expected to be in bookkeeping.
4.2.7. Partnerships and linkages
The majority of respondents from universities indicated that they have partnerships with
SAICA, the Bank SETA and Fasset. These partnerships are largely for accreditation purposes,
training support and placement of learners for experiential learning purposes. There is also a
number indicating partnerships with banks that are funding research chairs and assisting with
placement of learners for workplace learning purposes. Other partnerships mentioned include
professional institutes such as SAIPA and CIMA.
In respect of TVET colleges, professional institutions such as Chartered Institute of Bookkeep-
ers (CIB) and ACCA are cited as key partners in respect of accreditation and support with
examinations. Others mentioned include SETAs such as ETDP, MICT and Bank SETA. Very
little is mentioned in relation to Fasset partnerships. In the words of one of the respondents
“We work well with other SETAs, it’s with Fasset where we have struggled to get funding”.

Fasset Sector Survey 2016 FINAL REPORT: 29 September 2017
76
4.2.8. Fasset-related research efforts
A review of respondent comments at both university and TVET colleges indicates that re-
search efforts are not at the level where they should be. Most of the research referred to is
focusing on academic outputs at Masters and PhD level. From the responses, it is also appar-
ent that research is currently considered an underfunded mandate with respondents indicating
that they would like more funding and guidance by the sector on areas to focus on. Current
funders include some banks for Research Chairs and the National Research Fund focusing
on specific projects. Respondents indicated that they would like more funding for research,
guidance from Fasset on research areas that are of sectorial interest as well as training on
how to handle research. The need for research capacity building through training features
more prominently at TVET college level. Other issues mentioned include the need for assis-
tance from Fasset in publicising research outputs and having road shows to publicise available
funding windows for research.
4.2.9. Fasset-funded projects
Half (50%) of the respondents from universities indicated that they currently receive funding
from Fasset. To a large extent, this funding focuses on improving learner performance in ac-
counting programs and targets learners from previously disadvantaged population groups.
Funding covers areas such as bridging programs for learners, cost of additional lecturers,
tuition material and career guidance. University survey respondents indicated that these inter-
ventions have had a positive impact on student performance and work-readiness. One West-
ern Cape based university that received Fasset funding for a bridging program specifically
targeting Black African students reported that the intervention was very effective on student
pass rates. Another university in the same province indicated that it had benefitted from a
Fasset funded work-readiness project which also had a very positive impact. Based on com-
ments received, it can be concluded that these targeted interventions from Fasset are having
a positive impact on improving student pass rates especially for learners coming from previ-
ously disadvantaged communities who may be battling in their studies because of poor lan-
guage and Mathematics competency levels. However, it has been noted that universities with
limited financial resources such as those in outlying areas of the Eastern Cape and KwaZulu-
Natal do not seem to be benefiting from any current funding from Fasset. Without doubt, tar-
geted Fasset interventions at these universities would also have a very positive impact on
learner throughput and work-readiness.
None of the survey respondents from TVET institutions (both public and private) are benefitting
from Fasset project funding. A single respondent indicated that they did benefit 2 (two) years
ago on a program that sought to improve learner literacy levels in English and Mathematics.
Based on responses from survey participants at TVET colleges, there is no doubt that such
funding for bridging programs is still a necessity especially in the context of poor passes by
students at high school. Such an intervention may positively impact on student throughput and
lower the level of dropouts.
4.2.10. Scarce Skills Training Perspective
In their response to the question on what they consider to be scarce skills, 25% of respondents
from universities indicated that the positions of Lecturers and Chartered Accountants were

Fasset Sector Survey 2016 FINAL REPORT: 29 September 2017
77
scarce. This was followed by positions of Financial Manager, Management Accountant and
Chief Financial Officer, all of which were considered scarce skills by 8,3% of the respondents.
University respondents also identified the positions of Internal Auditors, Management Ac-
countants, Tax Practitioners and Cost Accountants as being scarce. Interestingly, the same
types of skills are broadly identified by both public and private TVET colleges as being scarce
skills. The additional scarce skills identified by TVET colleges include those of Bookkeeping,
Financial Analyst, Auditor and Tax Practitioner. Table 4-8 and Table 4-9 are a summary of
skills identified by university and public TVET college respondents as being scarce:
Table 4-8: Scarce Skills According to Universities
Scarce Skill Response %
Lecturer in Accounting 25,0%
Financial Manager 8,3%
Chartered Accountant 25,0%
Managerial Accountant 8,3%
Chief Financial Officer 8,3%
Source: Sector Survey (2016)
From Table 4-9 below, it is evident that a significant number of respondents from public TVET
colleges view Financial Manager skills as being scarce. This is followed by positions such as
Accountant, Chartered Accountant, Auditor and Actuary. Except for positions of Bookkeepers
and Actuaries that are not mentioned by universities, this list of scarce skills compares favour-
ably with what university respondents perceived to be scarce skills.
Table 4-9: Scarce Skills According to Public TVET colleges
Scarce Skill Response %
Bookkeepers 5,6%
Financial Manager 27,8%
Financial Analyst 5,6%
Accountant 16,7%
Chartered Accountant 11,1%
Actuary 11,1%
Internal Auditors 5,6%
Tax Practitioner 5,6%
Auditors 11,1%
Source: Sector Survey (2016)
What is also clear (from both Table 4-8 and Table 4-9) is that the dominant theme in the list of
scarce skills relates to accounting skills. It can therefore be surmised that with improved
throughput in accounting graduates the scarce skills identified by both universities and public
TVET colleges will to a large extent be ameliorated. Although broadly similar responses were
observed from private TVET colleges, respondents from these institutions also included Econ-
omists and Financial Analysts as also being scarce skills.

Fasset Sector Survey 2016 FINAL REPORT: 29 September 2017
78
Equally important in skills planning is the need to identify the reasons for the scarce skills. 18,
5% of respondents from public TVET colleges attribute scarce skills to lack of interest in or
lower pass marks in Mathematics. Interestingly, 30% of respondents in private TVET colleges
attribute scarce skills to lack of adequate training. In a way, these two reasons are related as
poor Mathematics results limits the number of learners qualified to go into Fasset related pro-
grams, a fact which then affects the throughput pipeline. University respondents in Table 4-8
however cite slightly different reasons for the scarce skills with 16,7% attributing this to lack of
management skills, lack of practical experience and lack of business communication skills. All
these factors however point to the problems in the education system at both high school and
tertiary level. The bottom line is that a significant proportion of learners are not well prepared
for the world of work.
4.2.11. Critical skills gaps-Training provider perspective
The problem of scarce skills discussed above is exacerbated by critical skills gaps in some
occupations. As highlighted in Table 4-10, among critical skills gaps identified by university
respondents are basic management skills and those related to lack of soft skills training such
as communication and negotiation. These skill gaps point to the inadequacy of training at
tertiary institutions, the outcome of which is graduates that are ill-prepared for the demands of
the workplace. A comparison of critical skill gaps identified by universities with those identified
by private TVET colleges reveals some interesting insights. For example, while lack of infor-
mation technology skills does not feature as a skills gap for universities 40% of private TVET
college respondents deem this to be a skill gap.
Respondents from both institutions however agree that lack of soft skills is currently a skills
gap for graduates. This is also corroborated by respondents from public TVET colleges. Criti-
cal skill areas identified by university survey respondents are indicated in Table 4-10 below.
Table 4-10: Critical Skills Gaps According to Universities
Critical Skills Gap Response %
Leadership/ Conflict Management Skills 3%
Negotiation Skills 8%
Lack of Practical Experience 14%
Lack of Soft Skills 6%
Source: Sector Survey (2016)
Critical skills identified by private TVET college respondents are as depicted in Table 4-11.
Table 4-11: Critical Skills Gaps According to Private TVET colleges
Critical Skills Gap Response %
Business Communication Skills 14,3%
Problem Solving Skills 14,3%
Lack of Software skills (Pastel, SAP, Caseware) 35,7%
Advanced Computer skills 28,6%
Lack of Soft Skills 7,1%
Source: Sector Survey (2016)

Fasset Sector Survey 2016 FINAL REPORT: 29 September 2017
79
Table 4-11 indicates that, unlike both universities and public TVET colleges, private TVET
colleges regard lack of computer/software skills as the most prominent critical skills gap. As
indicated above, all institutions are however in agreement on soft skills as being deficient.
Lack of soft skills negatively affects employee effectiveness in the workplace and it is therefore
important that an appropriate skills program be developed to ensure capacity building in this
area. This intervention must also include university lecturers who have also been identified as
lacking competency in this area.
Although the reasons for the skill gaps vary, there are some commonalities emerging across
the different tertiary institutions. As indicated in the tables below, lack of soft skills training,
problems of skills mismatch and lack of adequate training are some of the reasons identified
by survey respondents. Without doubt, problems of under-qualified lecturers, outdated learn-
ing material particularly at public colleges and poor learner mathematical literacy levels all
contribute to the skills gaps identified by the respondents. Table 4-12 summarises the reasons
identified by university respondents on reasons for the skills gaps:
Table 4-12: Reasons for Critical Skill Gaps According to Universities
Reasons for Critical Skill Gap Response %
Lack of Leadership/Management training 3%
Software programs expensive 3%
No adequate training 14%
Lack of soft skills in training 6%
Skills mismatch 3%
Source: Sector Survey (2016)
As indicated in Table 4-12, the majority of universities attribute lack of critical skills to inade-
quate training. By implication, lack of critical skills can be effectively addressed if training pro-
grams are property structured to meet the needs of the employment market. A key aspect of
this alignment is ensuring that learning institutions are proactive in their approach to curriculum
development in order to keep pace with the ever-changing requirements of the employers.
This approach also requires that learning material be updated regularly to capture changing
requirements. As noted in this SS, this is currently a problematic area especially for public
TVET colleges as most learning material currently used is outdated.
Table 4-13 indicates that a slightly different picture emerges when one analyses the reasons
given by public TVET colleges.
Table 4-13: Reasons for Critical Skills Gaps According to Public TVET Colleges Re-
spondents
Reason for Critical Skills Gap Response %
Lack of Leadership/Management training 13,3%
Software programs expensive 6,7%
No adequate training 53,3%
Lack of soft skills in training 6,7%

Fasset Sector Survey 2016 FINAL REPORT: 29 September 2017
80
Reason for Critical Skills Gap Response %
Skills mismatch 6,7%
Lack of Work- Integrated Learning programs 6,7%
Inadequate academic infrastructure 6,7%
Source: Sector Survey (2016)
In line with universities, public TVET colleges attribute lack of critical skills largely to inade-
quate training. As indicated before, the solution will require that training programs be devel-
oped in a proactive manner that ensures graduates are well prepared for the needs of the
workplace. For public TVET colleges in particular, this will also require that learning material
be updated regularly to ensure alignment with the regulatory environment and the needs of
the workplace.
In terms of future skills demand, both universities and colleges seem to agree that Chartered
Accountants will continue to be in demand. Table 4-14 is a summary of public college respond-
ent perceptions on future skills demand:
Table 4-14: Future Skills Demand According to Public TVET colleges
Future Skills Demand Area Response %
Bookkeeping 38%
Financial Accounting 23%
Taxation 15%
Payroll Administrator 8%
Financial Management 8%
Officer Administration 8%
Source: Sector Survey (2016)
Table 4-14 indicates that most university respondents are of the view that Bookkeeping will
be the skill in most demand in future. Financial accounting and taxation are also forecast to
be highly in demand. If training programs are to be sensitive to the needs of the market place,
this skills demand forecast has implications on areas to focus on at skills development institu-
tion level.
For university survey respondents, positions that will be in demand include Chartered Ac-
countants, Chief Financial Officers, Auditors and Finance Managers.
4.2.11.1. Critical skills gaps specific to occupations
Although survey respondents have not been specific in terms of critical skills gaps for most
occupations, they did not shy away from evaluating their own lecturing staff that they deemed
lacking in terms of presentation and soft skills. They also indicated that the majority of junior
lecturers lack practical work experience, a fact that tends to limit their ability to transfer practi-
cal work skills to learners. It was indicated that the majority of lecturers, particularly at college
level, were recruited straight from universities and hence this skills gap. The situation is much
better at universities where there are some highly experienced personnel who have made the

Fasset Sector Survey 2016 FINAL REPORT: 29 September 2017
81
transition from corporate to academic and thus bring practical experience to their work envi-
ronment.
4.2.11.2. Critical skills gaps spanning various occupations
Respondents tended to be too general in terms of identifying skill gaps spanning various oc-
cupations. One can understand this since most of them do not work with the various skills
categories they were expected to evaluate. It is however clear that most occupations tend to
have soft skill gaps. In addition, some respondents indicated lack of leadership and manage-
ment skills as being a gap. Table 4-15 shows perceptions on skills gaps by universities.
Table 4-15: Occupational Skills Gaps According to Universities
Occupational Skill Gap Response %
Leadership / Conflict management Skills 3%
Negotiation Skills 8%
Lack of Practical experience 14%
Lack of Soft Skills 6%
Source: Sector Survey (2016)
As discussed in the earlier part of this report, occupational skills gaps spanning occupations
largely revolve around lack of soft skills competency. Indeed, this is the prevailing view of
survey respondents from institutions of higher learning. Universities and TVET colleges are
also in agreement in that lack of practical experience is an area of concern for graduates and
negatively affects graduate employment.
4.2.12. Anticipated sector challenges
Survey respondents have indicated that they anticipated the following challenges to face the
sector over the coming years:
continuing demand for highly skilled professionals to support a growing service econ-
omy;
an angry youth that will be hard to please;
the need to adapt to a changing world of work and technology;
high unemployment rates;
student funding issues particularly at university level;
regulatory challenges such as how the government will regulate the SETAs in the fu-
ture; and
the political environment which can have its own dynamics.
There is no doubt that all these factors will impact on the sector albeit in different ways. The
sector is operating in a dynamic environment where change is the only constant. There will
therefore be need to adapt to the external forces pushing for change and for the sector to be
nimble enough to change with the times. In a way, the challenges the sector will face are a
reflection of those the country will face and they are many and varied. While the sector can do
something about those factors it can control such as adapting to technological environmental

Fasset Sector Survey 2016 FINAL REPORT: 29 September 2017
82
changes, not much can be done about issues that are societal such as dealing with a generally
angry youth who are faced with the reality of high unemployment rates and lacklustre eco-
nomic growth.
4.2.13. Productivity and work performance
In order to improve productivity in the workplace, 27% of respondents from public TVET col-
leges consider training to be critical. 13% of respondents from public institutions also consider
development of computer and software skills as important. In addition to these intervention
strategies, respondents from private colleges also highlight the importance of work readiness
programs. Universities emphasized the need for training delivery and use of information tech-
nology. Based on this SSs results, it is therefore plausible to conclude that to improve produc-
tivity in the sector a much more agile workforce is required. Such a workforce can only result
if training is effective and the sector maximizes on available technology.
4.2.14. Fasset initiatives in the HEI sector
Fasset joined the University of Cape Town’s (UCT) accounting department as a funding part-
ner on two projects, namely:
Learn Accounting, which is a 4 (four) year, R17 million, project which aims to assist
students whose first language is not English. This is achieved through the production
of videos which explain basic accounting concepts in numerous non-English lan-
guages, and then re-plays the same video in English so that the student gets used to
technical accounting terms that will be used in everyday lectures as well as textbooks.
This tool is believed to have significantly helped students to develop early understand-
ing of important accounting concepts, thereby avoiding a lag in learning that often re-
sults in an accumulated and overwhelming work-load which in turn can lead to sub-
optimum performance and even dropout; and
the iKusasa Lethu project started in 2012 and is an ongoing joint partnership between
UCT, SAICA and Fasset, the aim of which is to provide Black African students from
previously disadvantaged backgrounds on the Chartered Accounting program with
regular tutoring in their second and third years. The annual cost of the project is ap-
proximately R1 million, and has successfully led to increased throughput rates of this
population group.
Fasset also joined the University of the Western Cape (UWC) as a funding partner on two
projects, namely:
uKhwazi which is an R8 million project that aims to provide a total of 150 (one hundred
and fifty) graduates who have not found employment with comprehensive work-readi-
ness training. Graduates can choose to enrol on the 3 (three) month full-time program,
or the one-year part-time program. Modules of the program include interviewing skills,
business simulations which increase emotional intelligence, project management, eth-
ics, professional conduct, and technical aspects such as Pastel Accounting training as
well as addressing any academic gaps. The first phase was completed in 2016, with
feedback from both university staff and the graduates being very positive. Graduates
were observed to have increased levels of confidence and self-belief; and

Fasset Sector Survey 2016 FINAL REPORT: 29 September 2017
83
Pucula which was a R28 million project which aimed to increase throughput rates in
challenging subjects. It ran concurrently to normal studies, and also included soft skills
training such as time management, stress management, the development of critical
thinking skills as well as English. University staff interviewed deemed the project a
success as they observed that those who had underwent the training had improved
academic performance.
4.2.15. Conclusion
This section of the SS has consolidated and analysed survey respondent perceptions on
universities and TVET colleges. While the nature of challenges faced by institutions is varied,
there are commonalities that have emerged from the analysis.
Based on the results of the analysis, the following conclusions can be made:
despite all efforts by the government and the SETA, financial constraints continue to
be a challenge for institutions of higher learning, students and training providers;
although government has invested significant resources on education infrastructure
over the past 10 (ten) years, the exponential increase in student intake has to a large
extent negated these efforts resulting in infrastructure challenges continuing to exist
especially for universities;
student throughput levels continue to be lower than expected as a result of learner
dropouts;
currently low Matric pass levels with Mathematics are a challenge for universities and
TVET colleges as they directly determine the pool of learners available for recruitment
into Fasset-related training programs;
recruiting and retaining qualified lecturers is a challenge for institutions of higher learn-
ing;
Chartered Accountants, Financial Managers, Bookkeepers and Auditors are some of
the skills still considered critical; and
across the spectrum, respondents agree there is currently a competency gap on lead-
ership, management and soft skills especially at professional levels.

Fasset Sector Survey 2016 FINAL REPORT: 29 September 2017
84
4.3 Survey of Workplace Training Providers
4.3.1. Introduction
This section of the SS focuses primarily on understanding WTPs in the sector. At a high level,
the following elements will be discussed:
nature of WTPs in terms of size and scope;
effectiveness of workplace training initiatives; and
impact of Fasset training initiatives.
4.3.2. Profile of Workplace Training Providers
A total of 108 (one hundred and eight) WTPs were interviewed for this SS. The job titles of
respondents were varied but included Human Resource Managers, Accountants, Partners,
Directors and Skills Development Facilitators (SDFs). Learnerships facilitated by respondent
WTPs were also varied with the majority offering Chartered Accountant, SAICA and SAIPA
learnerships. More than 80% of respondent WTPs have been involved with training of learners
for more than 10 (ten) years. As indicated in the table below, 62% of respondents were from
the Accounting, Bookkeeping and Auditing sub-sector. Table 4-16 below shows the number
of WTPs that were surveyed, according to sub-sector.
Table 4-16: Profile of WTPs Surveyed by Subsector
Source: Sector Survey (2016)
Subsector Total surveyed per subsector
Percentage Number
Investment Entities & Trusts and Company Secretary
Services 1,9% 1
Stockbroking and Financial Markets 2,8% 1
Development Organisations 0,0% 2
Accounting, Bookkeeping & Auditing Activities 87,0% 67
Activities Auxiliary to Financial Intermediation 0,0% 22
Business & Management Consulting Services 1,9% 0
SARS and Government Departments 0,0% 3
No response 6,5% 7
Total 100% 108

Fasset Sector Survey 2016 FINAL REPORT: 29 September 2017
-85-
4.3.3. Size of Workplace Training Providers
Table 4-17 shows the size of the WTPs surveyed.
Table 4-17: Profile of Workplace Training Providers Surveyed by Sub-sector
Size
Number Percentage
Large 4 3,70%
Medium 10 9,30%
Small 94 87,00%
Total 108 100%
Source: Sector Survey (2016)
4.3.4. Motivation for the provision of learnerships
As part of the survey questionnaire, WTP were asked to indicate which factors motivated them
to provide learnerships. The following table summarises their responses which are further an-
alysed in Figure 4-3:
Table 4-18: Motivation for Provision of Learnerships
What motivates your organisation to take part in the training of learners through learn-
erships? (You may choose more than one option.)
Response
Percent
Response Count
Financial reasons (getting access to grants) 0,0% 0
Development of skills of employees 60,0% 3
Providing training opportunities to the unemployed 40,0% 2
Learners are an inexpensive form of labour 0,0% 0
Employing Black African learners improves the organi-
sation's BEE scorecard performance
0,0% 0
No response
103
Total 100% 108
Source: Sector Survey (2016)

Fasset Sector Survey 2016 FINAL REPORT: 29 September 2017
-86-
Figure 4-3: Motivation for Provision of Learnerships
Source: Sector Survey (2016)
The Figure 4-3 above indicates that 60% of respondents provided learnerships because they
needed to develop employee skills whereas 40% were motivated by the need to provide train-
ing opportunities to the unemployed.
4.3.5. Effectiveness of workplace initiatives
4.3.5.1. Career guidance
The majority of survey respondents were positive on the effectiveness of career guidance
initiatives. With 31% responding that the initiatives were “effective” and 40% viewing them as
“somewhat effective”, it is safe to conclude that current efforts are indeed bearing some fruits.
Only 13% of respondents thought the initiatives were “ineffective”, indicating that although
there has been positive impact by current initiatives there is room for much more to be done
on career guidance. It is significant to note that effective career guidance could have a positive
impact on issues such as student dropout and pass rates.
4.3.5.2. Output rates
Perceptions on output rates are also showing a measure of positivity with 48% of respondents
indicating they are “somewhat effective”. However, 16% of respondents think initiatives on
dropout rates are “not effective”. Again, these responses do indicate that there are some pos-
itive efforts being made although there is still scope for improvement. Failure to effectively
manage output rates affects the cost of education provision as some learners incur costs and
yet do not complete their studies.
60%
40%
Development of skills ofemployees
Providing trainingopportunities to theunemployed

Fasset Sector Survey 2016 FINAL REPORT: 29 September 2017
-87-
4.3.5.3. Dropout rates
Dropout rates are still a major challenge for the sector. While 33% of survey respondents
indicated that current efforts are “somewhat effective”, a significant 30% of respondents felt
that they were “not effective”. Only 10% of respondents thought current efforts were “very
effective”. The reasons for high dropouts are varied but the majority of respondents attribute
this to the low motivation of learners which results in lack of commitment and also to wrong
career choices. Respondents also indicated that another significant contributor to high dropout
rates is the inability of the workplaces to provide adequate practical experience to learners.
Given the multiplicity of reasons for the high dropout rates, it becomes imperative that a robust
intervention strategy be implemented so that all issues can be tackled. As alluded to in other
sections of this SS, more needs to be done in dealing with the problem of learner dropouts.
Unfortunately, 69% of respondents are currently not involved in any specific strategies to de-
crease dropout rates. Only 13% of respondents are doing so being involved in initiatives such
as in-house job training and career support/motivation/guidance.
4.3.5.4. Available financial support to learners/students
In the context of the “#FeesMustFall” challenges faced by the tertiary education system last
year, it is certainly no surprise that student funding is still viewed by many respondents as a
problematic area. While 47% of respondents were of the view that current efforts at dealing
with available financial support to learners were “somewhat effective”, 21% felt these were
“not effective”. Admittedly, a lot has happened since the demonstrations of last year but there
are still some simmering tensions in this area. Training providers are at the coal - face of some
of these challenges as they interact with learners affected by financial constraints. Their per-
ceptions in this area are therefore significant in evaluating the effectiveness of current inter-
ventions. The fact that only 7% of respondents thought the initiatives were “very effective”, is
telling.
4.3.5.5. Access to learnerships
SS respondents were generally more positive on interventions to promote access to learner-
ships with 40% indicating that they were “somewhat effective” while 35% viewed them as
being “very effective”. Only 10% of respondents thought efforts were “not effective”. While
access is not usually a problem, often the difficulty is finding the right candidates to fill learn-
ership positions.
4.3.5.6. Access to employment
Interestingly, WTP perceptions on access to employment are much more positive than what
was gleaned from TVET colleges and universities. 40% of respondents felt that current efforts
are somewhat effective while 32% thought they were “very effective”. Only 11% of respond-
ents thought efforts were “not effective”. The responses indicate an encouraging element of
positivity on efforts to promote access to employment. The results may be influenced by the

Fasset Sector Survey 2016 FINAL REPORT: 29 September 2017
-88-
proximity of the learning providers to workplaces, a situation which may make it easier to assist
learner’s access to employment opportunities.
4.3.6. Impact of Fasset interventions
Table 4-18 shows a summary of respondent perceptions on the impact of Fasset interventions.
The interventions which were assessed ranges from workplace accreditation, learnership
funding, and skills development of learners, lifelong learning, and grant claims to training
budget.
Table 4-18: Respondent Perceptions on the Impact of Fasset Interventions
Impact Area Very effective Somewhat effective Not at all
Workplace accreditation 39% 40% 22%
Learnership funding 24% 46% 30%
Skills development of learners 36% 47% 16%
Turnover 10% 48% 43%
Lifelong Learning 36% 51% 13%
Productivity 18% 49% 33%
Grant claims 23% 44% 33%
Training budget 20% 45% 35%
Source: Sector Survey (2016)
4.3.6.1. Workplace accreditation
Survey respondents are fairly positive on the impact of Fasset on workplace accreditation as
indicated in Table 4-18. To this extent, 39% of respondents felt that it was “very effective” and
40% felt it was “somehow effective”. However, 22% of respondents felt it was “not effective”
indicating that there is definitely scope for improvement.
4.3.6.2. Learnership funding
Table 4-18 also indicates that respondents were less positive with regard to learnership fund-
ing. While 46% thought it was “somehow effective”, a significant 30% was of the view that it
was “not effective”. Only 24% indicated that it was “fully effective”. It is however worth noting
that the issue of learnership funding cannot be divorced from the general funding issues af-
fecting the tertiary education sector. As such, it would be surprising if respondents were more
positive on this issue when, as highlighted above, they generally acknowledge the existing
problems related to tertiary education funding. While TVET colleges were generally more pos-
itive in terms of current funding arrangements, universities were not. There is therefore a com-
mon theme amongst WTPs regarding the inadequacy of funds for education and training. The
adequacy or otherwise of funding is really reflective of the state of the economy. With lacklus-
tre economic growth, funding issues will continue to be a talking point for WTPs.

Fasset Sector Survey 2016 FINAL REPORT: 29 September 2017
-89-
4.3.6.3. Skills development of learners
Based on respondent perceptions shown in Table 4-18, Fasset’s efforts are having a positive
impact on skills development. While 47% of respondents felt the impact was “somewhat ef-
fective”, a further 36% were of the view that it was “very effective”. With only 16% of respond-
ents indicating that the impact was “not effective”, it is fair to conclude that Fasset’s efforts at
skills development of learners are fairly well regarded by respondents.
4.3.6.4. Turnover
Survey respondents do not view Fasset’s efforts as having a very positive impact on turnover
as shown in Table 4-18. Only 10% felt the efforts were “very effective” while 48% regarded
the impact as being “somewhat effective”. A high percentage of respondents (43%) regarded
the efforts as “not effective”. Evidently, Fasset needs to do more in this area to demonstrate a
positive impact.
4.3.6.5. Lifelong learning
Lifelong learning is one of the key objectives of the training approach envisaged in the SDA.
As such, SETAs are expected to be champions in promoting not just the philosophy of lifelong
learning but its reality in their respective sectors. The majority of survey respondents as indi-
cated in Table 4-18 are of the view that Fasset is doing a fairly good job in this regard with
36% indicating that its impact is “very effective” and 51% as being “somewhat effective”. This
seems a fairly high vote of confidence on the impact of Fasset efforts, especially when one
recognises that only 13% indicated that the impact of interventions was “not effective”.
4.3.6.6. Productivity
Based on survey respondent perceptions, it seems Fasset needs to do much more to convince
training providers that its efforts can positively impact on productivity. This is reflected in Table
4-18 where 33% of respondents indicated that current efforts are “not effective” and 49% in-
dicating they are “somehow effective”. Only 18% were of the view that current efforts at
productivity improvement were “very effective”. These results indicate that a lot still needs to
be done to improve impact on productivity.
4.3.6.7. Grant claims
WTPs do not believe that Fasset is performing well in its handling of grant claims as shown in
Table 4-18. This is evident in 33% of respondents indicating that it is “not effective” whereas
44% think it is “somehow effective”. Only 23% of respondents consider the intervention as
being “very effective”. The results lead one to the conclusion that more needs to be done to
improve impact on grant claims.

Fasset Sector Survey 2016 FINAL REPORT: 29 September 2017
-90-
4.3.6.8. Training budget
Perceptions about Fasset’s impact on training budgets are in a way reflective of views regard-
ing the adequacy or otherwise of finances to meet training requirements. As with other issues
relating to finance, there is a rather negative view of the efforts of Fasset in providing adequate
financial resources for training initiatives. As such, Table 4-18 shows that 35% of the respond-
ents are of the view that current efforts are “not effective” while 45% think they are “somewhat
effective”. With only 20% responding that Fasset’s efforts are “very effective”, it is clear a lot
still needs to be done to positively impact training budgets.
4.3.7. Challenges in the provision of learnerships
4.3.7.1. Finding suitable training programs for learners
The majority of SS respondents indicated that there are limited courses on offer in most topics,
a situation which invariably affects learner performance as some learners complete courses
that are not necessarily suited to their academic ability. Respondents also indicated that most
training programs are guided by professional bodies and are thus credible for learners to pur-
sue.
4.3.7.2. Finding the right facilitators (mentors, coaches, supervisors)
Although availability of quality lecturers is a challenge for universities and to a lesser extent
TVET colleges, the majority of WTPs indicated that this was not a problem for them. They
however alluded to the language barrier challenges experienced. This challenge is a reflection
of the quality of learners in learnerships, most of whom would have had low pass rates in the
language of instruction.
4.3.7.3. Ensuring that learners gain practical experience
While the majority of respondents did not have a challenge in this area, some confirmed that
the training timetable can be problematic. Given the time available for learnerships where most
are completed within 36 (thirty six) months, this is hardly surprising and can be a limiting factor
in affording the learner adequate opportunities for both theoretical and practical training. Re-
spondents also indicated that training opportunities are not easily available.
4.3.7.4. Communication with and support from professional bodies
The majority of SS respondents indicated that SAICA, SAIPA and IRBA are very supportive.
Other respondents however alluded to the challenges of slow response times, a fact that typ-
ically characterises public institutions nationally. Poor response times would naturally be frus-
trating to the end-user and contributes to the quality of education provided by respondents.

Fasset Sector Survey 2016 FINAL REPORT: 29 September 2017
-91-
4.3.7.5. Workplace assessments
The majority of SS respondents indicated that they find workplace deadlines demotivating. In
line with responses from universities and colleges, respondents also indicated that lack of
career awareness is problematic and this becomes apparent is workplace assessments. Also
significant was the recognition by respondents that some students do not finish a learnership,
a fact related to the inadequacy of finances in some cases.
4.3.7.6. Learner motivation
Learner motivation is a challenge affecting both WTPs and tertiary institutions. It has been
recognised that lack of motivation by learners contributes not only to learner dropout rates but
also to their general performance in class. 9, 3% of survey respondents indicated that learners
lack self-commitment, thus confirming that learner motivation is a challenge that has to be
dealt with. Lack of motivation leads to some learners dropping out as soon as they get an
opportunity for employment elsewhere. These dropouts have a direct impact on the cost of
education as some expenses are incurred and yet the target learners do not complete their
training. Learner counselling can perhaps be used as an intervention strategy to improve
learner motivation.
4.3.7.7. Learner work-readiness
As one would expect, 29% of respondents indicated the need for work readiness programs.
This is compounded by poor career counselling of learners at high school level, a fact acknowl-
edged by both universities and TVET colleges as being problematic. 24% of respondents also
indicated that limited work exposure is sometimes related to industry specifications which tend
to limit the number of learners that can be taken to available workplaces. Also noted as chal-
lenges are issues relating to skill mis-matches and learners who are ill-prepared for the work-
place. Unfortunately, skill mis-matches will continue to be a challenge as long as there is poor
career counselling for learners. Poor career counselling leads to poor career choices being
made resulting in not only poorly qualified candidates but graduates with skills that are not
required in the economy. Respondents also expressed concern on the fact that some learners
lack basic life skills and this affects their readiness for the workplace.
4.3.7.8. Learner financial constraints
Learner financial constraints are a challenge acknowledged by training providers across all
tertiary institutions. 23% of respondents indicated this challenge manifests in learners failing
to attend classes as a result of lack of funds for needs like transport. As learners fail to attend
lessons they miss out on valuable tuition, resulting in poor pass marks. Lack of financial re-
sources also means learners cannot take advantage of available technological gadgets that
would otherwise make their academic life easier. On the other hand, some learners make
themselves difficult to employ because of the unrealistic salaries they demand when they get
to the market place. This behaviour is unfortunately related to poor career counselling too.
Figure 4-4 summarises respondent perceptions on learner financial constraints.

Fasset Sector Survey 2016 FINAL REPORT: 29 September 2017
-92-
Figure 4-4: Learner Financial Constraints
Source: Sector Survey (2016)
As indicated in Figure 5.4, 43% of respondents believe learners are facing financial constraints
while 29% do not think financial constraints are an issue. These perceptions are broadly in
line with those observed from universities and to a lesser extent TVET colleges.
4.3.7.9. Contracts and other administration issues
Respondents were generally positive on this issue. The few that responded indicated that
there are challenges when there are frequent changes to procedures and methods. This is an
understandable concern as some providers lack administrative capacity to be adjusting pro-
cedures frequently in order to meet compliance requirements. Related to this is the concern
that contracts and administrative issues are time consuming.
4.3.7.10. Diminishing education standards
Concerns on quality of education are topical across the entire education value chain. WTP
respondents are certainly no exception to this. Of the respondents surveyed, 79% expressed
the opinion that the pool of quality candidates is reducing as a result of poor education stand-
ards. Some indicated, as university and TVET college respondents did, that Mathematics ed-
ucation is lacking. This unfortunately, is affecting the ability of learners to cope with Fasset-
related courses at tertiary institutions. Figure 4-5 summarizes respondent perceptions on ed-
ucation standards.
14%
43%
14%
29%
0%
5%
10%
15%
20%
25%
30%
35%
40%
45%
50%
Learner support familymembers financially
Limited finances Tuition and other socio-economic welfare needs
Not an issue
Pe
rce
nta
ges(
%)

Fasset Sector Survey 2016 FINAL REPORT: 29 September 2017
-93-
Figure 4-5: Respondent Perceptions on Education Standards
Source: Sector Survey (2016)
4.3.7.11. Sourcing employable candidates
94% of SS respondents indicated that it was difficult to find suitably qualified candidates for
available learnerships. Indeed, this would be hardly surprising given the challenges experi-
enced with higher education where there is a limited pool of learners who do well in Mathe-
matics. As a result, there must be a lot of competition for the few who qualify. In order to
improve the candidate pipeline, there is a need to transform the education sector and improve
not just the pass rate at high school but Mathematics especially. Together with providing ca-
reer counselling early in life, a robust education system will ameliorate this shortage of traina-
ble applicants. This is particularly important given the high levels of unemployment in the
country, especially among the youth. Respondents also highlighted the challenge of mismatch
between the salaries students are demanding and what employers are prepared to pay. In
order to manage this problem, graduate career counselling is an absolute necessity.
4.3.8. Factors affecting learner productivity
Learner productivity is a result of a multiplicity of factors. Based on survey respondent percep-
tions, issues that have the greatest impact on learner productivity include the individual’s work
ethic, the personality and emotional intelligence of the learner, their socio-economic circum-
stances, lack of understanding of delegated tasks, time allotted for studying and in-house
training provided. Table 4-19 indicates some of the survey responses on issues considered
significant by training providers.
79%
7%
14%
0%
10%
20%
30%
40%
50%
60%
70%
80%
90%
Pool of quality applicants isreducing due to poor education
standards
Low percentage pass-rate forMatric impacting on studentperfomance in tertiary and
workplace
Maths and bookkeepingeducation lacking
Pe
rce
nta
ges(
%)

Fasset Sector Survey 2016 FINAL REPORT: 29 September 2017
-94-
Table 4-19: Factors Affecting Learner Productivity
Factor Response %
Personality & emotional intelligence of learners 14%
Work ethic, managing work load, quality of work, pace of work
(how fast and correct they work) 23%
Level of education/ qualification standard/basic education 7%
Socio economic issues (family problems/ personal circum-
stances) 11%
Lack of understanding in delegated task or deliverables 11%
We do not employ students any longer. 2%
Being on the phone or internet most of the time 5%
Internet accessibility 2%
Time allocated to studying 7%
Financial challenges 5%
In-house training (the availability of supervisors to provide ef-
fective coaching) 7%
Mentorship 2%
Proximity to the work space/ affects pregnant female learners 2%
Source: Sector Survey (2016)
As revealed in Table 4-19, respondents clearly indicated the importance of work ethic and
individual personality in respect of productivity. It therefore follows that if learner productivity
is to be improved upon learner motivation must be the focus of individual development effort.
With a good intervention strategy, learner motivation and attitudinal disposition can be posi-
tively impacted resulting in improved learner productivity.
4.3.9. Learnership costs
Respondents did not provide detailed responses on questions relating to the cost of learner-
ships. However, some insights can be gleaned on some of the responses relating to percep-
tions on the adequacy of funding and the fairness of grant offered by Fasset. In terms of the
most common learnership programs, survey respondents indicated that the Chartered Ac-
countant program was the most popular, followed by SAIPA and then SAICA as indicated in
the table below. Of the programs offered, 42% are for duration of 36 (thirty six) months. This
is significant from a costing point of view. Respondents were generally positive on the fairness
of the grant offered by Fasset, with 34, 3% indicating that they perceived it as being fair and
20, 4% saying it is not fair. In terms of the adequacy of finances, as indicated in the Table 4-
20, 5, 7% of respondents indicated that money was not enough to meet learner needs. Fur-
thermore, 7, 5% expressed the view that grant money should cover all other population groups
and not just Black African learners.

Fasset Sector Survey 2016 FINAL REPORT: 29 September 2017
-95-
Table 4-20: Distribution of Fasset-Related Learnership Programs
Name of Learnership Response % Responses
The Hedge Fund Academy Learnership 2% 1
Tshamano 2% 1
Triumph Maluleke 2% 1
Marvellous Moyo 2% 1
Commercial & Financial Accounting: Public Practice 2% 1
SIVIWE MOYAKE 2% 1
CA(SA) Training Program 2% 1
Financial Accountant in Practice: 01/Q010008/00/480/7 2% 2
Commercial & Financial Accounting: Public Practice 2% 2
Accounting Technician 2% 3
FASSET 3% 5
SAICA 5% 6
Post graduate diploma: professional accountant in practice (SAIPA)
8% 7
SAIPA 21% 14
Chartered Accountant Learnership 29% 20
Total 100% 66
Source: Sector Survey (2016)
As shown in Table 4-20 it is evident that the Chartered Accountant and SAIPA Learnerships
are the most popular in the sector. It is worth noting that this distribution is in line with scarce
skills identified for the sector which indicate demand largely centred on Chartered Accountant
and Financial Accountant skills.
Table 4-21 summarises respondent perceptions on the adequacy of grants provided by Fas-
set.
Table 4-21: Perceptions on Adequacy of Grants
Respondent Perception Response %
Helps cover workstation costs. Computers etc. 6%
Organisation does not receive grant at all 18%
Yes, but grant money should cover all population not only black learners 24%
We do not employ students any longer. 3%
Grant money assist companies more in the first year on training and
supervision 3%
Much time consumed in grant application process 9%
Grant money not sufficient to cater for learners needs 18%
Not sufficient and should be increased to meet the increasing cost of
living 9%

Fasset Sector Survey 2016 FINAL REPORT: 29 September 2017
-96-
Respondent Perception Response %
Fasset grants have proved helpful to business operations and cash flow
in the face of learnership expenses. 6%
Far too short of what we spend and go through in terms of training 3%
Source: Sector Survey (2016)
Based on the respondent perceptions summarised in Table 4-21, 24% of respondents are of
the view that grant money is adequate while 18% believe it is inadequate. When the entirety
of the table is analysed, it becomes clear that there are concerns that Fasset needs to address
in respect of the grant quantum and who qualifies to receive it. Given limited financial re-
sources, it is expected that not everyone will be satisfied with the quantum provided and who
the beneficiaries are. What is important is that the criteria must be transparent and the process
clearly explained to all stakeholders.
4.3.10. Anticipated sector challenges
In responding to questions relating to sector challenges, Table 4-22 shows that 26% of re-
spondents anticipated that there would be fewer learners who will be available to go into the
financial/accounting profession. This is in contrast to the universities and TVET colleges’ re-
spondent perceptions, who by and large anticipate increasing intakes in these fields. WTP
respondents also anticipate that there will be a lack of knowledgeable candidates for entrance
into programs, a view which is also inconsistent with tertiary institutions that are forecasting
growth in the number of not just of applicants but also graduates. However, the quality of
applicants for programs may be the real issue here as all respondents have acknowledged
current challenges experienced with low level of mathematics passes in applying students.
Where perceptions of training providers are in line with those of tertiary institutions is on their
view that economic growth is a challenge the country is facing and will directly have an effect
on skills development in the sector and also on challenges relating to education funding. With
low economic growth forecasts, the rate of graduate absorption will continue to be a challenge
into the foreseeable future. Unfortunately, low economic growth may also act as a catalyst in
driving some valuable skills out of the economy and thus further exacerbate critical skill short-
ages. The table below summarises respondent perceptions on anticipated sector challenges:
Table 4-22: Perceptions on Anticipated Sector Challenges
Anticipated Sector Challenge Response %
Few learners who want to go into being professionals 26%
Lower job outsourcing to other countries e.g. India. 3%
Automation of accounting functions 3%
Small Business Employers might opt out of the program and take
learners on employment contracts instead. 3%
Lack of capable/knowledgeable candidates for entrance into pro-
grams. 19%
Lack of articleships due to Companies Act implementation i.e.or-
ganisations don't require audits. 3%
Government interference 6%

Fasset Sector Survey 2016 FINAL REPORT: 29 September 2017
-97-
Anticipated Sector Challenge Response %
Increasing skills shortage 3%
Existence of the SETA 6%
Quality of trainees’ due to entitlement issues 3%
Keeping funds out of politician’s hands 13%
Economic challenges in the country 10%
Source: Sector Survey (2016)
In addition to the anticipated challenge relating to fewer learners being available for the sector-
related professions, respondents also foresee lack of capable/knowledgeable learners for en-
trance into programs. Should these two issues become reality, they would threaten the very
existence of the sector and thus further exacerbate the scarce skills dilemma. It is therefore
imperative that a clear strategy be put in place to minimise the possibility of these two scenar-
ios.
4.3.11. Scarce skills
As indicated in the Figure 4-6, the majority of survey respondents (57%) indicated that they
considered Trainee Accountants as being a scarce skill. This was followed by positions of
Bookkeeper, Audit Manager, Administrator, Debt Collector and Clerk. In terms of the occupa-
tional category of scarce skills, the dominant one is Accounting followed by Office Administra-
tion and then Trainees. The skills identified as being scarce are broadly in line with what uni-
versities and colleges identified. Two of the reasons given for the scarcity of skills include the
poor standard of qualified candidates and unrealistic salary expectations by applicants.
Table 4-23: Scarce Skills According to Workplace Training Providers
Scarce Skill Response % Response Count
Bookkeeper 14% 2
Trainee Accountant 57% 8
Auditor Manager 7% 1
Clerk 7% 1
Administrator 7% 1
Debt Collector 7% 1
Total 100% 14
Source: Sector Survey (2016)
Regarding the interventions that could help alleviate the scarcity of skills, respondents sug-
gested career awareness in schools, offering of more bursaries and training. Interestingly, 38,
9% of WTPs indicated that they are not involved in interventions dealing with scarce skills.
Only 12% indicated they are involved in dealing with scarce skills. This lack of focus in dealing
with scarce skills is an indictment on respondents as it gives the impression that they are not
focusing efforts in the priority areas where their contributions could make a difference to skills
availability in the sector. To ensure that scarce skills are effectively dealt with, Fasset must
focus on funding providers focusing on scarce skills development rather than funding areas of

Fasset Sector Survey 2016 FINAL REPORT: 29 September 2017
-98-
low skills demand. Once funding priorities are established at Fasset level, it will not be prob-
lematic to shift the focus of providers as they would follow funding and adjust their programs
accordingly.
4.3.12. Critical skills gaps
Although some skills are generally adequate for the sector, they exhibit critical skill gaps that
need to be closed to enable effective performance by job incumbents. SS respondents indi-
cated that critical skills gaps are generally found in soft skill areas of communication and busi-
ness leadership and also in specific skill areas such as auditing. Interventions suggested in
closing the skills gaps include soft skills training, promotion of specific careers such as audit-
ing, more funding for students and promoting more business English courses. As indicated
earlier in this report, soft skills and leadership gaps were also identified as critical skills gaps
by universities and colleges.
4.3.12.1. Critical skills gaps specific to occupations
Respondents indicated that there is need to improve understanding of audit by individuals
occupying accounting roles such as Finance Managers, Bookkeepers and Finance Clerks as
some of them lack understanding on this critical component of their function. It was noted that
some TVET colleges offer financial management courses and yet do not include auditing as
a compulsory component of the course. The result is that one gets qualified accounting per-
sonnel who do not understand the audit function and are therefore not able to effectively in-
teract with the auditors.
4.3.12.2. Critical skills gaps spanning various occupations
SS respondents generally felt that soft skills training needed to be improved for all categories
of occupations in the sector. This is to include training in communication, leadership and emo-
tional intelligence. It has to be noted that these are generally not areas of emphasis during the
training of accounting personnel and the source of the skills gap may be because of that omis-
sion.
4.3.13. Future skills needs
SS respondents indicated that Accountants, Bookkeepers and Auditors are the three skills
that will be in demand in future. Of these, Accountants will be most in demand both at the level
of qualified Accountants and at Trainee Accountant level. While the anticipated NQF levels
vary broadly, most respondents expect most demand at levels 7 and 8. It is however also
anticipated that there will be demand for these skills at NQF levels 3-5.

Fasset Sector Survey 2016 FINAL REPORT: 29 September 2017
-99-
4.3.14. Supply of skills to the sector
In response to the question on what they consider to be factors influencing skills supply in the
sector, 21, 3% of the survey respondents indicated that it is the output from the education
system. While 8, 3% of respondents attributed demand to the supply of graduates and skilled
workers, 2, 8% thought it related to levels and availability of training. What is clear from these
responses is that WTPs believe the supply of skills to the sector is a function of skills devel-
opment at different levels of the education system. By implication, an efficient skills supply will
only result if the entire education value chain is operating optimally. Significantly, only 14, 8%
of respondents indicated that their overall impression of education and training in the sector is
satisfactory while 3, 7% considered it to be impressive. It is therefore apparent that much more
needs to be done to improve education and training in the sector to enable it to meet the
supply of skills.
4.3.15. Sector outlook and change drivers
SS respondents were not too optimistic on growth expectations in the sector. While 6, 5%
were of the opinion that the sector will grow, 7, 4% forecast that the sector will remain constant.
A further 5, 6% anticipated that the sector will actually decline.
In respect of the drivers of growth, 14% of respondents attributed this to general economic
growth while 7, 4% saw this being related to regulatory and environmental changes. Other
respondents saw the growth of the sector as being a driver for growth.
While acknowledging the changes taking place in the sector, respondents had varied reasons
for these changes. These reasons varied from technological to regulatory and business-re-
lated changes and also encompassed the effects of globalization. It is also important to note
that respondents felt that these changes will affect all professional levels within the sector, a
realisation that has a bearing on the interventions required to manage change. Effectively, this
implies that change interventions must focus on all skill levels within the sector.
4.3.16. Expected Role of Fasset in the sector
As the main driver of skills development in the sector, Fasset carries an enormous responsi-
bility in ensuring that the myriad of skill challenges are not only identified but also managed.
From the respondent’s perspective, the 3 (three) key roles that Fasset ought to play relate to
offering better training opportunities and specific courses focused on addressing specific skills
shortage areas and, perhaps more importantly, providing funding. Table 4-23 summarizes the
respondent’s views on the role Fasset ought to play.

Fasset Sector Survey 2016 FINAL REPORT: 29 September 2017
-100-
Table 4-23: Respondent views on the expected role of Fasset
Expected Fasset Role Response % Responses
Assist in CSR and School events - Financial & resource assistance
5% 1
Provide more relevant lectures around Account-ing and related topics to SDL payers
5% 1
We do not employ students any longer. 5% 1
Courses in Business English 5% 1
Sound work ethics and have life skills and basic good general knowledge and willing to work for a living.
5% 1
More incentives for training individuals in areas with scarce skills.
10% 2
Funding 14% 3
Offer specific skills shortage courses 19% 1
Offer better training opportunities 33% 7
Total 100% 21
Source: Sector Survey (2016)
The table above indicates that the majority of respondents (33%) would like Fasset to offer
better training opportunities while 19% would like it to offer specific training courses. This in-
formation is critical in sector skills planning and in ensuring skills development initiatives focus
on areas of strategic importance to stakeholders. The areas highlighted are at the core of the
SETA skills mandate and therefore need further investigation to clarify the specific expecta-
tions of the stakeholders.
4.4 Conclusion
This section of the report has analysed survey respondent perceptions from WTPs.
Based on the results of the analysis, the following conclusions can be made:
despite all efforts by the South African government and Fasset, financial constraints
continue to be a challenge for WTPs;
student throughput levels continue to be lower than expected as a result of learner
dropouts;
currently low Matric pass levels with Mathematics are a challenge for WTPs as they
directly determine the pool of learners available for recruitment into Fasset-related
training programs;
recruiting and retaining qualified lecturers is a challenge for institutions of higher learn-
ing;
placement of learners for work-based experiential learning needs to be improved;
Chartered Accountants, Financial Managers, Bookkeepers and Auditors are some of
the skills still considered critical; and
there is currently a competency gap on leadership, management and soft skills espe-
cially at professional levels.

Fasset Sector Survey 2016 FINAL REPORT: 29 September 2017
-101-

Fasset Sector Survey 2016 FINAL REPORT: 29 September 2017
-102-
5 SURVEY OF LEARNERS
5.1 Introduction
The sector provides theoretical and practical training opportunities to thousands of learners.
Most of these training opportunities are in the form of formal learnership programs that lead to
NQF registered qualifications. The learnerships that are offered in the sector span from NQF
level 3 to 7 and many of them provide access to professional body membership and profes-
sional designations. Through the professional learnerships the sector trains financial profes-
sionals not only for its own needs but also for those of other sectors of the economy. Further-
more, South African trained professionals are in great demand internationally.
This chapter presents the results of a survey conducted among a group of 203 learners on
learnerships. The following elements will be discussed:
profile of learners;
learner experiences with regard to workplace training;
learner challenges during the learnership; and
employment prospects and future career plans.
5.2 Learner Database and Sample Sizes
Fasset offered 3 (three) Discretionary Grants during the 2015/2016 financial year, namely
the Pivotal Grant (PG), the Learnership Cash Entry and Exit Grant or Learnership Cash Grant
(LCG), and the NSFAS Loan Repayment Grant
The total population for the learners on this survey was drawn from the LCG and NSFAS
lists. The 2 (two) databases had a total of 581 (five hundred and eight one) learners and 203
(two hundred and three) successfully completed the questionnaires. Thus, the sample size
constituted 35% of the population. The majority of the learners completed the online survey,
through Survey Monkey.
5.3 Profile of Learners Surveyed
5.3.1. Learners by gender and race
A total of 203 (two hundred and three) learners participated in the survey, versus a target of
173 (one hundred and seventy three). In terms of gender composition, 61% were female
while males constituted 39%.

Fasset Sector Survey 2016 FINAL REPORT: 29 September 2017
-103-
Table 5-1: Gender and Race
Race Gender
Male Female Percentage
Black African 79 122 99%
White 0 0 0%
Coloured 1 1 1%
Indian 0 0 0%
Total 80 123 100% Source: Sector Survey (2016)
As shown in Table 5-1 above, 99% of the learner respondents were Black Africans followed
by Coloureds (1%).
5.3.2. Learners by age
Table 5-2 below shows that the majority (73%) of the learners surveyed were in the 25-30
years age group followed by the 20-24 years age group (16%).
Table 5-2: Age of Fasset learners surveyed
Age range Total Surveyed Percentage
20-24 years 33 16%
25-30 years 148 73%
31-34 years 16 8%
35> years 6 3%
Total 203 100% Source: Sector Survey (2016)
Table 5-2 also shows that the learners in the Fasset Learnership program were generally
young, and that the number of learners in the program decreased significantly with age.
5.3.3. Geographic distribution of learners
Figure 5-1 shows that the majority (36%) of the learners surveyed were doing their learner-
ships in Gauteng, followed by KwaZulu-Natal (24%) and Western Cape which had the third
largest group of learners (18%). Very few learners from Mpumalanga, Northwest and Northern
Cape responded from the survey.

Fasset Sector Survey 2016 FINAL REPORT: 29 September 2017
-104-
Figure 5-1: Geographical distribution of Fasset learners surveyed
Source: Sector Survey (2016)
5.3.4. Education and skills levels
With regard to education, Figure 5-2 reveals that the highest proportion (65.5%) had Bache-
lor’s Degree as their highest qualification prior to starting their learnerships, followed by Na-
tional Diploma (10.3%), Postgraduate Diploma (3.9%), Honours Degree (3.4%) and Grade 12
(3%). There was no learner respondent with a masters or doctoral degree. A significant num-
ber of learner respondents (12.8%) did not specify their highest qualification prior to the learn-
ership.
74
48
36
22
13
7
1 1 1
0
10
20
30
40
50
60
70
80
No
. of
Lear
ne
rs

Fasset Sector Survey 2016 FINAL REPORT: 29 September 2017
-105-
Figure 5-2: Learners surveyed by education level
Source: Sector Survey (2016)
5.3.5. Learnership types
As shown on Figure 5-3 below, the majority of the learners (68, 5%) who participated in in the
survey were under the LCG learnership while 26, 6% were under the NSFAS learnership. Only
2% indicated that they were on both LCG and NSFAS with another 2, 5% not indicating their
learnership type.
Figure 5-3: Learnership type
Source: Sector Survey (2016)
3.4%
0.0%0.6%
11.9% 0.6%
75.1%
4.5%4.0%
0.0% 0.0%
Grade 12
Higher Certificate
National Certificate
National Diploma
Advanced Diploma
Bachelor's Degree
Post Graduate Diploma
Honours Degree
Master's Degree
Doctorate (PhD)
71%
27%
2%
0%
10%
20%
30%
40%
50%
60%
70%
80%
LCG NSFAS Both
% o
f Le
arn
ers

Fasset Sector Survey 2016 FINAL REPORT: 29 September 2017
-106-
Respondent learners were also asked to indicate the professional body they belong to. Most
of the learners (40.9%) indicated that they belonged to SAICA (SAIPA) with ICB coming at a
distant third (1%). A significant number of learners (35%) did not indicate their professional
body.
5.3.6. Learner salaries
Learners were asked to indicate their gross salary per month and Figure 5-4 below shows the
tabulated results. The majority of the learners (28%) indicated that their monthly salary was
less than R6 200.00. A significant number of learners (14%) indicated that they were earning
more than R16 200.00 per month.
Figure 5-4: Gross monthly salary per learner
Source: Sector Survey (2016)
In the 2016 SS, it was found that 25, 3% earned less than R5 000.00 per month, 40% earned
between R 5 000.00 and R7 500.00 and less than 4% of learners earned more than R
12 500.00 per month. This means that the monetary value or salary scale, without adjusting
for inflation, has generally increased.
5.4 Perceptions and Experiences of Training
When asked about training, learners advised that they had so far received the following: tech-
nical training related to field of study (78%), communication skills (70%) and time management
(70%) as their top 3 (three). Figure 5-5 shows all the other skills mentioned by respondent
learners.
28%
24%
19%
14%
8%
7%
0%
5%
10%
15%
20%
25%
30%
Less than R6200
R6 200 - R8700
R8 701 - R11200
More than R16200
R11 201 - R13700
R13 701 - R16200
% o
f Le
arn
ers

Fasset Sector Survey 2016 FINAL REPORT: 29 September 2017
-107-
Figure 5-5: What training have you received so far?
Source: Sector Survey (2016)
Some of the learners indicated that they were now proud that their training had helped them
to do compilation of financial statements and tax related calculations and returns confidently
while some recommended that the new training software such as “Case ware” be upgraded.
When asked if there was any additional training that learners may still be in need of, the fol-
lowing training was cited: technical training related to field of study (33%), soft skills (15%) and
accounting and non-accounting software (10%), as shown in Figure 5-6.
78%
70% 70% 69% 69%
56%
52%
0%
10%
20%
30%
40%
50%
60%
70%
80%
90%
Technical trainingrelated to field of study
Time management Office etiquette skills Presentation skills
% o
f Le
arn
ers

Fasset Sector Survey 2016 FINAL REPORT: 29 September 2017
-108-
Figure 5-6: Additional training that learners may still need
Source: Sector Survey (2016)
However, some learners, instead of demanding more training had advice for other learners.
One learner said “there are e-learnings that one may do in their own time on various topics”,
encouraging other learners to take advantage of technology. Another learner asked for help
on preparation for SAICA exams, saying “[there is need for] simulation programs to ensure I
achieve my SAICA competencies”.
When asked about the support received from the organisation in order to perform their tasks,
the following are a few of the quotes from some of the learners:
“We have online webinars on different topics related to the profession. We also attend
courses and occasionally have in-house training”.
“In our organisations, trainees who are making progress in their training are given op-
portunities to lead an audit with juniors under them, which gives them (trainees) expo-
sure to being a leader and getting them ready for when they assume a managerial
position”.
“I benefited from secondments and overseas opportunities, during and after the train-
ing on leadership”.
“We attend seminars and events that are relevant to our career development”.
5.4.1. Practical experience
A total of 70% of learners interviewed believed that they were receiving enough practical ex-
perience during the learnership, 13% said it wasn’t enough while 17% did not answer the
question. One learner confidently said “I have been exposed to small entities in which one can
see the entire audit process to large entities in which one can face complex transactions and
33%
15%
10%
10%
6%
5%
5%
4%
4%
4%
2%
2%
0% 5% 10% 15% 20% 25% 30% 35%
Technical training related to your field of study
Soft skills
Non accounting skills/Software
Technical Skills/Software
Leadership and management
Presentation skills
Communication skills
Academic support
Time management
Office etiquette skills
Computer training
Problem-solving skills
% of Learners

Fasset Sector Survey 2016 FINAL REPORT: 29 September 2017
-109-
apply professional judgment. The Firm has both government audits and private company au-
dits. There are agreed upon procedures in which we use other skills over and above audit to
complete these separate engagement”.
Learners were asked to rate certain aspects of their practical training. Figure 5-7 below, pro-
vides a summary of their responses.
Figure 5-7: Learner scores for practical experience
Source: Sector Survey (2016)
As shown in Figure 5-7, the majority of the learners considered the experience they had during
workplace training as “satisfactory” or “excellent”, with a minority saying “unsatisfactory”. The
main aspect which the learners were not satisfied with was access to a mentor. This suggests
that a few organisations made a dedicated mentor available or if the mentor was available, it
was difficult for learners to access direct mentorship or they had limited access. On the issue
of the importance of a mentor, one learner said “a dedicated mentor ensures that the compe-
tences that I must obtain as per SAICA requirements are being obtained as per timeline. This
includes being assigned new clients and regular meetings with other managers to ensure they
understand my development needs”.
The aspect which was considered excellent by the majority of learners was ‘relevance of prac-
tical experience to theoretical training’. This suggests that the majority of learners were ex-
posed to the real world of work in line with the training curriculum. However, another learner
was not happy with her exposure saying “I am not exposed to any kind of practical experience
as I find myself doing same thing as I was doing 2 years ago. Especially on Management
Accounting and Tax as required by SAIPA Logbook”.
The majority of the learners said that they were satisfied with the exposure they got in all
aspects of practical training. One of the learners, though overall satisfied, had some concerns:
“adequate experience is provided for trainee accountants, and the organisation offers great
40%38%
22%
38%
48%
14%
47%44%
9%
0%
10%
20%
30%
40%
50%
60%
Excellent Satisfactory Unsatisfactory
% o
f Le
arn
ers
Access to a mentor
Exposure to all aspects of practical training
Relevance of practical experience to theoretical training

Fasset Sector Survey 2016 FINAL REPORT: 29 September 2017
-110-
exposure, but I feel that there is a lack of rotation within the organisation, resulting in us not
getting exposure to other areas”.
5.4.2. Soft skills
Learners were asked to rate the extent to which they believed the learnership improved their
soft skills. Figure 5-8 shows the types of soft skills received and the learner ratings.
Figure 5-8: Learner scores for soft skills attainment
Source: Sector Survey (2016)
As shown on Figure 5-8, the soft skill which was rated highest (by 76% of the learners) is
critical thinking. This analysis shows that the top 5 (five) soft skills the learners benefited from
the learnerships are critical thinking, communication, problem-solving, decision-making and
career management skills. Some leaners also mentioned that the learnership helped them
develop time management and client management skills. The results also show that the learn-
ership did not have much focus on job searching skills, probably because the majority of the
learners are already employed by the workplace training provider.
76%
21%
2%
73%
23%
4%
68%
29%
3%
66%
29%
5%
58%
34%
9%
41%
48%
10%
38%40%
22%
0%
10%
20%
30%
40%
50%
60%
70%
80%
To a large extent To some extent Not at all
% o
f Le
arn
ers
Critical thinking Communication (personal and business)
Problem-solving Decision-making
Career management Networking
Job searching

Fasset Sector Survey 2016 FINAL REPORT: 29 September 2017
-111-
5.4.3. Technical skills
Learners were asked to rate the extent to which they believed the learnership improved their
technical skills, in terms of ‘to a large extent’, ‘to some extent’, and ‘not at all’. Figure 5-9 shows
the learners’ rankings to the questions “to what extent did the Learnership improve your tech-
nical skills?”
Figure 5-9: Learner scores for technical skills attainment
Source: Sector Survey (2016)
Respondent learners rated highly (to a large extent) the following 5 (five) technical skills:
communication, both personal and business (73%);
financial accounting (73%);
computer-based technical skills (71%);
auditing (62%); and
taxation (61%).
5.4.4. Challenges faced during learnership
Learners were asked to indicate the main challenges encountered during the learnership
which could lead to learner dropout. Figure 5-10 shows that the most sighted challenge was
financial difficulty (36.9%) followed by overwhelming workload (6.9%) and ill-treatment of train-
ees (6.4%).
73%
25%
2%
73%
24%
3%
71%
23%
6%
62%
28%
10%
61%
31%
8%
46%
41%
13%
44%
43%
14%
42%
39%
18%
0%
20%
40%
60%
80%
To a large extent To some extent Not at all
% o
f Le
arn
ers
Communication (personal and business) Financial accountingComputer-based technical skills Auditing and assuranceTaxation Management decision makingFinancial management Internal auditing and corporate governance

Fasset Sector Survey 2016 FINAL REPORT: 29 September 2017
-112-
Figure 5-10: Challenges encountered during learnership
Source: Sector Survey (2016)
Highlighting the financial difficulty faced by the learners, one learner remarked that “the stipend
[is] not enough as it is lower than R3500.00. It was stated [that it would be] above that on the
second year of the Learnership, and we still have to pay tuition fees and professional body
fees with that stipend”. One learner highlighted that they did not have a structured training
program at their workplace, saying “there is no skill and development plan that we follow as
guidance of how we should be trained”.
5.5 Access to Education and Training
Learners were asked to highlight what they felt were the factors which promoted access to
education and training, as well as the factors which inhibited access. To improve on learner’s
access to education and training in the sector, respondent leaners recommended that the
financial support be increased (12.3%), improved marketing and awareness of Fasset funded
programs (5.4%), facilitation of access to workplace training (2.5%) and access to mentors
(2%).
5.5.1. Workplace interventions
Learners were asked to rate their perceptions about the effectiveness of the existing initiatives
around education and training in the workplace. As shown in Figure 5-11, most of the initiatives
were rated as “satisfactory”.
49%
9%
7%
5%
5%
5%
5%
4%
1%
1%
0%
9%
0% 10% 20% 30% 40% 50% 60%
Financial difficulty
Overwhelming workload
Exploitation and mistreatment of trainees
Lack of mentorship
Lack of organisation support
Personal reasons
Lack of transfomation mindset
Lack of technical exposure during workplace training
Lack of carrer guidance
Lack of soft skills
Lack of work ethic
Other
% of Learners

Fasset Sector Survey 2016 FINAL REPORT: 29 September 2017
-113-
Figure 5-11: Learner scores for workplace initiatives
Source: Sector Survey (2016)
According to the learners who participated in the survey, initiatives being implemented in line
with career guidance, access to learnerships and access to financial support could be rated
as “excellent”. However, there is also a significant number of learners who are not satisfied
with the current initiatives on access to financial support. Other areas where the learners indi-
cated dissatisfaction include high learner dropout, lack of transformation in the sector and lack
of access to employment.
5.5.2. Learner dropout
As shown on Figure 5-10, financial difficulty is a leading cause of learner dropout. This finding
is collaborated with the statistics in Figure 5-11, where 22% of the respondent learners indi-
cated that they were not satisfied with the way the industry was treating the challenge of
learner dropout. Below are some salient points (direct quotes) from some of the learners:
“The transition from tertiary into the working environment in the work place can some-
times be hostile, personal issues, lack of financial support”.
“Learners are being treated as bookkeepers instead of 'trainee accountants'. Employ-
ers are more profit driven and neglect logbook coverage for all learners”.
“I think there should be a standard living wage for entrants in the sector that is at least
above R10 000. You cannot be earning R5 000 and yet a flat rental is R 6 500. There
is a gap as you can see in there. Lack of affordable accommodation hinders ones’
development, and might lead to drop-out”.
“The monthly stipend paid to trainees does not cover enough for learner expenses,
given the rising prices due to inflation”.
42% 4
7%
11%
39%
48%
13%
36% 4
1%
23%
35%
46%
19%
34%
53%
13%
34%
48%
18%
26%
52%
22%
0%
10%
20%
30%
40%
50%
60%
Excellent Satisfactory Unsatisfactory
% o
f Le
arn
ers
Career guidance Access to learnerships Access to financial support
Transformation in the sector Tertiary education pass rate Access to employment
Learnershp dropout rate

Fasset Sector Survey 2016 FINAL REPORT: 29 September 2017
-114-
From the above quotes, it can be concluded that the issue of costs versus stipend is a major
concern. This mirrors the “#FeesMustFall” campaign in the universities and TVET colleges.
There is also need for monitoring to ensure that there is adherence to learner logbooks, as
lack of development might cause discouragement leading to dropout.
5.6 Career Progression and Future Plans
Approximately 90% of the learners interviewed were positive about their employment pro-
spects after completion of the learnership, indicating that the prospects were good or excellent
(Figure 5-12).
Figure 5-12: Learners' perceptions on employment prospects after learnership
Source: Sector Survey (2016)
Some learners we optimistic that the public-sector policies will turn the economy around and
lead to high employment3. Some learners expressed optimism that they will now be employed
on a permanent basis after learnership.
Learners were also asked to indicate their future plans after completion of the learnership.
Figure 5-13 below shows the main responses.
3 Please note that this survey was concluded before the cabinet reshuffle, which lead to the dismissal
of the then finance minister and subsequently the downgrade of the SA economy to ‘junk’ status.
45%
42%
11%
2%
0%
5%
10%
15%
20%
25%
30%
35%
40%
45%
50%
Excellent Good Average Poor
% o
f Le
arn
ers

Fasset Sector Survey 2016 FINAL REPORT: 29 September 2017
-115-
Figure 5-13: Learner plans post-learnership
Source: Sector Survey (2016)
As shown in Figure 5-13, with regard to medium to long-term plans, 38% of learners stated
that they would look for employment opportunities within South Africa, 27%% stated that they
would enrol for further studies while 17% would want to start their own business4. Approxi-
mately4% of the learners indicated that they intended to search for employment opportunities
outside South Africa, thus the estimated emigration rate is around 5.9%.
5.7 Conclusion
This chapter presented the findings from the learners’ survey. The main objective was to ex-
plore the learner experiences regarding workplace training and challenges experienced during
the learnership, especially those that may lead to premature termination of the learnership.
The main finding is that learners are generally happy with the initiatives being implemented in
line with career guidance, access to learnerships and access to financial support. However,
the main complaint, which might be the main reason for learner dropout, is financial difficulty.
The issue of cost of living versus stipend is a major concern. This mirrors the “#FeesMustFall”
campaign recently witnessed in the universities and TVET colleges.
4 Please note that learners where asked to indicated more than one option, hence the total percentage
is more than 100%.
38%
27%
17%
14%
4%
0%
5%
10%
15%
20%
25%
30%
35%
40%
To findemploymentelsewhere in
SA
To enroll forfurtherstudies
To start owncompany
To stay withorganisation
To findemploymentoutside SA
% o
f Le
arn
ers

Fasset Sector Survey 2016 FINAL REPORT: 29 September 2017
-116-
6 SUPPLY OF SKILLS
6.1 Introduction
The skills required for the sector are produced at school, TVET Colleges, private Training
Providers, Universities, Universities of Technology as well as workplaces themselves. This
chapter focuses primarily on understanding the supply of skills to the sector. The context of
Grade 12 results in Pure Mathematics and Accounting, nature of the supply of skills from fur-
ther and higher education institutions, learnerships at workplace and challenges and interven-
tions to the sector will be discussed.
6.2 Basic Education
Chapter 2’s labour market profile showed that the biggest proportion of employees in the sec-
tor (35%) have achieved the equivalent of NQF Level 4 as their highest level of education.
However, most stakeholders interviewed one-on-one expressed concern at the quality of basic
education in the country. Given the nature of the sector, all the core occupations require a
foundation of good quality Mathematics, Accounting and English, which for the majority of the
population is lacking, even when Grade 12 has been completed. The basic education system
is not producing sufficient numbers of young South Africans who meet the admission criteria
for the fields of study that are relevant to the sector.
Mathematics is a critical formative subject in acquiring analytical and problem-solving skills,
while English is the language for communication, learning and business. Weaknesses in these
core subjects weakens the potential students from entering the value chain system of the
Fasset labour market. Too many learners cannot read textbooks and follow arguments, and
thus their further education and training or higher education is compromised.
South Africa has one of the highest rates of public investment in education in the world. At
about 7.3% of gross domestic product (GDP) and 20.5% of total state expenditure, the gov-
ernment spends more on education than on any other sector, National Budget (2017). School
infrastructure has been a persistent challenge for many rural provinces and a fair portion of
the Department of Basic Education’s budget will be channelled to rural school infrastructure.
The NDP calls for 450 000 (four hundred and fifty thousand) Grade 12 learners to achieve
university entrance passes with Mathematics and Physical Science in 2030. But the intake for
these subjects at high school has been slow.
Table 6-1 shows the Grade 9 pass rates for Mathematics in South Africa for the years 2012 to
2014. The table shows that the average pass rate for Mathematics in South Africa remains
very low for the period being reported. What is worrying is that the average mark is even going
down from 13.9% in 2013 to 10.8% in 2014. Only a handful of students are achieving at least
50% pass mark. The table shows that only 2.3% of students in grade 9 achieved a pass mark
of 50% in 2012 and this marginally increased to 3.4% in 2013 before it receded to 2.9% in
2014.

Fasset Sector Survey 2016 FINAL REPORT: 29 September 2017
-117-
Table 6-1: Grade 9 Mathematics pass rates in South Africa (as determined by the ANA)
Year Average percentage mark for
Mathematics in South Africa
(%)
Percentage of learners in South Af-
rica who achieved at least 50% for
Mathematics
2012 12.7 2.3%
2013 13.9 3.4%
2014 10.8 2.9%
Source: HEMIS data, 2017
Table 6-2 shows the number of learners writing Matric Mathematics, English and Accounting
National School Certificates and their pass rates in South Africa for the years 2011 to 2015. It
shows the number of learners who passed the three subjects by obtaining a mark of 30% or
above. It is particularly of concern that the pass rates in core subject such as Mathematics
remain low. Especially concerning are the rates for Mathematics, as the pass mark required
is 30% but less than half the learners are managing to attain it. Of great concern is the fluctu-
ation of the pass rate in Mathematics which had shown signs of improving from 46.3% to
59.1% between 2011 and 2013 and only to drop to 53.5% and to 49.1% in 2014 and 2015
respectively. However, 2016 results have shown an improvement of students who attained at
least 30% to 51.1%. The table shows that learners have maintained good passes in English
and Accounting with the pass marks increasing from 61.6% to 69.5% and 96.2 to 97.4% re-
spectively. With the pass mark required being a low 30% it is important that far more learners
pass these subjects, especially as they form the foundation of the core occupations in the
sector.
Table 6-2: Matric completion and pass rates for Mathematics and Accounting in South
Africa
Year Number
of learn-
ers com-
pleting
Mathe-
matics
Pass rate
for
Mathemat-
ics
with
at least
30%
Number
of learn-
ers com-
pleting
Account-
ing
Pass rate
for
Account-
ing with at
least 30%
Number of
learners
complet-
ing
English
Pass Rate
for
English
with at
least 30%
2011 224,635 46.3 137,903 61.6 414,480 96.2
2012 225,874 54.0 134,978 65.6 419,263 97.9
2013 241,509 59.1 145,427 65.7 454,666 98.8
2014 225,458 53.5 125,987 68.0 432,933 82.8
2015 263,903 49.1 140,474 59.6 543,941 97.1
2016 265,810 51.1 128,853 69.5 547,292 97.4
Source: National Senior Certificate Examination- Schools Subject Report, accessed 2017
Although the national Grade 12 pass rate has improved somewhat in recent years, questions
remain about the quality of the Grade 12 certificate, especially considering that learners need
to score only 30% to pass some subjects. National and regional stakeholders believe that

Fasset Sector Survey 2016 FINAL REPORT: 29 September 2017
-118-
many learners struggle at universities and TVET colleges after school because their basic
education has been poor. It is believed that when this has been resolved, much of the current
training requirements which employers and Fasset have to fund will become unnecessary.
However, Van Broekhuizen et al (2016) in their study of higher education access and out-
comes for the 2008 national matric cohort, find out that even though Matric marks are a good
indicator of university access they are only weakly related to eventual university enrolment. A
large proportion of matriculants who qualify to go to university do not enter university in the
year following matric, but only one or more years later. They find that just under 33% or a third
of students who perform well enough to achieve a Bachelor pass did not enrol in university in
the next six years.
6.3 Technical Vocational Education and Training Sector
6.3.1. Introduction
The South African government places great emphasis on the growth of TVET colleges as
enshrined in the White Paper which seeks to strengthen and expand the public TVET colleges
for the purposes of making them attractive institutions to school leavers and to provide skills
to the labour force. Figure 6-1 reports the number in Business and Financial Management
graduates in 2013 and 2014. Public TVET colleges continue to produce the largest number of
graduates when compared to private TVET colleges. In 2013 public TVET colleges produced
881 (eight hundred and eight one) and 1,128 (one thousand one hundred and twenty eight)
graduates in Business Management and Financial Management respectively, which repre-
sented more than 90 % of the total graduates. In 2014 a significant increase was registered in
the number of graduates in Business and Financial Management from 950 (nine hundred and
fifty) and 1,181 (one thousand one hundred and eight one) respectively to 2,561 (two thousand
five hundred and sixty one) and 3,057 (three thousand and fifty seven) respectively. This
shows that confidence in TVET colleges as a choice of post-school education and training
institutions and as a source of providing skills to prospective students is growing.

Fasset Sector Survey 2016 FINAL REPORT: 29 September 2017
-119-
Figure 6-1: Graduates in Business and Financial Management from Public and Private
TVET colleges
Source: DBE, National Examination Database, month and year, accessed 2017
6.3.2. Completion rates in Public and Private TVET colleges
Table 6-3 shows completion rates of students enrolled in both public and private TVET col-
leges for 2013 and 2014 across 3 (three) years of studies in Business and Financial Manage-
ment. Results shows that public TVET colleges have a higher completion rates in both Busi-
ness and Financial Management in the reported periods. The average completion rate for
Business Management is 37.8 %for 2014 in public TVET colleges while that of private TVET
colleges is 26.9 % for the same year. Financial Management completion rates in public TVET
colleges are higher than those in Business Management. Completion rates are low at all levels
of studies from level 1 up to level 2 across both public and private TVET colleges and in both
Business and Financial Management. In 2013, the average completion rates for Business
Management were 28.5% and 19.7% in public and private TVET colleges respectively. How-
ever, an increase of 10.8% and 9.5% points in average completion rates of Business Manage-
ment was witnessed in 2014.
69
881 950
159
24022561
53
1128 1181
156
29013057
0
500
1000
1500
2000
2500
3000
3500
Private Public Total Graduates Private Public Total Graduates
Per
cen
tage
(%)
2013 Business Management 2014 Financial Management

Fasset Sector Survey 2016 FINAL REPORT: 29 September 2017
-120-
Table 6-3: Completion rates in Public and Private TVET colleges
Business
Management
2013 2014
Level 1 Level 2 Level 3 Aver-
age
Level 1 Level 2 Level 3 Aver-
age
Public TVETs 31,1 37,5 17 28,5 41,7 43,9 27,8 37,8
Private
TVETs
19,6 22,1 17,4 19,7 23,3 28,7 28,8 26,9
Financial
Management
Level 1 Level 2 Level 3 Aver-
age
Level 1 Level 2 Level 3 Aver-
age
Public TVETs 28,9 48,6 26,4 34,6 38,9 53 42 44,6
Private
TVETs
13,5 29,2 13,8 18,8 18,1 36 27,7 27,3
Source: DBE, National Examination Database, month and year, accessed 2017
Figures 6-2 and 6-3 shows the completion rates of both Business Management and Financial
Management by gender in 2013 and 2014 for private and public TVET colleges. Females
training with private TVET colleges have a higher completion rates over males with 21.8% and
27.8% completing their education while only 16.7% and 26% of males in 2013 and 2014 re-
spectively. Both females and males training with public TVET colleges registered almost equal
completion rates in 2013 and 2014.
Figure 6-2: Completion rates for 2013-2014 in Business Management by gender
Source: DBE, National Examination Database, month and year, accessed 2017
19.2%
27.1%
34.3%
43.9%
18.2%
27.5%
35.4%
46.4%
0.0%
5.0%
10.0%
15.0%
20.0%
25.0%
30.0%
35.0%
40.0%
45.0%
50.0%
2013 2014 2013 2014
Private TVETS Public TVETS
Per
cen
tage
(%)
Female
Male

Fasset Sector Survey 2016 FINAL REPORT: 29 September 2017
-121-
In Financial Management Figure 6-2 shows that completion rates for males are higher than
that of females in public TVET colleges while that of Private TVET colleges is almost the same.
The figures also show that the completion rates in both public and private TVET colleges for
both females and males have registered an improvement over the same period.
Figure 6-3: Completion rates for 2013-2014 in Financial Management by gender
Source: DBE, National Examination Database, month and year, accessed 2017
6.4 Higher Education and Training
6.4.1. Introduction
Higher education and training (HET), or tertiary education, includes education for undergrad-
uate and postgraduate degrees, certificates and diplomas, up to the level of the doctoral de-
gree. In recent years more school-leavers have been obtaining grades that enable them to
enrol for studies at university. However, owing to the poor Mathematics pass marks in the
country which is a requirement for the majority of Fasset-related qualifications, as well as due
to competition with other academic fields in Science, Engineering and Medicine, the uptake
for the sector remains relatively low.
19.2%
27.1%
34.3%
43.9%
18.2%
27.5%
35.4%
46.4%
0.0%
5.0%
10.0%
15.0%
20.0%
25.0%
30.0%
35.0%
40.0%
45.0%
50.0%
2013 2014 2013 2014
Private TVETS Public TVETS
Per
cen
tage
(%)
Female
Male

Fasset Sector Survey 2016 FINAL REPORT: 29 September 2017
-122-
6.4.2. Accounting and Bachelor of Commerce graduates
With regard to universities, certain of the fields of study relevant to the sector are Accounting,
Auditing, Finance, Bookkeeping, Tax Consulting, Stockbroking and Investing.
6.4.2.1. Graduates in Accounting
Table 6-4 shows that the number of graduates in Accounting qualifications at HET level for
the period 2004 and 2011-2015 has generally been increasing. Between 2011 and 2015 a
total of 76,280 (seventy six thousand two hundred and eighty) students have graduated across
all accounting qualifications with 3 (three) year Bachelor’s degrees, undergraduate di-
ploma/certificates and honours graduates recording the highest number of graduates of
28,640 (twenty eight thousand six hundred and forty), 15,137 (fifteen thousand one hundred
and thirty seven) and 13,664 (thirteen thousand six hundred and sixty four) respectively. Grad-
uates attaining advanced diploma recorded 504 (five hundred and four) being the lowest num-
ber of graduates as it has only started recording graduates in 2013. Students graduating with
Masters degrees and PhDs remains low though the numbers have been increasing particularly
in Masters degrees to which 511 (five hundred and eleven) students have graduated between
2010 and 2015. Graduates in Advanced Diploma, Masters, 4 year or more Bachelor’s degree
programs have recorded highest growth rates of 281.3%, 30.2% and 15.1% respectively in
that order while the Post- Graduate Certificates and Bachelor of Technology degrees have
been declining by 10.1% and 0.3% respectively. The output of graduates has significantly
increased year on year. A total of 12,056 (twelve thousand and fifty six) graduates were pro-
duced in 2004 while a total of 16,657 (sixteen thousand six hundred and fifty seven) were
produced in 2015 giving an average yearly growth of 3.3%.
Table 6-4: Graduate numbers in Accounting according to NQF level for 2004 and 2011-
2015
NQF
Level
Type of
Qualifica-
tion
2004 2011 2012 2013 2014 2015 Grand
Total
Av.
yearly
growth
(%)
10 Doctoral 4 6 4 7 7 11 35 14,8
9 Masters 195 56 105 92 120 138 511 30,2
8 Honours 2,407 2,344 2,314 2,593 3,058 3,355 13,664 8,5
7 1st Bache-
lor’s Degree
(3 years)
4,463 5,583 5,587 5,768 5,562 6,140 28,640 2,8
1st Bache-
lor’s Degree
(4 years or
more)
131 157 215 240 425 469 1,506 15,1
Bachelor of
Technology
530 776 692 750 880 796 3,894 -0,3

Fasset Sector Survey 2016 FINAL REPORT: 29 September 2017
-123-
NQF
Level
Type of
Qualifica-
tion
2004 2011 2012 2013 2014 2015 Grand
Total
Av.
yearly
growth
(%)
Advanced
Diploma
- - - 26 100 378 504 281,3
Total 5,124 6,516 6,493 6,784 6,967 7,783 34,543 3,5
6 PG/Dip/Post
Dip/Cert
509 917 1 082 980 749 570 4,298 -10,1
UG Dip/
Cert (1 or
2years)
209 1,555 1,478 1,628 1,651 1,784 8,096 2,0
UG Dip/Cert
(3years)
3,608 3,015 3,159 3,024 2,921 3,018 15,137 3,0
Total 4,326 5,487 5,719 5,631 5,321 5,372 27,530 0,3
Grand Total 12,056 14,408 14,635 15,107 15,473 16,657 76,280 3,3
Source: HEMIS database accessed, 2017
Table 6-5 shows the proportion of graduates in the Accounting related qualifications by race,
for the years 2004 and 2010-2015. In 2004 doctoral graduates were only coming from Whites
and over the years graduates from other races have been registering their presence. The table
also shows that accounting qualifications in NQF Level 6 and 7 mainly are dominated by Black
Africans whilst those qualifications in NQF Levels 8 to 10 are dominated by Whites.
Table 6-5: Graduate Numbers in Accounting, by race for 2004 and 2010-2015
NQF
Level
Race 2004 2011 2012 2013 2014 2015 Grand Total
10 Black Afri-
can (%)
33,3% - 42,9% 28,6% 27,3% 28,6%
Coloured
(%)
- 25,0% - 14,3% - 4,8%
Indian (%) - - - - 9,1% 2,4%
No Info (%) 16,7% - - - - 4,8%
White (%) 100% 50,0% 75,0% 57,1% 57,1% 63,6% 59,5%
Total 100%
(4)
100%
(6)
100%
(4)
100%
(7)
100%
(7)
100%
(11)
100%
(42)
9 Black Afri-
can (%)
12,3% 21,4% 27,6% 25,0% 30,0% 40,6% 30,1%
Coloured
(%)
3,6% 3,6% 3,8% 5,4% 4,2% 4,3% 4,0%
Indian (%) 13,8% 10,7% 21,0% 8,7% 14,2% 10,9% 12,5%
White (%) 70,8% 64,3% 47,6% 62,0% 50,8% 43,5% 53,4%
Total 100%
(195)
100%
(56)
100%
(105)
100%
(92)
100%
(120)
100%
(138)
100%
(554)

Fasset Sector Survey 2016 FINAL REPORT: 29 September 2017
-124-
NQF
Level
Race 2004 2011 2012 2013 2014 2015 Grand Total
8 Black Afri-
can (%)
16,9% 34,3% 37,4% 40,8% 42,8% 46,3% 39,6%
Coloured
(%)
4,0% 5,9% 6,2% 6,5% 5,2% 5,4% 5,7%
Indian (%) 13,0% 12,1% 10,3% 11,1% 11,7% 10,9% 11,3%
No Info (%) 0,1%
0,1% 1,4% 1,7% 1,9% 1,0%
White (%) 66,1% 47,6% 46,0% 40,1% 38,5% 35,5% 42,3%
Total 100%
(2,407)
100%
(2,344)
100%
(2,314)
100%
(2,593)
100%
(3,058)
100%
(3,355)
100%
(15,915)
7 Black Afri-
can (%)
37,0% 53,8% 57% 56,5% 60,8% 63,5% 57,5%
Coloured
(%)
5,1% 6,3% 5,4% 6,1% 6,1% 6,2% 6%
Indian (%) 13,7% 12,1% 11,3% 11,5% 10,1% 9,9% 10,8%
No Info (%) 0,1% 0,4% 0,6% 0,7% 0,5% 0,6% 0,5%
White (%) 44,1% 27,5% 25,6% 25,3% 23,0% 21,5% 25,2%
Total 100%
(5,123)
100%
(6,516)
100%
(6,494)
100%
(6,784)
100%
(6,935)
100%
(7,656)
100%
(41,135)
6 Black Afri-
can (%)
71,5% 81,1% 79,9% 82,8% 84,6% 87,1% 82,2%
Coloured
(%)
6,7% 6,9% 6,5% 5,4% 5,1% 4,8% 6,2%
Indian (%) 3,6% 4,5% 5,0% 4,5% 5,2% 4,5% 4,8%
No Info (%) - 0,3% 0,7% 0,1% 0,2% 0,0% 0,2%
White (%) 3,6% 7,3% 7,9% 7,2% 4,9% 3,5% 6,5%
Total 100%
(4,326)
100%
(5,487)
100%
(5,719)
100%
(5,632)
100%
(5,321)
100%
(5,372)
100%
(32,830)
Source: HEMIS database accessed, 2017
Table 6-6 shows the breakdown of accounting qualifications by gender, for the years 2004
and 2011-2015. It shows that accounting qualifications in NQF Level 6 to 8 are mainly domi-
nated by females while their male counter parts dominate the NQF levels 9 and 10. The table
also shows that whist it is the case that males dominate qualifications in NQF 9 and 10, the
proportion of females have been increasing rapidly in NQF 9 qualifications when compared to
NQF Level 10. Comparably, the proportion of males increases with the higher level of degrees
such as in Honours degrees than in undergraduate degrees and certificates.
Table 6-6: Graduate Numbers in Accounting for 2004 and 2011-2015, by gender
NQF
Level
Gender 2004 2011 2012 2013 2014 2015 Grand
Total
NQF
10
Female
(%)
50,0% 50,0% 25,0% 14,3% 28,6% 36,4% 33,3%
Male (%) 50,0% 50,0% 75,0% 85,7% 71,4% 63,6% 69,0%

Fasset Sector Survey 2016 FINAL REPORT: 29 September 2017
-125-
NQF
Level
Gender 2004 2011 2012 2013 2014 2015 Grand
Total
Total 100%
(4)
100%
(6)
100%
(4)
100%
(7)
100%
(7)
100%
(11)
100%
(42)
NQF 9 Female
(%)
31.8% 33,9 48,6 51,1 53,3 50,7 48,7
Male (%) 68.2% 66,1 52,4 48,9 46,7 49,3 51,1
Total 100%
(195)
100%
(56)
100%
(105)
100%
(92)
100%
(120)
100%
(138)
100%
(554)
NQF 8 Female
(%)
49,0% 50,9% 52,6 53,2 53,3 54,8 53
Male (%) 51,0%
49,1% 47,5 46,8 46,7 45,2 47
Total 100%
(2,407)
100%
(2,344)
100%
(2,314)
100%
(2,593)
100%
(3,058)
100%
(3,355)
100%
(15,915)
NQF 7 Female
(%)
53,0% 55,6% 56,1% 56,4% 57,9 58,5 56,6
Male (%) 47,0% 44,4% 43,9% 43,8% 42,7 43,9 44,0
Total 100%
(5,123)
100%
(6,516)
100%
(6,494)
100%
(6,777)
100%
(6,926)
100%
(7,601)
100%
(40,905)
NQF 6 Female
(%)
55,6% 60,07% 59,01% 61,04% 60,29 59,83 60,10
Male (%) 44,6% 39,91% 40,97% 38,94% 39,73 40,17 39,90
Total 100%
(4,326)
100%
(5,487)
100%
(5,719)
100%
(5,632)
100%
(5,321)
100%
(5,372)
100%
(32,830)
Source: Calculated from HEMIS database, accessed 2017
6.4.2.2. Graduates in Commerce, Business Management and Business Administra-
tion
Table 6-7 shows that the number of graduates in Commerce, Business Management and
Business Administration5 qualifications at HET level. Generally, the total number of graduates
has been increasing on a yearly basis when compared with the numbers which were produced
in 2004. A total of 116,532 (one hundred and sixteen thousand five hundred and thirty two)
graduates in commerce, business management and business administration qualifications
have been produced between 2011 and 2015. During the same period Advanced Diplomas,
three-year Bachelor’s degrees, undergraduate’s diploma certificates and Honours recorded
the highest number of graduates with 57,000 (fifty seven thousand), 38,868 (thirty eight thou-
sand eight hundred and sixty eight), 25,047 (twenty five thousand and forty seven) and 14,133
5 Business Administration, Management and Operations; Economics; Finance and Financial Manage-ment Services; Business, Economics and Management Studies; Taxation; Management Sciences and Quantitative Methods; International Business; and Entrepreneurial and Small Business Operations.

Fasset Sector Survey 2016 FINAL REPORT: 29 September 2017
-126-
(fourteen thousand one hundred and thirty three) whilst Bachelor of Technology degrees rec-
orded 500 (five hundred) being the lowest number of graduates. On the other hand, graduates
in doctoral studies have shown a significant growth of 23% followed by post graduate di-
ploma/certificates and 4-year Bachelor’s degrees which recorded 12.7% and 10.8% growth.
Graduates in Master’s degrees and 3-year Bachelor’s degrees recorded the lowest growth of
4.7% and 5.4%.
Table 6-7: Graduate numbers in Commerce, Business Management and Business Ad-
ministration qualifications according to NQF level for 2004 and 2011-2015
NQF
Level
Type of Qual-
ification
2004 2011 2012 2013 2014 2015 Grand
Total
Average
growth
rate (%)
10 Doctoral 40 95 111 117 144 193 660 23,0
9 Masters 1,194 2,014 2,095 2,056 2,146 2,211 10,522 4,7
8 Honours 954 2,215 2,261 3,118 3,325 3,214 14,133 8,5
7 1ST Bache-
lor’s Degree
(3 years)
2,645 6,661 6,948 8,181 8,422 8,656 38,868 5,4
1ST Bache-
lor’s Degree
(4 years or
more)
451 683 591 672 757 800 3,503 10,8
Bachelor of
Technology
1,256 2,211 2,261 3,118 3,325 3,214 14,129 9,5
Advanced Di-
ploma
- - - 37 70 393 500 275,3
Total 4,352 9,555 9,800 12,008 12,574 13,063 57,000 7,2
6 PG/DIP/POST
DIP DIP/
CERT
1,116 1,516 1,309 1,737 1,663 7,341 12,7
UG DIP/
CERT (1 or
2years)
51 44 20 42 185 1,538 1,829 213,8
UG DIP/
CERT
(3years)
3,465 4,479 4,609 5,247 5,082 5,630 25,047 8,4
Total 4,231 5,639 6,145 6,598 7,004 8,831 34,217 12,6
Grand Total 10,771 19,518 20,412 23,897 25,193 27,512 116,532 8,5
Source: HEMIS database, accessed 2017
Table 6-8 shows the breakdown of the graduates in Commerce, Business Management and
Business Administration qualifications by race, for the years 2004 and 2011-2015. It shows
that over the period Black Africans have maintained the highest proportion of graduates across
all the qualifications of Commerce, Business Management and Business Administration. Black

Fasset Sector Survey 2016 FINAL REPORT: 29 September 2017
-127-
Africans have shown their strong presence which is also growing in NQF Level 6, 7 and 8
qualifications. In doctoral studies which are designated in NQF Level 10 Black Africans have
increased their proportion from a mere 15% in 2004 to as high as 53.9% whilst the dominance
of Whites have been reduced from as much as 70% in 2004 to 30.1%.
Table 6-8: Graduate numbers in Commerce, Business Management and Business Ad-
ministration qualifications for 2004 and 2011-2015, by race
NQF
Level
Race 2004 2011 2012 2013 2014 2015 Grand
Total
Level
10
Black Afri-
can (%)
15,0% 52,6% 50,5% 41,9% 48,6% 53,9% 49,3%
Coloured
(%)
2,5% 3,2% 1,8% 5,1% 4,9% 3,1% 3,6%
Indian (%) 12,5% 7,4% 4,5% 6,8% 9,7% 8,3% 7,9%
No Info (%) - 1,1% 2,7% 0,9% 2,1% 4,7% 2,6%
White (%) 70,0% 34,7% 38,7% 41,9% 31,9% 30,1% 34,8%
Total 100%
(40)
100%
(95)
100%
(111)
100%
(117)
100%
(144)
100%
(193)
100%
(730)
Level 9 Black Afri-
can (%)
21,8% 43% 45,9% 40,9% 45,9% 48,1% 44,4%
Coloured
(%)
5,1% 5,9% 5,2% 4,7% 5,3% 4,2% 5,1%
Indian (%) 11,2% 10,8% 10,2% 9,5% 8,8% 10,1% 9,9%
No Info (%) - 1,5% 1,8% 2,7% 3,4% 4,3% 2,5%
White (%) 61,9% 35,8% 33,9% 35,1% 30,7% 29,7% 33,2%
Total 100%
(1,194)
100%
(2,077)
100%
(2,165)
100%
(2,213)
100%
(2,282)
100%
(2,287)
100%
(12,915)
Level 8 Black Afri-
can (%)
21,3% 40,1% 43,3% 45,6% 52,3% 51,4% 45,8%
Coloured
(%)
7,3% 5,7% 6,2% 6,1% 6,1% 5,5% 5,8%
Indian (%) 12,6% 9,8% 8,1% 9,9% 9,3% 10,4% 9,7%
No Info (%) 0,1% 0,5% 1,6% 1,8% 1,6% 3,5% 1,8%
White (%) 58,8% 43,8% 40,8% 36,5% 30,7% 29,2% 36,9%
Total 100%
(954)
100%
(2,215)
100%
(2,261)
100%
(3,118)
100%
(3,325)
100%
(3,214)
100%
(16,364)
Level 7 Black Afri-
can (%)
32,5% 51,7% 55,1% 58,2% 59,4% 61,2% 56,8%
Coloured
(%)
6,8% 6,7% 6,8% 6,1% 6,3% 6,0% 6,4%
Indian (%) 12,4% 9,4% 9,4% 9,4% 9,6% 8,4% 9,3%
No Info (%) 0,5% 1,1% 0,8% 0,7% 0,5% 2,0% 1,0%
White (%) 47,2% 31,2% 28,0% 25,6% 24,2% 22,4% 27,0%
Total 100%
(4,352)
100%
(9,556)
100%
(10,119)
100%
(11,761)
100%
(12,017)
100%
(12,629)
100%
(65,420)

Fasset Sector Survey 2016 FINAL REPORT: 29 September 2017
-128-
NQF
Level
Race 2004 2011 2012 2013 2014 2015 Grand
Total
Level 6 Black Afri-
can (%)
71,0% 72,4% 72,1% 77,7% 75,7% 75,9% 74,6%
Coloured
(%)
7,2% 7,4% 6,9% 6,5% 6,8% 6,5% 6,8%
Indian (%) 5,3% 3,5% 3,4% 2,9% 3,2% 3,7% 3,4%
No Info (%) 0,2% 0,4% 0,3% 0,2% 0,2% 0,2% 0,3%
White (%) 16,3% 16,2% 17,3% 12,5% 13,9% 13,6% 14,8%
Total 100%
(4,231)
100%
(5,639)
100%
(6,146)
100%
(6,597)
100%
(7,005)
100%
(8,831)
100%
(39,149)
Source: HEMIS database, accessed 2017
Table 6-9 illustrates the composition of gender mix of students over a period between 2010
and 2015. Results clearly indicates two distinct NQF Level of qualifications where males and
females dominate separately. Females have shown their dominance in first degree and other
post graduate qualifications designated in NQF Level 6 to NQF Level 8 whilst men dominates
in masters and doctoral qualifications in NQF Level 9 to 10. Females have shown their prow-
ess in NQF 6 qualifications with proportions ranging from 53.1% to 58.8% over the entire pe-
riod. Level NQF 7 qualifications has been fluctuating over the period with women constituting
between 48% and 56%. With regard to NQF Level 8 qualifications females have maintained
their dominance over males with the composition ranging from 49.5% to about 53.8%. Results
shows that the number of females who pursue their studies to Masters and doctoral qualifica-
tions which are designated in NQF Level 9 and 10 is very low. The composition of males
ranged between 58.6% and 64.6% in Masters qualifications whilst it also ranged from 66.9%
to 72.8% for doctoral qualifications.
Table 6-9: Graduate numbers in Commerce, Business Management and Business Ad-
ministration qualifications for 2004 and 2011-2015, by gender
NQF
Level
Gender 2004 2011 2012 2013 2014 2015 Grand To-
tal
NQF
10
Female
(%)
35.0% 33,1% 27,2 33,9 30,6 28,1 30,3
Male (%) 65.0% 66,9% 72,8 66,1 69,4 71,9 69,7
Total 100%
(40)
100%
(95)
100%
(111)
100%
(121)
100%
(148)
100%
(196)
100%
(740)
NQF
9
Female
(%)
26.6% 37,9% 36,9 37,7 38,7 41,4 38,1
Male (%) 73.4% 62,1% 63,1 62,3 61,3 58,6 61,9
Total 100%
(1,194)
100%
(2,077)
100%
(2,165)
100%
(2,213)
100%
(2,282)
100%
(2,287)
100%
(12,915)
NQF
8
Female
(%)
47.6% 51,3% 50,6% 51,2 53,8 52,5 51,7
Male (%) 52.4% 48,7% 49,4% 48,8 46,2 47,5 48,3

Fasset Sector Survey 2016 FINAL REPORT: 29 September 2017
-129-
Total 100%
(955)
100%
(2,230)
100%
(2,273)
100%
(3,368)
100%
(3,603)
100%
(3,241)
100%
(16,972)
NQF
7
Female
(%)
49.5% 50,2% 51,9% 55,5% 56,0% 47,6% 48,7%
Male (%) 50.5% 49,8% 48,1% 44,5% 44,0% 52,4% 51,3%
Total 100%
(4,352)
100%
(9,605)
100%
(10,175)
100%
(12,324)
100%
12,569
100%
(12,629)
100%
(66,761)
NQF
6
Female
(%)
53.3% 55,7% 57,6% 53,1% 58,8% 56,6% 57,1%
Male (%) 46.7% 44,3% 42,4% 46,9% 41,2% 43,4% 42,9%
Total 100%
(4,230)
100%
(5,669)
100%
(6,189)
100%
(6,952)
100%
(7,452)
100%
(8,942)
100%
(40,168)
Source: HEMIS database, accessed 2017
Even though students eventually enrol at a university, dropout rates remain high. However,
Van Broekhuizen et al (2016) reported that the dropout rates are not as high as are often
reported, because many students who are reported as “drop-outs” in official university statis-
tics do not leave the university system, but some change their degree program, whilst some
switches from a degree to a diploma or certificate program, or enrol with another university.
Of the 112 000 (one hundred and twelve thousand) learners from the 2008 Matric year who
entered university, about 34 000 (thirty four thousand) or 30% had dropped out before 2014.
The five-year dropout rate was somewhat higher amongst Coloured and Black African stu-
dents (33% and 32%) than amongst Asians and Whites (23% and 17%).
6.5 Development of Professionals
6.5.1. Professional Bodies
Chartered Accountants (CAs) continues to be an important accounting profession supplying
skills to the sector. Of the total pool of professionals, CAs form the largest component. CAs
are considered most important persons with regard to Accounts and Audits as well as ensuring
compliance with rules and regulations. SAICA is responsible for the registration of CAs, train-
ees and management of their training contracts, either in public practice or outside public
practice. However, it is also important to note that not all CAs registered under SAICA are
entirely in the FASSET sector but also takes up financial positions in other sectors of the
economy. The growth in the number of CAs available to the market is shown in Table 6-10. In
2016 there were 41,362 (forty one thousand three hundred and sixty two) CAs registered with
SAICA which increased from 31,602 (thirty one thousand six hundred and two) in 2010 giving
an annual average growth rate of 4.9% over the same period. Table 6-10 also shows that over
the period 2010-2016 an average of 19, 4% of CAs registered with SAICA are leaving abroad.
The proportion CAs living abroad has been on a downward trend from 22, 1% down to 19.3%
in 2010 and 2016 respectively. This is attributed to an increase of people qualifying as CAs
increasing at a higher rate than the CAs living abroad.

Fasset Sector Survey 2016 FINAL REPORT: 29 September 2017
-130-
Table 6-10: Number of Chartered Accountants registered with SAICA: 2010-2016
Year CAs living in South Africa CAs living abroad
N % growth N % of CAs registered with
SAICA and living abroad
2010 31,602 6,5 6,989 22,1
2011 33,167 5,0 7,138 21,5
2012 34,600 4,3 7,215 20,9
2013 36,113 4,4 7,212 20,0
2014 37,834 4,8 7,329 19,4
2015 39,797 5,2 7,731 19,4
2016 41,362 3,9 7,968 19,3
Average 4,9 20,4
Source: Calculated using SAICA statistics, accessed 2017
6.5.1.1. CAs by race
In terms of race as shown in Table 6-11, the data shows that Whites dominate the CA profes-
sion followed by Indians, Black Africans, Coloured and Unknowns with 73,8%; 11,2%; 10.9%;
3,6% and 0,6% respectively. Black Africans have almost doubled their representation from 5,
8% in 2010 to 10, 9% in 2016 while the proportion of Whites has receded from 82, and 6% to
73, 8%.
Table 6-11: CAs by race
Year 2010 2011 2012 2013 2014 2015 2016
Black Af-
rican (%)
5,8% 6,6% 7,2% 7,8% 8,8% 9,8% 10,9%
Coloured
(%)
2,5% 2,6% 2,8% 2,9% 3,1% 3,4% 3,6%
Indian
(%)
8,8% 9,3% 9,7% 10,2% 10,5% 10,9% 11,2%
White (%) 82,6% 81,2% 80,0% 78,6% 77,0% 75,4% 73,8%
Unknown
(%)
0,3% 0,3% 0,4% 0,5% 0,5% 0,6% 0,6%
Total 100% 100% 100% 100% 100% 100% 100%
Source: Calculated using SAICA statistics, accessed 2017
6.5.1.2. CAs by gender
In terms of gender distribution CA as a profession continues to be dominated by males who
constitute about 65%, while females constitute about 35% Figure 6-4. Despite the bias towards
males, females have been making great strides to improve their representation registering a
6% increase over a period 2010-2016.

Fasset Sector Survey 2016 FINAL REPORT: 29 September 2017
-131-
Figure 6-4: CAs by gender
Source: Calculated using SAICA statistics, accessed 2017
6.5.2. Fasset-registered Learnerships
Learnerships are an integral part of skills development as enshrined in the SDA. They equip
learners with short term employment and may be entered into between the employer and
existing employers, as well as between the employer and non-employees. In 2016 a total of
31 (thirty one) learnerships from NQF level 3 to NQF level 8 were registered with Fasset.
Table 6-12 shows the number of people who completed Fasset-registered learnerships in
2016. The total number of learnerships completed was 4,778 (four thousand seven hundred
and seventy eight). The majority (80.7%) of these learnerships were between NQF Level 5
and 8, and most of them led to the qualification Chartered Accountant: Auditing.
29.2% 30.3% 31.5% 32.3% 33.4% 34.4% 35.3%
70.8% 69.7% 68.5% 67.7% 66.6% 65.6% 64.7%
0.0%
10.0%
20.0%
30.0%
40.0%
50.0%
60.0%
70.0%
80.0%
2010 2011 2012 2013 2014 2015 2016
Per
cen
tage
s(%
)
Female
Male

Fasset Sector Survey 2016 FINAL REPORT: 29 September 2017
-132-
Table 6-12: Learnerships completed in 2016
Source: Fasset learnership database, 2016
N %
ACCA Professional Qualification :Chartered Certified Accountant 16
CIS Professional Post-Graduate Qualification: Company Secretarial and Governance Practice 2
Occupational Certificate: Tax Professional 4
Post Graduate Diploma: Professional Accountant in Practice 636
Post-graduate Diploma: General Internal Auditing 17
NQF Level 8 675 14,1
Chartered Accountant: Auditing 2888
Diploma: Technician Internal Auditing 3
Occupational Certificate: Financial Markets Practitioner 10
Post Graduate Professional Qualification: Professional Accountant in Business 65
Professional Qualification: Chartered Management Accountant 3
NQF Level 7 2969 62,1
Certificate: Information Technology: Database Development 3
CIS Professional Qualification: Governance and Administration 2
National Diploma : Financial Markets and Instruments 53
National Diploma: Management Accounting 5
Level 6 63 1,3
Certificate: Accounting 13
Certificate: Certified Accounting Technician 1
Certificate: Office Administration 24
Higher Certificate: Office Administration 15
National Certificate: Banking 15
National Certificate: Business Accounting 34
National Certificate: Generic Management: General Management 8
National Certificate: Information Technology (Systems Development) 2
National Certificate: Information Technology: Systems Support 41
National Diploma: Technical Financial Accounting 1
NQF Level 5 154 3,2
FET Certificate: Bookkeeping 206
FET Certificate: Debt Recovery 65
FETC:Business Administration 26
Further Education and Training Certificate: Accounting Technician 43
Further Education and Training Certificate: Banking 9
Further Education and Training Certificate: Generic Management: General Management 39
Further Education and Training Certificate: Information Technology: End User Computing 45
Further Education and Training Certificate: Information Technology: Technical Support 68
Further Education and Training Certificate: Project Management 19
NQF Level 4 520 10,9
Certificate: Accounting Technician 69
Certificate: Local Government Accounting 50
National Certificate: Bookkeeping 32
National Certificate: Business Administration Services 58
National Certificate: Contact Centre and Business Process Outsourcing Support 8
National Certificate: Information Technology: End User Computing 22
NQF Level 3 239 5,0
National Certificate: Business Administration Services 5
National Certificate: Contact Centre Support 84
NQF Level 2 89 1,9
General Education and Training Certificate: Business Practice 64
General Education and Training Certificate: Hygiene and Cleaning 1
GETC: Domestic Services 4
NQF Level 1 69 1,4
Grand Total 4778 100
CompletedLearnership

Fasset Sector Survey 2016 FINAL REPORT: 29 September 2017
-133-
Table 6-13 shows the number of people who completed Fasset-registered learnerships in
2016, by race group. Black Africans occupy the highest proportion of completed learnerships
followed by Whites, Indians and lastly by Coloureds with 45.5%, 35.5%, 10.7% and 8% re-
spectively. Results also shows that the majority of learnerships in 2016 completed NQF Level
7 followed by NQF Level 8 with NQF Level 6 attaining the least number of learnerships.
Figure 6-5: Learnerships completed in 2016, by race group
Source: Fasset learnership database, 2016
Figure 6-5 shows the number of learners who completed Fasset-registered learnerships in
2016, by gender. Results shows that more females are completing the learnerships than
males. A total of 55.4% of learnerships were completed by females in 2016, with female com-
pletions outnumbering males in NQF levels 2, 3, 4, 5, 7 and 8 qualifications.
48 69 1
60
475
108
42
1083
205
2190
14
17 37
25
22
10
211
44
380
7 3 19
16
21
1
395
48
510
0 0 23
4 3 10
1280
378
1698
0
500
1000
1500
2000
2500
Level 1 Level 2 Level 3 Level 4 Level 5 Level 6 Level 7 Level 8 Total
No
. of
Lear
ner
s
Black African Coloured Indian White

Fasset Sector Survey 2016 FINAL REPORT: 29 September 2017
-134-
Figure 6-5: Learnerships completed in 2016, by gender
Source: Fasset Learnership database, 2016
6.5.3. Fasset interventions at HET level
Fasset has a bursary scheme for tertiary studies. The bursary provides financial support in
respect of tuition fees, textbooks, accommodation, meals and living expenses to students
whose household income is between R123 000.00 and R350 000.00 per annum. It applies to
students entering their first year of study who possess a South African Matric Certificate (or
an evaluated equivalent qualification) in the subjects and with subject grades that are required
by the academic institution (or such equivalent qualification as that the institution may deter-
mine), for undergraduate studies, bursars entering their second or third year of study who
meet the requirements as specified under the “Bursary Continuation, Suspension and Rein-
statement” principles contained in this policy and students studying towards a university or
university of technology (Degree, Diploma and B Tech).
Table 6-14 shows the current Fasset-funded bursars in the system. Bachelor of Commerce
(Accounting) has the largest number of students, with 69.8% receiving bursars from Fasset
than any other degree with Non-Accounting Bachelor of Commerce having 29.3% of students.
The table also shows that the majority of the students being assisted through Fasset Bursars
are either in their third or fourth year accounting for 43.4 %and 35.1 respectively with first years
only accounting for 0.8 %clearly showing a scaling down of this from of assistance to students.
32 61
182
302
8227
1566
397
2649
37 28 57
218
72 36
1403
278
2129
0
500
1000
1500
2000
2500
3000
Level 1 Level 2 Level 3 Level 4 Level 5 Level 6 Level 7 Level 8 Total
Per
cen
tage
s(%
)
Female
Male

Fasset Sector Survey 2016 FINAL REPORT: 29 September 2017
-135-
Table 6-14: Fasset-funded bursars
Study Discipline 1st
year
2nd
year
3rd
year
4th
year
Grand
Total
Percent-
ages (%)
Bachelor of Commerce (Ac-
counting)
45 55 69 169 69,8%
Bachelor of Commerce (Ac-
counting &Insurance)
1
1 0,4%
Bachelor Commerce (Business
Management & Accounting)
1
1 0,4%
*Bachelor of Commerce (Non-
Accounting)
2 5 48 16 71 29,3%
Grand Total 2 50 105 85 242 100%
Percentages (%) 0,8% 20,7% 43,4% 35,1% 100%
Source: Fasset database (2016)
*Non-Accounting refers to Bachelor of Commerce degrees in the following (Banking Manage-
ment, Economics, Business Management, Human Resource Management); Mathematical
Statistics; Investment Management; Bachelor of Education and Bachelor of Recreation and
Sports Management
6.6 Conclusion
This chapter focused primarily on understanding the value chain of the skills supply to the
Fasset sector. This pipeline includes basic education, the TVET sector, universities, profes-
sional bodies and WTPs. The main source of data for this chapter was secondary data from
HEMIS, Fasset databases, DHET, SAQA and other official sources.

Fasset Sector Survey 2016 FINAL REPORT: 29 September 2017
-136-
7 SKILLS DEMAND & SKILLS SHORTAGES
7.1 Introduction
Having profiled the employers in the sector and the people working in it, this chapter focuses
primarily on understanding the demand for skills as well as occupation-specific skills shortages
in the sector. The issue of critical skills gaps in the sector will also be addressed.
7.2 Extent and Nature of Demand
One of the sections in the survey of employers asked about organisations’ demand for skills
in the future. Demand for skills refers to the employers’ needs for skills. A combination of data
from the survey and the WSP submissions will be used in this section as they are deemed to
complement each other.
7.2.1. Changes in employment
Employers were asked if the total number of people employed by their organisation had
changed at all over the last two years. Figure 7-1 shows that the majority of organisations
(62%) have not experienced any changes whilst about 22% experienced an increase in their
employment levels with the remainder having experienced a decrease.
Figure 7-1: Changes in employment in the last 2 years
Source: Sector Survey (2016)
Further analysis on organisations whose employment levels had changed is shown in Figure
7-2 which reveals that the majority of organisations (62% or 63%) either increased or de-
creased their employment levels by 10 % respectively. This was followed by between 15%
and 17 % of the organisations whose employment levels increased or decreased by 11, 20%.
Very few organisations experienced changes in employment levels in excess of 40%.
Decrease16%
Increase22%
No change62%
Decrease
Increase
No change

Fasset Sector Survey 2016 FINAL REPORT: 29 September 2017
-137-
Figure 7-2: Changes in employment (percentage) in the last 2 years
Source: Sector Survey (2016)
7.2.1.1. Reasons for changes in employment
Figure 7-3 reveals the main reasons for the changes (or no changes) in employment levels.
Growth in business volume is the main factor in driving the change in the employment in the
sector. This was cited by 20% of the employers which implies that growth in business volume
has a huge direct bearing on the number of jobs created in the sector than any other factor.
Other factors which were reported are business problems, difficulties in finding the appropri-
ately finding the experienced and skilled people and these were reported by 5.9%, 5, 4% re-
spectively. Only a few companies 0.3% however cited that changes in employment growth is
caused by organic growth of their business entities.
62%
15%
6%3%
7%
1%
5%
63%
17%
9%
6%
2% 1% 1% 1%
0%
10%
20%
30%
40%
50%
60%
70%
1-10% 11-20% 21-30% 31-40% 41-50% 51-60% 61-70% 81-90% 91-100%
% o
f o
rgan
isat
ion
s
Decrease Increase

Fasset Sector Survey 2016 FINAL REPORT: 29 September 2017
-138-
Figure 7-3: Reasons for change in employment (%)
Source: Sector Survey (2016)
7.2.1.2. Expectations for employment growth
Table 7-1 shows employers’ expectations regarding their employment numbers over the next
5 (five) years. The table reveals that most employers expect employment in the sector to in-
crease (48, 9%) or remain the same (42.9%). Results shows that only 11, 4% of the employers
were pessimistic about the sector as they expect the employment levels in the sector to de-
crease. Investment Entities and Trusts and Company Secretary Services is the sub-sector
which had majority of employers (54,5%) expecting no change in the employment levels while
majority of employers in the Development Organisations (62.5%) expects the employment
levels to increase.
Table 7-1: Expectations in employment by sub-sector
Subsector
Decrease
(%)
No change
(%)
Increase
(%)
Investment Entities and Trusts and Company
Secretary Services - 54,5 45,5
Stockbroking and Financial Markets 3,8 50,0 46,2
Development Organisations - 37,5 62,5
Accounting, Bookkeeping, Auditing and Tax Ser-
vices 4,5 47,1 48,4
Business and Management Consulting Services 5,6 50,0 44,4
Activities Auxiliary to Financial Intermediation 10,0 50,0 40,0
SARS and Government Departments 33,3 11,1 55,6
Average 11.4 42.9 48.9
Source: Sector Survey (2016)
0.3%
0.1%
0.4%
0.4%
0.4%
2.8%
5.4%
5.9%
20.0%
3.5%
0.0% 5.0% 10.0% 15.0% 20.0% 25.0%
Moving to a new business environment
No organic growth
Resignations
Internal strategies
Automation/Technology
Labour-related problems e.g. find it difficult to discharge…
Difficult to find appropriately experienced and skilled…
Business problems (decrease in business)
Growth in business volume (increase in business)
Restructuring of multiple organisations ( e.g. mergers,…
Percentage(%)

Fasset Sector Survey 2016 FINAL REPORT: 29 September 2017
-139-
7.2.1.3. Increases in employment by occupational category
Table 7-2 shows the proportions of employers who expect increases in employment numbers
in certain occupational categories. Employment in Professionals is expected to grow by 45, 4
% of the employers followed by Technicians & Associate Professionals (43, 6%) and Clerical
Support Workers (42, 5%). The main change drivers which were given for growth in Profes-
sionals are demand for more skilled employees, growth of business, succession plans, diver-
sity in business and increased statutory compliance and opportunities. On the other hand,
Service and Sales Workers is the occupational category which is least expected to have its
employment levels increase by the employers.
Table 7-2 Employment increases by occupational category
Occupational
category
% of employers Main reason/s for expected increase
Managers 26,0 Growth of business, addition of more skills, employ-
ment too high, finance, huge gap between owner
and trainees, increase in employees, increased leg-
islative compliance, promotion, restructuring of or-
ganisational structure and retirement
Professionals 45,4 Demand for more skilled employees, growth of busi-
ness, succession plans, business diversity, increase
in employees, increased statutory compliance and
opportunities
Technicians &
Associate Pro-
fessionals
43,6 Growth of business, Demand for more skilled em-
ployees, increase in employees through hiring or
promotions, new recruit plans and recruitment.
Clerical Support
Workers
42,5 Growth of business, demand for more skilled em-
ployees, compliance demands, economy, retirement
Service & Sales
Workers
18,3 Demand for more skilled employees and growth of
business
Source: Sector Survey (2016)
7.2.1.4. Increases in employment by OFO code
Table 7-3 shows the occupations which employers advised will specifically increase. About
19, 1% of employers expected Accounting in Practice to increase, 14, 7% in Accountant/ Char-
tered Accountant, 13, 2% in General Clerk and Accounts Clerk and 8% in Managers. The least
expected occupations to increase by the employers are Audit managers, Corporate General
Managers, Head of IT, and SAICA Trainees which were only cited by 1.5% of employers.

Fasset Sector Survey 2016 FINAL REPORT: 29 September 2017
-140-
Table 7-3: Increases in employment by OFO code
Occupation OFO CODE Percentage (%) of organisa-
tions
Accounting in Practice 241106 19,1
Accountant/Chartered Accountant 241101 14,7
General Clerk 411101 13,2
Accounts Clerk 431101 13,2
Manager 133102 8,8
Actuary 212101 4,4
Business Analyst 241301 2,9
Accounting Technician 331302 2,9
Receptionist 422601 2,9
Audit manager 121104 1,5
Corporate General Manager 121901 1,5
Head of IT 133105 1,5
Trainee (Accountant) 241101 1,5
Accountant (General) 241101 1,5
Management Accountant 241102 1,5
SAICA Trainees 241104 1,5
ICT Professional 251101 1,5
Database Administrator 252101 1,5
Bookkeepers 331301 1,5
Portfolio Managers 333907 1,5
Debt Collector 421401 1,5
Auditor 241104 0
Source: Sector Survey (2016)
7.2.2. Professional bodies’ views on the demand for skills in the sector
Professional bodies were asked about their views on the future demand for skills. Table 7-4
shows the 3 (three) skills which each professional body believed would be in highest demand
by the sector’s employers in the next 5 (five) years.
Table 7-4 Skills most in demand in the next 5 years
Professional Body 1st skill in demand 2nd skill in de-
mand
3rd skill in de-
mand
The Association for the Ad-
vancement of Black Ac-
countants of Southern Af-
rica (ABASA)
Management &
leadership skills
Application skills &
integrated thinking
abilities
Business commu-
nication skills &
professional con-
duct
(work-readiness)

Fasset Sector Survey 2016 FINAL REPORT: 29 September 2017
-141-
Professional Body 1st skill in demand 2nd skill in de-
mand
3rd skill in de-
mand
The Association of Ac-
counting Technicians
(AATSA)
Business commu-
nication skills &
professional con-
duct
(work-readiness)
Application skills &
integrated thinking
abilities
Business acumen
The Association of Certi-
fied Fraud Examiners,
South Africa Chapter
(ACFESA)
Enquiring & analyt-
ical skills
Cyber skills Counter-surveil-
lance skills
The Association of Char-
tered Certified Account-
ants (ACCA)
Business commu-
nication skills &
professional con-
duct
(work-readiness)
Application skills &
integrated thinking
abilities
Project manage-
ment skills
Chartered Institute of Man-
agement Accountants
(CIMA)
Application skills &
integrated thinking
abilities
Business commu-
nication skills &
professional con-
duct
(work-readiness)
Public sector
knowledge
Chartered Secretaries
Southern Africa (CSSA)
Business commu-
nication skills &
professional con-
duct
(work-readiness)
Ethics Combination skills
(technical, busi-
ness & soft skills)
The Institute of Accounting
and Commerce (IAC)
Management skills
(both people & pro-
ject management)
New technology Combination skills
(technical, busi-
ness & soft skills)
The Institute of Certified
Bookkeepers (ICB)
Business commu-
nication skills &
professional con-
duct
(work-readiness)
Numeracy skills Application skills &
integrated thinking
abilities
The Institute of Certified
Bookkeepers and Account-
ants (ICBA)
Business commu-
nication skills &
professional con-
duct
(work-readiness)
Numeracy skills Application skills &
integrated thinking
abilities
The Institute of Internal Au-
ditors South Africa (IIASA)
Application skills &
integrated thinking
abilities
Business commu-
nication skills &
professional con-
duct
(work-readiness)
Combination skills
(technical, busi-
ness & soft skills)

Fasset Sector Survey 2016 FINAL REPORT: 29 September 2017
-142-
Professional Body 1st skill in demand 2nd skill in de-
mand
3rd skill in de-
mand
The South African Institute
of Chartered Accountants
(SAICA)
New technology,
including data ana-
lytics
Critical thinking
skills
Emotional intelli-
gence
The South African Institute
of Professional Account-
ants (SAIPA)
New technology Critical thinking
skills
Application skills &
integrated thinking
abilities
The South African Institute
of Stockbrokers (SAIS)
Application skills &
integrated thinking
abilities
Business commu-
nication skills &
professional con-
duct
(work-readiness)
Ethics
The South African Institute
of Tax Professionals
(SAIT)
Critical thinking
skills
Business commu-
nication skills &
professional con-
duct
(work-readiness)
Application skills &
integrated thinking
abilities
The Southern African Insti-
tute for Business Account-
ants (SAIBA)
Application skills &
integrated thinking
abilities
Financial skills on
lower NQF levels
Critical thinking
skills
The Southern African Insti-
tute of Government Audi-
tors (SAIGA)
Ethics Business commu-
nication skills &
professional con-
duct
(work-readiness)
Public sector
knowledge
Source: Sector Survey (2016)
Table 3.4 above shows that the 5 (five) most prominent skills in demand as advised by the 16
(sixteen) professional bodies are:
application skills & integrated thinking abilities;
business communication skills & professional conduct (work-readiness);
critical thinking skills;
public sector knowledge; and
combination skills (technical, business & soft skills).
7.2.2.1. Technology
The impact of the advances in technology on skills demand were mentioned by 7 (seven)
professional bodies during interviews. The transformation from manual to automated pro-
cessing will likely result in the loss of some jobs in the financial services industry, but questions
remain regarding the real impact and which categories of professionals will be affected the
most. While there may be a loss seen in some jobs, one of the CEOs interviewed cited a report
published in 2015 by RMIT University and Chartered Accountants Australia and New Zealand
called “Future proofing the profession: preparing business leaders and finance professionals

Fasset Sector Survey 2016 FINAL REPORT: 29 September 2017
-143-
for 2025” which concluded that there will be a major growth in ‘interaction jobs’, a direct effect
of increasing automation. These are jobs that cannot easily be outsourced or automated be-
cause people in these roles require high levels of analytical skills, reasoning and judgement.
As already mentioned under the section on critical skills gaps, the ability to manage non-rou-
tine tasks and be strong in creative problem-solving will become increasingly important to the
sector.
It is generally believed, however, that not just new graduates will need to up-skill, but also
established financial professionals. Upskilling is a considerable challenge and that is where
professional bodies play a major role – in the provision of relevant lifelong learning. However,
most professional bodies were in agreement that it is difficult to understand exactly how each
of the different professions will need to adapt to imminent technologies. As will be seen in a
later section of this chapter, professional bodies are aware of this already-very-familiar narra-
tive regarding technology, and ideally now need comprehensive research to be undertaken
which can explain in detail how the researchers and developers’ innovations are expected to
disrupt the sector and affect its professions. Their comments expressed the need to prepare
timeously for what the future financial professional needs to look like and be skilled in.
7.2.2.2. Work-readiness
One of the professional bodies’ biggest concerns was how unprepared graduates are for the
world of work, from general business communication skills to appropriate attire and conduct,
as well as considerable lack of confidence which hampers an individual’s ability to take initia-
tive, even to ask for assistance when needed. Both employers and professional bodies made
reference to the effectiveness of the work-readiness program that Fasset used to fund, and
some expressed a desire to see the SETA returning funding to the initiative again. In addition
to these programs leading to more well-rounded workers, it was also believed that increased
levels of self-confidence and assertiveness would likely lead to increased productivity in the
workplace.
7.2.2.3. Soft skills
The lack of application skills with integrated thinking ability, together with critical thinking skills,
were the soft skills of most concern to professional bodies, and mentioned by almost all of
them. Discussions around mitigating the issue involved facilitating conversations with educa-
tion and training institutions to introduce a more integrated way of teaching and assessing
learners, as well as workshops and using the platform of work-readiness programs. Other soft
skills of concern included negotiation, decision-making, management skills and ethics – all of
which could be developed during workshops. One of the professional bodies cautioned that
one workshop alone in one of these areas would not adequately develop the particular skill –
it was emphasised that refresher courses would be needed to embed the learnings and de-
velop the skill robustly.
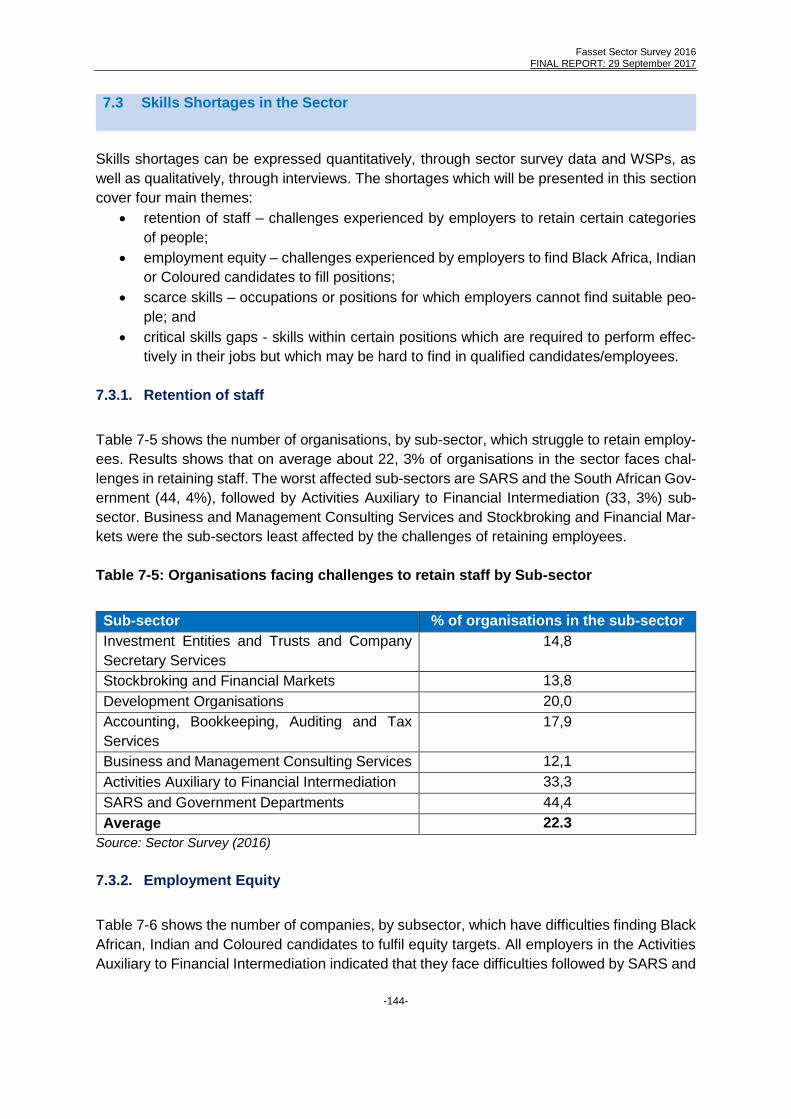
Fasset Sector Survey 2016 FINAL REPORT: 29 September 2017
-144-
7.3 Skills Shortages in the Sector
Skills shortages can be expressed quantitatively, through sector survey data and WSPs, as
well as qualitatively, through interviews. The shortages which will be presented in this section
cover four main themes:
retention of staff – challenges experienced by employers to retain certain categories
of people;
employment equity – challenges experienced by employers to find Black Africa, Indian
or Coloured candidates to fill positions;
scarce skills – occupations or positions for which employers cannot find suitable peo-
ple; and
critical skills gaps - skills within certain positions which are required to perform effec-
tively in their jobs but which may be hard to find in qualified candidates/employees.
7.3.1. Retention of staff
Table 7-5 shows the number of organisations, by sub-sector, which struggle to retain employ-
ees. Results shows that on average about 22, 3% of organisations in the sector faces chal-
lenges in retaining staff. The worst affected sub-sectors are SARS and the South African Gov-
ernment (44, 4%), followed by Activities Auxiliary to Financial Intermediation (33, 3%) sub-
sector. Business and Management Consulting Services and Stockbroking and Financial Mar-
kets were the sub-sectors least affected by the challenges of retaining employees.
Table 7-5: Organisations facing challenges to retain staff by Sub-sector
Sub-sector % of organisations in the sub-sector
Investment Entities and Trusts and Company
Secretary Services
14,8
Stockbroking and Financial Markets 13,8
Development Organisations 20,0
Accounting, Bookkeeping, Auditing and Tax
Services
17,9
Business and Management Consulting Services 12,1
Activities Auxiliary to Financial Intermediation 33,3
SARS and Government Departments 44,4
Average 22.3
Source: Sector Survey (2016)
7.3.2. Employment Equity
Table 7-6 shows the number of companies, by subsector, which have difficulties finding Black
African, Indian and Coloured candidates to fulfil equity targets. All employers in the Activities
Auxiliary to Financial Intermediation indicated that they face difficulties followed by SARS and

Fasset Sector Survey 2016 FINAL REPORT: 29 September 2017
-145-
Government (75%). Accounting, Bookkeeping, Auditing and Tax Services is the only sub-sec-
tor which had the least number (27, 3%) of organisations facing these difficulties in retaining
Black African, Indian and Coloured.
Table 7-6: Organisations struggling to retain Black African, Indian and Coloured by
Sub-sector
Sub-sector % of organisations in the sub-sector
Investment Entities and Trusts and Company
Secretary Services
46,2
Stockbroking and Financial Markets 50,0
Development Organisations 50,0
Accounting, Bookkeeping, Auditing and Tax Ser-
vices
27,3
Business and Management Consulting Services 40,0
Activities Auxiliary to Financial Intermediation 100,0
SARS and Government Departments 75,0
Average 55,5
Source: Sector Survey (2016)
Table 7-7 shows challenges faced by Organisations in retaining Black Africa, Indian and Col-
oured by occupations. Most organisations in the sector indicated that occupational categories
such as Managers, Professionals, Technicians and Associate Professionals and Clerical
Workers find it difficult to meet employment equity because of Lack of Black African people
who have suitable qualifications to occupy those positions. Some employers also indicated
that Black African people lack academic/technical skills and some demand high salaries which
most organisations cannot afford. Difficulties in retaining black professionals clearly indicates
that there is an overall shortage in the market. The fact that most organisations are not able
to meet salary demands of professionals is the main reason for their inability to retain staff.
This also reaffirms the overall shortages of skills in the market.
Table 7-7: Challenges faced by Organisations in retaining Black Africa, Indian and Col-
oured by occupations
Occupation Lack of
Black
African
people
with
suita-
ble
qualifi-
cations
Lack of
aca-
demic/
technical
skills i.e.
skills ob-
tained
during
studies
Lack of
basic/ ge-
neric/ trans-
ferable
skills e.g.
IT, team-
work, prob-
lem solving,
soft skills
Lack of
rele-
vant
experi-
ence
Afforda-
bility
(salary
de-
mands
of appli-
cants)
People do
not want to
work out-
side urban
areas (big
cities)
Managers 35,7 10,7 6,0 7,1 15,5 6,0
Professionals 33,3 19,0 8,3 8,3 17,9 4,8

Fasset Sector Survey 2016 FINAL REPORT: 29 September 2017
-146-
Occupation Lack of
Black
African
people
with
suita-
ble
qualifi-
cations
Lack of
aca-
demic/
technical
skills i.e.
skills ob-
tained
during
studies
Lack of
basic/ ge-
neric/ trans-
ferable
skills e.g.
IT, team-
work, prob-
lem solving,
soft skills
Lack of
rele-
vant
experi-
ence
Afforda-
bility
(salary
de-
mands
of appli-
cants)
People do
not want to
work out-
side urban
areas (big
cities)
Technicians
and Associ-
ate Profes-
sionals
15,5 16,7 9,5 7,1 14,3 3,6
Clerical Sup-
port Workers
13,1 9,5 8,3 10,7 6,0 1,2
Service and
Sales Work-
ers
3,6 1,2 1,2 1,2 1,2 1,2
Skilled Agri-
cultural, For-
estry, Fish-
ery, Craft and
Related
Trades Work-
ers
- - - - 1,2 1,2
Plant and Ma-
chine Opera-
tors and As-
semblers
- - - - 1,2 1,2
Elementary
Occupations
1,2 - - 2,4 1,2 1,2
Source: Sector Survey (2016)
Table 7-8 shows other challenges in retaining Black African, Indian and Coloured employees
are because they lack adequate qualifications and skills, in some instances the location of the
work place is not attractive and that they often have unrealistic salary expectations.
Table 7-8: Other Challenges faced by Organisations in retaining Black Africa, Indian
and Coloured by occupations
Challenges % of employers
Not enough qualification and skills (HDI) 14,3
Attractiveness of the place 7,1
High turnover/ resign High turnover/ resign 3,6

Fasset Sector Survey 2016 FINAL REPORT: 29 September 2017
-147-
Challenges % of employers
Unrealistic salary expectations 6,0
Lack of mentorship/ awareness/ career guidance and counselling 3,6
Other challenges mentioned too few people, and they often get head-hunted with higher salaries
1,2
Few people in administration especially men 1,2
Difficulty in passing exams 1,2
Source: Sector Survey (2016)
Figure 7-4 shows the number of companies which have positions for which they struggle to fill
with Black African candidates. The figure shows that about 79% of organisations in the sector
are finding it difficult to fill in the positions with Black African candidates.
Figure 7-4: Organisations struggling to fill positions with Black African
Source: Sector Survey (2016)
Table 7-9 presents the occupations for which companies struggle to fill with Black African
candidates. The table shows that Trainee Accountants, Chartered Accountants and Managers
are the occupations which organisations in the sector are finding it difficult to fill with Black
Africans. About 20% of the organisations reported that they are struggling to fill Trainee Ac-
countants with Black African followed by Chartered Accountants (18%) and Managers (13%).
Table 7-9: Occupations which organisations struggle to fill with Black African
Occupation / Position % of employers
Trainee Accountant 19,8
Chartered Accountant 18,2
Manager 13,2
21.1%
78.9%
No
Yes

Fasset Sector Survey 2016 FINAL REPORT: 29 September 2017
-148-
Occupation / Position % of employers
Audit Manager 6,6
Financial Manager 5,8
Accounts Clerk/ Articled clerk 5,8
Investment Analyst 4,1
Economist 3,3
General Clerk 3,3
Bookkeepers 3,3
Auditors 3,3
ICT Professional 2,5
Principals/ Associate 2,5
Portfolio managers 2,5
Senior accountants - 3rd year practical 2,5
Credit Risk Analyst 1,7
Business Analyst 1,7
Equity Analysts 1,7
Financial Analyst 1,7
Research Analyst/ (in investments) 0,8
Stock Broker 0,8
Actuary 0,8
Tax Practitioner 0,8
Agricultural economist 0,8
Audit clerks 0,8
Boiler making 0,8
Business Development Manager 0,8
CA Managers 0,8
Call centre manager 0,8
CIMA Trainee 0,8
Client Advisors 0,8
Communications & Business development dept head 0,8
Corporate Finance Executive 0,8
Deputy Technical Department Head 0,8
Diesel Mechanics 0,8
Equity Trader/Dealer 0,8
Executive Assistants 0,8
Procurement Manager- Supply Chain Management 0,8
Property admin staff 0,8
Qualifications Project Manager 0,8

Fasset Sector Survey 2016 FINAL REPORT: 29 September 2017
-149-
Occupation / Position % of employers
Sales Representatives 0,8
Senior Managers 0,8
Research Analyst 0,8
Source: Sector Survey (2016)
Most organisations indicated that lack of Black Africans with suitable qualifications (67%); lack
of academic/ technical skills obtained during studies (55%); high salary demands from appli-
cants (46%); lack of relevant experience (34%) and lack of basic/ generic /transferrable skills
such as IT, teamwork, problem solving, soft skills etc. are the main the reasons they are not
able to hire Black Africans to fill their positions in the current vacancies. See Figure 7-5 below.
Figure 7-5: Reasons why organisations do not fill with Black African
Source: Sector Survey (2016)
7.3.3. Scarce skills
Scarce occupations are defined as occupations which take 3 (three) months or more to find a
candidate with suitable work experience, qualifications and attributes at current wage levels.
Scarce skills are usually caused by one of two factors:
absolute scarcity – this relates to suitably skilled people who are not available in the
country’s labour market. Reasons could include a lack of interest from learners to pur-
sue certain occupations, and globalization which is attracting our highly skilled individ-
uals abroad; and.
relative scarcity – this relates to a sufficient level of suitably skilled people in the coun-
try, but employers struggle to attract them:
0.8%
4.1%
5.8%
14.9%
19.8%
21.5%
33.9%
33.9%
46.3%
54.5%
66.9%
0.0% 10.0% 20.0% 30.0% 40.0% 50.0% 60.0% 70.0% 80.0%
Discrimination at work
Lack of commitment
Lack of exposure
Lack of mentors in the organisation to guide new staff
Labour laws make it difficult to discharge incompetent…
People do not want to work outside urban areas (big…
Lack of the relevant experience
Lack of basic/generic/transferable skills e.g. IT,…
Affordability (salary demands of applicants)
Lack of academic/technical skills i.e. skills obtained…
Lack of Black African people with suitable qualifications
Percentage(%)

Fasset Sector Survey 2016 FINAL REPORT: 29 September 2017
-150-
o geographic location - many of the Fasset employers are situated in urban ar-
eas, which may not produce the talent required in more rural areas, and which
employers may also struggle to attract from elsewhere. This could lead to the
need to incentivise candidates with high salaries; and
o industry/subsector attractiveness – some employers may believe that the sec-
tor (or a particular subsector) does not attract skills.
Table 7-10 shows the number of organisations experiencing difficulties to fill vacancies. On
average 49, 5% of the organisations in the sector reported that they find it difficult to fill some
vacancies. SARS and Government Departments, Activities Auxiliary to Financial Intermedia-
tion, Stockbroking and Financial Markets and Investment Entities and Trusts and Company
Secretary Services had majority of organisations in their sub-sectors having difficulties in filling
vacancies. Development Organisations had the least number of organisations (20%) having
difficulties.
Table 7-10: Organisations with difficulties to fill vacancies by sub-sector
Sub-sector % of organisations in the sub-sector
Investment Entities and Trusts and Company
Secretary Services
53,8
Stockbroking and Financial Markets 55,6
Development Organisations 20,0
Accounting, Bookkeeping, Auditing and Tax
Services
43,1
Business and Management Consulting Ser-
vices
45,6
Activities Auxiliary to Financial Intermediation 58,3
SARS and Government Departments 70,0
Average 49,5
Source: Sector Survey (2016)
7.3.3.1. Occupational vacancies
Analysis in this section will be based on survey findings together with the analysis of the WSP
submissions which were made by organisations in the sector. Table 7-11 shows proportions
of top ten vacancies by OFO code occupations. Results shows that many Professional occu-
pations are mainly in short supply when compared to other occupations. Accounting in Prac-
tice (14, 3%), Auditors (12%) and Investment Analysts (12%) were the main occupations which
are vacant and expected to be filled. Some of the occupations which are in the top 10 (ten)
are Managers (11,1%), Tax Specialists (7,6%), Accountant/ Chartered Accountant (7,1%) and
Accounting Technician (7,1%) whist the smallest occupation in terms of vacancies were Busi-
ness Analysts.

Fasset Sector Survey 2016 FINAL REPORT: 29 September 2017
-151-
Table 7-11: Occupations for which skills shortages are experienced by employers in
the sector
Main Occupation cate-gory
OFO code Occupation Percentage of vacan-cies (forecast) (%)
Managers 133102 Manager 11,1%
Professionals 241106 Accountant in practice 14,3%
241104 Auditor 12,0%
241201 Investment Analyst 12,0%
251101 ICT Systems Analyst 5,5%
241103 Tax specialist 7,6%
241101 Accountant/Chartered Accountant
7,1%
241301 Business Analyst 2,5%
Technicians and As-sociate Professionals 331302 Accounting Technician
7,1%
Clerical Support 431101 Accounting clerk
4,1%
Source: Sector Survey (2016)
Table 7-12 shows the managerial occupations for which skills shortages are experienced by
employers in the sector as reported in the WSP submissions. Finance Managers, Managers
and Senior Managers are the main Managerial occupations which employers reported to have
skills shortages. Most of these vacancies are for specialist positions which requires a combi-
nation of qualification, skill and experience e.g. postgraduate commerce or finance qualifica-
tions with business development experience and knowledge of asset management and invest-
ments. Technical and management skills and experience are very important requirements for
most positions on this level.
Table 7-12: Managerial occupations for which skills shortages are experienced
Occupation OFO code *Number of vacancies (fore-cast)
121101 Finance Manager 339
122201 Manager 110
122201 Senior Manager 56
143901 Facilities Manager 17
133105 Information Technology Manager 16
142103 Retail Manager (General) 10

Fasset Sector Survey 2016 FINAL REPORT: 29 September 2017
-152-
Occupation OFO code *Number of vacancies (fore-cast)
6Other for managers 92
Total 640
Fasset WSP database, 2016. *Only occupations with 10 or more vacancies
Table 7-13 shows the technician and associate professional occupations for which skills short-
ages are experienced by employers in the sector. Of the 2,633 (two thousand six hundred and
thirty three) professional scarce-skill vacancies reported, the top 5 (five) were Financial Ac-
countants (363 (three hundred and sixty three)); Management Accountants (348 (three hun-
dred and forty eight)); Mathematicians (334 (three hundred and thirty four)), Software Devel-
opers (332 (three hundred and thirty two)); Analysts (170 (one hundred and seventy)); Char-
tered Accountants/ Accountant General (129 (one hundred and twenty nine)) and External
Auditors (104 (one hundred and four)). Some organisations indicated that qualified people
were quickly recruited by the Big Four audit firms who are able to offer these professional
competitive salaries. Small firms and those that are located outside the main metropolitan
areas regard themselves as being at a disadvantage when it comes to the recruitment of pro-
fessionals. Many of the professional vacancies that organisations had difficulties in filling re-
quire a combination of tertiary (often postgraduate) qualifications, professional registration and
work-related skills. Some of these vacancies necessitate specialised knowledge in fields other
than finance e.g. law, IT and engineering. Although general skill shortages were reported, a
lack of availability of Black Africans with suitable qualifications and relevant experience, was
stated throughout the survey. As a result of these shortages, fierce competition exists among
organisations for the small pool of skilled black people in the market. Exorbitant salary de-
mands made by black professionals is one of the results of this competition and it was specif-
ically mentioned by several of the respondent organisations.
Table 7-13: Professional occupations for which skills shortages are experienced
Occupation OFO code *Number of vacancies (fore-cast)
241107 Financial Accountant 363
241102 Management Accountant 348
212102 Mathematician 334
251201 Software Developer 332
242202 Analyst 170
6 Others for Managers refers to Financial Markets Business Manager; Elected Official; Corporate General Manager; Compen-
sation and Benefits Manager; Director (Enterprise / Organisation); Project Managers; Customer Service Manager; Business Re-covery Consultant/ Managers; General Manager Public Service; Supply and Distribution Manager; Program or Project Manager; Sales Manager; Application Development Manager; Company secretary; Financial Manager; Quality Assurance Analyst (Comp; Sales and Marketing Manager ; Director of Marketing; ICT Project Manager; Work Force Management; General Secretary; Credit Manager; Human Resources; Business Training Manager; Corporate Services Manager; Project Managers: Infrastructure De-velopment; Business Development Manager; Marketing Management; Client Services; Research and Development Manager; and Call or Contact Centre Manager

Fasset Sector Survey 2016 FINAL REPORT: 29 September 2017
-153-
Occupation OFO code *Number of vacancies (fore-cast)
241101 Chartered Accountant/Accountant (Gen-eral)
129
241104 External Auditors 104
242102 Organisation and Methods Analyst 100
212101 Actuary 61
242211 Internal Auditor 42
241106 Accountant in Practice 36
242202 Senior Analyst 34
242210 Business Administrator 32
242102 Performance Improvement Consulting 22
251202 IT 22
241103 Tax Professional 21
241103 Tax Professional 20
243403 Computer Software Support Consultant 20
241301 Financial Investment Advisor 18
241201 Investment Analyst 16
242208 Organisational Risk Manager 15
252901 Security Administrator 15
242202 Senior Risk Analyst 14
226302 Professionals 13
242207 Compliance Officer 13
252201 Systems Administrator 13
241203 Investment Financial Services 12
242202 Policy Analyst 12
252901 ICT Security Specialist 12
242101 Financial Systems Advisor 11
7Other for professional
Total 2633
Fasset WSP database, 2016. *Only occupations with 10 or more vacancies
Table 7-14 shows the Technicians and Associate Professional occupations for which skills
shortages are experienced by employers in the sector.
7 Other for Professional refers to Financial Markets Business Manager; Elected Official; Corporate General Manager; Compen-sation and Benefits Manager; Director (Enterprise / Organisation); Project Managers; Customer Service Manager; Business Re-covery Consultant/ Managers; General Manager Public Service; Supply and Distribution Manager; Program or Project Manager; Sales Manager; Application Development Manager; Company secretary; Financial Manager; Quality Assurance Analyst (Comp; Sales and Marketing Manager ; Director of Marketing; ICT Project Manager; Work Force Management; General Secretary; Credit Manager; Human Resources; Business Training Manager; Corporate Services Manager; Project Managers: Infrastructure De-velopment; Business Development Manager; Marketing Management; Client Services; Research and Development Manager; Call or Contact Centre Manager; Accounting Officer; Tax Consultant; Project Accountant; Compliance Officer; etc.

Fasset Sector Survey 2016 FINAL REPORT: 29 September 2017
-154-
Table 7-14: Technicians and Associate Professional occupations for which skills short-
ages are experienced
Occupation OFO code *Number of vacancies (forecast)
341110 Associate Legal Professional 61
333905 Supply Chain Practitioner 21
333401 Property Manager 15
335101 Customs Officer 14
331302 Accounting Technician 10
341107 Support Officer 10
8Other 55
Total 186
Fasset WSP database, 2016. *Only occupations with 10 or more vacancies
Table 7-15 shows that the Clerical Support Worker group had a total of 114 (one hundred and
fourteen) hard-to-fill vacancies that were reported. The table reveals the need for suitably
qualified General Clerks; Accounts Clerks, Auditor Clerks and Debt Collectors who have at
least 10 vacancies to be filled. These positions require a specialised set of skills such as nu-
meracy and communication skills combined with certain personality traits and experience in
the field, which are difficult to find.
Table 7-15: Clerical Support Workers occupations for which skills shortages are expe-
rienced
Occupation OFO code *Number of vacancies (forecast)
411101 General Clerk 33
431101 Accounts Clerk 26
431101 Audit Clerk 24
421401 Debt Collector 14
9Other 17
Total 114
Fasset WSP database, 2016. *Only occupations with 10 or more vacancies
8Other for Technicians and Associate Professionals to Business Support Coordinator; Private Investigator; Property Portfolio and Asset Manager; Computer Network Technician; Paralegal; Production / Operations Supervisor (Manufacturing); Financial market practitioner; Bookkeeper; Business Broker; Asset Swap Administrator; Tax Administrator Research Services; Tax Admin-istrator People & Organisation; Environmental Practices Inspector; Taxation Inspector; Finance and Insurance Consultant; Insur-ance Agent; Marketing Coordinator; Property Lease Administrator; Sales Representative; Commodities Trader; Office Adminis-trator; Personal Assistant; etc. 9 Other for Clerical Support Workers refers to Inbound Contact Centre Consultant; Inbound Contact Centre Consultant; Per-sonal Investments; Personal Investments; Debtors Clerk; Insurance Administrator; Payroll Clerk; Human Resources Clerk; Con-tract Administrator

Fasset Sector Survey 2016 FINAL REPORT: 29 September 2017
-155-
7.3.3.2. Professional bodies’ views on the sector’s scarce skills
As can be seen from the Worker Profile in chapter one, a high proportion of employees in the
sector are Professionals and Managers. Scarce skills experienced by employers span a vari-
ety of occupations and NQF levels in the professional and managerial categories, most of
which fall within the ambit of the sector’s professional bodies. During interviews, professional
bodies tended to focus on their own professions when scarce skills were discussed, as these
were the occupations most familiar to them. Most professional bodies considered their partic-
ular occupations as scarce to the sector, so this section will focus on their reasons for the
shortages and the required interventions to address them.
7.3.3.3. Reasons for occupational shortages and required interventions
Poor quality teaching, low Matric pass rates, poor Mathematics competency levels and a lack
of adequate career guidance were the predominant reasons cited by professional bodies for
the various scarce skills in the sector. A lack of funding to address these 4 (four) factors was
believed to be a huge compounding problem.
7.3.3.3.1. Career guidance
13 (thirteen) of the 16 (sixteen) professional bodies interviewed are involved in career guid-
ance initiatives where high school and university learners are concerned. While just under half
of them do not partner, they visit schools and universities to provide information on their par-
ticular profession and designation pathways. The most common form of involvement was by
being involved in large career exhibitions organised by other stakeholders. Only one profes-
sional body pays visits to TVET colleges to offer career guidance to learners.
7.3.3.3.2. Matric Mathematics
Mathematics is seen as one of the most important fundamental subjects for the sector. Not
only is the ability to work well with numbers a crucial skill for all of the sector’s core occupa-
tions, but professional bodies interviewed also agreed that it is the one subject at school level
which facilitates the development of some of the sector’s essential soft skills: critical thinking
and analytical skills. As is seen in the chapter on the Survey of Education and Training Pro-
viders, research has shown that a learner’s Mathematics competence level is often a predictor
of likely access to university, reinforcing the value of the subject. 5 (five) of the sector’s pro-
fessional bodies do have initiatives in place which aim to address this challenge: two organi-
sations arrange Mathematics camps for learners in certain high schools, where tutoring is the
focus of an intensive few days for learners; two organisations encourage their members and
trainees to volunteer their time to tutor learners at chosen schools who are struggling with
Matric Mathematics; while another organization has developed self-teaching tools which learn-
ers are able to access in order to work through fundamental Mathematics concepts and com-
mon challenges.

Fasset Sector Survey 2016 FINAL REPORT: 29 September 2017
-156-
However, South Africa faces such a massive challenge in this area that most (11) of Fasset’s
professional bodies tend to focus rather on efforts related to those already pursuing their par-
ticular professions.
7.3.3.3.3. NQF levels under 6
2 (two) professional bodies whose designations fall between NQF levels 3 and 5, expressed
concern over Fasset’s recent policy change to direct funding efforts to learnerships and initia-
tives which focus only on qualifications that fall on NQF level 6 and above, stating that there
is a negative impact on learners’ access to education and training in the sector. Fasset’s
changes were introduced as a result of the sector’s scarce skills list consistently being domi-
nated by the higher-level occupations, as well as the DHET’s proposed changes to the SETA
landscape which could be executed as early as 2018. Fasset believed that the uncertainty
regarding the latter necessitated a radical priority shift to ensure that as much impact as pos-
sible could be made in the sector, leading to their campaign in this regard: #LastingLegacy.
The two professional bodies’ comments echoed a few large employers’ concerns over the
establishment of workplace programs which were developed and implemented for employees
in response to Fasset’s earlier funding incentives which spanned all NQF levels, as well as
the argument that occupations on lower NQF levels are necessary skills pipe-lines for the
sector. It is also believed that this moratorium on funding inhibits access to education for learn-
ers who may use lower-level designations as a career pathway to higher-level occupations,
some of which may be scarce in the sector.
7.3.3.3.4. Other factors
Other factors which were considered inhibitors to increasing access to high quality education
and training for learners included changing governmental policies, skills development priori-
ties, negative mind sets towards transformation and a lack of workplace training, the latter two
believed to be interrelated.
Six professional bodies also highlighted that globalisation has led to the ongoing emigration
of many high-level South Africans, wedging a further skills gaps in the sector. This was a
particular concern to the professional bodies, as they believed that until the quality of basic
education is resolved and its provision made equal to all learners, the economy cannot afford
to lose its few senior people.
Since most of these pervasive problems either fall largely within the ambit of basic education
or are exogenous factors, professional bodies focus mostly on mitigating some of the effects
on their own occupations.
7.3.3.4. Critical skills gaps specific to occupations
Critical skills are those found within certain positions which are required for the effective per-
formance of the job. Critical skills gaps, therefore, refer specifically to critical skills that may be
hard to find in qualified candidates/employees. For example, a Portfolio Manager with good

Fasset Sector Survey 2016 FINAL REPORT: 29 September 2017
-157-
presentation skills, or a Business Analyst with Advanced Excel skills. They could also be gen-
eral skills gaps found across occupations in an organisation, for example a lack of business
communication skills. Many of these skills can be categorised as soft skills.
The discussions below refer most specifically to the gaps between graduate attributes and
employer requirements. With some exceptions, they do not necessarily refer to all established
professionals in their fields.
7.3.3.4.1. Accountants
Where accountants in general are concerned, a few professional bodies felt that the future of
the profession will involve the ability to evaluate the business as a whole, including where its
strategy, risk and governance functions are concerned. Accounting is evolving from a focus
on the transactional and cost efficiency areas to strategy where finance professionals are now
expected to have a considerable influence in business decisions and impact on business per-
formance by being able to translate financial reports into important signals. This has arisen in
part because of technological innovations which have freed accounting professionals some-
what from the technical aspects of their role, spending less time preparing standardised re-
ports and more on analysing and interpreting information. Increasingly they are being ex-
pected to explain their findings rather than just report them.
The abilities to think analytically and strategically, to forecast and to lead a company are
scarce, skills which are not widely being incorporated into accounting qualifications but are
being discussed by stakeholders as highly necessary inclusions. Further research is needed
to guide efforts to close this gap particularly as accounting departments of universities con-
tinue to monitor a professional environment rapidly changing with technology but within an
institutional context constrained by mostly financial and academic resources for their learners.
Future disruptions that educational institutions need to prepare for are technology, soft skills
and the increasing use of non-financial information.
A few professional bodies believe that accountants often lack specialised knowledge in fields
such as Tax and Commercial Law, owing to the regularly changing legislations and laws which
individuals who specialise in those fields keep more closely in touch with. Accounting as a
successful services industry faces challenges from other professions, such as law, as they
look to expand their markets and offerings, thus placing greater expectations on accountants
to deliver an expanded set of skills of a high quality.
Another area of specialisation which is lacking is public sector knowledge, mentioned by three
professional bodies, and corroborated by universities and employers. Professional bodies
have stated that the uptake from learners for public sector-specific programs has been slow,
and that there needs to be more focused marketing about this from both Fasset and the pro-
fessional bodies. Additionally, it is felt that priority funding needs to be made available from
Fasset.

Fasset Sector Survey 2016 FINAL REPORT: 29 September 2017
-158-
7.3.3.4.2. External auditors
In the case of external auditors, a series of corporate scandals and the financial crisis of
2007/08, the increasing complexity of business as well as the influence carried by the four
King Reports on Corporate Governance (King IV having been released in November 2016),
have led to some significant changes to audit globally and to the role of audit in the overall
corporate governance structure. Professional bodies explained that auditing in South Africa is
evolving from its traditional function of monitoring and reporting, to a more proactive and in-
sightful one which can search for clues and interpret findings from a business perspective –
similar in some respects to the changing roles of accountants. This is reflected by the fact that
the Independent Regulatory Board for Auditors (IRBA) adopted a new auditing report standard
that was issued by the IAASB (International Auditing and Assurance Standards Board) in Jan-
uary 2015 (effective from December 2016). Auditors can no longer simply state that a report
they have assessed is either qualified or unqualified. They must also disclose the procedures
that were followed, the risks that were identified, in what way the risks were addressed in the
auditing, and which discussions were held with the auditing committee. This was done be-
cause, while users of the financial statements have signalled that the auditor’s opinion on the
financial statements is indeed valued, many have called for the auditor’s report to be more
informative and relevant.
Furthermore, besides the need for deeper technical knowledge in areas such as governance,
ethics and forensics, soft skills such as analytical, interpersonal and leadership skills in an
audit candidate will become increasingly valuable to a business. It is believed that the skills
base is not developing at the same rate that the evolution of the audit role is.
The auditing profession has also seen a number of major technological advancements where
the use of data analytics is concerned, which is the process of using financial data to draw
meaningful insights and conclusions where the business as a whole is concerned. It is also
possible through this process to detect cues of possible abnormal or even fraudulent activity,
and it is thus imperative for an auditor to have strong data interrogation skills. The transformed
auditing profession will increasingly need to use intelligent analytics software to deliver a
higher quality of audit evidence and more relevant business insights, skills which are currently
scarce but which will become increasingly critical to deliver a more relevant audit.
Owing to the role of auditors changing quite significantly, the talent profile of those who were
and are currently attracted to the career path may change. Career guidance initiatives will
need to be adapted in order to continue attracting the right type of individual.
Professional bodies with the above comments felt that these were all skills which needed to
be incorporated into accounting and auditing qualifications at the earliest level possible, in
order to prepare accountants and external auditors for the rapidly changing needs and expec-
tations of business. 2 (two) professional bodies confirmed that they were in the process of
incorporating data analytics as well as forensic accounting and auditing into their curricula.

Fasset Sector Survey 2016 FINAL REPORT: 29 September 2017
-159-
7.3.3.4.3. Forensic practitioners
These professionals proactively interrogate information in order to expose fraud and white-
collar crime. Some of the critical skills gaps in this profession, particularly evident in those who
are newly graduated and inexperienced, are the lack of enquiring and analytical skills, and the
ability to think with a bigger picture in mind, rather than on just a part. As mentioned under the
section on external auditors, these are becoming increasingly important and valuable skills for
the sector. These gaps are sometimes resolved through experience, but it also requires that
the right type of individual is attracted to the field, and that these skills are developed at an
early an age as possible. A more integrated approach at educational level where the assess-
ment of learners is concerned could produce more enquiring and analytical graduates for the
profession.
7.3.3.4.4. Tax practitioners
As of 2011, tax practitioners are required to register with a recognised controlling body (eight
of which are professional bodies in the Fasset sector), and with SARS. This change provided
a framework for the minimum qualifications needed and a mechanism for taxpayers and SARS
to address professional misconduct by tax professionals. While the regulation of the profes-
sion has succeeded in ensuring that tax practitioners are adequately qualified to provide tax
consultative services and perform tax returns, professional bodies have raised similar con-
cerns as those regarding forensic practitioners, that graduates and young professionals in
particular lack analytical skills, as well as the ability to critically review information in order to
make and motivate informed opinions. Additionally, often candidates specialise in one area
but then choose to practise as generalists, which comes with high risks where the provision of
consultation services is concerned. It is believed that more intensive workplace experience
with exposure to different contexts would mitigate this, as would work-readiness programs for
new graduates, especially the majority who lack confidence and assertiveness.
7.3.3.4.5. Company secretaries
The company secretary is positioned in the top tier of a company, and is the person who
usually links the board and the executive. The role is largely administrative in nature; however,
a company secretary needs to deliver strategic leadership as well. Company secretaries align
the interests of different parties around a boardroom table, facilitate dialogue, gather and as-
similate relevant information, and enable effective decision-making. They also need to be con-
fident communicators and able to manage complex relationships and competing interests
within an organisation. As with some of the afore-mentioned professions, the role of company
secretaries is becoming increasingly outward focused, with regard to the need to be aware of
the external environment within which the company operates, outside pressures and the wider
implications of decision-making. They are also the guardians of governance, therefore given
the increased value placed globally on compliance and external audits, their role in organisa-
tional success is crucial. This individual requires a strong combination of skills including tech-
nical, business and soft skills, and it is very challenging to find candidates with these combi-
nation skills early in their careers. Another skills gap is that of a knowledge on the intricacies

Fasset Sector Survey 2016 FINAL REPORT: 29 September 2017
-160-
of governance and compliance, as well as individuals with business communication, negotia-
tion, decision-making and management skills, as well as ethics. It is believed that these soft
skills can be developed through workshops, short courses and to some extent through work-
readiness programs.
7.3.3.4.6. Internal auditors
Internal auditors provide objective assurance to management in order to add value to organi-
sational strategy and to assist with meeting objectives. Internal audit is a fundamental pillar of
governance within organisations, ensuring sufficient oversight in terms of risks and internal
controls. Internal auditors often have input into strategic planning, market analysis, compliance
and change management. An internal auditor needs to have a combination of skills and a high
level of competence in order to process and interrogate various and large amounts of infor-
mation for the benefit of the company. Besides technical skills, it is essential that the individual
possesses business acumen and an ability to think in an integrated way. Lack of competence,
brought on by low experience levels, is a key challenge in this profession as large companies
are looking for candidates that require little to no training. Increased access to workplace ex-
perience during training would help to mitigate this challenge.
7.3.3.5. Critical skills gaps spanning various occupations
This section discusses the skills gaps highlighted by professional bodies as not being occu-
pation-specific. Generally, a considerable amount of time was spent on this part of the inter-
view, as professional bodies spend much time problem-solving ways to mitigate the effects of
some of these challenges.
Figure 7-6 shows the critical skills gaps most commonly mentioned by the professional bodies
interviewed.
Figure 7-6: Most common critical skills gaps found across occupations
Source: Sector Survey (2016)
14
11
7
7
6
5
3
0 2 4 6 8 10 12 14 16
Application/integrated thinking
Work-readiness & business communication skills
Workplace experience
Critical thinking skills
Public sector knowledge
Ethics & Governance
Management skills ( people & project)
No. of Professional Bodies

Fasset Sector Survey 2016 FINAL REPORT: 29 September 2017
-161-
As echoed by many of the employers interviewed one-on-one, almost all of the professional
bodies brought up the issue of application skills and integrated thinking being a critical short-
age among graduates and young professionals. Application skills refers to the ability to take
what has been learned at educational institutions and determine how to use it to process and
evaluate new information in the workplace. This ability usually works hand-in-hand with the
need to think in an integrated manner, connecting dots both within the individual’s area of
focus but also more holistically, in other words proactively taking into consideration the bigger
working context within which the individual operates and making decisions which concern the
whole. These comments are closely linked to the previous section on how the future finance
professionals in the sector will need to be educated. Professional bodies agreed that the man-
ner in which learners are trained and assessed at education institutions should be adapted to
allow for the development of these skills more effectively. For example, exams at the end of
semesters or the year should involve case studies which take into account all disciplines rather
than just one. Some professional bodies are currently advocating for this, and a few have
already incorporated this pedagogy in their own qualifications. For the most part, however, it
is believed that teaching and assessments at all levels of education are to a large extent re-
sponsible for leading learners to think “in silos”.
These skills are closely linked to that of critical thinking skills, also referred to as analytical or
problem-solving skills. Professional bodies stated that Mathematics at school is the most cru-
cial juncture where development of these skills is found. Mathematics is a subject which, when
taught well, requires the utilisation of foundational concepts in new or different scenarios to
determine the correct, or best, course of action. Problem-solving skills is also often a creative
process of overcoming stumbling blocks when even foundational concepts seem inadequate
to solve an issue. It is this process of problem-solving and thinking critically that has led to the
technological innovations in the sector. But this requires a specific way of teaching, and as we
have seen from the chapter on the Survey of Education and Training Providers, South Africa’s
success rate in Mathematics throughput rates and pass marks is very poor. Assessments
should not be testing for a person’s ability to memorise information as in the case of rote
learning, which is how Mathematics is believed to be taught at most schools in South Africa,
but rather for a person’s ability to process and use learned information constructively and
progressively.
A lack of work-readiness in the vast majority of graduates was another major concern ex-
pressed by eleven of the professional bodies. A lack of work-readiness can also in many re-
spects be tied in with the professional bodies’ concerns regarding a lack of business commu-
nication skills. Their biggest concern was how unprepared graduates are for the world of work,
from general business communication skills to appropriate attire and conduct. There is also a
pervasive lack of confidence which hampers an individual’s ability to take initiative, even to
ask for assistance when needed. Both employers and professional bodies made reference to
Fasset’s work-readiness program, now no longer being funded, which was outsourced to cer-
tain training companies and aimed to develop critical social and communication skills, as well
as some technical skills such as making presentations, in order to bridge the gap between
educational environments and the workplace. Beneficiaries could be involved in this training
for up to 6 (six) months, after which they would enter either learnerships, internships or full-
time employment. These were widely lauded by stakeholders interviewed during the SS as

Fasset Sector Survey 2016 FINAL REPORT: 29 September 2017
-162-
being highly effective in producing more work-ready individuals and many expressed a desire
to see Fasset returning funding to the initiative.
Where workplace experience is concerned, mentioned by 7 (seven) professional bodies, com-
ments were closely related to the afore-mentioned inability to apply existing knowledge to the
workplace, and was seen to be a result not just of the way in which learners are educated, but
in the large gap that exists between theory and practice. While some of this may be mitigated
by more practical teaching methods and assessments, it was believed that a lack of workplace
experience during a learner’s training was mostly to blame. It was felt that increasing access
to learnerships was part of the solution, however that care also needed to be taken to ensure
that the workplace element of a learnership is relevant as well as related to the theory being
studied. Some professional bodies expressed hope that QCTO’s requirement that all qualifi-
cations include a mandatory practical component as part of theory training will be an effective
tool to plug this gap.
Professionals with public sector knowledge are considered scarce. South Africa’s public sector
employs one quarter of the working population across national, provincial and local govern-
ment, and state-owned companies. Given its size, due consideration of its numerous occupa-
tions and their accompanying skills requirements is important. A handful of universities are
adapting to this need by including a public-sector specialisation in its accounting qualifications,
and professional bodies such as the AAT (SA), ACCA and CIMA are either developing new
qualifications or enhancing existing curricula to include public sector-specific streams. In 2012,
the Department of National Treasury approached the AAT (SA) to develop a customised ac-
counting qualification that was relevant for provincial and national department officials. The
AAT (SA) believes that at the top of public sector service, recruitment and management should
be based on experience and expertise, while at junior levels the state needs to focus on pro-
ducing the skills and expertise that will be necessary for future public service cohorts. To this
end, the AAT (SA) has developed a few public-sector qualifications, and a Public-Sector Ac-
counting Technician designation is currently in the SAQA approval process, the aim of which
is to address the skills shortage as well as create public sector-specific career paths that will
articulate with other qualifications on higher levels. However, interest from learners has not
been sufficient so far. Professional bodies who have already been offering public sector mod-
ules in their offerings have stated that the uptake from learners for public sector-specific pro-
grams has generally been slow, to the extent that there needs to be more learner-directed
marketing from both Fasset and the professional bodies themselves. Additionally, it is felt that
priority funding needs to be made available from Fasset.
7.3.4. Employer interventions
Employers were asked to indicate whether they are undertaking any interventions to address
scarce skills within their organisations. Figure 7-7 reveals that about 79% of the organisations
who responded indicated that they have taken steps to address skills shortages while 21%
indicated that they have not implemented any interventions to address skills shortages. Most
organisations are intervening in the areas of accounting, auditing, finance, technical and soft
skills development and other programs.

Fasset Sector Survey 2016 FINAL REPORT: 29 September 2017
-163-
Figure 7-7: Organisations involved in interventions to increase the number of people
with scarce skills
Source: Sector Survey (2016)
Figure 7-8 shows that employers are using various forms of interventions to address the scar-
city of skills with the sector.
Figure 7-8: Interventions undertaken to increase the number of people with scarce skills
Source: Sector Survey (2016)
21%
79%
Yes
No
2%
7%5% 5%
17%
63%
0%
10%
20%
30%
40%
50%
60%
70%
SAIPA &SAICA
Clerkship
WorkplaceTraining
BridgingProgramme
Mentorships Bursaries Learnerships
Pe
rce
nta
ges(
%)

Fasset Sector Survey 2016 FINAL REPORT: 29 September 2017
-164-
As shown in Figure 3.8, the majority of organisations (63, 4%) reported that they offer learn-
ership programs to address scarce skills. Learnerships are popular as they offer learners very
critical skills that are essential to the workplace as well as practical experience relating to the
work environment. Learners also have higher chances of getting employed as they can easily
adjust to the work environment because they are also taught other important skills such as
social and communication skills. Other forms of interventions used by organisations in the
sector are bursaries (17, 1%), Workplace Training (7, 3%), Mentorships (4.9%) and Bridging
Programs (4, 9%).
7.4 Conclusion
This chapter focused mainly on highlighting the demand for skills as well as occupation-spe-
cific skills shortages in the sector. The main sources of data were employer survey, profes-
sional body survey and Fasset WSP data. The issue of scarce skills (or skills/occupational
shortages) and critical skills gaps in the sector were also discussed in great detail.

Fasset Sector Survey 2016 FINAL REPORT: 29 September 2017
-165-
8 LABOUR DEMAND AND PROJECTIONS
8.1 Introduction
This chapter focuses, firstly, on the demand for skills in the financial sector and, secondly, on
the specific forecasting of the demand for skills Concepts including employment trends, the
growth or decline in employment levels experienced by organisations in the period between
the two SSs done in 2012 and 2016, staff turnover, employment growth expectations and the
factors that may impact on future growth of the sector and the demand for skills are reviewed.
8.2 Employment Trends
Based on the employment information obtained through the employer survey, total employ-
ment in the sector is estimated at 138,587 (one hundred and thirty eight thousand five hundred
and eight seven) in 2016. This is 3,129 (three thousand one hundred and twenty nine) more
jobs than the total employment figure estimated in the 2012 SS and this shows that employ-
ment in the sector had increased on average by 2.3% over the 5 (five) year period between
the 2 (two) surveys. Figure 8-1 compares total employment presented in the SS and those
from the Employment Trends reports by Fasset which is based on mandatory grant applica-
tions. Figure 8-1 shows that employment recovered in 2013. The Employment Trends are
estimates of total employment while the SS were conducted in the second half of 2002, 2007,
2012 and 2016.
Figure 8-1: Employment Trends
Source: Sector Survey (2016 and Previous Reports): Trends in Employment
A comparison of total employment in 2012 and SS and that of 2016 [Drafting Note: What is
being compared here?] is made to analyse the trend in employment in the sector together with
the sub-sectors. Table 8-1 shows the changes in employment in the various sub-sectors. All
0
20,000
40,000
60,000
80,000
100,000
120,000
140,000
160,000
2002 2003 2004 2005 2006 2007 2008 2009 2010 2011 2012 2013 2014 2015 2016
Employment Trends (2002-2016)
Fasset: Trends in Employment Sectors Surveys
Nu
mb
er o
f e
mp
loye
es

Fasset Sector Survey 2016 FINAL REPORT: 29 September 2017
-166-
the sub-sectors excluding Investment entities, Trusts and Company Secretary Services, De-
velopment Organisations and Accounting, Bookkeeping, Auditing and Tax Services Sector
showed growth in employment since 2012. Business and Management Consulting Services,
Stockbroking and Financial Markets and SARS and Government experienced the highest
growth in employment in that order over the period, with annual increases ranging from 14,3%
to 34,7%. Activities Auxiliary to Financial Intermediation had the lowest growth at 0, 7%.
Table 8-1: Changes in employment 2012-2016 per subsector
Subsector Total em-
ployment
2012
Total em-
ployment
2016
Percent-
age
Change
Investment entities, Trusts and Company
Secretary Services
9,645 6,503 - 32,6%
Stockbroking and Financial Markets 14,254 19,063 33,7%
Development Organisations 1,897 *397 - 79,1%
Accounting, Bookkeeping, Auditing and Tax
Service Sector
59,110 54,965 - 7,0%
Business and Management Consulting Ser-
vices
13,363 17,999 34,7%
Activities Auxiliary to Financial Intermedia-
tion
20,864 21,006 0,7%
SARS and Government Departments 16,316 18,645 14,3
Grand Total 135,449 138,578 2,3%
Source: Sector Survey (2016)
*This could be a true reflection of the subsector due low response rate from all the Development Or-
ganisations subsector
Growth in business was the main contributor to growth in employment. Business problems
(decrease in business), difficulties in finding appropriately experienced and skilled people and
restructuring through, for example, mergers or acquisitions, were the main reasons for some
organisations experiencing decreases in employment over the two-year period.
8.3 Staff Turnover
In the period 1 April 2015 to 31 March 2016, 6,480 (six thousand four hundred and eighty)
employees left the service of their employers. This constitutes a staff turnover rate of 4, 6%.
Table 8-2 shows that 51.3% of the employees who left resigned from their positions, while
3.6% were dismissed and 2.7% retired. About 10% of the employees who left their employers
were learners who had completed learnerships.

Fasset Sector Survey 2016 FINAL REPORT: 29 September 2017
-167-
Table 8-2: Reasons for Staff Turnover
Reason N %
Resigned 3324 51,3
Retired 178 2,7
Retrenched 95 1,5
Dismissed 234 3,6
Passed away 59 0,9
Completion of Learnership 676 10,4
Emigrated 13 0,2
End of contract 820 12,7
Transferred 163 2,5
Other 312 4,8
Total 6480 100,0
Source: Sector Survey (2016)
8.4 Employers’ Views on the Past and Future Growth of the Sector
Employers were asked about their view on the changes of employment over the last 2 (two)
years. Table 8-3 shows that 59% of the employers cited that their level of employment had
decreased over the last 2 (two) years whilst 19, 9% were of the view that their employment
levels had increased. Only 21, 1% of the employers said that their employment levels had
remained the same over the last 2 (two) years. Accounting, Bookkeeping, Auditing and Tax
Services, Activities Auxiliary to Financial Intermediation and Development organisations were
some of the subsectors were most of the employers had indicated that their employment levels
had decreased over the last 2 (two) years. Stockbroking and Financial Markets is the only
subsector in which most employers had indicated that their employment levels had remained
the same during the last 2 (two) years.
Table 8-3: Changes in employment over the last 2 (two) years
Subsector Increase Same Decrease Total
% of organisations
Investment entities, Trusts and Com-
pany Secretary Services
11,1 29,6 59,3 100
Stockbroking and Financial Markets 7,4 40,7 51,9 100
Development Organisations 11,1 11,1 78,8 100
Accounting, Bookkeeping, Auditing
and Tax Service Sector
14,6 21,4 64,0 100
Business and Management Consulting
Services
18,0 26,0 56,0 100
Activities Auxiliary to Financial Inter-
mediation
27,3 9,1 63,6 100

Fasset Sector Survey 2016 FINAL REPORT: 29 September 2017
-168-
Subsector Increase Same Decrease Total
% of organisations
SARS and Government Departments 50,0 10,0 40,0 100
Average 19,9 21,1 59,0 100
Source: Sector Survey (2016)
8.5 Expectations of the Employment Changes in the next 5 Years
Employers were also asked about their expectations in terms of employment growth over the
next 5 (five) years. On average about 46, 8% of the organisations indicated that they expect
total employment to increase in the next 5 (five) years, while about 9, 7% of the organisations
indicated that they expect a decrease in the total employment in the sectors. About 43, 5% of
the organisations indicated that they expected the number of employees to remain the same.
Table 8-4: Expectations of Employment changes in the next 5 years
Subsectors Decrease Remain
the same
Increase Total
Accounting, Bookkeeping, Auditing and
Tax Services
4,3 46,9 48,8 100
Activities Auxiliary to Financial Intermedia-
tion
10,0 60,0 30,0 100
Business and Management Consulting Ser-
vices
4,1 49,0 46,9 100
Development Organisations 0,0 37,5 62,5 100
Investment Entities and Trusts and Com-
pany Secretary Services
0,0 54,2 45,8 100
SARS and Government Departments 45,5 9,1 45,5 100
Stockbroking and Financial Markets 4,0 48,0 48,0 100
Average 9,7 43,5 46,8 100
Source: Sector Survey (2016)
As shown on Table 8-4, Activities Auxiliary to Financial Intermediation and Investment Entities
and Trusts and Company Secretary Services are the sub-sectors who had many organisations
expecting the employment to remain the same in the next 5 (five) years.
8.6 Occupational Categories whose Employment Will Increase or Decrease
Employers were also asked to give their opinion on which occupational categories they ex-
pected to increase or decrease. Table 8-5 shows that about 45, 4%, 44, 4% and 42, 3% of
employers expected Professionals, Technicians and Associate Professionals and Clerical
Support to increase respectively.

Fasset Sector Survey 2016 FINAL REPORT: 29 September 2017
-169-
Table 8-5: Occupational categories whose employment will increase or decrease
Occupational Categories Changes
Increase Remain the
same
Decrease Total
Managers 26,0 67,1 6,9 100,0
Professionals 45,4 49,6 5,0 100,0
Technicians and Associate Profession-
als
44,4 49,1 6,6 100,0
Clerical Support 42,3 49,1 8,6 100,0
Service & Sales Workers 17,3 77,3 5,3 100,0
Skilled Agricultural, Forestry, Fishery,
Craft
2,7 92,0 2,7 100,0
Plant & Machinery Operators 1,0 95,1 3,9 100,0
Elementary Workers 6,5 88,2 5,2 100,0
Source: Sector Survey (2016)
Table 8-5 also shows that occupational categories such as Plant & Machinery Operators,
Skilled Agricultural, Forestry, Fishery, Craft and Elementary Workers were largely expected to
remain the same by employers.
8.7 Factors Impacting on the Demand for Skills
Organisations were also asked to indicate the factors which are driving the changes in em-
ployment. The results on Table 8-6 show that about 54, 3% of the organisations indicated that
growth in business volume is the major driver of employment changes. Some of the factors
that affect employment which were cited by organisations are difficulties in finding appropriate,
experienced and skilled people, business problems and labour related problems such as the
difficulty to discharge incompetent people. These were cited by 14, 4%, 13, 8%, 6, and 4% of
organisations respectively.
Table 8-6: Reasons for change in employment
Reason for change N Percentage
Restructuring 12 6,4
Growth in business volume 102 54,3
Business problems (decrease) 26 13,8
Difficult to find appropriate, experienced and skilled people 27 14,4
Labour related problems (difficult to discharge incompetent peo-
ple
12 6,4

Fasset Sector Survey 2016 FINAL REPORT: 29 September 2017
-170-
Reason for change N Percentage
Other10 9 4,8
Total 188 100
Source: Sector Survey (2016)
Apart from the factors mentioned in Table 8-6, other factors such as technology, resignations,
no organic growth and moving to new business were the least cited factors which drives
changes in employments levels as only they were only mentioned by 4,8% of the organisa-
tions.
8.8 Forecasting of the Demand for Skills in the Sector
This section gives an overview of how a model to project labour demand in the sector for the
next 5 years will be developed. The sector applicable to Fasset forms part of the larger Fi-
nance, Real Estate and Business Services sector and the growth projections for this sector
will be used as the basis in quantifying the growth of the sector during the period under review.
We also acknowledge that the sector is largely a professional services sector where work
largely depends on the time and effort of trained personnel. Therefore, the growth in demand
for the services of the sector and growth in employment are directly linked.
The demand for labour in a sector is defined as the total number of people expected to be
employed in the sector in a specific year. Of particular importance for skills development is the
number of people that need to be recruited into or trained for the sector. The positions that
need to be filled emanate from the expansion of the sector because of a growth in the demand
for its services or a growth in the output of the sector (new demand), and the attrition of staff
through retirement, movement of people into other sectors or out of the labour market, emi-
gration, and mortality (replacement demand).
8.8.1. Demand forecasting model
In the model, the demand for labour will be defined as the total number of people expected to
be employed in the sector within a specific period. This figure also includes the job openings
that need to be filled in the sector.
8.8.1.1. Components of the model
The model identifies new demand and replacement demand as the main drivers in creating
job openings. New demand is explained by the growth of the sector as a result of increase in
10 Other refers to technology, resignations, no organic growth and moving to new business

Fasset Sector Survey 2016 FINAL REPORT: 29 September 2017
-171-
the demand of its services or a growth in the output of the sector. On the other hand, replace-
ment demand is explained by employee attrition through retirement, movement into other sec-
tors or out of the labour market completely, emigration and mortality (see Table 8-7).
Table 8-7: Categories of variables to be used
New Demand Replacement Demand
Economic growth of the sector (an
econometric model will be adopted to
project the growth of the economy
and sectors)
Mortality rate
Retirement
Emigration
People leaving the sector or labour
market
Source: Underhill Corporate Solutions, 2016
The model utilises primary and secondary data in quantifying the variables which will be used
together with well thought assumptions.
8.8.1.2. Conceptual framework and assumptions
The demand for labour in a sector is defined as the total number of people expected to be
employed in the sector in a specific year. Of particular importance for skills development is the
number of positions that need to be filled; i.e. the number of people that need to be recruited
into or trained for the sector. Positions that need to be filled are the result of 2 (two) processes.
These processes involve expansion of the sector because of a growth in the demand for its
services or a growth in the output of the sector (new demand), and attrition of staff through
retirement, movement of people into other sectors or out of the labour market, emigration and
mortality (replacement demand).
For the purpose of this study four demand scenarios are presented and range from conserva-
tive to most optimistic.
8.8.1.2.1. Base employment
In most labour demand studies the total number of positions available at a specific time is
taken as the sum of people employed plus reported vacancies. On the basis of the findings of
the employer survey the total employment is obtained by weighting SS data and is estimated
at 138,587 (one hundred and thirty eight thousand five hundred and eight seven). This be-
comes the baseline of the employment which will be used to project employment growth over
the next 5 (five) years.

Fasset Sector Survey 2016 FINAL REPORT: 29 September 2017
-172-
8.8.1.2.2. Growth of the sector
The Financial and Accounting Services Sector, as demarcated for the purposes of the imple-
mentation of the SDA does not have specific economic data. However, economic data for
Finance, Real Estate and Business Services Sector, which includes most components of the
Financial and Accounting Services Sector is used. In this model, we make use of growth pro-
jections of the sector which were estimated by Quantec11 in which they expect the growth of
the sector to range from 1, 2% to 2, and 5% over the period 2016 to 2021. This gives us an
average growth rate of the sector to be 2, 05% over the same period.
We make use of three scenarios. In the first scenario, we assume that the growth rate of the
sector will follow the growth path estimated by the model which is an average of 2% over the
next 5 (five) years. A pessimistic scenario assumes a slower growth rate of 1% which is lower
than the expected growth from the model, while an optimistic scenario assumes a growth rate
of 4% which will be higher and expected to be sustained at the same level than the expected
growth from the model over the next 5 (five) years.
8.8.1.2.3. Employment elasticity
The Financial and Accounting Services Sector consists of components that are relatively la-
bour intensive as well as ones that are less labour intensive. In a study conducted by the
Human Sciences Research Council (HSRC) in 2002 on the demand for labour, the employ-
ment elasticity for the Business Services Sector was estimated to be 0,78. That means that
for every 1% growth in output, employment would grow by 0, 78 %. This elasticity figure is
relatively high. However, from the surveys that were conducted as part of the current study
technological changes are slowing down growth in employment. For the purposes of this
model we assume an elasticity of 0, 65%.
8.8.1.2.4. Mortality
Expected mortality in the sector was estimated by using the age, gender and population group
distributions of the workforce observed in the employer survey. The results from the survey
indicated a mortality rate of 0, 9% per annum.
8.8.1.2.5. Retirement
An estimate of retirement is based on the assumption that workers will retire at the age of 60
(sixty) years. The number of employees who would retire was, therefore, taken as all workers
who would reach retirement age in each projection year. This calculation was based on the
11 Quantec Research (Pty) Ltd: Economic Review, Quarterly Report, January 2017

Fasset Sector Survey 2016 FINAL REPORT: 29 September 2017
-173-
age distribution of workers observed in the employer survey. However, it must also be noted
that many professionals are often delaying their retirement at the age of 60 (sixty). In most
cases the retirees move from large organisations and public enterprises to create small private
businesses such as accounting practices and management consultancies to make use of their
experience as well as supplementing their retirement income. For the purposes of this survey,
an average of 1% taken from all the past surveys is used as the proportion of employees
retiring from the sector.
8.8.1.2.6. Emigration
The fact that the labour market for professionals, and specifically financial professionals, has
become a global labour market was mentioned earlier in this report. One source of information
on emigration is the official emigration figures published by Stats SA. These figures are ob-
tained at the airports, where people declare their reasons for departure from the country. Only
people who state that they are emigrating are counted. It is generally accepted that the official
emigration figures do not reflect the full extent of emigration because many people choose not
to declare that they are leaving the country permanently. Employers reported in the survey
that 0, 2% of the workforce left their service in order to establish themselves elsewhere in the
world. Although it may be optimistic to think that emigration figures will level off, for the purpose
of the model emigration was taken as 0, 5 % per year over the projection period to cater for
unreported cases of emigration.
8.8.1.2.7. People leaving the sector or the labour market
People leaving the sector to find employment in other sectors of the economy or those who
stop working altogether are the greatest factor to contribute to replacement demand. Infor-
mation about these trends which is a form of wastage from the sector, is however, non-existent
or very difficult to obtain. In the absence of data an assumption of 5% is used based on the
previous survey reports.
8.8.2. Scenarios used in forecasts
3 (three) scenarios were developed for the purpose of this study. This was done by changing
only 2 (two) variables, namely: the economic growth rates and employment elasticity ñ in other
words, the factors that affect new growth in demand. Attrition from the sector was held con-
stant and was calculated as described in the previous section. The permutations used in the
3 (three) scenarios are shown in Table 8-8.
Table 8-8: Scenarios used for the Forecasts
Scenario Economic growth of sector Employment elasticity
Pessimistic 1% 0,65
Normal 2% 0,65
Optimistic 4% 0,65
Source: Underhill Corporate Solutions, 2016

Fasset Sector Survey 2016 FINAL REPORT: 29 September 2017
-174-
8.8.3. Results of the model for projection of total employment in the sector
The results of the model are shown in Table 8-9 below. The growth rates emanating from the
3 (three) scenarios are 7, 5%, 8, 1% and 10, 1% respectively. The number of new employment
opportunities created over the six-year period varies as follows:
Pessimistic : 6 575
Normal : 14 009
Optimistic : 27 870
It must be emphasised that all 3 (three) scenarios are based on the assumption that relatively
positive average growth rates will be experienced over the projection period. Lower growth in
the sector or a marked decline in the growth of the total economy will obviously change the
situation completely.
Table 8-9: Labour demand projections for 2016-2021
Low Growth (Pessimistic) of 1% 2016 2017 2018 2019 2020 2021
Total employment at the beginning of the year
138578 149872 162087 175297 189583 205034
New positions to be filled during the year 901 974 1054 1139 1232 1333
Positions that need to be replaced during the year
10393 11240 12157 13147 14219 15378
Total positions to be filled during the year 11294 12215 13210 14287 15451 16710
Total employment at the end of the year 149872 162087 175297 189583 205034 221745
Annual growth in positions to be filled 8.1 8.2 8.1 8.2 8.1
Baseline Growth (Normal) of 2% 2016 2017 2018 2019 2020 2021
Total employment at the beginning of the year
138578 150773 164041 178362 193758 210310
New positions to be filled during the year 1802 1960 2133 2319 2519 2734
Positions that need to be replaced during the year
10393 11308 12303 13377 14532 15773
Total positions to be filled during the year 12195 13268 14321 15396 16552 17794
Total employment at the end of the year 150773 164041 178362 193758 210310 228104
Annual growth in positions to be filled 8.8 7.9 7.5 7.5 7.5
High Growth (Optimistic) of 4% 2016 2017 2018 2019 2020 2021
Total employment at the beginning of the year
138578 152574 167984 184951 203631 224198
New positions to be filled during the year 3603 3967 4368 4809 5294 5829
Positions that need to be replaced during the year
10393 11443 12599 13871 15272 16815
Total positions to be filled during the year 13996 15410 16966 18680 20567 22644
Total employment at the end of the year 152574 167984 184951 203631 224198 246842
Annual growth in positions to be filled 10.1 10.1 10.1 10.1 10.1
Source: Underhill Corporate Solutions, 2016

Fasset Sector Survey 2016 FINAL REPORT: 29 September 2017
-175-
The demand scenarios also assume that there will be no constraints on the supply side. It
must be remembered that employment creation in this particular sector is highly dependent
on the availability of skilled professionals. They are the people who start up small practices
and businesses and by doing so create employment for others. Growth may be stifled by their
absence or change in the economic and regulatory environment.
8.8.4. Results of the model for projection by Occupational Categories
Further analysis was carried to out to project employment levels for the period 2016 to 2021
for those categories which had high levels of employment. Projections were made using the
same assumptions which were used to estimate total employment in the sector for the next 5
years and the results are presented in the tables.
Table 8-10: Labour demand projections for 2016-2021 by Occupational Category
Occupation Pessimistic Normal Optimistic
Clerical Support 1 207 2 175 2 800
Technicians 432 929 1 002
Professionals 1 622 2 844 3 765
Managers 573 1 156 1 329
The results of the model are shown in Table 8-10. Detailed results of the model is presented
in Annexure B. Results shows that the sector will be in demand of between 1 622 (one thou-
sand six hundred and twenty two) and 3 765 (three thousand seven hundred and sixty five)
professionals over the period 2016-2021. It must be emphasised that all 3 (three) scenarios
are based on the assumption that relatively positive average growth rates will be experienced
over the projection period. Lower growth in the sector or a marked decline in the growth of the
total economy will obviously change the situation completely.
8.9 Conclusion
The information presented in this chapter clearly shows that the Financial and Accounting
Services Sector has grown steadily over the last 5 (five) years and that it is expected to
continue on this growth path over the next 5 (five) years. The growth of the sector has slowed
down when compared to previous years as a result of the slow economic growth of the South
African economy. As the economy grows the number of enterprises increase and existing
businesses also grow, and this also acts as a trigger which increases the need for financial
services.
On the basis of the demand-forecasting model developed for the Financial and Accounting
Services Sector, it is estimated that the number of positions available in the sector will increase
by between 8% and 10% each year. Replacement demand is estimated at approximately 7.5%
of total employment. This growth depends on the economic growth of the country and of this

Fasset Sector Survey 2016 FINAL REPORT: 29 September 2017
-176-
particular sector. It also depends on the availability of skills. The very nature of the work of this
sector is such that its growth is closely related to the availability of skilled staff especially pro-
fessionals.

Fasset Sector Survey 2016 FINAL REPORT: 29 September 2017
-177-
9 CONCLUSION
9.1 Introduction
Fasset was established in March 2000 in terms of the SDA. In 2001 Fasset started collecting
and analysing labour market information on the sector and has continued to do so ever since.
The reason for the collection of labour market information is to inform Fasset’s skills planning
and funding decisions.
The main objective of the SS was to present the ‘current picture of the Fasset sector’ by having
regard to employers, professional bodies, education and training providers, earners, skills
shortages in the sector and a demand and supply analysis. The SS is also required to highlight
skills deficits and skills priorities. The information also serves to monitor transformation in the
sector.
The first comprehensive SS was conducted in 2002 and included surveys of employers, pro-
fessional bodies, education and training providers, and learners in the sector. After several
changes in the sector, such as the SDL) threshold which was increased from R 250 000.00 to
R 500 000.00, the second comprehensive SS was conducted in 2007. The third comprehen-
sive SS was conducted in 2012 in the NSDS III dispensation. The current SS arises amidst a
range of changes, including the extension of the existence of the twenty one (21) SETAs to
31 March 2020 and the corresponding extension of the NSDS III (Government Gazette,
2016)12.
All the occupational information in the current SS has been coded and is reported on according
to OFO Version 2012. The OFO is an occupational classification system that was introduced
by the DoL in 2006 for the identification and reporting of scarce and critical skills. The OFO
that was introduced at that time was based on an occupational classification system developed
by Australia and New Zealand – the ANSCO. That classification system differed substantially
from the SOC that was used before 2006 by the SETAs.
The OFO that was based on ANSCO was used in the 2007 SS conducted by Fasset. In 2010
the South African government decided to change the structure of the OFO, to align it to the
ISCO which is the classification system used by the ILO. The original OFO (prior to 2010) and
the one based on ISCO (post 2010) differ substantially, even at the level of major occupation
groups. For this reason, the occupational data from the 2 (two) SSs should be compared with
great care.
12 http://www.dhet.gov.za/SitePages/DocGazette.aspx

Fasset Sector Survey 2016 FINAL REPORT: 29 September 2017
-178-
9.2 Organisations in the Sector
The estimate of organisations in the sector is based on Fasset’s database of organisations.
The database is received from SARS via the DHET and contains the details of all organisa-
tions that could possibly fall within the sector. However, the majority of organisations on the
list do not pay the SDL and it is not known how many of them are active. Over the years Fasset
has made a concerted effort to clean the database and to stay in contact with levy-exempt
organisations that are active in the sector by registering them. Only registered organisations
have access to Fasset’s lifelong learning events and discretionary grants. In this SS it was
assumed that the sector consists of the levy-paying organisations together with the levy-ex-
empt organisations that are registered with Fasset.
This brought the estimate of the total number of organisations to almost 5 042 (five thousand
and forty two), with small organisations (those that employ fewer than 50 (fifty) people) making
up 94.8% of the organisations in the sector. Medium size organisations with 50 (fifty) to 149
(one hundred and forty nine) employees constitute 2.9% of the organisations in the sector
while the large organisations with 150 (one hundred and fifty) or more employees form 2.0%
of the organisations in the sector. The small group of large organisations employ 69.9% of the
sectoral workforce and the medium size organisations another 6.9%. This situation has not
changed since 2007 and Fasset is still faced with the challenge of balancing the needs of
small, medium and large organisations, keeping in mind the distribution of employees among
these organisations.
9.3 Employment in the Sector
Employment in the sector has been increasing since the first SS was completed in 2002. How-
ever, the rate of increase slowed down between 2012 and 2016. On average the total employ-
ment rate has been increasing by an average of 5.5% per year between 2002 and 2008 and
3.1% per year between 2008 and 2012. However, between 2012 and 2016 the rate of growth
had slowed down to an average of 0.5% per year. Majority of employees (39.7%) work in
Accounting, Bookkeeping, Auditing and Tax Services. This is supported by the fact that 51.1%
of employers are in this sector too. This is followed by Activities Auxiliary to Financial Interme-
diation, Stockbroking and Financial Markets and SARS and Government Department sub-
sectors which employ 15.2%, 13.8% and 13.5% respectively. Development Organisations
sub-sector is the smallest of all sub-sectors in terms of employment as it only employs 0.3%
of the total employees in the sector. Large companies constitute a very small percentage of
the sector’s employer population, however, shows that they constitute 69.9% of employment
which has increased by 17% from the 2012 SS. The SS reveals that average employment per
organisation varies considerably according to organisational size. Even where the two small-
est categories are concerned, small organisations employ an average of 14 (fourteen) people,
while NLP organisations employ an average of 5 (five) people.

Fasset Sector Survey 2016 FINAL REPORT: 29 September 2017
-179-
9.4 Profile of the Sector
The current profile of the sector is consistent with the profile portrayed in the previous studies.
The majority of employees in the sector are women who constitute 60%. The percentage of
male employees has been fluctuating between 38.6% and 46.4% in the previous SS while the
percentage of female employees fluctuates between 53.6% and 61.4%. Professionals form
the largest occupational group, with 40.2% of the workforce employed in professional occu-
pations. The second largest occupational group is Clerical Support Workers (29.9%), followed
by Managers (14.2%) and Technicians & Associate Professionals (10.7%). The majority
(62.9%) of employees in the sector have post-school qualifications. 37.4% of employees in
the sector are holders of a National Qualifications Framework (NQF) Level 4 qualification,
followed by 28.8% who have achieved NQF Level 7 qualification. The smallest number of
employees fall into the lowest educational categories, being NQF Levels 1, 2 and 3 with a
combined percentage of 2.3%, which is a consistent reflection over the years of the sector’s
need for a highly-qualified workforce. Employees in the sector are relatively young, with 55 %
of them being 35 (thirty five) years old or younger. Only 6.7 % of the employees are over the
age of 56 (fifty six) years. The sector is also highly concentrated in the urban areas of Gauteng,
the Western Cape and KwaZulu-Natal.
9.5 Transformation of the Sector
The SS clearly shows that the sector has made significant strides in transforming. The com-
position of the 4 (four) race groups in the sector for the period between 2002 and 2016 shows
that the percentage of Black Africans employed in the sector has increased from 17% in 2002
to 37.4% in 2016 while that of Whites has decreased from 66% to 36.4%. The percentage of
Coloureds employed in the sector has also increased from 8% in 2002 to 12.7% in 2016 while
that of Indians has decreased from 10% in 2002 to 9.4 % in 2016. Black Africans constitute
the majority of employees in most occupational categories, including Clerical Support Work-
ers; and Technicians and Associate Professionals. However, Whites comprise the majority in
the Managers (8.1%) and Professionals (16.3%) categories with Black Africans comprising
2.8% and 14.2% in those respective categories.
The race and gender profile of the sector shows some significant improvements from the pre-
vious years. Black African and female employees are now in the majority. However, measures
need to be put in place to ensure that more Black Africans occupy the Managerial and Profes-
sional positions and more females occupy positions which are superior to the Clerical Support
positions. The sector currently employs only a very small number of people with disabilities.
The type of work performed in the sector provides any opportunity for people who live with
disabilities to earn a livelihood. The sector ought, therefore to encourage employers to focus
on creating employment opportunities for people with disabilities.

Fasset Sector Survey 2016 FINAL REPORT: 29 September 2017
-180-
9.6 Professional Bodies in the Sector
Professional bodies performs self-regulatory and professional functions to uphold practice
standards, enhance quality of services and protect the broader public against unscrupulous
practitioners. A large portion of the workers in the sector are members of organised profes-
sions and are represented by these bodies. By upholding standards in the financial services
sector the professional bodies make an important contribution to strengthen investor confi-
dence in the economy.
A complex combination of qualifications awarded by professional bodies and conferred by
public and private higher institutions is used in the sector. Several professional bodies confer
upon their members qualifications that are registered on the NQF. It is common practice that
qualifications, professional designations and membership of the professional bodies are inter-
linked. Most of these qualifications require workplace experience in addition to academic train-
ing, and many are registered as learnerships with Fasset and other SETAs. Quality assurance
of the majority of qualifications in the Fasset sector is managed by the professional bodies in
partnership with Fasset.
In addition to the development of education and training programs for their particular designa-
tions, Professional bodies are also involved in functions which support this primary role. Some
of the initiatives which they are undertaking are enhancing output rates by providing learners
with mentorship and tutoring in the form of short courses, refresher and revision classes;
providing financial support to learners in the form of bursaries aimed at high-achieving Matric
students from low-income households; providing access to learnership opportunities by using
their networks to connect learners with employers; providing graduate placement through net-
working, appointing register and posting of job opportunities on their websites; providing CPD
through publishing newsletters for their members, organising workshops on sector and pro-
fession updates as well as facilitating opportunities for CPD. Some professional bodies rec-
ognise RPL as a valid form of knowledge and skills set which contribute to the completion of
qualifications and the awarding of designations.
9.7 Skills Shortages in the Sector
One of Fasset’s key responsibilities is to monitor the skills demand and supply in its sector
and to identify mismatches in the labour market. Chapter 7 of this report looks at the demand-
side of the market and the skills shortages experienced by employers and observed by pro-
fessional bodies. The term “skills shortages” is used to refer to both the quantitative mis-
matches between the demand and supply sides of the labour market and qualitative deficien-
cies in the skills sets of employees.
Skills shortages typically manifest in high staff turnover rates and difficulties experienced by
employers to retain certain categories of staff. In order to gauge the nature and extent of skills
shortages experienced in the sector, employers were asked to identify the occupations in
which they find it difficult to find suitable employees. They were also asked about the number
of vacancies in their organisations in those occupations. According to the employers, a total

Fasset Sector Survey 2016 FINAL REPORT: 29 September 2017
-181-
of 3 573 (three thousand five hundred and seventy three) people would be needed to fill va-
cancies in occupations in which there seemed to be a scarcity of qualified people. These va-
cancies are composed of Managerial (640 (six hundred and forty)); Professionals (2 633 (two
thousand six hundred and thirty three)); Technicians & Associate Professionals (186 (one
hundred and eight six)); and Clerical Support Workers (114 (one hundred and fourteen)).
Poor quality teaching, low Matric pass rates, poor Mathematics competency levels and a lack
of adequate career guidance were the predominant reasons cited by professional bodies for
the various scarce skills in the sector. A lack of funding to address these 4 (four) factors was
believed to be a huge compounding problem.
Majority of organisations (63.4%) reported that they offer learnership programs to address
scarce skills. Learnerships are popular as they offer learners very critical skills that are essen-
tial to the workplace as well as practical experience relating to the work environment. Learners
also have higher chances of getting employed as they can easily adjust to the work environ-
ment because they are also taught other important skills such as social and communication
skills. Other forms of interventions used by organisations in the sector are bursaries (17.1%),
Workplace Training (7.3%), Mentorships (4.9%) and Bridging Programs (4.9%).
9.8 The Supply of Skills to the Sector
The skills required for the sector are produced at school, TVET colleges, private training pro-
viders, universities and workplaces. To a large extent, the issues facing TVET colleges re-
garding quality of lecturing staff mirror those found at universities. Public TVET colleges indi-
cated that they have adequate capacity in terms of lecturing staff, however, their challenge
relates to retaining qualified and experienced employees. As a result of competition from other
organisations, employment in TVET colleges is largely seen as a stepping stone by most uni-
versity graduates. Lecturers at TVET colleges also lack practical work exposure in other or-
ganisations and this affects their ability to integrate theory with relevant industry practice.
Availability of infrastructure is a problem for the majority of university. The problem is rooted
in the rapid expansion in student intake levels which has unfortunately not been matched by
infrastructure growth. This has undoubtedly created infrastructure bottlenecks for student lec-
ture rooms, facilities and lecturer offices. As a result of limited operational budgets, maintaining
available infrastructure is also a challenge.
The high drop-out rates on learnerships remain a challenge that the sector faces. The two
most important reasons for premature termination of learnerships wrong career choices and
financial constraints. Both these are areas that Fasset can address.
Given the toxic atmosphere in which this survey was conducted with the “#FeesMustFall”
campaign in full swing, most training providers raised issues relating to the financial challenges
affecting learners. This indicates that while there is recognition of the South African govern-
ment efforts at providing financial support to tertiary institutions, more still needs to be done.
Concerns were raised regarding the inadequacy of funding to cover student needs such as
accommodation and transport. To a large extent, respondent perceptions reflect the success

Fasset Sector Survey 2016 FINAL REPORT: 29 September 2017
-182-
of government efforts at improving student financial access to financial resources through
NSFAS funding.
Access to workplace learning opportunities is a challenge for tertiary institutions at all levels.
Faced with an economy showing a lacklustre growth, it is hardly surprising that fewer organi-
sations have an appetite to accommodate students for workplace learning opportunities. What
seems evident though is that learners from public TVET colleges have a much better chance
at workplace learning opportunities than their counterparts at universities.
Graduate placement is a challenge confronting universities and TVET colleges alike. Re-
search findings confirmed the poor rate of graduate absorption by the economy. However, it
has to be noted that most training providers do not have a tracking system on their graduates
and it is therefore difficult for them to know where their graduates are employed at any specific
time. Across the spectrum, training providers acknowledged the difficulties faced in the labour
market by some of their graduates. Graduate absorption in the labour market is influenced by
a number of factors including the fit between their qualifications and the rate of growth of the
economy. Both factors may be contributing to the low placement of graduates in the local
labour market.
9.9 Research Capacity and Needs
The SS also assessed the research capacity and research needs in the sector. This area of
focus was included because of the emphasis that the National Skills Development Strategy
(NSDS) III places on research and the SETAs’ responsibilities regarding the development of
research capacity in the country. A review of respondent comments at both university and
TVET colleges indicates that research efforts are not at the level where they should be. Most
of the research referred to is focusing on academic outputs at Masters and PhD level. From
the responses, it is also apparent that research is currently considered an underfunded man-
date with respondents indicating that they would like more funding and guidance by the sector
on areas to focus on.
Current funders include some banks for Research Chairs and the National Research Fund
focusing on specific projects. Respondents indicated that they would like more funding for
research, guidance from Fasset on research areas that are of sectorial interest as well as
training on how to handle research. The need for research capacity building through training
features more prominently at TVET college level. Other issues mentioned include the need for
assistance from Fasset in publicising research outputs and having road shows to publicise
available funding windows for research.
Areas which professional bodies believed that research was needed, and which Fasset could
initiate and fund on behalf of and for the benefit of the sector’s stakeholders, include research
on the future impact of technology; impact of regulation; development of integrated thinking
skills in new graduates and junior professionals; impact of withdrawal of funding from certain
projects such as work readiness programs and learnerships; career guidance as they is need
to research into effective ways in disseminating informative details on different career options
available. Other areas which professional bodies suggested for future research concerns how

Fasset Sector Survey 2016 FINAL REPORT: 29 September 2017
-183-
to build a network of retirees who can mentor learners; how to make CPD more relevant, rather
than a compliance exercise; the impact of language barriers on learners; determine the aver-
age company’s ratio of higher to lower level finance skills; and whether the QCTO model is
workable.
9.10 Stakeholders Expectations from FASSET
As the main driver of skills development in the sector, Fasset carries an enormous responsi-
bility in ensuring that the myriad of skill challenges are not only identified but also managed.
From the respondent’s perspective, the 3 (three) key roles that Fasset ought to play relate to
offering better training opportunities and specific courses focused on addressing specific skills
shortage areas and, perhaps more importantly, providing funding. Majority of respondents
(33%) would like Fasset to offer better training opportunities while 19% would like it to offer
specific training courses. This information is critical in sector skills planning and in ensuring
skills development initiatives focus on areas of strategic importance to stakeholders. The ar-
eas highlighted are at the core of the SETA skills mandate and therefore need further investi-
gation to clarify the specific expectations of the stakeholders.

Fasset Sector Survey 2016 FINAL REPORT: 29 September 2017
-184-
ANNEXURE A: METHODOLGY USED IN CALCULATION OF WEIGHTS
METHODOLGY USED IN CALCULATION OF WEIGHTS – EMPLOYER SURVEY
The sample of employers13was drawn from Fasset’s database of skills levy paying and ac-
cepted non-levy paying organisations. SARS and government departments were also in-
cluded. In order to extrapolate the data collected from the sample of organisations in the sur-
vey to sector totals and to compensate for the use of disproportionate sampling, the data had
to be weighted.
Levy-paying organisations
First, organisations were categorised according to subsector and total SDL amount paid in
2016. Each organisation was categorised based on the sub-sector and levy amounts paid.
The data was sourced from Fasset’s database.
Second, the levy amounts paid by organisations in each category were used to calculate the
weights for the respective categories. Weights were calculated as follows:
WeightC= (LCT /LCS)
Where
LCT = Total levy amount paid by all organisations in Category
and
LCS = Total levy paid by organisations in Category that participated in the survey.
Non-levy paying organisations
The total employment of non-levy paying organisations (NLPs) registered on Fasset’s data-
base in 2016 was used to calculate weights for NLP organisations per subsector. The following
formula was used:
WeightNLP= ENLP total/ENLP sample
Where
ENLP total= Total employment of NLP organisations on the database
and
ENLP sample = Total employment of NLP organisations participating in the survey.
13 Because of the small number of organisations with annual levies higher than R 500 000.00 all were
included in the sample but not all of them participated. All government departments in Fasset were also
included.

Fasset Sector Survey 2016 FINAL REPORT: 29 September 2017
-185-
Table B—1 shows the weights used for levy paying and non-levy paying organisations (em-
ployers).
TABLE B – 1 FINAL WEIGHTS: EMPLOYERS
Row La-bels
Account-ing, Bookkeep-ing, Audit-ing and Tax Ser-vices
Activities Auxiliary to Finan-cial Inter-mediation
Business and Man-agement Consult-ing Ser-vices
Develop-ment Or-ganisa-tions
Invest-ment En-tities and Trusts and Com-pany Sec-retary Services
Stock-broking and Fi-nancial Markets
SARS and Govern-ment Depart-ments
NLP 1 3,8823529 1,000000 23,000000 1,000000 14,000000 1,000000 1,000000
<10000 2 4,669899 1,000000 13,058955 1,5342935 1,000000 16,473107
10000-49999 3 4,1403544 17,25878 6,8486341 4,6823778 9,6349586 8,6155843
50000-99999 4 3,5286272 23,525205 4,8396387 1,0000000 7,9189207 13,807874
100000-499999 5 3,9936288 7,251308 5,5924027 1,1048318 2,5367993 5,8557437
500000-999999 6 3,5835224 1,9258655 5,8971451 1,3167453 1,6383293 10,959629
>1000000 7 1,4087638 1,9262304 3,4227327 1,0000000 16,210232 5,4960209
Besides summarised total employment figures, organisations also had to provide detailed bi-
ographical information on individual employees. Not all organisations could assist the research
team with this information and not all information provided could be used. Detailed employee
information received in the survey had to be re-weighed. The same category system as ex-
plained above was used and weights that could be applied to the individual records belonging
to organisations in each category were calculated as follows:
Weight IE = EC/ES
Where
EC= total weighted employment of organisations in the category and
ES = Total number of individual employee records of organisations in the category.

Fasset Sector Survey 2016 FINAL REPORT: 29 September 2017
-186-
ANNEXURE B: PROJECTIONS OF EMPLOYMENT BY DIFFERENT OCCUPATIONS
i. Clerical Support
Low Growth of 1% 2016 2017 2018 2019 2020 2021
Total employment at the beginning of the year 41435 45433 50490 56111 62355 69295
New positions to be filled during the year 269 968 1075 1195 1328 1476
Positions that need to be replaced during the year 3729 4089 4544 5050 5612 6237
Total positions to be filled during the year 3998 5057 5620 6245 6940 7713
Total employment at the end of the year 45433 50490 56110 62355 69295 77007
Baseline Growth of 2% 2016 2017 2018 2019 2020 2021
Total employment at the beginning of the year 41435 45703 53929 60801 68292 76458
New positions to be filled during the year 539 1622 1914 2158 2424 2714
Positions that need to be replaced during the year 3729 4113 4854 5472 6146 6881
Total positions to be filled during the year 4268 8227 6872 7491 8166 8902
Total employment at the end of the year 45703 53929 60801 68292 76458 85361
High Growth of 4% 2016 2017 2018 2019 2020 2021
Total employment at the beginning of the year 41435 46241 52701 60064 68455 78018
New positions to be filled during the year 1077 2298 2619 2985 3402 3877
Positions that need to be replaced during the year 3729 4162 4743 5406 6161 7022
Total positions to be filled during the year 4806 6460 7362 8391 9563 10899
Total employment at the end of the year 46241 52701 60064 68455 78018 88917
ii. Technicians
Low Growth of 1% 2016 2017 2018 2019 2020 2021
Total employment at the beginning of the year 14828 16909 18791 20882 23206 25789
New positions to be filled during the year 746 360 400 445 494 549
Positions that need to be replaced during the year 1335 1522 1691 1879 2089 2321
Total positions to be filled during the year 2081 1882 2091 2324 2583 2870
Total employment at the end of the year 16909 18791 20882 23206 25789 28660
Baseline Growth of 2% 2016 2017 2018 2019 2020 2021
Total employment at the beginning of the year 14828 16355 19299 23054 27148 31611
New positions to be filled during the year 193 581 685 818 964 1122
Positions that need to be replaced during the year 1335 1472 1737 2075 2443 2845
Total positions to be filled during the year 1527 2944 3755 4094 4463 4866
Total employment at the end of the year 16355 19299 23054 27148 31611 36477

Fasset Sector Survey 2016 FINAL REPORT: 29 September 2017
-187-
High Growth of 4% 2016 2017 2018 2019 2020 2021
Total employment at the beginning of the year 14828 16548 18860 21495 24497 27920
New positions to be filled during the year 386 822 937 1068 1218 1388
Positions that need to be replaced during the year 1335 1489 1697 1935 2205 2513
Total positions to be filled during the year 1720 2312 2635 3003 3422 3900
Total employment at the end of the year 16548 18860 21495 24497 27920 31820
iii. Professionals
Low Growth of 1% 2016 2017 2018 2019 2020 2021
Total employment at the beginning of the year 55708 61084 67882 75438 83834 93165
New positions to be filled during the year 362 1301 1446 1607 1786 1984
Positions that need to be replaced during the year 5014 5498 6109 6789 7545 8385
Total positions to be filled during the year 5376 6799 7555 8396 9331 10369
Total employment at the end of the year 61084 67882 75438 83834 93165 103534
Baseline Growth of 2% 2016 2017 2018 2019 2020 2021
Total employment at the beginning of the year 55708 61446 72506 81050 90363 100516
New positions to be filled during the year 724 2181 2574 2877 3208 3568
Positions that need to be replaced during the year 5014 5530 6526 7294 8133 9046
Total positions to be filled during the year 5738 11060 8544 9313 10153 11067
Total employment at the end of the year 61446 72506 81050 90363 100516 111583
High Growth of 4% 2016 2017 2018 2019 2020 2021
Total employment at the beginning of the year 55708 62170 70855 80754 92035 104892
New positions to be filled during the year 1448 3090 3522 4013 4574 5213
Positions that need to be replaced during the year 5014 5595 6377 7268 8283 9440
Total positions to be filled during the year 6462 8685 9898 11281 12857 14653
Total employment at the end of the year 62170 70855 80754 92035 104892 119546
iv. Managers
Low Growth of 1% 2016 2017 2018 2019 2020 2021
Total employment at the beginning of the year 19678 21577 23978 26647 29613 32909
New positions to be filled during the year 128 460 511 568 631 701
Positions that need to be replaced during the year 1771 1942 2158 2398 2665 2962
Total positions to be filled during the year 1899 2402 2669 2966 3296 3663
Total employment at the end of the year 21577 23978 26647 29613 32909 36572

Fasset Sector Survey 2016 FINAL REPORT: 29 September 2017
-188-
Baseline Growth of 2% 2016 2017 2018 2019 2020 2021
Total employment at the beginning of the year 19678 21705 25612 29935 34648 39786
New positions to be filled during the year 256 771 909 1063 1230 1412
Positions that need to be replaced during the year 1771 1953 2305 2694 3118 3581
Total positions to be filled during the year 2027 3907 4323 4713 5138 5602
Total employment at the end of the year 21705 25612 29935 34648 39786 45388
High Growth of 4% 2016 2017 2018 2019 2020 2021
Total employment at the beginning of the year 19678 21961 25029 28525 32510 37052
New positions to be filled during the year 512 1091 1244 1418 1616 1841
Positions that need to be replaced during the year 1771 1976 2253 2567 2926 3335
Total positions to be filled during the year 2283 3068 3496 3985 4542 5176
Total employment at the end of the year 21961 25029 28525 32510 37052 42228
Top Related