


Languages
Pages
Legal

© Experian Public
Experian Automotive Quarterly Briefing Fourth quarter 2016 automotive market share trends and registrations
Brad Smith | Director, Automotive Market Statistics
Marty Miller | Senior Product Manager, Vehicles in Operation (VIO)
2 © Experian Public
Today’s presentationPart one
Presentation will be available 24-48 hours after Webinar
Email with a link will be sent to all registrants to download
Questions? Contact us at [email protected]
What’s on the Road
VIO by model year, segment, age and market share
U.S. light duty vehicles through December 31, 2016
U.S. medium and heavy duty vehicles through December 31, 2016
Marty Miller
Senior Product Manager, VIO
3 © Experian Public
Q4 2016 Registrations
Market trends
Geographic performance
Manufacturer, make and model share
Loyalty, conquest and defection
Session overviewPart two
Brad Smith
Director, Automotive
Market Statistics

4 © Experian Public
U.S. Total Vehicles in Operation = 283.8M
Light Duty
Passenger Cars, Light Trucks, Vans
Cars and GVW Class 1 - 3
Medium & Heavy Duty
Large Vans, Delivery Trucks, Buses, RVs,
Cement Trucks, Semi-Tractors
GVW Class 4 - 8
Power Sports
Motorcycles, All-Terrain,
Utility Task, Snowmobiles*Q4 2016 includes Puerto Rico
5 © Experian Public
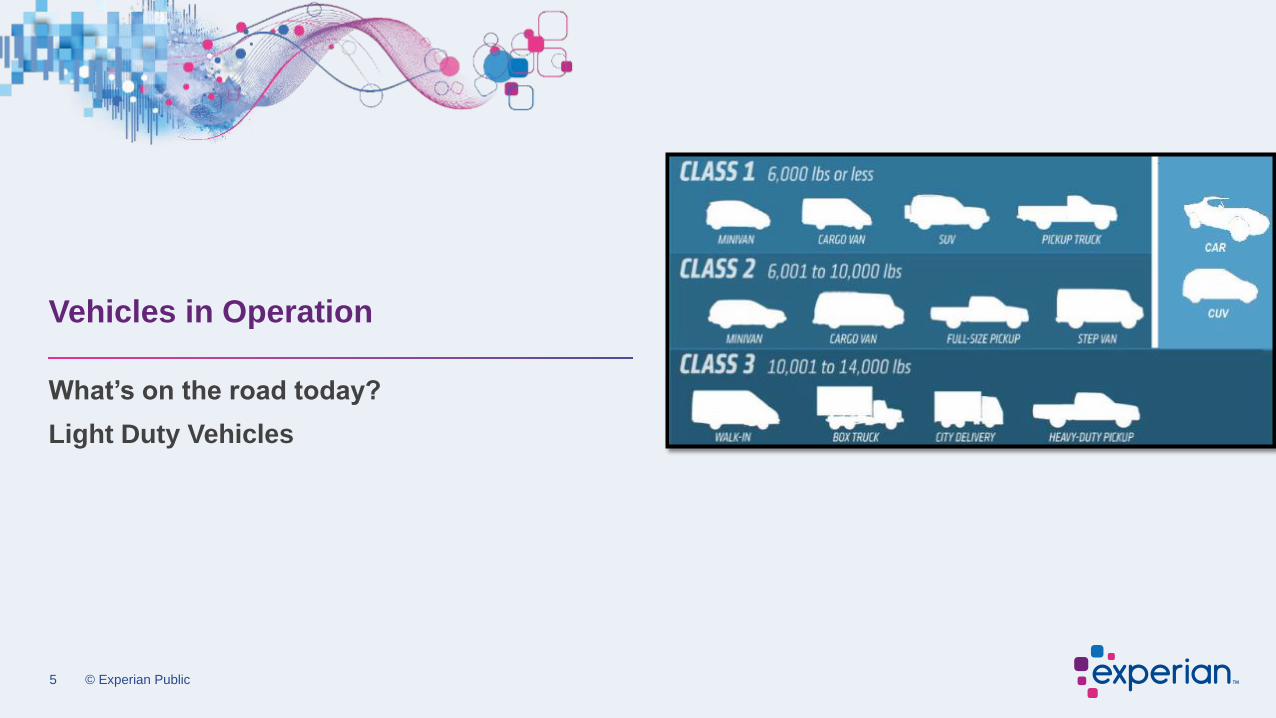
What’s on the road today?
Light Duty Vehicles
Vehicles in Operation
6 © Experian Public
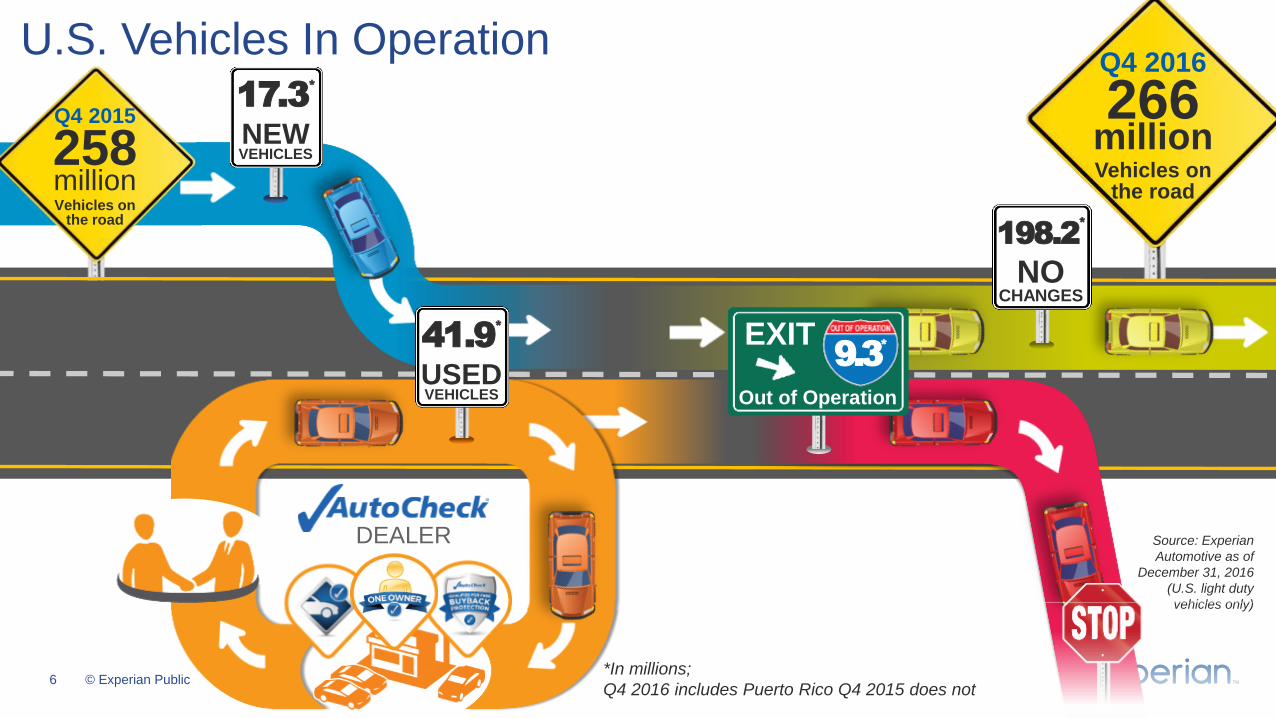
Source: Experian
Automotive as of
December 31, 2016
(U.S. light duty
vehicles only)
U.S. Vehicles In Operation
Q4 2015
258millionVehicles on
the road
Q4 2016
266millionVehicles on
the road
17.3*
NEWVEHICLES
DEALER
41.9*
USEDVEHICLES
198.2*
NOCHANGES
9.3*
EXIT
Out of Operation
*In millions;
Q4 2016 includes Puerto Rico Q4 2015 does not
7 © Experian Public
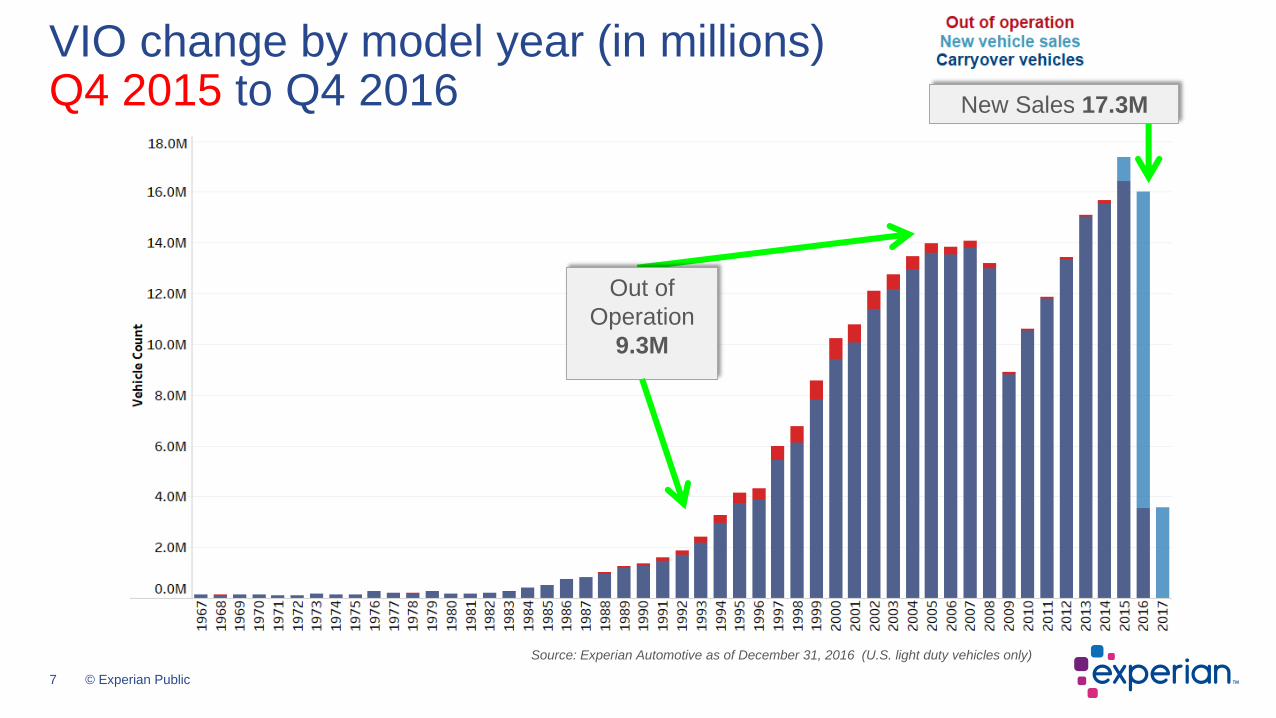
VIO change by model year (in millions)Q4 2015 to Q4 2016 New Sales 17.3M
Out of
Operation
9.3M
Source: Experian Automotive as of December 31, 2016 (U.S. light duty vehicles only)
8 © Experian Public
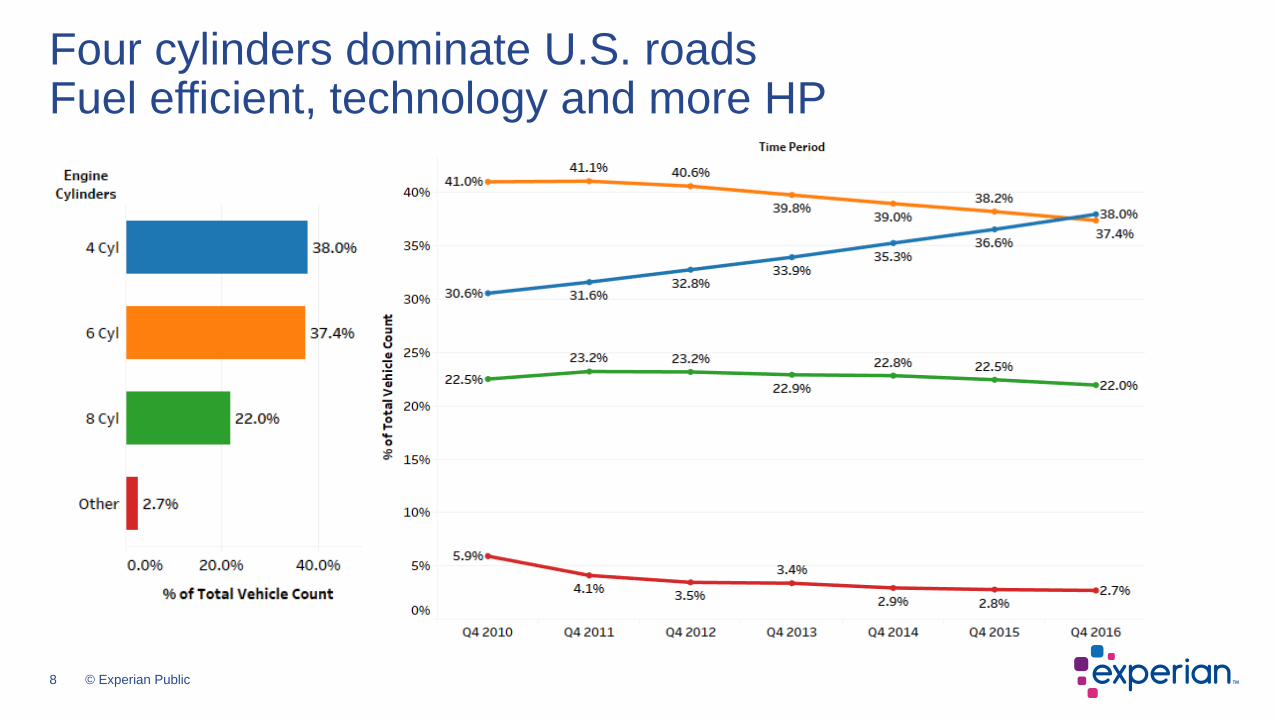
Four cylinders dominate U.S. roadsFuel efficient, technology and more HP
9 © Experian Public
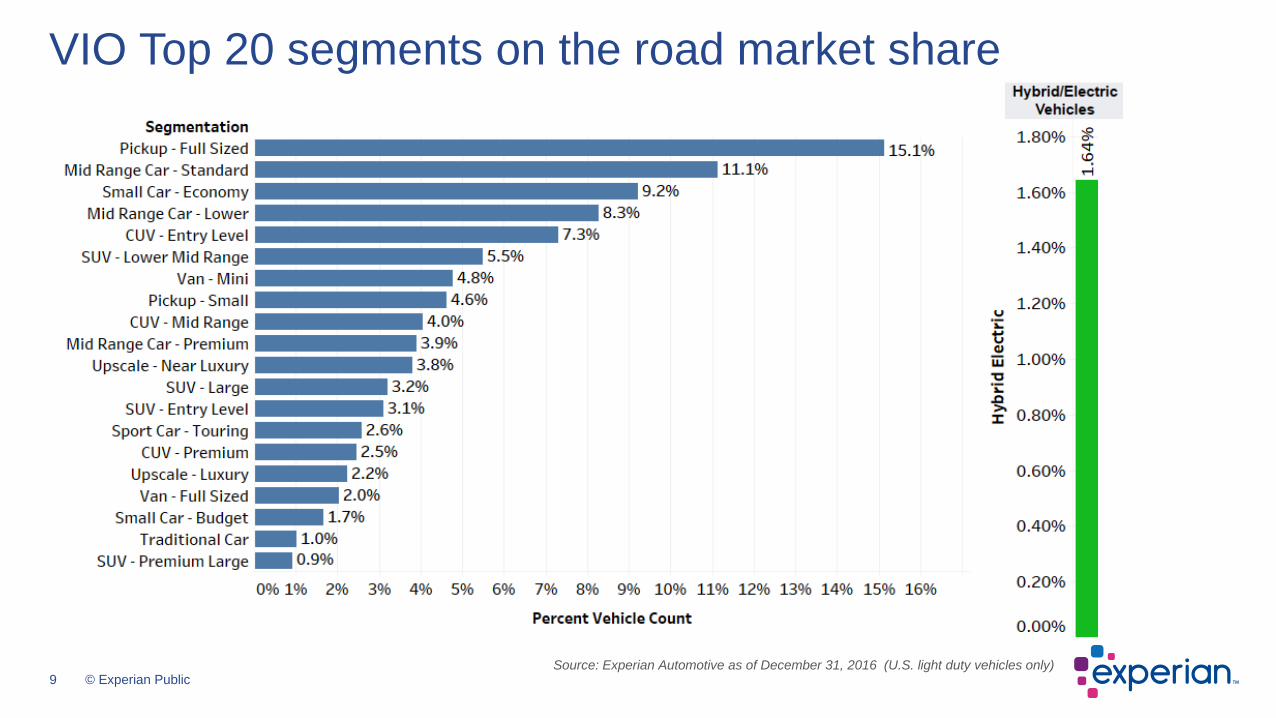
VIO Top 20 segments on the road market share
Source: Experian Automotive as of December 31, 2016 (U.S. light duty vehicles only)
10 © Experian Public
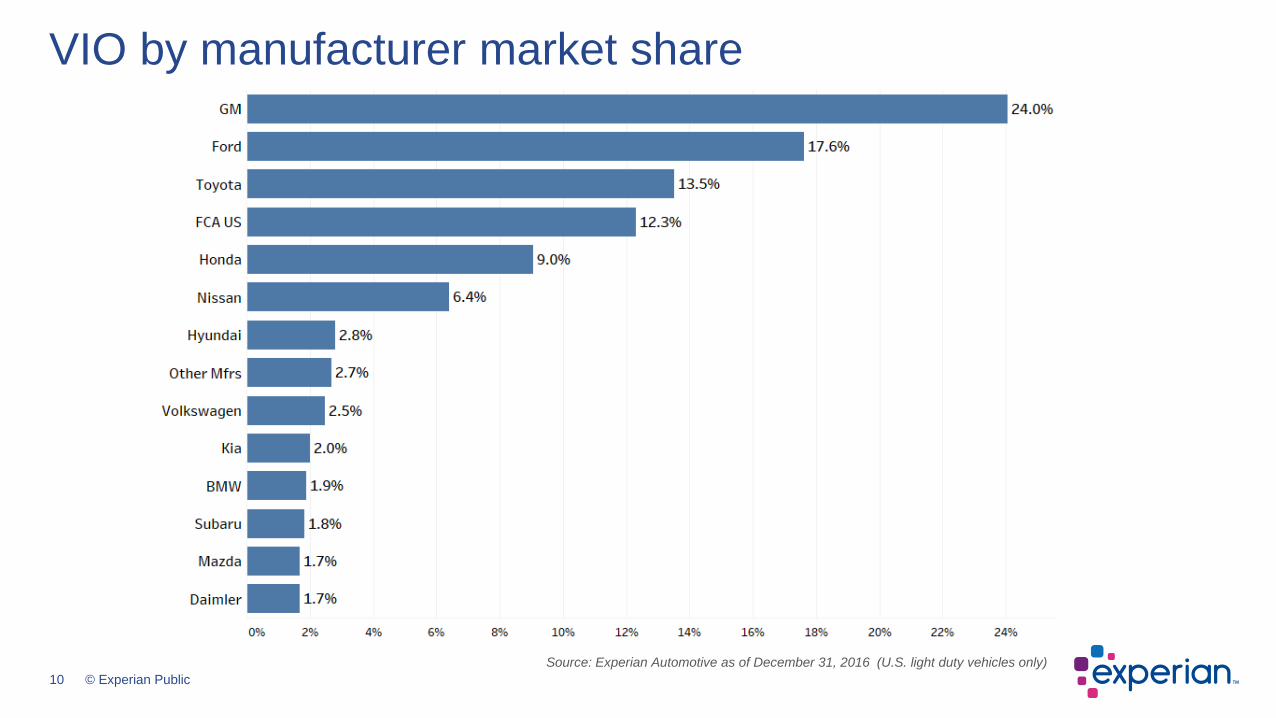
VIO by manufacturer market share
Source: Experian Automotive as of December 31, 2016 (U.S. light duty vehicles only)
11 © Experian Public
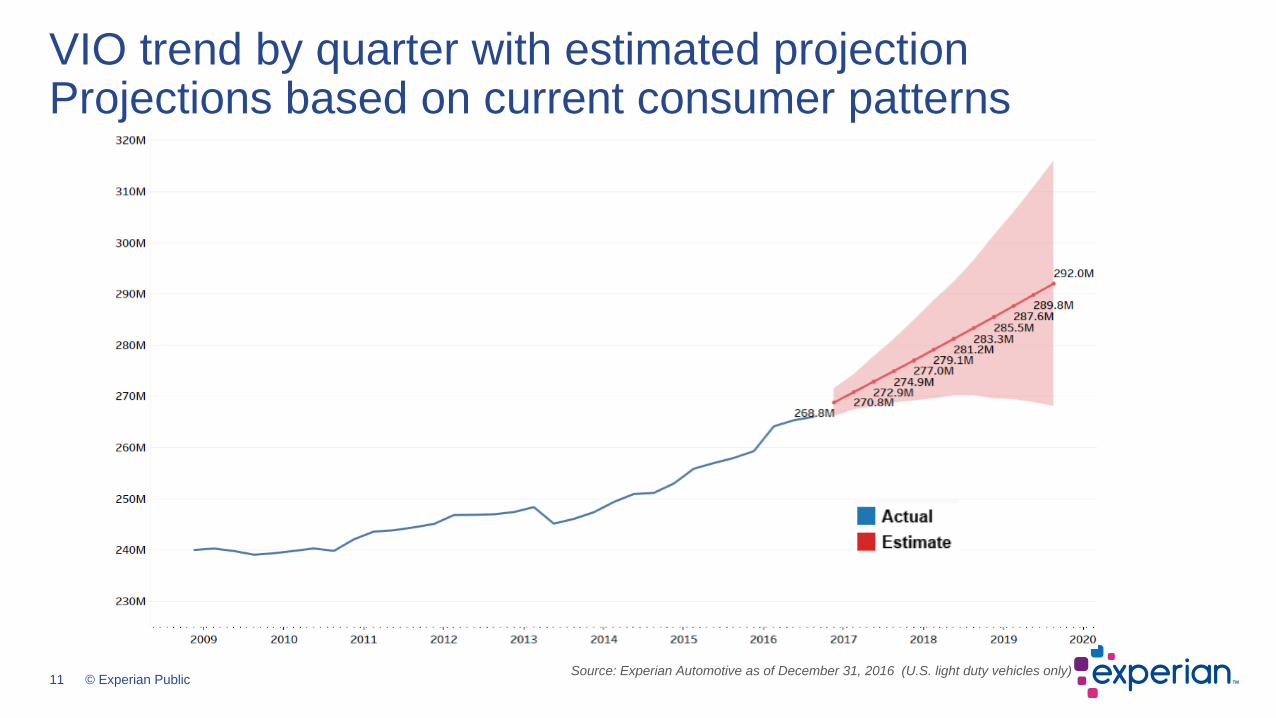
VIO trend by quarter with estimated projectionProjections based on current consumer patterns
Source: Experian Automotive as of December 31, 2016 (U.S. light duty vehicles only)
12 © Experian Public
The aftermarket “Sweet Spot” is defined as 6 to 12 model year old vehicles, and because of their age, are out of the general OEM manufacturer warranty for any repairs.
These vehicles are within a time period when more part replacement or services are needed (e.g. shocks, timing belt service, engine repairs) that may be performed by aftermarket service shops which are supplied by aftermarket part manufacturers and retailers.
Defining the Sweet Spot size helps identify the overall market potential, and changes can have implications to those that service it.
“Post Sweet Spot” vehicles are defined as 13 model years old or older, and identify the models where less costs may be spent to service them due to their age and vehicle value.
“Pre Sweet Spot” vehicles are defined as 5 model years old or newer, and identify the incoming models into the Sweet Spot.
The aftermarket “Sweet Spot” overview“Post” and “Pre” Sweet Spot defined
13 © Experian Public
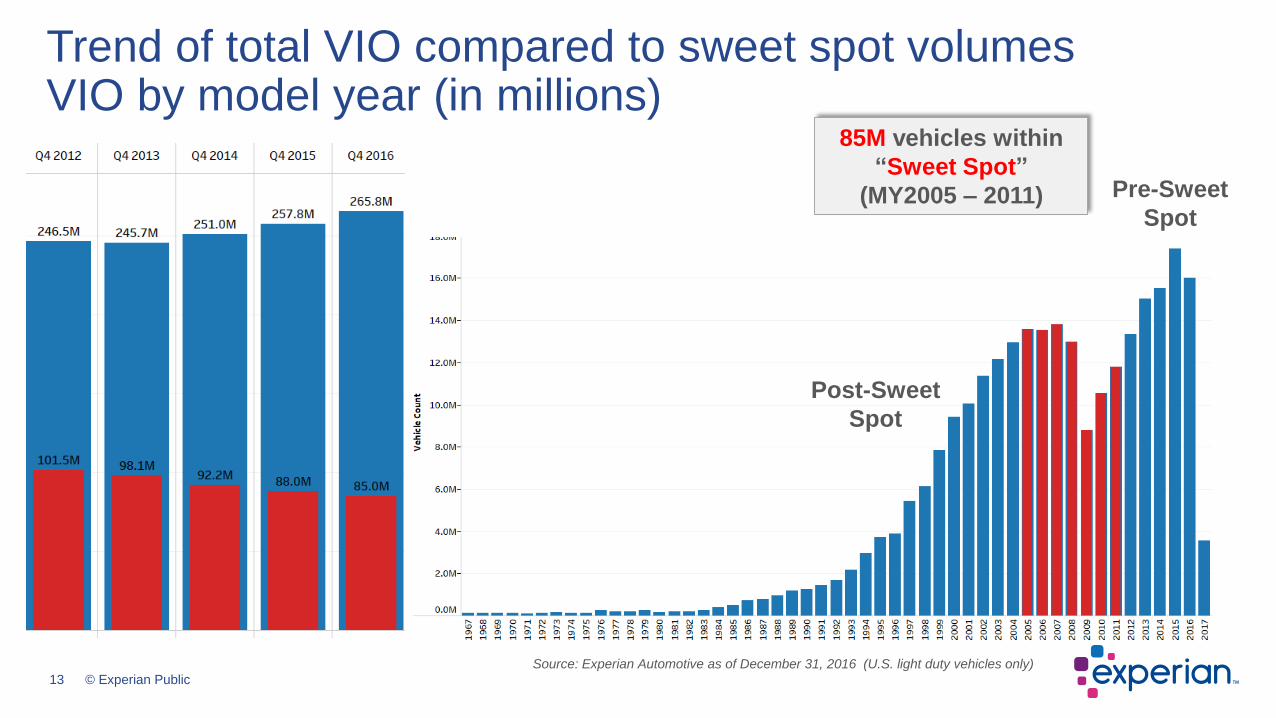
Trend of total VIO compared to sweet spot volumesVIO by model year (in millions)
85M vehicles within
“Sweet Spot”
(MY2005 – 2011) Pre-Sweet
Spot
Post-Sweet
Spot
Source: Experian Automotive as of December 31, 2016 (U.S. light duty vehicles only)
14 © Experian Public
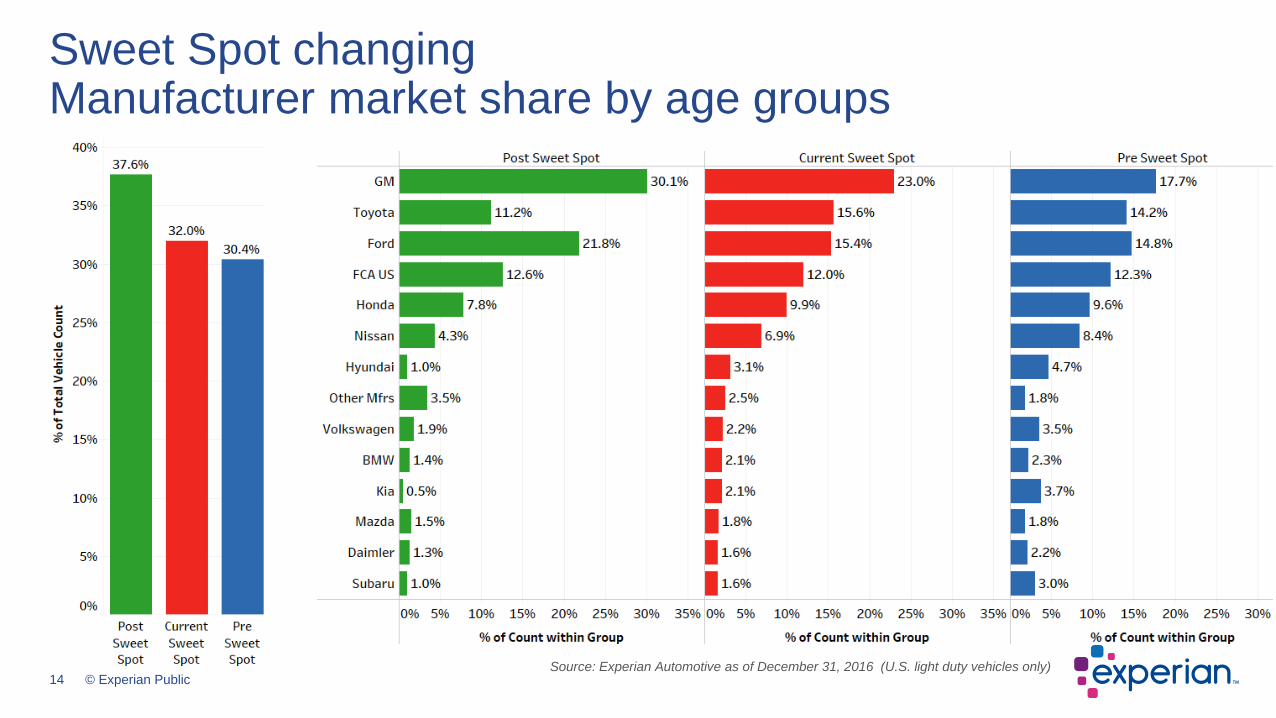
Sweet Spot changingManufacturer market share by age groups
Source: Experian Automotive as of December 31, 2016 (U.S. light duty vehicles only)
15 © Experian Public
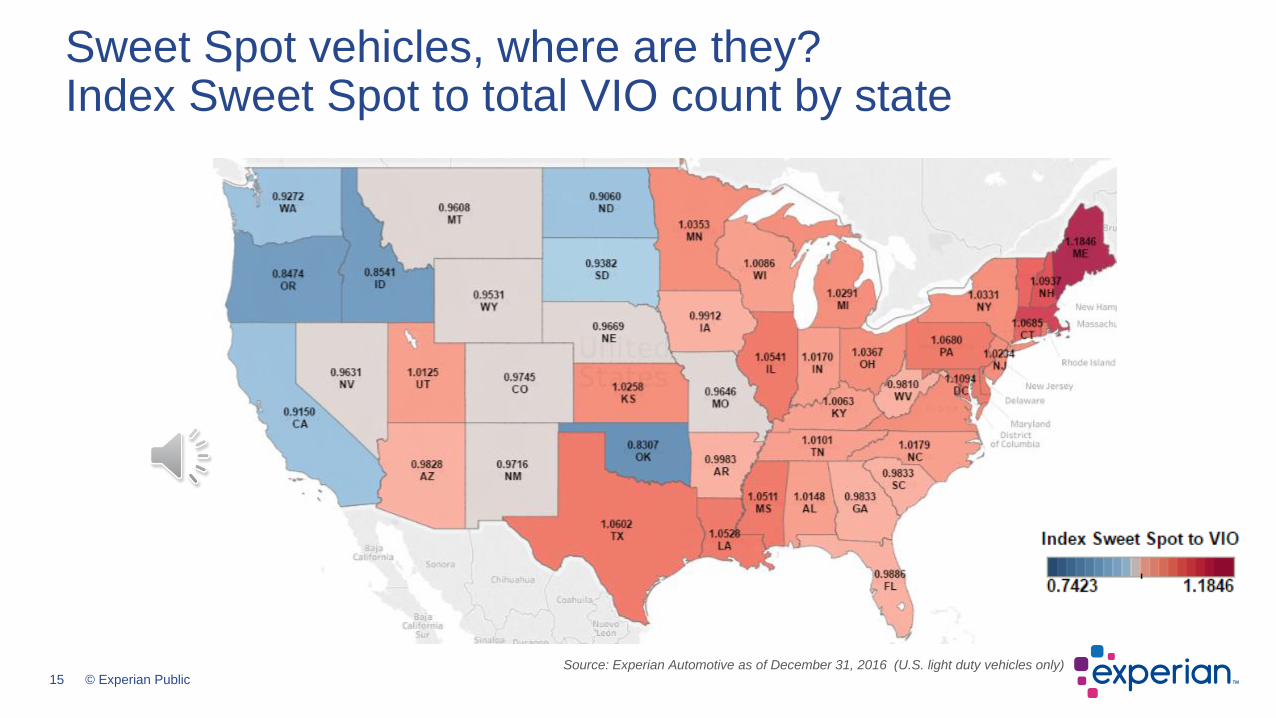
Sweet Spot vehicles, where are they?Index Sweet Spot to total VIO count by state
Source: Experian Automotive as of December 31, 2016 (U.S. light duty vehicles only)
16 © Experian Public
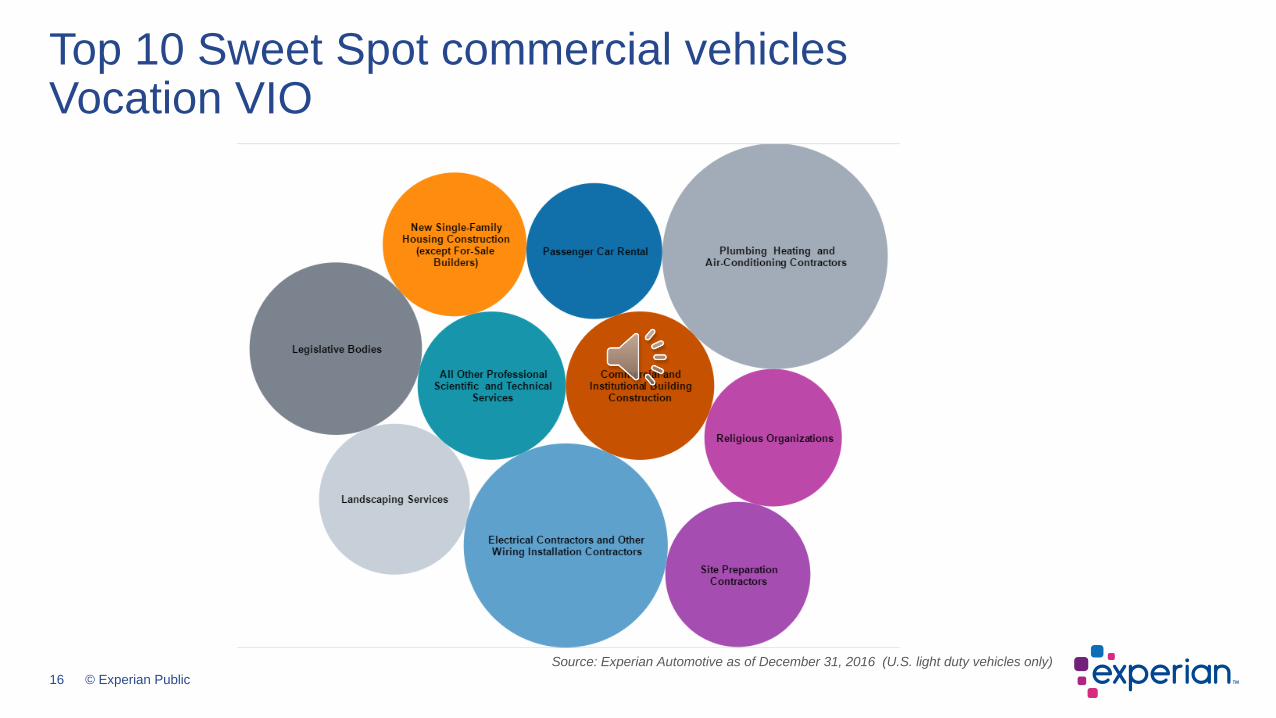
Top 10 Sweet Spot commercial vehiclesVocation VIO
Source: Experian Automotive as of December 31, 2016 (U.S. light duty vehicles only)
17 © Experian Public
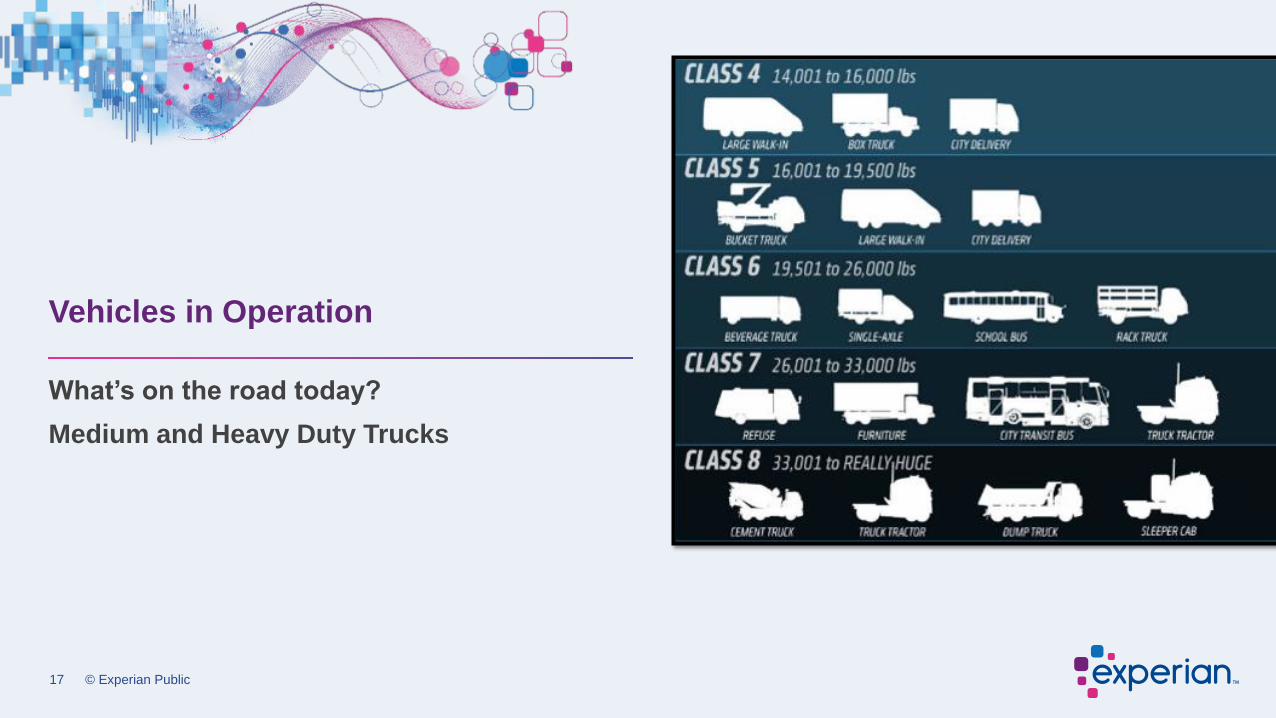
What’s on the road today?
Medium and Heavy Duty Trucks
Vehicles in Operation
18 © Experian Public
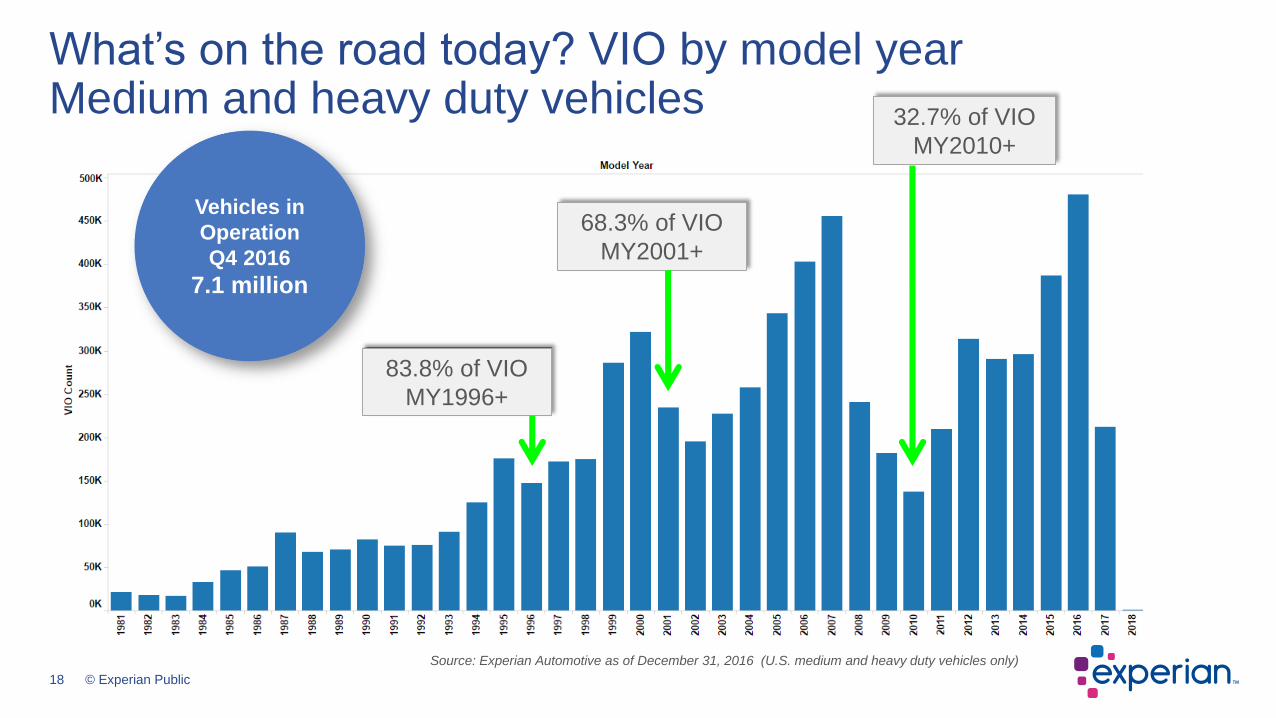
What’s on the road today? VIO by model yearMedium and heavy duty vehicles
32.7% of VIO
MY2010+
68.3% of VIO
MY2001+
83.8% of VIO
MY1996+
Vehicles in
Operation
Q4 2016
7.1 million
Source: Experian Automotive as of December 31, 2016 (U.S. medium and heavy duty vehicles only)
19 © Experian Public
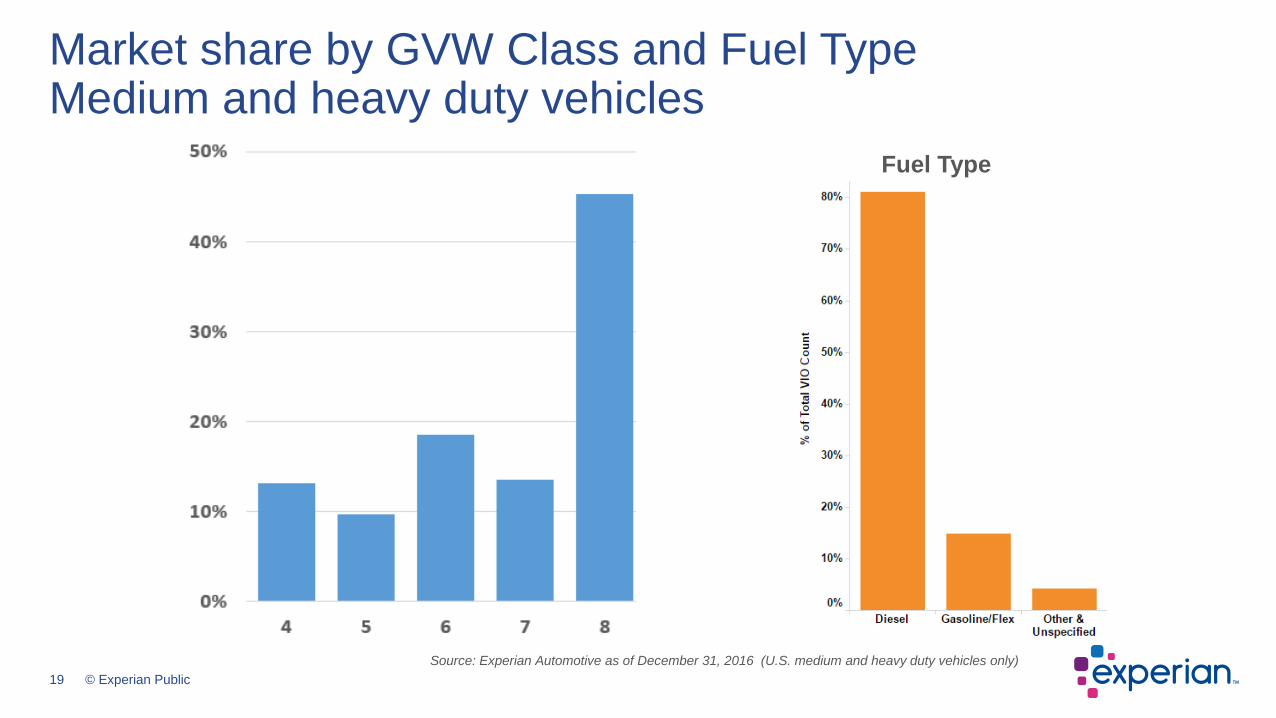
Market share by GVW Class and Fuel TypeMedium and heavy duty vehicles
GVW Class Fuel Type
Source: Experian Automotive as of December 31, 2016 (U.S. medium and heavy duty vehicles only)
20 © Experian Public
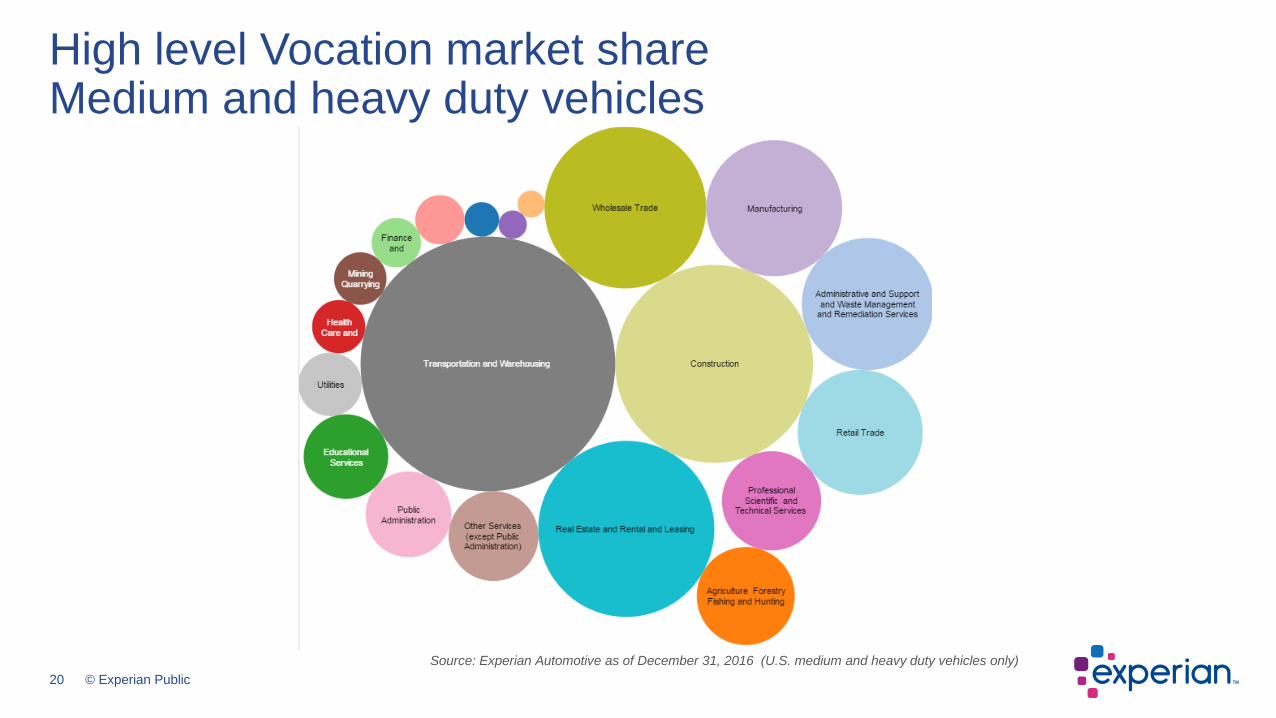
High level Vocation market shareMedium and heavy duty vehicles
Source: Experian Automotive as of December 31, 2016 (U.S. medium and heavy duty vehicles only)
© Experian [Public, Confidential, Internal, Restricted – choose the appropriate category]
U.S. Market Overview
• New registration totals• Year over year changes in performance• Share by sales category• Impact of demographics on purchasing behavior• Share across geographies and vehicle segments• Brand leaders
22 © Experian Public
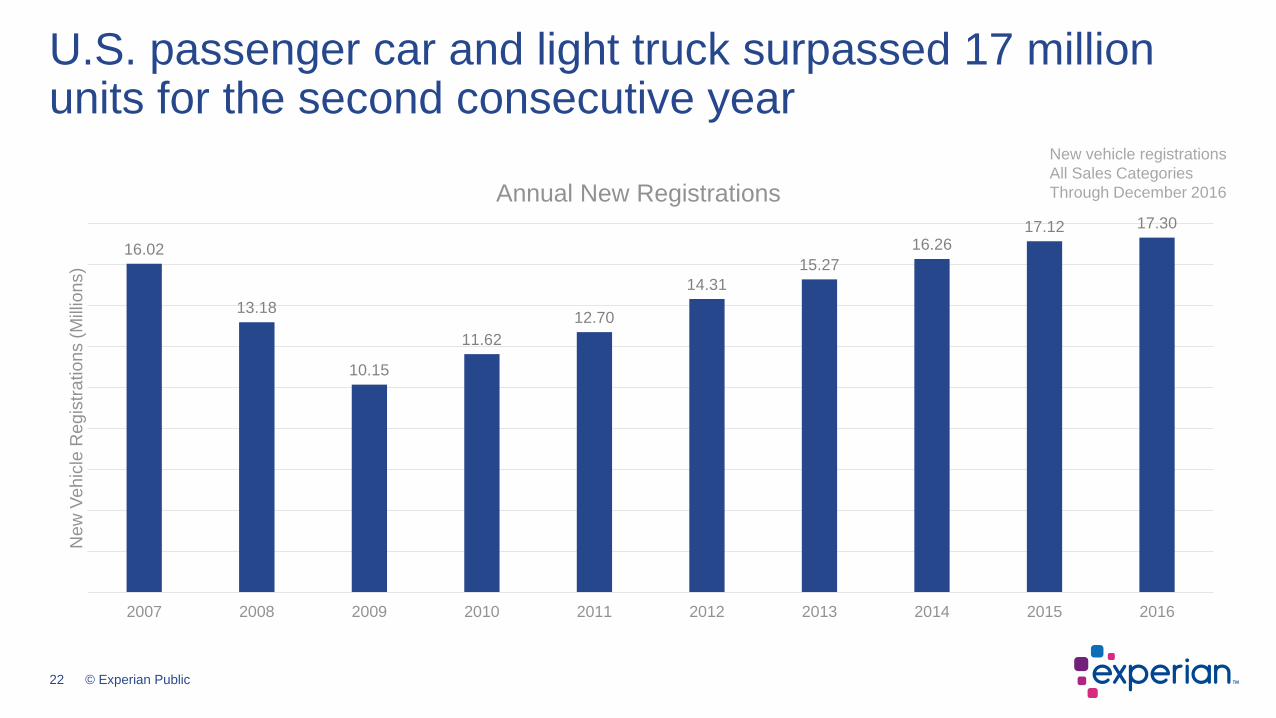
16.02
13.18
10.15
11.62
12.70
14.31
15.27
16.2617.12 17.30
2007 2008 2009 2010 2011 2012 2013 2014 2015 2016
New
Veh
icle
Reg
istr
ations (
Mill
ion
s)
Annual New Registrations
U.S. passenger car and light truck surpassed 17 million units for the second consecutive year
New vehicle registrations
All Sales Categories
Through December 2016
23 © Experian Public
-17.72%
-23.05%
14.56%
9.26%
12.65%
6.73% 6.52%5.29%
1.03%
-25%
-20%
-15%
-10%
-5%
0%
5%
10%
15%
20%
2008 2009 2010 2011 2012 2013 2014 2015 2016
% Y
OY
Cha
ng
e
Year over Year Change in New Vehicle Registrations
Gains in annual new vehicle registrations have been steadily declining since 2012
New vehicle registrations
All Sales Categories
Through December 2016
24 © Experian Public
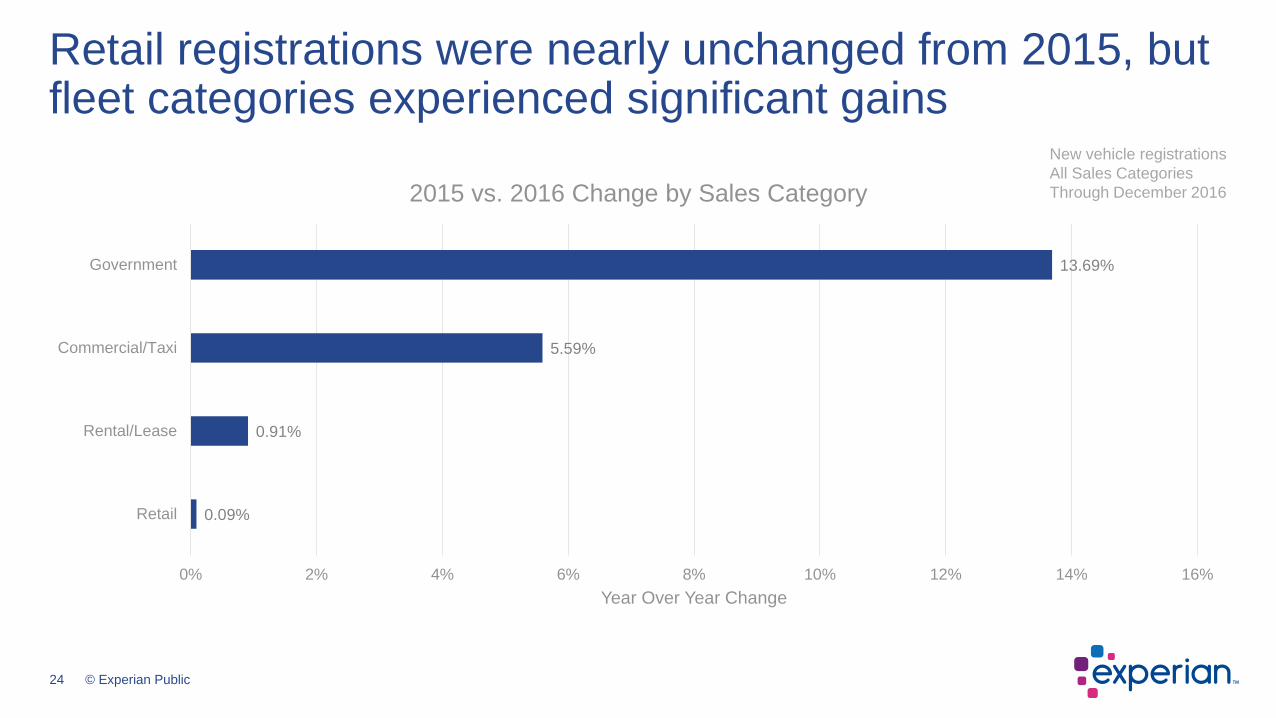
0.09%
0.91%
5.59%
13.69%
0% 2% 4% 6% 8% 10% 12% 14% 16%
Retail
Rental/Lease
Commercial/Taxi
Government
Year Over Year Change
2015 vs. 2016 Change by Sales Category
Retail registrations were nearly unchanged from 2015, but fleet categories experienced significant gains
New vehicle registrations
All Sales Categories
Through December 2016
25 © Experian Public
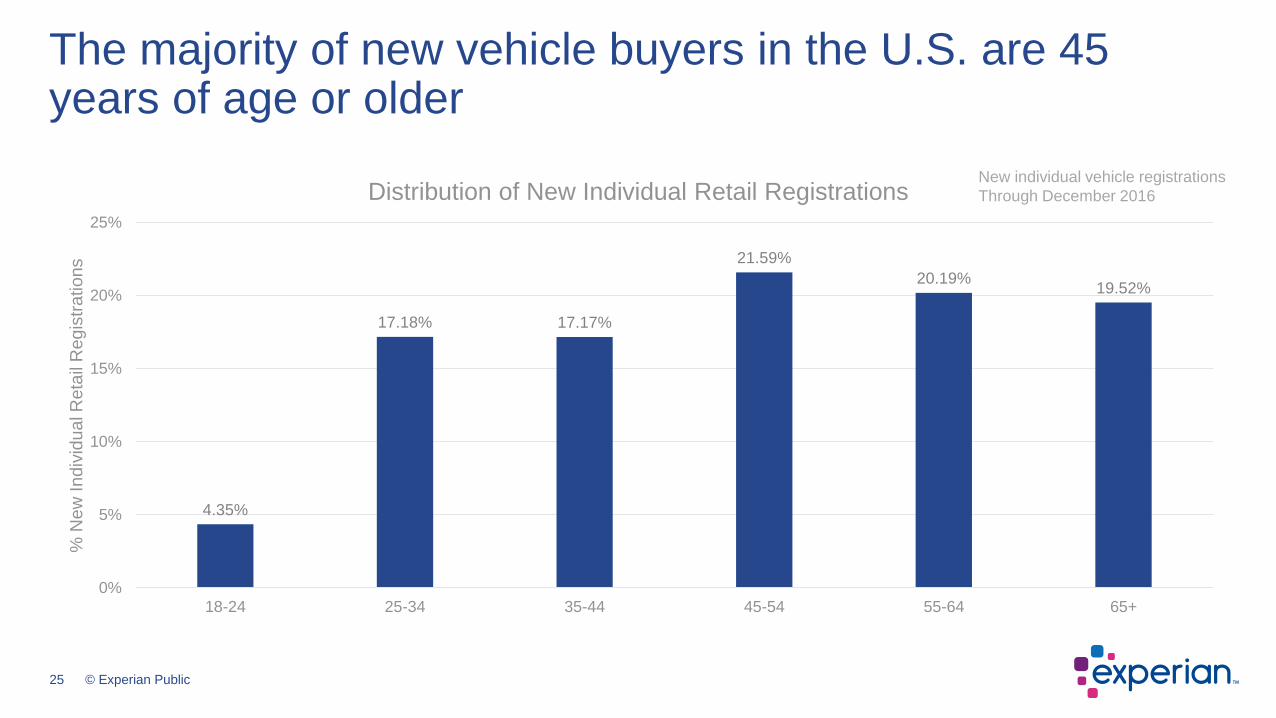
4.35%
17.18% 17.17%
21.59%
20.19%19.52%
0%
5%
10%
15%
20%
25%
18-24 25-34 35-44 45-54 55-64 65+
% N
ew
In
div
idu
al R
eta
il R
eg
istr
ations
Distribution of New Individual Retail Registrations
The majority of new vehicle buyers in the U.S. are 45 years of age or older
New individual vehicle registrations
Through December 2016
26 © Experian Public
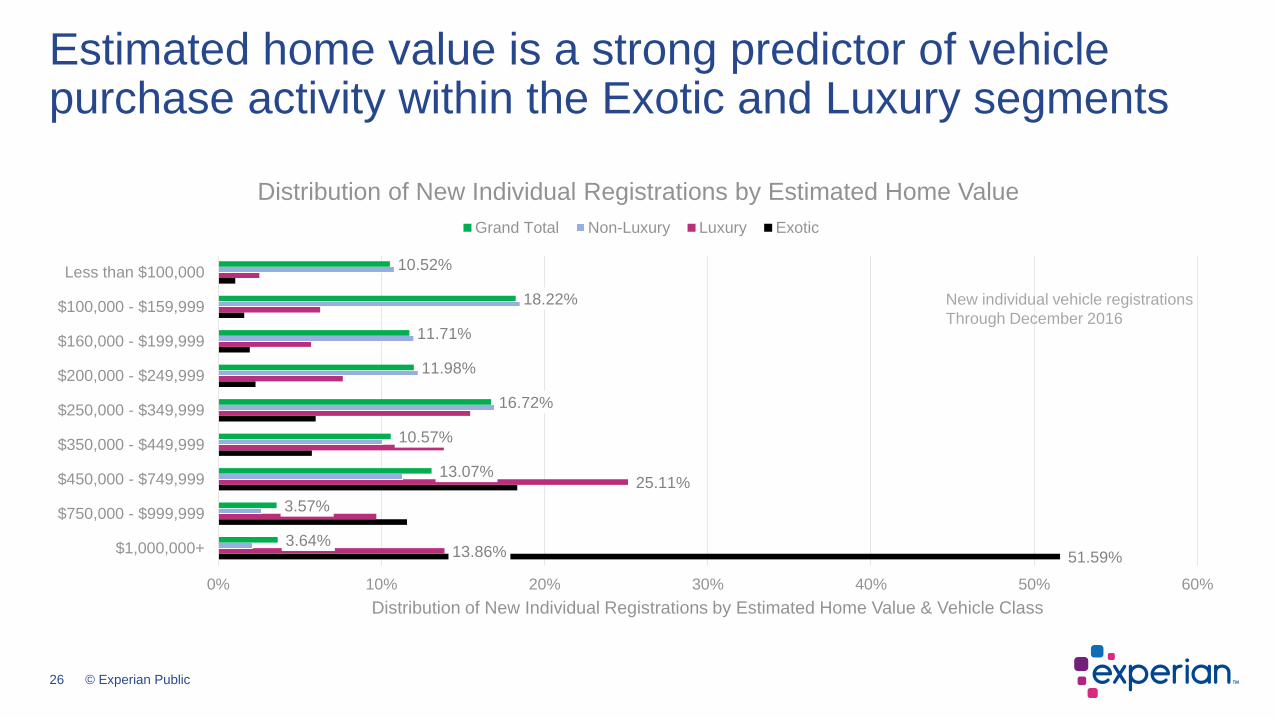
51.59%13.86%
25.11%
3.64%
3.57%
13.07%
10.57%
16.72%
11.98%
11.71%
18.22%
10.52%
0% 10% 20% 30% 40% 50% 60%
$1,000,000+
$750,000 - $999,999
$450,000 - $749,999
$350,000 - $449,999
$250,000 - $349,999
$200,000 - $249,999
$160,000 - $199,999
$100,000 - $159,999
Less than $100,000
Distribution of New Individual Registrations by Estimated Home Value & Vehicle Class
Distribution of New Individual Registrations by Estimated Home Value
Grand Total Non-Luxury Luxury Exotic
Estimated home value is a strong predictor of vehicle purchase activity within the Exotic and Luxury segments
New individual vehicle registrations
Through December 2016
27 © Experian Public
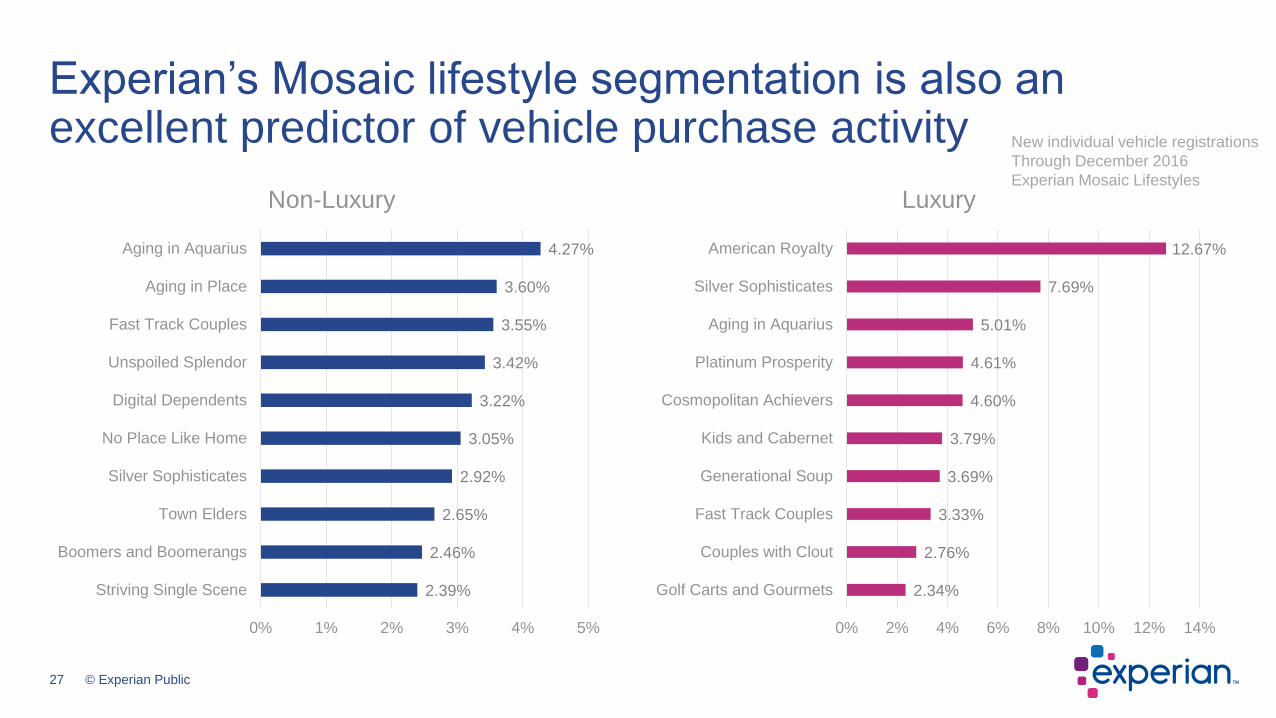
2.39%
2.46%
2.65%
2.92%
3.05%
3.22%
3.42%
3.55%
3.60%
4.27%
0% 1% 2% 3% 4% 5%
Striving Single Scene
Boomers and Boomerangs
Town Elders
Silver Sophisticates
No Place Like Home
Digital Dependents
Unspoiled Splendor
Fast Track Couples
Aging in Place
Aging in Aquarius
Non-Luxury
Experian’s Mosaic lifestyle segmentation is also an excellent predictor of vehicle purchase activity
2.34%
2.76%
3.33%
3.69%
3.79%
4.60%
4.61%
5.01%
7.69%
12.67%
0% 2% 4% 6% 8% 10% 12% 14%
Golf Carts and Gourmets
Couples with Clout
Fast Track Couples
Generational Soup
Kids and Cabernet
Cosmopolitan Achievers
Platinum Prosperity
Aging in Aquarius
Silver Sophisticates
American Royalty
Luxury
New individual vehicle registrations
Through December 2016
Experian Mosaic Lifestyles
28 © Experian Public
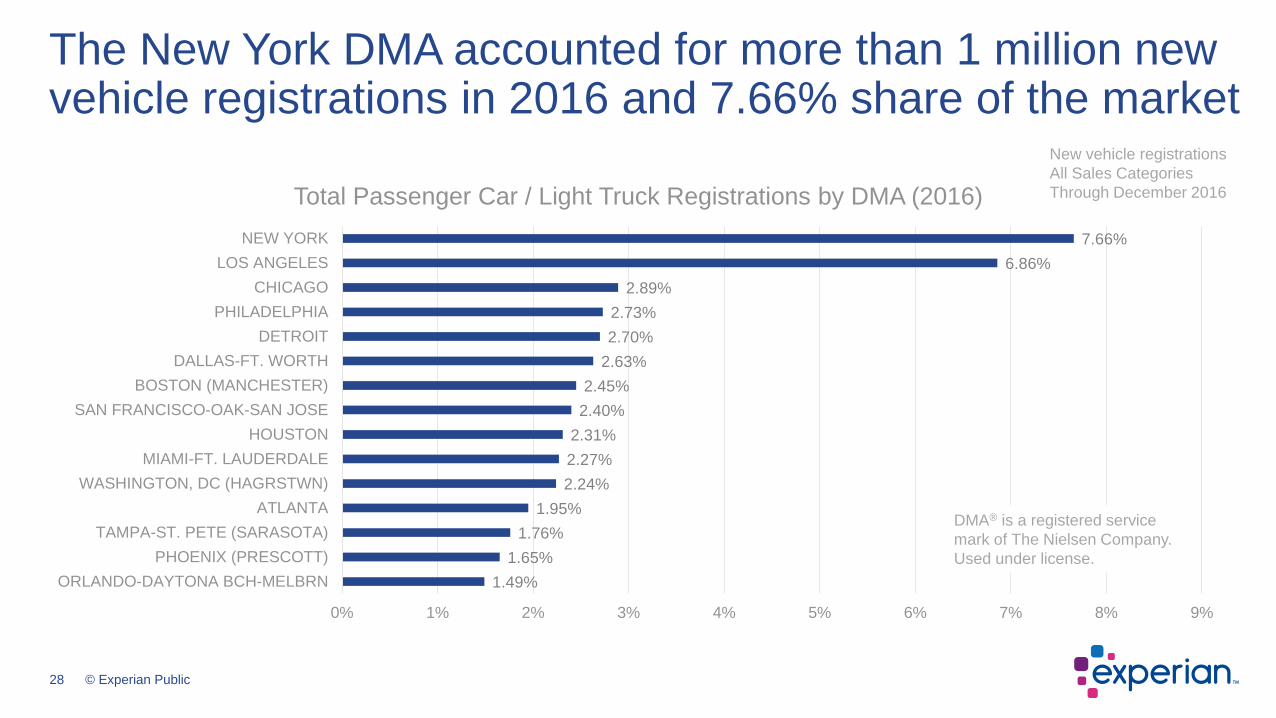
1.49%
1.65%
1.76%
1.95%
2.24%
2.27%
2.31%
2.40%
2.45%
2.63%
2.70%
2.73%
2.89%
6.86%
7.66%
0% 1% 2% 3% 4% 5% 6% 7% 8% 9%
ORLANDO-DAYTONA BCH-MELBRN
PHOENIX (PRESCOTT)
TAMPA-ST. PETE (SARASOTA)
ATLANTA
WASHINGTON, DC (HAGRSTWN)
MIAMI-FT. LAUDERDALE
HOUSTON
SAN FRANCISCO-OAK-SAN JOSE
BOSTON (MANCHESTER)
DALLAS-FT. WORTH
DETROIT
PHILADELPHIA
CHICAGO
LOS ANGELES
NEW YORK
Total Passenger Car / Light Truck Registrations by DMA (2016)
The New York DMA accounted for more than 1 million new vehicle registrations in 2016 and 7.66% share of the market
New vehicle registrations
All Sales Categories
Through December 2016
DMA® is a registered service
mark of The Nielsen Company.
Used under license.
29 © Experian Public
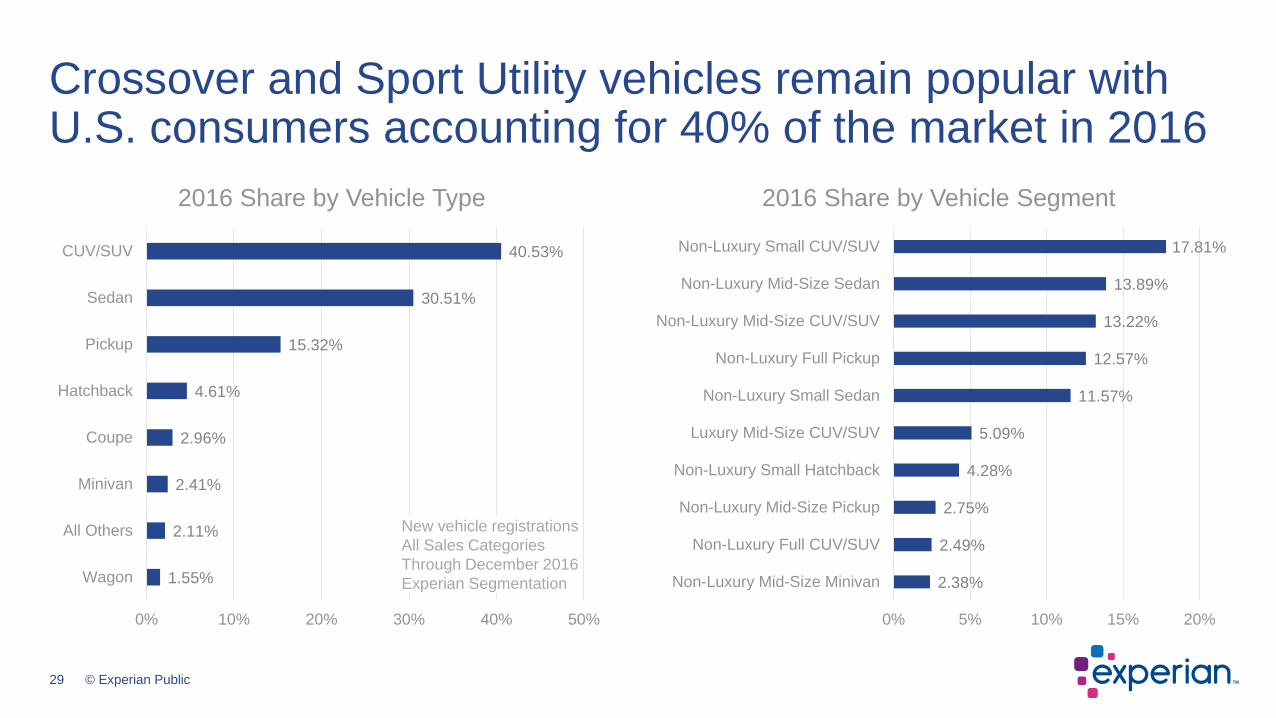
1.55%
2.11%
2.41%
2.96%
4.61%
15.32%
30.51%
40.53%
0% 10% 20% 30% 40% 50%
Wagon
All Others
Minivan
Coupe
Hatchback
Pickup
Sedan
CUV/SUV
2016 Share by Vehicle Type
Crossover and Sport Utility vehicles remain popular with U.S. consumers accounting for 40% of the market in 2016
2.38%
2.49%
2.75%
4.28%
5.09%
11.57%
12.57%
13.22%
13.89%
17.81%
0% 5% 10% 15% 20%
Non-Luxury Mid-Size Minivan
Non-Luxury Full CUV/SUV
Non-Luxury Mid-Size Pickup
Non-Luxury Small Hatchback
Luxury Mid-Size CUV/SUV
Non-Luxury Small Sedan
Non-Luxury Full Pickup
Non-Luxury Mid-Size CUV/SUV
Non-Luxury Mid-Size Sedan
Non-Luxury Small CUV/SUV
2016 Share by Vehicle Segment
New vehicle registrations
All Sales Categories
Through December 2016
Experian Segmentation
30 © Experian Public
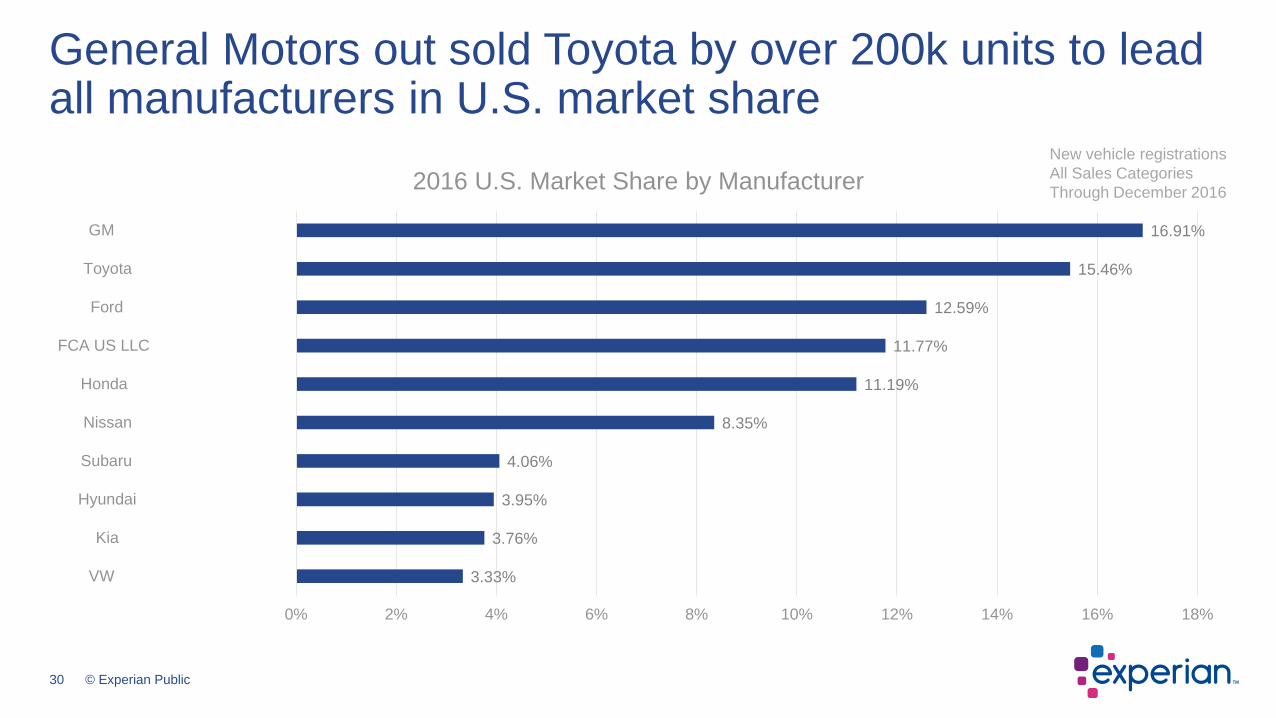
3.33%
3.76%
3.95%
4.06%
8.35%
11.19%
11.77%
12.59%
15.46%
16.91%
0% 2% 4% 6% 8% 10% 12% 14% 16% 18%
VW
Kia
Hyundai
Subaru
Nissan
Honda
FCA US LLC
Ford
Toyota
GM
2016 U.S. Market Share by Manufacturer
General Motors out sold Toyota by over 200k units to lead all manufacturers in U.S. market share
New vehicle registrations
All Sales Categories
Through December 2016
31 © Experian Public
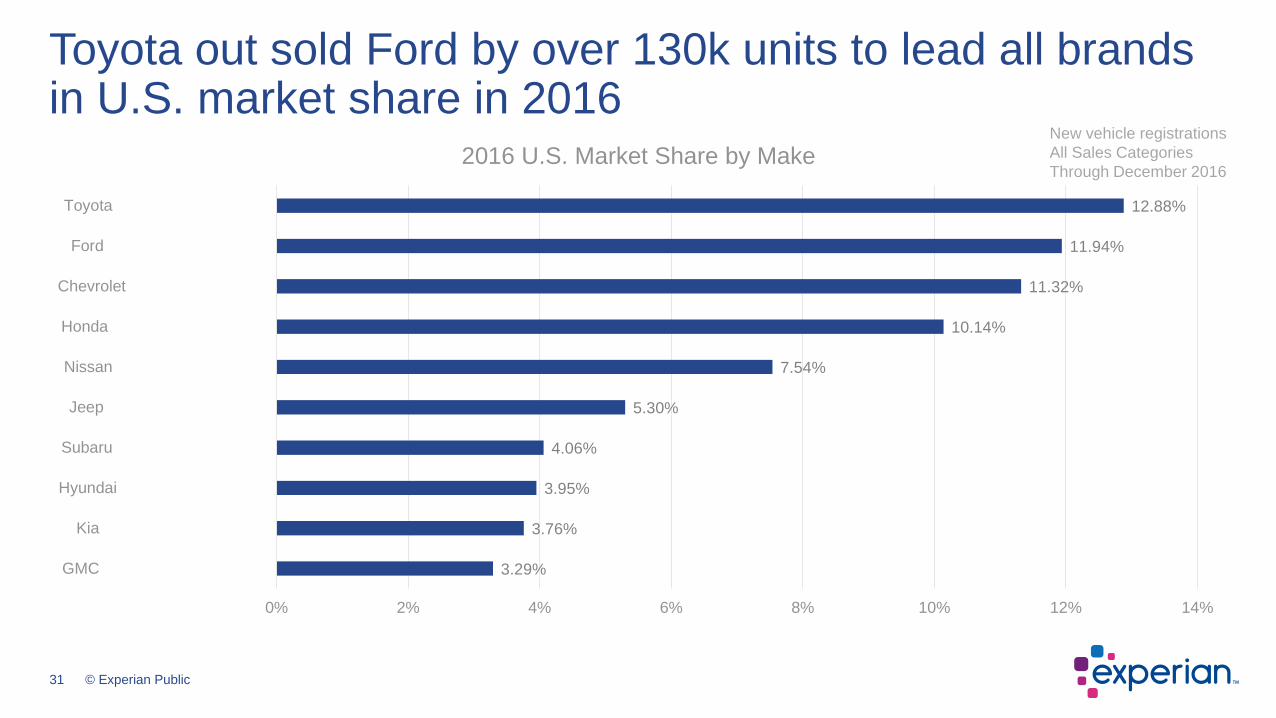
3.29%
3.76%
3.95%
4.06%
5.30%
7.54%
10.14%
11.32%
11.94%
12.88%
0% 2% 4% 6% 8% 10% 12% 14%
GMC
Kia
Hyundai
Subaru
Jeep
Nissan
Honda
Chevrolet
Ford
Toyota
2016 U.S. Market Share by Make
Toyota out sold Ford by over 130k units to lead all brands in U.S. market share in 2016
New vehicle registrations
All Sales Categories
Through December 2016
32 © Experian Public
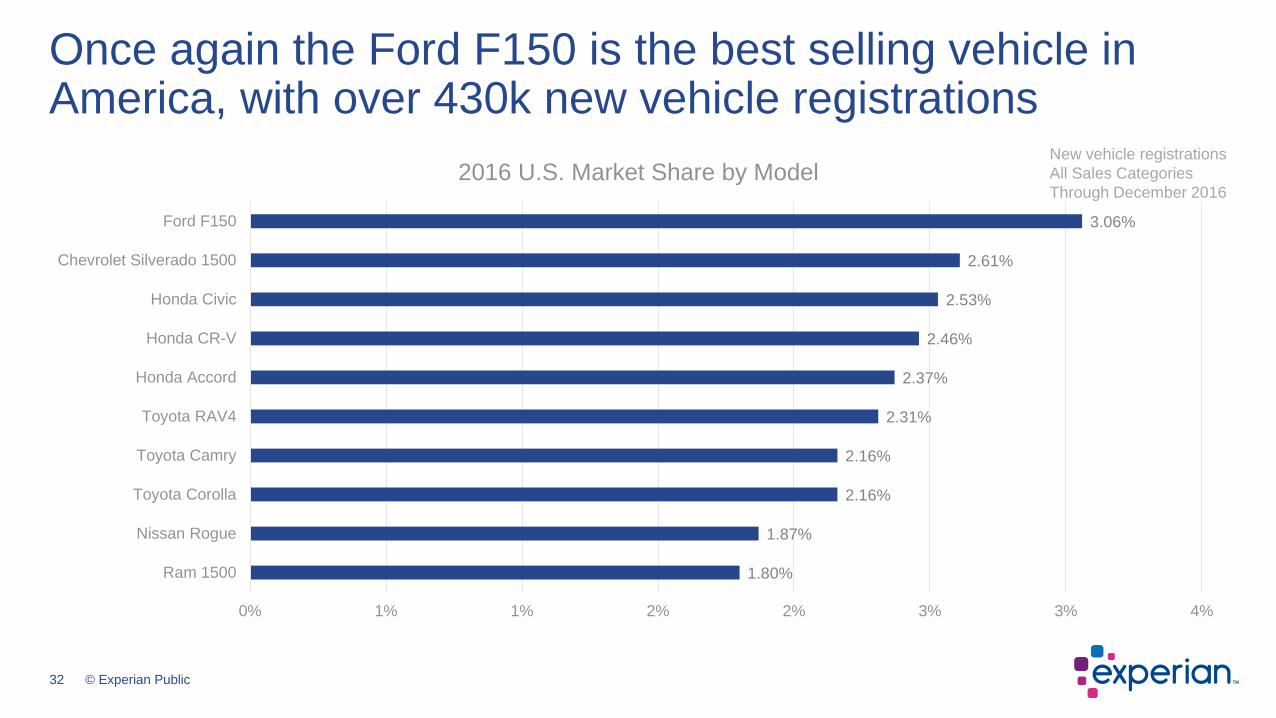
1.80%
1.87%
2.16%
2.16%
2.31%
2.37%
2.46%
2.53%
2.61%
3.06%
0% 1% 1% 2% 2% 3% 3% 4%
Ram 1500
Nissan Rogue
Toyota Corolla
Toyota Camry
Toyota RAV4
Honda Accord
Honda CR-V
Honda Civic
Chevrolet Silverado 1500
Ford F150
2016 U.S. Market Share by Model
Once again the Ford F150 is the best selling vehicle in America, with over 430k new vehicle registrations
New vehicle registrations
All Sales Categories
Through December 2016
© Experian [Public, Confidential, Internal, Restricted – choose the appropriate category]
U.S. Loyalty, Conquest and Defections
• Loyalty trends• Impact of demographics on repurchase loyalty• Loyalty by owned vehicle type• Brand leaders• Conquest to defection ratios
34 © Experian Public
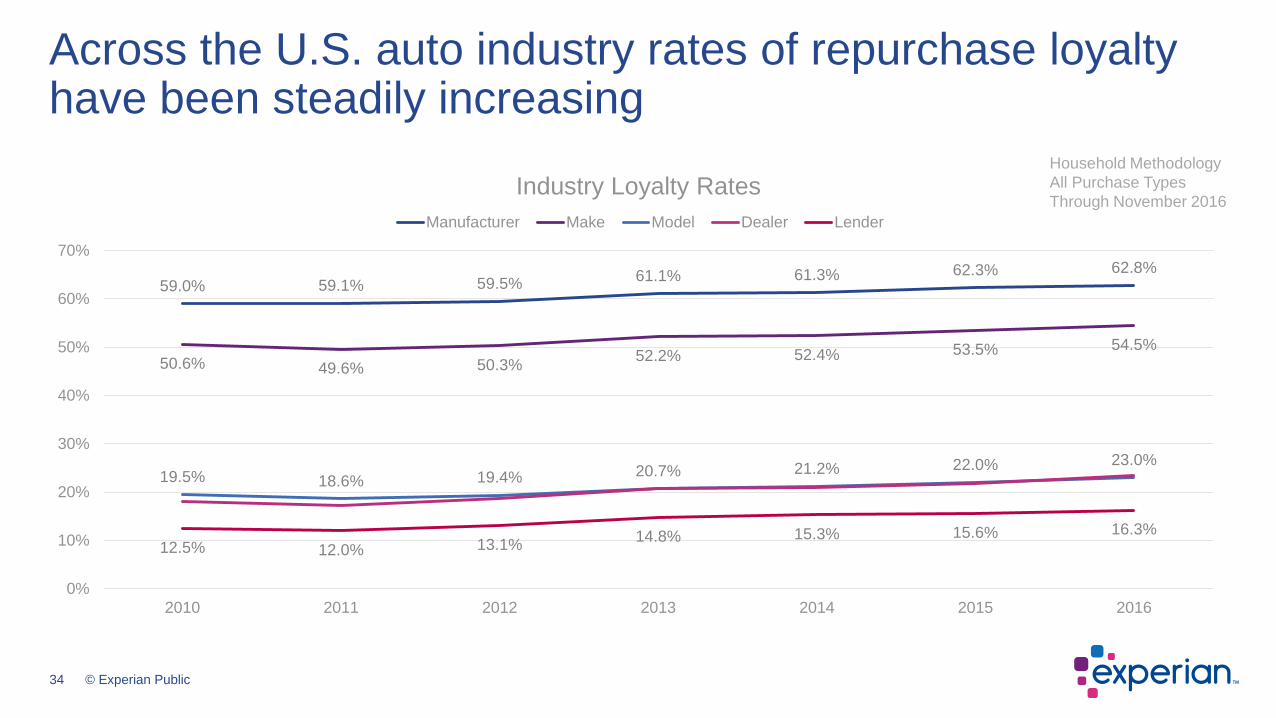
59.0% 59.1% 59.5%61.1% 61.3% 62.3% 62.8%
50.6% 49.6% 50.3%52.2% 52.4% 53.5% 54.5%
19.5% 18.6% 19.4% 20.7% 21.2% 22.0% 23.0%
12.5% 12.0% 13.1%14.8% 15.3% 15.6% 16.3%
0%
10%
20%
30%
40%
50%
60%
70%
2010 2011 2012 2013 2014 2015 2016
Industry Loyalty Rates
Manufacturer Make Model Dealer Lender
Across the U.S. auto industry rates of repurchase loyalty have been steadily increasing
Household Methodology
All Purchase Types
Through November 2016
35 © Experian Public
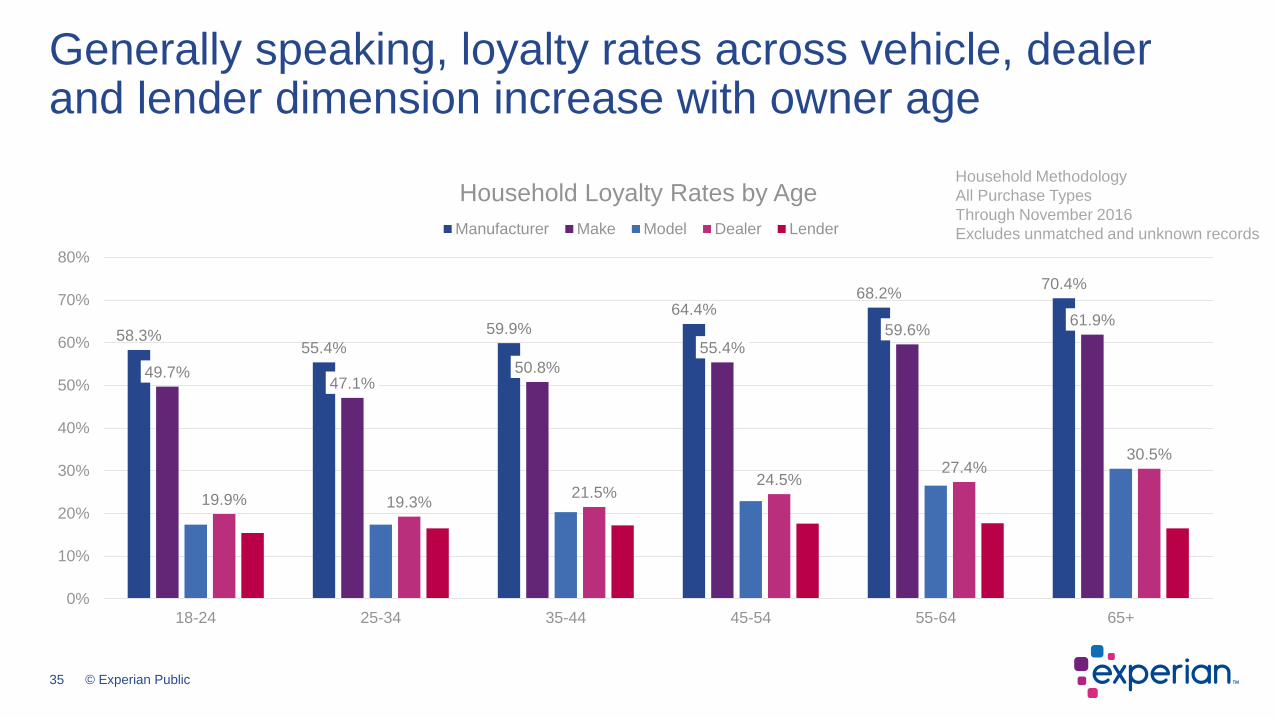
58.3%55.4%
59.9%
64.4%68.2%
70.4%
49.7%47.1%
50.8%
55.4%59.6%
61.9%
19.9% 19.3%21.5%
24.5%27.4%
30.5%
0%
10%
20%
30%
40%
50%
60%
70%
80%
18-24 25-34 35-44 45-54 55-64 65+
Household Loyalty Rates by Age
Manufacturer Make Model Dealer Lender
Generally speaking, loyalty rates across vehicle, dealer and lender dimension increase with owner age
Household Methodology
All Purchase Types
Through November 2016
Excludes unmatched and unknown records
36 © Experian Public
Manufacturer loyalty falls with rises in estimated home value while loyalty to lenders increases
66.6% 66.4% 65.5% 64.6% 63.3%61.3%
59.1%57.0% 56.8%
14.5% 15.5% 16.2% 16.6% 17.5% 18.6% 19.6% 20.6% 21.3%
0%
10%
20%
30%
40%
50%
60%
70%
Less Than$100,000
$100,000 -$159,999
$160,000 -$199,999
$200,000 -$249,999
$250,000 -$349,999
$350,000 -$449,000
$450,000 -$749,999
$750,000 -$999,999
$1,000,000+
Household Loyalty Rates by Estimated Home Value
Manufacturer Make Model Dealer Lender
Household Methodology
All Purchase Types
Through November 2016
Excludes unmatched and unknown records
37 © Experian Public
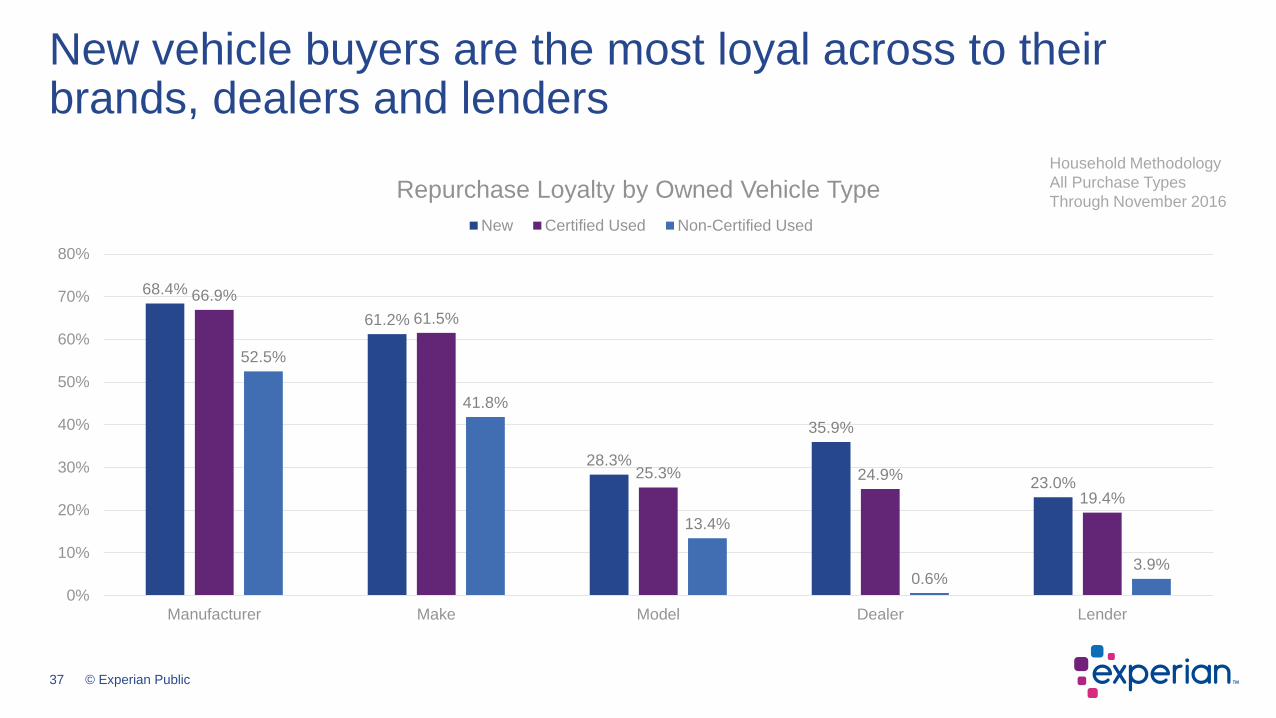
New vehicle buyers are the most loyal across to their brands, dealers and lenders
68.4%
61.2%
28.3%
35.9%
23.0%
66.9%
61.5%
25.3% 24.9%
19.4%
52.5%
41.8%
13.4%
0.6%3.9%
0%
10%
20%
30%
40%
50%
60%
70%
80%
Manufacturer Make Model Dealer Lender
Repurchase Loyalty by Owned Vehicle Type
New Certified Used Non-Certified Used
Household Methodology
All Purchase Types
Through November 2016
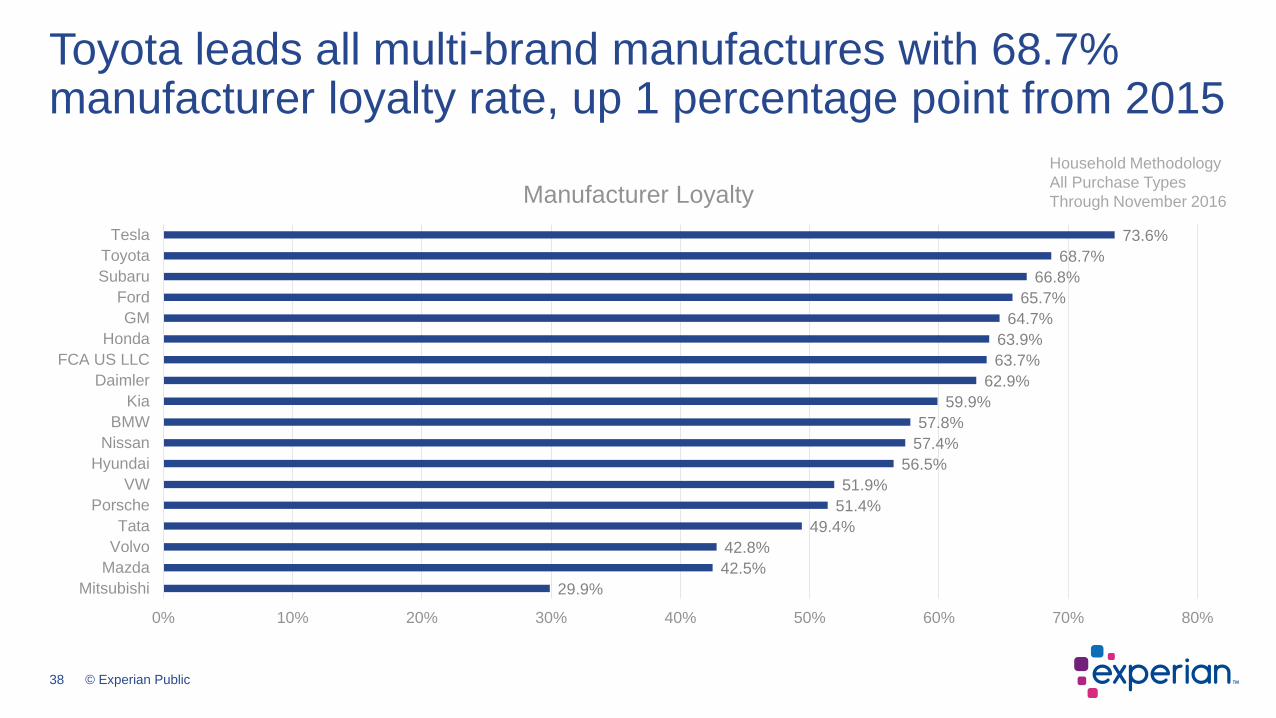
38 © Experian Public
29.9%
42.5%
42.8%
49.4%
51.4%
51.9%
56.5%
57.4%
57.8%
59.9%
62.9%
63.7%
63.9%
64.7%
65.7%
66.8%
68.7%
73.6%
0% 10% 20% 30% 40% 50% 60% 70% 80%
Mitsubishi
Mazda
Volvo
Tata
Porsche
VW
Hyundai
Nissan
BMW
Kia
Daimler
FCA US LLC
Honda
GM
Ford
Subaru
Toyota
Tesla
Manufacturer Loyalty
Toyota leads all multi-brand manufactures with 68.7% manufacturer loyalty rate, up 1 percentage point from 2015
Household Methodology
All Purchase Types
Through November 2016
39 © Experian Public
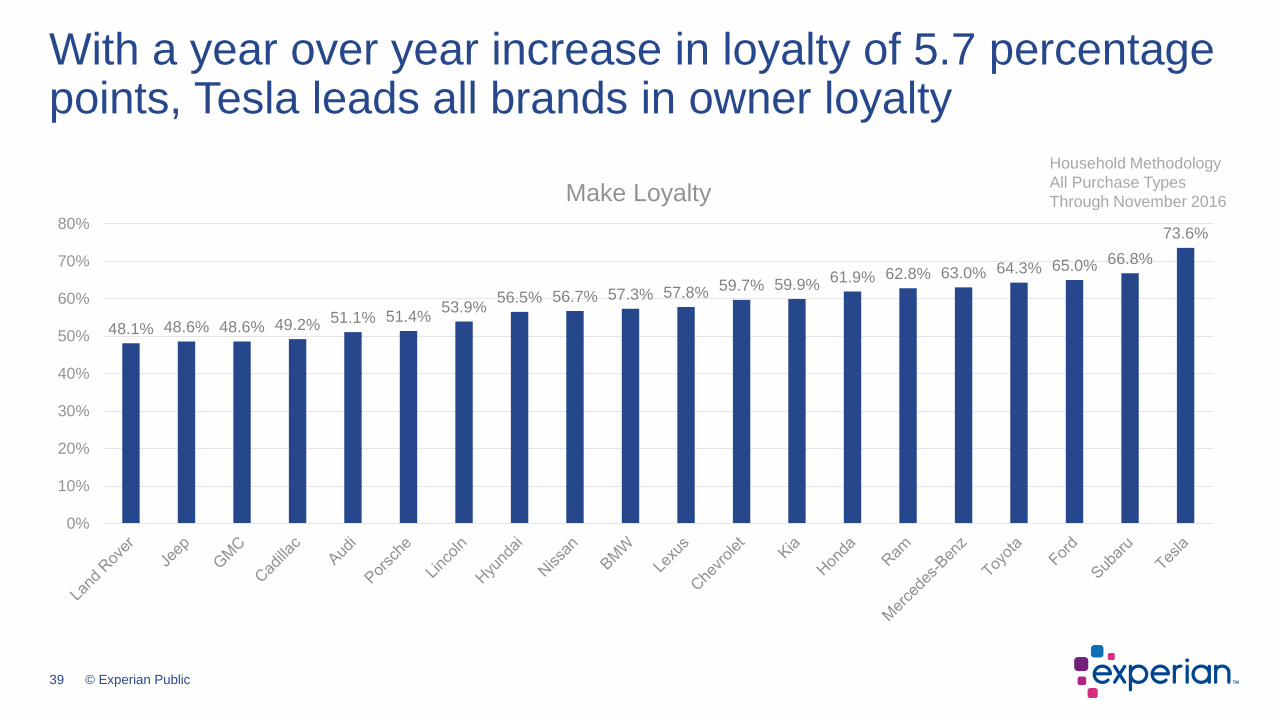
48.1% 48.6% 48.6% 49.2% 51.1% 51.4%53.9%
56.5% 56.7% 57.3% 57.8% 59.7% 59.9%61.9% 62.8% 63.0% 64.3% 65.0% 66.8%
73.6%
0%
10%
20%
30%
40%
50%
60%
70%
80%
Make Loyalty
With a year over year increase in loyalty of 5.7 percentage points, Tesla leads all brands in owner loyalty
Household Methodology
All Purchase Types
Through November 2016
40 © Experian Public
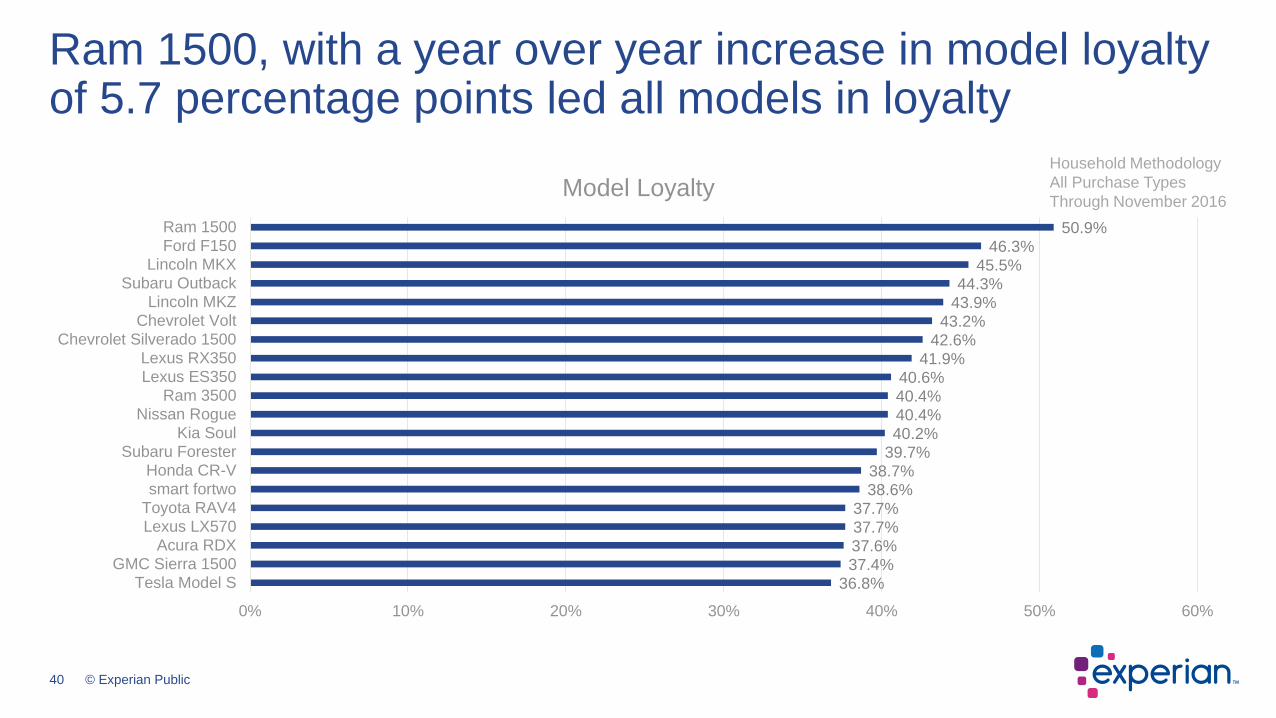
36.8%37.4%
37.6%37.7%37.7%
38.6%38.7%
39.7%40.2%
40.4%
40.4%40.6%
41.9%
42.6%
43.2%
43.9%44.3%
45.5%
46.3%50.9%
0% 10% 20% 30% 40% 50% 60%
Tesla Model S
GMC Sierra 1500
Acura RDX
Lexus LX570Toyota RAV4smart fortwo
Honda CR-VSubaru Forester
Kia Soul
Nissan RogueRam 3500
Lexus ES350Lexus RX350
Chevrolet Silverado 1500
Chevrolet Volt
Lincoln MKZSubaru Outback
Lincoln MKXFord F150
Ram 1500
Model Loyalty
Ram 1500, with a year over year increase in model loyalty of 5.7 percentage points led all models in loyalty
Household Methodology
All Purchase Types
Through November 2016
41 © Experian Public
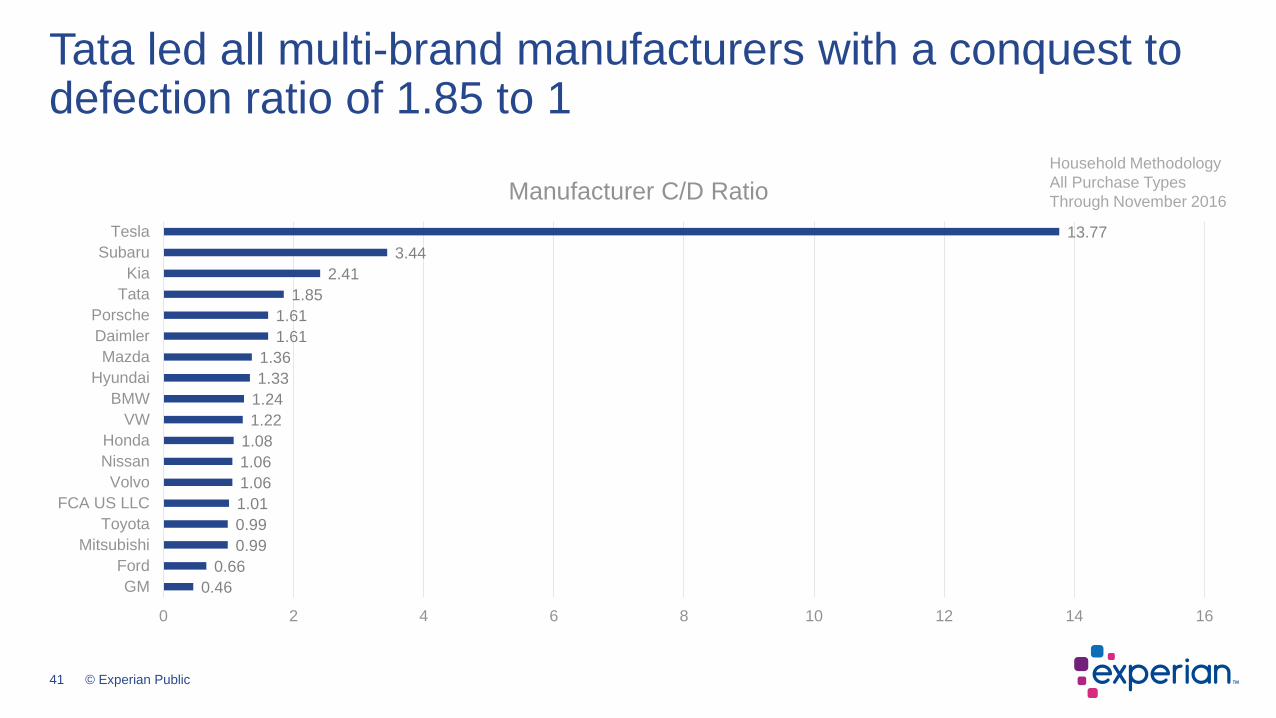
0.46
0.66
0.99
0.99
1.01
1.06
1.06
1.08
1.22
1.24
1.33
1.36
1.61
1.61
1.85
2.41
3.44
13.77
0 2 4 6 8 10 12 14 16
GM
Ford
Mitsubishi
Toyota
FCA US LLC
Volvo
Nissan
Honda
VW
BMW
Hyundai
Mazda
Daimler
Porsche
Tata
Kia
Subaru
Tesla
Manufacturer C/D Ratio
Tata led all multi-brand manufacturers with a conquest to defection ratio of 1.85 to 1
Household Methodology
All Purchase Types
Through November 2016
42 © Experian Public
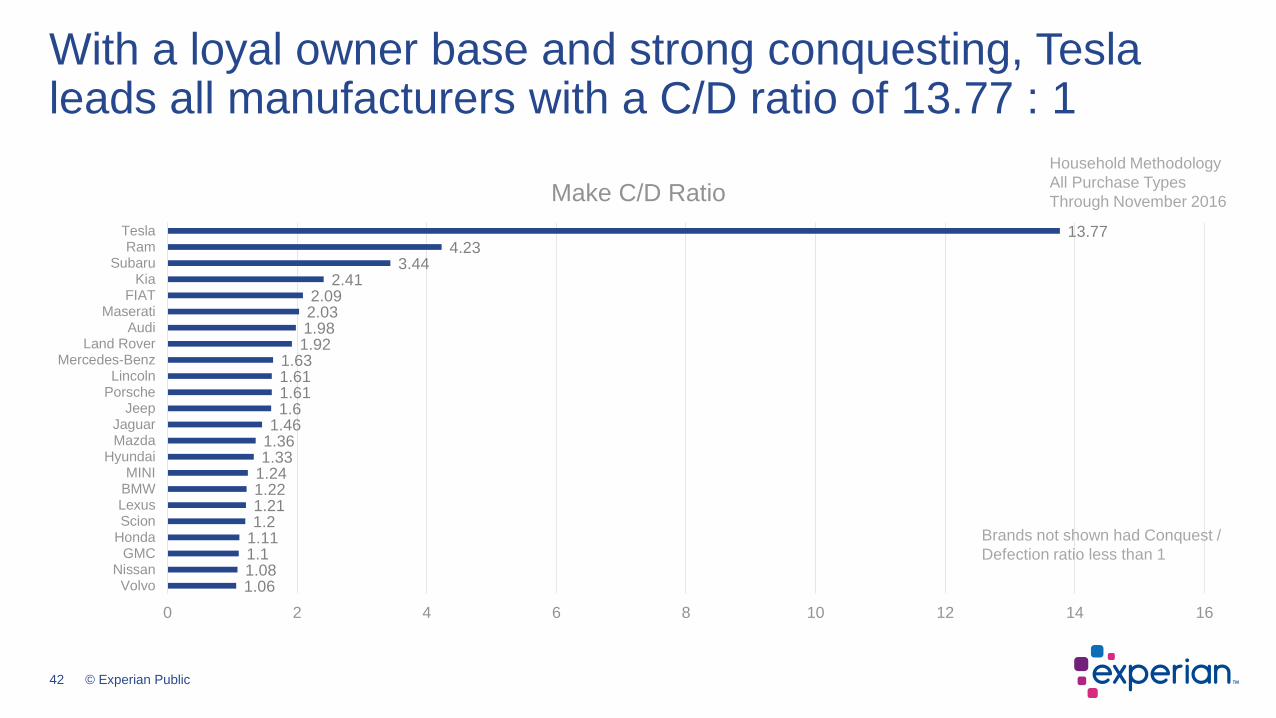
1.061.081.11.111.21.211.221.241.331.361.46
1.61.611.611.63
1.921.982.032.09
2.413.44
4.2313.77
0 2 4 6 8 10 12 14 16
VolvoNissan
GMCHondaScionLexusBMWMINI
HyundaiMazdaJaguar
JeepPorscheLincoln
Mercedes-BenzLand Rover
AudiMaserati
FIATKia
SubaruRam
Tesla
Make C/D Ratio
With a loyal owner base and strong conquesting, Tesla leads all manufacturers with a C/D ratio of 13.77 : 1
Household Methodology
All Purchase Types
Through November 2016
Brands not shown had Conquest /
Defection ratio less than 1
43 © Experian Public
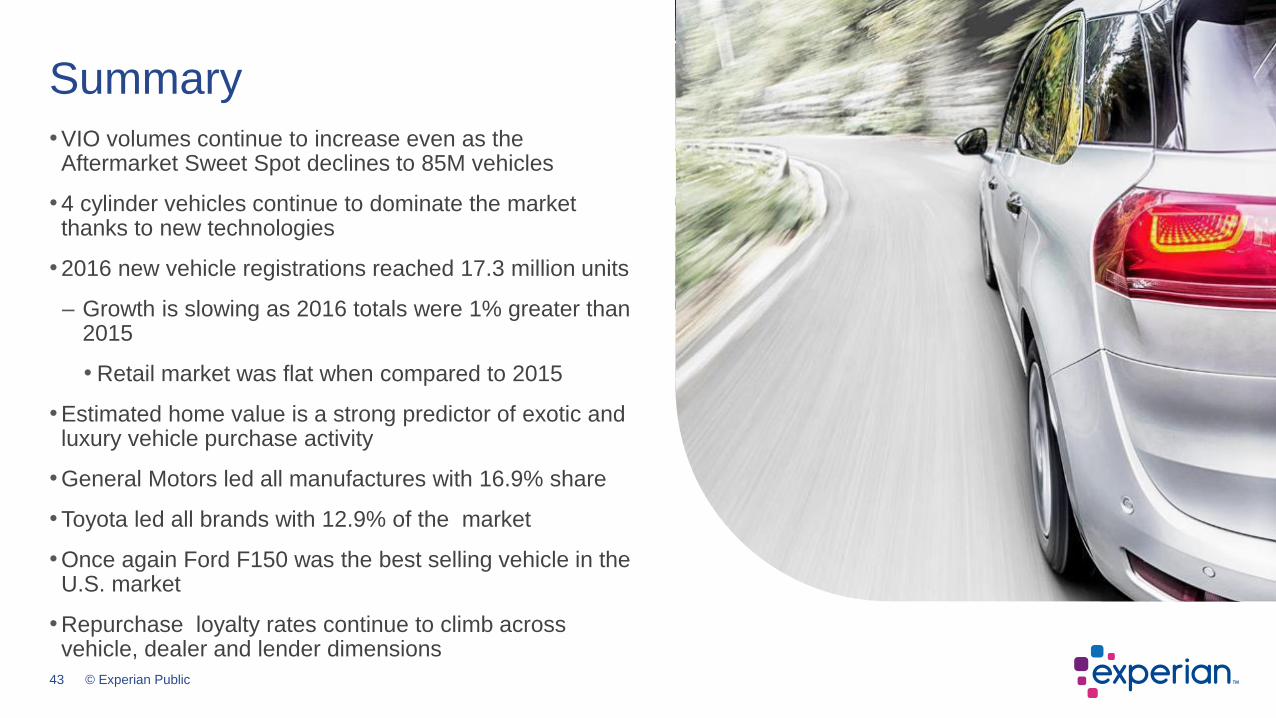
• VIO volumes continue to increase even as the Aftermarket Sweet Spot declines to 85M vehicles
• 4 cylinder vehicles continue to dominate the market thanks to new technologies
• 2016 new vehicle registrations reached 17.3 million units
– Growth is slowing as 2016 totals were 1% greater than 2015
• Retail market was flat when compared to 2015
• Estimated home value is a strong predictor of exotic and luxury vehicle purchase activity
• General Motors led all manufactures with 16.9% share
• Toyota led all brands with 12.9% of the market
• Once again Ford F150 was the best selling vehicle in the U.S. market
• Repurchase loyalty rates continue to climb across vehicle, dealer and lender dimensions
Summary
44 © Experian Public
Today’s presentation
Follow us on Twitter
#EXPAuto
@Experian_Auto
Connect with us on LinkedIn
Experian Automotive
Presentation will be available 24-48 hours after Webinar
Email with a link will be sent to all registrants to download
Questions? Contact us at [email protected]
45 © Experian Public
Thank youExperian Automotive is prepared to meet your needs with an integrated solution statically designed to drive your business forward
©2017 Experian Information Solutions, Inc. All rights reserved. Experian and the Experian marks used herein are trademarks
or registered trademarks of Experian Information Solutions, Inc. Other product and company names mentioned herein are the
trademarks of their respective owners. No part of this copyrighted work may be reproduced, modified, or distributed in any
form or manner without the prior written permission of Experian.
Experian Public
Top Related