


Languages
Pages
Legal


Evidence - Based Research:Continuing on after your PT3 is gone
ByGerald Knezek
Professor of Technology & CognitionUniversity of North Texas
SITE Annual MeetingAtlanta, Georgia
March 2, 2004
Dedicated to PT3 Program Pioneers:
• Kelly Green• Susana Bonis• Tom Carroll• All of US
– PT3 Capacity ‘99-’00– PT3 Implementation ‘00-’03– PT3 Core Evaluation Group ‘01-’03– Challenge Grant Evaluator ‘99-’05– AERA TACTL SIG ‘02 - ‘04+– SITE V.P. for Research ‘04-’07
Major Topics
• As a project concludes, what are research questions that need to be addressed? How can studies be conducted related to these questions?
• What is necessary to conduct Scientifically Based Research? (Intro. to afternoon symposium)
General Guidelines
1. Build on successesWhat were/are you good at?
2. Use data already gathered
3. Publish, Publish, PublishSubmit to SITE, AERA TACTL SIG ($5;)
Accept book chapter offers, assemble panels
Write journal articles (AACE, ISTE etc.)
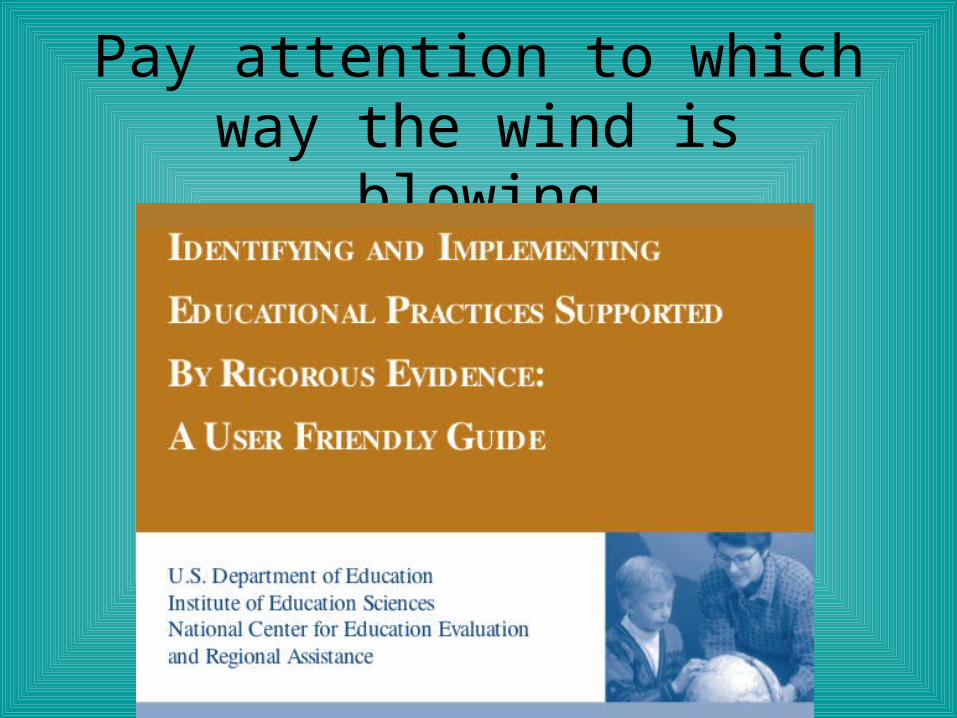
Pay attention to which way the wind is blowing
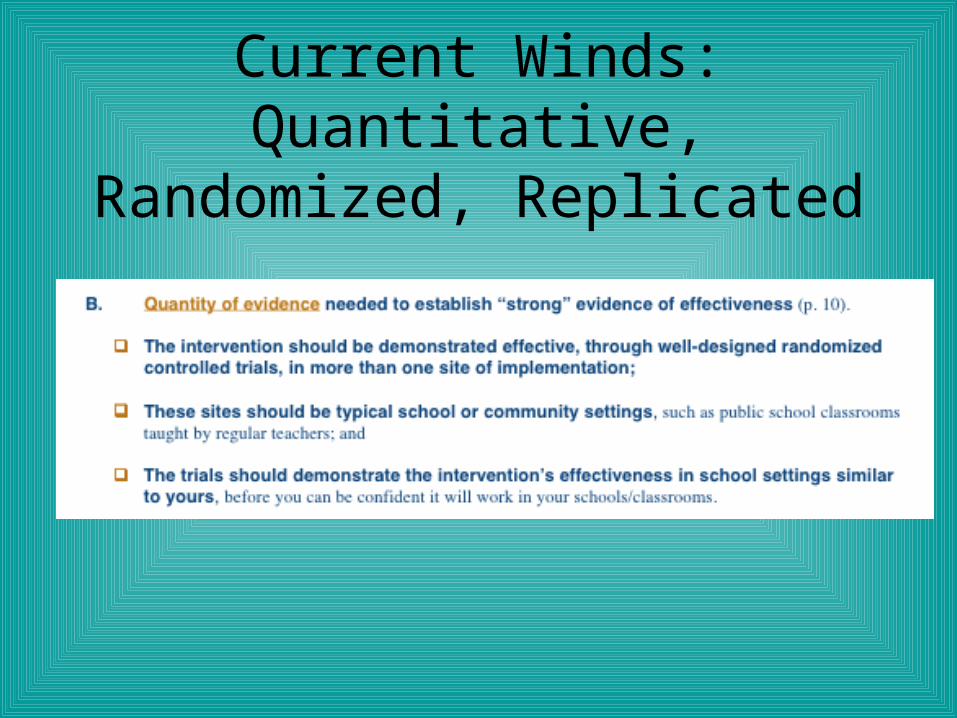
Current Winds:Quantitative, Randomized,
Replicated

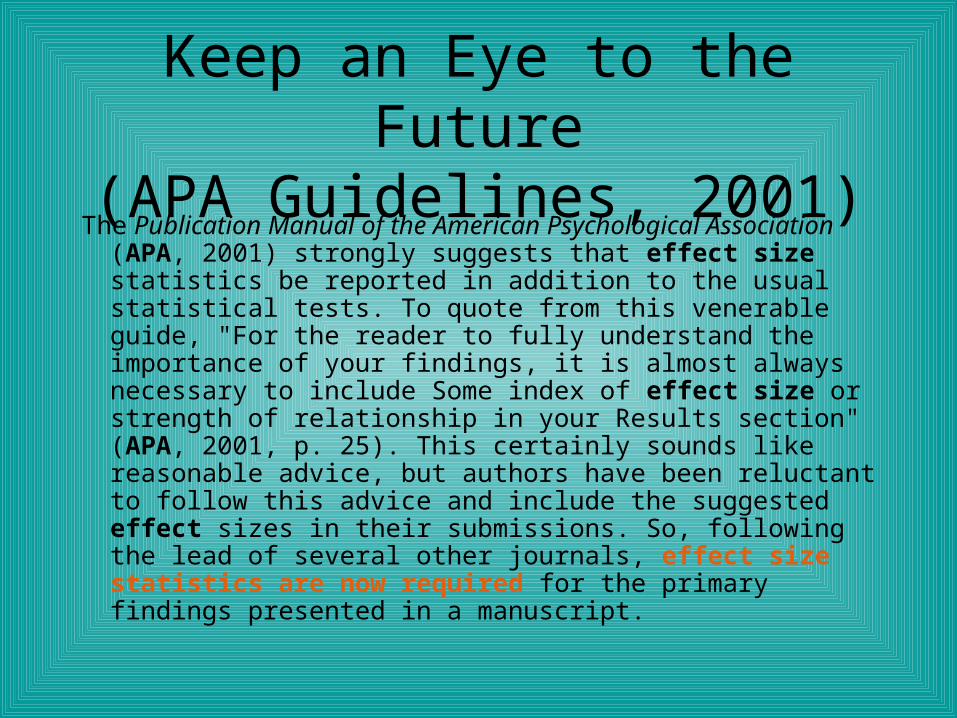
Keep an Eye to the Future(APA Guidelines, 2001)
The Publication Manual of the American Psychological Association (APA, 2001) strongly suggests that effect size statistics be reported in addition to the usual statistical tests. To quote from this venerable guide, "For the reader to fully understand the importance of your findings, it is almost always necessary to include Some index of effect size or strength of relationship in your Results section" (APA, 2001, p. 25). This certainly sounds like reasonable advice, but authors have been reluctant to follow this advice and include the suggested effect sizes in their submissions. So, following the lead of several other journals, effect size statistics are now required for the primary findings presented in a manuscript.
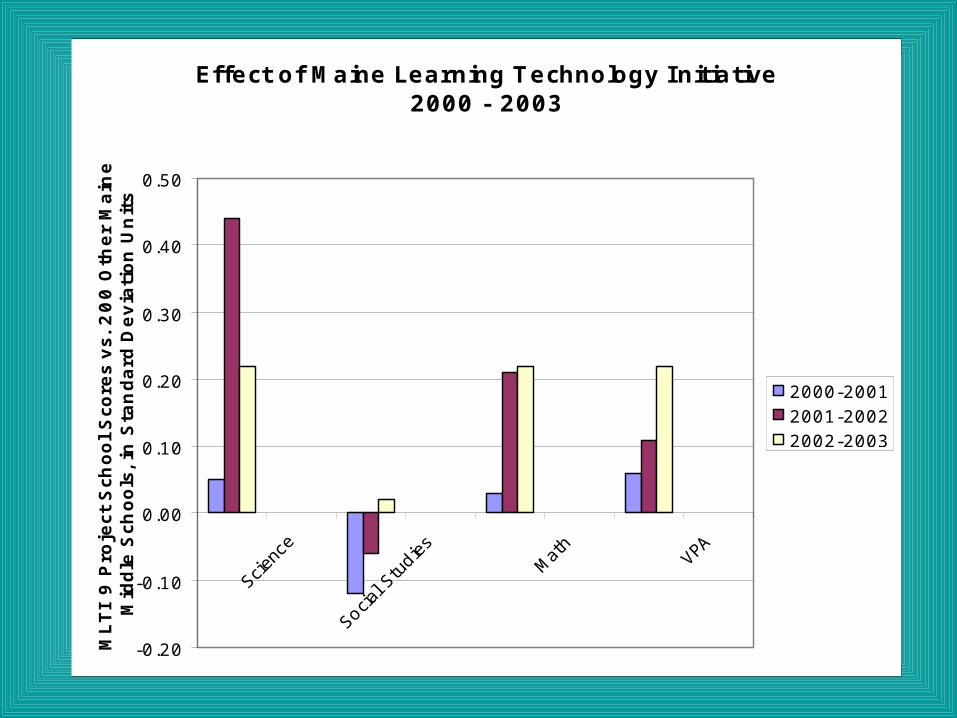
Effect of Maine Learning Technology Initiative 2000 - 2003
-0.20
-0.10
0.00
0.10
0.20
0.30
0.40
0.50
Scie
nce
Socia
l Stu
dies
Mat
hVP
A
MLTI 9
Pro
ject
Sch
ool S
core
s vs. 2
00
Oth
er
Main
e
Mid
dle
Sch
ools
, in
Sta
ndard
Devia
tion
Un
its
2000-20012001-20022002-2003

Maine 2003
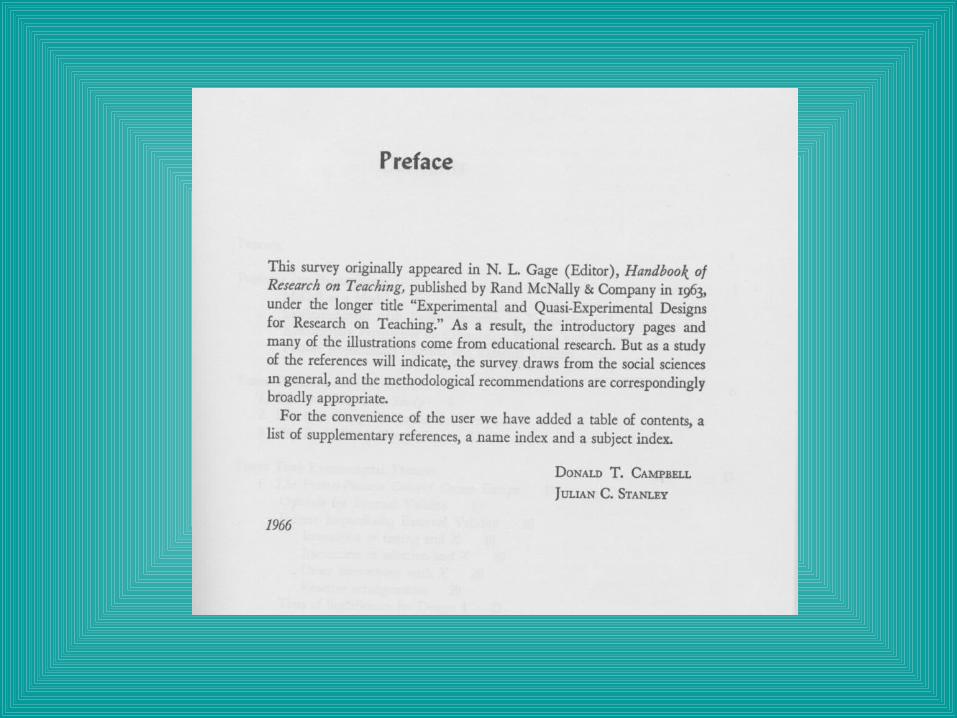
And to the Past
• Campbell, D. T. & Stanley, J. C. (1966). Experimental and Quasi-Experimental Designs for Research on Teaching. From Gage, N. L. (Ed.) Handbook of Research on Teaching. Boston: Rand McNally, 1963.
Frequently references:• McCall, W. A. (1923). How to Experiment in
Education.
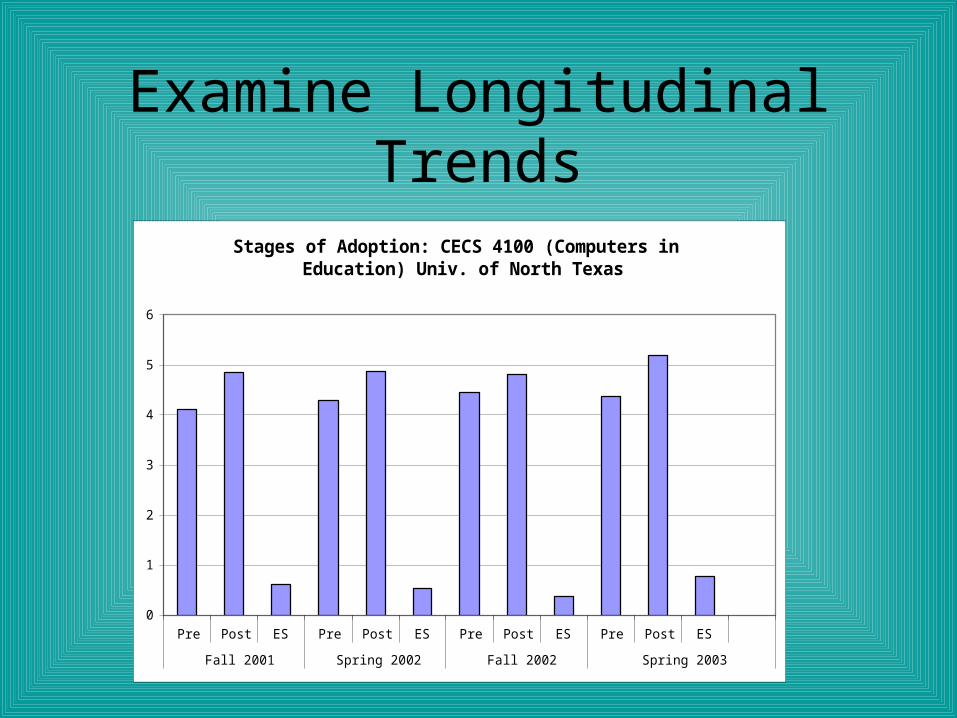
Examine Longitudinal Trends
Stages of Adoption: CECS 4100 (Computers in Education) Univ. of North Texas
0
1
2
3
4
5
6
Pre Post ES Pre Post ES Pre Post ES Pre Post ES
Fall 2001 Spring 2002 Fall 2002 Spring 2003
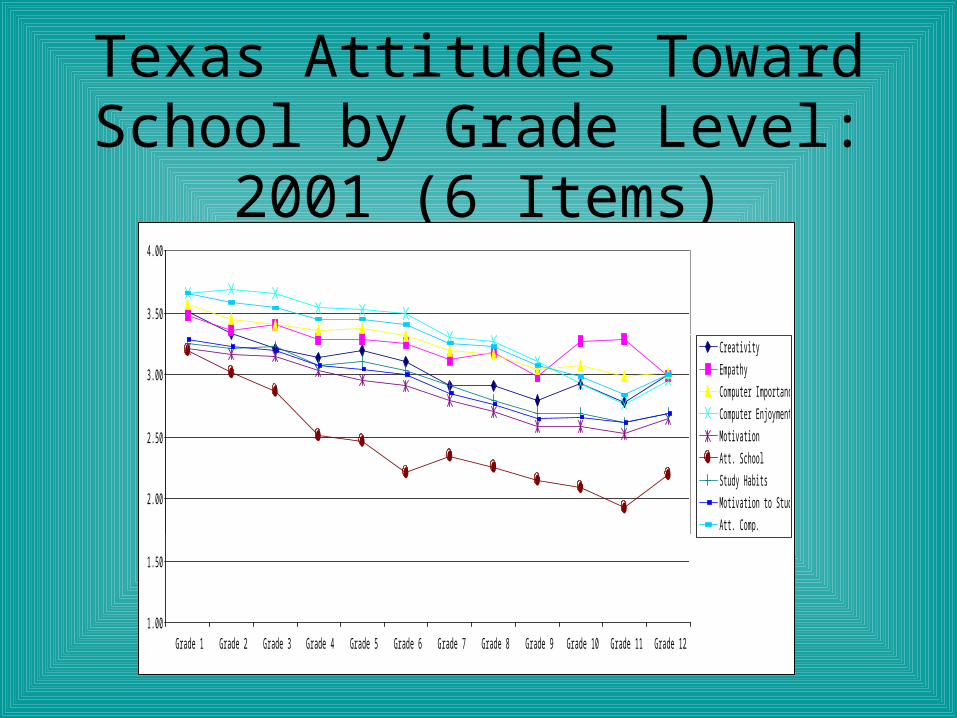
Texas Attitudes Toward School by Grade Level: 2001 (6 Items)
1.00
1.50
2.00
2.50
3.00
3.50
4.00
Grade 1 Grade 2 Grade 3 Grade 4 Grade 5 Grade 6 Grade 7 Grade 8 Grade 9 Grade 10 Grade 11 Grade 12
Creativity
Empathy
Computer Importance
Computer Enjoyment
Motivation
Att. School
Study Habits
Motivation to Study
Att. Comp.
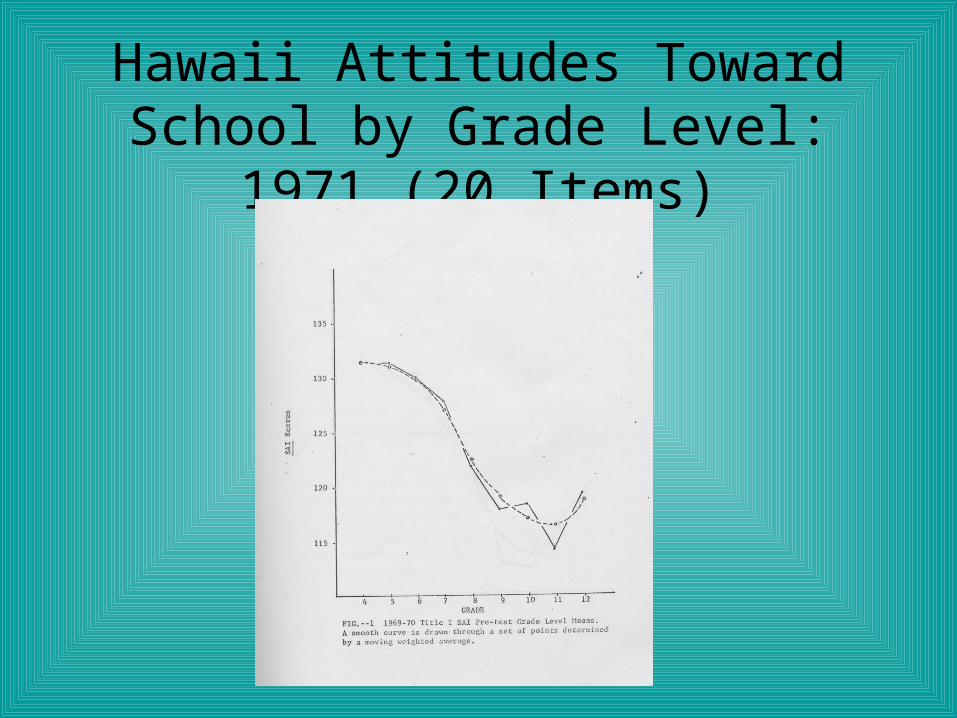
Hawaii Attitudes Toward School by Grade Level: 1971 (20 Items)
QuickTime™ and aTIFF (LZW) decompressor
are needed to see this picture.
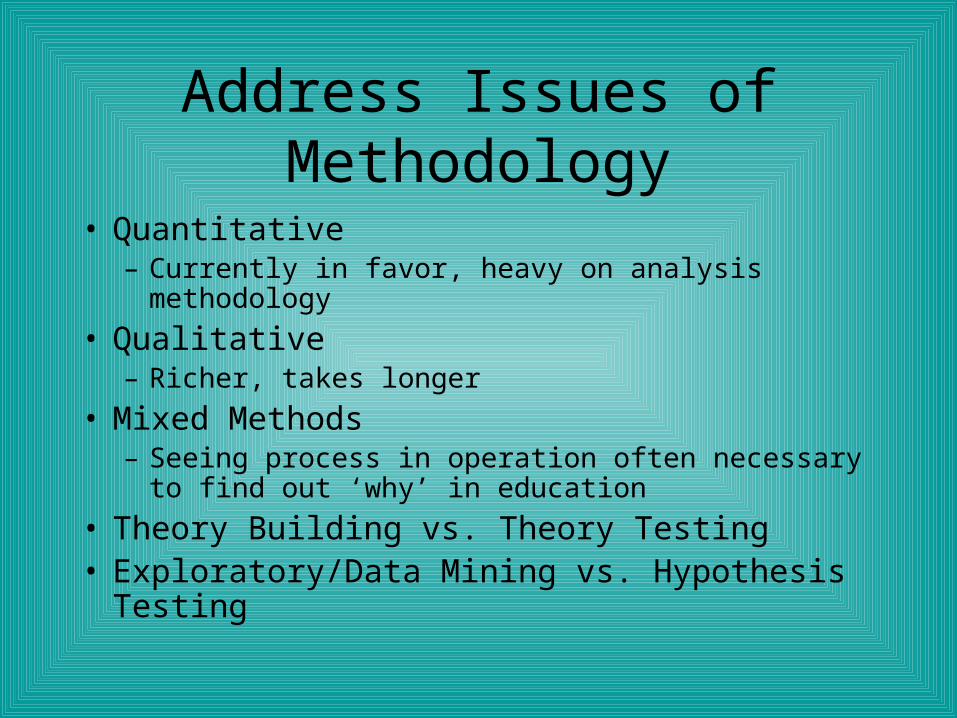
Address Issues of Methodology
• Quantitative – Currently in favor, heavy on analysis methodology
• Qualitative– Richer, takes longer
• Mixed Methods– Seeing process in operation often necessary to find out
‘why’ in education
• Theory Building vs. Theory Testing• Exploratory/Data Mining vs. Hypothesis Testing
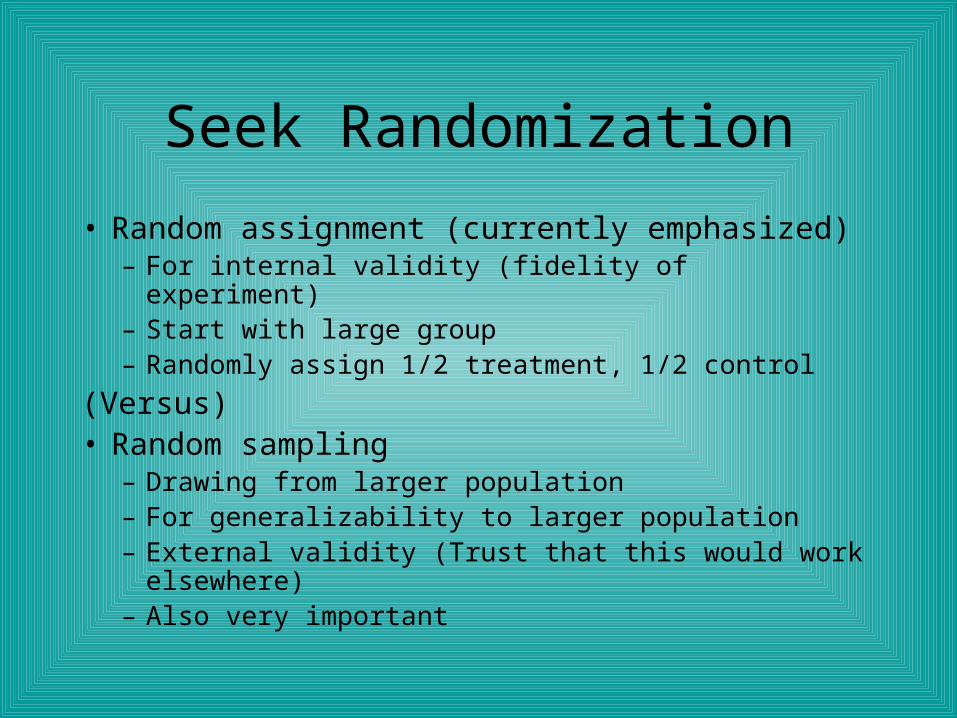
Seek Randomization
• Random assignment (currently emphasized)– For internal validity (fidelity of experiment)– Start with large group– Randomly assign 1/2 treatment, 1/2 control
(Versus)• Random sampling
– Drawing from larger population– For generalizability to larger population– External validity (Trust that this would work elsewhere)– Also very important
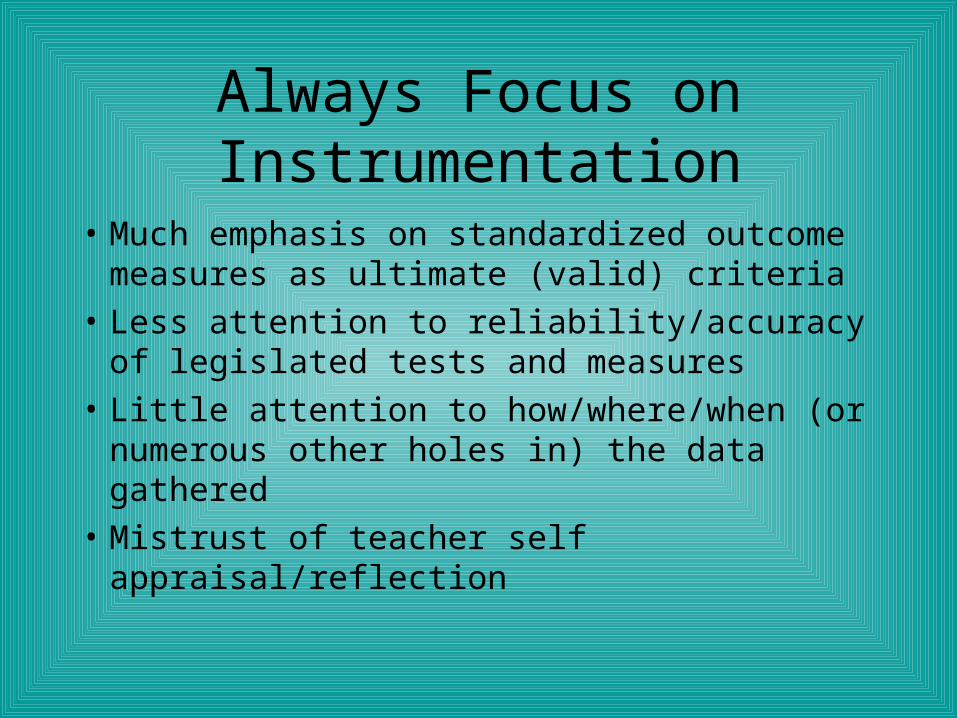
Always Focus on Instrumentation
• Much emphasis on standardized outcome measures as ultimate (valid) criteria
• Less attention to reliability/accuracy of legislated tests and measures
• Little attention to how/where/when (or numerous other holes in) the data gathered
• Mistrust of teacher self appraisal/reflection
Instruments Book (http://iittl.unt.edu)
Instrumentsfor
AssessingEducator Progress
inTechnologyIntegration
ByGerald KnezekRhonda ChristensenKeiko MiyashitaMargaret Ropp
UNIVERSITYof
NORTH TEXAS
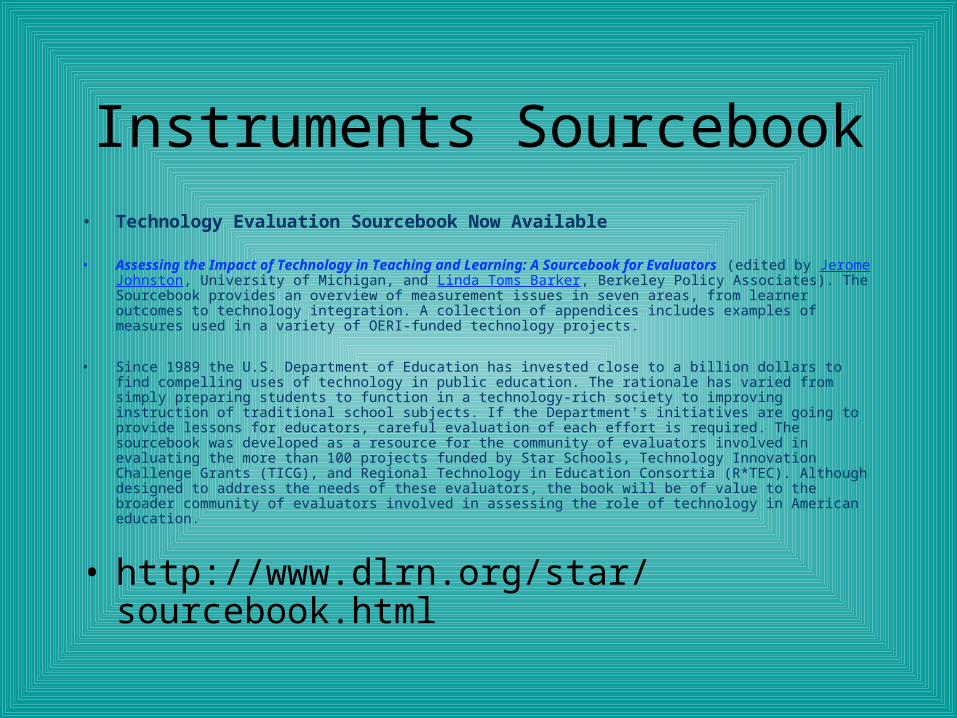
Instruments Sourcebook• Technology Evaluation Sourcebook Now Available
• Assessing the Impact of Technology in Teaching and Learning: A Sourcebook for Evaluators (edited by Jerome Johnston, University of Michigan, and Linda Toms Barker, Berkeley Policy Associates). The Sourcebook provides an overview of measurement issues in seven areas, from learner outcomes to technology integration. A collection of appendices includes examples of measures used in a variety of OERI-funded technology projects.
• Since 1989 the U.S. Department of Education has invested close to a billion dollars to find compelling uses of technology in public education. The rationale has varied from simply preparing students to function in a technology-rich society to improving instruction of traditional school subjects. If the Department's initiatives are going to provide lessons for educators, careful evaluation of each effort is required. The sourcebook was developed as a resource for the community of evaluators involved in evaluating the more than 100 projects funded by Star Schools, Technology Innovation Challenge Grants (TICG), and Regional Technology in Education Consortia (R*TEC). Although designed to address the needs of these evaluators, the book will be of value to the broader community of evaluators involved in assessing the role of technology in American education.
• http://www.dlrn.org/star/sourcebook.html
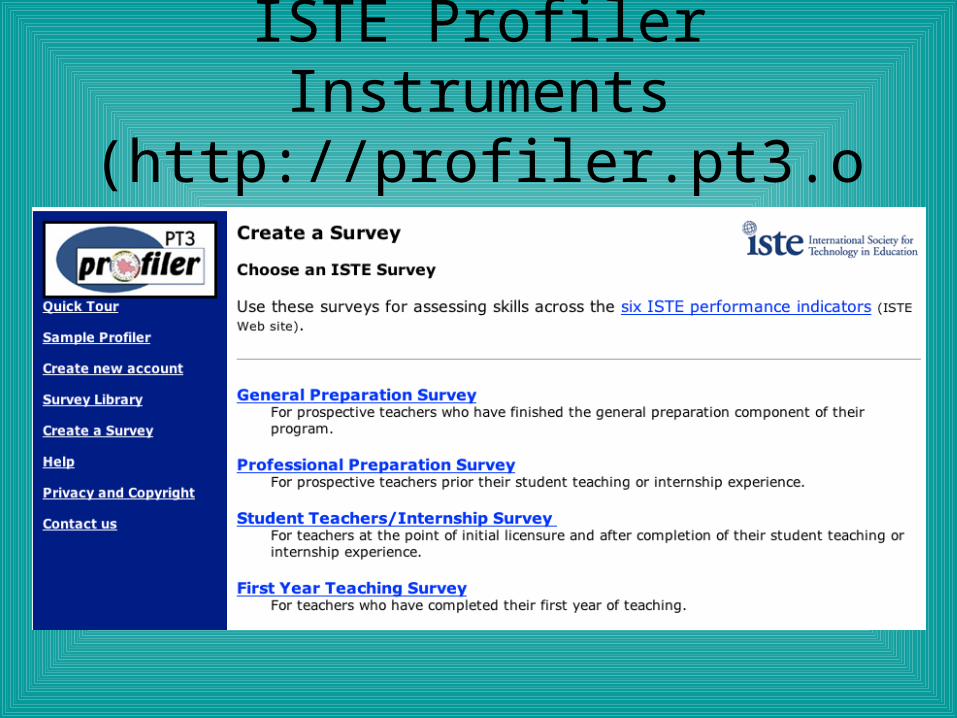
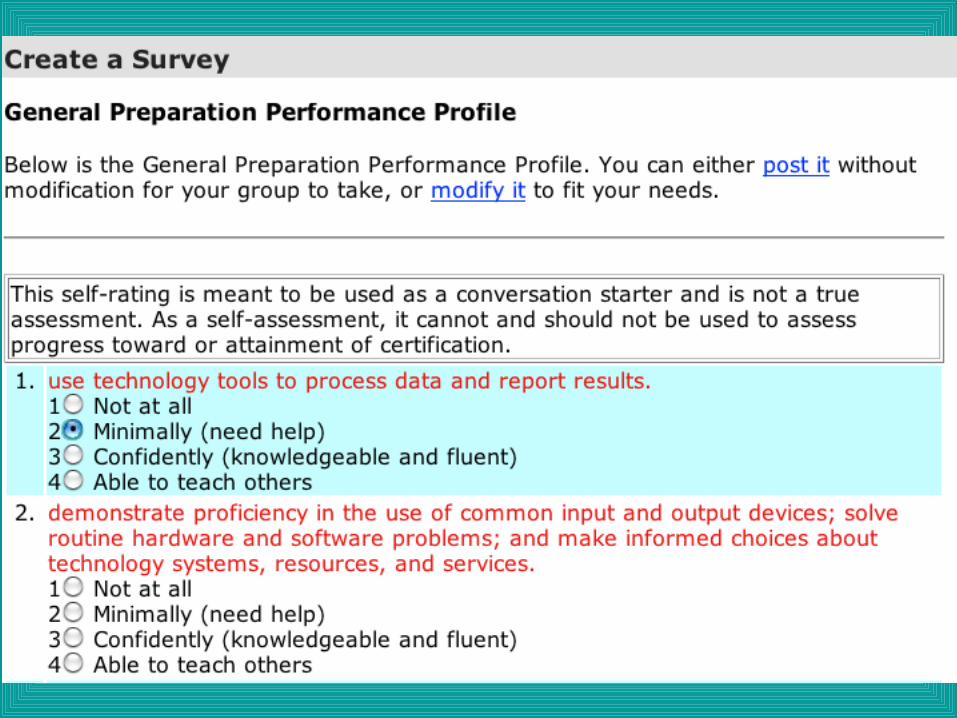
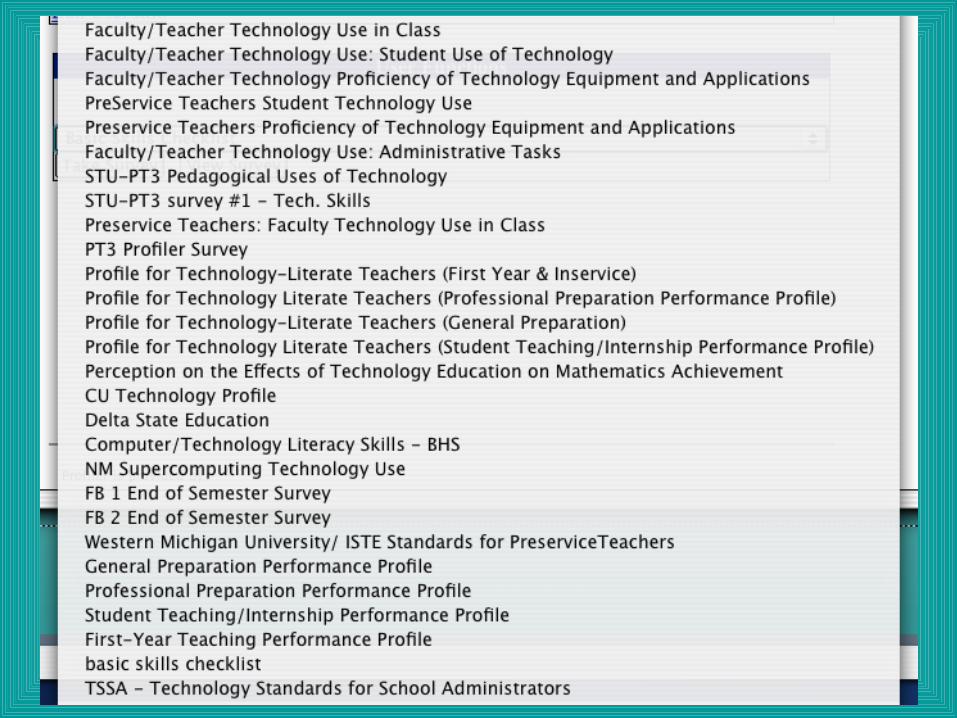
ISTE Profiler Instruments(http://profiler.pt3.org)
Examine Many Approaches to Analysis/Interpretation
• Much attention to single ‘correct’ procedure– T-test of differences vs. Analysis of Covariance– Power estimates for hierarchically nested data
• Little recognition of value of multiple views of data– Nonparametric techniques for small samples
• Too much emphasis on accept/reject null and too little on strength of effect (ES/APA)
• Tendency to use no data to make decisions rather than rely on less than perfect information
Explicity Describe Research Design
• 7 randomly selected control districts• Compared with 18 treatment districts• Interventions:
– Summer Institute (Eisenhower Model)– Tools to integrate into the classroom– New technology-enhanced reading program
• Outcome Measures:– Texas Primary Reading Indicator scores on
• Reading Accuracy• Reading Comprehension• For Grades 1 and 2
Start With Your Research Questions
• Research Question 1:– Is the KIDS Summer Inst. effective in
promoting technology integration among teachers?
• Research Question 2:– Is there a positive impact of the KIDS
technology-based reading program on student achievement?
Some Teacher Preparation Suggestions for Questions
• Are exiting candidates now better technology integrators than before PT3?
• Is the (teaching career) retention rate higher for PT3-initiative teachers?
• Do the students of PT3-prepared teachers exhibit higher achievement?
• Are the teacher preparation faculty at your university more highly skilled at technology infusion than before PT3? (If so, will it last?)
• Are there long term benefits to your institution gained through peer-institution collaboration and exchange?
Top Related