


Languages
Pages
Legal

Cross and Pokhrel 1
EVALUATION OF VACUUM DRYING FOR DETERMINATION OF BULK SPECIFIC GRAVITY
OF HMA SAMPLES
6784 Equivalent Words
by:
Stephen A. Cross, Ph.D., P.E.
Professor School of Civil and Environmental Engineering
Oklahoma State University Stillwater, Oklahoma 74078
Tel: (405) 744-7200 Fax: (405) 744-7554
e-mail: [email protected]
and
Gyanendra Pokrel Graduate Research Assistant
School of Civil and Environmental Engineering Oklahoma State University Stillwater, Oklahoma 74078
Tel: (405) 744-7200 Fax: (405) 744-7554
e-mail: [email protected]
Paper submitted for presentation and publication at the 88th Annual Meeting of the Transportation Research Board, January 11-15, 2009, Washington, D.C.
TRB 2009 Annual Meeting CD-ROM Paper revised from original submittal.
Cross and Pokhrel 2
EVALUATION OF VACUUM DRYING FOR DETERMINATION OF
BULK SPECIFIC GRAVITY OF HMA SAMPLES
ABSTRACT
Stephen A. Cross and Gyanendra Pokhrel
Text 3840 words Abstract 194 words 2 Figures 500 words
9 tables 2250 words Total 6784 words
Determination of bulk specific gravity (Gmb) of bituminous paving mixtures is an important part of the Superpave mix design system and construction quality control/ quality assurance programs. Two problems commonly associated with AASHTO T 166 are the time it takes to dry test specimens and potential damage to the sample caused by drying at elevated temperatures. A vacuum drying technique has been developed to overcome these shortcomings. Field core samples and laboratory compacted samples of dense graded HMA and SMA were obtained for testing. The objectives of the study were to determine if dry mass and resultant Gmb of laboratory compacted and pavement core samples determined using vacuum drying procedures produces statistically similar results to AASHTO T 166 procedures. A second objective was to compare the dry mass obtained from AASHTO T 166 Method A to that of Method C. Comparisons of the means were made using ANOVA techniques along with paired t-testing. The practical significance of any statistically different results was also evaluated by using the precision statement of AASHTO T 166. Results indicated that vacuum drying is an acceptable procedure for determining dry mass and bulk specific gravity of HMA samples.
TRB 2009 Annual Meeting CD-ROM Paper revised from original submittal.
Cross and Pokhrel 3
EVALUATION OF VACUUM DRYING FOR DETERMINATION OF BULK SPECIFIC GRAVITY OF HMA SAMPLES
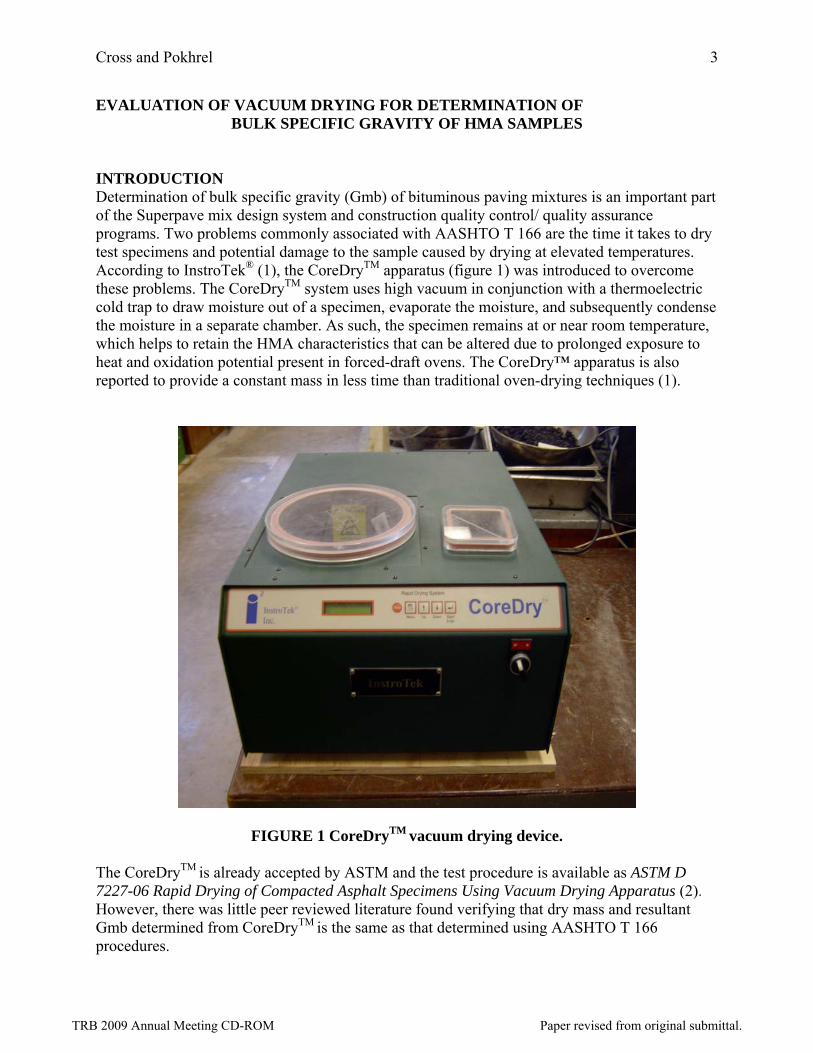
INTRODUCTION Determination of bulk specific gravity (Gmb) of bituminous paving mixtures is an important part of the Superpave mix design system and construction quality control/ quality assurance programs. Two problems commonly associated with AASHTO T 166 are the time it takes to dry test specimens and potential damage to the sample caused by drying at elevated temperatures. According to InstroTek® (1), the CoreDryTM apparatus (figure 1) was introduced to overcome these problems. The CoreDryTM system uses high vacuum in conjunction with a thermoelectric cold trap to draw moisture out of a specimen, evaporate the moisture, and subsequently condense the moisture in a separate chamber. As such, the specimen remains at or near room temperature, which helps to retain the HMA characteristics that can be altered due to prolonged exposure to heat and oxidation potential present in forced-draft ovens. The CoreDry™ apparatus is also reported to provide a constant mass in less time than traditional oven-drying techniques (1).
FIGURE 1 CoreDryTM vacuum drying device. The CoreDryTM is already accepted by ASTM and the test procedure is available as ASTM D 7227-06 Rapid Drying of Compacted Asphalt Specimens Using Vacuum Drying Apparatus (2). However, there was little peer reviewed literature found verifying that dry mass and resultant Gmb determined from CoreDryTM is the same as that determined using AASHTO T 166 procedures.
TRB 2009 Annual Meeting CD-ROM Paper revised from original submittal.
Cross and Pokhrel 4
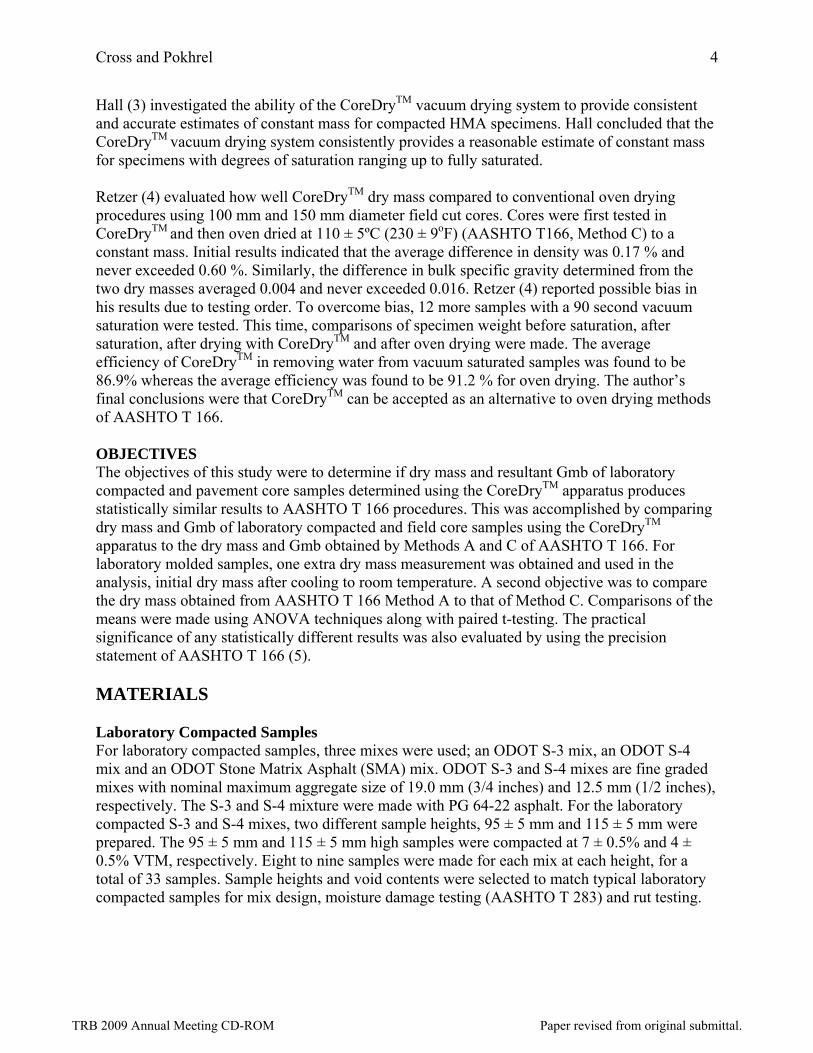
Hall (3) investigated the ability of the CoreDryTM vacuum drying system to provide consistent and accurate estimates of constant mass for compacted HMA specimens. Hall concluded that the CoreDryTM vacuum drying system consistently provides a reasonable estimate of constant mass for specimens with degrees of saturation ranging up to fully saturated. Retzer (4) evaluated how well CoreDryTM dry mass compared to conventional oven drying procedures using 100 mm and 150 mm diameter field cut cores. Cores were first tested in CoreDryTM and then oven dried at 110 ± 5ºC (230 ± 9oF) (AASHTO T166, Method C) to a constant mass. Initial results indicated that the average difference in density was 0.17 % and never exceeded 0.60 %. Similarly, the difference in bulk specific gravity determined from the two dry masses averaged 0.004 and never exceeded 0.016. Retzer (4) reported possible bias in his results due to testing order. To overcome bias, 12 more samples with a 90 second vacuum saturation were tested. This time, comparisons of specimen weight before saturation, after saturation, after drying with CoreDryTM and after oven drying were made. The average efficiency of CoreDryTM in removing water from vacuum saturated samples was found to be 86.9% whereas the average efficiency was found to be 91.2 % for oven drying. The author’s final conclusions were that CoreDryTM can be accepted as an alternative to oven drying methods of AASHTO T 166. OBJECTIVES The objectives of this study were to determine if dry mass and resultant Gmb of laboratory compacted and pavement core samples determined using the CoreDryTM apparatus produces statistically similar results to AASHTO T 166 procedures. This was accomplished by comparing dry mass and Gmb of laboratory compacted and field core samples using the CoreDryTM apparatus to the dry mass and Gmb obtained by Methods A and C of AASHTO T 166. For laboratory molded samples, one extra dry mass measurement was obtained and used in the analysis, initial dry mass after cooling to room temperature. A second objective was to compare the dry mass obtained from AASHTO T 166 Method A to that of Method C. Comparisons of the means were made using ANOVA techniques along with paired t-testing. The practical significance of any statistically different results was also evaluated by using the precision statement of AASHTO T 166 (5). MATERIALS Laboratory Compacted Samples For laboratory compacted samples, three mixes were used; an ODOT S-3 mix, an ODOT S-4 mix and an ODOT Stone Matrix Asphalt (SMA) mix. ODOT S-3 and S-4 mixes are fine graded mixes with nominal maximum aggregate size of 19.0 mm (3/4 inches) and 12.5 mm (1/2 inches), respectively. The S-3 and S-4 mixture were made with PG 64-22 asphalt. For the laboratory compacted S-3 and S-4 mixes, two different sample heights, 95 ± 5 mm and 115 ± 5 mm were prepared. The 95 ± 5 mm and 115 ± 5 mm high samples were compacted at 7 ± 0.5% and 4 ± 0.5% VTM, respectively. Eight to nine samples were made for each mix at each height, for a total of 33 samples. Sample heights and void contents were selected to match typical laboratory compacted samples for mix design, moisture damage testing (AASHTO T 283) and rut testing.
TRB 2009 Annual Meeting CD-ROM Paper revised from original submittal.
Cross and Pokhrel 5
Twenty-five field produced SMA samples were obtained from a contractor’s laboratory for an Interstate paving project. The sample heights ranged from 116 – 122 mm. Void contents varied.
Field Cores Field cores of HMA were provided from various projects by a commercial testing laboratory and two contractor labs. There were two different sizes of cores provided, 100 mm (4 inches) and 150 mm (6 inches) nominal diameters, respectively. The cores provided by the commercial testing laboratory were from old projects that were slated for disposal. Therefore, not all of these cores could be identified by project or mix. TEST PLAN Test Procedures CoreDry™ All CoreDry™ testing was performed in accordance with the manufacturer’s recommendations (1) and the procedures of ASTM D 7227 (2). The Gmb was determined using dry mass determined from CoreDry™ and the appropriate volume determined from either AASHTO T 166 or AASHTO TP 69 (ASTM D 6752). AASHTO T 166 The Gmb of each sample was determined in accordance with AASHTO T 166-05 Method A and Method C (5). There are two Gmb procedures under Method A and one under Method C. The procedures are based on how dry mass of the sample is determined. Method B uses a volumeter and does not appear to be that popular among DOTs. AASHTO T 166 is not recommended for samples where the water absorption exceeds 2 percent, by volume. Method A Note 1 of Method A (5) defines constant mass as the mass at which further drying at 52 ± 3ºC (125 ± 5ºF) does not alter the mass by more than 0.05 %. Samples partially saturated with water are dried overnight at 52 ± 3ºC (125 ± 5ºF) and then weighed at two-hour drying intervals until the mass loss is less than 0.05 %. Dry mass determined in this manner was used with the submerged mass and saturated surface dry mass (SSD) to determine Gmb and was designated as Method A dry mass or Gmb. Note 1 of Method A (5) states that recently molded lab samples, which have not been exposed to moisture, do not require drying. Note 2 of Method A (5) states that the sequence of testing may be changed to expedite testing. For lab molded samples, the dry mass is usually recorded first. The dry mass and Gmb determined in this manner was designated Initial. Method C Method C of AASHTO T 166 (5) outlines procedures for determining dry mass and Gmb of laboratory compacted and field core samples which have a substantial amount of moisture and are not required for further testing. The determination of sample volume is similar to Method A. The only difference in this method is determination of dry mass (A). The sample is placed in a pan and dried at 110 ± 5ºC (230 ± 9ºF) to a constant mass. Dry mass is defined as the weight at which further drying at 110 ± 5ºC (230 ± 9ºF) does not alter the mass by more than 0.05% when weighed at 2-hour intervals. The dry mass and Gmb determined in accordance with
TRB 2009 Annual Meeting CD-ROM Paper revised from original submittal.
Cross and Pokhrel 6
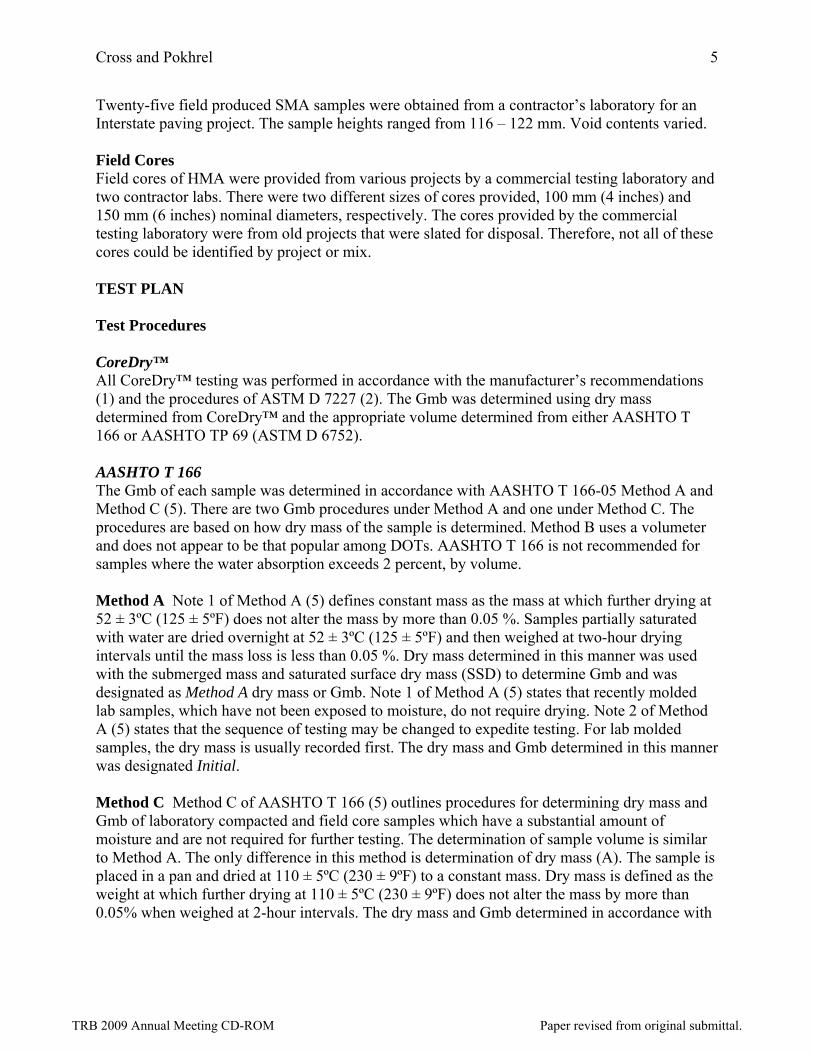
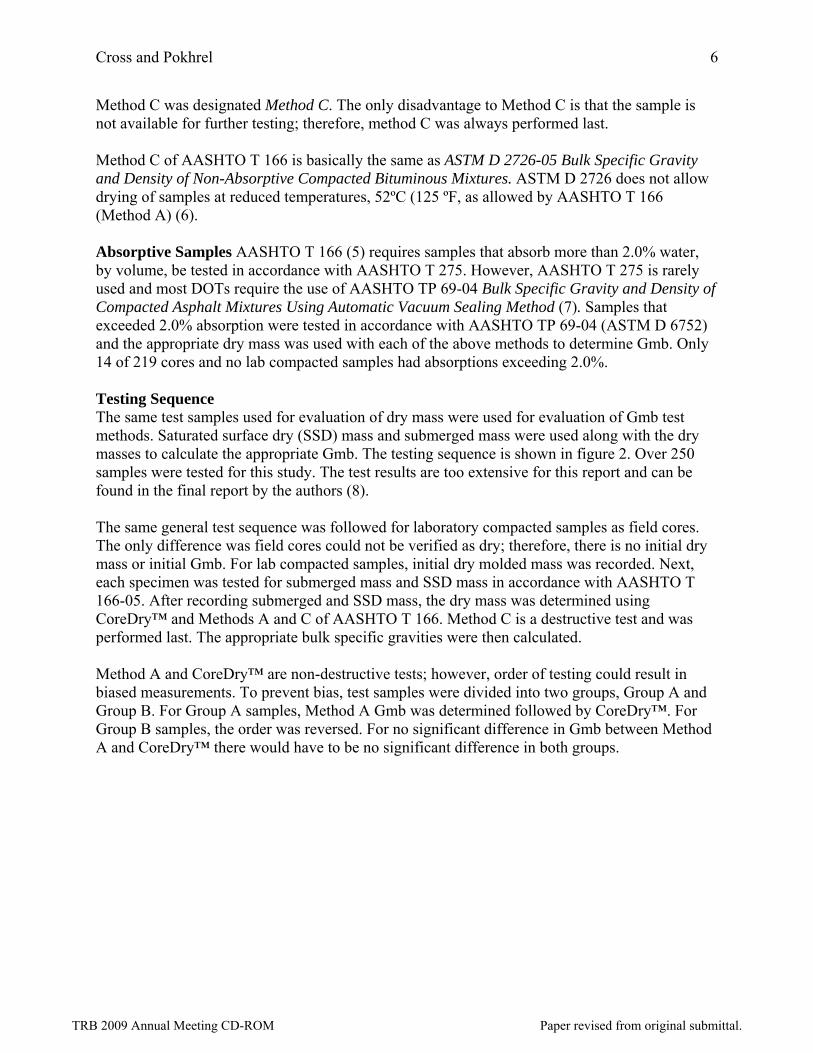
Method C was designated Method C. The only disadvantage to Method C is that the sample is not available for further testing; therefore, method C was always performed last. Method C of AASHTO T 166 is basically the same as ASTM D 2726-05 Bulk Specific Gravity and Density of Non-Absorptive Compacted Bituminous Mixtures. ASTM D 2726 does not allow drying of samples at reduced temperatures, 52ºC (125 ºF, as allowed by AASHTO T 166 (Method A) (6). Absorptive Samples AASHTO T 166 (5) requires samples that absorb more than 2.0% water, by volume, be tested in accordance with AASHTO T 275. However, AASHTO T 275 is rarely used and most DOTs require the use of AASHTO TP 69-04 Bulk Specific Gravity and Density of Compacted Asphalt Mixtures Using Automatic Vacuum Sealing Method (7). Samples that exceeded 2.0% absorption were tested in accordance with AASHTO TP 69-04 (ASTM D 6752) and the appropriate dry mass was used with each of the above methods to determine Gmb. Only 14 of 219 cores and no lab compacted samples had absorptions exceeding 2.0%. Testing Sequence The same test samples used for evaluation of dry mass were used for evaluation of Gmb test methods. Saturated surface dry (SSD) mass and submerged mass were used along with the dry masses to calculate the appropriate Gmb. The testing sequence is shown in figure 2. Over 250 samples were tested for this study. The test results are too extensive for this report and can be found in the final report by the authors (8). The same general test sequence was followed for laboratory compacted samples as field cores. The only difference was field cores could not be verified as dry; therefore, there is no initial dry mass or initial Gmb. For lab compacted samples, initial dry molded mass was recorded. Next, each specimen was tested for submerged mass and SSD mass in accordance with AASHTO T 166-05. After recording submerged and SSD mass, the dry mass was determined using CoreDry™ and Methods A and C of AASHTO T 166. Method C is a destructive test and was performed last. The appropriate bulk specific gravities were then calculated. Method A and CoreDry™ are non-destructive tests; however, order of testing could result in biased measurements. To prevent bias, test samples were divided into two groups, Group A and Group B. For Group A samples, Method A Gmb was determined followed by CoreDry™. For Group B samples, the order was reversed. For no significant difference in Gmb between Method A and CoreDry™ there would have to be no significant difference in both groups.
TRB 2009 Annual Meeting CD-ROM Paper revised from original submittal.
Cross and Pokhrel 7
*Laboratory compacted specimens only.
FIGURE 2 Test procedures for evaluation of dry mass and Gmb.
ANALYSIS OF DRY MASS TEST RESULTS
ANOVA Techniques Laboratory Compacted Samples S-3 and S-4 Superpave mixes consisted of two sets of samples with different heights, 95 mm and 115 mm. SMA samples were all approximately 115 mm high. For effective comparisons, samples of approximately equal dry mass are necessary. Therefore, ANOVA tests were performed separately for Superpave and SMA mixtures. S-3 & S-4 Mixtures ANOVA results for S-3 and S-4 mixes, by group, are shown in table 1. The ANOVA indicates that there is no statistical difference between the four methods used to determine dry mass. However, there were significant differences between dry mass by mix type and sample height, as expected. There were significant interactions between mix type and sample
T 166 Method C Dry Mass & Gmb
Submerged Mass
T 166 Method A Dry Mass & Gmb
SSD Mass
CoreDryTM Dry Mass & Gmb
Test Sample
Initial* Dry Mass & Gmb
CoreDryTM Dry Mass & Gmb
T 166 Method A Dry Mass & Gmb
Group B Group A
TRB 2009 Annual Meeting CD-ROM Paper revised from original submittal.
Cross and Pokhrel 8
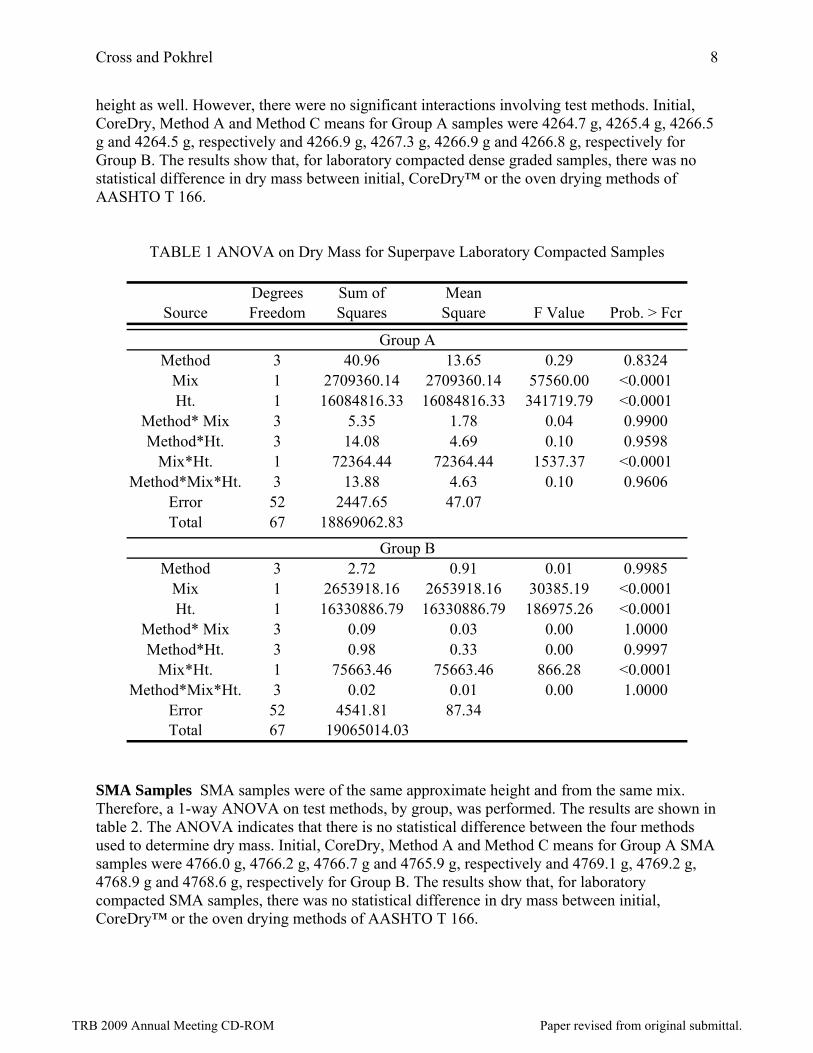
height as well. However, there were no significant interactions involving test methods. Initial, CoreDry, Method A and Method C means for Group A samples were 4264.7 g, 4265.4 g, 4266.5 g and 4264.5 g, respectively and 4266.9 g, 4267.3 g, 4266.9 g and 4266.8 g, respectively for Group B. The results show that, for laboratory compacted dense graded samples, there was no statistical difference in dry mass between initial, CoreDry™ or the oven drying methods of AASHTO T 166.
TABLE 1 ANOVA on Dry Mass for Superpave Laboratory Compacted Samples
Degrees Sum of MeanSource Freedom Squares Square F Value Prob. > Fcr
Method 3 40.96 13.65 0.29 0.8324Mix 1 2709360.14 2709360.14 57560.00 <0.0001Ht. 1 16084816.33 16084816.33 341719.79 <0.0001
Method* Mix 3 5.35 1.78 0.04 0.9900Method*Ht. 3 14.08 4.69 0.10 0.9598
Mix*Ht. 1 72364.44 72364.44 1537.37 <0.0001Method*Mix*Ht. 3 13.88 4.63 0.10 0.9606
Error 52 2447.65 47.07Total 67 18869062.83
Method 3 2.72 0.91 0.01 0.9985Mix 1 2653918.16 2653918.16 30385.19 <0.0001Ht. 1 16330886.79 16330886.79 186975.26 <0.0001
Method* Mix 3 0.09 0.03 0.00 1.0000Method*Ht. 3 0.98 0.33 0.00 0.9997
Mix*Ht. 1 75663.46 75663.46 866.28 <0.0001Method*Mix*Ht. 3 0.02 0.01 0.00 1.0000
Error 52 4541.81 87.34Total 67 19065014.03
Group A
Group B
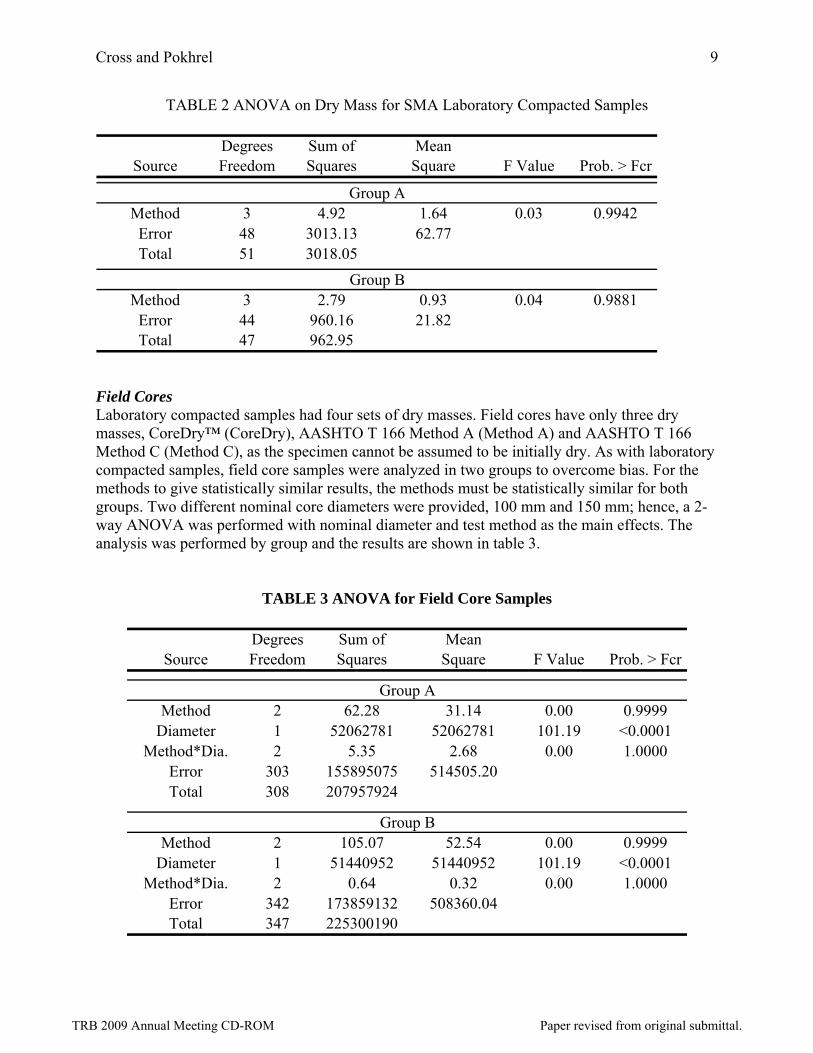
SMA Samples SMA samples were of the same approximate height and from the same mix. Therefore, a 1-way ANOVA on test methods, by group, was performed. The results are shown in table 2. The ANOVA indicates that there is no statistical difference between the four methods used to determine dry mass. Initial, CoreDry, Method A and Method C means for Group A SMA samples were 4766.0 g, 4766.2 g, 4766.7 g and 4765.9 g, respectively and 4769.1 g, 4769.2 g, 4768.9 g and 4768.6 g, respectively for Group B. The results show that, for laboratory compacted SMA samples, there was no statistical difference in dry mass between initial, CoreDry™ or the oven drying methods of AASHTO T 166.
TRB 2009 Annual Meeting CD-ROM Paper revised from original submittal.
Cross and Pokhrel 9
TABLE 2 ANOVA on Dry Mass for SMA Laboratory Compacted Samples
Degrees Sum of MeanSource Freedom Squares Square F Value Prob. > Fcr
Method 3 4.92 1.64 0.03 0.9942Error 48 3013.13 62.77Total 51 3018.05
Method 3 2.79 0.93 0.04 0.9881Error 44 960.16 21.82Total 47 962.95
Group A
Group B
Field Cores Laboratory compacted samples had four sets of dry masses. Field cores have only three dry masses, CoreDry™ (CoreDry), AASHTO T 166 Method A (Method A) and AASHTO T 166 Method C (Method C), as the specimen cannot be assumed to be initially dry. As with laboratory compacted samples, field core samples were analyzed in two groups to overcome bias. For the methods to give statistically similar results, the methods must be statistically similar for both groups. Two different nominal core diameters were provided, 100 mm and 150 mm; hence, a 2-way ANOVA was performed with nominal diameter and test method as the main effects. The analysis was performed by group and the results are shown in table 3.
TABLE 3 ANOVA for Field Core Samples
Degrees Sum of MeanSource Freedom Squares Square F Value Prob. > Fcr
Method 2 62.28 31.14 0.00 0.9999Diameter 1 52062781 52062781 101.19 <0.0001
Method*Dia. 2 5.35 2.68 0.00 1.0000Error 303 155895075 514505.20Total 308 207957924
Method 2 105.07 52.54 0.00 0.9999Diameter 1 51440952 51440952 101.19 <0.0001
Method*Dia. 2 0.64 0.32 0.00 1.0000Error 342 173859132 508360.04Total 347 225300190
Group A
Group B
TRB 2009 Annual Meeting CD-ROM Paper revised from original submittal.
Cross and Pokhrel 10
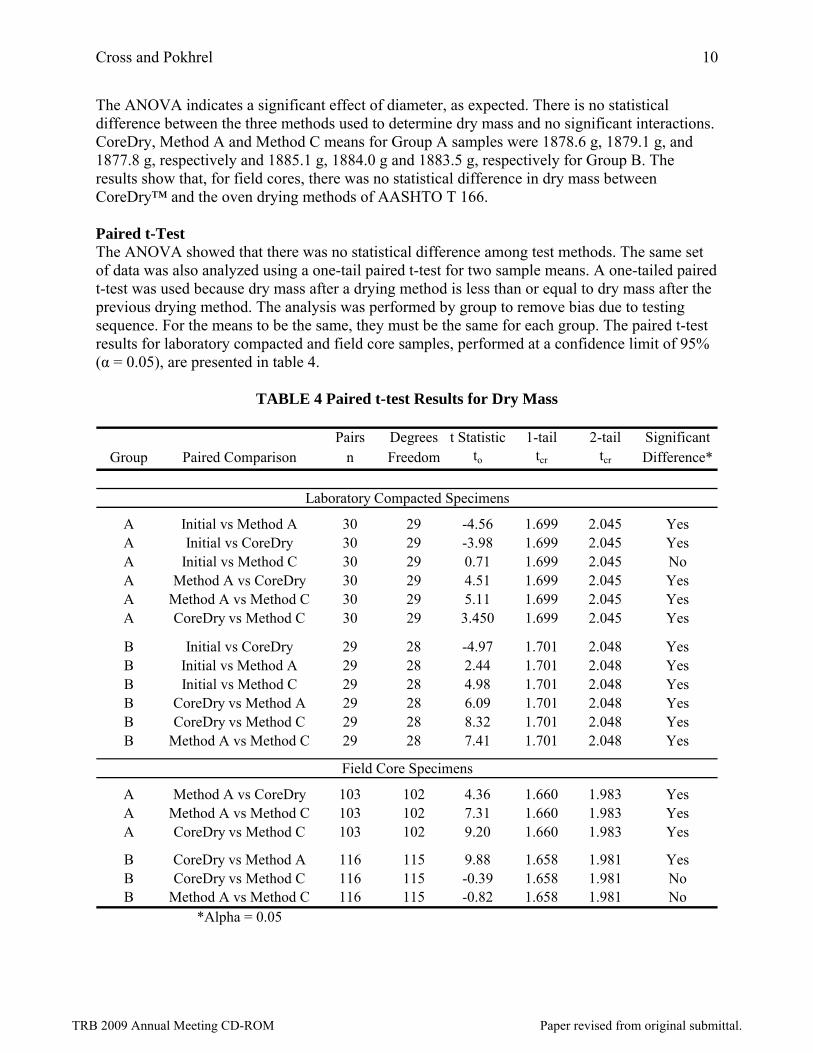
The ANOVA indicates a significant effect of diameter, as expected. There is no statistical difference between the three methods used to determine dry mass and no significant interactions. CoreDry, Method A and Method C means for Group A samples were 1878.6 g, 1879.1 g, and 1877.8 g, respectively and 1885.1 g, 1884.0 g and 1883.5 g, respectively for Group B. The results show that, for field cores, there was no statistical difference in dry mass between CoreDry™ and the oven drying methods of AASHTO T 166. Paired t-Test The ANOVA showed that there was no statistical difference among test methods. The same set of data was also analyzed using a one-tail paired t-test for two sample means. A one-tailed paired t-test was used because dry mass after a drying method is less than or equal to dry mass after the previous drying method. The analysis was performed by group to remove bias due to testing sequence. For the means to be the same, they must be the same for each group. The paired t-test results for laboratory compacted and field core samples, performed at a confidence limit of 95% (α = 0.05), are presented in table 4.
TABLE 4 Paired t-test Results for Dry Mass
Pairs Degrees t Statistic 1-tail 2-tail SignificantGroup Paired Comparison n Freedom to tcr tcr Difference*
A Initial vs Method A 30 29 -4.56 1.699 2.045 YesA Initial vs CoreDry 30 29 -3.98 1.699 2.045 YesA Initial vs Method C 30 29 0.71 1.699 2.045 NoA Method A vs CoreDry 30 29 4.51 1.699 2.045 YesA Method A vs Method C 30 29 5.11 1.699 2.045 YesA CoreDry vs Method C 30 29 3.450 1.699 2.045 Yes
B Initial vs CoreDry 29 28 -4.97 1.701 2.048 YesB Initial vs Method A 29 28 2.44 1.701 2.048 YesB Initial vs Method C 29 28 4.98 1.701 2.048 YesB CoreDry vs Method A 29 28 6.09 1.701 2.048 YesB CoreDry vs Method C 29 28 8.32 1.701 2.048 YesB Method A vs Method C 29 28 7.41 1.701 2.048 Yes
A Method A vs CoreDry 103 102 4.36 1.660 1.983 YesA Method A vs Method C 103 102 7.31 1.660 1.983 YesA CoreDry vs Method C 103 102 9.20 1.660 1.983 Yes
B CoreDry vs Method A 116 115 9.88 1.658 1.981 YesB CoreDry vs Method C 116 115 -0.39 1.658 1.981 NoB Method A vs Method C 116 115 -0.82 1.658 1.981 No
*Alpha = 0.05
Laboratory Compacted Specimens
Field Core Specimens
TRB 2009 Annual Meeting CD-ROM Paper revised from original submittal.
Cross and Pokhrel 11
According to the paired t-test results, not all methods are statistically different from each other. However, due to bias in the testing sequence, for the methods to be similar they must be similar in each group. The Group A cores were dried using Method A followed by CoreDry™. The Group B cores were dried using CoreDry™ followed by Method A. Based on the paired t-testing, the methods give different dry mass results.
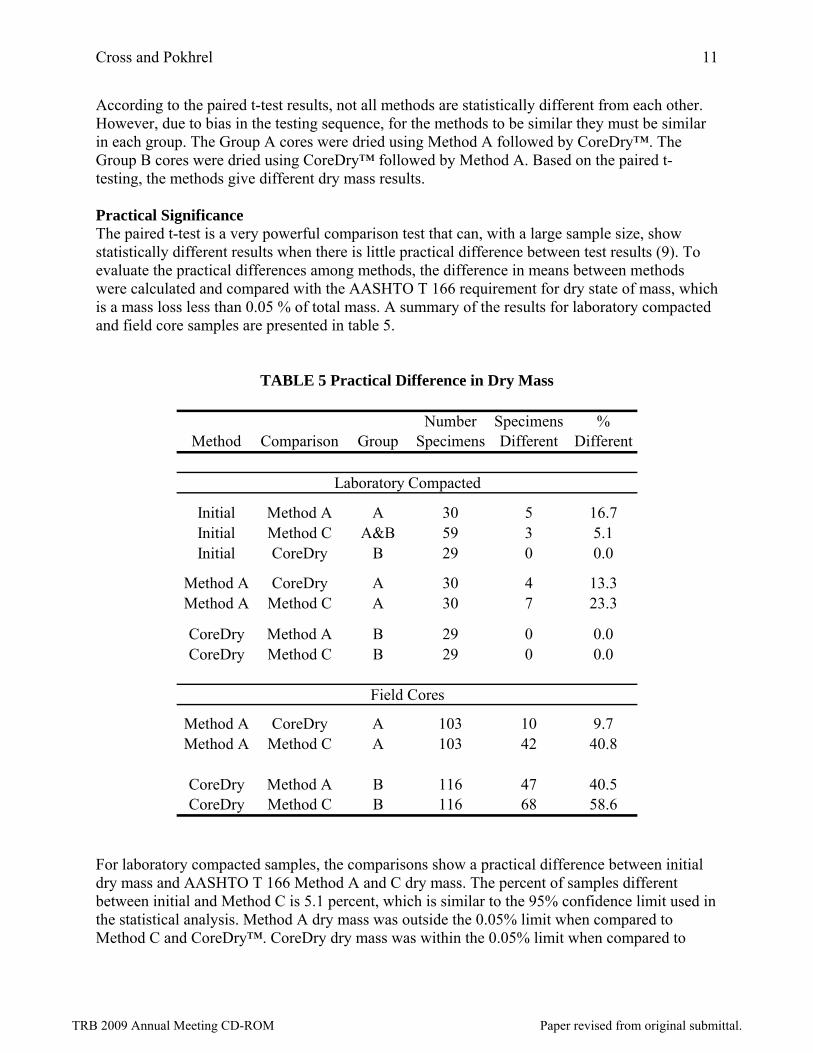
Practical Significance The paired t-test is a very powerful comparison test that can, with a large sample size, show statistically different results when there is little practical difference between test results (9). To evaluate the practical differences among methods, the difference in means between methods were calculated and compared with the AASHTO T 166 requirement for dry state of mass, which is a mass loss less than 0.05 % of total mass. A summary of the results for laboratory compacted and field core samples are presented in table 5.
TABLE 5 Practical Difference in Dry Mass
Number Specimens %Method Comparison Group Specimens Different Different
Initial Method A A 30 5 16.7Initial Method C A&B 59 3 5.1Initial CoreDry B 29 0 0.0
Method A CoreDry A 30 4 13.3Method A Method C A 30 7 23.3
CoreDry Method A B 29 0 0.0CoreDry Method C B 29 0 0.0
Method A CoreDry A 103 10 9.7Method A Method C A 103 42 40.8
CoreDry Method A B 116 47 40.5CoreDry Method C B 116 68 58.6
Laboratory Compacted
Field Cores
For laboratory compacted samples, the comparisons show a practical difference between initial dry mass and AASHTO T 166 Method A and C dry mass. The percent of samples different between initial and Method C is 5.1 percent, which is similar to the 95% confidence limit used in the statistical analysis. Method A dry mass was outside the 0.05% limit when compared to Method C and CoreDry™. CoreDry dry mass was within the 0.05% limit when compared to
TRB 2009 Annual Meeting CD-ROM Paper revised from original submittal.
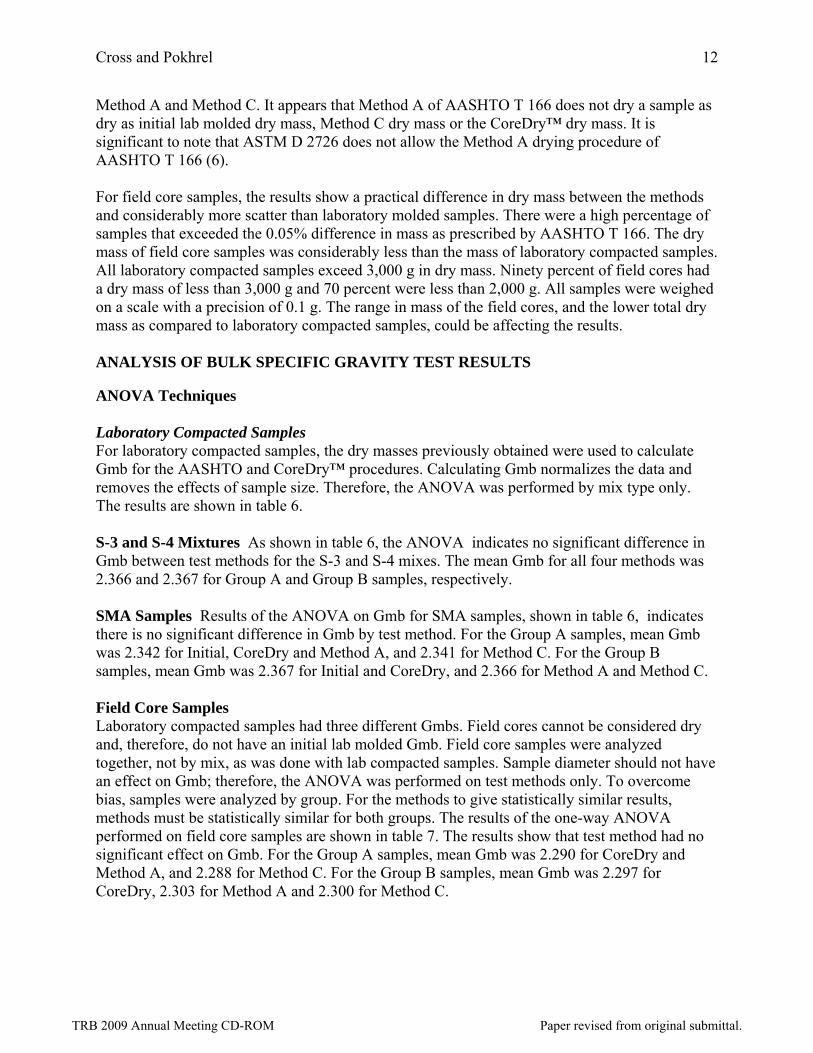
Cross and Pokhrel 12
Method A and Method C. It appears that Method A of AASHTO T 166 does not dry a sample as dry as initial lab molded dry mass, Method C dry mass or the CoreDry™ dry mass. It is significant to note that ASTM D 2726 does not allow the Method A drying procedure of AASHTO T 166 (6). For field core samples, the results show a practical difference in dry mass between the methods and considerably more scatter than laboratory molded samples. There were a high percentage of samples that exceeded the 0.05% difference in mass as prescribed by AASHTO T 166. The dry mass of field core samples was considerably less than the mass of laboratory compacted samples. All laboratory compacted samples exceed 3,000 g in dry mass. Ninety percent of field cores had a dry mass of less than 3,000 g and 70 percent were less than 2,000 g. All samples were weighed on a scale with a precision of 0.1 g. The range in mass of the field cores, and the lower total dry mass as compared to laboratory compacted samples, could be affecting the results. ANALYSIS OF BULK SPECIFIC GRAVITY TEST RESULTS ANOVA Techniques Laboratory Compacted Samples For laboratory compacted samples, the dry masses previously obtained were used to calculate Gmb for the AASHTO and CoreDry™ procedures. Calculating Gmb normalizes the data and removes the effects of sample size. Therefore, the ANOVA was performed by mix type only. The results are shown in table 6.
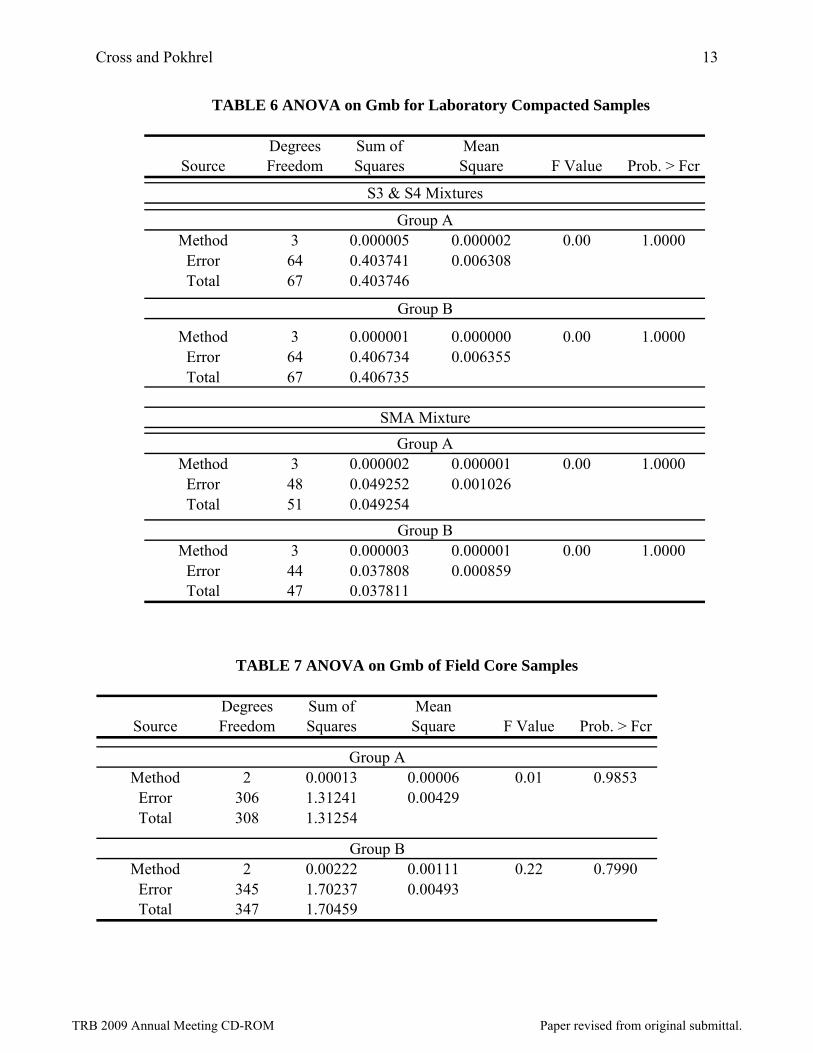
S-3 and S-4 Mixtures As shown in table 6, the ANOVA indicates no significant difference in Gmb between test methods for the S-3 and S-4 mixes. The mean Gmb for all four methods was 2.366 and 2.367 for Group A and Group B samples, respectively.
SMA Samples Results of the ANOVA on Gmb for SMA samples, shown in table 6, indicates there is no significant difference in Gmb by test method. For the Group A samples, mean Gmb was 2.342 for Initial, CoreDry and Method A, and 2.341 for Method C. For the Group B samples, mean Gmb was 2.367 for Initial and CoreDry, and 2.366 for Method A and Method C.
Field Core Samples Laboratory compacted samples had three different Gmbs. Field cores cannot be considered dry and, therefore, do not have an initial lab molded Gmb. Field core samples were analyzed together, not by mix, as was done with lab compacted samples. Sample diameter should not have an effect on Gmb; therefore, the ANOVA was performed on test methods only. To overcome bias, samples were analyzed by group. For the methods to give statistically similar results, methods must be statistically similar for both groups. The results of the one-way ANOVA performed on field core samples are shown in table 7. The results show that test method had no significant effect on Gmb. For the Group A samples, mean Gmb was 2.290 for CoreDry and Method A, and 2.288 for Method C. For the Group B samples, mean Gmb was 2.297 for CoreDry, 2.303 for Method A and 2.300 for Method C.
TRB 2009 Annual Meeting CD-ROM Paper revised from original submittal.
Cross and Pokhrel 13
TABLE 6 ANOVA on Gmb for Laboratory Compacted Samples
Degrees Sum of MeanSource Freedom Squares Square F Value Prob. > Fcr
Method 3 0.000005 0.000002 0.00 1.0000Error 64 0.403741 0.006308Total 67 0.403746
Method 3 0.000001 0.000000 0.00 1.0000Error 64 0.406734 0.006355Total 67 0.406735
Method 3 0.000002 0.000001 0.00 1.0000Error 48 0.049252 0.001026Total 51 0.049254
Method 3 0.000003 0.000001 0.00 1.0000Error 44 0.037808 0.000859Total 47 0.037811
Group A
Group B
Group A
Group B
S3 & S4 Mixtures
SMA Mixture
TABLE 7 ANOVA on Gmb of Field Core Samples
Degrees Sum of MeanSource Freedom Squares Square F Value Prob. > Fcr
Method 2 0.00013 0.00006 0.01 0.9853Error 306 1.31241 0.00429Total 308 1.31254
Method 2 0.00222 0.00111 0.22 0.7990Error 345 1.70237 0.00493Total 347 1.70459
Group A
Group B
TRB 2009 Annual Meeting CD-ROM Paper revised from original submittal.
Cross and Pokhrel 14
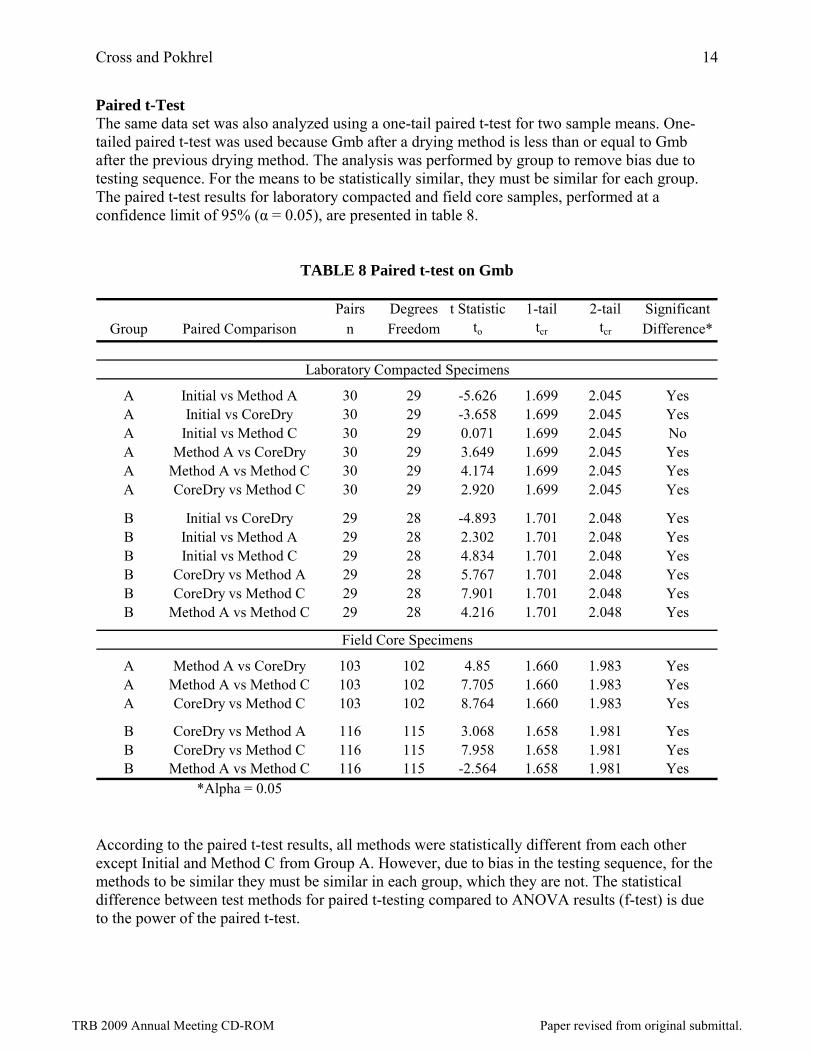
Paired t-Test The same data set was also analyzed using a one-tail paired t-test for two sample means. One-tailed paired t-test was used because Gmb after a drying method is less than or equal to Gmb after the previous drying method. The analysis was performed by group to remove bias due to testing sequence. For the means to be statistically similar, they must be similar for each group. The paired t-test results for laboratory compacted and field core samples, performed at a confidence limit of 95% (α = 0.05), are presented in table 8.
TABLE 8 Paired t-test on Gmb
Pairs Degrees t Statistic 1-tail 2-tail SignificantGroup Paired Comparison n Freedom to tcr tcr Difference*
A Initial vs Method A 30 29 -5.626 1.699 2.045 YesA Initial vs CoreDry 30 29 -3.658 1.699 2.045 YesA Initial vs Method C 30 29 0.071 1.699 2.045 NoA Method A vs CoreDry 30 29 3.649 1.699 2.045 YesA Method A vs Method C 30 29 4.174 1.699 2.045 YesA CoreDry vs Method C 30 29 2.920 1.699 2.045 Yes
B Initial vs CoreDry 29 28 -4.893 1.701 2.048 YesB Initial vs Method A 29 28 2.302 1.701 2.048 YesB Initial vs Method C 29 28 4.834 1.701 2.048 YesB CoreDry vs Method A 29 28 5.767 1.701 2.048 YesB CoreDry vs Method C 29 28 7.901 1.701 2.048 YesB Method A vs Method C 29 28 4.216 1.701 2.048 Yes
A Method A vs CoreDry 103 102 4.85 1.660 1.983 YesA Method A vs Method C 103 102 7.705 1.660 1.983 YesA CoreDry vs Method C 103 102 8.764 1.660 1.983 Yes
B CoreDry vs Method A 116 115 3.068 1.658 1.981 YesB CoreDry vs Method C 116 115 7.958 1.658 1.981 YesB Method A vs Method C 116 115 -2.564 1.658 1.981 Yes
*Alpha = 0.05
Laboratory Compacted Specimens
Field Core Specimens
According to the paired t-test results, all methods were statistically different from each other except Initial and Method C from Group A. However, due to bias in the testing sequence, for the methods to be similar they must be similar in each group, which they are not. The statistical difference between test methods for paired t-testing compared to ANOVA results (f-test) is due to the power of the paired t-test.
TRB 2009 Annual Meeting CD-ROM Paper revised from original submittal.
Cross and Pokhrel 15
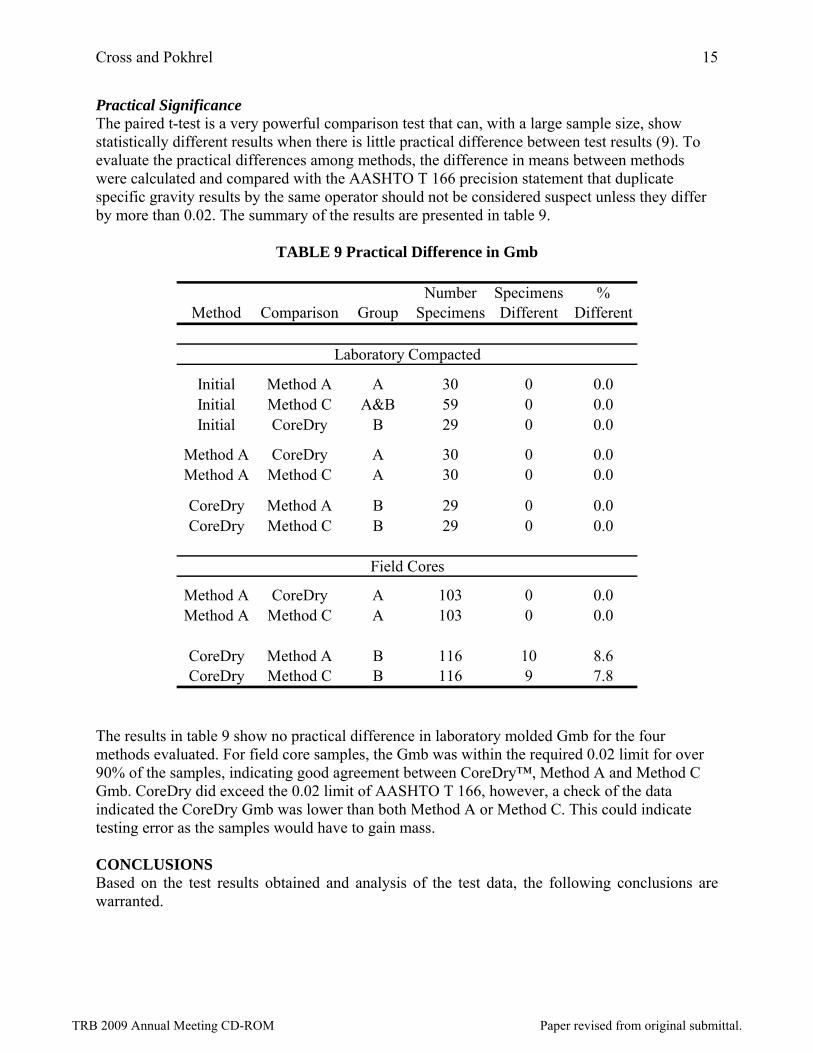
Practical Significance The paired t-test is a very powerful comparison test that can, with a large sample size, show statistically different results when there is little practical difference between test results (9). To evaluate the practical differences among methods, the difference in means between methods were calculated and compared with the AASHTO T 166 precision statement that duplicate specific gravity results by the same operator should not be considered suspect unless they differ by more than 0.02. The summary of the results are presented in table 9.
TABLE 9 Practical Difference in Gmb
Number Specimens %Method Comparison Group Specimens Different Different
Initial Method A A 30 0 0.0Initial Method C A&B 59 0 0.0Initial CoreDry B 29 0 0.0
Method A CoreDry A 30 0 0.0Method A Method C A 30 0 0.0
CoreDry Method A B 29 0 0.0CoreDry Method C B 29 0 0.0
Method A CoreDry A 103 0 0.0Method A Method C A 103 0 0.0
CoreDry Method A B 116 10 8.6CoreDry Method C B 116 9 7.8
Laboratory Compacted
Field Cores
The results in table 9 show no practical difference in laboratory molded Gmb for the four methods evaluated. For field core samples, the Gmb was within the required 0.02 limit for over 90% of the samples, indicating good agreement between CoreDry™, Method A and Method C Gmb. CoreDry did exceed the 0.02 limit of AASHTO T 166, however, a check of the data indicated the CoreDry Gmb was lower than both Method A or Method C. This could indicate testing error as the samples would have to gain mass.
CONCLUSIONS Based on the test results obtained and analysis of the test data, the following conclusions are warranted.
TRB 2009 Annual Meeting CD-ROM Paper revised from original submittal.
Cross and Pokhrel 16
1. Based on ANOVA testing of laboratory compacted and field core samples, there was no statistical difference in dry mass or Gmb between initial, AASHTO T 166 Method A, AASHTO T 166 Method C or CoreDryTM procedures.
2. Paired t-test analysis, which is a much more powerful test than the F-test (ANOVA), showed a statistical difference in dry mass and Gmb, at a 95 percent confidence limit (α = 0.05), between initial, AASHTO T 166 Method A, AASHTO Method C and CoreDryTM procedures.
3. The practical significance between methods for determining dry mass was evaluated by comparing the difference in dry mass between methods for each sample to the AASHTO T 166 requirement of a mass loss of less than 0.05 % between two consecutive drying operations.
a. For laboratory compacted samples, there was no practical difference found between CoreDryTM dry mass and either initial laboratory compacted dry mass or Method C of AAASHTO T 166. There was no practical difference found between initial laboratory compacted dry mass and Method C of AAASHTO T 166. There was a practical difference found between AASHTO T 166 Method A dry mass and initial laboratory compacted dry mass, Method C dry mass and CoreDry™ dry mass.
b. For field core samples, there was a practical difference in dry mass between CoreDry™, Method A and Method C of AASHTO T 166. The smaller dry mass of core samples compared to laboratory compacted samples could have had an effect on results.
4. The practical significance between methods for determining Gmb of laboratory compacted specimens was evaluated using the precision statement of AASHTO T 166 that duplicate specific gravity results by the same operator should not be considered suspect unless they differ by more than 0.02 (3). There was no practical difference in laboratory compacted samples between CoreDryTM, initial, AASHTO T 166 Method A or AASHTO T 166 Method C procedures.
5. The practical significance between methods for determining Gmb of field core samples was evaluated using the precision statement of AASHTO T 166 that duplicate specific gravity results by the same operator should not be considered suspect unless they differ by more than 0.02 (3). There was a practical difference in dry mass between CoreDry™, Method A and Method C of AASHTO T 166.
RECOMMENDATIONS
1. The CoreDryTM apparatus should be considered as an equivalent procedure to Method A of AASHTO T 166 for determining dry mass and Gmb of HMA specimens.
REFERENCES
1. CoreDry™ Operators Guide, Version 4, InstroTek® Inc. Raleigh, NC, June 2005. 2. “Standard Test Method for Rapid Drying of Compacted Asphalt Specimens Using
Vacuum Drying Apparatus, ASTM Designation: D 7227-06.” Annual Book of ASTM Standards, Volume 04.03., American Society for Testing and Materials, West Conshohocken, PA., 2006.
3. Hall, Kevin D. “Evaluation of Drying Efficiency for Hot-Mix Cores Using Vacuum Drying Method.” Compendium of Papers, 86th Annual Meeting of the Transportation
TRB 2009 Annual Meeting CD-ROM Paper revised from original submittal.
Cross and Pokhrel 17
Research Board. CD-ROM. Transportation Research Board, National Research Council, Washington, D.C., January 2007.
4. Retzer, N., “Review and Research of InstroTek®’s CoreDry™ Report”, Materials and Geotechnical Branch, Colorado Department of Transportation, Denver, Colorado, 2006.
5. “Bulk Specific Gravity of Compacted Hot-Mix Asphalt Using Saturated Surface-Dry Specimens, AASHTO Designation: T 166.” Standard Specifications for Transportation Materials and Methods of Sampling and Testing, Twenty-fifth Edition, Part 2A, Tests, American Association of State Highway and Transportation Officials, Washington, D.C., 2005.
6. “Standard Test Method for Bulk Specific Gravity and Density of Non-Absorptive Compacted Bituminous Mixtures, ASTM Designation: D 2726.” Annual Book of ASTM Standards, Volume 04.03., American Society for Testing and Materials, West Conshohocken, PA., 2006.
7. “Bulk Specific Gravity and Density of Compacted Asphalt Mixtures Using Automatic Vacuum Sealing Method, AASHTO Designation: TP 69-04.” AASHTO Provisional Standards for Transportation Materials and Methods of Sampling and Testing, Twenty-fifth Edition, American Association of State Highway and Transportation Officials, Washington, D.C., 2005.
8. Cross, Stephen A. and Gyanendra Pohkrel. Validation of the CoreDry and CoreReader Apparatus. Final Report, OTC Project Number: HWY-05-11. Oklahoma Transportation Center, Oklahoma State University, Stillwater, Oklahoma, March 2008, 80 pp.
9. Montgomery, Douglas C., George Runger and Norma Hubele. Engineering Statistics, Fourth Edition, John Wiley & Sons, Inc., Hoboken, NJ, 2007.
TRB 2009 Annual Meeting CD-ROM Paper revised from original submittal.
Top Related