


Languages
Pages
Legal


Evaluation of the OhmMapper Instrument for
Measurement of Soil Moisture
1,2Jeffrey P. Walker and 1Paul R. Houser
1. Hydrological Sciences Branch, Laboratory for Hydrospheric ProcessesNASA’s Goddard Space Flight Center, Greenbelt, MD 20771, USA
2. Goddard Earth Sciences and Technology Center
Submitted to:Soil Science Society of America Journal
7th November, 2000
Corresponding Author:Jeffrey P. Walker
Rm B309, Building 33NASA/GSFC Mail Code 974Greenbelt MD, 21144 USA

ACKNOWLEDGEMENTS
The United States Department of Agriculture is acknowledged for allowing access to the
OPE3 field site at the Agriculture Research Center in Beltsvill e, MD. Assistance was given
in the field by Kristi Arsenault, Brian Cosgrove, Dan Hymer and Melinda Pouss. The loan
of an OhmMapper by Geometrics Inc. and analysis of OhmMapper data by Brandy
Rutledge is acknowledged.

Evaluation of the OhmMapper Instrument forMeasurement of Soil Moisture
Abstract
An instrument for making rapid measurements of the soil moisture content in the
top few meters of soil i s an essential tool for many applications, including understanding of
soil water dynamics, evaluation of agriculture water stress, validation of soil moisture
modeling, and assimilation of remotely sensed near-surface soil moisture data. Studies have
shown that electrical resistance measurements may be used to measure soil moisture
content. In this paper, electrical resistivity (resistance multiplied by a geometric factor)
measurements of the soil using the OhmMapper instrument of Geometrics Inc. are
compared with time domain reflectometry point measurements of soil moisture to a depth
of 70 cm. It was found that the OhmMapper could measure soil moisture content with a
correlation coefficient of up to 0.6. It is li kely that this correlation coeff icient would be
greater if much deeper measurements of soil moisture were compared with the OhmMapper
measurements.

1
1. INTRODUCTION
Knowledge of the spatial distribution in soil moisture content for the top meter or
two of the earth’s surface is important for many environmental studies, including
meteorology, hydrology and agronomy. However, as a result of the heterogeneity of soil
properties, topography, land cover, evapotranspiration, and precipitation, soil moisture is
highly variable both spatially and temporally (Engman, 1991; Wood et al., 1993). Hence,
numerical soil moisture models are prone to error (Wood et al., 1993) and spatial coverage
by point measurements is limited by logistics (Giacomelli et al., 1995). Moreover, soil
moisture measurement depth from remote sensing observations is limited to the top few
centimeters (Schmugge, 1985). As a result, research is being directed toward a combination
of these three approaches for estimating the spatial distribution and temporal variation of
soil moisture content; assimilation of remote sensing observations into the numerical soil
moisture model (eg. Houser et al., 1998) and calibration/evaluation of the soil moisture
model from point measurements (eg. Walker et al., 2000). However, validation of such a
system over even moderately sized areas is diff icult, due to a lack of knowledge about
spatial variabili ty in the soil moisture profile. This necessitates a dependence on sparse
point measurements of soil moisture and measurements of surrogate variables, such as
surface temperature and evapotranspiration, for validation of the soil moisture estimates. In
order to overcome such limitations, there is a demonstrated need for an instrument that
allows rapid measurement of the spatial variabili ty in soil moisture for the top meter or two
of the earth’s surface.

2
Studies have shown that soil moisture content can be determined from
measurements of the soil electrical resistance (eg. Seyfried, 1993; Amer et al., 1994; Hymer
et al., 2000) using point measurement techniques. A new instrument on the market for
mapping the spatial variabili ty of electrical resistivity (resistance multiplied by a geometric
factor) over the top several meters of the earth’s surface is the OhmMapper by Geometrics
Inc. In this paper we evaluate the OhmMapper for its potential to map the soil moisture
profile over large areas in a timely fashion.
2. DATA AND METHODOLOGY
2.1 Study Area
Evaluation of the OhmMapper was undertaken at the OPE3 (Optimizing Production
inputs for Economic and Environmental Enhancement) field site located at the United
States Department of Agriculture, Agriculture Research Center, in Beltsvill e, MD (Gish et
al., 2001). The OPE3 field site has a sandy loam soil with terrain slopes from 1% to 3% and
is used for growing corn during the spring and summer. This field site consists of four
gently sloping 4ha watersheds that feed a wooded riparian wetland and first-order stream. A
single 250m transect running from top to bottom of one of the watersheds was monitored
using both widely accepted point measurement techniques (capacitance and time domain
reflectometry) and the OhmMapper. Point measurements were made at 25m spacing to a
depth of 70cm. Evaluation was made over a 1-month period immediately following
planting in the spring growing season of 2000. Soil moisture content and OhmMapper
measurements were made on a total of 8 days.

3
2.2 Point Measurements
The point measurements of soil moisture content were made with the commercially
available Theta Probe from Delta-T Devices Ltd. (Delta-T Devices Ltd., 1996) and the
Trase Connector Time Domain Reflectometry (TDR) soil moisture instrument from Soil
Moisture Equipment Corp. (Soil Moisture Equipment Corp., 1989). (The mention of trade
and company names is for the benefit of the reader and does not imply an endorsement of
the product.) By inserting the probes/waveguides vertically from the soil surface, the Theta
Probe provided a soil moisture measurement over the top 6cm of soil , while the TDR
instrument provided soil moisture measurements over the top 15, 30, 45, 60 and 70cm of
soil . Comparison of Theta Probe and 15cm TDR measurements with thermogravimetric
measurements showed that the manufacturers calibration was not satisfactory for this
evaluation (Figure 1). Hence a correction was applied to the point measurements of soil
moisture content.
2.3 OhmMapper
The OhmMapper instrument is a capacitively-coupled resistivity system that
measures the electrical properties of the ground without the cumbersome galvanic
electrodes used in traditional resistivity surveys. A simple coaxial-cable array with
transmitter and receiver sections is pulled along the ground either by a single person or a
small all -terrain vehicle (Figure 2). In conventional resistance surveys, four electrodes are
inserted into the soil and a current injected into the ground by connecting a DC power
source to two of the electrodes. The voltage is then measured at the remaining two
electrodes, and the resistance calculated using Ohm’s Law. The resistance measured varies
as a function of the distance and geometry between the probes, so it is normalized with the

4
addition of a geometric factor that converts the measurement to resistivity (Geometrics Inc.,
1999). This is the basis for the electrical resistance sensors commercially available for
measurement of soil moisture content.
Like some configurations of traditional galvanic resistivity, the OhmMapper uses a
dipole-dipole array (ie. injection of current following measurement of voltage rather than a
nested measurement) to measure resistivity, except that contact is made with the ground
capacitively. The dipole-dipole array is very sensitive to horizontal changes in resistivity
but relatively insensitive to vertical changes, meaning that it is good in mapping vertical
structures but relatively poor in mapping horizontal structures (Loke, 1991). By increasing
the dipole cable length and/or tow-link cable length, and hence the total length of the
dipole-dipole array, the depth of the resistivity measurement is increased. For dipoles
separated by a dipole length (see Figure 2) this measurement depth is approximately 14%
of the total length of the dipole-dipole array (Loke, 1999). The measurement depth
increases to approximately 22% of the total length of the dipole-dipole array for dipoles
separated by six dipole lengths (Loke, 1999). Hence, by making multiple passes with
different configurations of the OhmMapper it is possible to measure the variation of
resistivity with depth. In addition, data collection is continuous in time so the resistivity is
finely sampled along any given towpath. Nominal dipole cable lengths of 1, 2.5 and 5m,
and nominal tow-link cable lengths of 0.25, 0.5, 1.0 2.0 and 4.0m were used in this
evaluation.

5
2.4 Evaluation
Hymer et al. (2000) used a power relationship between volumetric soil moisture
content (θ) and resistance (R) of the form
baR=θ , (1)
where a and b are fitted parameters. A relationship of this form is compatible with Archie’s
Law (Archie, 1942), where a is the inverse of soil salinity and b is a soil texture parameter.
Similar non-linear relationships have been used by Seyfried (1993) and Amer et al. (1994).
In this paper, we take the OhmMapper apparent resistivity measurement to be
equivalent to the resistance value in (1). We then solve for the parameters a and b by fitting
(1) to OhmMapper measurements of apparent resistivity and TDR/Theta Probe
measurements of soil moisture at each 25m interval along the 250m transect. Although the
variation of resistivity with depth in the soil profile could be evaluated from an inversion of
the multiple OhmMapper measurements with different dipole cable and tow-link cable
lengths using a commercially available inversion software package, we have concentrated
our efforts on evaluating the single pass resistivity data. Our reasons for this are: (i) the
TDR measurements used for evaluation give a depth integrated measurement of soil
moisture content; and (ii ) the single pass data must be shown to have information about soil
moisture before attempting the measurement of soil moisture variation with depth.

6
3. RESULTS AND DISCUSSION
The results from fitting the function given in (1) with the measured soil moisture
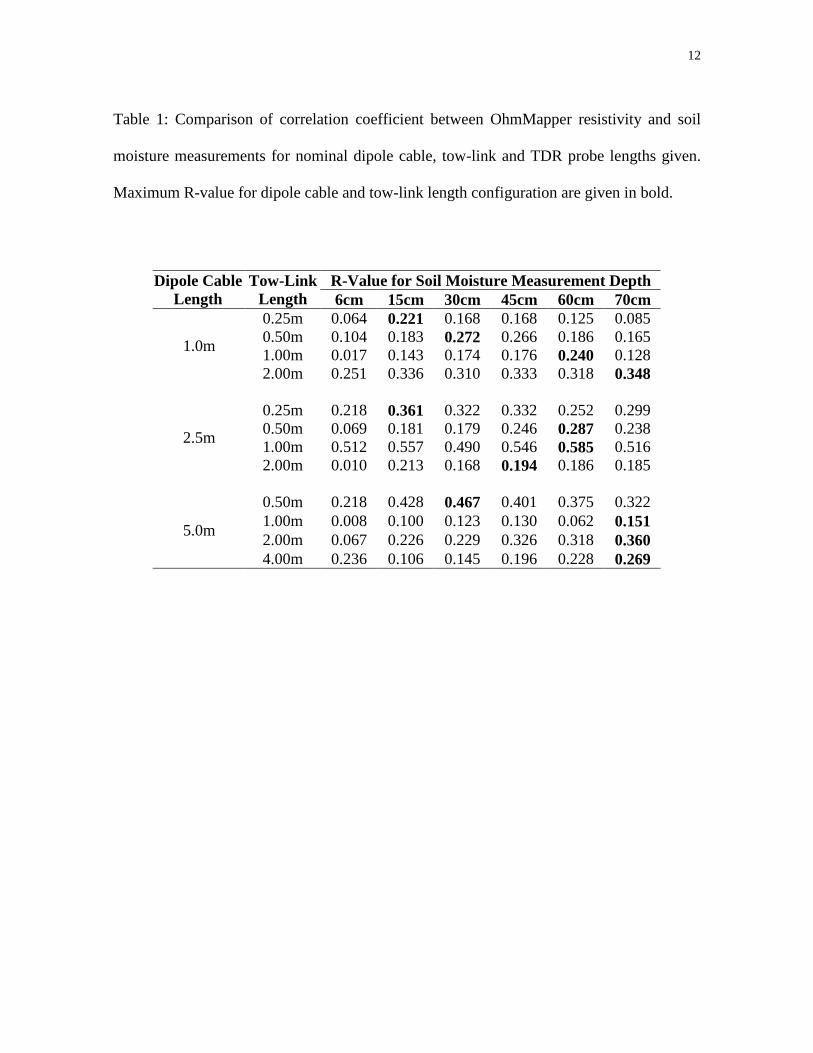
content and resistivity data are summarized in Table 1 for the correlation coeff icient. These
results show a typically low correlation coeff icient, having a value of less than 0.6, for all
dipole cable, tow-link and soil moisture depth measurement combinations. However,
generally speaking, for a given dipole cable length the soil moisture depth yielding the
greatest correlation coeff icient increases with tow-link length. The correlation coefficients
cease to follow this trend only when soil moisture measurements are too shallow. This
trend was expected, as a greater separation between the midpoints of receiver and
transmitter dipoles is claimed to yield a deeper measurement (Geometrics Inc., 1999).
However, using the general rule that resistivity measurement depth is half of this
separation, it was expected that the greatest correlation coeff icient for the 1m dipole cable
length and 0.25m tow-link length would be with the 70cm soil moisture measurement
depth. Given that the correlation coeff icients are so low for the 1m dipole cable length, the
higher correlation coeff icient for the 15cm soil moisture measurement depth may be a
purely spurious correlation.
The scatterplots with fitted function are given in Figures 3 to 5 for each dipole cable
and tow-link length for the soil moisture measurement depth having the greatest correlation
coeff icient. However, it may be seen that there is still as much as 15% v/v variation in soil
moisture content for a given resistivity value, with most scatterplots bearing no
resemblance to the fitted function, or any other relationship, being simply a cloud of points.
The nominal 2.5m dipole cable length with 1m tow-link cable length is the only
OhmMapper configuration that yielded a scatterplot that bore a significant resemblance to

7
the fitted function, as indicated by its higher correlation coeff icient. In fact, this
configuration yielded a consistently higher correlation coeff icient for all soil moisture
measurement depths when compared with the other configurations. It is suggested that the
lower correlation coeff icients for shorter dipole cables and tow-link lengths are a result of
the noisy resistivity measurement yielded by the OhmMapper when the dipole cables were
short and/or the dipole cable separation was small relative to the dipole cable length. The
lower correlation coeff icients for longer dipole cable and/or tow-link lengths are likely a
result of the OhmMapper resistivity measurement being for a depth much greater than the
deepest TDR measurement of soil moisture. The higher correlation coeff icients for all soil
moisture measurement depths with the OhmMapper resistivity measurements for 2.5m
dipole cables and 1m tow-link cable length are likely a result of high correlation in soil
moisture content for the top 70cm of soil .
The soil moisture variation along the 250m transect is plotted in Figure 6 for the
60cm TDR measurements, where it is compared with the OhmMapper measurements for
2.5m dipole cables and 1m tow-link lengths using the fitted function from Figure 4c. Most
notable in this figure is that TDR point measurements of soil moisture content have a
variation of approximately 7% v/v from dry to wet, while the OhmMapper measurements
have only approximately 3% v/v variation from dry to wet. However, the day on which
TDR measurements indicate the wettest soil moisture coincides with the day on which
OhmMapper measurements indicate the wettest soil moisture. Likewise, the TDR and
OhmMapper measurements both indicate the driest soil moisture on the same day.
Moreover, the OhmMapper measurements exhibit approximately the correct trend of soil
moisture content along the transect.

8
It is well known that the near-surface soil moisture content responds rapidly to both
infilt ration and exfilt ration events while the soil moisture content for a deep layer of soil
has a much slower response time. Moreover, changes in the near-surface soil moisture
content have only a minimal impact on the average soil moisture content of a thick soil
layer (ie. 3m). Hence, an explanation for the OhmMapper having the correct response to
soil moisture content but the wrong magnitude may be that the OhmMapper is actually
measuring the resistivity, and hence soil moisture, of a much deeper layer than the TDR,
being approximately 3m as compared to 60cm. Furthermore, OhmMapper measurements of
resistivity are an average measurement made over not only some depth (eg 3m), but over
the entire length of the instrument (ie. 11m for 2.5m dipole cables and 1m tow-link),
meaning that interpretation of comparisons with individual point measurement is diff icult.
4. CONCLUSIONS
This study has shown that there is a correlation coeff icient of approximately 0.6
between TDR measurements of soil moisture content and the OhmMapper with 2.5m
dipole cables and a 1m tow-link. All other OhmMapper configurations resulted in smaller
correlation coefficients for the soil moisture depths measured. Results have indicated that
this configuration is optimal for the purpose of measuring soil moisture in the top few
meters, with the correlation coeff icient likely to be greater if TDR measurements of soil
moisture content could be made for a greater depth. Moreover, unless the noise in
OhmMapper measurements of resistivity can be reduced for shorter dipole cables and/or
shorter dipole cable separations, it is unlikely that the OhmMapper will be applicable for
measuring the soil moisture content of shallower soil depths or be used to measure the
variation of soil moisture content with depth in the soil profile.

9
REFERENCES
Amer, S.A., T.O. Keefer, M.A. Weltz, D.C. Goodrich, and L.B. Bach, 1994. Soil moisture
sensors for continuous monitoring. Water Resources Bulletin, 30:69-83.
Archie, G.E., 1942. The electrical resistivity log as an aid in determining some reservoir
characteristics. Transactions of the American Institute of Mineral Engineering,
146:54-62.
Delta-T Devices Ltd., 1996. Theta Probe Soil Moisture Sensor Type ML1 User Manual.
Delta-T Devices, Inc., Cambridge, England, 18pp.
Engman, E.T., 1991. Application of microwave remote sensing of soil moisture for water
resources and agriculture. Remote Sensing of the Environment, 35:213-226.
Geometrics Inc., 1999. OhmMapper TR1 Operation Manual. Geometrics Inc., San Jose,
USA, 113pp.
Giacomelli , A., U. Bacchiega, P.A. Troch, and M. Mancini, 1995. Evaluation of surface
soil moisture distribution by means of SAR remote sensing techniques and
conceptual hydrological modelli ng. Journal of Hydrology, 166:445-459.
Gish, T.J., W.P. Dulaney, C.S.T. Daughtry, and K.-J.S. Kung, 2001. Influence of
preferential flow on surface runoff f luxes. ASAE Preferential Flow Symposium.

10
Houser, P.R., W.J. Shuttleworth, J.S. Famiglietti, H.V. Gupta, K.H. Syed, and D.C.
Goodrich, 1998. Integration of soil moisture remote sensing and hydrologic
modeling using data assimilation. Water Resources Research, 34: 3405-3420.
Hymer, D.C., M.S. Moran, and T.O. Keefer, 2000. Soil water evaluation using a hydrologic
model and calibrated sensor network. Soil Science Society of America Journal,
64:319-326.
Loke, M.H., 1999. Electrical imaging surveys for environmental and engineering studies: A
practical guide to 2D and 3D surveys. Geometrics Inc., San Jose, USA, 57pp.
Schmugge, T., 1985. Chapter 5: Remote Sensing of Soil Moisture, In: M.G. Anderson, and
T.P. Burt, (Eds.), Hydrological Forecasting, John Wiley and Sons, New York,
101-124.
Seyfried, M.S., 1993. Field calibration and monitoring of soil -water content with fiberglass
electrical resistance sensors. Soil Science Society of America Journal, 57:1432-
1436.
Soil Moisture Equipment Corp., 1989. Trase System 1 Operating Instructions. Soil
Moisture Equipment Corp., Santa Barbara, USA, 54pp.
Walker, J.P., G.R. Willgoose, and J.D. Kalma, 2000. Three-dimensional soil moisture
profile retrieval by assimilation of near-surface measurements: Simpli fied Kalman
filter covariance forecasting and field application. Water Resources Research, In
Preparation.

11
Wood, E.F., D.S. Lin, M. Mancini, D.J. Thongs, P.A. Troch, T.J. Jackson, J.S. Famiglietti,
and E.T. Engman, 1993. Intercomparisons between passive and active microwave
remote sensing and hydrological modeling for soil moisture. Advances in Space
Research, 13:167-176.
12
Table 1: Comparison of correlation coeff icient between OhmMapper resistivity and soil
moisture measurements for nominal dipole cable, tow-link and TDR probe lengths given.
Maximum R-value for dipole cable and tow-link length configuration are given in bold.
R-Value for Soil Moisture Measurement DepthDipole CableLength
Tow-LinkLength 6cm 15cm 30cm 45cm 60cm 70cm0.25m 0.064 0.221 0.168 0.168 0.125 0.0850.50m 0.104 0.183 0.272 0.266 0.186 0.1651.00m 0.017 0.143 0.174 0.176 0.240 0.128
1.0m
2.00m 0.251 0.336 0.310 0.333 0.318 0.348
0.25m 0.218 0.361 0.322 0.332 0.252 0.2990.50m 0.069 0.181 0.179 0.246 0.287 0.2381.00m 0.512 0.557 0.490 0.546 0.585 0.516
2.5m
2.00m 0.010 0.213 0.168 0.194 0.186 0.185
0.50m 0.218 0.428 0.467 0.401 0.375 0.3221.00m 0.008 0.100 0.123 0.130 0.062 0.1512.00m 0.067 0.226 0.229 0.326 0.318 0.360
5.0m
4.00m 0.236 0.106 0.145 0.196 0.228 0.269

13
a)
� �� �
� �� �� �� �
� � � � � � � � � � � �
� � � � � � � � � � � � � � � � � � � �
�� �� �� ��� �� �� !�� "� #��
$% &' &(
) * + , - . / , 0 1 2 - + 3 , 2 4 5 . 2 6 7 . 2 8 3 9 , + : ; 1 < 1 =b)
� �� �
� �� �� �� �
� � � � � � � � � � � �
� � � � � � � � � � � � � � � � � �
�>?� �� !
�� "� #��$% &' &(
) * + , - . / , 0 1 2 - + 3 , 2 4 5 . 2 6 7 . 2 8 3 9 , + : ; 1 < 1 =
Figure 1: Calibration of a) Theta Probe and b) 15cm TDR against thermogravimetric soil
moisture measurements.

14
Figure 2: Schematic of the OhmMapper instrument.
Dipole Cable Dipole Cable Dipole Cable Dipole Cable
Receiver TransmitterNon-conductivetow-link cable
Fiber opticisolator cable
Dipole Length
Resistivity Measurement

15
a)
� �� �
� �� �� �� �
� � � � @ � � A � � B � � � � � �� � � � � � C D � E F � � � � C � � C G � � � � � � � �
� �� !�� "� #��
$% &' &(
H I I 0 , + J 3 K + 8 2 8 3 2 1 2 3 L : . * - M - =b)
� �� �
� �� �� �� �
� � � � @ � � A � � B � � � � � �� � � � � � C D � E F � � � � � � G � � � � � � � �
� �� !�� "� #��
$% &' &(
H I I 0 , + J 3 K + 8 2 8 3 2 1 2 3 L : . * - M - =
c)
� �� �
� �� �� �� �
� � � � @ � � A � � B � � � � � �� � � � � � D � E F � � � � � � � � G � � � � C � � �
� �� !�� "� #��
$% &' &(
H I I 0 , + J 3 K + 8 2 8 3 2 1 2 3 L : . * - M - =d)
� �� �
� �� �� �� �
� � � � @ � � A � � B � � � � � �� � � � C D � E F � � � � � � � � G � � � � C � �
� �� !�� "� #��
$% &' &(
H I I 0 , + J 3 K + 8 2 8 3 2 1 2 3 L : . * - M - =
Figure 3: Fitted function and scatter plot of apparent resistivity against the soil moisture
measurement giving the greatest correlation for the OhmMapper configuration of dipole
cable tow-link cable lengths. Nominal 1m dipole cable length with: a) nominal 0.25m tow-
link length against 15cm TDR measurements; b) nominal 0.5m tow-link length against
30cm TDR measurements; c) nominal 1m tow-link length against 60cm TDR
measurements; and d) nominal 2m tow-link length against 70cm TDR measurements.

16
a)
� �� �
� �� �� �� �
� � � � � � � � � � @ � � � � � A � � N � � B � �� � � � � � D � E F � � � � � � C � G � � � � � � � �
� �� !�� "� #��
$% &' &(
H I I 0 , + J 3 K + 8 2 8 3 2 1 2 3 L : . * - M - =b)
� �� �
� �� �� �� �
� � � � � � � � � � @ � � � � � A � � N � � B � �� � � � C � D � E F � � � � � � � G � � � � � � C �
� �� !�� "� #��
$% &' &(
H I I 0 , + J 3 K + 8 2 8 3 2 1 2 3 L : . * - M - =
c)
� �� �
� �� �� �� �
� � � � � � � � � � @ � � � � � A � � N � � B � �� � � � � � D � E F � � � � � � C G � � � � � C � C
� �� !�� "� #��
$% &' &(
H I I 0 , + J 3 K + 8 2 8 3 2 1 2 3 L : . * - M - =d)
� �� �
� �� �� �� �
� � � � � � � � � � @ � � � � � A � � N � � B � �� � � � � C � D � E F � � � � � � G � � � � �
� �� !�� "� #��
$% &' &(
H I I 0 , + J 3 K + 8 2 8 3 2 1 2 3 L : . * - M - =
Figure 4: Fitted function and scatter plot of apparent resistivity against the soil moisture
measurement giving the greatest correlation for the OhmMapper configuration of dipole
cable tow-link cable lengths. Nominal 2.5m dipole cable length with: a) nominal 0.25m
tow-link length against 15cm TDR measurements; b) nominal 0.5m tow-link length against
60cm TDR measurements; c) nominal 1m tow-link length against 60cm TDR
measurements; and d) nominal 2m tow-link length against 45cm TDR measurements.

17
a)
� �� �
� �� �� �� �
� � � � � � � � � � @ � � � � � A � �� � C � � � � D � E F � � � C � � G � � � C � � � �
� �� !�� "� #��
$% &' &(
H I I 0 , + J 3 K + 8 2 8 3 2 1 2 3 L : . * - M - =b)
� �� �
� �� �� �� �
� � � � � � � � � � @ � � � � � A � �� � � � � � C D � E F � � � � C � � � G � � � � � � �
� �� !�� "� #��
$% &' &(
H I I 0 , + J 3 K + 8 2 8 3 2 1 2 3 L : . * - M - =
c)
� �� �
� �� �� �� �
� � � � � � � � � � @ � � � � � A � �� � C � � � D � E F � � � � � � � G � � � � � � � �
� �� !�� "� #��
$% &' &(
H I I 0 , + J 3 K + 8 2 8 3 2 1 2 3 L : . * - M - =d)
� �� �
� �� �� �� �
� � � � � � � � � � @ � � � � � A � �� � � � � � � D � E F � � � � � C � C G � � � � � C �
� �� !�� "� #��
$% &' &(
H I I 0 , + J 3 K + 8 2 8 3 2 1 2 3 L : . * - M - =
Figure 5: Fitted function and scatter plot of apparent resistivity against the soil moisture
measurement giving the greatest correlation for the OhmMapper configuration of dipole
cable tow-link cable lengths. Nominal 5m dipole cable length with: a) nominal 0.5m tow-
link length against 30cm TDR measurements; b) nominal 1m tow-link length against 70cm
TDR measurements; c) nominal 2m tow-link length against 70cm TDR measurements; and
d) nominal 4m tow-link length against 70cm TDR measurements.

18
O P
Q R
Q P
S R
R P R O R R O P R Q R R Q P R
T UVWX UV YZ [\
]^_`a `b
c d e f g h i j k l m
Figure 6: Comparison of 60cm TDR soil moisture measurements (symbols) with the
OhmMapper soil moisture estimate (continuous line and symbol); solid circle 7 June, solid
triangle 9 June, solid square 12 June, open circle 15 June, open triangle 19 June and open
square 23 June.
Top Related