


Languages
Pages
Legal

lable at ScienceDirect
Quaternary Geochronology 36 (2016) 28e37
Contents lists avai
Quaternary Geochronology
journal homepage: www.elsevier .com/locate/quageo
Evaluating isothermal thermoluminescence and thermally transferredoptically stimulated luminescence for dating of Pleistocene sedimentsin Amazonia
Fabiano do Nascimento Pupim*, Andr�e Oliveira Sawakuchi, Thays Desire Mineli,Luciana NogueiraInstitute of Geosciences, University of S~ao Paulo, Rua do Lago, 562 e S~ao Paulo, SP, 05508-080, Brazil
a r t i c l e i n f o
Article history:Received 8 January 2016Received in revised form1 August 2016Accepted 8 August 2016Available online 9 August 2016
Keywords:Luminescence datingTT-OSLITLAmazonia paleogeography
* Corresponding author.E-mail address: [email protected] (F.N. Pupim
http://dx.doi.org/10.1016/j.quageo.2016.08.0031871-1014/© 2016 Elsevier B.V. All rights reserved.
a b s t r a c t
The paleogeography of Amazonia lowlands during the Pleistocene remains hampered by the lack ofreliable absolute ages to constrain sediment deposition in the hundred thousand to few million yearstimescales. Optically stimulated luminescence (OSL) dating applied to quartz has provided importantchronological control for late Quaternary sediments, but the method is limited to the last ~150 ka. Inorder to extend the age range of luminescence dating, new signals from quartz have been investigated.This study tested the application of isothermal thermoluminescence (ITL) and thermally transferredoptically stimulated luminescence (TT-OSL) signals of quartz for dating of fluvial terraces from easternAmazonia. ITL and TT-OSL signals measured in a modern fluvial sediment sample have shown smallresidual doses (4 and 16 Gy), suggesting adequate bleached sediments for the target dose range(>150 Gy). This sample responded well to dose recovery test, which showed that the ITL and TT-OSLsignals grow to higher doses compared to the doses estimated by the conventional OSL signal. The ITLsignal saturated for doses significantly lower than doses reported in the literature. Most dating sampleswere beyond the ITL saturation doses and only TT-OSL signals were suitable to estimate equivalent doses.Burial ages ranging from 107 to 340 ka were estimated for the fluvial terraces in the lower Xingu River.The main ages uncertainties are related to dose rate changes through time. Despite the uncertainties,these ages should indicate a higher channel base level during the Middle Pleistocene followed by channelincision, possibly due to episodes of increased precipitation in the Xingu watershed.
© 2016 Elsevier B.V. All rights reserved.
1. Introduction
The modern Amazonia landscape and biodiversity arestrongly related with the evolution of the Amazonian fluvialsystem during the Neogene and Quaternary (Hoorn andWesselingh, 2010; Ribas et al., 2011). However, our understand-ing on the paleogeography of Amazonian rivers is restricted tothe last few hundred thousand years (Soares et al., 2010; Rossettiet al., 2015) due to the lack of reliable burial ages to constrainchanges in fluvial sedimentation during the Middle to EarlyPleistocene. Optically stimulated luminescence (OSL) datingbased on the fast OSL component of quartz (Murray and Wintle,2000) has provided important chronological control for late
).
Quaternary sedimentation, but the method is usually limited tothe last 100e200 ka due to OSL signal saturation (Wintle andMurray, 2006). The luminescence dating of potassium feldspar,using post-infrared-infrared (pIRIR) signals, has been shown tobe suitable to estimate equivalent doses up to 1 kGy. However, itsintrinsic higher dose rate limits the age range to around 500 ka(Buylaert et al., 2012). In order to extend the age range ofluminescence dating, new signals from quartz have been inves-tigated. Isothermal thermoluminescence (ITL) (Jain et al., 2007)and thermally transferred optically stimulated luminescence (TT-OSL) (Wang et al., 2006) are the most promising signals to extendthe age limit of luminescence dating of quartz.
The origin of the ITL signal has been linked to the 325 and 375 �CTL peaks of quartz (Aitken, 1985; Jain et al., 2007). It is a thermallystable signal, relatively easy to optically reset when exposed to lightand its saturation occurs for higher doses than for the OSL signal.The TT-OSL signal is composed of a signal dependent on the
F.N. Pupim et al. / Quaternary Geochronology 36 (2016) 28e37 29
radiation dose (recuperated OSL e Re-OSL) and a thermally trans-ferred signal independent of the accumulated dose (basic transfer -BT-OSL) (Wang et al., 2006). The source of charge for the TT-OSLsignal is still not well characterized, but two mechanisms havebeen suggested: a double transfer (Wang et al., 2006) and a singletransfer (Adamiec et al., 2008). Adamiec et al. (2010) described thatin the double transfer mechanism, the electrons from the trapresponsible for the fast OSL signal are released and stored in arefuge trap before being thermally transferred back into the fastOSL trap for subsequent measurement as TT-OSL; and in the singletransfer mechanism, the electrons are thermally transferred from asource trap into the fast OSL trap and thenmeasured as TT-OSL. Thesingle aliquot regenerative dose (SAR) protocol using ITL and TT-OSL signals of quartz has been tested through laboratory experi-ments (e.g. Jain et al., 2005; Huot et al., 2006; Stevens et al., 2009;Adamiec et al., 2010). So far, few studies have tested the dating ofsediments using ITL (e.g. Choi et al., 2006; Barham et al., 2011) orTT-OSL (e.g. Jacobs et al., 2011; Thiel et al., 2012; Demuro et al.,2015) signals. The results show that both signals have potential todating sediments older than 1 Ma (Wang et al., 2006; Jain et al.,2007).
Besides the specific geomorphological questions related todating of Amazonian sediments, the characterization of ITL and TT-OSL signals of quartz from different geological contexts is necessaryto test and develop protocols to extend the age range of lumines-cence dating. Brazilian sediments are commonly heavily weatheredand enriched in quartz with high luminescence sensitivity (Guedeset al., 2013) and buried in relatively low dose rates environments(~0.5e1.0 Gy/ka). The first aim of this study was to test the appli-cation of dating protocols based on ITL and TT-OSL signals to extendthe age limit for dating of fluvial sediments from eastern Amazonia.Moreover, this is a critical issue to understand changes in theAmazonian fluvial system during the Quaternary and its role asbiogeographical barriers for terrestrial fauna or pathways formigration of aquatic or flooded-forest species.
2. Material and methods
2.1. Study site and samples
This study focused on fluvial sediments outcropping in terracesof the lower Xingu River, eastern Amazonia. The Xingu River is aclear water river (low concentration of suspended sediments; Sioli,1985) representing the easternmost tributary of the southernmargin of the Amazon River, Brazil (Fig. 1). The lower Xingu Riverhas a modern fluvial channel with approximately 10 km wide and15e25 m deep. Through recent time, the river has incised by about3e10 m into its older floodplain, leaving its former fluvial sedi-ments exposed in terraces. Terrace sediments are mainly composedof gravel, coarse to fine sand and mud, suggesting fining upwardsequences formed by change frombottom channel (sandy gravel) tosand bar and floodplain muds, prior to renewed downcutting.Muddy portions would be related to overbank deposits, despite thepossibility of authigenic minerals formation and clay or fine siltinfiltration during long-time tropical weathering. Eight sampleswere taken from two sediment profiles in the left margin of thelower Xingu River (Fig. 1). The samples for luminescence mea-surements were collected in aluminum tubes in order to avoidsunlight exposure. Sediments within a radius of 30 cm from theluminescence sampling point were collected separately to estimateradiation dose rates. Additionally, a sample of shallow buried sands(XNG-47-2) from a fluvial bar was used as a modern analogue toevaluate residual ITL and TT-OSL signals.
2.2. Sample preparation
The preparation of quartz concentrates were conducted undersubdued red light conditions. Samples were wet-sieved to isolatethe fraction 180e250 mm. Afterward, the target fractionwas treatedwith hydrogen peroxide (H2O2 27%) and hydrochloric acid (HCl3.7%) to remove organic material and carbonates, respectively.Lithium metatungstate solution was used to remove heavy min-erals (>2.75 g/cm3) and feldspar grains (<2.62 g/cm3). Then, quartzconcentrates (2.62e2.75 g/cm3) were etched with hydrofluoric acid(HF 40%) for 40 min to further purify the quartz and also etch a~10 mm outer layer of quartz grains, thus removing the alpha par-ticles contribution from the dose rate.
2.3. Dose rate calculation
Radionuclides concentrations for dose rate calculations weredetermined by gamma ray spectrometry using a high-puritygermanium (HPGe) detector with a 55% of relative efficiency,2.1 keV of energy resolution at 1332 keV and encased in an ultralowbackground shield (Canberra Industries). The samples for gammaray spectrometry were weighed and dried to estimate the watercontent. Each sample was packed in sealed plastic containers andstored for at least 28 days to allow radon to reach equilibriumwithits parent radionuclides, prior to gamma spectrometry measure-ment. Beta and gamma radiation dose rates were determined usingradionuclides concentrations (U, Th and K) and conversion factorsoutlined by Gu�erin et al. (2011). The cosmic dose rate contributionwas calculated following Prescott and Hutton (1994). Water satu-ration was determined by the ratio between water weight and drysample weight. Considering that the samples are under the influ-ence of changes inwater table, the effect of water content over doserate was investigated through dose rate calculation using a mini-mum and maximum water content assuming constant concentra-tions of radionuclides. The water content measured in the collectedsamples was considered as minimumwater content estimate sincethe samples were collected during the dry season. For estimation ofmaximum water content, each pre-dried sample was water satu-rated in the laboratory, until we observed that all pore spaces wereoccupied by water. The samples were weighed both before andafter water saturation, the difference was assumed to themaximum water content for each the sample.
2.4. Luminescence measurements
Aliquots of quartz grains (100e200 grains) were mounted onstainless steel cups. All luminescence measurements were carriedout on an automated Risø TL/OSL DA-20 reader system, equippedwith a 90Sr/90Y beta source delivering a dose rate of 0.11 ± 0.03 Gy/sand blue LEDs (470 ± 20 nm) operated at 90% power (~40 mW/cm)for stimulation. The near UV emissions were measured with abialkali PM tube (Thorn EMI 9635QB) coupled with Hoya U-340detection filters (290e340 nm). The calibration quartz distributedby Risø National Laboratory (Hansen et al., 2015) was used for thecalibration of the beta source using stainless steel cups at the samemeasurements conditions used in this study. Heating rate of 5 �C/swas used in all heat treatments and luminescence measurements.
The ITL and TT-OSL signals of quartz are relatively hard to bleachcompared to the OSL signal (Jain et al., 2007; Duller and Wintle,2012). Studied sediments from the modern fluvial bar and ter-races are characterized by bright quartz grains with rapidlydecaying OSL signal (first 0.8s of light emission). Thus, the sample(XNG-47-2) collected from the modern sediment bar at the XinguRiver was used to evaluate both its luminescence (OSL, ITL and TT-OSL) bleaching characteristics and its dosimetric performance with
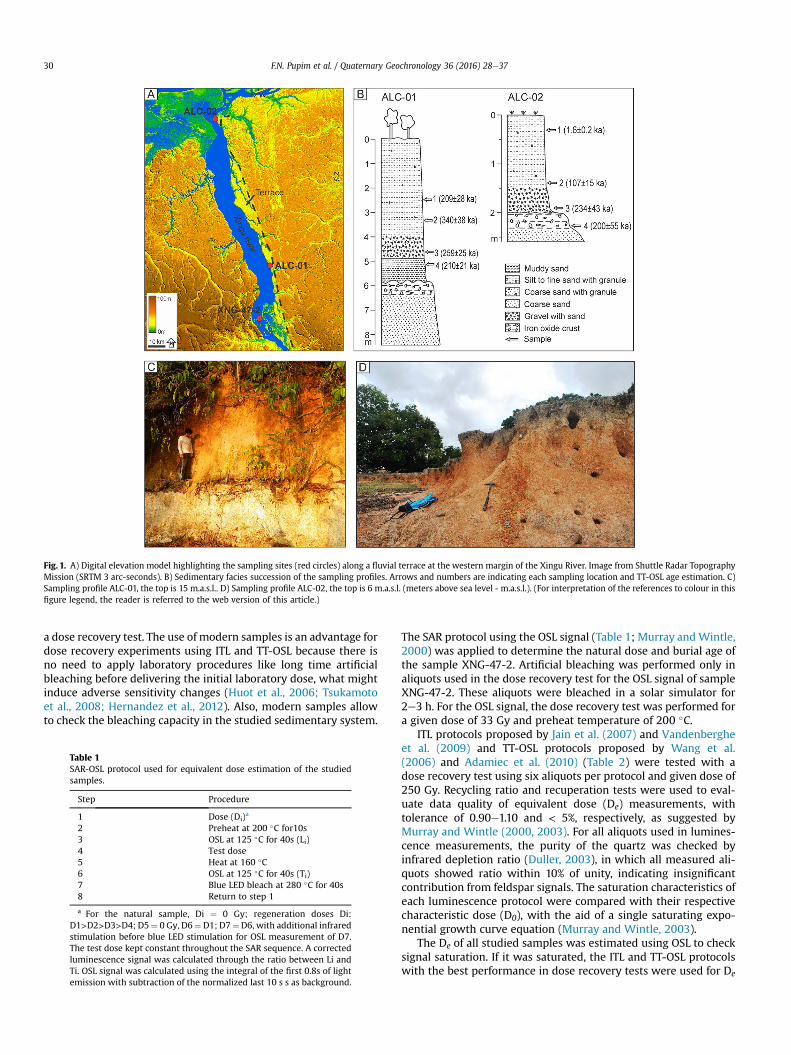
Fig. 1. A) Digital elevation model highlighting the sampling sites (red circles) along a fluvial terrace at the western margin of the Xingu River. Image from Shuttle Radar TopographyMission (SRTM 3 arc-seconds). B) Sedimentary facies succession of the sampling profiles. Arrows and numbers are indicating each sampling location and TT-OSL age estimation. C)Sampling profile ALC-01, the top is 15 m.a.s.l.. D) Sampling profile ALC-02, the top is 6 m.a.s.l. (meters above sea level - m.a.s.l.). (For interpretation of the references to colour in thisfigure legend, the reader is referred to the web version of this article.)
F.N. Pupim et al. / Quaternary Geochronology 36 (2016) 28e3730
a dose recovery test. The use of modern samples is an advantage fordose recovery experiments using ITL and TT-OSL because there isno need to apply laboratory procedures like long time artificialbleaching before delivering the initial laboratory dose, what mightinduce adverse sensitivity changes (Huot et al., 2006; Tsukamotoet al., 2008; Hernandez et al., 2012). Also, modern samples allowto check the bleaching capacity in the studied sedimentary system.
Table 1SAR-OSL protocol used for equivalent dose estimation of the studiedsamples.
Step Procedure
1 Dose (Di)a
2 Preheat at 200 �C for10s3 OSL at 125 �C for 40s (Li)4 Test dose5 Heat at 160 �C6 OSL at 125 �C for 40s (Ti)7 Blue LED bleach at 280 �C for 40s8 Return to step 1
a For the natural sample, Di ¼ 0 Gy; regeneration doses Di:D1>D2>D3>D4; D5¼ 0 Gy, D6¼ D1; D7¼D6, with additional infraredstimulation before blue LED stimulation for OSL measurement of D7.The test dose kept constant throughout the SAR sequence. A correctedluminescence signal was calculated through the ratio between Li andTi. OSL signal was calculated using the integral of the first 0.8s of lightemission with subtraction of the normalized last 10 s s as background.
The SAR protocol using the OSL signal (Table 1; Murray andWintle,2000) was applied to determine the natural dose and burial age ofthe sample XNG-47-2. Artificial bleaching was performed only inaliquots used in the dose recovery test for the OSL signal of sampleXNG-47-2. These aliquots were bleached in a solar simulator for2e3 h. For the OSL signal, the dose recovery test was performed fora given dose of 33 Gy and preheat temperature of 200 �C.
ITL protocols proposed by Jain et al. (2007) and Vandenbergheet al. (2009) and TT-OSL protocols proposed by Wang et al.(2006) and Adamiec et al. (2010) (Table 2) were tested with adose recovery test using six aliquots per protocol and given dose of250 Gy. Recycling ratio and recuperation tests were used to eval-uate data quality of equivalent dose (De) measurements, withtolerance of 0.90e1.10 and < 5%, respectively, as suggested byMurray and Wintle (2000, 2003). For all aliquots used in lumines-cence measurements, the purity of the quartz was checked byinfrared depletion ratio (Duller, 2003), in which all measured ali-quots showed ratio within 10% of unity, indicating insignificantcontribution from feldspar signals. The saturation characteristics ofeach luminescence protocol were compared with their respectivecharacteristic dose (D0), with the aid of a single saturating expo-nential growth curve equation (Murray and Wintle, 2003).
The De of all studied samples was estimated using OSL to checksignal saturation. If it was saturated, the ITL and TT-OSL protocolswith the best performance in dose recovery tests were used for De
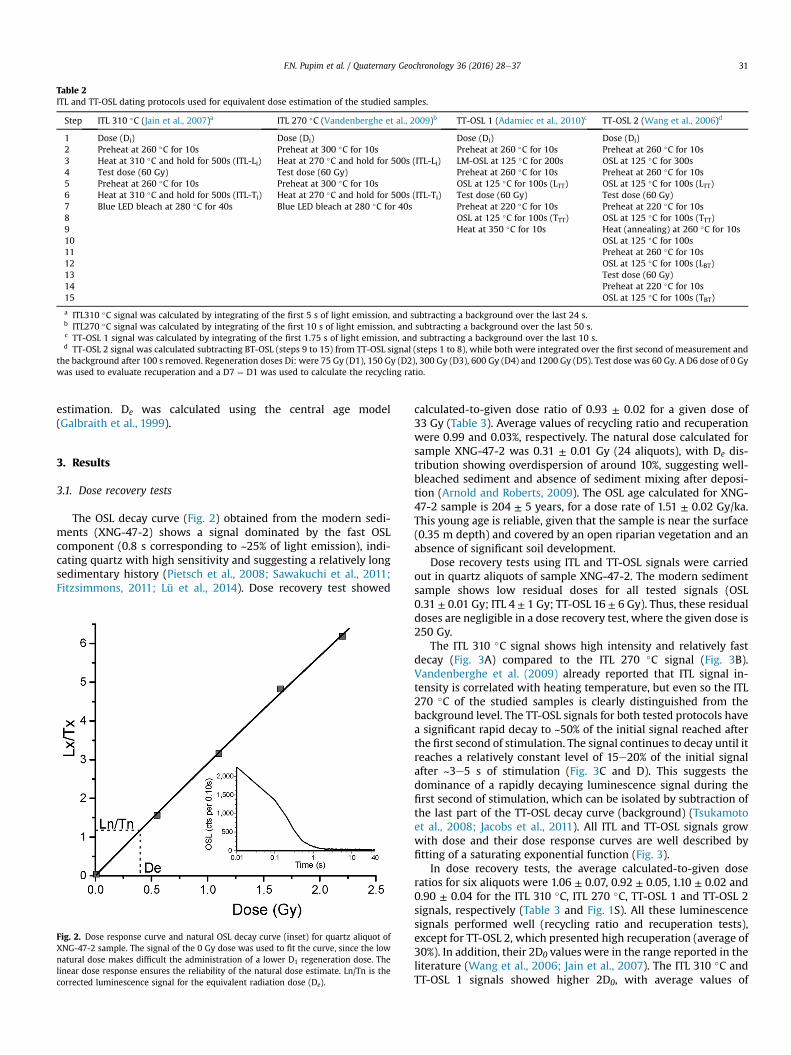
Table 2ITL and TT-OSL dating protocols used for equivalent dose estimation of the studied samples.
Step ITL 310 �C (Jain et al., 2007)a ITL 270 �C (Vandenberghe et al., 2009)b TT-OSL 1 (Adamiec et al., 2010)c TT-OSL 2 (Wang et al., 2006)d
1 Dose (Di) Dose (Di) Dose (Di) Dose (Di)2 Preheat at 260 �C for 10s Preheat at 300 �C for 10s Preheat at 260 �C for 10s Preheat at 260 �C for 10s3 Heat at 310 �C and hold for 500s (ITL-Li) Heat at 270 �C and hold for 500s (ITL-Li) LM-OSL at 125 �C for 200s OSL at 125 �C for 300s4 Test dose (60 Gy) Test dose (60 Gy) Preheat at 260 �C for 10s Preheat at 260 �C for 10s5 Preheat at 260 �C for 10s Preheat at 300 �C for 10s OSL at 125 �C for 100s (LTT) OSL at 125 �C for 100s (LTT)6 Heat at 310 �C and hold for 500s (ITL-Ti) Heat at 270 �C and hold for 500s (ITL-Ti) Test dose (60 Gy) Test dose (60 Gy)7 Blue LED bleach at 280 �C for 40s Blue LED bleach at 280 �C for 40s Preheat at 220 �C for 10s Preheat at 220 �C for 10s8 OSL at 125 �C for 100s (TTT) OSL at 125 �C for 100s (TTT)9 Heat at 350 �C for 10s Heat (annealing) at 260 �C for 10s10 OSL at 125 �C for 100s11 Preheat at 260 �C for 10s12 OSL at 125 �C for 100s (LBT)13 Test dose (60 Gy)14 Preheat at 220 �C for 10s15 OSL at 125 �C for 100s (TBT)
a ITL310 �C signal was calculated by integrating of the first 5 s of light emission, and subtracting a background over the last 24 s.b ITL270 �C signal was calculated by integrating of the first 10 s of light emission, and subtracting a background over the last 50 s.c TT-OSL 1 signal was calculated by integrating of the first 1.75 s of light emission, and subtracting a background over the last 10 s.d TT-OSL 2 signal was calculated subtracting BT-OSL (steps 9 to 15) from TT-OSL signal (steps 1 to 8), while both were integrated over the first second of measurement and
the background after 100 s removed. Regeneration doses Di: were 75 Gy (D1), 150 Gy (D2), 300 Gy (D3), 600 Gy (D4) and 1200 Gy (D5). Test dose was 60 Gy. A D6 dose of 0 Gywas used to evaluate recuperation and a D7 ¼ D1 was used to calculate the recycling ratio.
F.N. Pupim et al. / Quaternary Geochronology 36 (2016) 28e37 31
estimation. De was calculated using the central age model(Galbraith et al., 1999).
3. Results
3.1. Dose recovery tests
The OSL decay curve (Fig. 2) obtained from the modern sedi-ments (XNG-47-2) shows a signal dominated by the fast OSLcomponent (0.8 s corresponding to ~25% of light emission), indi-cating quartz with high sensitivity and suggesting a relatively longsedimentary history (Pietsch et al., 2008; Sawakuchi et al., 2011;Fitzsimmons, 2011; Lü et al., 2014). Dose recovery test showed
Fig. 2. Dose response curve and natural OSL decay curve (inset) for quartz aliquot ofXNG-47-2 sample. The signal of the 0 Gy dose was used to fit the curve, since the lownatural dose makes difficult the administration of a lower D1 regeneration dose. Thelinear dose response ensures the reliability of the natural dose estimate. Ln/Tn is thecorrected luminescence signal for the equivalent radiation dose (De).
calculated-to-given dose ratio of 0.93 ± 0.02 for a given dose of33 Gy (Table 3). Average values of recycling ratio and recuperationwere 0.99 and 0.03%, respectively. The natural dose calculated forsample XNG-47-2 was 0.31 ± 0.01 Gy (24 aliquots), with De dis-tribution showing overdispersion of around 10%, suggesting well-bleached sediment and absence of sediment mixing after deposi-tion (Arnold and Roberts, 2009). The OSL age calculated for XNG-47-2 sample is 204 ± 5 years, for a dose rate of 1.51 ± 0.02 Gy/ka.This young age is reliable, given that the sample is near the surface(0.35 m depth) and covered by an open riparian vegetation and anabsence of significant soil development.
Dose recovery tests using ITL and TT-OSL signals were carriedout in quartz aliquots of sample XNG-47-2. The modern sedimentsample shows low residual doses for all tested signals (OSL0.31 ± 0.01 Gy; ITL 4 ± 1 Gy; TT-OSL 16 ± 6 Gy). Thus, these residualdoses are negligible in a dose recovery test, where the given dose is250 Gy.
The ITL 310 �C signal shows high intensity and relatively fastdecay (Fig. 3A) compared to the ITL 270 �C signal (Fig. 3B).Vandenberghe et al. (2009) already reported that ITL signal in-tensity is correlated with heating temperature, but even so the ITL270 �C of the studied samples is clearly distinguished from thebackground level. The TT-OSL signals for both tested protocols havea significant rapid decay to ~50% of the initial signal reached afterthe first second of stimulation. The signal continues to decay until itreaches a relatively constant level of 15e20% of the initial signalafter ~3e5 s of stimulation (Fig. 3C and D). This suggests thedominance of a rapidly decaying luminescence signal during thefirst second of stimulation, which can be isolated by subtraction ofthe last part of the TT-OSL decay curve (background) (Tsukamotoet al., 2008; Jacobs et al., 2011). All ITL and TT-OSL signals growwith dose and their dose response curves are well described byfitting of a saturating exponential function (Fig. 3).
In dose recovery tests, the average calculated-to-given doseratios for six aliquots were 1.06 ± 0.07, 0.92 ± 0.05, 1.10 ± 0.02 and0.90 ± 0.04 for the ITL 310 �C, ITL 270 �C, TT-OSL 1 and TT-OSL 2signals, respectively (Table 3 and Fig. 1S). All these luminescencesignals performed well (recycling ratio and recuperation tests),except for TT-OSL 2, which presented high recuperation (average of30%). In addition, their 2D0 values were in the range reported in theliterature (Wang et al., 2006; Jain et al., 2007). The ITL 310 �C andTT-OSL 1 signals showed higher 2D0, with average values of
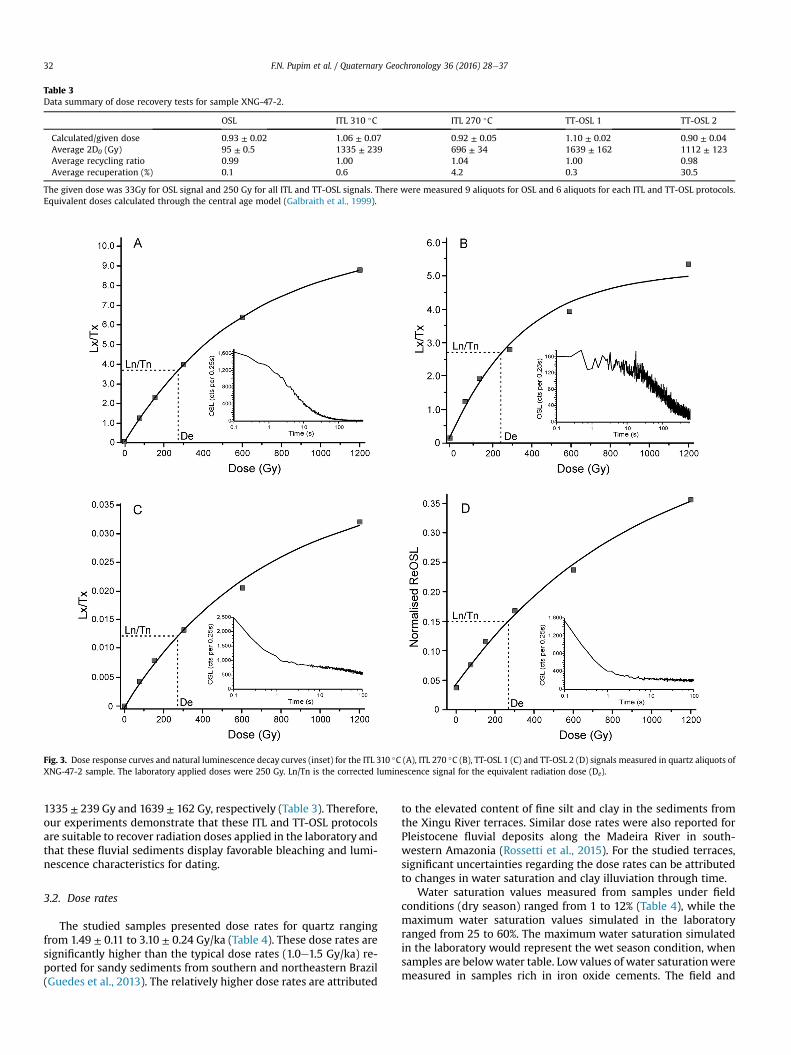
Table 3Data summary of dose recovery tests for sample XNG-47-2.
OSL ITL 310 �C ITL 270 �C TT-OSL 1 TT-OSL 2
Calculated/given dose 0.93 ± 0.02 1.06 ± 0.07 0.92 ± 0.05 1.10 ± 0.02 0.90 ± 0.04Average 2D0 (Gy) 95 ± 0.5 1335 ± 239 696 ± 34 1639 ± 162 1112 ± 123Average recycling ratio 0.99 1.00 1.04 1.00 0.98Average recuperation (%) 0.1 0.6 4.2 0.3 30.5
The given dose was 33Gy for OSL signal and 250 Gy for all ITL and TT-OSL signals. There were measured 9 aliquots for OSL and 6 aliquots for each ITL and TT-OSL protocols.Equivalent doses calculated through the central age model (Galbraith et al., 1999).
Fig. 3. Dose response curves and natural luminescence decay curves (inset) for the ITL 310 �C (A), ITL 270 �C (B), TT-OSL 1 (C) and TT-OSL 2 (D) signals measured in quartz aliquots ofXNG-47-2 sample. The laboratory applied doses were 250 Gy. Ln/Tn is the corrected luminescence signal for the equivalent radiation dose (De).
F.N. Pupim et al. / Quaternary Geochronology 36 (2016) 28e3732
1335 ± 239 Gy and 1639 ± 162 Gy, respectively (Table 3). Therefore,our experiments demonstrate that these ITL and TT-OSL protocolsare suitable to recover radiation doses applied in the laboratory andthat these fluvial sediments display favorable bleaching and lumi-nescence characteristics for dating.
3.2. Dose rates
The studied samples presented dose rates for quartz rangingfrom 1.49 ± 0.11 to 3.10 ± 0.24 Gy/ka (Table 4). These dose rates aresignificantly higher than the typical dose rates (1.0e1.5 Gy/ka) re-ported for sandy sediments from southern and northeastern Brazil(Guedes et al., 2013). The relatively higher dose rates are attributed
to the elevated content of fine silt and clay in the sediments fromthe Xingu River terraces. Similar dose rates were also reported forPleistocene fluvial deposits along the Madeira River in south-western Amazonia (Rossetti et al., 2015). For the studied terraces,significant uncertainties regarding the dose rates can be attributedto changes in water saturation and clay illuviation through time.
Water saturation values measured from samples under fieldconditions (dry season) ranged from 1 to 12% (Table 4), while themaximum water saturation values simulated in the laboratoryranged from 25 to 60%. The maximum water saturation simulatedin the laboratory would represent the wet season condition, whensamples are belowwater table. Low values of water saturationweremeasured in samples rich in iron oxide cements. The field and
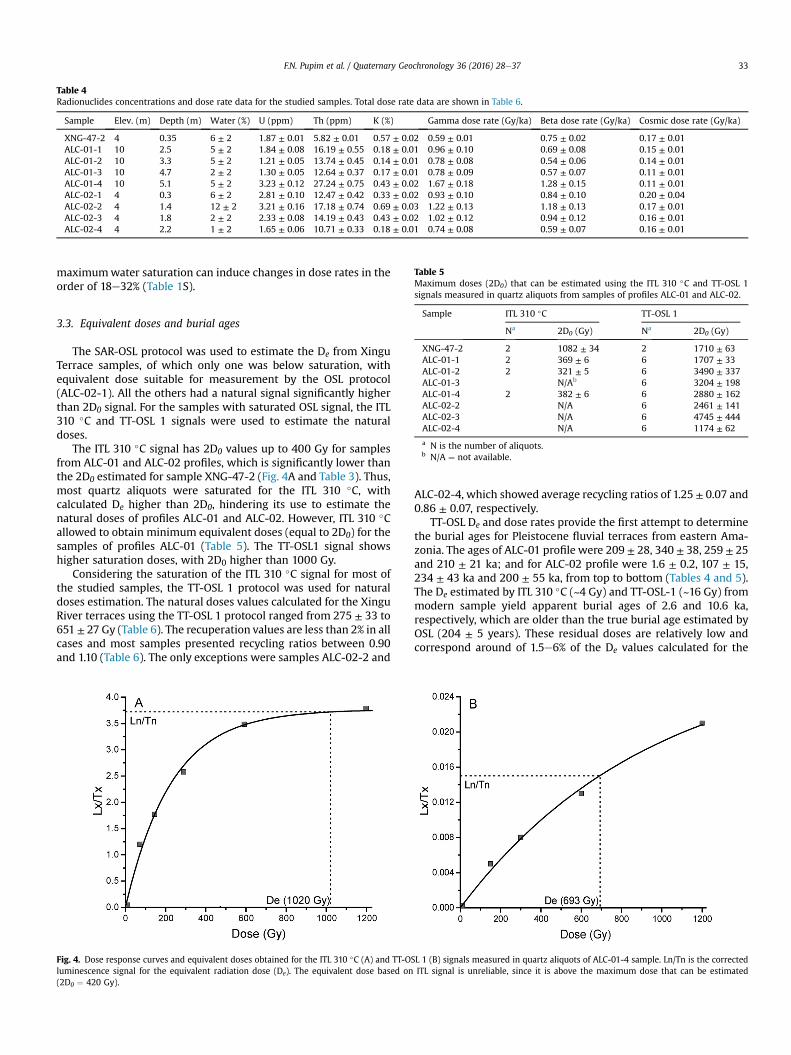
Table 4Radionuclides concentrations and dose rate data for the studied samples. Total dose rate data are shown in Table 6.
Sample Elev. (m) Depth (m) Water (%) U (ppm) Th (ppm) K (%) Gamma dose rate (Gy/ka) Beta dose rate (Gy/ka) Cosmic dose rate (Gy/ka)
XNG-47-2 4 0.35 6 ± 2 1.87 ± 0.01 5.82 ± 0.01 0.57 ± 0.02 0.59 ± 0.01 0.75 ± 0.02 0.17 ± 0.01ALC-01-1 10 2.5 5 ± 2 1.84 ± 0.08 16.19 ± 0.55 0.18 ± 0.01 0.96 ± 0.10 0.69 ± 0.08 0.15 ± 0.01ALC-01-2 10 3.3 5 ± 2 1.21 ± 0.05 13.74 ± 0.45 0.14 ± 0.01 0.78 ± 0.08 0.54 ± 0.06 0.14 ± 0.01ALC-01-3 10 4.7 2 ± 2 1.30 ± 0.05 12.64 ± 0.37 0.17 ± 0.01 0.78 ± 0.09 0.57 ± 0.07 0.11 ± 0.01ALC-01-4 10 5.1 5 ± 2 3.23 ± 0.12 27.24 ± 0.75 0.43 ± 0.02 1.67 ± 0.18 1.28 ± 0.15 0.11 ± 0.01ALC-02-1 4 0.3 6 ± 2 2.81 ± 0.10 12.47 ± 0.42 0.33 ± 0.02 0.93 ± 0.10 0.84 ± 0.10 0.20 ± 0.04ALC-02-2 4 1.4 12 ± 2 3.21 ± 0.16 17.18 ± 0.74 0.69 ± 0.03 1.22 ± 0.13 1.18 ± 0.13 0.17 ± 0.01ALC-02-3 4 1.8 2 ± 2 2.33 ± 0.08 14.19 ± 0.43 0.43 ± 0.02 1.02 ± 0.12 0.94 ± 0.12 0.16 ± 0.01ALC-02-4 4 2.2 1 ± 2 1.65 ± 0.06 10.71 ± 0.33 0.18 ± 0.01 0.74 ± 0.08 0.59 ± 0.07 0.16 ± 0.01
Table 5Maximum doses (2D0) that can be estimated using the ITL 310 �C and TT-OSL 1
F.N. Pupim et al. / Quaternary Geochronology 36 (2016) 28e37 33
maximumwater saturation can induce changes in dose rates in theorder of 18e32% (Table 1S).
signals measured in quartz aliquots from samples of profiles ALC-01 and ALC-02.
Sample ITL 310 �C TT-OSL 1
Na 2D0 (Gy) Na 2D0 (Gy)
XNG-47-2 2 1082 ± 34 2 1710 ± 63ALC-01-1 2 369 ± 6 6 1707 ± 33ALC-01-2 2 321 ± 5 6 3490 ± 337ALC-01-3 N/Ab 6 3204 ± 198ALC-01-4 2 382 ± 6 6 2880 ± 162ALC-02-2 N/A 6 2461 ± 141ALC-02-3 N/A 6 4745 ± 444ALC-02-4 N/A 6 1174 ± 62
a N is the number of aliquots.b N/A ¼ not available.
3.3. Equivalent doses and burial ages
The SAR-OSL protocol was used to estimate the De from XinguTerrace samples, of which only one was below saturation, withequivalent dose suitable for measurement by the OSL protocol(ALC-02-1). All the others had a natural signal significantly higherthan 2D0 signal. For the samples with saturated OSL signal, the ITL310 �C and TT-OSL 1 signals were used to estimate the naturaldoses.
The ITL 310 �C signal has 2D0 values up to 400 Gy for samplesfrom ALC-01 and ALC-02 profiles, which is significantly lower thanthe 2D0 estimated for sample XNG-47-2 (Fig. 4A and Table 3). Thus,most quartz aliquots were saturated for the ITL 310 �C, withcalculated De higher than 2D0, hindering its use to estimate thenatural doses of profiles ALC-01 and ALC-02. However, ITL 310 �Callowed to obtain minimum equivalent doses (equal to 2D0) for thesamples of profiles ALC-01 (Table 5). The TT-OSL1 signal showshigher saturation doses, with 2D0 higher than 1000 Gy.
Considering the saturation of the ITL 310 �C signal for most ofthe studied samples, the TT-OSL 1 protocol was used for naturaldoses estimation. The natural doses values calculated for the XinguRiver terraces using the TT-OSL 1 protocol ranged from 275 ± 33 to651 ± 27 Gy (Table 6). The recuperation values are less than 2% in allcases and most samples presented recycling ratios between 0.90and 1.10 (Table 6). The only exceptions were samples ALC-02-2 and
Fig. 4. Dose response curves and equivalent doses obtained for the ITL 310 �C (A) and TT-OSluminescence signal for the equivalent radiation dose (De). The equivalent dose based on(2D0 ¼ 420 Gy).
ALC-02-4, which showed average recycling ratios of 1.25 ± 0.07 and0.86 ± 0.07, respectively.
TT-OSL De and dose rates provide the first attempt to determinethe burial ages for Pleistocene fluvial terraces from eastern Ama-zonia. The ages of ALC-01 profile were 209 ± 28, 340 ± 38, 259 ± 25and 210 ± 21 ka; and for ALC-02 profile were 1.6 ± 0.2, 107 ± 15,234 ± 43 ka and 200 ± 55 ka, from top to bottom (Tables 4 and 5).The De estimated by ITL 310 �C (~4 Gy) and TT-OSL-1 (~16 Gy) frommodern sample yield apparent burial ages of 2.6 and 10.6 ka,respectively, which are older than the true burial age estimated byOSL (204 ± 5 years). These residual doses are relatively low andcorrespond around of 1.5e6% of the De values calculated for the
L 1 (B) signals measured in quartz aliquots of ALC-01-4 sample. Ln/Tn is the correctedITL signal is unreliable, since it is above the maximum dose that can be estimated
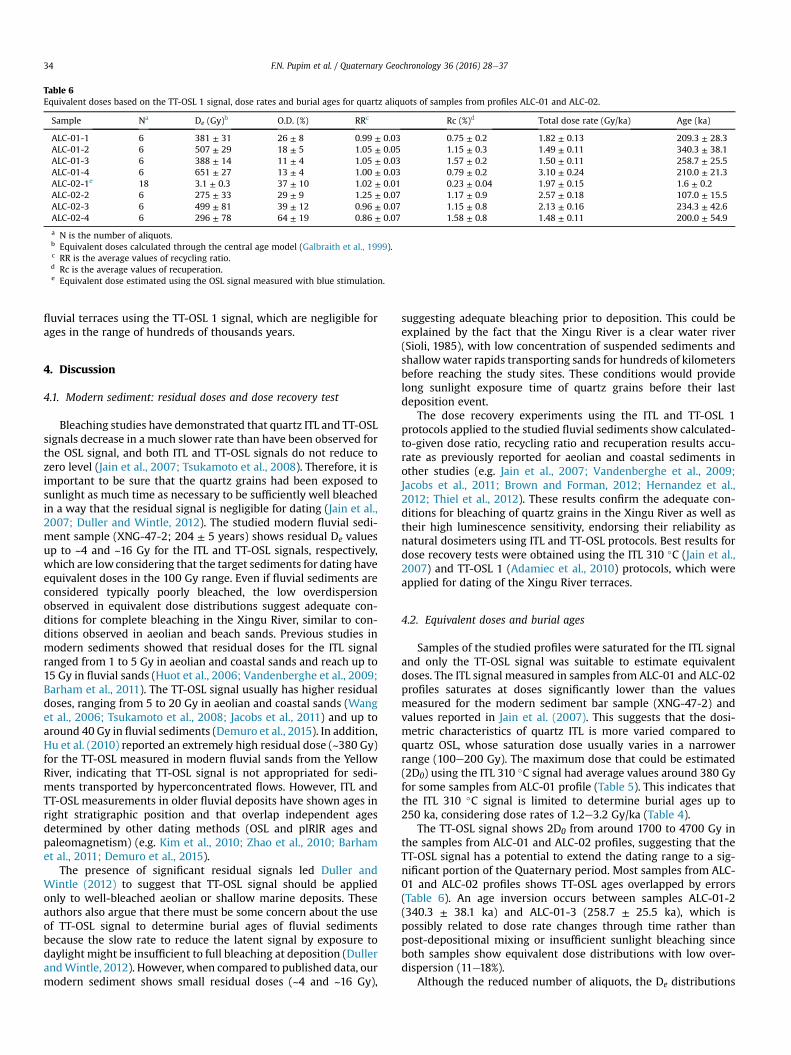
Table 6Equivalent doses based on the TT-OSL 1 signal, dose rates and burial ages for quartz aliquots of samples from profiles ALC-01 and ALC-02.
Sample Na De (Gy)b O.D. (%) RRc Rc (%)d Total dose rate (Gy/ka) Age (ka)
ALC-01-1 6 381 ± 31 26 ± 8 0.99 ± 0.03 0.75 ± 0.2 1.82 ± 0.13 209.3 ± 28.3ALC-01-2 6 507 ± 29 18 ± 5 1.05 ± 0.05 1.15 ± 0.3 1.49 ± 0.11 340.3 ± 38.1ALC-01-3 6 388 ± 14 11 ± 4 1.05 ± 0.03 1.57 ± 0.2 1.50 ± 0.11 258.7 ± 25.5ALC-01-4 6 651 ± 27 13 ± 4 1.00 ± 0.03 0.79 ± 0.2 3.10 ± 0.24 210.0 ± 21.3ALC-02-1e 18 3.1 ± 0.3 37 ± 10 1.02 ± 0.01 0.23 ± 0.04 1.97 ± 0.15 1.6 ± 0.2ALC-02-2 6 275 ± 33 29 ± 9 1.25 ± 0.07 1.17 ± 0.9 2.57 ± 0.18 107.0 ± 15.5ALC-02-3 6 499 ± 81 39 ± 12 0.96 ± 0.07 1.15 ± 0.8 2.13 ± 0.16 234.3 ± 42.6ALC-02-4 6 296 ± 78 64 ± 19 0.86 ± 0.07 1.58 ± 0.8 1.48 ± 0.11 200.0 ± 54.9
a N is the number of aliquots.b Equivalent doses calculated through the central age model (Galbraith et al., 1999).c RR is the average values of recycling ratio.d Rc is the average values of recuperation.e Equivalent dose estimated using the OSL signal measured with blue stimulation.
F.N. Pupim et al. / Quaternary Geochronology 36 (2016) 28e3734
fluvial terraces using the TT-OSL 1 signal, which are negligible forages in the range of hundreds of thousands years.
4. Discussion
4.1. Modern sediment: residual doses and dose recovery test
Bleaching studies have demonstrated that quartz ITL and TT-OSLsignals decrease in a much slower rate than have been observed forthe OSL signal, and both ITL and TT-OSL signals do not reduce tozero level (Jain et al., 2007; Tsukamoto et al., 2008). Therefore, it isimportant to be sure that the quartz grains had been exposed tosunlight as much time as necessary to be sufficiently well bleachedin a way that the residual signal is negligible for dating (Jain et al.,2007; Duller and Wintle, 2012). The studied modern fluvial sedi-ment sample (XNG-47-2; 204 ± 5 years) shows residual De valuesup to ~4 and ~16 Gy for the ITL and TT-OSL signals, respectively,which are lowconsidering that the target sediments for dating haveequivalent doses in the 100 Gy range. Even if fluvial sediments areconsidered typically poorly bleached, the low overdispersionobserved in equivalent dose distributions suggest adequate con-ditions for complete bleaching in the Xingu River, similar to con-ditions observed in aeolian and beach sands. Previous studies inmodern sediments showed that residual doses for the ITL signalranged from 1 to 5 Gy in aeolian and coastal sands and reach up to15 Gy in fluvial sands (Huot et al., 2006; Vandenberghe et al., 2009;Barham et al., 2011). The TT-OSL signal usually has higher residualdoses, ranging from 5 to 20 Gy in aeolian and coastal sands (Wanget al., 2006; Tsukamoto et al., 2008; Jacobs et al., 2011) and up toaround 40 Gy in fluvial sediments (Demuro et al., 2015). In addition,Hu et al. (2010) reported an extremely high residual dose (~380 Gy)for the TT-OSL measured in modern fluvial sands from the YellowRiver, indicating that TT-OSL signal is not appropriated for sedi-ments transported by hyperconcentrated flows. However, ITL andTT-OSL measurements in older fluvial deposits have shown ages inright stratigraphic position and that overlap independent agesdetermined by other dating methods (OSL and pIRIR ages andpaleomagnetism) (e.g. Kim et al., 2010; Zhao et al., 2010; Barhamet al., 2011; Demuro et al., 2015).
The presence of significant residual signals led Duller andWintle (2012) to suggest that TT-OSL signal should be appliedonly to well-bleached aeolian or shallow marine deposits. Theseauthors also argue that there must be some concern about the useof TT-OSL signal to determine burial ages of fluvial sedimentsbecause the slow rate to reduce the latent signal by exposure todaylight might be insufficient to full bleaching at deposition (DullerandWintle, 2012). However, when compared to published data, ourmodern sediment shows small residual doses (~4 and ~16 Gy),
suggesting adequate bleaching prior to deposition. This could beexplained by the fact that the Xingu River is a clear water river(Sioli, 1985), with low concentration of suspended sediments andshallowwater rapids transporting sands for hundreds of kilometersbefore reaching the study sites. These conditions would providelong sunlight exposure time of quartz grains before their lastdeposition event.
The dose recovery experiments using the ITL and TT-OSL 1protocols applied to the studied fluvial sediments show calculated-to-given dose ratio, recycling ratio and recuperation results accu-rate as previously reported for aeolian and coastal sediments inother studies (e.g. Jain et al., 2007; Vandenberghe et al., 2009;Jacobs et al., 2011; Brown and Forman, 2012; Hernandez et al.,2012; Thiel et al., 2012). These results confirm the adequate con-ditions for bleaching of quartz grains in the Xingu River as well astheir high luminescence sensitivity, endorsing their reliability asnatural dosimeters using ITL and TT-OSL protocols. Best results fordose recovery tests were obtained using the ITL 310 �C (Jain et al.,2007) and TT-OSL 1 (Adamiec et al., 2010) protocols, which wereapplied for dating of the Xingu River terraces.
4.2. Equivalent doses and burial ages
Samples of the studied profiles were saturated for the ITL signaland only the TT-OSL signal was suitable to estimate equivalentdoses. The ITL signal measured in samples from ALC-01 and ALC-02profiles saturates at doses significantly lower than the valuesmeasured for the modern sediment bar sample (XNG-47-2) andvalues reported in Jain et al. (2007). This suggests that the dosi-metric characteristics of quartz ITL is more varied compared toquartz OSL, whose saturation dose usually varies in a narrowerrange (100e200 Gy). The maximum dose that could be estimated(2D0) using the ITL 310 �C signal had average values around 380 Gyfor some samples from ALC-01 profile (Table 5). This indicates thatthe ITL 310 �C signal is limited to determine burial ages up to250 ka, considering dose rates of 1.2e3.2 Gy/ka (Table 4).
The TT-OSL signal shows 2D0 from around 1700 to 4700 Gy inthe samples from ALC-01 and ALC-02 profiles, suggesting that theTT-OSL signal has a potential to extend the dating range to a sig-nificant portion of the Quaternary period. Most samples from ALC-01 and ALC-02 profiles shows TT-OSL ages overlapped by errors(Table 6). An age inversion occurs between samples ALC-01-2(340.3 ± 38.1 ka) and ALC-01-3 (258.7 ± 25.5 ka), which ispossibly related to dose rate changes through time rather thanpost-depositional mixing or insufficient sunlight bleaching sinceboth samples show equivalent dose distributions with low over-dispersion (11e18%).
Although the reduced number of aliquots, the De distributions
F.N. Pupim et al. / Quaternary Geochronology 36 (2016) 28e37 35
for samples from the ALC-01 profile have low overdispersion values(11e26%), pointing out to a single population of grains with dosescentered on the weighted mean De value. Three samples from theALC-02 profile show moderate (29e39%) to high (64%) over-dispersion values. Therefore, most samples presents overdispersionvalues lower than 35%, which is consistent with the commonlyreported range for well-bleached sediments not affected by post-depositional mixing (e.g., Arnold and Roberts, 2009; Demuroet al., 2015). Sawakuchi et al. (2016) show that quartz-rich fluvialsediments in Brazil are well bleached as indicated by equivalentdose distributions with low overdispersion. These sediments havelow feldspar content and are dominated by quartz grains with highluminescence sensitivity. This suggests that overdispersion inequivalent dose distributions is strongly related with micro-dosimetric heterogeneities. Therefore, sediments in different Bra-zilian rivers have adequate bleaching and are suitable forluminescence dating using multigrain aliquots. High over-dispersion observed in equivalent dose distributions of somestudied samples can result from microdosimetric effects in sedi-ments with more heterogeneous texture and/or composition.
Laboratory experiments have suggested that the lifetime of TT-OSL trap might vary between hundred thousands and few millionyears (Li and Li, 2006; Adamiec et al., 2010; Shen et al., 2011;Pagonis et al., 2011; Thiel et al., 2012). Adamiec et al. (2010)calculated a thermal lifetime of 4.5 Ma at a storage temperatureof 10 �C and 580 ka at 20 �C for the ReOSL signal used in the TT-OSL1 protocol, where a 10% age underestimation, for a 1 Ma burial,would be expected. Thiel et al. (2012) presented a lifetime of 0.7 Maat 19 �C for the TT-OSL signal of sediments from Cap Bon coast(Tunisia). According to Thiel et al. (2012), TT-OSL ages were 23e43%underestimated when compared to ages in the 200e700 ka rangeobtained through the pIRIR at 290 �C signal. Results from numericalmodeling indicate that natural doses from TT-OSL signal can bemeasured in the range 0e400 Gy with an accuracy of ~1e5%, but itcould underestimate doses above 400 Gy (Pagonis et al., 2011). Thisfactor can hinder the use of this signal for dating of samples beyond1 Ma. Brown and Forman (2012) used TT-OSL signal to date early-mid Pleistocene loess-paleosol sequences at the Mississippi andMissouri Rivers valleys. The TT-OSL ages for the youngest units(~52e63 ka, 66 ka, and 133e192 ka) agreed well with previouslypublished thermoluminescence (TL) and infrared stimulatedluminescence (IRSL) ages, but the ages for the oldest units(~167e200 ka) were underestimated by 20%. Thus, we cannotdiscard the possibility that all of our TT-OSL ages are under-estimating the real burial age. In this case, the TT-OSL ages wouldindicate minimum ages for the formation of terraces along thelower Xingu River. Considering TT-OSL ages underestimation up toaround 45% reported in Thiel et al. (2012) for the same age range ofthe studied samples, the Xingu River terraces would have ages up to700 ka.
4.3. Dose rate uncertainties
The dose rates calculated for the studied samples show signifi-cant variation in both sedimentary profiles. Samples collected inlayers with higher concentration of silt and clay present radionu-clides concentration two times higher than in coarse sand layers(see details in Fig. 1 and Tables 4 and 6). The studied profilescomprise fining upward intervals and sedimentary facies separatedby clear surfaces, indicating sediment accretion in channel, sandbar and floodplain environments. In this way, the observed grainsize pattern can be mainly attributed to depositional processes.However, the development of clay-enriched sand layers in theXingu River terraces could be related partially to clay translocationdownward by percolating water and subsequent deposition into
the profile (Anderson and Schaetzl, 2005). The low content of K(from 0.17 to 0.69%) and relatively high Th/U ratio (ALC-01 profilefrom 8.4 to 11.4; ALC-02 profile from 4.4 to 6.5) suggest sedimentsproduced under intense weathering rates (Table 4). The Th/U ratioin most upper crustal rocks is typically 3.8 (Taylor and McLennan,1985). In most cases, weathering and sedimentary recyclingresult in loss of U, leading to an elevation in the Th/U ratio (Asieduet al., 2000; Carmichael et al., 2014). Thus, Th/U values ranging from4.4 to 11.4 in the studied samples would indicate sediments withdifferent origins regarding weathering and source areas. Thetropical weathering typical of Amazonia combined with cratonicareas partially covered by old sedimentary rocks in the Xingu Riverbasin would favor the formation of sediments with high Th/U ratio.Despite the possibility of clay illuviation could promote post-depositional changes in sediment texture and composition, thisprocess would produce minor shifts in the primary sedimentologiccharacteristics of the studied profiles.
Changes in water saturation since sediment deposition and dueto seasonal climate (dry versus wet season) can promote variationof radiation dose rate through time (Aitken, 1985). Considering thatthe studied fluvial sediments were deposited below water table(completely water saturated), and that they are significantly abovethe present water table due to channel incision, we interpret asignificant decrease of water content through time. Based on thewater saturation range estimated for the studied samples andconsidering constant radionuclides concentrations, water contentvariation can promote decrease in dose rate and increase in burialages in the order of 18e32% (Table 1S). The maximum watersaturation estimates allow to determine a boundary scenario forsediment burial ages of the Xingu River terraces, in which themaximum ages for ALC-01 and ALC-02 profiles are around 446 ± 44and 326 ± 56 ka, respectively.
Changes in the clay content through time due to weathering ofcoarser sediment grains can also affect dose rate due to variation inwater saturation promoted by the higher capacity of clay mineralsin keep moisture. Pleistocene climate changes recorded for Ama-zonia (Cheng et al., 2013) and their influence over weatheringprocesses can also provoke loss or uptake of radionuclides throughmineral leaching or authigenesis. All those factors result in doserate changes through time, then any attempt at applying lumi-nescence dating should be problematic. Thus, dose rate heteroge-neities and temporal variations in dose rate could contribute to theobserved age inversions. According to the sedimentary faciesinterpretation, the profiles would correspond to a succession ofsediment accretion in a fluvial channel covered by sand bar andfloodplain deposits. In this way, the overlap of burial ages is ex-pected, considering that age errors of tens of thousands of yearsavoid the discrimination of depositional events in timescales offluvial channel dynamics.
4.4. Paleogeography implications
Despite age uncertainties, the studied terraces represent a phaseof higher river level during theMiddle Pleistocene, which representa maximum age for the Xingu River channel under similar positionand dimensions as today. Moreover, the Xingu River channel hasdepth around 15e25 m in most zones of the studied sector. Thus,TT-OSL ages would indicate a river base level 15e25 m higher thanthe present level during the Middle Pleistocene, considering theinterpretation of the bottom sediment beds of the profiles aschannel deposits. After this time, increase in precipitation and riverdischarge resulted in vertical channel incision and development ofthe modern Xingu River valley, whose flooding would allow theformation of its ria-type channel (Archer, 2005) before reaching theAmazon River. The younger deposits on the top of ALC-02 profile
F.N. Pupim et al. / Quaternary Geochronology 36 (2016) 28e3736
correspond to a Holocene sand layer covering the Pleistocene ter-races and it might be related to more recent extreme flood events.
5. Conclusions
The first evaluation of ITL and TT-OSL signals of quartz frommodern Xingu River sediments achieved satisfactory results fordose recovery tests, showing their suitability to estimate equivalentdoses. Both signals have high sensitivity and are well bleached innature. The best dose recovery results were achieved by protocolsbased on the ITL 310 �C (Jain et al., 2007) and TT-OSL signals(Adamiec et al., 2010), which can recover equivalent doses up to1082 ± 34 Gy and 1710 ± 63 Gy, respectively.
When applied to calculate De for the Xingu River terraces, themaximum dose that can be estimated using the ITL 310 �C signal isaround 380 Gy, which is significantly lower than observed for themodern analogue sample and previous studies. This limited itsapplication to dating the studied sedimentary sequences. Furtherefforts are necessary to investigate the factors controlling the hugevariation in saturation doses of ITL signal as observed in quartzfrom the Xingu River sediments.
TT-OSL signal provided De up to 651 ± 27 Gy and ages between107.0 ± 15.5 and 340.3 ± 38.1 ka for the Xingu River terraces. Withthe exception of one sample, all other studied fluvial sedimentssamples showed equivalent dose distributions with low to mod-erate overdispersion (11e39%), similar to values observed in coastalor aeolian sediments. However, possible instability of TT-OSL anduncertainties regarding dose rate changes through time are themajor concerns regarding the estimation of accurate burial ages. Sofar, innovation efforts in dose rate modeling are necessary toenhance the accuracy of burial ages. The TT-OSL signal shows 2D0
up to 4745 ± 444 Gy in the samples from Xingu terrace profiles,which would suggest the potential of TT-OSL signal to determineburial ages for the whole Quaternary of Amazonia, consideringaverage dose rates of 1.5e2.0 Gy/ka. This would allow to betterconstrain changes in the Amazonian river system during the Qua-ternary, shedding light into the role of rivers for biodiversity inAmazonia.
Acknowledgments
The authors sincerely thank Sebasti�en Huot and an anonymousreviewer for valuable efforts and detailed suggestions, whichgreatly improved the manuscript. The S~ao Paulo Research Foun-dation funded the Post-doctorate fellowship to FNP (grant 2014/23334-4) and the set-up of the Luminescence and Gamma Spec-trometry Laboratory (LEGaL) at University of S~ao Paulo (grant 2009/53988-8). AOS is supported by National Council for Scientific andTechnological Development (CNPq grant 3009223/2014-8). Thisresearch had the financial support of the project “Structure andevolution of the Amazonian biota and its environment: an inte-grative approach”, a collaborative Dimensions of Biodiversity-BIOTA grant supported by FAPESP (grant 2012/50260-6), NSF andNASA. We are grateful to the field team Mauricio Parra, BettinaBozzi, Jandessa de Jesus, Nelson and Tonho (boat pilots); andLeandro Sousa, Tatiana Pereira and Jos�e Adriano Giorgi (UFPA) forthe logistics support during the fieldwork preparation in Altamiracity.
Appendix A. Supplementary data
Supplementary data related to this article can be found at http://dx.doi.org/10.1016/j.quageo.2016.08.003.
References
Adamiec, G., Bailey, R.M., Wang, X.L., Wintle, A.G., 2008. The mechanism of ther-mally transferred optically stimulated luminescence in quartz. J. Phys. D Appl.Phys. 41, 135503.
Adamiec, G., Duller, G.A.T., Roberts, H.M., Wintle, A.G., 2010. Improving the TT-OSLSAR protocol through source trap characterisation. Radiat. Meas. 45, 768e777.
Aitken, M.J., 1985. Thermoluminescence Dating. Academic Press, London.Anderson, S., Schaetzl, R., 2005. Soils Genesis and Geomorphology. Cambridge
University Press, New York.Archer, A.W., 2005. Review of amazonian depositional systems. In: Blum, M.D.,
Marriott, S.B., Leclair, S.F. (Eds.), Fluvial Sedimentology VII. Blackwell PublishingLtd. Oxford, UK, pp. 17e39.
Arnold, L.J., Roberts, R.G., 2009. Stochastic modeling of multi-grain equivalent dose(De) distributions: implications for OSL dating of sediment mixtures. Quat.Geochronol. 4, 204e230.
Asiedu, D.K., Suzuki, S., Nogami, K., Shibata, T., 2000. Geochemistry of lowercretaceous sediments, inner zone of southwest Japan. Constraints on prove-nance and tectonic environment. Geochem. J. 34 (2), 155e173.
Barham, L., Phillips, W.M., Maher, B.A., Karloukovski, V., Duller, G.A., Jain, M.,Wintle, A.G., 2011. The dating and interpretation of a mode 1 site in theLuangwa Valley, Zambia. J. Hum. Evol. 60 (5), 549e570.
Brown, N.D., Forman, S.L., 2012. Evaluating a SAR TT-OSL protocol for dating fine-grained quartz within Late Pleistocene loess deposits in the Missouri andMississippi river valleys, United States. Quat. Geochronol. 12, 87e97.
Buylaert, J.P., Jain, M., Murray, A.S., Thomsen, K.J., Thiel, C., Sohbati, R., 2012.A robust feldspar luminescence dating method for Middle and Late Pleistocenesediments. Boreas 41 (3), 435e451.
Carmichael, S.K., Waters, J.A., Suttner, T.J., Kido, E., DeReuil, A.A., 2014. A new modelfor the kellwasser anoxia events (late devonian): shallow water anoxia in anopen oceanic setting in the central asian orogenic belt. Palaeogeogr. Palae-oclimatol. Palaeoecol. 399, 394e403.
Cheng, H., Sinha, A., Cruz, F.W., Wang, X., Edwards, R.L., d’Horta, F.M., Ribas, C.C.,Vuille, M., Stott, L.D., Auler, A.S., 2013. Climate change patterns in Amazonia andbiodiversity. Nat. Commun. 4, 1411.
Choi, J.H., Murray, A.S., Cheong, C.S., Hong, D.G., Chang, H.W., 2006. Estimation ofequivalent dose using quartz isothermal TL and the SAR procedure. Quat.Geochronol. 1, 101e108.
Demuro, M., Arnold, L.J., Par�es, J.M., Sala, R., 2015. Extended-range luminescencechronologies suggest potentially complex bone accumulation histories at theEarly-to-Middle Pleistocene palaeontological site of Hu�escar-1 (Guadix-Bazabasin, Spain). Quat. Int. 389, 191e212.
Duller, G.A.T., 2003. Distinguishing quartz and feldspar in single grain luminescencemeasurements. Radiat. Meas. 37 (2), 161e165.
Duller, G.A.T., Wintle, A.G., 2012. A review of the thermally transferred opticallystimulated luminescence signal from quartz for dating sediments. Quat. Geo-chronol. 7, 6e20.
Fitzsimmons, K.E., 2011. An assessment of the luminescence sensitivity of Australianquartz with respect to sediment history. Geochronometria 38, 199e208.
Galbraith, R.F., Roberts, R.G., Laslett, G.M., Yoshida, H., Olley, J.M., 1999. Opticaldating of single and multiple grains of quartz from Jinmium rock shelter,northern Australia: Part I. Experimental design and statistical models.Archaeometry 41, 339e364.
Guedes, C.C.F., Sawakuchi, A.O., Giannini, P.C.F., Dewitt, R., Aguiar, V.P., 2013.Luminescence characteristics of quartz from Brazilian sediments and con-straints for OSL dating. An. Acad. Bras. Ciencias (Impresso) 85, 1303e1316.
Gu�erin, G., Mercier, N., Adamiec, G., 2011. Dose-rate conversion factors: update. Anc.TL 29 (1), 5e8.
Hansen, V., Murray, A., Buylaert, J.P., Yeo, E.Y., Thomsen, K., 2015. A new irradiatedquartz for beta source calibration. Radiat. Meas. 81, 123e127.
Hernandez, M., Mauz, B., Mercier, N., Shen, Z., 2012. Evaluating the efficiency of TT-OSL SAR protocols. Radiat. Meas. 47 (9), 669e673.
Hoorn, C., Wesselingh, F.P., 2010. Introduction: Amazonia, landscape and speciesevolution. In: Hoorn, C., Wesselingh, F.P. (Eds.), Amazonia: Landscape andSpecies Evolution: a Look into the Past. John Wiley & Sons, pp. 1e6.
Hu, G., Zhang, J.-F., Qiu, W.-L., Zhou, L.P., 2010. Residual OSL signals in modernfluvial sediments from the Yellow River (HuangHe) and the implications fordating young sediments. Quat. Geochronol. 5, 187e193.
Huot, S., Buylaert, J.-P., Murray, A.S., 2006. Isothermal thermoluminescence signalsfrom quartz. Radiat. Meas. 41, 796e802.
Jacobs, Z., Roberts, R.G., Lachlan, T.J., Karkanas, P., Marean, C.W., Roberts, D.L., 2011.Development of the SAR TT-OSL procedure for dating Middle Pleistocene duneand shallow marine deposits along the southern Cape coast of South Africa.Quat. Geochronol. 6, 491e513.
Jain, M., Bøtter-Jensen, L., Murray, A.S., Denby, P.M., Tsukamoto, S., Gibling, M.R.,2005. Revisiting TL: dose measurement beyond the OSL range using SAR. Anc.TL 23, 9e24.
Jain, M., Duller, G.A.T., Wintle, A.G., 2007. Dose response, thermal stability andoptical bleaching of the 310�C isothermal TL signal in quartz. Radiat. Meas. 42,1285e1293.
Kim, J.C., Duller, G.A.T., Roberts, H.M., Wintle, A.G., Lee, Y.I., Yi, S.B., 2010. Re-eval-uation of the chronology of the palaeolithic site at Jeongokri, Korea, using OSLand TT-OSL signals from quartz. Quat. Geochronol. 5, 365e370.
Li, B., Li, S.-H., 2006. Studies of thermal stability of charges associated with thermal
F.N. Pupim et al. / Quaternary Geochronology 36 (2016) 28e37 37
transfer of OSL from quartz. J. Phys. D Appl. Phys. 39, 2941e2949.Lü, T.Y., Sun, J., Li, S.-H., Gong, Z., Xue, L., 2014. Vertical variations of luminescence
sensitivity of quartz grains from loess/paleosol of Luochuan section in thecentral Chinese Loess Plateau since the last interglacial. Quat. Geochronol. 22,107e115.
Murray, A.S., Wintle, A.G., 2000. Luminescence dating of quartz using an improvedsingle-aliquot regenerative-dose protocol. Radiat. Meas. 32, 57e73.
Murray, A.S., Wintle, A.G., 2003. The single aliquot regenerative dose protocol:potential for improvements in reliability. Radiat. Meas. 37, 377e381.
Pagonis, V., Adamiec, G., Athanassas, C., Chen, R., Baker, A., Larsen, M., Thompson, Z.,2011. Simulations of thermally transferred OSL signals in quartz: accuracy andprecision of the protocols for equivalent dose evaluation. Nucl. Instrum.Methods Phys. Res. B 269, 1431e1443.
Pietsch, T.J., Olley, J.M., Nanson, G.C., 2008. Fluvial transport as a natural lumines-cence sensitiser of quartz. Quat. Geochronol. 3, 365e376.
Prescott, J.R., Hutton, J.T., 1994. Cosmic ray contributions to dose rates for lumi-nescence and ESR dating: large depths and long-term time variations. Radiat.Meas. 23 (2e3), 497e500.
Ribas, C.C., Aleixo, A., Nogueira, A.C.R., Miyaki, C.Y., Cracraft, J., 2011.A palaeobiogeographic model for biotic diversification within Amazonia overthe past three million years. Proc. R. Soc. B Biol. Sci. 279 (1729), 681e689.
Rossetti, D.F., Cohen, M.C., Tatumi, S.H., Sawakuchi, A.O., Cremon, �E.H., Mittani, J.C.,Bertania, T.C., Munitae, C.J.A.S., Tudelaf, D.R.G., Yeec, M., Moya, G., 2015. Mid-Late Pleistocene OSL chronology in western Amazonia and implications for thetranscontinental Amazon pathway. Sediment. Geol. 330, 1e15.
Sawakuchi, A.O., Blair, M.W., DeWitt, R., Faleiros, F.M., Hyppolito, T., Guedes, C.C.F.,2011. Thermal history versus sedimentary history: OSL sensitivity of quartzgrains extracted from rocks and sediments. Quat. Geochronol. 6, 261e272.
Sawakuchi, A.O., Mendes, V.R., Pupim, F.N., Mineli, T.D., Ribeiro, L.M.A.L., Zular, A.,Guedes, C.C.F., Giannini, P.C.F., Nogueira, L., Sallun Filho, W., Assine, M.L., 2016.
Optically stimulated luminescence and isothermal thermoluminescence datingof high sensitivity and well bleached quartz from Brazilian sediments: fromLate Holocene to beyond the Quaternary? Braz. J. Geol. 46 (Suppl. 1), 209e226.
Shen, Z.X., Mauz, B., Lang, A., 2011. Source-trap characterization of thermallytransferred OSL in quartz. J. Phys. D Appl. Phys. 44 (29), 295405.
Sioli, H., 1985. Amazonia: Fundamentos de Ecologia da Maior Regi~ao de FlorestasTropicais. Editora Vozes, Petr�opolis.
Soares, E.A.A., Tatumi, S.H., Riccomini, C., 2010. OSL age determinations of Pleisto-cene fluvial deposits in Central Amazonia. Ann. Braz. Acad. Sci. 82 (3), 691e699.
Stevens, T., Buylaert, J.-P., Murray, A.S., 2009. Towards development of a broadlyapplicable SAR TT-OSL dating protocol for quartz. Radiat. Meas. 44, 639e645.
Taylor, S.R., McLennan, S.M., 1985. The Continental Crust: its Composition andEvolution. Blackwell, Oxford.
Thiel, C., Buylaert, J.-P., Murray, A.S., Elmejdoub, N., Jedoui, Y., 2012. A comparison ofTT-OSL and pot-IR IRSL dating of coastal deposits on Cap Bon peninsula, north-eastern Tunisia. Quat. Geochronol. 10, 209e217.
Tsukamoto, S., Duller, G.A.T., Wintle, A.G., 2008. Characteristics of thermallytransferred optically stimulated luminescence (TT-OSL) in quartz and its po-tential for dating sediments. Radiat. Meas. 43, 1204e1218.
Vandenberghe, D.A.G., Jain, M., Murray, A.S., 2009. Equivalent dose determinationusing a quartz isothermal TL signal. Radiat. Meas. 44 (5), 439e444.
Wang, X.L., Lu, Y.C., Wintle, A.G., 2006. Recuperated OSL dating of fine-grainedquartz in Chinese loess. Quat. Geochronol. 1, 89e100.
Wintle, A.G., Murray, A.S., 2006. A review of quartz optically stimulated lumines-cence characteristics and their relevance in single-aliquot regeneration datingprotocols. Radiat. Meas. 41, 369e391.
Zhao, H., Lu, Y.C., Wang, C.M., Chen, J., Liu, J.F., Mao, H.L., 2010. ReOSL dating ofaeolian and fluvial sediments from Nihewan Basin, northern China and itsenvironmental application. Quat. Geochronol. 5, 159e163.
Top Related