


Languages
Pages
Legal

Estimating phylogenetic trees from genome-scale data
Liang Liu1,2 , Zhenxiang Xi3, Shaoyuan Wu4, Charles Davis3, and Scott V. Edwards4*
1Department of Statistics, University of Georgia, Athens, GA 30602, USA
2Institute of Bioinformatics, University of Georgia, Athens, GA 30602, USA
3Department of Organismic and Evolutionary Biology, Harvard University, Cambridge, MA
02138, USA
4Department of Biochemistry and Molecular Biology & Tianjin Key Laboratory of Medical
Epigenetics, School of Basic Medical Sciences, Tianjin Medical University, Tianjin 300070,
China.
*Corresponding author:
Scott Edwards
Department of Organismic and Evolutionary Biology
Harvard University
Cambridge, MA 02138, USA
Email: [email protected]

2
Abstract
As researchers collect increasingly large molecular data sets to reconstruct the Tree of Life, the
heterogeneity of signals in the genomes of diverse organisms poses challenges for traditional
phylogenetic analysis. A class of phylogenetic methods known as ‘species tree methods’ have
been proposed to directly address one important source of gene tree heterogeneity, namely the
incomplete lineage sorting or deep coalescence that occurs when evolving lineages radiate
rapidly, resulting in a diversity of gene trees from a single underlying species tree. Although
such methods are gaining in popularity, they are being adopted with caution in some quarters, in
part because perceived shortcomings, poor performance, model violations or philosophical
issues. Here we review theory and empirical examples that help clarify these conflicts.
Thinking of concatenation as a special case of the more general case provided by the
multispecies coalescent model (MSC) can help explain a number of differences in the behavior
of the two methods on phylogenomic data sets. Recent work suggests that species tree methods
are more robust than concatenation approaches to some of the classic challenges of phylogenetic
analysis, including rapidly evolving sites in DNA sequences, base compositional heterogeneity
and long branch attraction. We show that approaches such as binning, designed to augment the
signal in species tree analyses, can distort the distribution of gene trees and are inconsistent.
Computationally efficient species tree methods that incorporate biological realism are a key to
phylogenetic analysis of whole genome data.
Keywords: bias-variance dilemma, transcriptome, isochore, anomaly zone, recombination.

3
The emergence of phylogenomic data provides unprecedented opportunities to resolve
challenging phylogenies of species and, ultimately, the Tree of Life. In the last few years, a
number of phylogenetic and population genetic methods for analyzing the evolutionary history of
whole genomes have emerged. These new methods are gradually replacing methods that were
once the bulwarks of evolutionary genomics and molecular ecology in the PCR-era. For
example, recently the classic isolation-with migration model of phylogeography, originally
introduced by Hey, Nielsen and others1-3 and widely used in likelihood and Bayesian formats, has
been updated to accommodate whole genome data4,5. Like most methods in phylogeography,
these methods model genomic data as a series of unlinked or partially linked loci whose histories
are influenced by the underlying demographic history of the species in question. The coalescent
provides a robust and general framework for many of these new genome-scale models in
phylogeography.
Like models in phylogeography, genome-scale methods in phylogenomics are
undergoing a transition, grappling with the heterogeneity of signals that frequently emerge from
genome-scale data6,7. Recent research has revealed a surprising array of such heterogeneous
signals, including variation among loci in base composition, evolutionary rate, and, perhaps most
conspicuously, topological congruence8-12. Indeed, mirroring early insights into gene tree
heterogeneity discovered in the 1980s in the context of phylogeography, gene tree heterogeneity
in phylogenetics has emerged as a ubiquitous element, particularly as the number of loci in
phylogenetic studies has increased6. Yet, surprisingly, whereas phylogeography has dealt with
this heterogeneity by acknowledging and modeling stochasticity – indeed, statistical
phylogeography has not known any other means of modeling such variation – for decades such
models made few in roads into phylogenetics. Even as heterogeneity in gene trees was

4
acknowledged as a significant issue in phylogenetics13, concatenation or supermatrix methods
provided the main paradigm in which phylogenetic models were developed to deal with diverse
signals found in multilocus data14. Perhaps more intriguing, then, is that, even as such so-called
‘species tree’ or coalescent models have been developed in the context of phylogenetics, they are
being embraced by phylogeneticists cautiously, or in some cases openly questioned15,16. Such
caution and questioning is no doubt healthy, but it also suggests that, for some researchers, the
heterogeneity observed in gene trees is either deemed unimportant or inconsequential for
phylogenetic analysis, or that the models developed thus far to deal with this heterogeneity are
unsatisfying, incomplete or flawed.
Phylogenomic data have intensified debates over whether concatenation or coalescent
methods in phylogenomics are more appropriate for analyzing multilocus sequence data6,15,17,18.
Although recent phylogenomic studies suggest that the majority of relationships yielded by
concatenation and coalescent trees are consistent with each other, or differ from each other
without high statistical support11,12,19,20, recent examples of highly supported conflicting
relationships favored by concatenation and coalescent methods have highlighted the details,
weaknesses, and assumptions of both sets of methods11,21-26 . The significant differences in
performance of concatenation and coalescent methods in estimating species trees flow directly
from the distinct assumptions on which the two methods are based13,27,28. Perhaps more
importantly, it can be shown that under certain conditions the coalescent model reduces to the
concatenation model18 (see below), which can help explain the frequent similarities between
concatenation and coalescent trees in empirical data analyses. Finally, in comparing
concatenation and coalescent methods, important questions have been raised regarding the
performance of coalescent methods under genetic forces such as within-gene recombination and

5
gene flow, or issues with data, such as sampling effort and strategies, missing data, misrouting of
gene trees, binning (concatenating) of multiple loci or errors in gene tree estimation15,16,29-33.
Whereas population genetic effects such as gene flow and recombination rarely figured in
discussions of phylogenetic models in the supermatrix era, recent discussions of these topics
appear to be a direct result of the advent of coalescent methods and mark a growing appreciation
by phylogeneticists of the links between population genetics and phylogenetics34,35. Overall, the
current debates offer a glimpse of a field in transition, grappling with new signals and
heterogeneity brought on by phylogenomics.
In this review we discuss a number of recent trends in the application of coalescent
models to phylogenetic analysis, and address some recent criticisms of such models. Most
coalescent models in phylogenomics assume simple models of instantaneous speciation, in which
no gene flow occurs after species begin to diverge. Moreover, these models assume complete
neutrality, no recombination within loci and free recombination between loci, such that loci can
be treated as independent neutral replicates conditional on the phylogenetic history of the
lineages under study. Several recent papers have shown that violations of these assumptions can
have varying effects on the outcome of phylogenetic analysis (Table 1), with some more severe
than others. The main criticisms of coalescent methods in phylogenetics – articulated most
forcefully in a series of papers and comments by Gatesy and Springer15,16,21 – focus on features of
phylogenomic data sets that are perceived to violate the multispecies coalescent model (MSC).
Such concerns focus on several issues, including the potential for recombination within loci,
particularly for transcriptome data in which exons that might span megabases in the genome yet
are ‘concatenated’ together, either in silico or by the cell during the process of transcription; the
claim that different species tree methods yield conflicting results when applied to the same data

6
sets; the suggestion that most gene tree heterogeneity results from effects other than incomplete
lineage sorting (ILS); and confusion over the effects and implications of low-resolution gene
trees on species tree estimation. This last issue has also motivated the development of add-on
methods to species tree estimation, such as naïve and statistical binning36,37, whose aim is to
augment phylogenetic signal when inferring species trees using coalescent methods.
Here we discuss these various criticisms and concerns in an effort to clarify a host of
issues raised about coalescent models in phylogenetics. We also highlight recent empirical
studies that evaluate the signal in gene trees and explore their implications for the adoption or
rejection of species tree methods. We show that concatenation methods can be considered a
special case of the more general MSC. As such, the more specific concatenation model is
expected to yield results that are biased but with a smaller variance (e.g., higher bootstrap
support) for the estimates of model parameters than the more general MSC -- a perspective that
helps explain recent trends in observed phylogenomic data sets. We also suggest that naïve
binning – a proposal to augment the signal in multilocus data sets by concatenating genes at
random into bins – will only work under highly restricted conditions, and that the lower
performance of coalescent methods versus concatenation methods in those studies reflects an
undue focus on point estimates and a restricted set of simulation conditions, an undervaluation of
the variance of those estimates and the often inflated support of concatenation analyses. Overall
we find that currently proposed species tree methods represent a promising start to the challenge
of analyzing phylogenomic data and highlight conceptual and practical challenges for the future.
Concatenation versus Coalescent Models in Phylogenomics
The coalescent and concatenation models differ in their treatment of individual gene trees. In the
coalescent model, which assumes free recombination among genes, the gene trees are treated as

7
conditionally independent random variables G ={gi, i = 1, …, k} given the species tree S38, where
k is the number of genes. However, independent gene trees may have the same topology,
especially when the species tree has long internal branches in coalescent units39,40. Under the
coalescent model, the likelihood function of the species tree S given the multilocus sequence data
D = (d1, d2, …, dk) is given by
L(S |D) = f (D |G,!)!"(G | S)dGG" . (1)
In (1), f (D |G,!) is the probability density function of sequence data D given gene trees G and
parameters λ in the substitution model, and !(G | S) is the coalescent distribution function of
gene trees G given the species tree S. The function f (D |G,!) is the traditional likelihood
function used for building maximum likelihood gene trees. When gene trees G are identical with
the species tree S (i.e., g1 = g2 = … = gK = S), the coalescent probability function !(G | S) is 1 for
G = S and 0 otherwise. Therefore, when all gene trees are identical with the species tree S, the
likelihood function of the species tree S is reduced to
L(S |D) = f (D | S,!) . (2)
As model parameters λ may or may not be linked across genes (i.e., partitions), f (D | S,!) in (2)
is the likelihood function for the concatenation model with or without partitions. Equation (2)
shows that the concatenation model with or without partitions is a special case of the coalescent
model. This result has at least two important implications: (i) while concatenation methods may
produce inconsistent estimates of species trees under the coalescent model28, coalescent methods
can consistently produce the true species tree under the concatenation model, and (ii) the
comparison between the coalescent and concatenation methods falls into the general bias-

8
variance dilemma, i.e., the reduced model (concatenation) in general is biased and has smaller
variance for the estimates of model parameters41.
As a reduced model, concatenation has a smaller number of parameters, because all gene
trees in the concatenation model are treated as the same parameter. Thus, the estimates of
parameters in the concatenation model tend to have a smaller variance. Since small variance
corresponds to high bootstrap support or posterior probability, overestimation of bootstrap
support by concatenation methods is a consequence of the fact that it is a reduced model.
Moreover, gene-tree-based coalescent methods – those methods that estimate the species tree
using separately estimated gene trees42,43 – can in turn result in larger variance for their estimates
of species trees, because these methods estimate gene trees and the species tree separately in two
steps using summary statistics or a pseudo-likelihood function. This is the same as saying that
gene-tree-based coalescent methods may sometimes result in bootstrap support that is lower than
those coalescent methods using the full coalescent model, such as BEST 27 and *BEAST44.
(Indeed, we have observed this empirically for the 30-locus data set from birds 45 analyzed by
Liu and Pearl 27, which yielded a posterior probability of 0.9 when analyzed by BEST but only
~54% bootstrap support when analyzed by the simpler model in STAR46). However, the problem
of larger variance in gene-tree-based coalescent methods can be greatly alleviated by either
improving the efficiency of these methods or by increasing the number of genes. Because
phylogenomic data often contain hundreds of genes, species tree analyses using gene-tree-based
coalescent methods have produced highly supported species trees for empirical phylogenomic
data11,20,23,24,47. In contrast, inconsistency of concatenation tends to become severe when there are
a large number of genes28. Thus, the major concern of phylogenomic data analysis is not the high
variance of gene-tree-based coalescent methods, but rather the inconsistency of concatenation
9
methods due to model misspecification43, especially in cases where phylogenomic inferences are
based on highly supported relationships.
In empirical phylogenomic data analyses, concatenation and coalescent methods often
produce similar relationships for the majority of branches in the estimated trees. As discussed
above, when the concatenation model applies, we do not expect to encounter highly supported
relationships that conflict between concatenation and coalescent trees, because with the
assumption of identical gene trees, the coalescent model is reduced to the concatenation model.
Thus, highly supported but conflicting relationships in concatenation and coalescent trees, as has
recently been observed in several phylogenomic data analyses24,48, indicate either a high amount
of ILS (due to short internal branches [in coalescent units] in the species tree) that mislead the
concatenation method11, or that the major cause of gene tree variation is not ILS. In the latter
case, neither concatenation nor coalescent models can adequately explain the distribution of
heterogeneous gene trees.
Empirical examples of conflict between coalescent and concatenation methods
Coalescence versus concatenation in plant phylogenomics
To date, very few studies have utilized coalescent methods for inferring plant phylogenies30,49-51.
Of these studies, strongly conflicting relationships involving concatenation versus coalescent
analyses have recently been demonstrated for key nodes in land plant phylogeny. Despite
tremendous effort, relationships between the five main seed plant clades–angiosperms, conifers,
cycads, Ginkgo, and gnetophytes–have remained uncertain. A first broad coalescent analysis of
seed plants by Xi et al.23 incorporated 305 nuclear genes and suggest an explanation for why
concatenation methods may result in strong topological incongruence, manifested as
phylogenetic ‘flip-flops’ between analyses involving different subsets of data. Unlike most

10
previous analyses using concatenation, which have strongly placed cycads and Ginkgo as
successive sisters to the remainder of extant gymnosperms, coalescent results instead strongly
identified Ginkgo and cycads as monophyletic. Suspecting that the rate of nucleotide substitution
might be influencing this difference, Xi et al.23 binned sites into fast and slow evolving categories
and reanalyzed these data. Coalescent analyses continued to support the monophyly of Ginkgo
and cycads regardless of rate category, but concatenation did not. Instead, fast evolving sites
strongly supported the more traditional placement of cycads and Ginkgo whereas slow evolving
sites supported the placement inferred from coalescent methods. This finding raised the
hypothesis that rate variation among sites may explain the striking topological differences
observed in concatenated phylogenomic analyses, reflecting problems commonly encountered in,
for example, cases of ‘long branch attraction’52,53. Furthermore, more recent coalescent analyses
using expanded taxon sampling and transcriptome data corroborated the monophyly of Ginkgo
and cycads 50.
In a second paper, Xi et al.24 further explored this hypothesis by examining a slightly
larger phylogenomic dataset including 310 nuclear genes, mostly from flowering plants. Here,
phylogenetic relationships were congruent between concatenation and coalescent methods,
except for the placement of Amborella, which has long been heralded as the sister to all other
flowering plants54,55. Here, coalescent analyses consistently and strongly support the less
traditional placement of Amborella as sister to water lilies across all nucleotide rate partitions.
By contrast, concatenation showed the same kind of strongly conflicting results that were
observed in earlier study involving the placement of Ginkgo and cycads: slow evolving sites
corroborated the results from coalescent analyses and fast evolving sites placed Amborella alone
as the first lineage of extant plants. An additional assessment of these fast evolving sites showed

11
particularly strong evidence of saturation, suggesting one explanation for these artifacts. In this
case, it appears that distributing saturated sites among many individual gene trees and analyzing
each separately as is done by commonly used coalescent methods may be more effective at
diluting the deleterious effects of such characters. By contrast, when analyzing all such sites
simultaneously within a single matrix as is done using concatenation, such deleterious effects
will be exacerbated. We should note that this question has been revaluated more recently with
coalescent analyses using expanded taxon sampling and transcriptome data 50. This study
strongly supports the more traditional placement of Amborella alone. However, one of us (Z.X.)
has analyzed the nearly 400 transcripts common to both Amborella and water lilies using these
data. Here again, slow evolving nucleotide and amino acid sites strongly support the placement
of Amborella and water lilies as monophyletic (unpublished data).
Xi et al. investigated this placement of Amborella further with simulations. The first of
these simulations used the Amborella dataset. Here, they randomly constrained each gene tree to
be consistent with one of the alternative placements of Amborella. Branch lengths and
substitution model parameters were then estimated on each constrained tree from the original
data. Data sets were then simulated on these trees and the resulting simulated data were binned
into fast and slow evolving sites. Coalescent analysis of these data reconstructed the constrained
topologies as expected, regardless of rate category. Surprisingly, however, despite 60-80% of the
gene trees constrained to the Amborella plus water lilies placement, concatenation of the fast
evolving sites still resulted in the placement of Amborella and water lilies as successive sisters to
all angiosperms. This strongly suggests that concatenation of fast evolving sites likely plays a
strong role influencing the misleading placement of Amborella.
12
Additional simulations24 on species trees with both long and short branches suggested
that when incomplete lineage sorting is high, concatenation methods perform very poorly,
suggesting that concatenation may strongly be influenced by the shape of the species tree
topology and its interaction with ILS. A related follow-up simulation study 25 suggests that when
long external and short internal branches occur simultaneously with high ILS, concatenation
methods can be misled, especially when two of these long branches are sister lineages. By
contrast, species tree methods (in this case MP-EST43 and STAR46) are more robust under these
circumstances. This result is particularly relevant because many ancient radiations across the
Tree of Life suggest this particular pattern of adjacent long and short branches. Because short
internal branches in the species tree can increase the potential for ILS and gene tree discordance,
these results indicate that coalescent methods are more likely to infer the correct species tree in
cases of rapid, ancient radiations where short internal and long external branches are in close
phylogenetic proximity.
Coalescence versus concatenation in mammal phylogenomics
Despite recent progress in classifying eutherian mammals into four superorders –
Afrotheria, Xenarthra, Laurasiatheria and Euarchontoglires, several key relationships within
eutherian mammals remain controversial, including the root of Eutheria, and the interordinal
relationships within Euarchontoglires, Laurasiatheria and Afrotheria56,57. To date, however, the
reconstruction of mammalian phylogeny has relied mostly on concatenation methods, which as
we indicate above may suffer from systematic bias due to the unrealistic assumption of gene tree
homogeneity across loci. To empirically address the effect of gene tree heterogeneity on
estimating deeply diverging phylogenies, Song et al.48 took the approach of subsampling loci and
taxa so as to investigate the robustness of concatenation and coalescent methods to different
13
analyses of the same taxa. Using a data set of 447 nuclear genes for 35 mammalian taxa, Song et
al. demonstrated that concatenation indeed behaves inconsistently across data sets, as evidenced
by the conflicting and strongly supported relationships from different subsamples of loci. In
contrast, coalescent methods were able to estimate a consistent phylogeny for eutherian
mammals from the same subsets of data, and demonstrated clear positive relationship between
nodal support values and the number of loci. In this regard, the study on mammals was
consistent with predictions of a recent simulation study that showed a correlation between
number of loci and species tree support for nodes exhibiting high rates of ILS31.
Several studies 58, including the mammal study11, have revealed the sometimes striking
contrast between support values for trees analyzed by concatenation versus coalescent methods,
with the latter often yielding much lower values even when the tree is largely similar. It is often
the case that a tree that appears well-resolved by concatenation methods is found to be poorly
resolved using coalescent methods. So which set of support values better reflects reality? Such
results likely reflects the tendency for concatenation methods, especially Bayesian concatenation
methods, to overestimate credibility values in phylogenetic trees59,60. They may also partly
reflect the tendency of gene-tree-based coalescent methods to yield lower confidence levels than
full Bayesian coalescent methods when the number of gene trees is small (see above).
Differences in the method of bootstrapping may also contribute to these discrepancies; the
multilocus bootstrap61 is generally believed to more accurately capture support in large data sets
than the simple bootstrap16. In the study by Song et al.11, the 26 genes that resolved a sample of
mammalian taxa using concatenation resulted in a poorly resolved tree when analyzed by MP-
EST. They suggested that, in a coalescent framework, approximately 400 genes would be
required to resolve the sample of taxa in the particular tree for mammals. In this case, missing

14
data may also play a role, since coalescent methods appear to be more sensitive to missing data
than concatenation methods58. However, one study62 suggested that species tree methods were
“remarkably resilient to the effects missing data”. In our view, what sensitivity to missing data
displayed by species tree methods reflects the true impact of missing data on phylogenetic
analysis -- an impact that is obscured by analyses employing concatenation. There are now
many examples of well resolved phylogenies employing concatenation on highly incomplete
data sets50,63,64. We believe these examples illustrate the power of concatenation to obscure the
true support for trees by the collected data (see also65).
Maximizing signal in species tree analysis
Species tree analysis has moved past the stage of uncritical adoption to evaluation of sampling
strategies and methods for maximizing phylogenetic signal29,34,66-69. Much of our understanding
of the behavior of species tree reconstruction comes from simulation studies, although analyses
of empirical data have also yielded important insights. An important rule of thumb that has
emerged from both simulation and empirical studies is that species trees are only as good as the
gene trees on which they are built10,34,58,66,70,71. This maxim applies both to ‘two-step’ species tree
methods, in which gene trees are used as input data, as well as to ‘single step’ approaches, such
as Bayesian methods, in which gene and species trees are estimated simultaneously. For
example, several empirical studies on organisms as varied as turtles, mammals, fish and
flowering plants, have shown that species tree estimation can be misled by biased gene tree
estimation due to long-branch attraction and base compositional heterogeneity among lineages, a
manifestation of substitution model non-stationarity8,10,24. Even so, recent work suggests that
species tree methods, even those in which gene trees are estimated first and separately from the
species tree, may be less susceptible to classic challenges in phylogenetic analysis, such as long
15
branch attraction (Table1)25. This lowered susceptibility of species tree methods may be due to
the fact that a typical gene tree is based on at most a few thousand base pairs, which may be
small enough such that departures from stationarity may be less visible in the underlying data
sets. While it is valid to criticize the ensemble of constituent approaches that comprise gene tree
and species tree analysis, including gene tree and species tree reconstruction, it is unwarranted to
criticize species tree methods per se, especially when it is the reconstruction of gene trees that is
responsible for misestimation16. Thus a number of authors have suggested improving and
maximizing signal in gene tree estimation as a means of improving species tree estimation as a
whole. Such improvements in signal take a variety of forms, including binning of subsets of
genes, using longer or more informative genomic regions for each locus 11,26,71,72, minimizing base
compositional heterogeneity among lineages, and even choosing genes with specific trends in
base composition, for example those genes trending towards AT richness in mammals73. In this
section we evaluate a variety of suggestions for signal enhancement in species tree analysis.
Naïve and statistical binning
The naïve binning technique was proposed to improve the support of coalescent estimates of
species trees by reducing the estimation error of gene trees37. This technique concatenates DNA
sequences across randomly selected genes, regardless of whether the selected genes share the
same history. The binned sequences are treated as a “super gene”, and used to estimate “super
gene trees”. As the binned sequences are longer than the original data, the resulted gene trees are
often well supported37. However, as shown in Kubatko and Degnan28, binning sequences from
genes with distinct histories can mislead maximum likelihood (ML) concatenation methods,
which consistently produce the wrong estimate of the species tree under broad conditions. This
inconsistency problem may also occur for the “super genes” in the binning technique. Indeed,
16
although the paper title implied that binning yielded a general improvement for phylogenomic
data (“Naive binning improves phylogenomic analyses”), in the paper the authors were more
equivocal (“This paper should not be interpreted as recommending the use of naïve binning, but
instead as an indication of the potential for binning techniques to improve species tree
estimation”; p. 2284). From first principles we know that, for the case of 4-taxon anomalous
species tree (see Figure 3f in Kubatko and Degnan28) when the bin size (BS) is large, all of the
concatenated genes (i.e., super genes) will have the same ML tree, a tree that is incongruent with
the species tree. These biased super gene trees can significantly mislead the MP-EST estimate of
the species tree. Even when the bin size is small (10-15 genes), binning sequences can increase
the probability of estimating gene trees that disagree with the species tree. When this probability
is greater than a threshold, it will mislead the MP-EST method to consistently produce the wrong
estimate of the species tree.
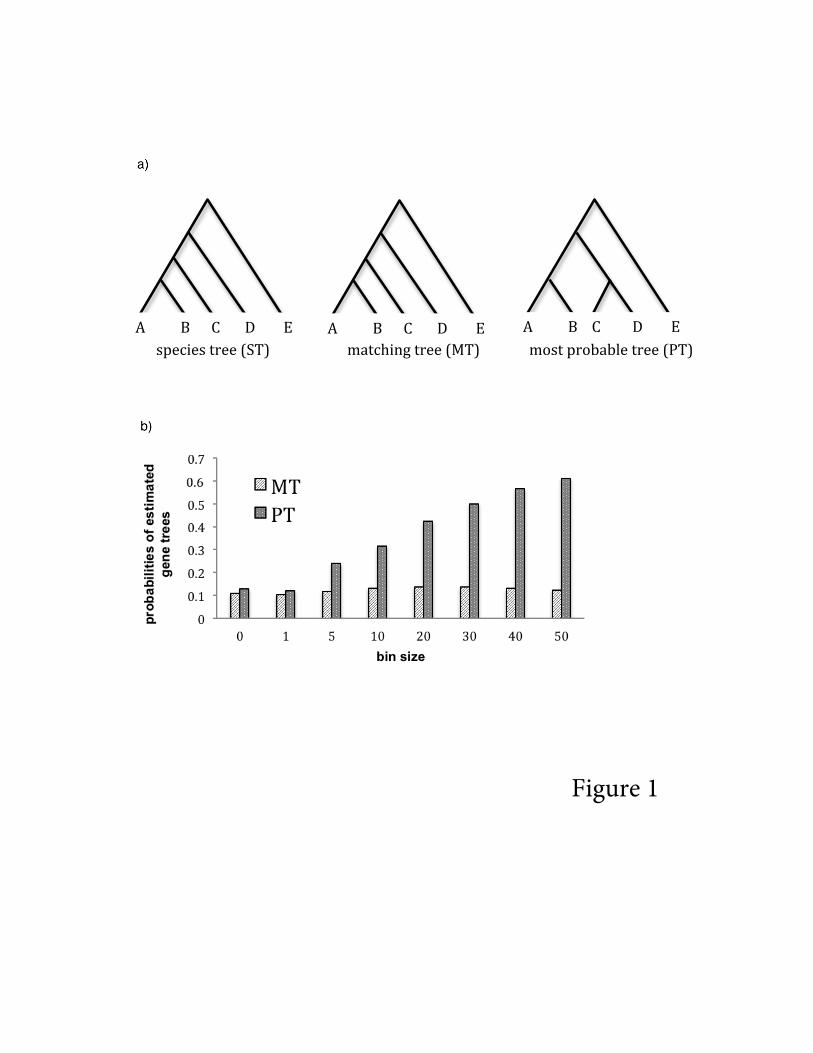
To demonstrate these phenomena, we simulated gene trees from a 5-taxon species tree
(labeled species A–E, Figure 1a) under the coalescent model using the function sim.coaltree.sp
in the R package Phybase74. Because the MP-EST method assumes that gene trees are rooted
trees, species E is used as the outgroup for rooting the estimated gene trees. To reduce the
rooting error, we intentionally set a small population size θ = 0.01 and a long internal branch
(length = 0.08) between the ingroup species (A-D) and the outgroup species E. Under these
conditions, the ingroup species (A-D) almost always form a monophyletic group in the simulated
gene trees. In addition, the population size parameter θ is set to 0.1 for other ancestral
populations in the species tree. This species tree is in the anomaly zone, because the internal
branches for species A, B, C, and D are very short (0.005/0.1 = 0.05 in coalescent unit), and the
most probable gene tree (PT) does not match the species tree75. DNA sequences of length 1000
17
bp were generated from the simulated gene trees using SeqGen76 with the Jukes-Cantor (JC69)
model77. The simulated DNA sequences were binned at random to form super genes. The bin
size was set to 10, 20, 30, 40, and 50 genes, respectively. A ML super gene tree was estimated
for each bin by PhyML78. The estimated super gene trees were then used to estimate species trees
using the MP-EST method. Each simulation was repeated 100 times.
When the bin size is one (i.e., no binning was performed), the probabilities of the
estimated gene trees are similar to the true probabilities of gene trees generated from the species
tree (Figure 1b). However, the probability of the most probable gene tree (PT) significantly
increases as the bin size increases (Figure 1b). When the bin size is 30, almost half of the
estimated super gene trees are PT, which is incongruent with the species tree (Figure 1b). It is
clear from this exercise that binning sequences from genes with distinct histories can bias the
distribution of the estimated gene trees, with a high probability of producing the tree that is
incongruent with the species tree.
Without binning (BS = 1), the MP-EST method can consistently estimate the correct
species tree as the number of genes increases (Figure 2a). The proportion of trials yielding the
correct species tree appears to increase as the number of genes increases, and reach 1.0 when the
number of genes is 1000. When the bin size is five, the probabilities of estimating the correct
species tree are greater than those without binning. This result indicates that when the bin size is
five, binning can improve the performance of MP-EST in estimating species trees. However,
when the bin size is greater than or equal to 10, the probability of estimating the correct species
tree is in general less than the probability without binning (Figure 2b). Moreover, the probability
of estimating the correct species tree appears to decrease as the number of bins (i.e., the number
of super genes) increases (Figure 2b). For bin sizes of 30, 40, and 50, the probability of yielding
18
the correct species tree decreases to zero when the number of bins reaches 80 (Figure 2b).
Meanwhile, when the bin size is greater than 10, the MP-EST tree based on the binned genes
appears to consistently estimate the wrong tree as the number of bins increases (Figure 2c).
Interestingly, for the simulation parameters studied here, for a bin size of 10, the probability of
the correct tree stabilizes around 0.6, while the probability of an incorrect tree stabilizes around
0.4. Although this result suggests that when the bin size is less than 10, the binning technique
can be beneficial for improving the performance of the MP-EST method in estimating species
tree, additional simulation results suggest that this may not always be the case (not shown).
Further research on naïve binning is needed. We can certainly state that when the bin size is
greater than 10, binning sequences across genes with distinct histories can significantly bias the
distribution of estimated gene trees, and result in inconsistent estimates of species trees.
Ideally, the loci should be concatenated if no or only a few recombination events
occurred between those loci. A model based on biology would suggest that binning should be
based on loci that are closely linked in genomes, such as often occurs in transcriptomes, because
the chance of recombination is positively related to the physical distance between two loci.
Recently, Mirarab et al36 proposed a statistical binning technique which attempts to bin loci with
the same gene tree. In this approach, loci are binned when there are no strongly supported
topological conflicts among the estimated gene trees of those loci, for example when the gene
trees do not conflict on branches with > 75% bootstrap support. However, the statistical
properties of statistical binning are not yet fully explored. As discussed in the previous section,
the assumption of free recombination between genes and no recombination within genes plays a
key role in the coalescent model. Loci are treated as conditionally independent, due to the
assumption of free recombination between genes. Two loci may have the same gene tree even

19
though they are conditionally independent. This may occur, for example, when the species tree
has long internal branches (in coalescent units). When the genes have the same history, binning
their sequences can improve gene tree estimation, but it also reduces the sample size of
independent genes. Thus, from first principles we can state that binning sequences from genes
with the same history may not necessarily improve species tree estimation. In addition, two trees
with no strongly supported conflicts do not necessarily indicate that they are topologically
identical with each other. As we discussed for the naïve binning, combining loci with different
histories may seriously bias the distribution of the estimated gene trees, which in turn will
mislead species tree estimation. In conclusion, further studies are needed to evaluate the
performance of statistical binning.
Information content of genes for species tree reconstruction
Despite the recent arrival of genome-scale Bayesian phylogenetic methods for concatenation 79,
the Bayesian or approximate Bayesian coalescent model cannot presently be applied to
phylogenomic data due to excessive computational burden27,44,80. Alternative gene-tree
approaches, including MP-EST43, GLASS81, Maximum Tree43, STAR46, STEM82, STELLS83,
ASTRAL84 and STEAC46, build species trees from estimated gene trees. These approaches have
computational advantages that allow them to be used for phylogenomic data analyses70 and novel
molecular markers such as ultraconserved elements19,72. Additionally, recent species tree
methods utilizing information from SNPs85,86 and haplotypes87 may be scalable to large data
sets. However, the tree estimates given by gene-tree-based approaches often suffer the problem
of big variance (i.e., low bootstrap support). As these approaches employ bootstrap techniques to
account for errors in estimating gene trees, large estimation error for gene trees can greatly lower
the bootstrap support of the species trees estimated by those approaches (Huang et al 2010).

20
Moreover, these approaches estimate species trees based only on the topologies of gene trees,
ignoring the branch length information, which further reduces the efficiency of those approaches.
The simulation study by Huang et al (2010) suggests that high amount of gene tree estimation
error may be the major cause of low bootstrap support in estimates of species trees using STEM
(Table 1). It has been suggested by empirical studies that using highly supported gene trees
(average bootstrap support value > 0.5) can improve bootstrap support of species trees estimated
by gene-tree-based approaches11,17, and adding poorly supported gene trees (i.e., weak genes)
does not contribute more information regarding the phylogeny of species. We evaluated this
hypothesis through a simple simulation analysis.
To evaluate the effect of weak genes on the performance of gene-tree-based approaches
in estimating species trees, DNA sequences were simulated from the true species tree
((((A:0.002, B:0.02):0.002, (C:0.002, D:0.002):0.002):0.002, E:0.006):0.01, F:0.016) with θ =
0.008. The population size parameter θ is constant across branches of the species tree.
Specifically, gene trees were generated from the species tree under the MSC, again using
Phybase74. DNA sequences were generated from the simulated gene trees under the JC69 model
using SeqGen76 with the Jukes-Cantor model77. We generated 1000 base pairs for ‘strong’ genes,
and 100 base pairs for ‘weak’ genes. The average bootstrap support values of strong genes range
primarily from 70% (first quantile) to 91.75% (3rd quantile) with median = 81.83% (Figure 3a),
whereas the average bootstrap support values for 100 base pair genes are mostly < 50% (Figure
3a). Thus we selected 100 base pair genes with bootstrap values < 50% as weak genes. Species
trees were reconstructed from 10, 20, up to 90 (in increments of 10) estimated gene trees for
strong genes using MP-EST. Each simulation was repeated 100 times. The proportion of trials
estimating the true species tree was 0.33 for 30 strong genes, and it increased to 1 when the
21
number of strong genes was 40 (Figure 3b). However, when adding weak genes to the set of 30
strong genes, the proportion of estimating the true species tree increased slowly to 0.63 and then
decreased to 0.50 (Figure 3b). This result suggests that adding weak genes may not contribute
more information to an otherwise strong data set when estimating species trees. When adding
weak genes, the distribution of estimated gene trees becomes flat, and the coalescent signal
contained in the estimated gene trees is significantly reduced. Thus adding weak genes may
actually reduce the performance of species tree estimation methods, negating the old adage that
“more data is always better”.
Transcriptomes, base composition, and location-aware concatenation
Transcriptomes have formed an important type of data lending itself to species tree estimation.
Because of their ease of alignment and characterization, transcriptomes will continue to be an
important data type for many kinds of phylogenetic analysis. However, because transcriptomes
consist solely of coding regions, they are potential targets of natural selection88. Indeed, genome-
wide phylogenetic comparisons in primates have shown that the rate of ILS in coding regions is
lower than that in non-coding regions88. This higher incidence of reciprocal monophyly and
lower incidence of ILS in coding regions is likely driven by recurrent bouts of positive selection
on coding regions, with surrounding noncoding regions adhering to patterns more consistent with
neutrality. Whether or not this type of departure from the neutral coalescent will be problematic
for species tree analysis is unclear, because by lowering the rate of deep coalescence, natural
selection could help eliminate some of the discordance that is known to decrease phylogenetic
signal in species tree analysis42,89. However, recent genome-wide analyses of avian phylogeny
suggest substantial convergence in protein coding regions, resulting in species trees that are
clearly incongruent with noncoding genomic partitions 12.

22
Transcriptomes are also characterized by strong base compositional biases, and it is well
known that the third positions of nuclear genes can evolve rapidly and become misleading over
long time scales. Departures from base compositional stationarity in phylogenomic data sets
have long been known to cause serious problems for phylogenetic analysis, potentially linking
together lineages that are unrelated but share similar base compositions12,90-92. Variation in base
composition among taxa is known for both transcriptome data and for whole-genome data.
Additionally, it is well known that different subgenomes can possess different base
compositions; for example, coding regions are generally more GC-rich than noncoding regions.
Examination of variation in base composition among lineages and genes as well as saturation
patterns in different data partitions has shed some light on optimal choice of marker for species
tree analyses. For example, Chiari et al.10 showed that species tree analysis of turtle relationships
changed dramatically depending on whether amino acid sequence or nucleotide sequence data
were used to build gene trees, with amino acid data sets providing more congruent results.
Betancur-R et al.8 showed convincingly that substantial apparent gene tree heterogeneity in fish
data sets arises from mis-estimation of gene trees most likely due to base compositional
heterogeneity among lineages. They found that choosing sets of genes with base compositional
homogeneity among lineages substantially reduced the apparent evidence for gene tree
heterogeneity and ILS. While we view this result as significant, we suggest that it does not
invalidate the use of species tree methods or necessarily support supermatrix approaches,
because species tree methods do not require gene tree heterogeneity to work well. A final
example in which base composition plays a role in species tree reconstruction was provided by
Romiguier et al.73, who found that the gene trees in mammals based on GC-rich coding regions
were more heterogeneous than those with an AT-bias. Moreover, the species tree suggested by

23
AT-rich data sets favored the Afrotheria hypothesis, with Afrotheria as the first branch within
placental mammals, whereas those based on the more heterogeneous GC-rich data sets favored
the Atlantogenata rooting, in which Xenartha and Afrotheria are sister groups. These authors
suggested that the way forward was not so much to account for ILS using novel phylogenetic
methods as to reduce its incidence by using particular sets of markers. Again, while we do not
dispute the observation of lower gene tree heterogeneity in AT-rich markers, this does not mean
that supermatrix approaches are necessarily favored. So long as different genes are conditionally
independent from one another due to recombination, we suggest that species tree analysis will
still accumulate phylogenomic signal very differently, and we hypothesize more accurately, than
will concatenation approaches. Species tree approaches are not invalidated by the absence of
ILS; rather they represent a fundamental recognition of the importance of stochasticity from gene
to gene that is unaccounted for by concatenation methods, even when ILS is low or absent.
An important issue in the ongoing discussion of concatenation versus coalescent methods
is whether the location-aware concatenation of exons in transcriptome data is reasonable or
whether it violates the MSC21. Location-aware concatenation occurs when adjacent exons or
genomic regions are concatenated to one another. This type of concatenation has biological
realism in so far as adjacent regions of the genome are known to be correlated in their historical
ancestry, with stretches of chromosomes yielding information suggesting similarity in gene trees
as one moves along the chromosome. On the one hand, transcriptome data has been shown in
multiple studies to yield phylogenetic trees produced by MSC models that are either congruent
with previous results or provide novel hypotheses that are plausible (e.g., turtles, plants). On the
other hand, transcriptome data is indeed ‘concatenated’ by cells when converting pre-mRNAs
into the mature mRNAs that are often used in phylogenomic studies. A key difference between

24
the location-aware concatenation performed by cells and the naïve binning recommended by
Bayzid and Warnow37 is that, in location-aware concatenation, exons that are adjacent to one
another in the genome are concatenated, whereas binning approaches are agnostic as to the
location of binned genes in the genome. Still, exons that are concatenated by cells can still occur
at varying distances from one another in the genome, and may experience levels of
recombination in their history that rivals those experienced by loci located at a distance in the
genome. However, as pointed out by Lanier and Knowles35 point out, recombination will only
be a challenge on extremely short internal branches of the species tree; recombination occurring
on long branches will involve sequences closely related within species and will provide
discordant signal primarily when taking place in common ancestral species. The empirical
effects of varying genomic distance on the variety of observed gene trees needs to be studied in
more detail. Using a variety of statistical methods, several studies, particularly in primates and
rodents, have found a patchwork of gene tree signals in chunks when moving along a
chromosome93-95. Methods for delimiting genomic segments that display consistency of
phylogenetic signal are emerging, and these may prove extremely useful for delimiting loci for
species tree analysis and minimizing the negative effects of recombination. In general, however,
when faced with insufficient signal in a species tree analysis, we advocate increasing the size of
phylogenomic data sets72, rather than pseudoconcatenation or naïve binning as a means of
augmenting signal. Despite the plethora of large-scale phylogenomic studies, empiricists have
not yet exhausted phylogenetic information, and until then, data collection, rather than binning
uninformed by genomic context, should be the method of choice for data augmentation.

25
Computational trade-offs in species tree analysis
In addition to concerns about marker choice and the statistical properties of species tree
estimation methods, another major concern is computational cost. When phylogenomic data
include thousands of genes, the total length of the concatenated sequences will begin to explode,
resulting in an extremely high computation burden when using concatenation methods. For such
data sets, it is practically impossible to perform bootstrap concatenation analyses (with just 100
replicates), or model selection analysis for choosing the best substitution model for the data. For
some cases, it is even challenging to perform a single maximum likelihood analysis for the
concatenated sequences. Recent analyses of genome-scale data have been unable to complete
computation for concatenated date sets, and phylogenetic inferences are often made in the
absence of analyses that have reached convergence or have searched tree space substantively
(e.g., 12,96). Recent advances in computer architecture of phylogenetic analyses may help
alleviate the challenges of analyzing genome-scale supermatrices97. On the other hand, Bayesian
coalescent models27,44 have the same computational issues as concatenated analyses when the
sequence data involve hundreds of genes. Simpler coalescent methods such as MP-EST, STAR,
and STEAC rely on estimated gene trees to infer species trees, and their computational costs are
manageable, even for thousands of genes and species. Of course, as a price for computational
efficiency, gene-tree-based methods suffer low statistical efficiency, in the sense that they often
require more loci to produce a highly resolved tree. In practice, it is extremely difficult to
estimate the sample size for phylogenetic methods such that they can achieve reasonable
bootstrap support for their estimates of the species trees. Clearly the landscape of phylogenetic
methods for genome-scale data, whether for supermatrices or unlinked loci, is rapidly changing.
26
Conclusion
Phylogenetic analysis of genome-scale data inevitably invites the use of methods that
acknowledge the stochasticity of gene histories, and the MSC provides a robust framework for
incorporating the information in this stochasticity. Yet newer methods for analyzing genome-
scale data, relying on supertrees98 or alignment graphs99, will likely yield further insights. The
justification for species tree methods lies not in the ubiquity of gene tree heterogeneity in
empirical data sets, although this heterogeneity has certainly spurred the advent of such methods.
Rather, the justification lies in their acknowledgement of fundamental genetic processes inherent
in all organisms, including recombination along the chromosome, which renders gene histories
independent of one another, conditional on the phylogeny, and genetic drift, which generates
stochasticity in gene tree topologies and branch lengths. Thus, even when all gene trees are
topologically similar, species tree methods will yield results differing from concatenation
methods, if not in phylogenetic topology then often in phylogenetic support, because species tree
methods better model the accumulation of signal that is accrued with increasingly large data sets.
Different methods of species tree inference incorporate different amounts of detail of the
multispecies coalescent process, and there is a trade-off between model accuracy and
computational burden. For now, ‘two-stage’ species tree methods, in which estimated gene trees
are used as input data, are useful in so far as they can analyze large-scale genome-wide data sets
with ease. But more complex and computationally efficient models are sorely needed7.
Although concatenation and species tree approaches often yield similar estimates of phylogeny,
an increasing number of examples of strong conflict between concatenation and coalescent
analyses shows that the conditions for conflict among methods occur in empirical data.
Additionally, concatenation methods appear more sensitive to classic phylogenetic challenges

27
such as long-branch attraction and rate variation among lineages than are gene-by-gene species
tree analyses. Some of the differences in behavior between concatenation and species tree
methods can be understood as manifestations of the classic bias-variance problem in statistics,
because concatenation is a special case of the more general model used by species tree methods,
and therefore can exhibit low variance (such as high tree support) despite being more biased than
species tree approaches. Further studies aimed at understanding the connections between
concatenation and species tree methods and the types of data that maximize signal under the
multispecies coalescent model will allow phylogenetics to take full advantage of the flood of
data in the genomics era.
Acknowledgements
This work was supported by the United States National Science Foundation [DMS- 1222745 to L.L. and DEB-1120243 to C.C.D.].
28
References
1. Hey, J. & R. Nielsen. 2007. Integration within the Felsenstein equation for improved Markov chain Monte Carlo methods in population genetics. Proc Natl Acad Sci USA. 104: 2785-‐2790. 2. Machado, C. A., et al. 2002. Inferring the history of speciation from multilocus DNA sequence data: the case of Drosophila pseudoobscura and close relatives. Mol Biol Evol. 19: 472-‐488. 3. Wakeley, J. & J. Hey. 1997. Estimating ancestral population parameters. Genetics. 145: 847-‐855. 4. Mailund, T., et al. 2012. A new isolation with migration model along complete genomes infers very different divergence processes among closely related great ape species. PLoS Genet. 8: e1003125. 5. Liu, K. J., et al. 2014. An HMM-‐based comparative genomic framework for detecting introgression in eukaryotes. Plos Comput Biol. 10: e1003649. 6. Edwards, S. V. 2009. Is a new and general theory of molecular systematics emerging? Evolution. 63: 1-‐19. 7. Szöllősi, G. J., et al. 2015. The Inference of Gene Trees with Species Trees. Syst Biol. 64: e42-‐e62. 8. Betancur-‐R, R., et al. 2013. Addressing Gene Tree Discordance and Non-‐Stationarity to Resolve a Multi-‐Locus Phylogeny of the Flatfishes (Teleostei: Pleuronectiformes). Syst Biol. 62: 763-‐785. 9. Betancur-‐R, R., G. J. P. Naylor & G. Orti. 2014. Conserved Genes, Sampling Error, and Phylogenomic Inference. Syst Biol. 63: 257-‐262. 10. Chiari, Y., et al. 2012. Phylogenomic analyses support the position of turtles as the sister group of birds and crocodiles (Archosauria). Bmc Biol. 10: 65. 11. Song, S., et al. 2012. Resolving conflict in eutherian mammal phylogeny using phylogenomics and the multispecies coalescent model. Proc Natl Acad Sci USA. 109: 14942-‐14947. 12. Jarvis, E. D., et al. 2014. Whole-‐genome analyses resolve early branches in the tree of life of modern birds. Science. 346: 1320-‐1331. 13. Maddison, W. P. 1997. Gene trees in species trees. Syst Biol. 46: 523-‐536. 14. de Queiroz, A. & J. Gatesy. 2007. The supermatrix approach to systematics. Trends Ecol Evol. 22: 34-‐41. 15. Gatesy, J. & M. S. Springer. 2014. Phylogenetic analysis at deep timescales: unreliable gene trees, bypassed hidden support, and the coalescence/concatalescence conundrum. Mol Phylogenet Evol. 80: 231-‐266. 16. Springer, M. S. & J. Gatesy. 2014. Land plant origins and coalescence confusion. Trends Plant Sci. 19: 267-‐269. 17. Zhong, B. J., L. Liu & D. Penny. 2014. The multispecies coalescent model and land plant origins: a reply to Springer and Gatesy. Trends in Plant Science. 19: 270-‐272. 18. Liu, L., et al. 2009. Coalescent methods for estimating phylogenetic trees. Mol Phylogenet Evol. 53: 320-‐328. 19. McCormack, J. E., et al. 2012. Ultraconserved elements are novel phylogenomic markers that resolve placental mammal phylogeny when combined with species tree analysis. Genome Res. 22: 746-‐754.
29
20. Edwards, S. V., L. Liu & D. K. Pearl. 2007. High-‐resolution species trees without concatenation. Proc Natl Acad Sci USA. 104: 5936-‐5941. 21. Gatesy, J. & M. S. Springer. 2013. Concatenation versus coalescence versus "concatalescence". Proc Natl Acad Sci USA. 110: E1179. 22. Wu, S., et al. 2013. Reply to Gatesy and Springer: the multispecies coalescent model can effectively handle recombination and gene tree heterogeneity. Proc Natl Acad Sci U S A. 110: E1180. 23. Xi, Z., J. S. Rest & C. C. Davis. 2013. Phylogenomics and coalescent analyses resolve extant seed plant relationships. Plos One. 8: e80870. 24. Xi, Z., et al. 2014. Coalescent versus concatenation methods and the placement of Amborella as sister to water lilies. Syst Biol. 63: 919-‐932. 25. Liu, L., Z. Xi & C. C. Davis. 2014. Coalescent methods are robust to the simultaneous effects of long branches and incomplete lineage sorting. Mol Biol Evol. 26. Leache, A. D., et al. 2014. A hybrid phylogenetic-‐phylogenomic approach for species tree estimation in African Agama lizards with applications to biogeography, character evolution, and diversification. Mol Phylogenet Evol. 79: 215-‐230. 27. Liu, L. & D. K. Pearl. 2007. Species trees from gene trees: reconstructing bayesian posterior distributions of a species phylogeny using estimated gene tree distributions. Syst Biol. 56: 504-‐514. 28. Kubatko, L. S. & J. H. Degnan. 2007. Inconsistency of phylogenetic estimates from concatenated data under coalescence. Syst Biol. 56: 17-‐24. 29. Huang, H. T., et al. 2010. Sources of error inherent in species-‐tree estimation: impact of mutational and coalescent effects on accuracy and implications for choosing among different methods. Syst Biol. 59: 573-‐583. 30. Zhong, B., et al. 2013. Origin of land plants using the multispecies coalescent model. Trends Plant Sci. 18: 492-‐495. 31. Lanier, H. C. & L. Lacey Knowles. 2014. Applying species-‐tree analyses to deep phylogenetic histories: challenges and potential suggested from a survey of empirical phylogenetic studies. Mol Phylogenet Evol. in press. 32. Tian, Y. & L. S. Kubatko. 2014. Gene tree rooting methods give distributions that mimic the coalescent process. Mol Phylogenet Evol. 70: 63-‐69. 33. Rosenfeld, J. A., A. Payne & R. DeSalle. 2012. Random roots and lineage sorting. Mol Phylogenet Evol. 64: 12-‐20. 34. Knowles, L. L., et al. 2012. Full modeling versus summarizing gene-‐tree uncertainty: method choice and species-‐tree accuracy. Mol Phylogenet Evol. 65: 501-‐509. 35. Lanier, H. C. & L. L. Knowles. 2012. Is recombination a problem for species-‐tree analyses? Syst Biol. 61: 691-‐701. 36. Mirarab, S., et al. 2014. Statistical binning enables an accurate coalescent-‐based estimation of the avian tree. Science. 346. 37. Bayzid, M. S. & T. Warnow. 2013. Naive binning improves phylogenomic analyses. Bioinformatics. 29: 2277-‐2284. 38. Rannala, B. & Z. Yang. 2003. Bayes estimation of species divergence times and ancestral population sizes using DNA sequences from multiple loci. Genetics. 164: 1645-‐1656. 39. Degnan, J. H. & L. Salter. 2005. Gene tree distributions under the coalescent process. Evolution. 59: 24-‐37.
30
40. Degnan, J. H. & N. A. Rosenberg. 2006. Discordance of species trees with their most likely gene trees. Public Library of Science Genetics. 2: 762-‐768. 41. Kelchner, S. A. & M. A. Thomas. 2007. Model use in phylogenetics: nine key questions. Trends in Ecology & Evolution. 22: 87-‐94. 42. Liu, L., et al. 2009. Estimating species phylogenies using coalescence times among sequences. Syst Biol. 58: 468-‐477. 43. Liu, L., L. Yu & S. Edwards. 2010. A maximum pseudo-‐likelihood approach for estimating species trees under the coalescent model. BMC Evol Biol. 10: 302. 44. Heled, J. & A. J. Drummond. 2010. Bayesian inference of species trees from multilocus data. Mol Biol Evol. 27: 570-‐580. 45. Jennings, W. B. & S. V. Edwards. 2005. Speciational history of Australian grass finches (Poephila) inferred from 30 gene trees. Evolution. 59: 2033-‐2047. 46. Liu, L., et al. 2009. Estimating species phylogenies using coalescence times among sequences. Syst Biol. 58: 468-‐477. 47. Faircloth, B. C., et al. 2012. Ultraconserved elements anchor thousands of genetic markers spanning multiple evolutionary timescales Syst Biol. 61: 717-‐726. 48. Song, S., et al. 2012. Resolving conflict in eutherian mammal phylogeny using phylogenomics and the multispecies coalescent model. Proc. Natl. Acad. Sci. USA. 109: 14942-14947. 49. Zhao, L., et al. 2013. Phylogenomic analyses of nuclear genes reveal the evolutionary relationships within the BEP clade and the evidence of positive selection in Poaceae. Plos One. 8: e64642. 50. Wickett, N. J., et al. 2014. Phylotranscriptomic analysis of the origin and early diversification of land plants. Proc Natl Acad Sci U S A. 111: E4859-‐4868. 51. Weitemier, K., et al. 2014. Hyb-‐Seq: Combining target enrichment and genome skimming for plant phylogenomics. Appl Plant Sci. 2: 1400042. 52. Felsenstein, J. 2003. Inferring Phylogenies. Sinauer Associates, Inc. Sunderland, MA. 53. Felsenstein, J. 1978. Cases in which parsimony or compatibility methods will be positively misleading. Systematic Zoology. 27: 401-‐410. 54. Amborella Genome Project. 2013. The Amborella genome and the evolution of flowering plants. Science. 342: 1241089. 55. Soltis, D. E. & P. S. Soltis. 2004. Amborella not a "basal angiosperm"? Not so fast. American journal of botany. 91: 997-‐1001. 56. Murphy, W. J., et al. 2001. Resolution of the early placental mammal radiation using Bayesian phylogenetics. Science. 294: 2348-‐2351. 57. Murphy, W. J., et al. 2007. Using genomic data to unravel the root of the placental mammal phylogeny. Genome Res. 17: 413-‐421. 58. Thomson, R. C., et al. 2008. Developing markers for multilocus phylogenetics in non-‐model organisms: a test case with turtles. Mol Phylogenet Evol. 49: 514-‐525. 59. Suzuki, Y., G. V. Glazko & M. Nei. 2002. Overcredibility of molecular phylogenies obtained by Bayesian phylogenetics. Proc Natl Acad Sci USA. 99: 16138-‐16143. 60. Misawa, K. & M. Nei. 2003. Reanalysis of Murphy et al.'s data gives various mammalian phylogenies and suggests overcredibility of Bayesian trees. J Mol Evol. 57: S290-‐S296.
31
61. Seo, T. K. 2008. Calculating bootstrap probabilities of phylogeny using multilocus sequence data. Mol Biol Evol. 25: 960-‐971. 62. Hovmoller, R., L. L. Knowles & L. S. Kubatko. 2013. Effects of missing data on species tree estimation under the coalescent. Mol Phylogenet Evol. 69: 1057-‐1062. 63. Driskell, A. C., et al. 2004. Prospects for building the tree of life from large sequence databases. Science. 306: 1172-‐1174. 64. Dunn, C. W., et al. 2008. Broad phylogenomic sampling improves resolution of the animal tree of life. Nature. 452: 745-‐U745. 65. Simmons, M. P. & P. A. Goloboff. 2014. Dubious resolution and support from published sparse supermatrices: The importance of thorough tree searches. Mol Phylogenet Evol. 78: 334-‐348. 66. Lanier, H. C., H. Huang & L. L. Knowles. 2014. How low can you go? The effects of mutation rate on the accuracy of species-‐tree estimation. Mol Phylogenet Evol. 70: 112-‐119. 67. Knowles, L. L. & L. S. Kubatko. 2010. Estimating species trees: An introduction to concepts and models. In Estimating Species Trees: Practical and Theoretical Aspects. Knowles, L. L. & L. S. Kubatko, Eds.: 1-‐14. Wiley-‐Blackwell. New York. 68. Leaché, A. D., et al. 2014. The influence of gene flow on species tree estimation: a simulation study. Syst Biol. 63: 17-‐30. 69. Leaché, A. D. & B. Rannala. 2011. The accuracy of species tree estimation under simulation: a comparison of methods. Syst Biol. 60: 126-‐137. 70. DeGiorgio, M., et al. 2014. An empirical evaluation of two-‐stage species tree inference strategies using a multilocus dataset from North American pines. BMC Evol Biol. 14: 67. 71. Xi, Z., L. Liu & C. C. Davis. 2015. Gene-‐tree-‐based coalescent methods are reliable for species tree estimation. Mol Phylogenet Evol. in review. 72. Lemmon, E. M. & A. R. Lemmon. 2013. High-‐Throughput Genomic Data in Systematics and Phylogenetics. Annual Review of Ecology, Evolution, and Systematics, Vol 44. 44: 99-‐+. 73. Romiguier, J., et al. 2013. Less is more in mammalian phylogenomics: AT-‐rich genes minimize tree conflicts and unravel the root of placental mammals. Mol Biol Evol. doi: 10.1093/molbev/mst116. First published online: June 29, 2013 74. Liu, L. & L. L. Yu. 2010. Phybase: an R package for species tree analysis. Bioinformatics. 26: 962-‐963. 75. Rosenberg, N. A. 2013. Discordance of species trees with their most likely gene trees: a unifying principle. Mol Biol Evol. 30: 2709-‐2713. 76. Rambaut, A. & N. C. Grassly. 1997. Seq-‐Gen: An application for the Monte Carlo simulation of DNA sequence evolution along phylogenetic frees. Computer Applications In The Biosciences. 13: 235-‐238. 77. Jukes, T. H. & C. R. Cantor. 1969. Evolution of protein molecules. In Mammalian Protein Metabolism. Munro, H. N., Ed.: 21-‐123. Academic Press. New York. 78. Guindon, S., et al. 2010. New Algorithms and Methods to Estimate Maximum-‐Likelihood Phylogenies: Assessing the Performance of PhyML 3.0. Systematic Biology. 59: 307-‐321. 79. Aberer, A. J., K. Kobert & A. Stamatakis. 2014. ExaBayes: Massively Parallel Bayesian Tree Inference for the Whole-‐Genome Era. Mol Biol Evol. 31: 2553-‐2556.
32
80. Fan, H. H. & L. S. Kubatko. 2011. Estimating species trees using approximate Bayesian computation. Mol Phylogenet Evol. 59: 354-‐363. 81. Mossel, E. & S. Roch. 2010. Incomplete Lineage Sorting: Consistent Phylogeny Estimation from Multiple Loci. Ieee-‐Acm Transactions on Computational Biology and Bioinformatics. 7: 166-‐171. 82. Kubatko, L. S., B. C. Carstens & L. L. Knowles. 2009. STEM: species tree estimation using maximum likelihood for gene trees under coalescence. Bioinformatics. 25: 971-‐973. 83. Wu, Y. 2012. Coalescent-‐based species tree inference from gene tree topologies under incomplete lineage sorting by maximum likelihood. Evolution. 66: 763-‐775. 84. Mirarab, S., et al. 2014. ASTRAL: genome-‐scale coalescent-‐based species tree estimation. Bioinformatics. 30: i541-‐548. 85. Bryant, D., et al. 2012. Inferring Species Trees Directly from Biallelic Genetic Markers: Bypassing Gene Trees in a Full Coalescent Analysis. Mol Biol Evol. 29: 1917-‐1932. 86. Chifman, J. & L. Kubatko. 2014. Quartet inference from SNP data under the coalescent model. Bioinformatics. 30: 3317-‐3324. 87. Wu, Y. 2014. A coalescent-‐based method for population tree inference with haplotypes. Bioinformatics. 88. Scally, A., et al. 2012. Insights into hominid evolution from the gorilla genome sequence. Nature. 483: 169-‐175. 89. McCormack, J. E., H. T. Huang & L. L. Knowles. 2009. Maximum likelihood estimates of species trees: how ccuracy of phylogenetic inference depends upon the divergence history and sampling design. Syst Biol. 58: 501-‐508. 90. Hedges, S. B., K. D. Moberg & L. R. Maxson. 1990. Tetrapod Phylogeny Inferred from 18s-‐Ribosomal and 28s-‐Ribosomal Rna Sequences and a Review of the Evidence for Amniote Relationships. Mol Biol Evol. 7: 607-‐633. 91. Sharma, P. P., et al. 2012. Phylogenetic analysis of four nuclear protein-‐encoding genes largely corroborates the traditional classification of Bivalvia (Mollusca). Mol Phylogenet Evol. 65: 64-‐74. 92. Breinholt, J. W. & A. Y. Kawahara. 2013. Phylotranscriptomics: saturated third codon positions radically influence the estimation of trees based on next-‐gen data. Genome Biol Evol. 5: 2082-‐2092. 93. Dutheil, J. Y., et al. 2009. Ancestral population genomics: the coalescent hidden Markov model approach. Genetics. 183: 259-‐274. 94. Hobolth, A., et al. 2011. Incomplete lineage sorting patterns among human, chimpanzee, and orangutan suggest recent orangutan speciation and widespread selection. Genome Res. 21: 349-‐356. 95. White, M. A., et al. 2009. Fine-‐scale phylogenetic discordance across the house mouse genome. PLoS Genet. 5: e1000729. 96. Ryan, J. F., et al. 2013. The genome of the ctenophore Mnemiopsis leidyi and its implications for cell type evolution. Science. 342: 1242592. 97. Aberer, A. J., K. Kobert & A. Stamatakis. 2014. ExaBayes: massively parallel bayesian tree inference for the whole-‐genome era. Mol Biol Evol. 31: 2553-‐2556. 98. Steel, M. & A. Rodrigo. 2008. Maximum likelihood supertrees. Syst Biol. 57: 243-‐250. 99. Smith, S. A., J. W. Brown & C. E. Hinchliff. 2013. Analyzing and synthesizing phylogenies using tree alignment graphs. Plos Comput Biol. 9.

33
100. Reid, N., H., et al. 2013. Poor fit to the multispecies coalescent is widely detectable in empirical data. Syst Biol. 63: 322-‐333. 101. Eckert, A. J. & B. C. Carstens. 2008. Does gene flow destroy phylogenetic signal? The performance of three methods for estimating species phylogenies in the presense of gene flow. Mol Phylogenet Evol. in press. 102. Castillo-‐Ramírez, S., et al. 2010. Bayesian estimation of species trees: a practical guide to optimal sampling and analysis. In Estimating Species Trees: Practical and Theoretical Aspects. Knowles, L. L. & L. S. Kubatko, Eds.: 15-‐33. Wiley-‐Blackwell. New Jersey. 103. Huang, H. T. & L. L. Knowles. 2009. What Is the danger of the anomaly zone for empirical phylogenetics? Syst Biol. 58: 527-‐536.

34
Table 1. Studies evaluating the robustness of species tree phylogenetic methods to various genetic forces and sampling schemes.
Topic Reference number Conclusions/comments General violation of multispecies coalescent model
100 Claims the majority of multilocus sequence datasets are a poor fit to the MSC model, although much of the violation stems from fit of substitution model or unknown sources on a minority of genes.
Gene flow 68,101 • The coalescent method is robust to low levels of gene flow • Concatenation performs poorly relative to the coalescent methods in the presence of gene flow. • Gene flow can lead to overestimation of population sizes and underestimation of species divergence times in species trees.
Sampling/mutation 29,69,89 • Increased sampling of individuals
per species can significantly improve the estimation of shallow species trees. • Sampling more individuals does not significantly improve accuracy in estimating deep species trees. Adding more loci can improve the estimation of deep relationships. • Mutational variance is a major source of error in estimates of species trees.
Recombination 35,102 • Recombination has minor effect on species tree estimation except on extremely short species trees. • The negative effect sof recombination can be easily overcome by increased sampling of alleles
Missing data 15,58,62 • Missing data can decrease the support of species tree estimates • Missing data can significantly affect the accuracy of species tree estimation • Species tree methods are “remarkably resilient” to missing data62
Taxon sampling 11 Compared to concatenation, coalescent methods are more robust to poor taxa sampling
Long-branch attraction 25 Species tree methods more resilient to the effects of long-branch attraction than concatenation methods
Random rooting of gene trees 32,33 Misrooting of gene trees can mimic the coalescent process
Other 103 AGTs themselves are unlikely to pose a significant danger to empirical phylogenetic study
35
Figure legends
Figure 1: Inconsistency of the binning technique. a) the species tree used for simulating gene
trees. In this species tree, ((((A:0.01, B:0.01):0.005, C:0.015):0.005, D:0.02):0.08, E:0.1), species
E is used as the outgroup. To reduce the rooting error, we set a small population size θ = 0.01
and a long internal branch (length = 0.08) between ingroup species A, B, C, and D and the
outgroup species E. The population size parameter θ = 0.1 for other ancestral populations in the
species tree. b) The probabilities of two estimated gene trees for binned genes. We consider only
two trees, the matching tree (MT) and the most probable tree (PT). The bars at 0 represent the
true (coalescent) probabilities of MT and PT generated from the species tree under the coalescent
model.
Figure 2: the probability of estimating the wrong and correct species trees without binning. A) In
these simulation parameters, bin sizes of 0 (no binning) or 5 converge on the correct tree. B) For
bin size (BS) 10, the probability of estimating the correct tree is stable around 0.6 as the number
of bins increases. C) In contrast, the probabilities of estimating the wrong species tree for BS =
20, 30, 40, 50 increase to 1 as the number of bins increases.
Figure 3: The effect of non-informative genes on the performance of gene-tree-based approaches
in estimating species trees. DNA sequence data were simulated from the true species tree. The
sequences of 1000 base pairs were generated for strong genes, while 100 base pairs were
generated for weak genes. a) the species tree used in the simulation. b) the boxplot of the
average bootstrap values for weak and strong genes. c) the effect of different numbers of strong

36
and weak genes on the performance of MP-EST in estimating species trees. See text for further
explanation.
!
!
!
!!A!!!!!!!!!!B!!!!!!C!!!!!!!D!!!!!!!!E! !!A!!!!!!!!!!B!!!!!!C!!!!!!!D!!!!!!!!E! !!A!!!!!!!!!!B!!!!C!!!!!!!!!D!!!!!!!!E!!!!!!species!tree!(ST)!!!!!!!!!!!!!!!!!!!!!!matching!tree!(MT)!!!!!!!!!!!!!!most!probable!tree!(PT)!
Figure 1

0"
0.2"
0.4"
0.6"
0.8"
1"
100" 200" 400" 600" 800" 1000"the
prob
abili
ty o
f est
imat
ing
the
corr
ect s
peci
es tr
ee
number of bins
BS=0%BS=5%
!
Figure 2

!
a
we 20
40
60
80
10
0
weak strongspecies tree
a) b) c)
Pro
po
rtio
n o
f th
e t
rue
sp
ec
ies t
ree
number of genes
strong genes weak genes
Figure 3
Top Related