


Languages
Pages
Legal

1
ESS Linac Design Options
Dave McGinnis 29 March 2013
1 Executive Summary
1.1 Motivation The original design of the ESS Linac (2008 Baseline) was 1 GeV linac with a peak beam current of 150
mA. Forty percent of the energy gain was provide by normal conducting accelerating structures. At
the beginning of the Accelerator Design Update (ADU), it was recognized that the beam current of
150 mA introduced considerable technical risk. Subsequently, in ADU, the beam current was reduced
to 50 mA and the Linac energy increased to 2.5 GeV to compensate. Because of higher gradients,
lower operational costs, and larger apertures provided by superconducting accelerating structures, it
was decided in ADU that 98% of the ESS Linac would be superconducting. These features are
reflected in the 2012 Baseline.
Although the 2012 Baseline has lower technical risk than the 2008 Baseline, it has an inherently
higher construction cost because of the higher energy (but lower beam current) which requires a
significantly longer linac with more accelerating structures of which a larger fraction are
superconducting.
The equipment, services, and installation cost objective of the ESS linac is 497 M€ which is based on
the cost estimate of the 2008 Baseline. This objective was provided in October of 2012. The current
cost estimate of the 2012 Baseline is 589 M€. The only way to meet the cost target is to modify the
2012 Baseline design by adding technical risk or increasing the cost target. This note examines
various design options for meeting the cost objective while having minimal impact on schedule and
design work that has already occurred.
1.2 Cost Reduction Strategy The cost drivers of the ESS linac are the superconducting cryomodules and the associated RF systems
that provide power to the beam. For the same beam power the number of cryomodules can be
reduced by a combination of the following
Increasing the beam current and lowering the energy of the linac.
Increase the accelerating gradient by increasing the maximum allowable peak surface field in
the superconducting cavities.
Optimizing the cavity voltage profile for maximum energy gain
Increasing the pulse length and lowering the energy of the linac at the expense of peak beam
power.
1.3 Evaluation To evaluate performance as a function of cost reduction, four different linac configurations where
evaluated. These configurations are:

2
1. 2012: The October 2012 baseline that includes 15 medium beta cryomodules and 30 high
beta cryomodules
2. Prius: Includes a 22% increase in beam current, 10% increase in peak surface field, and a
maximized voltage profile which results in requiring only 7 medium beta cryomodules and 24
high beta cryomodules. A uniform focusing period cell length in the medium and high beta
sections is used which would permit interchange of cryomodules of different betas in the
future.
3. Smart: The same parameters as the Prius but with 6 cell medium beta cavities. One less high
beta cryomodule is required. The six cell medium beta cavities are 93% of the length of the
five cell high beta cavities which could make much of the design of the high beta and the
medium beta cryomodules similar.
4. Yugo: The same as the Smart but with an 18% increase in pulse length (and a corresponding
decrease in peak beam power). The lattice requires 7 medium beta cryomodules and 18 high
beta cryomodules.
Parameter 2012 Prius Smart Yugo Units
Beam Current 50 61 61 61 mA Pulse Length 2.86 2.86 2.86 3.38 mS Rep. Rate 14 14 14 14 Hz Energy 2491 2116 2077 1731 MeV Average Power 4.99 5.17 5.07 5.0 MW Peak Power 125 129 127 106 MW Number of elliptical cryomodules 45 31 30 25 Linac Length 436.3 340.3 332.4 292.7 meters
Linac Cost 586 511 506 481 M€
Table 1. Summary of different ESS linac configurations
1.4 Comments on Risk
1.4.1 Technical Risk
Technical risk results from any issue that prevents the ESS linac from achieving 5 MW of average
beam power. There are three main issues
1. Emittance growth due to the increased beam current. Increased space charge forces could
result in emittance growth and halo generation. Too much halo will irradiate tunnel
components to a point in which they need to be replaced or cannot be maintained. The
proposed increase in current of 22% over the 2012 technical design is probably not
significant enough to be of a concern. Finally, since the ESS linac does not have to inject into
a ring, the requirements on beam quality (e.g. beam emittance) can be relaxed. This is
especially true if the beam expansion system for the target is based on raster scanning of the
beam on the target.
2. Lower cavity yield due to increase requirements on higher average accelerating field. The
proposed increase on the peak surface field to 44 MV/meter in the superconducting cavities
might be more difficult to achieve than the 40 MV/meter in the 2012 design. However, the
value of 40-44 MV/meter for peak surface field is rather conservative as compared to many
other superconducting accelerators that are being built such as XFEL (50 MV/meter) or are in
the planning stages facilities such as SPL and the ILC. The need for ultra-high quality factors

3
required in such facilities as in Project X, FRIB, and XFEL are not important for the ESS linac
because of the low duty factor of the ESS linac.
3. Halo Formation due to discontinuities in the transverse and longitudinal phase advance. A
significant fraction in the reduction in the number of cryomodules arose from maximizing the
voltage profile along the linac. This resulted in a 15% increase in transverse emittance. This is
a small increase in comparison to the available aperture and is not likely to be noticed at the
target station. The experience at SNS has shown that a smooth lattice is not required for high
intensity operations.
1.4.2 Schedule Risk
Schedule risk results from any issue that prevents the ESS linac from providing beam by 2019. The
propose changes in this note might actually accelerate the schedule. The main possibilities for this
acceleration are:
1. The production of cryomodules and the associated RF station are not only cost drivers but on
the critical path for the entire program as well. This note proposes to remove at least 15
cryomodules out of 45 from the 2012 design. This will greatly reduce the production time
and since the cryomodules are installed serially, the installation period of the linac will be
shortened.
2. The specifications for the tender for the prototype of the klystrons and klystron modulators
have not been initiated. Therefore, there is no delay for the RF systems.
3. This note will show that to minimize the number of cryomodules the high beta cavities with a
geometrical beta of 0.86 is superior to the choice of 0.92 that is in the 2012 design. There is
no design for the 0.92 cavities. There exists only the design of 0.86 cavities and prototypes of
these cavities are in the process of fabrication. Thus the choice geometrical beta of 0.86
proposed in this note not only reduces the number of cryomodules but actually accelerates
the schedule.
4. This note proposes a uniform focusing cell length both the medium and high beta cavities so
that the cryomodules could be interchangeable and possibly identical. The note also
proposes 6 cell medium beta cavities that would be close to the same length of the high beta
cavities. If 6 cell medium beta cavities are practicable, then the medium beta and high beta
cryomodules could be identical. This would reduce the prototyping schedule (and cost)
significantly because only one type cryomodule prototype would need to be constructed.
Note that prototypes of each type of cavity string will still need to be constructed.
1.4.3 Cost Risk
Cost risk results from any issue that prevents the ESS linac construction from being on budget. The
main focus of this note was to reduce cost. Cost models were used to predict the increased cost of
having other systems provide more power because of the reduction in number of cryomodules. It
could be possible that these models are inaccurate or not precise enough to forecast the actual cost
savings. In addition, the cost implications on the cryomodules where not looked at the same depth as
the investigation of RF sources.
It should be noted that there were some areas discounts on costs for the proposed changes were not
taken. Chiefly among these was:
the reduced manufacturing costs of having only one cryomodule design

4
the reduced tunnel and gallery construction costs of having a uniform lattice cell length.
However, this note does not propose any drastic technology change so the risks in increased cost are
mostly the same as for the 2012 design.
5
Contents 1 Executive Summary ......................................................................................................................... 1
1.1 Motivation ............................................................................................................................... 1
1.2 Cost Reduction Strategy .......................................................................................................... 1
1.3 Evaluation ................................................................................................................................ 1
1.4 Comments on Risk ................................................................................................................... 2
1.4.1 Technical Risk .................................................................................................................. 2
1.4.2 Schedule Risk ................................................................................................................... 3
1.4.3 Cost Risk .......................................................................................................................... 3
2 Motivation ....................................................................................................................................... 6
3 Design Drivers .................................................................................................................................. 6
4 Design Evolution .............................................................................................................................. 7
4.1 2008 Design ............................................................................................................................. 7
4.2 2012 Design ............................................................................................................................. 8
5 Cost Drivers ..................................................................................................................................... 9
6 Design Options .............................................................................................................................. 10
6.1 Increasing the Duty Factor .................................................................................................... 11
6.1.1 Modulator Cost Model .................................................................................................. 11
6.1.2 Klystron Cost Model ...................................................................................................... 11
6.1.3 Cryogenic System Cost Model ....................................................................................... 12
6.1.4 Example Analysis ........................................................................................................... 13
6.2 Increasing the Peak Surface Field .......................................................................................... 13
6.3 Increasing the Peak Beam Current ........................................................................................ 13
6.4 Adjusting the Power Profile of the Linac ............................................................................... 14
6.5 Choice of Geometrical Beta ................................................................................................... 15
6.6 Lattice Cell Length ................................................................................................................. 18
6.7 Lattice Performance .............................................................................................................. 19
7 Summary ....................................................................................................................................... 24
8 Comments on Risk ......................................................................................................................... 25
8.1 Technical Risk ........................................................................................................................ 25
8.2 Schedule Risk ......................................................................................................................... 26
8.3 Cost Risk ................................................................................................................................ 27

6
2 Motivation The original design of the ESS Linac (2008 Baseline) was 1 GeV linac with a peak beam current of 150
mA. Forty percent of the energy gain was provide by normal conducting accelerating structures. At
the beginning of the Accelerator Design Update (ADU), it was recognized that the beam current of
150 mA introduced considerable technical risk. Subsequently, in ADU, the beam current was reduced
to 50 mA and the Linac energy increased to 2.5 GeV to compensate. Because of higher gradients,
lower operational costs, and larger apertures provided by superconducting accelerating structures, it
was decided in ADU that 98% of the ESS Linac would be superconducting. These features are
reflected in the 2012 Baseline.
Although the 2012 Baseline has lower technical risk than the 2008 Baseline, it has an inherently
higher construction cost because of the higher energy (but lower beam current) which requires a
significantly longer linac with more accelerating structures of which a larger fraction are
superconducting.
The equipment, services, and installation cost objective of the ESS linac is 497 M€ which is based on
the cost estimate of the 2008 Baseline. This objective was provided in October of 2012. The current
cost estimate of the 2012 Baseline is 589 M€. The only way to meet the cost target is to modify the
2012 Baseline design by adding technical risk or increasing the cost target. This note examines
various design options for meeting the cost objective while having minimal impact on schedule and
design work that has already occurred.
3 Design Drivers While considering different design options it is important to keep in mind the chief requirements of
the ESS Linac. For large neutron flux, an average proton beam power of 5 MW is required. To explore
rare processes with neutrons, a large peak proton beam power of 125 MW is needed. Finally to
satisfy the tight schedule requirements of the facility users, an availability of 95% is desired. (In this
note, availability will be defined as the ratio between the mean time to failure to the sum of the
mean time to failure and the mean time to repair.)
The ESS facility is based on the long pulse concept. The long pulse concept does not require the
typical compressor storage ring found in many other spallation sources and permits a very flexible
design strategy that could not be considered in compressor ring based spallation source. To
understand this inherent flexibility of the long pulse concept, a few of the constraints imposed by a
compressor ring will be examined.
Due to the phenomenon of space charge tune shift, the amount of beam that can be stored
in a compressor ring is approximately inversely proportional to the square of the energy at
the proton beam energies of interest. Without the need of a compressor ring, the ESS linac
can provide the design peak current at almost any energy to the neutron production target.
This flexible requirement of beam energy provides many avenues of staging the construction
of the linac.
In addition, since the ESS linac does not have to inject into a ring, the requirements on beam
quality (e.g. beam emittance) can be relaxed. This is especially true if the beam expansion
system for the target is based on raster scanning of the beam on the target.

7
Finally, a compressor ring requires the acceleration of H- ions so that the linac beam can be
merged with the circulating beam in the compressor ring. The acceleration of H- ions
produces beam loss in the linac due to intra-beam stripping of the H- ions. Also injection
losses on the required injection stripping system can be a dominant limitation for the
intensity in a compressor ring. These loss mechanisms will be completely absent in the ESS
design.
However, the disadvantage of the long pulse concept from an accelerator design point of view is that
the user requirements of pulse length and repetition rate are imprinted on the linac beam structure.
The duty factor of the ESS linac, which is defined as the product of the beam pulse length and the
linac repetition rate, is 4%. This number yields rather high operational costs for a normal conducting
linac. Conversely, the duty factor of 4% is rather small for a superconducting linac to provide
significant operational cost savings in contrast to the larger construction costs.
4 Design Evolution
4.1 2008 Design The current ESS linac design has evolved significantly over the years. Since the current cost targets
are based on cost estimates of these previous designs, it is worthwhile to examine the tradeoffs on
the linac design that have already been decided. Figure 1 shows a schematic of the 2008 design that
was the basis for the current ESS site selection. This design is a 1 GeV linac with a 3.3% duty factor
(16.6 Hz repetition rate and 2.0 mS pulse length). The linac is normal conducting to 400 MeV and
superconducting for the remaining 600 MeV. To obtain an average beam power of 5 MW, an intense
peak beam current of 150 mA is required. The resulting peak beam power is 150MW. The large beam
current is provided by two sources that are merged in a funnel system at 20 MeV. The
superconducting accelerating cavities operate at frequency of 1.3 GHz. At this high frequency, the
bore radius of the superconducting cavities is 3.5 cm. The average accelerating gradient of the
superconducting part of the linac is 12 MV/meter. With the relative low accelerating gradient and
duty factor, the dynamic heat load of the superconducting part of the linac is 25% of the total
cryogenic heat load.
The radio frequency (RF) power sources of the superconducting section feed two superconducting
cavities for each klystron as shown in Figure 2. This produces a significant cost savings at the risk of
requiring 1.8 MW peak and 60 kW average powers in the cavity couplers. The very large accelerating
gradients available in superconducting cavities cause the cavities to de-tune via electromagnetic
radiation pressure on the walls of the cavities (Lorentz detuning). Since the pulse length is about a
factor of two larger than the Lorentz detuning time constant of the superconducting cavities, the
individual performance of the cavities in a pair would have to be very close to identical.
8
Figure 1. 2008 Design of the ESS Linac
Figure 2. RF coupling concept for the superconducting section of the 2008 ESS Linac design
4.2 2012 Design The 2012 design made a number of substantial changes to enhance the availability of the ESS facility.
A significant feature of the 2008 design is the very high peak current of 150 mA that was required to
obtain the 5 MW average beam power. This large beam current could exacerbate beam loss via
space charge blowup of the emittances in the low energy section of the linac. The large beam loss
might preclude the required beam power which is the hallmark of the ESS facility. The space charge
can be partially ameliorated by having two lower current sources but with the added complication of
the combining the sources in a funnel section.
In the 2012 design, the beam current was reduced by a factor of three to a more manageable level of
50 mA. However, to compensate the decrease in beam current, the energy of the linac has to be
raised to 2.5 GeV. Since the operational cost of normal conducting accelerating cavities is much
higher than superconducting cavities, the 2012 design is 98% superconducting with only the first 80
MeV of the linac composed of normal conducting cavities. Since it has been observed that the
Lorentz detuning properties can vary significantly from cavity to cavity, the 2012 design takes a more
conservative approach to Lorentz detuning compensation. In the 2012 design, individual RF power
sources are required for the regulation of the accelerating field in each cavity.
9
In addition, the resonant frequency of the superconducting linac in the 2012 design is 352.21 and
704.42 MHz. The lower frequency permits a much larger beam pipe bore radius of 6 cm which is
almost double bore radius of the 2008 design. With the large aperture and a factor of three
reduction in beam current, much lower beam loss is expected in the 2012 design.
Finally, the maximum accelerating gradient in the 2012 design is 18 MV/meter compared to
12MV/meter for the 2008 design. The increase gradient makes more efficient use of RF sources
reduces tunnel length. In addition, for the same cavity quality factor, the higher gradient raises the
dynamic heat load to static heat load for more efficient use of the cryogenic system.
Figure 3. ESS Cost Distribution as of October 2012
Figure 4. RF System Cost Distribution
Figure 5. Cost breakdown for 704 MHz Elliptical
RF systems
Figure 6. Cost breakdown for high beta
cryomodule system.
5 Cost Drivers Figure 3 shows the distribution of costs for the major systems for the 2012 ESS linac design as of
October 2012. The main cost driver is the RF systems which comprise 37% of the cost. In second
place, the 704.42MHz elliptical cryomodules occupy 19% of the cost and in third place; the cryogenic
plant absorbs 14% of the total cost. The RF costs are distributed over five major systems as shown in
Figure 4. The 704 MHz elliptical section comprises 82% of the RF system cost. The cost break down
for the RF systems for the 704.42MHz elliptical section of the linac is shown in Figure 5. The high

10
power RF amplifiers (klystrons in this case) and the power convertor that energizes the amplifiers
(modulators) comprise 80% of the RF system cost. Figure 6 shows the cost distribution for a high beta
cryomodule. The cost of a single high beta cryomodule along with the associated RF systems
accounts 1.2% of the total cost of the linac.
6 Design Options There is always uncertainty in cost estimates, especially in such a complex project as the ESS linac. To
reduce this uncertainty, prototyping some of the major cost drivers such as the cryomodules,
klystrons, and modulators has started. In addition, the linac design should be examined to identify
possible sources of design contingency that will cope with market fluctuations and design alterations
as a result of prototype results for the major cost drivers.
The primary figure of merit of the ESS linac is average beam power. The average beam power, <Pb>,
is the product of the peak beam power, Pbpk, and the duty factor, D. The duty factor is the product of
the pulse length, p, and the repetition rate, fr.
⟨ ⟩ (1)
The equation for peak beam power can be written to emphasize the different design options for the
superconducting section of the linac:
( ∑(
( ))
) (2)
where Ib is the peak beam current, EFE is the energy of the normal conducting front end linac, q is the
charge of a proton, N is the number of superconducting cavities, Epk is the maximum surface electric
field in the superconducting cavities, EaccT is the acceleration gradient including the transit time
factor T along the beam axis for a cavity, and Mcell is number of cells in a cavity, g is the geometrical
beta of the cavity, is the RF wavelength in the cavity, and s is the synchronous phase.
Reducing the number of superconducting cavities will have the largest impact on cost and design
contingency because each cavity that is removed from the design not only removes the cost of the
cavity but also removes the need (and cost) for the RF power sources that feed the cavity. Therefore,
the design contingency strategy will hold the average beam power constant while looking for
avenues to minimize the number of superconducting cavities. Examining Equations 1 and 2, the
different options to decrease the number of superconducting cavities is to increase a combination of
the following list:
duty factor, D
peak surface field, Epk
peak beam current, Ib
average value of EaccT sum by adjusting the power profile
ratio of EaccT/Epk by appropriate choice of g
energy of the front end linac, EFE

11
6.1 Increasing the Duty Factor As discussed earlier, the choice of a superconducting linac becomes obvious as the duty factor
increases. Additionally, from an accelerator design point of view, increasing the duty factor has the
least impact on the configuration of the accelerator. As the duty factor is increased by either
increasing the pulse length or the repetition rate, the final energy of the linac can be decreased and
still provide the same average beam power.
6.1.1 Modulator Cost Model
When the duty factor is increased, the remaining RF systems need to provide more RF power to
compensate for the higher duty factor. The increase in RF power will incur additional cost due to
such factors as requiring larger capacitor banks in the klystron modulators, more powerful switch
assemblies in the modulators, larger klystron cathodes and collectors, etc. Simple cost models for the
RF systems have been developed to give a feel on how much impact an increase in RF power will
have on cost. A major cost driver for the RF systems is the klystron modulators. There are many
different configurations of klystron modulators and the cost scaling of a klystron modulator will
depend on the particular topology. Table 2 and Equation 3 demonstrate a simple scaling model for a
solid state bouncer modulator where C(P) is the cost at power level P and CPo is the cost at the
reference power Po.1
Modulator Part Symbol Cost (%) Power Factor
Capacitor Charger Rcc 30 1
Capacitor Banks Rcb 5 1
Solid State Switch Rss 15 0.33
Transformers Rxt 15 0.67
Cabinets & Controls Rcab 10 0
Assembly & testing Rat 25 0 Table 2. Cost Coefficients for Solid State Bouncer Klystron Modulator
( ) (
(
)
(
)
)
(3)
6.1.2 Klystron Cost Model
Since there are very few klystron vendors, the cost models for the klystron are much vaguer and
klystron costs can be the result of many other intangible variables such as market conditions. A
sample of klystron costs is shown in Figure 72. Also for a given frequency and power range, the cost
of a klystron is fairly insensitive to power. Based on a sampling of a few vendors a simplified cost
model [2] for a 704 MHz klystron is:
( ) (
)
(4)
Where CPo is the cost of the klystron at power level Po.
1 “Cost Model of Long Pulse and high Voltage Klystron Modulators”, Carlos Martins, August 2012
2 “Simple cost Model: Klystrons”, Anders Sunesson, October 2012

12
Figure 7. Klystrons costs as a function of peak power.
6.1.3 Cryogenic System Cost Model
Neglecting the fill and fall time of the cavity in long pulse operation, a simple expression for the
power dissipated in the walls of a superconducting cavity n is:
(
)
(5)
where Qo is the internal quality factor of the cavity and
is the accelerating shunt impedance
of the cavity. Comparing Equation 5 to Equation 1, the power dissipated in the walls for cavity n is:
( )
( ) (5)
Summing over all the cavities,
⟨ ⟩ (5)
where Pd is the total amount of power lost in the superconducting linac. Since the average beam
power is to be kept constant, the total dynamic heat load of the cryogenic system will be constant if
the ratio of Epk to Ib is kept constant. In fact it will be shown later that it will be advantageous to
decrease this ratio. In addition, reducing the number of cryomodules will decrease the total static
heat load, but a conservative approach would be to not to take credit for the reduction in the static
heat load. It will be assumed that the cost cryogenic cooing plant will be independent of small
changes in the duty factor.
As the duty factor is increased, the dynamic heat load on a given cryomodule will increase and the
cryogenic cooling of the cryomodule will have to be increased. However at the design duty factor of
4%, the dynamic heat load of a cryomodule is about two thirds the total heat load. This ratio will
temper the increased the cost of additional cooling for an individual cryomodule.
13
6.1.4 Example Analysis
Increasing the duty factor for a given average beam power will decrease the peak proton beam
power with a corresponding decrease in peak neutron flux. A decrease in peak neutron flux is
probably undesirable from a user point of view. However, because of the simplicity of this scenario, it
is worthwhile to examine the effects on cost of increasing the duty factor. This section will examine
the example scenario of increasing the duty factor from 4.0% to 4.8%. To increase the duty factor by
this amount, the pulse length can be increased from design value of 2.86 mS to 3.4ms. An increase of
pulse length of this magnitude would decrease the peak neutron flux by 20%.
For the current baseline design documented in the ESS Technical Design Report (TDR), the energy
gain per cryomodule is 68.7 MeV averaged over the last ten cryomodules. Thus six cryomodules can
be removed and the final energy of the linac reduced from 2500 MeV to 2087 MeV. The amount of
RF power in the remaining cryomodules will have to increase by 20% to compensate for the larger
duty factor. Using the cost models described above, the cost of the remaining modulators will
increase by 10% and the cost of the klystrons will increase by 2.6%. The effective cost of a
cryomodule system (cryomodule + RF) increases by 3.2%. This increase in cryomodule cost must
subtracted from the cost savings of removing the six cryomodules. Thus only 82% of the cost of the
six cryomodules removed is recovered in cost savings. In summary, increasing the pulse length by
20% reduces the cost of the linac by 5.9%.
6.2 Increasing the Peak Surface Field In the October 2012 baseline design for the ESS linac, the accelerating gradient in the 704 MHz
elliptical superconducting cavities was limited to so as not to exceed a peak surface field of 40
MV/meter. This rather conservative limit was set to ensure a high yield in the manufacturing of the
cavities. However, many other superconducting linacs are designed for substantially higher surface
fields of 50 MV/meter or higher. If the limit on the maximum surface field was increased by 10% to a
value of 44 MV meter, then three high beta cryomodules could be removed and still have the output
energy of the linac exceed 2500 MeV. With this higher accelerating gradient, the 10% more RF power
would be required by the remaining RF sources which would increase the cost of the modulators by
5% and the cost of the klystrons to increase by 1.3%. However 81% of the cost of the removed
cryomodules and RF systems could be recovered to provide a cost reduction of almost 3% for the
entire linac. The advantage to the cost reduction strategy is that the peak beam power remains
unchanged.
6.3 Increasing the Peak Beam Current In the October 2012 baseline design for the ESS linac, the peak beam current was limited to 50 mA.
Because the ESS linac accelerates protons instead of H- ions, substantially higher beam current
sources are available. Increasing the beam current would permit a reduction in the energy of the
linac and still provide the same average and peak beam power. However, increasing the beam
current can cause emittance increase due to higher space charge forces.
In addition to a the higher acceleration gradient proposed in Section 6.2, increasing the beam current
will require more peak power from the RF sources. The couplers on the elliptical 704 MHz cavities
have been tested to 1200 kW of peak power. It is unknown whether substantially higher peak RF
power in the couplers can be tolerated. In the October 2012 baseline design, the peak RF power is
860 kW. Increasing the accelerating gradient by 10% would leave margin of 25% in the peak RF
14
power to not exceed 1200 kW. In this section an increase in beam current of 10% to 55 mA will be
considered in addition to the increase of peak surface field to 44 MV/meter already discussed in
Section 6.2. This would provide a maximum power in the RF coupler of 1040 kW which gives 13% of
headroom in the maximum power rating of 1200 kW in the couplers.
With a peak surface field of 44MV/ meter and a beam current of 55 mA, six cryomodules can be
removed from the baseline configuration and still achieve an average beam power of 5 MW and a
peak beam power of 125 MW. The energy of the linac is reduced from 2500 MeV to 2300 MeV. The
amount of RF power in the remaining cryomodules increases by 21% which raises the cost of the
modulators by 10% and the cost of the klystrons by 2.7%. However 81% of the cost of the removed
cryomodules and RF systems could be recovered to provide a cost reduction of almost 5.8% for the
entire linac.
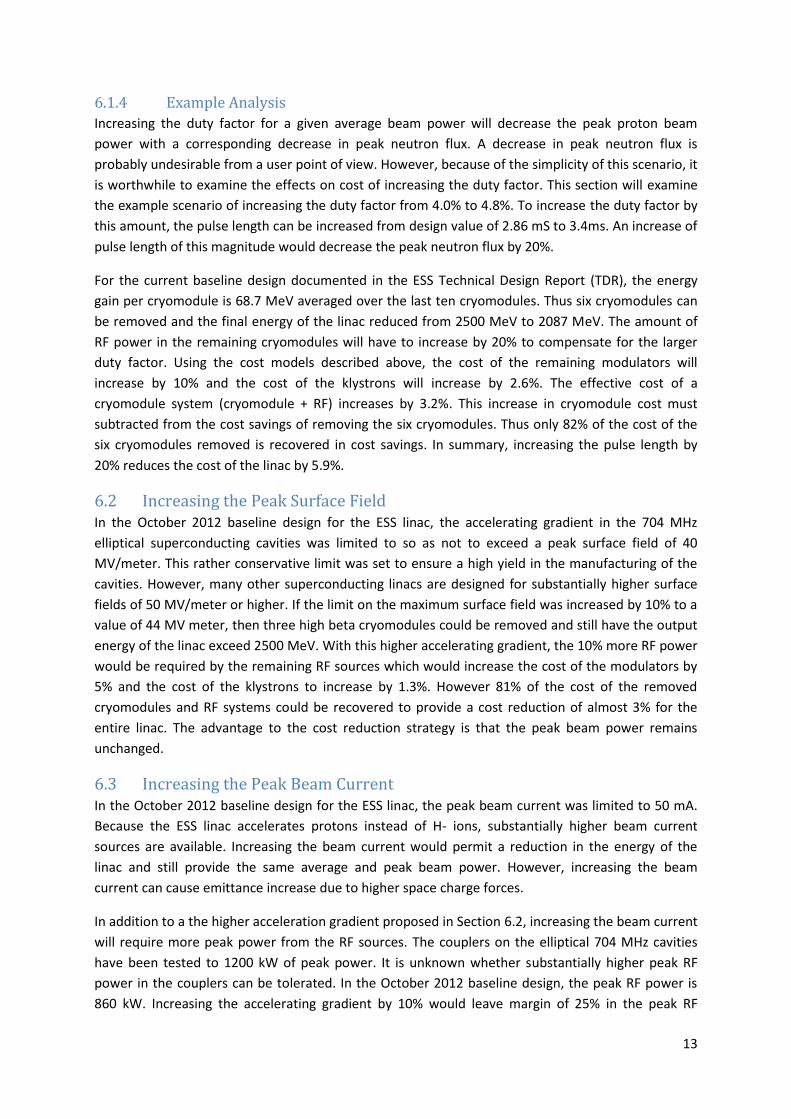
6.4 Adjusting the Power Profile of the Linac The cavity voltage profile for the superconducting section of the ESS linac as published in the TDR is
shown in “Oct 2012 Baseline” trace in Figure 8. The maximum voltage permitted for a 5 cell elliptical
cavity with a g of 0.92, a maximum surface field of 40 MV/meter with an Epeak/Eacc ratio of 2.13 is
represented with “Maximum Voltage” trace. There is an inconsistency in which the design voltage
profile exceeds the maximum value for the middle of the high beta section. The profile shown in
“Adjuster Oct 2012” trace rectifies this inconsistency and as a result the final energy of the linac is
reduced from 2523 MeV to 2491 MeV.
Examining the adjusted cavity voltage profile, the design voltage is substantially lower than the
maximum voltage permitted at the beginning of the medium beta and high beta sections. The reason
for this reduction is the lattice matching between preceding sections of the linac where a smooth
longitudinal phase advance per cell is desired. The goal of smooth phase advance is to produce a
lower longitudinal and transverse emittance. As noted earlier this note, the ESS linac sends the beam
directly to the target and does not inject into a compressor ring. Also, there is an effort underway to
study a raster scanning system for the beam on target to replace the current octopole beam
expansion system outlined in the TDR. Then, the only issue facing larger emittance is halo generation
and beam loss. It is not always clear that larger emittance produces more halo. In fact, a large
emittance reduces space charge forces and halo generation could in fact be smaller with a larger
emittance beam. Thus, the requirements on beam emittance could be relaxed.
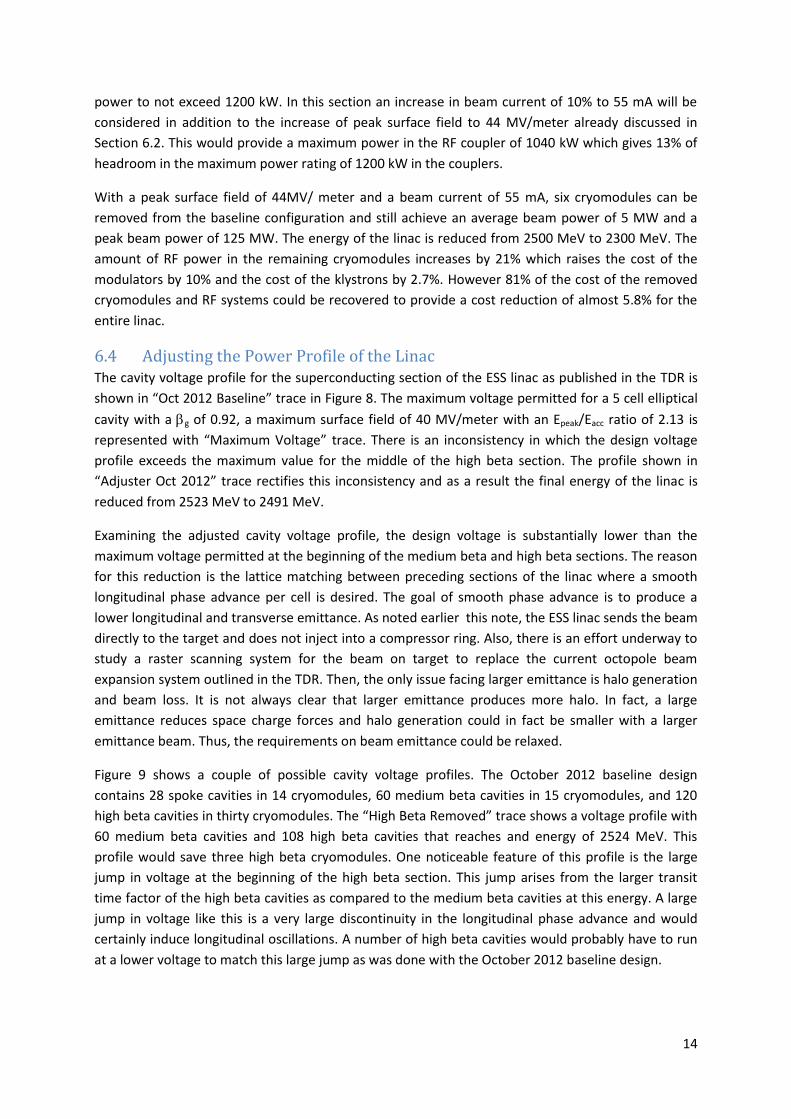
Figure 9 shows a couple of possible cavity voltage profiles. The October 2012 baseline design
contains 28 spoke cavities in 14 cryomodules, 60 medium beta cavities in 15 cryomodules, and 120
high beta cavities in thirty cryomodules. The “High Beta Removed” trace shows a voltage profile with
60 medium beta cavities and 108 high beta cavities that reaches and energy of 2524 MeV. This
profile would save three high beta cryomodules. One noticeable feature of this profile is the large
jump in voltage at the beginning of the high beta section. This jump arises from the larger transit
time factor of the high beta cavities as compared to the medium beta cavities at this energy. A large
jump in voltage like this is a very large discontinuity in the longitudinal phase advance and would
certainly induce longitudinal oscillations. A number of high beta cavities would probably have to run
at a lower voltage to match this large jump as was done with the October 2012 baseline design.
15
Figure 8. October 2012 Baseline Cavity Voltage. The blue diamonds is the cavity voltage profile as published in the TDR. The red squares are the maximum voltage permitted for a 5 cell elliptical cavity
with a g of 0.92 and a maximum surface field of 40 MV/meter. The green triangles are the adjusted profile that does not exceed the maximum limit.
It is clear in the “High Beta Removed” trace in Figure 9 that at the transition between medium to high
beta sections, the high beta cavities can produce substantially more voltage. As shown in Section 6.1,
the cost of producing the extra voltage is weak function of the extra power required. Thus, as long as
the impedance of the cavity mode is dominant over a given energy range, it makes economic sense
to remove the lower voltage medium beta cavities in favor of the high beta cavities at the transition.
The trace with “Med. Beta Removed” is a possible voltage profile in which 12 medium beta cavities (4
cryomodules) have been removed and an energy of 2510 MeV can still be achieved. This solution has
the advantage that no cavities need to be sacrificed for providing a matching section between the
medium and high beta sections.
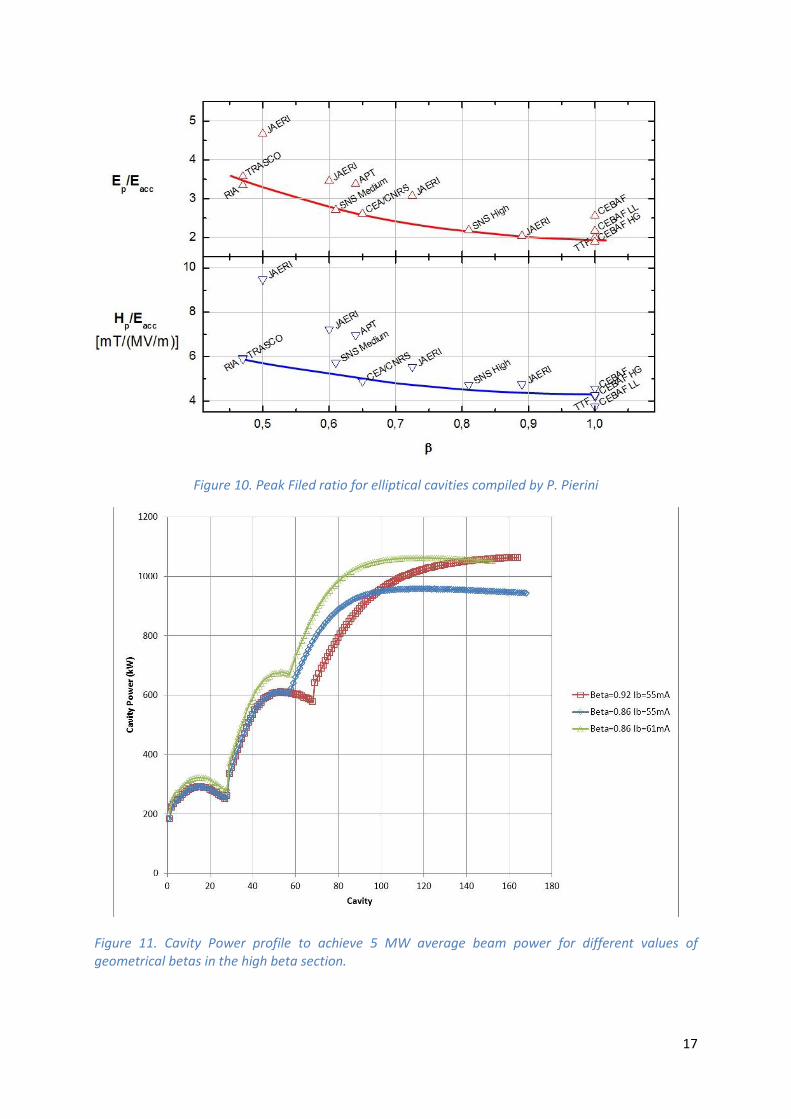
6.5 Choice of Geometrical Beta At an energy of 2500 MeV, the beam beta is 0.96. In the October 2012 baseline, the high beta
cavities have a geometrical beta of 0.92 which have an optimum beta of 0.985. The main reason for
this choice is there is experimental evidence (see Figure 10) that for a given peak surface field, higher
accelerating gradient that can be achieved for higher geometrical beta cavities. For example, the 0.86
cavity designed for ESS by CEA has an accelerating gradient of 17.9 MV/m for a peak surface field of
40 MV/meter. Using the curve in Figure 10, a 0.92 cavity could have an accelerating gradient of 18.7
MV/meter for a surface field of 40 MV/meter. The higher gradient could reduce the number of high
beta cryomodules. However, this increased gradient has to be weighed against the mismatch of
beam beta to optimum beta.
16
Figure 9. Maximum Cavity Voltage Profiles. The green triangle trace is the adjusted October 2012 baseline profile. The aqua cross trace profile has three high beta cryomodules (12 cavities) removed. The orange circles are the profile with four medium beta cryomodules (16 cavities) removed.
In Sections 6.2 and 6.3, it was proposed that the peak surface field and peak beam current be
increased by 10% to 44MV/meter and 55 mA. To provide 5 MW of average beam power, the
required energy of the linac is reduced to 2273 MeV and the corresponding beam beta becomes
0.956. Figure 11 shows the power per cavity required to achieve an average beam power 5 MW. For
the profile with the geometrical beta of 0.92, 40 medium beta cavities (10 cryomodules) and 96 high
beta cavities (24 cryomodules) reach an energy of 2295 MeV. For the profile with the geometrical
beta of 0.86, even fewer medium beta cavities are required because of the higher transit time factor
of the 0.86 cavities at lower energies. Only 28 medium beta cavities (7 cryomodules) are required.
However, 112 high beta cavities (28 cryomodules) are needed to reach an energy of 2333 MeV. Thus
the higher geometrical beta of 0.92 requires one less cryomodule than the 0.86 cavities.
The 0.92 cavities require 1060 kW of peak RF power compared to 960 kW required for the 0.86
cavities. Since the coupler design is independent of geometrical beta, it is possible to run 1060 kW of
power into the 0.86 cavities if the beam current is increased to 61 mA as shown in the green trace in
Figure 11. A beam current of 61 mA requires a final energy of only 2049 MeV for the linac. To achieve
this energy, the number of 0.86 high beta cavities can be reduced to 96 cavities (24 cryomodules).
Thus for the 0.86 design, 31 elliptical cryomodules (7 medium beta and 24 high beta) are needed
compared to 34 elliptical cryomodules (10 medium beta and 24 high beta) for the 0.92 design.
17
Figure 10. Peak Filed ratio for elliptical cavities compiled by P. Pierini
Figure 11. Cavity Power profile to achieve 5 MW average beam power for different values of geometrical betas in the high beta section.

18
6.6 Lattice Cell Length In the October 2012 baseline design, the cell length along the linac changes substantially. In the
spoke region, the cell length is 4.18 meters, in the medium beta section it is 7.12 meters with one
cryomodule per cell, and in the high beta section it is 15.19 meters with two cryomodules per cell. It
was shown in Section 6.5 that is more efficient to reduce the number of medium beta cryomodules
because they produce less acceleration than the high beta cryomodules. Also in Section 6.5, it was
proposed to eliminate over one half of the medium beta cryomodules. If the medium beta cells are
replaced with the current high beta cells which have over twice the length, then the transverse
focusing provided by the long high beta cells is too weak at to provide the desired phase advance per
cell of 87 degrees with reasonable gradients in the quadrupoles. Thus a fourth type of cell with one
high beta cryomodule per cell would be needed in this region.
At this point the linac layout is becoming very complicated. From a simplicity standpoint, it would be
better if all the high beta cells had only one cryomodule per cell. Although this would require 12
more doublet quadrupole packages, the cost impact would be minimal because a doublet
quadrupole package is only a few percent of the total cost of a cryomodule and associated RF
systems.
A tunnel design with many different cell lengths is very undesirable with the perspective of
considering future upgrades. In the future, it might be advantageous to interchange medium beta
cryomodules with high beta cryomodules. As the October 2012 baseline currently stands, this would
be difficult. To enhance the flexibility of the ESS linac design, it is proposed that the length of a lattice
cell in the elliptical section of the linac is uniform and independent of the geometrical beta of the
cavities. A possible configuration of a uniform cell is shown in Table 3.
The length of the superconducting section of the linac in the October 2012 baseline is 393 meters.
This length includes 14 two cavity spoke cryomodules, 15 four cavity medium beta cryomodules and
30 four cavity high beta (g=0.92) cryomodules. The design proposed in Section Error! Reference
source not found. includes 14 two cavity spoke cryomodules, 7 four cavity medium beta
cryomodules, and 24 four cavity high beta (g=0.86) cryomodules. If non-uniform cell lengths are
used in the elliptical section, then the superconducting section in the new design could be as short as
284.5 meters. With a uniform cell length proposed in Table 3, the length of the superconducting
section would be 304 meters.
In summary, a uniform cell length for the elliptical cryomodules provides the following advantages:
Common elliptical cryomodules independent of cavity beta
Uniform spacing of the tunnel stubs
Smooth transverse focusing at the medium beta – high beta transition
Stronger focusing and higher phase advance at the end of the linac
Ability to interchange medium beta and high beta cryomodules
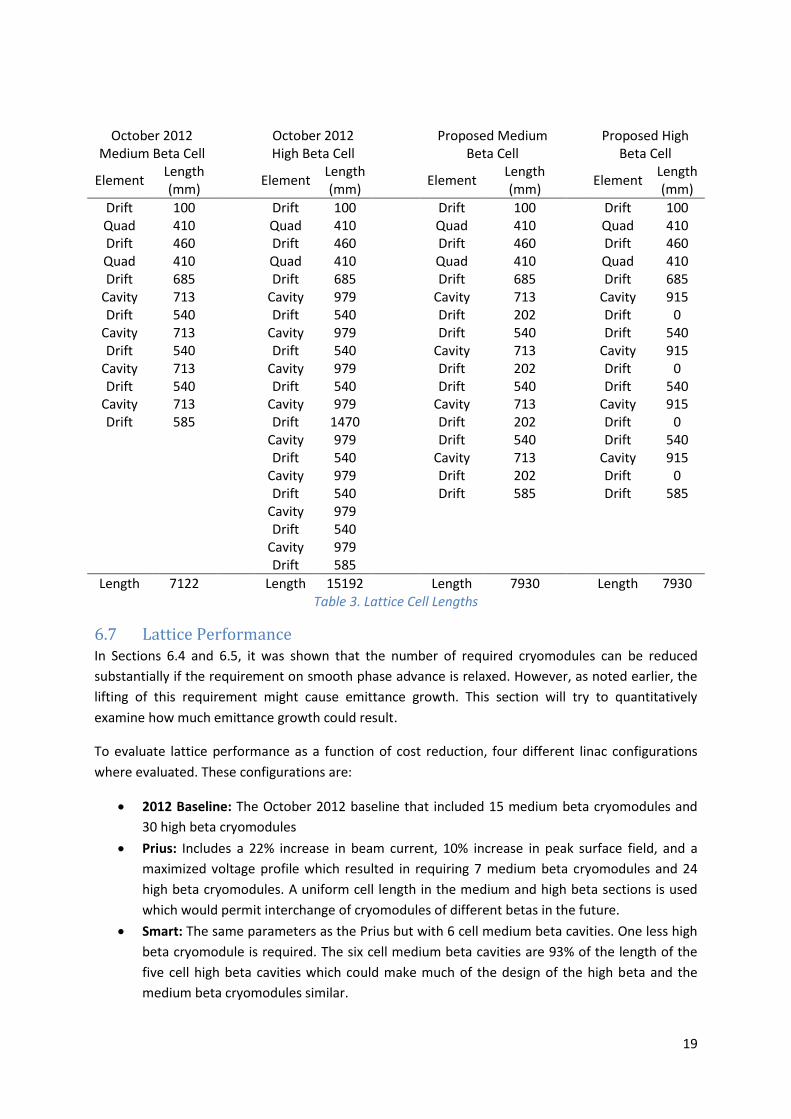
19
October 2012 Medium Beta Cell
October 2012 High Beta Cell
Proposed Medium
Beta Cell
Proposed High Beta Cell
Element Length (mm)
Element Length (mm)
Element Length (mm)
Element Length (mm)
Drift 100 Drift 100 Drift 100 Drift 100 Quad 410 Quad 410 Quad 410 Quad 410 Drift 460 Drift 460 Drift 460 Drift 460 Quad 410 Quad 410 Quad 410 Quad 410 Drift 685 Drift 685 Drift 685 Drift 685
Cavity 713 Cavity 979 Cavity 713 Cavity 915 Drift 540 Drift 540 Drift 202 Drift 0
Cavity 713 Cavity 979 Drift 540 Drift 540 Drift 540 Drift 540 Cavity 713 Cavity 915
Cavity 713 Cavity 979 Drift 202 Drift 0 Drift 540 Drift 540 Drift 540 Drift 540
Cavity 713 Cavity 979 Cavity 713 Cavity 915 Drift 585 Drift 1470 Drift 202 Drift 0
Cavity 979 Drift 540 Drift 540 Drift 540 Cavity 713 Cavity 915 Cavity 979 Drift 202 Drift 0 Drift 540 Drift 585 Drift 585 Cavity 979 Drift 540 Cavity 979 Drift 585
Length 7122 Length 15192 Length 7930 Length 7930 Table 3. Lattice Cell Lengths
6.7 Lattice Performance In Sections 6.4 and 6.5, it was shown that the number of required cryomodules can be reduced
substantially if the requirement on smooth phase advance is relaxed. However, as noted earlier, the
lifting of this requirement might cause emittance growth. This section will try to quantitatively
examine how much emittance growth could result.
To evaluate lattice performance as a function of cost reduction, four different linac configurations
where evaluated. These configurations are:
2012 Baseline: The October 2012 baseline that included 15 medium beta cryomodules and
30 high beta cryomodules
Prius: Includes a 22% increase in beam current, 10% increase in peak surface field, and a
maximized voltage profile which resulted in requiring 7 medium beta cryomodules and 24
high beta cryomodules. A uniform cell length in the medium and high beta sections is used
which would permit interchange of cryomodules of different betas in the future.
Smart: The same parameters as the Prius but with 6 cell medium beta cavities. One less high
beta cryomodule is required. The six cell medium beta cavities are 93% of the length of the
five cell high beta cavities which could make much of the design of the high beta and the
medium beta cryomodules similar.

20
Yugo: The same as the Smart but with an 18% increase in pulse length (and a corresponding
decrease in peak beam power). The lattice requires 7 medium beta cryomodules and 18 high
beta cryomodules.
The major parameters of these configurations are shown in Table 4.
Parameter 2012 Prius Smart Yugo Units
Beam Current 50 61 61 61 mA Pulse Length 2.86 2.86 2.86 3.38 mS Rep. Rate 14 14 14 14 Hz Energy 2491 2116 2077 1731 MeV Average Power 4.99 5.17 5.07 5.0 MW Peak Power 125 129 127 106 MW No. Spoke Cryomodules 14 14 14 14 No. of Spoke Cavities 28 28 28 28
g of Spokes 0.5 0.5 0.5 .5
No. of Spokes 2 2 2 2 Spoke Accelerating Field 8 8.8 8.8 8.8 MV/meter No. Spoke Cavities per Cryomodule 2 2 2 2 No. Spoke Cryomodules per cell 1 1 1 1 Spoke Cell Length 4.18 4.18 4.18 4.18 meter Maximum Spoke Cavity Power 238 320 320 320 kW No. of Medium Beta Cryomodules 15 7 7 7 No. of Medium Beta Cavities 60 28 28 28
g of Medium Betas .67 .67 .67 .67
No. of cells per Medium Beta cavity 5 5 6 6 Medium Beta Accelerating Field 15 16.5 16.8 16.8 MV/meter No. Medium Beta Cavities per Cryomodule
4 4 4 4
No. Medium Beta Cryomodules per cell
1 1 1 1
Medium Beta Cell Length 7.12 7.93 7.93 7.93 meter Maximum Medium Beta Cavity Power
515 695 820 820 kW
No. of High Beta Cryomodules 30 24 23 18 No. of High Beta Cavities 120 96 92 72
g of High Betas 0.92 .86 .86 .86
No. of cells per high Beta cavity 5 5 5 5 High Beta Accelerating Field 18.7 19.7 19.7 19.7 MV/meter No. High Beta Cavities per Cryomodule
4 4 4 4
No. High Beta Cryomodules per cell 2 1 1 1 High Beta Cell Length 15.19 7.93 7.93 7.93 meter Maximum High Beta Cavity Power 870 1060 1060 1060 kW Number of elliptical cryomodules 45 31 30 25 Linac Length 436.3 340.3 332.4 292.7 meters
Linac Cost 586 511 506 481 M€
Table 4. Major parameters of four different linac configurations

21
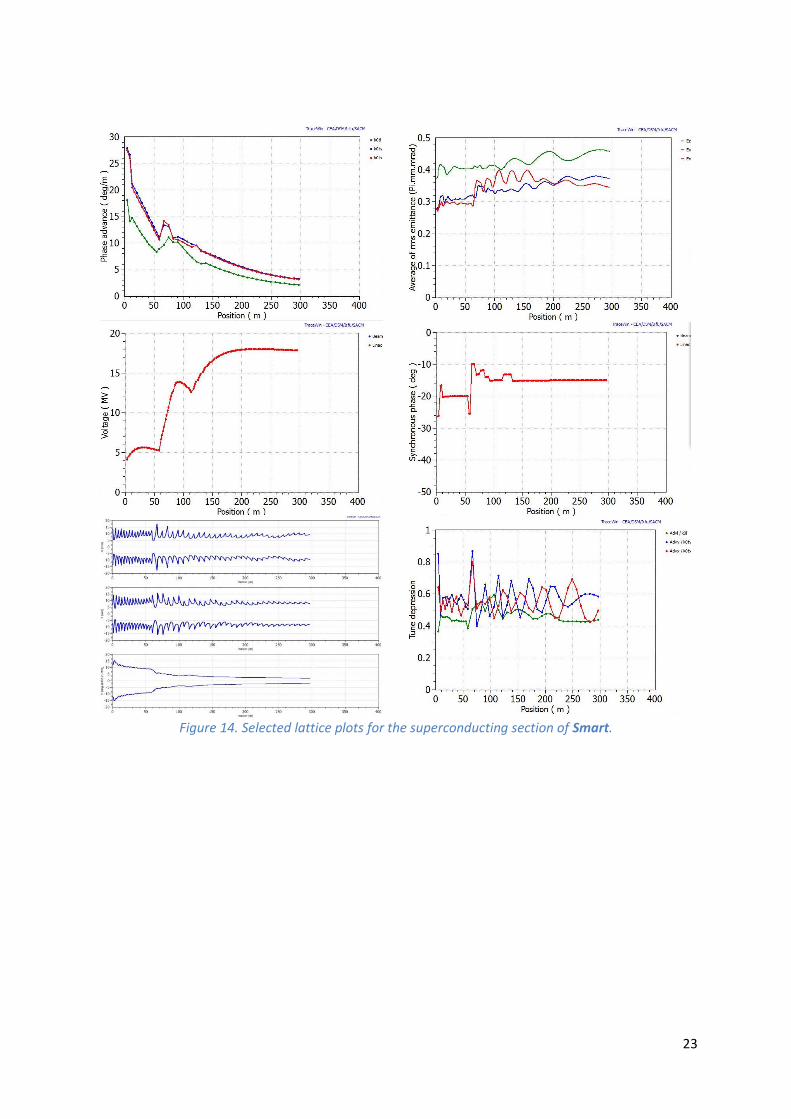
Figure 12 - Figure 14 show selected lattice plots of the superconducting section for the various linac
configurations. The October 2012 Baseline is the most expensive but has the best emittance
performance with almost no emittance growth observed in the superconducting section. The next
three configurations (Prius, Smart, and Yugo) all have maximized voltage profiles. This results in a
rapid longitudinal shrinking of the bunch length in the transition from the spoke to medium beta
section with a corresponding increase of 15% in transverse emittance. A fair amount of effort was
made to smooth the phase advance per meter of these configurations but with little success in
reducing the emittance growth in the medium beta sections.
It should be noted that all these configurations used the same normal conducting front-end lattices
which was optimized for the October 2012 Baseline configuration. It is possible that better emittance
performance could be obtained if the front-end lattice is optimized for each configuration. Additional
work should also be carried out to understand the effect of cavity pass-band modes and the
maximized voltage profiles have on longitudinal emittance.
Figure 12. Selected lattice plots for the superconducting section of the 2012 Baseline.
22
Figure 13. Selected lattice plots for the superconducting section of Prius.
23
Figure 14. Selected lattice plots for the superconducting section of Smart.
24
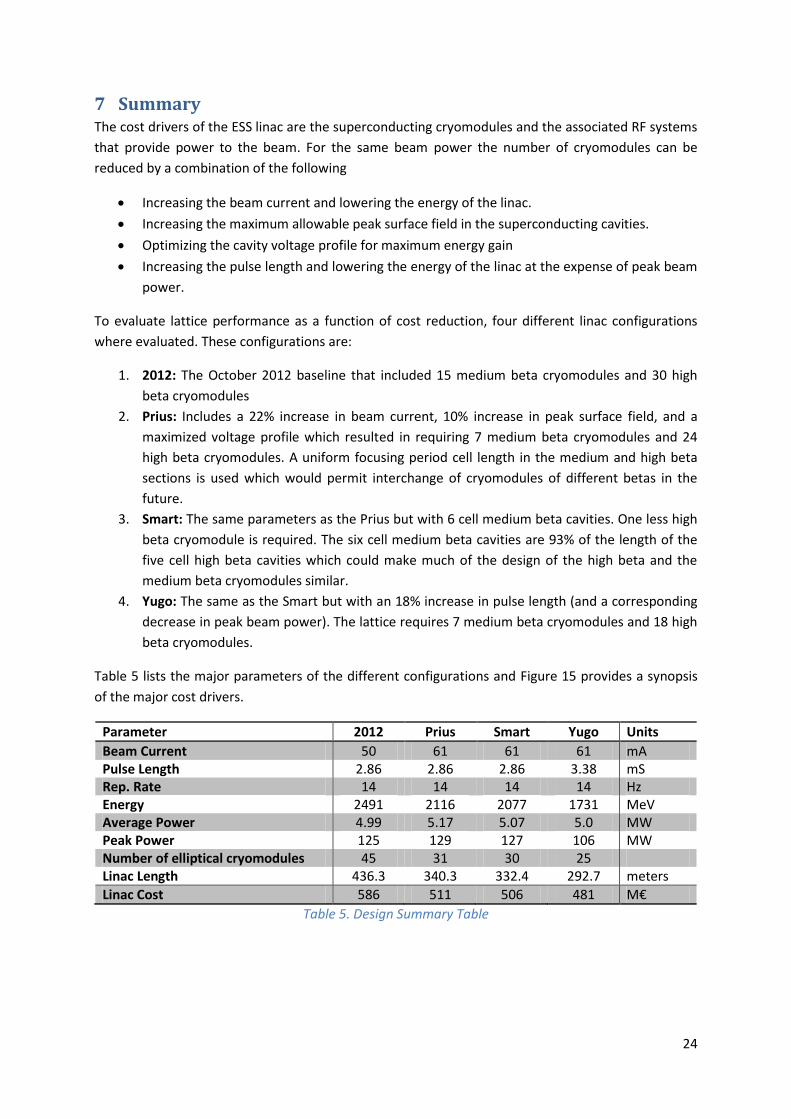
7 Summary The cost drivers of the ESS linac are the superconducting cryomodules and the associated RF systems
that provide power to the beam. For the same beam power the number of cryomodules can be
reduced by a combination of the following
Increasing the beam current and lowering the energy of the linac.
Increasing the maximum allowable peak surface field in the superconducting cavities.
Optimizing the cavity voltage profile for maximum energy gain
Increasing the pulse length and lowering the energy of the linac at the expense of peak beam
power.
To evaluate lattice performance as a function of cost reduction, four different linac configurations
where evaluated. These configurations are:
1. 2012: The October 2012 baseline that included 15 medium beta cryomodules and 30 high
beta cryomodules
2. Prius: Includes a 22% increase in beam current, 10% increase in peak surface field, and a
maximized voltage profile which resulted in requiring 7 medium beta cryomodules and 24
high beta cryomodules. A uniform focusing period cell length in the medium and high beta
sections is used which would permit interchange of cryomodules of different betas in the
future.
3. Smart: The same parameters as the Prius but with 6 cell medium beta cavities. One less high
beta cryomodule is required. The six cell medium beta cavities are 93% of the length of the
five cell high beta cavities which could make much of the design of the high beta and the
medium beta cryomodules similar.
4. Yugo: The same as the Smart but with an 18% increase in pulse length (and a corresponding
decrease in peak beam power). The lattice requires 7 medium beta cryomodules and 18 high
beta cryomodules.
Table 5 lists the major parameters of the different configurations and Figure 15 provides a synopsis
of the major cost drivers.
Parameter 2012 Prius Smart Yugo Units
Beam Current 50 61 61 61 mA Pulse Length 2.86 2.86 2.86 3.38 mS Rep. Rate 14 14 14 14 Hz Energy 2491 2116 2077 1731 MeV Average Power 4.99 5.17 5.07 5.0 MW Peak Power 125 129 127 106 MW Number of elliptical cryomodules 45 31 30 25 Linac Length 436.3 340.3 332.4 292.7 meters
Linac Cost 586 511 506 481 M€
Table 5. Design Summary Table

25
Figure 15. Cost Summary of different linac configurations
8 Comments on Risk
8.1 Technical Risk Technical risk results from any issue that prevents the ESS linac from achieving 5 MW of average
beam power. There are three main issues
1. Emittance growth due to the increased beam current. Space charge forces will increase as
the beam current increases. The space charge forces could result in emittance growth and
halo generation. Too much halo will irradiate tunnel components to a point in which they
need to be replaced or cannot be maintained. The beam intensity would have to be limited.
The proposed increase in current of 22% over the 2012 technical design is probably not
significant enough to be of a concern. It should be noted that the 2008 design had a factor of
three times more beam current in an aperture at least one fourth the size of the 2012 design.
Also future upgrades proposed for the ESS facility all rely on significant increases in beam
current well beyond the increase proposed in this note. The value of 50 mA chosen for the
2012 design was somewhat arbitrarily chosen without regard to quantitative studies of halo
formation and emittance growth and it will be hard to judge the added risk of going from 50
to 61 mA. Finally, since the ESS linac does not have to inject into a ring, the requirements on
beam quality (e.g. beam emittance) can be relaxed. This is especially true if the beam
expansion system for the target is based on raster scanning of the beam on the target.
2. Lower cavity yield due to increase requirements on higher average accelerating field. The
proposed increase on the peak surface field to 44 MV/meter in the superconducting cavities
might be more difficult to achieve than the 40 MV/meter in the 2012 design. This would
lower the energy of the linac with the associated reduction in beam power. However, the
value of 40-44 MV/meter for peak surface field is rather conservative as compared to many
other superconducting accelerators that are being built such as XFEL (50 MV/meter) or are in

26
the planning stages facilities such as SPL and the ILC. Superconducting RF technology
especially in the area of material processing and development has advanced rapidly over the
preceding decade and is likely to continue in the future to the point where the difference
between 40 MV/meter to 44 MV meter will be seen as a modest increase in peak surface
field. Finally, it should be noted that the duty factor of the ESS linac is very low (4%) and
significant contribution to the heat load is static. The need for ultra-high quality factors
required in such facilities as in Project X, FRIB, and XFEL are not important for the ESS linac
because of the low duty factor of the ESS linac.
3. Halo Formation due to discontinuities in the transverse and longitudinal phase advance. A
significant fraction in the reduction in the number of cryomodules arose from maximizing the
voltage profile along the linac. This resulted in a 15% increase in transverse emittance. This is
a small increase in comparison to the available aperture and is not likely to be noticed at the
target station. However, increase emittance gives fear to halo formation that might limit the
beam intensity as discussed above. It is not clear that large emittance increases halo
formation. Larger emittance might actually be beneficial because it reduces the strength of
space charge forces. The experience at SNS has shown that a smooth lattice is not required
for high intensity operations.
8.2 Schedule Risk Schedule risk results from any issue that prevents the ESS linac from providing beam by 2019. The
propose changes in this note might actually accelerate the schedule. The main possibilities for this
acceleration are:
1. The production of cryomodules and the associated RF station are not only cost drivers but on
the critical path for the entire program as well. This note proposes to remove at least 15
cryomodules out of 45 from the 2012 design. This will greatly reduce the production time
and since the cryomodules are installed serially, the installation period of the linac will be
shortened.
2. The specifications for the tender for the prototype of the klystrons and klystron modulators
have not been initiated. Therefore, there is no delay for the RF systems.
3. This note has shown that to minimize the number of cryomodules that high beta cavities
with a geometrical beta of 0.86 is superior to the choice of 0.92 that is in the 2012 design.
There is no design for the 0.92 cavities. There exists only the design of 0.86 cavities and
prototypes of these cavities are in the process of fabrication. Thus the choice geometrical
beta of 0.86 proposed in this note not only reduces the number of cryomodules but actually
accelerates the schedule.
4. This note proposes a uniform focusing cell length both the medium and high beta cavities so
that the cryomodules could be interchangeable and possibly identical. The note also
proposes 6 cell medium beta cavities that would be close to the same length of the high beta
cavities. If 6 cell medium beta cavities are practicable, then the medium beta and high beta
cryomodules could be identical. This would reduce the prototyping schedule (and cost)
significantly because only one type cryomodule prototype would need to be constructed.
Note that prototypes of each type of cavity string will still need to be constructed
27
8.3 Cost Risk Cost risk results from any issue that prevents the ESS linac construction from being on budget. The
main focus of this note was to reduce cost. Cost models were used to predict the increased cost of
having other systems to provide more power because of the reduction in number of cryomodules. It
could be possible that these models are inaccurate or not precise enough to forecast the actual cost
savings. In addition, the cost implications on the cryomodules where not looked at the same depth as
the investigation of RF sources.
It should be noted that there were some areas discounts on costs for the proposed changes were not
taken. Chiefly among these was:
the reduced manufacturing costs of having only one cryomodule design
the reduced tunnel and gallery construction costs of having a uniform lattice cell length.
However, this note did not propose any drastic technology change so the risks in increased cost are
mostly the same as for the 2012 design.
Top Related