


![Private equity funds in norway activity report h1 2013[1]](https://static.fdocuments.net/doc/165x107/568bdc1a1a28ab2034b0f746/private-equity-funds-in-norway-activity-report-h1-20131.jpg)


Languages
Pages
Legal


P.O. Box 930059, Amman 11193, JordanTel. + 962 (0) 6 5629300,Fax. + 962 (0) 6 5682941www.abci.com.jo (A wholly owned subsidiary of ABC (Jordan))
HIKMA PHARMACEUTICALS(HIK)
Equity Research ReportH1 2009 Results Update

HIK: H1 2009 Results Update - September 27th 2009
Pharmaceutical Sector - Hikma Pharmaceuticals
Hikma Pharmaceuticals (HIK)Pharmaceutical Sector
27 September 2009
H1 2009 Results UpdateBUY
Current Price 449.70p / 12-Month Fair Value 496.32p
Share Information
Ticker HIK
Exchange London Stock Exchange
Closing Price* 449.70p
52-Week High 487.50p
52-Week Low 225.00p
Year-on-Year % Change 7.9%
Year-to-Date % Change 28.5%
Market Cap (GBP millions) 851.08* Price as of September 27th 2009
Key Ratios
P/E (Trailing)* 15.7x
P/E (Forward)* 23.8x
P/BV 2.1x
ROAA 8.9%
ROAE 14.2%
Diluted EPS (cents) 22.3
Dividends per Share (cents) 4.5* Based on 2008 EPS** Based on annualised H1 2009 EPS
Based on a current market price of GBp 449.70, Hikma is trading at a trailing P/E and P/BV of 15.7x and 2.3x, respectively, based on its 2008 financial results. Going forward, Hikma is forecasted to register a before-tax bottom line of USD 94.25 million and a net income before minority interest of USD 78.04 million, giving a forward P/E and P/BV of 17.7x and 2.0x.
Our estimated fair value for the Hikma stock, using two peer-based multiples valuation methods and the discounted cash flow method, is GBp 496.32 per share, offering an upside potential of 10.4% over its current price. Therefore, we revise our initial recommendation for Hikma to a BUY.
Research Department
Tanya Khammash, CVAHead of Equity Research [email protected]
Zein AlkhasEquity Research [email protected]
The Group’s bottom line registered a 31.9% increase in H1 2009 compared to H1 2008, rising from USD 33.32 million to USD 43.96 million.
Sales registered a 7.2% increase on a year-on-year basis reaching USD 321.50 million, brought on by USD 16.14 million increase in revenues generated by the branded business, and the impressive 43.2% rally in the generics business. The injectables business, meanwhile, registered a 16.0% drop in revenues, equivalent to an 8.6% decline in constant currency terms.
The Group’s gross margin registered a notable improvement, rising to 47.0% in H1 2009 compared to a margin of 45.0% in H1 2008.
Hikma’s total assets increased to USD 1,003.73 million during the first six months of the year from USD 966.46 million, while its liabilities and shareholders’ equity reached USD 358.35 million and USD 639.20 million, respectively.
Hikma announced a dividend of 4.5 cents per share, up by 28.6% compared to the equivalent period in 2008.
•
•
•
•
•
Key Financial Information (USD ‘000) 2009F 2010F 2011F 2012F 2013F
Operating Profit 109,468 124,688 134,619 144,631 158,914
Profit before Tax and Minority Interest 94,251 108,364 116,762 124,844 136,764
Profit after Tax and before Minority Interest 78,041 89,727 96,680 103,372 113,242
Total Assets 1,072,810 1,191,387 1,322,806 1,470,446 1,632,692
Shareholders’ Equity 671,748 748,015 830,193 918,060 1,014,316
ROAA 7.65% 7.93% 7.69% 7.40% 7.30%
ROAE 12.24% 12.64% 12.25% 11.83% 11.72%
Ratings Change
Target Price Change
Estimates Change
•
•
•
2
Stock Price Performance
220
260
300
340
380
420
460
500
540
01/0
8
02/0
8
03/0
8
04/0
8
05/0
8
06/0
8
07/0
8
08/0
8
09/0
8
10/0
8
11/0
8
12/0
8
01/0
9
02/0
9
03/0
9
04/0
9
05/0
9
06/0
9
07/0
9
08/0
9
09/0
9
Hik
ma
Shar
e Pr
ice
(GB
p)
5,0005,5006,0006,5007,0007,5008,0008,5009,0009,50010,00010,50011,000
FTSE
250
Hikma Share Price FTSE 250

HIK: H1 2009 Results Update - September 27th 2009
Pharmaceutical Sector - Hikma Pharmaceuticals
Overview of Hikma Pharmaceuticals
Hikma Pharmaceuticals was established in Jordan in 1978. Its initial operations focused on branded pharmaceuticals within the Middle East North Africa (MENA) region, but by the early 1990s, Hikma had begun expanding its presence into the United States market by acquiring West-ward Pharmaceutical Corporation, New Jersey. It also set up injectable pharmaceutical operations in Portugal, and began exporting products to Eastern Europe.
In 1996, Hikma became the first Arabic company to receive FDA approval.
Hikma began operations at Jazeera Pharmaceutical Industries (JPI) in Saudi Arabia in 1999, and in 2004, Hikma Pharma (Holding Company) was established in Jersey.
In 2005, the Company took the IPO route and was listed on the London Stock Exchange, offering 51.31 million ordinary shares to the public at a price of 290p per share, generating finances to fund its capital expenditure programme, its investment in working capital, and its expansion into new markets.
It has since made a number of strategic acquisitions, gaining access to new markets and solidifying presence in existing ones. It acquired Hikma Italy in 2005, and in 2006, it acquired the remaining 52.5% of the Jazeera Pharmaceutical Industries (JPI), and began manufacturing operations in Trust Pharma Algeria. More recently, Hikma has acquired Ribosepharm GmbH and the Thymoorgan in Germany, the Arab Pharmaceutical Manufacturing Company (APM) in Jordan, and Alkan Pharma in Egypt.
Hikma Pharmaceutical PLC’s Main SubsidiariesCompany Name Country Ownership
(%)
Hikma Pharmaceutical Ltd Jordan 100%
Arab Pharmaceutical Manufacturing (APM) Jordan 100%
SARL Hikma Pharma Algeria Algeria 100%
Hikma Farmaceutica S.A. Portugal 100%
West-Ward Pharmaceuticals Corp. U.S.A. 100%
Pharma Ixir Co. Sudan 51%
Hikma Pharma SAE Egypt 100%
Thymoorgan Pharmazie GmbH Germany 100%
Hikma Pharma GmbH Germany 100%
Hikma Italia S.p.A Italy 100%
Al-Jazeera Pharmaceutical Industries (JPI) K.S.A. 100%Source: HIK 2008 Annual Report
Hikma has twelve manufacturing facilities in total distributed in eight countries; the United States, Jordan, Portugal, Saudi Arabia, Algeria, Italy, Germany, and Egypt. Hikma has four manufacturing plants in Jordan and two in Portugal, all of which, alongside the plant in the United States, are FDA approved. Its research & development (R&D) meanwhile, is carried out in the United States, Jordan, Saudi Arabia and Portugal. Its operations overall exist in almost fifty countries.
Hikma’s presence is concentrated in the MENA region, and its position has gone from strength to strength, penetrating new markets and establishing strong market shares. On a year-to-date
basis ended June 2009, Hikma ranked fifth in the private retail sales market, surpassing Spimaco, Astrazeneca and Bayer.
Private Retail Sales for Top 9 MENA MarketsUnit Sales
(‘000)Value Sales
($’000) % Growth % Market Share
MENA Private Market 1,466,454 3,964,265 5.9% -
Sanofi-Aventis 123,558 391,472 (7.3%) 9.9%
Glaxosmithkline 107,072 310,592 9.2% 7.8%
Novartis 60,905 214,928 (1.5%) 5.4%
Pfizer 37,377 198,405 (3.4%) 5.0%
Hikma Pharmaceuticals 43,488 149,334 14.3% 3.8%
Spimaco 23,003 96,200 9.1% 2.4%
Astrazeneca 7,897 86,151 22.6% 2.2%
Bayer 23,245 82,227 4.4% 2.1%
Johnson & Johnson 13,477 67,497 (1.5%) 1.7%
Pharco 86,171 66,378 14.2% 1.7%
Hikma has three main business lines:Generic PharmaceuticalsBranded PharmaceuticalsInjectables
Developments in Hikma’s Business Lines
Branded
Hikma’s branded sales grew by 9.3% during H1 2009 on an year-on-year basis to USD 190.2 million, continuing to surpass the growth in the MENA market, leading to a rise in its market share in terms of retail sales to 3.8% from 3.4% at the end of 2008, according to IMS Health. In constant currency terms, the sales growth registered at 12.5% for the period.
Through targeted sales and marketing efforts of own-brand products, in addition to strong demand for in-licensed products, Hikma has raised its market share in a number of countries in the MENA region, as well as further penetrating newer markets.
Change in Market ShareJune 08 Dec 08 June 09 Rank
Algeria 5.9% 6.4% 7.0% 3rd
Saudi Arabia 5.0% 4.9% 5.3% 4thN/A: Information not availableSource: Hikma Interim Results
Hikma has signed three new licensing agreements which will further boost its branded sales, which include the signing of an agreement with Teikoku Pharma USA for Lidoderm, which will cover Algeria, Morocco, Iraq, Libya, Sudan and Tunisia, as well as two other agreements signed during July with Faes Farma, covering the entire MENA region.
Overall, a total of 48 products were launched during H1 2009, which include five new compounds and 12 new dosage forms and strengths. Hikma has launched Actos and Blopress in thirteen markets, while Takepron has been launched in nine and Blopress Plus in six. The Company also received five regulatory approvals for new products, taking the total of approvals up to 22.
•••
3

HIK: H1 2009 Results Update - September 27th 2009
Pharmaceutical Sector - Hikma Pharmaceuticals
Injectables
Hikma’s injectables revenues dropped by 16.0% to USD 67.7 million compared to June 2008, brought on by a decision to cut private label sales to the U.S. market while maintaining own label sales, and aggravated by the depreciation of the Euro, the Algerian Dinar and the Sudanese Pound. In constant currency terms, the decline in sales amounts to 8.9%.
The distribution of injectables sales reveals a sharp decline in importance of sales to the U.S., with the percentage of sales declining to 8% from 16% one year prior, but still remains an important business fro Hikma. The recent signing of a supply agreement with a group purchasing organisation in the U.S. should help boost sales in the U.S. market in H2. Hikma expects to see a marked improvement in the U.S. injectables revenues by year-end.
H1 2009
Unites States8%
MENA48%
Europe & the World44%
H1 2008
MENA41%
Europe & the World43%
Unites States16%
Distribution of Injectables Sales
During the period, a total of 21 products were launched, including 5 new compounds and 10 new dosage forms and strengths. Fifteen regulatory approvals were also received, and 19 additional launches are anticipated for the second half of 2009. These new launches and anticipated growth in tender sales in the MENA region should further supplement the injectables sales during the second half of the year.
Generics
The generics business line managed to register positive growth during H1 2009 compared to H1 2008, with a 43.2% growth to USD 61.8 million. Efforts by the Company to streamline its sales and marketing operations, supplying anti-infective products from the lower-cost FDA-approved facilities in the MENA region, targeting sales and focusing on higher margin products, alongside the alteration of the competitive structure of the U.S. market, led to an improvement in its revenues.
Two new compounds were launched in 3 dosage forms and strengths. 35 products are pending approvals as of June 2009, of which 27 are new compounds.
Share Performance
Year 2009 saw Hikma’s stock price start off with a slump, dropping to 315p on January 9th from its 2008 year-end close of 350p. However, it was quick to recover, rising to reach 395p on February 6th after touching its low for the year of 308.5p on January 21st.
The stock then began to oscillate horizontally before slumping at the end of the first quarter of the year to 358p. From then on, it was an upward climb for the stock, rising to the high for 2009 of
487.5p on July 2nd. The stock became more turbulent during the remainder of July, fluctuating within a broad range of 420p-480p. By September 27th, meanwhile, the stock had closed at 449.7p, up 28.5% year-to-date.
HIKMA's Stock Performance
-200400600800
1,0001,2001,4001,6001,8002,000
31/12/2008 31/01/2009 28/02/2009 31/03/2009 30/04/2009 31/05/2009 30/06/2009 31/07/2009 31/08/2009
Vol
ume
Tra
ded
('000
)
300320340360380400420440460480500
Pric
e (p
ence
)
Volume Share Price
Source: Yahoo Finance
In terms of trading activity, year 2009 has so far been disappointing compared to 2008, with a mere 34.73 million shares traded up to September 27th, compared to 128.14 million for the entirety of 2008. On a daily average basis, in 2009 this stood at 186.70 thousand shares per day, falling significantly short of the 508.50 thousand daily average shares for 2008.
INCOME STATEMENT
Growth in Revenues and Gross Margin
Hikma’s revenues, heavily weighted in favour of the branded business line, are seasonal, with the first half of the year exhibiting stronger sales.
Revenues and Gross Margin
0
50
100
150
200
250
300
350
H1 2007 H2 2007 H1 2008 H2 2008 H1 2009
Reve
nues
and
Gro
ss P
rofit
(USD
mil)
38%
40%
42%
44%
46%
48%
50%
52%
Gro
ss M
argi
n (%
)
Revenue Gross Profit Gross Margin
During H1 2008, Hikma had struggled with its generics business on the back of aggressive market competition and price wars in the United States, while its injectables and branded business lines flourished. During the second half of 2008, the generics business recovered slightly, but sales overall were impacted by the economic slowdown, the financial crisis, and currency volatility. In H1 2009, however, Hikma’s sales rallied, particularly with regards to generics sales, which increased from USD 43.13 million in H1 2008 to USD 61.78 million for the equivalent period in 2009. Growth in the branded business sales decelerated slightly, but continued to outperform the overall market, leading to a growth in market share. Meanwhile, injectables sales continued to suffer, dropping from USD 80.60 million in H1 2008 to USD 67.69 million one year later.
Overall, the sales for the three core business lines registered at USD 319.64 million, up from USD 297.77 million for the equivalent period in 2008, registering a 7.3% increase year-on-year.
Meanwhile, the gross margin also improved, rising to 47.0% from 45.0%, despite the apparent decline in the margin for the branded
4

HIK: H1 2009 Results Update - September 27th 2009
Pharmaceutical Sector - Hikma Pharmaceuticals
business to 53.0% from 54.0% over the same period. This decline in the branded margin is due to currency fluctuations, whereby on a constant currency basis, the branded gross margins were flat in H1 2009 vis-a-vis H1 2008.
(in USD ‘000) H1 2007 H2 2007 H1 2008 H2 2008 H1 2009
Branded
Sales 103,620 95,322 174,039 146,798 190,179
Cost of Sales (47,388) (43,537) (80,040) (67,983) (89,324)
Gross Profit 56,232 51,785 93,999 78,815 100,855
Gross Margin 54.3% 54.3% 54.0% 53.7% 53.0%
Injectables
Sales 60,035 61,129 80,597 68,723 67,689
Cost of Sales (30,439) (36,566) (46,768) (39,174) (38,453)
Gross Profit 29,596 24,563 33,829 29,549 29,236
Gross Margin 49.3% 40.2% 42.0% 43.0% 43.2%
Generics
Sales 58,667 65,562 43,133 62,563 61,775
Cost of Sales (30,463) (35,181) (36,300) (50,085) (40,894)
Gross Profit 28,204 30,381 6,833 12,478 20,881
Gross Margin 48.1% 46.3% 15.8% 19.9% 33.8%Source: Company Interim Results
Both the injectables and generics business lines saw a rise in their gross margin in H1 2009.
Change in Revenue MixSales by Division (2008)
Injectables25.7%
Branded55.3%
Generics18.2%
Corporate & Others0.8%
Sales by Division (H1 2009)
Branded59.2%
Generics19.2%
Injectables21.1%
Corporate & Others0.6%
Hikma’s revenue composition revealed a rise in importance of the branded business, which increased from 55.3% in 2008 to 59.2% in H1 2009, at the expense of the injectables business, whose revenues slumped from 25.7% of total revenues to 21.1% over the same period. Revenues from generics also showed improvement, following a recovery in the business line from the struggles the business faced during 2008 in terms of heightened competition and price wars.
Sales by Geographic Location (H1 2009)
MENA68.0%
Europe & the World11.1%
United States20.9%
Sales by Geographic Location (2008)
Europe & the World14.5%
United States22.5%
MENA63.0%
The shift in sales between segments also reflected on the geographic distribution of revenues, with sales in the MENA
region rising from 63.0% of total sales in 2008 to 68.0% six months later.
Hikma’s positive outlook with regards the injectables business for the second half of 2009 is expected to restore some of the importance of injectables in the revenue mix going forward.
Operating Profit
The rise in gross profit accompanied by stable sales and marketing costs and a slump in research and development expenditure brought about a rise in operating profit to USD 57.21 million from USD 47.11 million in H1 2008.
Operating Profit by Business
-10
-
10
20
30
40
50
60
H1 07 H2 07 H1 08 H2 08 H1 09 H1 07 H2 07 H1 08 H2 08 H1 09 H1 07 H2 07 H1 08 H2 08 H1 09
Branded Generics Injectables
US
D M
illi
ons
All three business segments registered an improvement in operating profit compared to the previous interim results, and only the injectables business underperformed vis-a-vis the operating profit in H1 2008.
Improved Profitability Ratios
Profitability Ratios
0%
5%
10%
15%
20%
25%
2005 2006 2007 2008 2009*
Ret
urns
Rat
ios (
%)
ROAA ROAE ROCE
* Based on Annualised H1 2009 Returns
Following sustained declines in the main profitability ratios for the Company, H1 2009 finally revealed improvements in the ratios, with the return on average assets (ROAA) rising to 8.9% based on annualised semi-annual results from 6.1% in 2008. Meanwhile, the return on average equity (ROAE) and return on capital employed (ROCE) also rose, registering at 14.2% and 17.5%, respectively.
Due to the seasonality of the business, we anticipate a slight decline in the ratios by year end, but will, nonetheless, continue to surpass the ratios registered in 2008.
BALANCE SHEET
Asset Growth
Hikma’s assets continued to grow during H1 2009, reaching USD 1,003.73 million, up from USD 966.46 million at the end of 2008. The bulk of the growth is attributed to a rise in trade receivables and inventory, which registered increases during the period of
5
HIK: H1 2009 Results Update - September 27th 2009
Pharmaceutical Sector - Hikma Pharmaceuticals
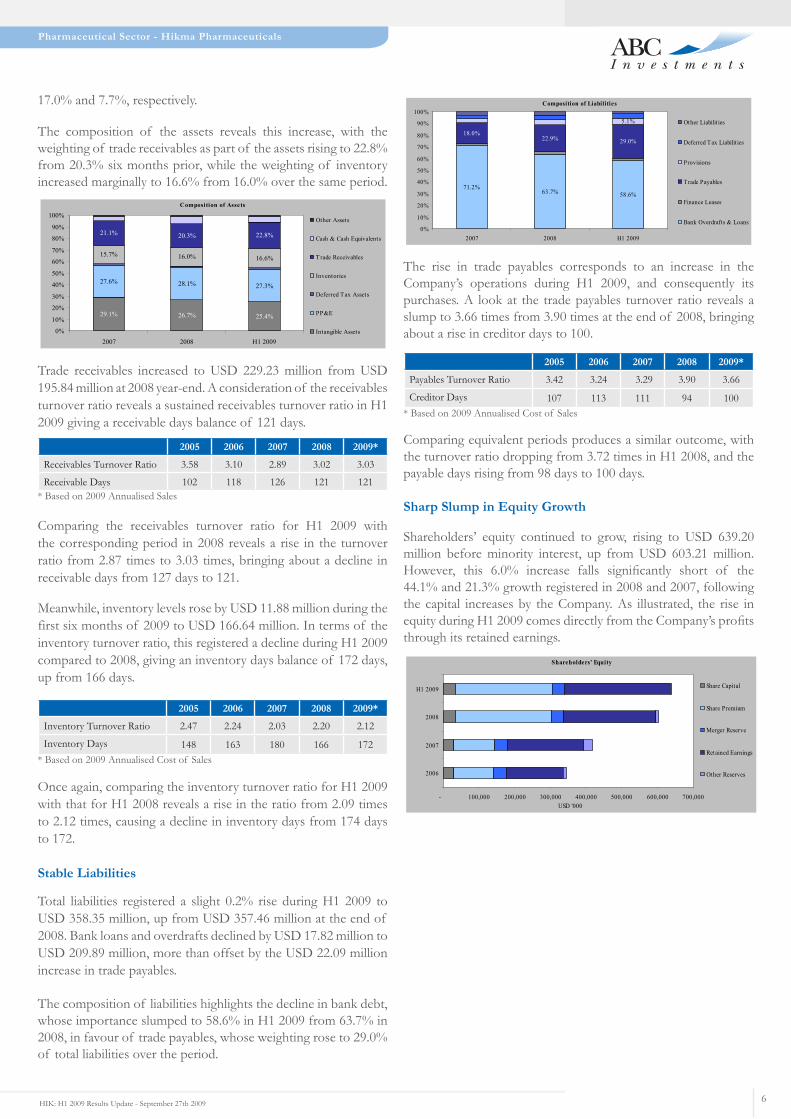
17.0% and 7.7%, respectively.
The composition of the assets reveals this increase, with the weighting of trade receivables as part of the assets rising to 22.8% from 20.3% six months prior, while the weighting of inventory increased marginally to 16.6% from 16.0% over the same period.
Composition of Assets
26.7% 25.4%
27.6% 28.1% 27.3%
15.7% 16.0% 16.6%
21.1% 20.3% 22.8%
29.1%
0%
10%
20%
30%
40%
50%
60%
70%
80%
90%
100%
2007 2008 H1 2009
Other Assets
Cash & Cash Equivalents
Trade Receivables
Inventories
Deferred Tax Assets
PP&E
Intangible Assets
Trade receivables increased to USD 229.23 million from USD 195.84 million at 2008 year-end. A consideration of the receivables turnover ratio reveals a sustained receivables turnover ratio in H1 2009 giving a receivable days balance of 121 days.
2005 2006 2007 2008 2009*
Receivables Turnover Ratio 3.58 3.10 2.89 3.02 3.03
Receivable Days 102 118 126 121 121* Based on 2009 Annualised Sales
Comparing the receivables turnover ratio for H1 2009 with the corresponding period in 2008 reveals a rise in the turnover ratio from 2.87 times to 3.03 times, bringing about a decline in receivable days from 127 days to 121.
Meanwhile, inventory levels rose by USD 11.88 million during the first six months of 2009 to USD 166.64 million. In terms of the inventory turnover ratio, this registered a decline during H1 2009 compared to 2008, giving an inventory days balance of 172 days, up from 166 days.
2005 2006 2007 2008 2009*
Inventory Turnover Ratio 2.47 2.24 2.03 2.20 2.12
Inventory Days 148 163 180 166 172* Based on 2009 Annualised Cost of Sales
Once again, comparing the inventory turnover ratio for H1 2009 with that for H1 2008 reveals a rise in the ratio from 2.09 times to 2.12 times, causing a decline in inventory days from 174 days to 172.
Stable Liabilities
Total liabilities registered a slight 0.2% rise during H1 2009 to USD 358.35 million, up from USD 357.46 million at the end of 2008. Bank loans and overdrafts declined by USD 17.82 million to USD 209.89 million, more than offset by the USD 22.09 million increase in trade payables.
The composition of liabilities highlights the decline in bank debt, whose importance slumped to 58.6% in H1 2009 from 63.7% in 2008, in favour of trade payables, whose weighting rose to 29.0% of total liabilities over the period.
6
Composition of Liabilities
71.2%63.7% 58.6%
18.0%22.9% 29.0%
5.1%
0%
10%
20%
30%
40%
50%
60%
70%
80%
90%
100%
2007 2008 H1 2009
Other Liabilit ies
Deferred Tax Liabilit ies
Provisions
Trade Payables
Finance Leases
Bank Overdrafts & Loans
The rise in trade payables corresponds to an increase in the Company’s operations during H1 2009, and consequently its purchases. A look at the trade payables turnover ratio reveals a slump to 3.66 times from 3.90 times at the end of 2008, bringing about a rise in creditor days to 100.
2005 2006 2007 2008 2009*
Payables Turnover Ratio 3.42 3.24 3.29 3.90 3.66
Creditor Days 107 113 111 94 100 * Based on 2009 Annualised Cost of Sales
Comparing equivalent periods produces a similar outcome, with the turnover ratio dropping from 3.72 times in H1 2008, and the payable days rising from 98 days to 100 days.
Sharp Slump in Equity Growth
Shareholders’ equity continued to grow, rising to USD 639.20 million before minority interest, up from USD 603.21 million. However, this 6.0% increase falls significantly short of the 44.1% and 21.3% growth registered in 2008 and 2007, following the capital increases by the Company. As illustrated, the rise in equity during H1 2009 comes directly from the Company’s profits through its retained earnings.
Shareholders' Equity
- 100,000 200,000 300,000 400,000 500,000 600,000 700,000
2006
2007
2008
H1 2009
USD '000
Share Capital
Share Premium
Merger Reserve
Retained Earnings
Other Reserves

HIK: H1 2009 Results Update - September 27th 2009
Pharmaceutical Sector - Hikma Pharmaceuticals
VALUATION
Revised Estimates
We have revised our previous estimates taking into account Hikma’s stronger than expected performance in the generics business line, and the somewhat weaker that anticipated gross margin in the branded business, and slower growth in injectables.
Overall, our amended forecasts include a slightly lower growth in revenues, but at a higher gross margin in 2009 and 2010 than previously estimated.
Valuation Methods
Using three types of valuation methods, we arrive at a weighted average fair value for Hikma’s stock of 496.32 pence, registering 10.4% higher than the stock’s current price, leading us to lend a BUY recommendation for the stock.
Weighted Average Fair Value per Share
Valuation Method Target Value Weighting Value
Discounted Cash Flow Model 386.12 60% 231.67
Peer Valuation (P/E multiple) 661.98 20% 132.40
Peer Valuation (P/S multiple) 661.26 20% 132.25
Weighted Average Fair Value (GBP - pence) 100% 496.32
Current Price (GBP - pence) 449.70
Upward (Downward) Potential 10.4%
Discounted Cash Flow (DCF)
Our DCF returns a fair value for Hikma of 386.12 pence per share. The WACC was based on a cost of equity of 8.87% and an after-tax cost of debt of 5.42%. A 15% and 85% debt and equity structure was assumed, arriving at a WACC of 8.36%.
(in USD - cents) 2009f 2010f 2011f 2012f 2013f Terminal Value
Free Cash Flow 89,033 106,987 104,408 95,965 101,303 1,377,205
NPV for Period 2009 - 2013 396,228
NPV of Terminal Value 922,018
Outstanding Debt 215,956
Cash at Beginning of Period 63,546
Equity Value 1,165,836
# of Outstanding Shares 189,254
DCF Value per Share (USD cents) 616.02
DCF Value per Share (GBP pence) 386.12
The components of the WACC are as follows:
Cost of Debt 6.83% Based on effective cost of debt over past 5 years
Tax Rate 20.6% Based on effective tax rate over past 5 years
Beta 0.72 Source: Reuters
Risk-Free Rate 4.91% Based on 10-year treasury bond in the U.S., the U.K. and bonds in Jordan, weighted according to Hikma’s revenue distribution
Market Risk Premium 5.5% Global market risk premium taken to be 4.5% - 5.5%
WACC 8.36%
Terminal Growth Rate 1.00%
Sensitivity Analysis
The table below illustrates the sensitivity of the dividend discount model valuation to the inputs of the model. To reflect the extent of this sensitivity, we have performed a sensitivity analysis on the model’s two key inputs; the terminal growth rate and the WACC.
7

HIK: H1 2009 Results Update - September 27th 2009
Pharmaceutical Sector - Hikma Pharmaceuticals
(in pence) Terminal Growth Rate
0.00% 0.50% 1.00% 1.50% 2.00%
WA
CC
7.36% 403.74 427.03 453.99 485.55 523.00
7.86% 374.82 394.68 417.44 443.78 474.62
8.36% 349.57 366.68 386.12 408.39 434.17
8.86% 326.80 341.61 358.31 377.28 399.01
9.36% 306.65 319.58 334.06 350.38 368.92
Relative Valuation
Based on the average P/E and P/S multiples for the below international peer group and the projected EPS and sales per share for Hikma for 2009 lends a target price of 661.98 pence and 661.26 pence respectively. The peer group was selected based on the 10 companies each within the industries “Pharmaceuticals, Generics and Specialty” and “Pharmaceuticals, Diversified” that had operations, measured in terms of value of sales, most similar to that of Hikma.
Ticker Name P/E P/S
0GD8.L UCB S.A. 14.03 1.53
SHP.L Shire Plc 23.77 3.21
BVTSEK.Lp Biovitrum AB N/A 2.33
0IJA.L Ipsen S.A. 23.24 2.91
0HLK.L Krka tovarna zdravil d.d. Novo Mesto 15.48 2.50
CHTT.O Chattem, Inc. 16.61 2.67
PHSTq.L OAO “Farmstandart” 22.62 5.53
BIOGEUR.Lp Biotest AG 17.69 1.07
SRZGEUR.Lp Schwarz Pharma AG 76.51 12.87
MDCO.O The Medicines Co N/A 1.55
SAN1LLTL.Lp Sanitas N/A 1.00
DECP.L Dechra Pharmaceuticals PLC 32.24 0.80
SFTRDBGN.Lp Sopharma Trading AD-Sofia 8.06 0.14
BMRN.O Biomarin Pharmaceutical Inc. > 100 5.46
MYGN.O Myriad Genetics Inc 19.30 7.83
PDLI.O PDL BioPharma, Inc. 6.22 2.89
PBH.N Prestige Brands Holdings, Inc. N/A 1.12
SCDBRON.Lp Zentiva SA 29.68 1.38
ATBERON.Lp Antibiotice SA 36.88 1.51
GENPEUR.Lp Stallergenes 47.85 5.17
Average 26.01 3.17As of September 27th 2009N/A: Not Available/ApplicableSource: Reuters
8

Pharmaceutical Sector - Hikma Pharmaceuticals
HIK: H1 2009 Results Update - September 27th 2009
BALANCE SHEET
Historical Forecast
(in USD '000) 2004 2005 2006 2007 2008 2009F 2010F 2011F 2012F 2013F
Intangible Assets 5,033 7,735 23,940 259,841 258,228 263,495 274,555 286,722 300,105 314,826
Property, Plant & Equipment 71,471 91,209 156,845 246,656 271,650 285,304 313,746 354,406 407,403 468,324
Interest in Associates & Joint Ventures 7,716 9,856 - 4,543 5,453 5,453 5,453 5,453 5,453 5,453
Deferred Tax Assets 171 1,506 5,719 14,503 13,305 13,305 13,305 13,305 13,305 13,305
Financial and Other Non-Current Assets 1,614 2,715 2,018 2,298 2,617 2,200 2,200 2,200 2,200 2,200
Non-Current Assets 86,005 113,021 188,522 527,841 551,253 569,757 609,259 662,086 728,465 804,108
Inventories 44,365 58,017 83,720 140,409 154,756 169,727 190,096 212,026 236,706 263,014
Income Tax Recoverable 1,908 1,320 500 358 - - - - - -
Trade and Other Receivables 63,732 82,634 121,846 188,275 195,843 222,401 249,091 276,135 299,469 322,966
Cash, Collateralised Cash & Cash Equivalents 49,107 141,079 91,564 34,533 63,546 109,761 141,639 171,106 204,183 240,801
Other Current Assets 1,364 1,891 2,204 2,625 1,061 1,164 1,303 1,454 1,623 1,803
Current Assets 160,476 284,941 299,834 366,200 415,206 503,053 582,129 660,720 741,981 828,584
Total Assets 246,481 397,962 488,356 894,041 966,459 1,072,810 1,191,387 1,322,806 1,470,446 1,632,692
Bank Overdrafts and Loans 35,108 21,146 35,614 276,537 117,300 170,869 186,796 206,939 231,671 260,101
Obligations under Finance Leases 1,165 797 1,216 1,455 1,221 1,339 1,500 1,673 1,868 2,075
Trade and Other Payables 29,812 44,017 53,916 84,324 82,003 107,000 120,077 134,843 153,173 171,387
Provisions 5,475 7,198 11,112 15,058 17,508 23,600 26,958 29,298 31,674 34,828
Other Current Liabilities 1,672 3,542 4,868 16,662 10,502 11,518 12,900 14,388 16,063 17,849
Current Liabilities 73,232 76,700 106,726 394,036 228,434 314,325 348,232 387,141 434,449 486,239
Long-Term Financial Debts 24,291 30,791 25,339 57,662 110,414 73,230 80,056 88,688 99,287 111,472
Deferred Income 591 416 356 279 695 762 854 952 1,063 1,181
Obligations under Finance Leases 2,448 1,411 4,441 5,698 5,496 6,028 6,751 7,530 8,406 9,341
Deferred Tax Liabilities 744 1,162 1,695 11,709 12,425 - - - - -
Non-Current Liabilities 28,074 33,780 31,831 75,348 129,030 80,019 87,660 97,170 108,757 121,993
Total Liabilities 101,306 110,480 138,557 469,384 357,464 394,345 435,892 484,311 543,206 608,233
Share Capital 25,269 29,457 29,712 30,229 33,857 34,010 34,010 34,010 34,010 34,010
Share Premium - 110,074 111,431 114,059 269,973 270,900 270,900 270,900 270,900 270,900
Treasury Shares (187) - - - (1,124) - - - - -
Reserves 117,408 144,350 203,924 274,192 300,503 369,808 449,287 536,393 632,095 736,157
Equity Attributable to Equity Holders of the Parent 142,490 283,881 345,067 418,480 603,209 671,748 748,015 830,193 918,060 1,014,316
Minority Interest 2,685 3,601 4,732 6,177 5,786 6,717 7,480 8,302 9,181 10,143
Total Equity 145,175 287,482 349,799 424,657 608,995 678,465 755,496 838,495 927,240 1,024,459
Total Liabilities & Equity 246,481 397,962 488,356 894,041 966,459 1,072,810 1,191,387 1,322,806 1,470,446 1,632,692
9
Pharmaceutical Sector - Hikma Pharmaceuticals
HIK: H1 2009 Results Update - September 27th 2009
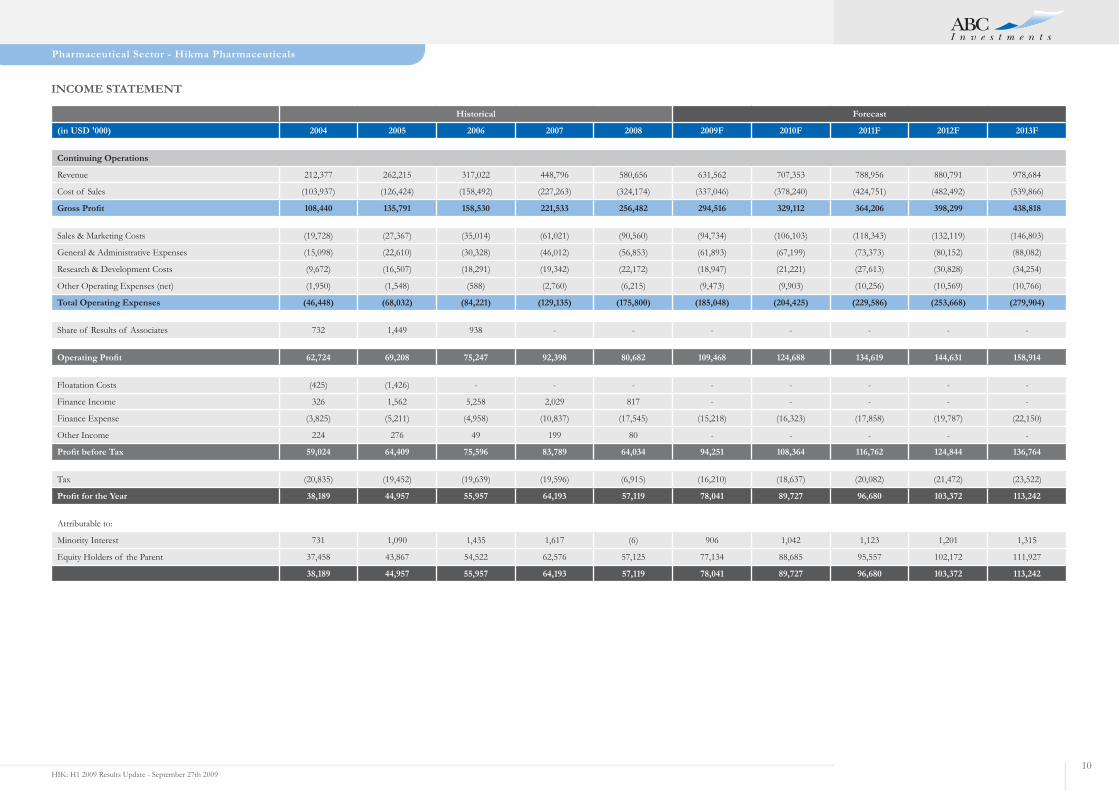
INCOME STATEMENT
Historical Forecast
(in USD '000) 2004 2005 2006 2007 2008 2009F 2010F 2011F 2012F 2013F
Continuing Operations
Revenue 212,377 262,215 317,022 448,796 580,656 631,562 707,353 788,956 880,791 978,684
Cost of Sales (103,937) (126,424) (158,492) (227,263) (324,174) (337,046) (378,240) (424,751) (482,492) (539,866)
Gross Profit 108,440 135,791 158,530 221,533 256,482 294,516 329,112 364,206 398,299 438,818
Sales & Marketing Costs (19,728) (27,367) (35,014) (61,021) (90,560) (94,734) (106,103) (118,343) (132,119) (146,803)
General & Administrative Expenses (15,098) (22,610) (30,328) (46,012) (56,853) (61,893) (67,199) (73,373) (80,152) (88,082)
Research & Development Costs (9,672) (16,507) (18,291) (19,342) (22,172) (18,947) (21,221) (27,613) (30,828) (34,254)
Other Operating Expenses (net) (1,950) (1,548) (588) (2,760) (6,215) (9,473) (9,903) (10,256) (10,569) (10,766)
Total Operating Expenses (46,448) (68,032) (84,221) (129,135) (175,800) (185,048) (204,425) (229,586) (253,668) (279,904)
Share of Results of Associates 732 1,449 938 - - - - - - -
Operating Profit 62,724 69,208 75,247 92,398 80,682 109,468 124,688 134,619 144,631 158,914
Floatation Costs (425) (1,426) - - - - - - - -
Finance Income 326 1,562 5,258 2,029 817 - - - - -
Finance Expense (3,825) (5,211) (4,958) (10,837) (17,545) (15,218) (16,323) (17,858) (19,787) (22,150)
Other Income 224 276 49 199 80 - - - - -
Profit before Tax 59,024 64,409 75,596 83,789 64,034 94,251 108,364 116,762 124,844 136,764
Tax (20,835) (19,452) (19,639) (19,596) (6,915) (16,210) (18,637) (20,082) (21,472) (23,522)
Profit for the Year 38,189 44,957 55,957 64,193 57,119 78,041 89,727 96,680 103,372 113,242
Attributable to:
Minority Interest 731 1,090 1,435 1,617 (6) 906 1,042 1,123 1,201 1,315
Equity Holders of the Parent 37,458 43,867 54,522 62,576 57,125 77,134 88,685 95,557 102,172 111,927
38,189 44,957 55,957 64,193 57,119 78,041 89,727 96,680 103,372 113,242
10
Pharmaceutical Sector - Hikma Pharmaceuticals
HIK: H1 2009 Results Update - September 27th 2009
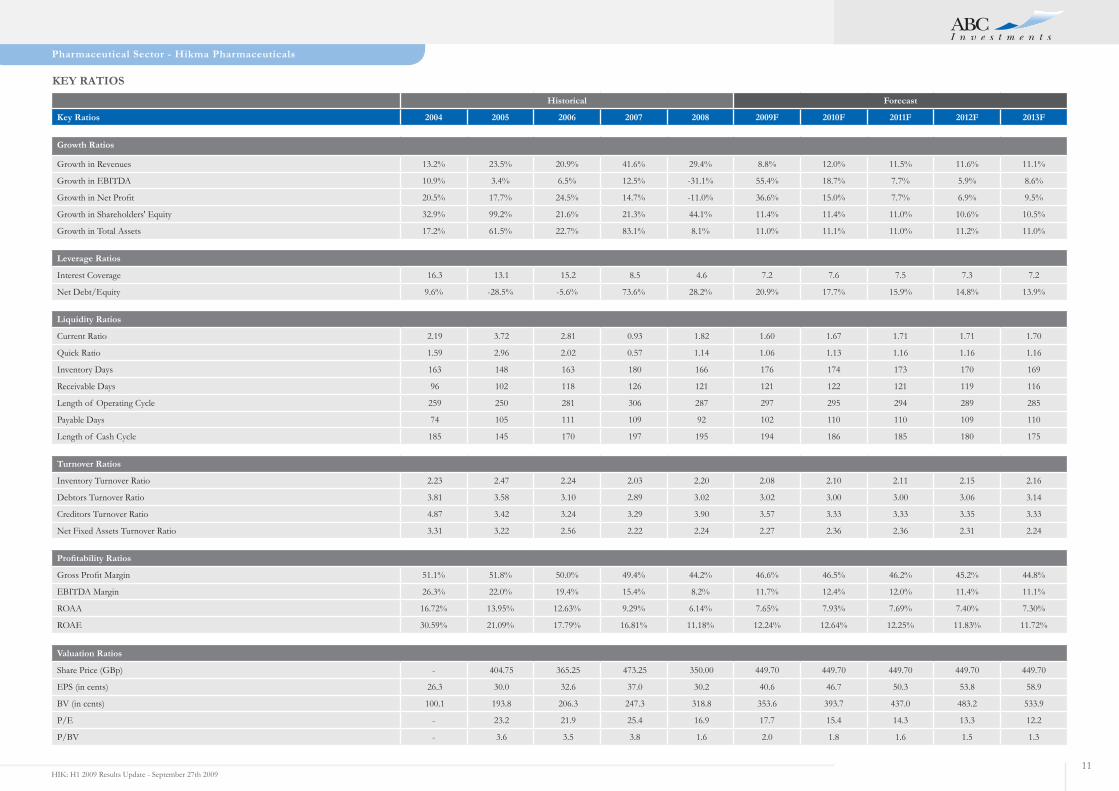
KEY RATIOSHistorical Forecast
Key Ratios 2004 2005 2006 2007 2008 2009F 2010F 2011F 2012F 2013F
Growth Ratios
Growth in Revenues 13.2% 23.5% 20.9% 41.6% 29.4% 8.8% 12.0% 11.5% 11.6% 11.1%
Growth in EBITDA 10.9% 3.4% 6.5% 12.5% -31.1% 55.4% 18.7% 7.7% 5.9% 8.6%
Growth in Net Profit 20.5% 17.7% 24.5% 14.7% -11.0% 36.6% 15.0% 7.7% 6.9% 9.5%
Growth in Shareholders' Equity 32.9% 99.2% 21.6% 21.3% 44.1% 11.4% 11.4% 11.0% 10.6% 10.5%
Growth in Total Assets 17.2% 61.5% 22.7% 83.1% 8.1% 11.0% 11.1% 11.0% 11.2% 11.0%
Leverage Ratios
Interest Coverage 16.3 13.1 15.2 8.5 4.6 7.2 7.6 7.5 7.3 7.2
Net Debt/Equity 9.6% -28.5% -5.6% 73.6% 28.2% 20.9% 17.7% 15.9% 14.8% 13.9%
Liquidity Ratios
Current Ratio 2.19 3.72 2.81 0.93 1.82 1.60 1.67 1.71 1.71 1.70
Quick Ratio 1.59 2.96 2.02 0.57 1.14 1.06 1.13 1.16 1.16 1.16
Inventory Days 163 148 163 180 166 176 174 173 170 169
Receivable Days 96 102 118 126 121 121 122 121 119 116
Length of Operating Cycle 259 250 281 306 287 297 295 294 289 285
Payable Days 74 105 111 109 92 102 110 110 109 110
Length of Cash Cycle 185 145 170 197 195 194 186 185 180 175
Turnover Ratios
Inventory Turnover Ratio 2.23 2.47 2.24 2.03 2.20 2.08 2.10 2.11 2.15 2.16
Debtors Turnover Ratio 3.81 3.58 3.10 2.89 3.02 3.02 3.00 3.00 3.06 3.14
Creditors Turnover Ratio 4.87 3.42 3.24 3.29 3.90 3.57 3.33 3.33 3.35 3.33
Net Fixed Assets Turnover Ratio 3.31 3.22 2.56 2.22 2.24 2.27 2.36 2.36 2.31 2.24
Profitability Ratios
Gross Profit Margin 51.1% 51.8% 50.0% 49.4% 44.2% 46.6% 46.5% 46.2% 45.2% 44.8%
EBITDA Margin 26.3% 22.0% 19.4% 15.4% 8.2% 11.7% 12.4% 12.0% 11.4% 11.1%
ROAA 16.72% 13.95% 12.63% 9.29% 6.14% 7.65% 7.93% 7.69% 7.40% 7.30%
ROAE 30.59% 21.09% 17.79% 16.81% 11.18% 12.24% 12.64% 12.25% 11.83% 11.72%
Valuation Ratios
Share Price (GBp) - 404.75 365.25 473.25 350.00 449.70 449.70 449.70 449.70 449.70
EPS (in cents) 26.3 30.0 32.6 37.0 30.2 40.6 46.7 50.3 53.8 58.9
BV (in cents) 100.1 193.8 206.3 247.3 318.8 353.6 393.7 437.0 483.2 533.9
P/E - 23.2 21.9 25.4 16.9 17.7 15.4 14.3 13.3 12.2
P/BV - 3.6 3.5 3.8 1.6 2.0 1.8 1.6 1.5 1.3
11

Disclaimer
This document has been issued by ABC Investments for informational purposes only. The information contained herein is based on sources we believe to be reliable, but its accuracy is not guaranteed and such information may be incomplete or condensed. This document is not, and should not, be construed as an offer or the solicitation of an offer to buy or sell any security. ABC Investments accepts no liability for any loss or damage of any kind arising from the use of all or any part of this document. ABC Investments has no obligation to update, modify or amend this report or to otherwise notify a reader thereof in the event that any matter stated herein changes or subsequently becomes inaccurate. This document may not be reproduced or circulated without the written consent of ABC Investments.
Top Related