


Languages
Pages
Legal


Enterprice-wide risk managementEnergy Risk Europe, 4th October 2006 London

2
The Statoil groupShort on history – long on achievements
Production (2004): 1.1 mmboepd
Reserves (2004):4.3 bn boe
24,000 employees Activity in 29 countries Operating 2.7 mmboepd
of NCS production Marketing 2/3 of
NCS gas volumes World’s 3rd largest
crude oil seller0 10 20 30 40
Norsk Hydro
Repsol YPF
ConocoPhillips
BG
Eni
Shell
BP
Statoil
Total
ChevronTexaco
ExxonMobil
Competitive returns1)
Return on Average Capital Employed 2004
1 Source: Lehman Brothers Oil and Gas Quarterly Scoresheet (10 February 2005), rolling 12-month ROACE.
Designing an effective enterprise-wide risk management framework

4
Enterprise-wide Risk ManagementCorporate Risk Management (blue font)
Short term Long term
Tactical risk Market (prices)
Credit risk
Operational risk
Strategic risk
Market (prices) Country Tax Reputation
Accidents Catastrophe Environment
Reservoir Project HSE Administrative
Insurable risk via Captive

5
Corporate Risk Committee Corporate Risk Committee (CRC) at group level
(advisory role / responsible for):
Strategic market risk policyo corporate hedging policy and strategieso strategic market views
Insurance policies Insurable risks Credit risk Trading methodologies issues Risk reporting Risk assessments of large projects
with difficult business risks Portfolio risk assessments
Participants: CFO (head of CRC) Head of Country Risk and Social Responsibility Head of Refining & Marketing Head of Oil Trading and Supply Head of Financial Services
E&P Norway International E&P Strategy and Control Natural Gas Finance & Control Natural Gas Long Term Market Corporate Risk Management
Information to CRC / training
CRC decision vehicleCRC advicery role

6
CRC cases (overview 2003-2005)
• Cove Point - overview / mandates• Cove Point expansion• Credit Default Swaps• Energiverk Mongstad• Insurance markets after GoM events• Overview of new country risk reporting • Hedge strategies - part I & II• Main features in Statoil’s risk management• Correlations between Brent and ref. margin &
NOK/USD & STL• Country risk status portfolio• Country risk overview: Libya• Country risk - Status pilot phase• Country risk overview: Algeria• Development country risk• Natural Gas Long Term contracts risks• NG Clearing: purpose and organization• NG trading mandates• NG weather derivatives - gen. disc. about use• NG: risk i gas portfolio and sub optimization• Oil vs gas indexation• Oil price hedging - status prices• Oil price hedging 2004
• PMT project - Tjeldbergodden• Risk capital/-appetite• Risk report October 05• Risk management report corporate tactical• Risk assessment / Enterprise wide Risk
Management• Risk report status• Connection between results and risk capital in
trading• Snorre-incident – economical consequences and
insurance• Statoil’s credit exposure• Statoil’s reputation• Status hedge 2005• Status crude oil market• Status tax risk• Bad scenarios – gap • Bad scenarios – going forward• Bad scenarios part I• Bad scenarios part II• Tactical reporting• Currency risk• Variable premium puts

7
Strategic risk management policySummary
Statoil’s corporate risk management defines crude oil price, natural gas price and production of crude oil and natural gas as the corporate’s core risks.
Main goals in the corporate’s risk management policy:
contribute in ensuring Statoil’s long term strategic development and reaching targets through protecting financial flexibility, i.e. avoiding different categories of financial distress, downrating and protecting cash flow, making the corporate able to
start and accomplish profitable projects/acquisitions andavoiding forced divestments
even in periods with bad market conditions.

Dynamic measurement of risk.

9
Some challenges for the energy sector?
In a bank a currency trader knows that when he has bought some foreign currency, he has a position !
When is an oil trader getting a position? All future potential positions? All proven reserves? All ”lifted” production? All sold cargoes?
When is the mark to market zero? When the oil is sold a fixed price? When the oil is sold a the floating market price?
Is it possible to use the same principles for oil, oil products, gas, lng, electrisity, coal???

10

11
Risk comprises both the upside and downside outcomes
Negative impact
Positive impact
Large
Probability0
Large
Oil price
Natural gas price Project
Credit
Country
Catasthropicevents
Currencies
Op. damages / accidents
Production
Pot
. re
puta
tion
eff
ect
12
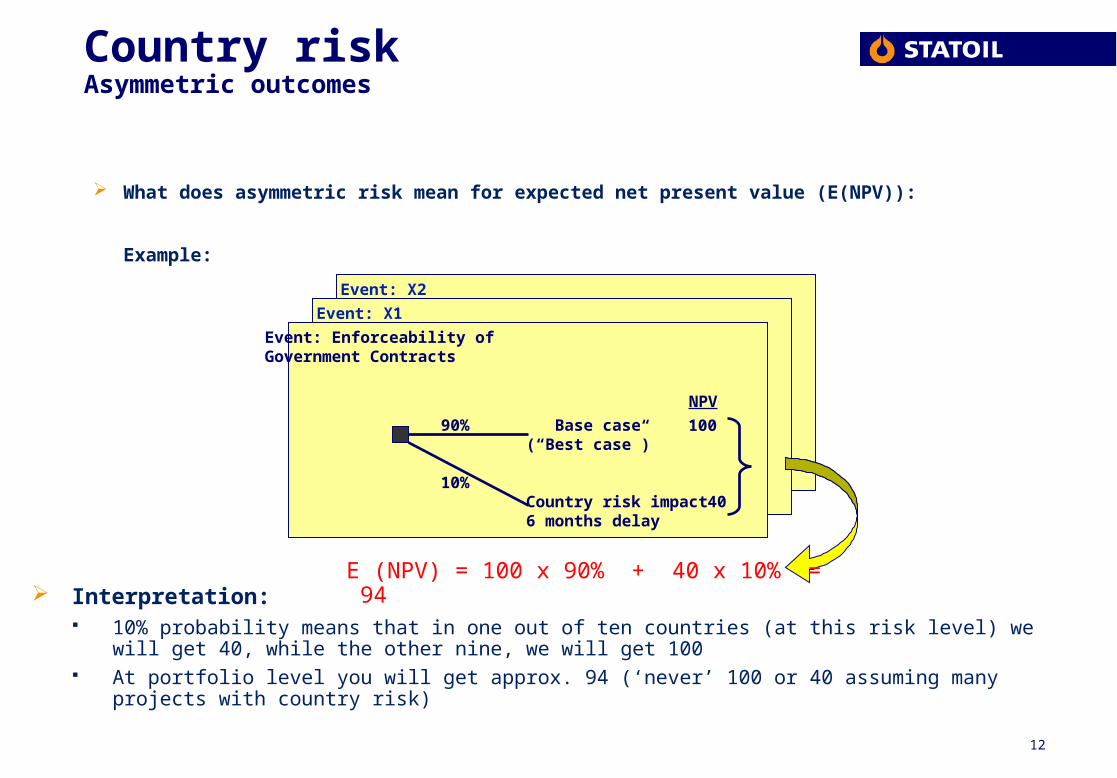
Country riskAsymmetric outcomes
What does asymmetric risk mean for expected net present value (E(NPV)):
Example:
Interpretation: 10% probability means that in one out of ten countries (at this risk level) we will get 40, while the other nine, we
will get 100 At portfolio level you will get approx. 94 (‘never’ 100 or 40 assuming many projects with country risk)
90%
10%
Event: Enforceability of Government Contracts
Base case(“Best case”)
Country risk impact6 months delay
NPV
100
40
E (NPV) = 100 x 90% + 40 x 10% = 94
Event: X1
Event: X2

13
Tax Asymmetry versus tax levelIllustrative
Tax asymmetry
NegativePositive
Low
High
Tax level
NCS
PSC
UK
Buy-
backs
GoM
Neutral”Low upside,
high downside”
”High upside,
low downside”

14
Risk and reward our different businesses
0 %
5 %
10 %
15 %
20 %
25 %
Basis oil NCSBasis nat. gas NCSTransportnet/processplants NCSUpstream oil internat.RetailRefiningPetrochemical
Moderate risk
Reward
Moderate to high riskLow risk
15
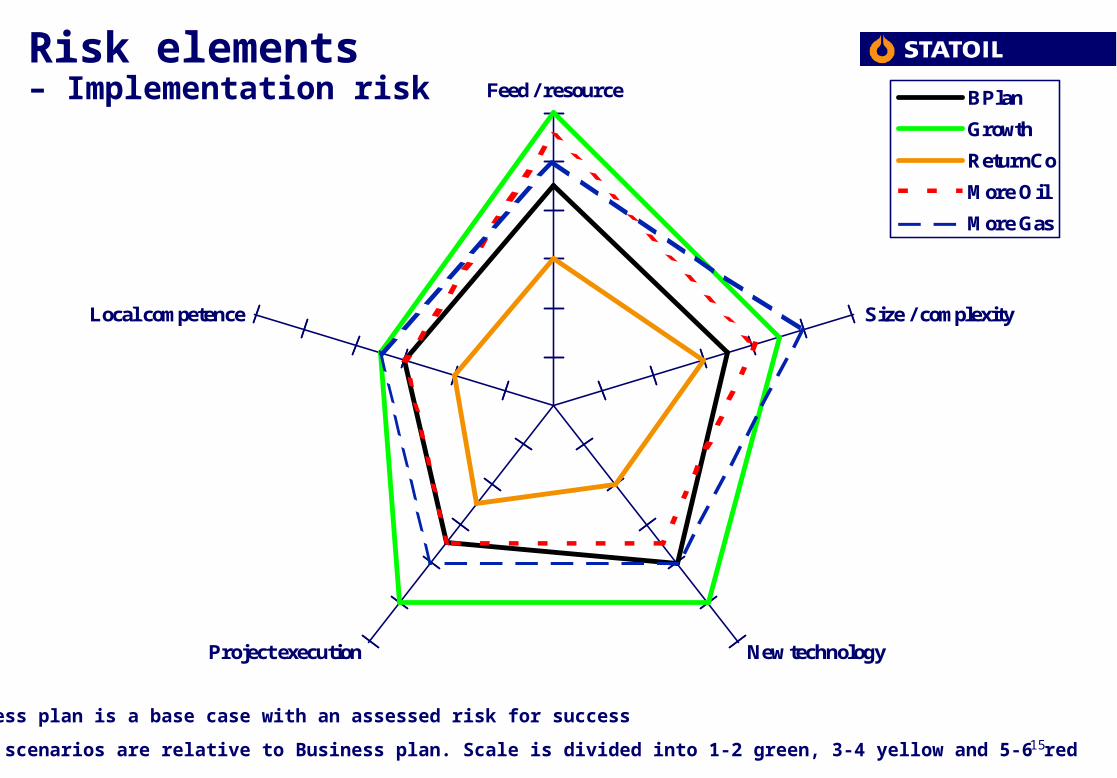
Risk elements – Implementation risk Feed / resource
Size / complexity
New technologyProject execution
Local competence
BPlan
Growth
ReturnCo
More Oil
More Gas
Business plan is a base case with an assessed risk for success
Other scenarios are relative to Business plan. Scale is divided into 1-2 green, 3-4 yellow and 5-6 red

Monitoring, controlling and reviewing your risk management framework.
17
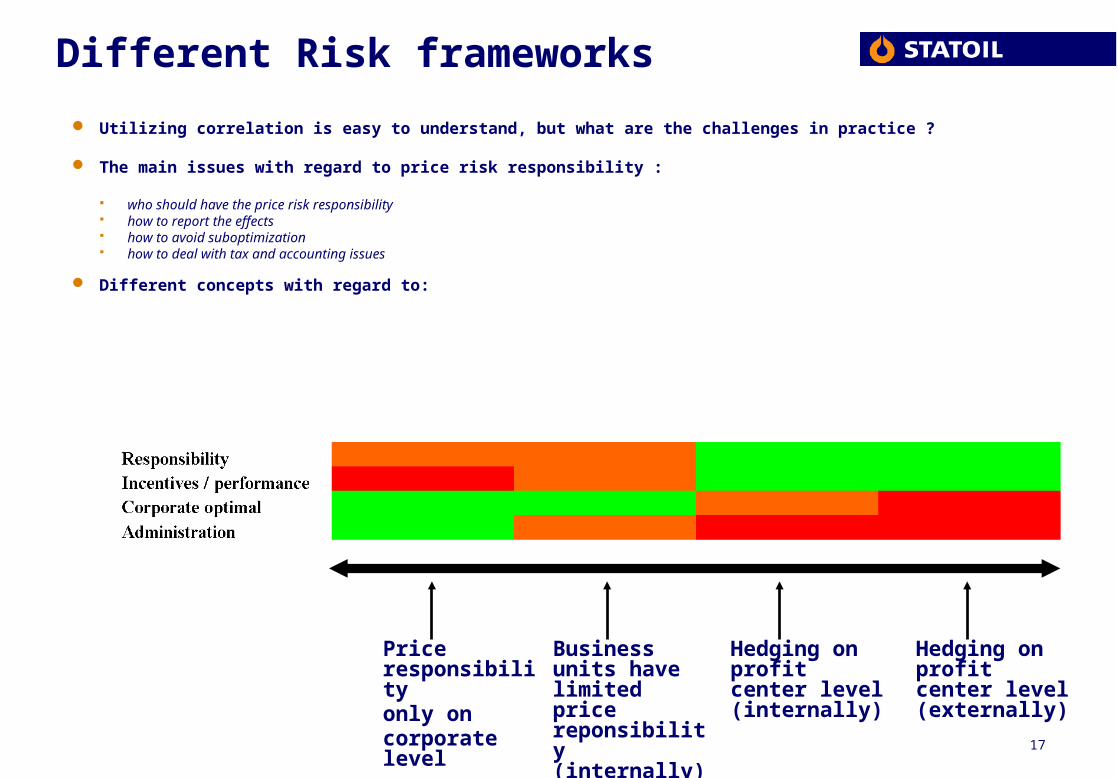
Different Risk frameworks
Utilizing correlation is easy to understand, but what are the challenges in practice ?
The main issues with regard to price risk responsibility :
who should have the price risk responsibility how to report the effects how to avoid suboptimization how to deal with tax and accounting issues
Different concepts with regard to:
Hedging on profit center level (internally)
Price responsibilityonly oncorporate level
Hedging on profit center level (externally)
Business units have limited price reponsibility (internally)

18
Reviewing VAR
Decide on a probabilty of loss Decide on a frequency Very low probability high frequency events give more comfort (99.9% daily var)
But….how do you test this? On average you’re going to exceed your VAR once every 1000 days (or four years)
Higher probability lower frequency events give better testability (75% weekly var) But….you lose more than your VAR every one week out of four How do you know what you could lose in extreme movements
However VAR is calculated, the methodology must have the following characteristics It should be reproducable It should be runnable on aggregate portfolios and should aggregate risk It should make sense for simple portfolios (I.e. if a swap has a VAR of X, twice the
position should give double the VAR) It should be “non-linear”. Options aren’t a “free risk strategy”. It should be timely.

19
Checking VAR
Data data data data data You must retain data on actual historical outcomes for books, portfolios, etc
Historical daily PnL numbers for last night’s positions (this is critical) Historical daily PnL numbers for each book including day trades (which you already
do…) Historical daily VAR numbers at a variety of probability levels (75%,90%,95%,99%?) This should be done at each level of aggregation
Once you have accumulated enough data (3 months?,6 months?) back test and mine the data. If your VAR methodology is correct, then the distribution of actual PnL for last night’s trades should match the distribution that your VAR implies. For example, one day in four, last night’s positions should lose more than your 75% VAR,
one day in 10, last night’s positions should lose more than your 90% VAR. The volatility of your total daily PnL is a more traditional risk return measure: the
sharpe ratio.

20
Presentation of ”the risk picture” for top management.
Executive board Monthly Annually

21
Section I: Tactical Risk
Low to medium risk in tactical trading.
The main market risk is in physical oil and plain paper instruments like futures, swaps and forwards, only minor risk in options, and we see that risk is focused on products like Brent, WTI, Fuel oil, gasoline and naphta.
VaR per instrument typeBase & Proprietary
Physical Futures Forwards Swaps Options
Base Propr.
VaR per physical productBase & Proprietary
Brent WTI ME crd Gasoline Distillates Fuel oils Naphtha LPG
Base Spec
VaR figures (95% - 1 day)
ChangeO&S Mandate VaR last month
Base 22,00 -1,76Proprietary 4,00 -0,43
Base + Proprietary 50 20,00 -2,01
Long Term DebtBase 20 13,00 -0,06Proprietary 5 2,00 0,08
Base + Proprietary 25 14,50 0,03
NGUK 2 1,50 0,20US 2 1,50 0,20
Aggregate VaRBase - 28,00 -2,20Base & Proprietary - 29,00 -2,30
O&S Base and Prop Trading
9-11 Scenario Stress Test Results vs. VAR @95%
-50-47-44-41-38-35-32-29-26-23-20-17-14-11
-8-5-214
02.ju
n.0
4
08.ju
n.0
4
21.ju
n.0
4
09.ju
l.04
21.ju
l.04
30.ju
l.04
25.a
ug
.04
06.s
ep.0
4
09.s
ep.0
4
14.s
ep.0
4
17.s
ep.0
4
22.s
ep.0
4
27.s
ep.0
4
30.s
ep.0
4
05.o
kt.0
4
08.o
kt.0
4
13.o
kt.0
4
18.o
kt.0
4
21.o
kt.0
4
26.o
kt.0
4
29.o
kt.0
4
05.n
ov.
04
10.n
ov.
04
17.n
ov.
04
22.n
ov.
04
25.n
ov.
04
30.n
ov.
04
mU
SD
9-11 stress test PERCENTVAR @95%, 1day
O&S Total Portfolio 9-11 Scenario Stress Test Results vs. VAR @95%
-30
-20
-10
0
10
20
30
03.01.05 31.01.05 28.02.05 28.03.05 25.04.05
mUSD
9-11 stress testPERCENTVAR @95%, 1day

22
Section II: Strategic Risk
The Kernel distribution is based on market forward prices and historical volatilities and correlations.
Brent forwards at historical very high level. Option prices at low level due to high forward level combined with moderate volatility in the market
Brent forward curves
25
30
35
40
45
50
2006 2007 2008 2009 2010
25 Feb 05
28 Jan 05
15 Des 04
USD/bbl
Hedge Status
Instrument Period Strike Hedged% of production
after taxUSD/bbl (mill bbls)
Put option Brent X Y Z %Put option Brent X Y Z %Put option Brent X Y Z %
Brent put options 2006(quarterly settled)
0,00
0,20
0,40
0,60
0,80
20.9.04 20.10.04 20.11.04 20.12.04 20.1.05 20.2.05
$ 24
$ 22
$ 20
USD/bbl
23
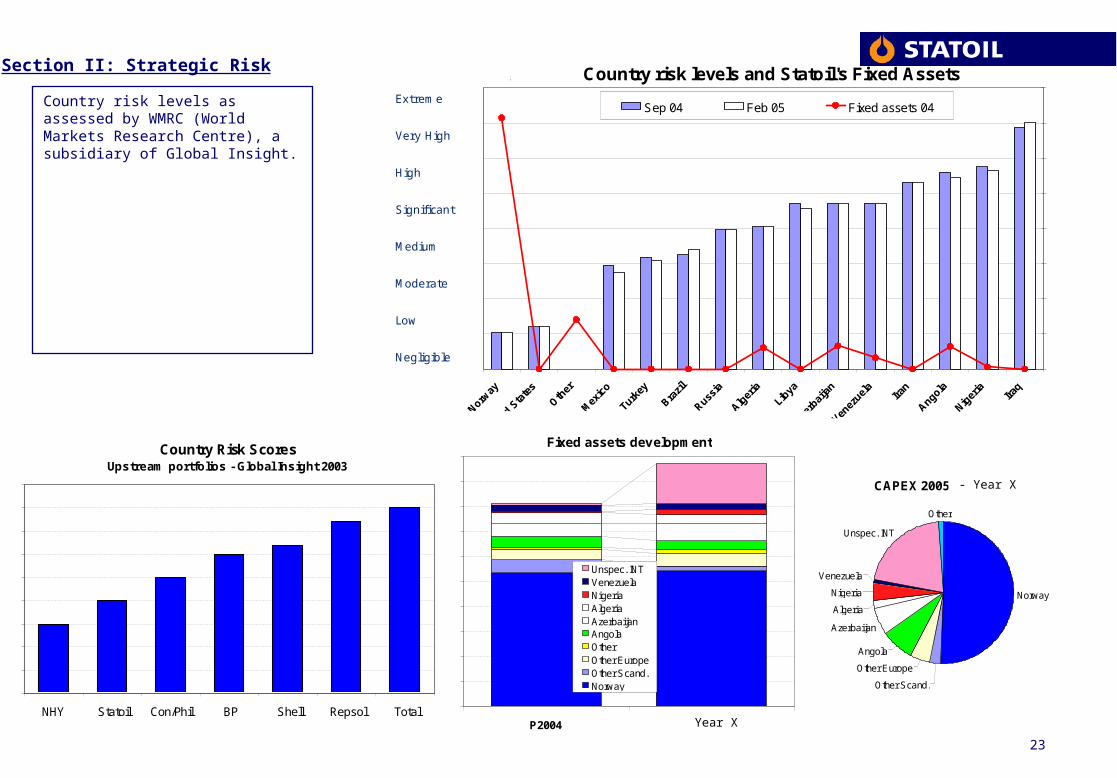
Section II: Strategic Risk
Country risk levels as assessed by WMRC (World Markets Research Centre), a subsidiary of Global Insight.
Extreme
Very High
High
Significant
Medium
Moderate
Low
Negligible
Country Risk ScoresUpstream portfolios - Global Insight 2003
NHY Statoil Con/Phil BP Shell Repsol Total
Country risk levels and Statoil's Fixed Assets
Sep 04 Feb 05 Fixed assets 04
Fixed Assets
RiskScores
Fixed assets development
P2004 2 009
Unspec. INTVenezuelaNigeriaAlgeriaAzerbaijanAngolaOtherOther EuropeOther Scand.Norway
CAPEX 2005 - 2009
Norway
Other Scand.
Other Europe
Angola
Azerbaijan
Algeria
Nigeria
Venezuela
Unspec. INT
Other
Year X
- Year X
24
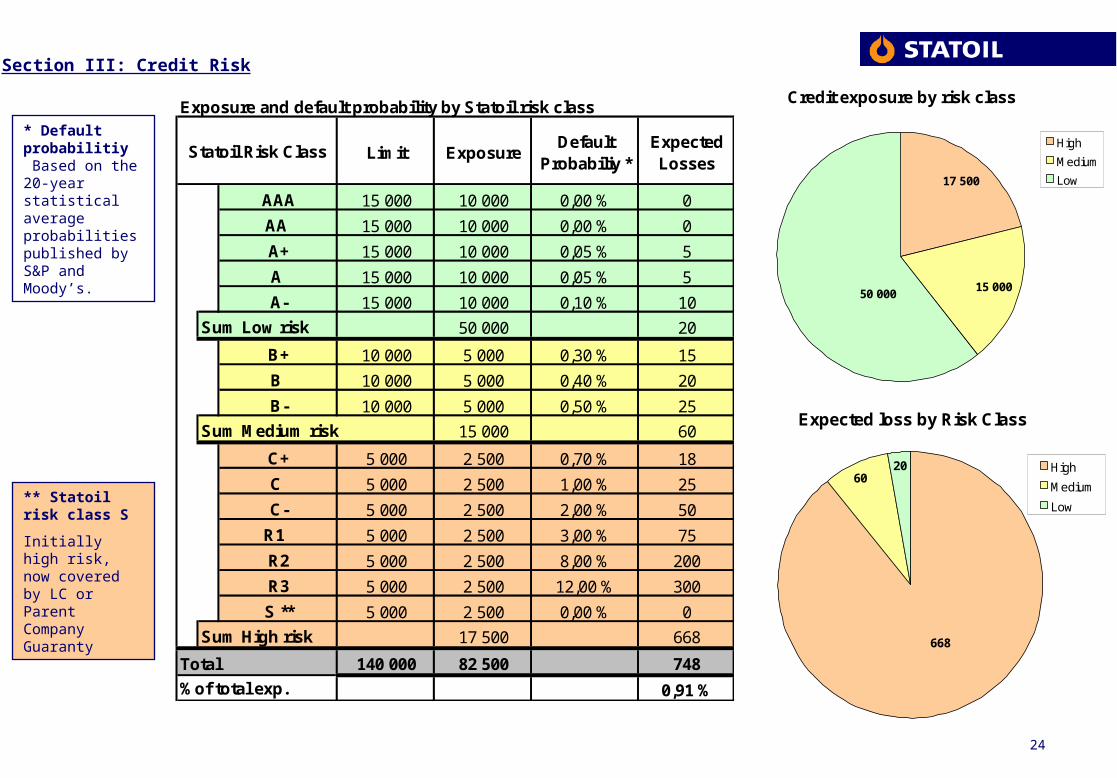
Section III: Credit Risk
* Default probabilitiy Based on the 20-year statistical average probabilities published by S&P and Moody’s.
** Statoil risk class S
Initially high risk, now covered by LC or Parent Company Guaranty
Exposure and default probability by Statoil risk class
Limit ExposureDefault
Probabiliy *Expected Losses
AAA 15 000 10 000 0,00 % 0
AA 15 000 10 000 0,00 % 0
A+ 15 000 10 000 0,05 % 5
A 15 000 10 000 0,05 % 5
A- 15 000 10 000 0,10 % 10
Sum Low risk 50 000 20
B+ 10 000 5 000 0,30 % 15
B 10 000 5 000 0,40 % 20
B- 10 000 5 000 0,50 % 25
Sum Medium risk 15 000 60
C+ 5 000 2 500 0,70 % 18
C 5 000 2 500 1,00 % 25
C- 5 000 2 500 2,00 % 50
R1 5 000 2 500 3,00 % 75
R2 5 000 2 500 8,00 % 200
R3 5 000 2 500 12,00 % 300
S ** 5 000 2 500 0,00 % 0
Sum High risk 17 500 668
Total 140 000 82 500 748
%of total exp. 0,91 %
Statoil Risk Class
Credit exposure by risk class
50 000
17 500
15 000
High
Medium
Low
Total exposure: 82500
Expected loss by Risk Class
2060
668
High
Medium
Low
Total expected losses: 748
25
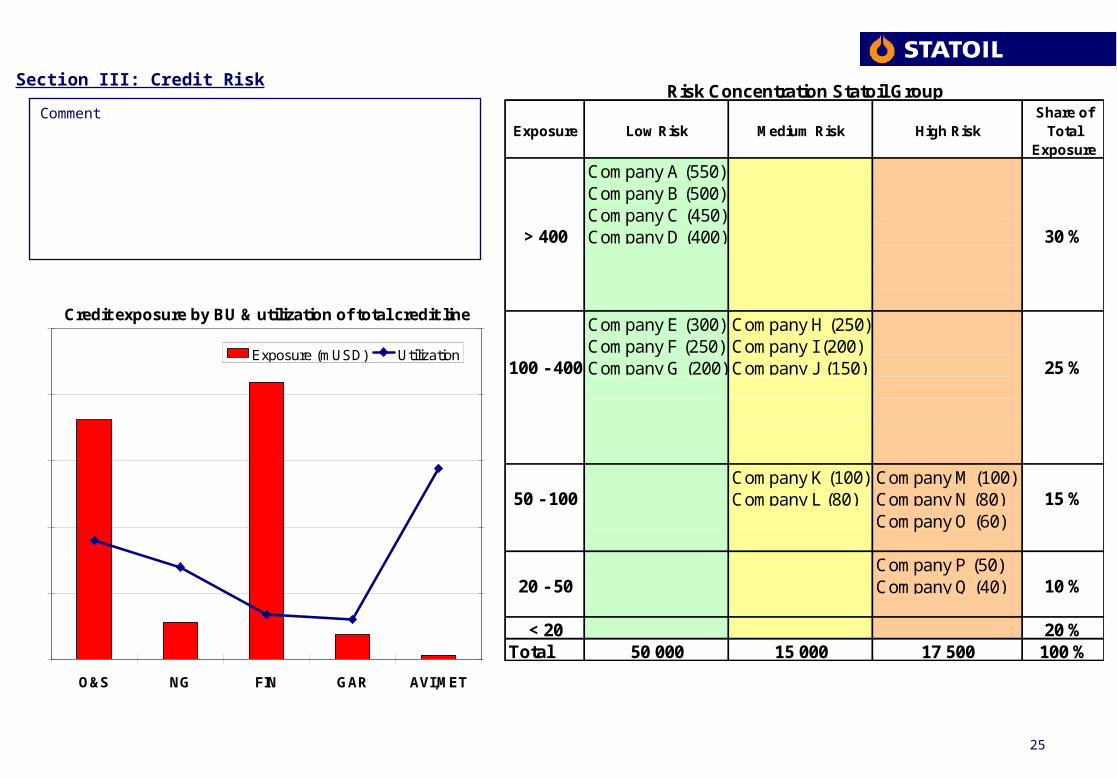
Section III: Credit Risk
Comment
Credit exposure by BU & utilization of total credit line
O&S NG FIN GAR AVI,MET
Exposure (mUSD) Utilization
Exposure Low Risk Medium Risk High Risk Share of
Total Exposure
Company A (550)Company B (500)Company C (450)
> 400 Company D (400) 30 %
Company E (300) Company H (250)Company F (250) Company I (200)
100 - 400 Company G (200) Company J (150) 25 %
Company K (100) Company M (100)50 - 100 Company L (80) Company N (80) 15 %
Company O (60)
Company P (50)20 - 50 Company Q (40) 10 %
< 20 20 %Total 50 000 15 000 17 500 100 %
Risk Concentration Statoil Group

26
Section IV: Insurance
Comment
Comment
Capital structure and exposure
Currentcapital
Oneplatform
Post oneevent
A secondplatform
Post twoevents
Risk Capital
Equity
Overall risk distribution Statoil insured assets
Statoil ASA selfinsurance
STAFOR
OIL / sEnergy
Market
External market inkl.
Lloyds/London, USA &
Europe
Q/S
STAFOR
Mutuals &
STAFOR
STAFOR
Statoil self insurance
STAFOR insurance structure
Insurance by asset
Market
OIL/ sEnergy
Stafor
Statoil ASA self insurance
Top Related