


Languages
Pages
Legal

Energy Efficiency and
Conservation
Master Plan up to 2030
Sustainable and Renewable Energy Development Authority
(SREDA)
and
Power Division
Ministry of Power, Energy and Mineral Resources
Government of the People’s Republic of Bangladesh
March 2015
i
TABLE OF CONTENTS
Executive Summary
1. Background .......................................................................................................................................... ii
1.1 Energy Demand ......................................................................................................................... ii
2. Master Plan .......................................................................................................................................... v
2.1 Objective of Energy Efficiency and Conservation Master Plan............................................ v
2.2 Overview of Energy Consumption .......................................................................................... vi
2.3 EE&C Potential ........................................................................................................................... viii
2.4 Toward “Self-Reliant EE&C Society”: Target and Implementation Roadmap .................... ix
3.Action Plan ............................................................................................................................................ x
3.1 Overview ..................................................................................................................................... x
3.2 Roles and Responsibilities ........................................................................................................ x
3.3 EE&C Programs ......................................................................................................................... xi
3.4 Monitoring and Review of the EE&C Programs .................................................................... xii
4. Economic Analysis ............................................................................................................................... xiii
5. Capacity Development and Awareness Raising .............................................................................. xv
Chapter 1 Introduction ......................................................................................................................... 1
1.1 Background ................................................................................................................................ 1
1.2 Objective of the Energy Efficiency and Conservation Master Plan ..................................... 6
1.3 Overview of Energy and Electricity ......................................................................................... 7
1.4 Existing policies on energy supply and energy use including acts, rules, regulations,
standards, guidelines and projects ..................................................................................... 13
1.5 Stakeholder’s Participation in EE&C Planning and Policy Making ...................................... 15
Chapter 2 Master Plan .......................................................................................................................... 16
2.1 Master Plan ................................................................................................................................ 16
2.2 Roadmap (from 2015 up to 2030, every 5years) ................................................................... Error! Bookmark not defined.
2.3 Monitoring and Review of the Plan ........................................................................................ 24
Chapter 3 Action Plan .......................................................................................................................... 27
3.3 EE&C Programs (Overview) ..................................................................................................... 35
3.4 Energy Management Program ................................................................................................ 35
3.5 EE (Energy Efficiency) Labeling Program ................................................................................ 46
3.6 EE Building Program ................................................................................................................. 53
3.7 EE&C Financial Incentive Programs ........................................................................................ 61
3.8 Government Own Initiative on EE&C Implementation ........................................................ 71
3.9 Country’s Energy Consumption Data Collection Mechanism ............................................. 73
3.10 Global Warming Countermeasure ........................................................................................ 75
3.11 Cooperation with International Donor Agencies ................................................................ 77
ii
Chapter 4 Economic Analysis of the EE&C Programs ...................................................................... 78
4.1 Background and Objectives ..................................................................................................... 78
4.2 Economic Impact of EE&C Implementation .......................................................................... 78
4.3 Cost-Benefit Analysis ................................................................................................................ 79
4.4 Cost Effectiveness Analysis ...................................................................................................... 83
Chapter 5 Capacity Development and EE&C Awareness Raising ................................................... 86
5.1 Overview ..................................................................................................................................... 86
5.2 Roles of the Government on Capacity Development and Awareness Raising .................. 86
5.3 Capacity Development for the Government .......................................................................... 86
5.4 Capacity Development for Energy Experts ............................................................................ 87
5.5 Capacity Development and Awareness Raising for Private Sectors ................................... 87
5.6 Awareness raising for Residential Sectors .............................................................................. 88
5.7 Roadmap .................................................................................................................................... 88
Energy Efficiency and Conservation Master Plan
Foreword
Energy has become one of the most important factors for better economic growth
and people’s life in Bangladesh. After decades of dependency on domestic natural
gas, we find ourselves not equipped with sufficient energy resources in our land,
and will gradually rely on imported fuels. Also, we are well aware that the use of
fossil energy increases Greenhouse Gas emission, which accelerates global
warming and causes climate change, and suffers our country by natural calamities.
Energy efficiency and conservation is a cross-cutting issue for all the people. We
hereby issue the Energy Efficiency and Conservation Master Plan, and declare our
unyielding commitment of its implementation.
ab - i
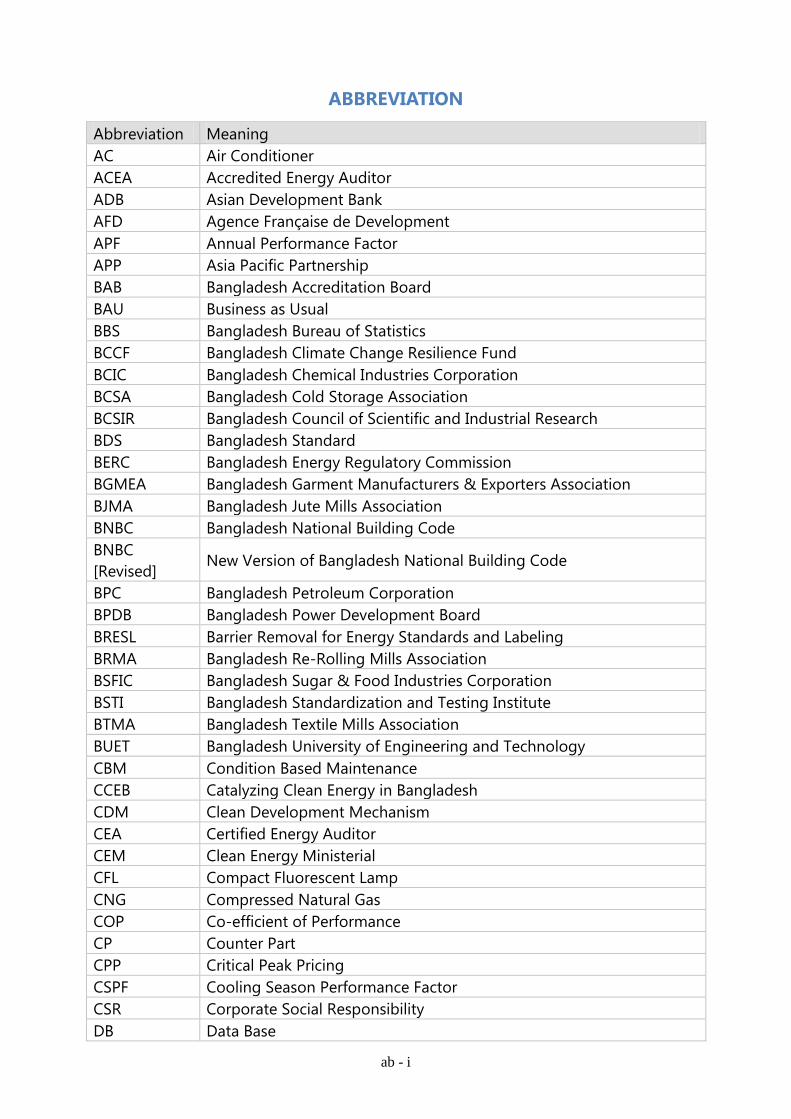
ABBREVIATION
Abbreviation Meaning
AC Air Conditioner
ACEA Accredited Energy Auditor
ADB Asian Development Bank
AFD Agence Française de Development
APF Annual Performance Factor
APP Asia Pacific Partnership
BAB Bangladesh Accreditation Board
BAU Business as Usual
BBS Bangladesh Bureau of Statistics
BCCF Bangladesh Climate Change Resilience Fund
BCIC Bangladesh Chemical Industries Corporation
BCSA Bangladesh Cold Storage Association
BCSIR Bangladesh Council of Scientific and Industrial Research
BDS Bangladesh Standard
BERC Bangladesh Energy Regulatory Commission
BGMEA Bangladesh Garment Manufacturers & Exporters Association
BJMA Bangladesh Jute Mills Association
BNBC Bangladesh National Building Code
BNBC
[Revised] New Version of Bangladesh National Building Code
BPC Bangladesh Petroleum Corporation
BPDB Bangladesh Power Development Board
BRESL Barrier Removal for Energy Standards and Labeling
BRMA Bangladesh Re-Rolling Mills Association
BSFIC Bangladesh Sugar & Food Industries Corporation
BSTI Bangladesh Standardization and Testing Institute
BTMA Bangladesh Textile Mills Association
BUET Bangladesh University of Engineering and Technology
CBM Condition Based Maintenance
CCEB Catalyzing Clean Energy in Bangladesh
CDM Clean Development Mechanism
CEA Certified Energy Auditor
CEM Clean Energy Ministerial
CFL Compact Fluorescent Lamp
CNG Compressed Natural Gas
COP Co-efficient of Performance
CP Counter Part
CPP Critical Peak Pricing
CSPF Cooling Season Performance Factor
CSR Corporate Social Responsibility
DB Data Base
ab - ii
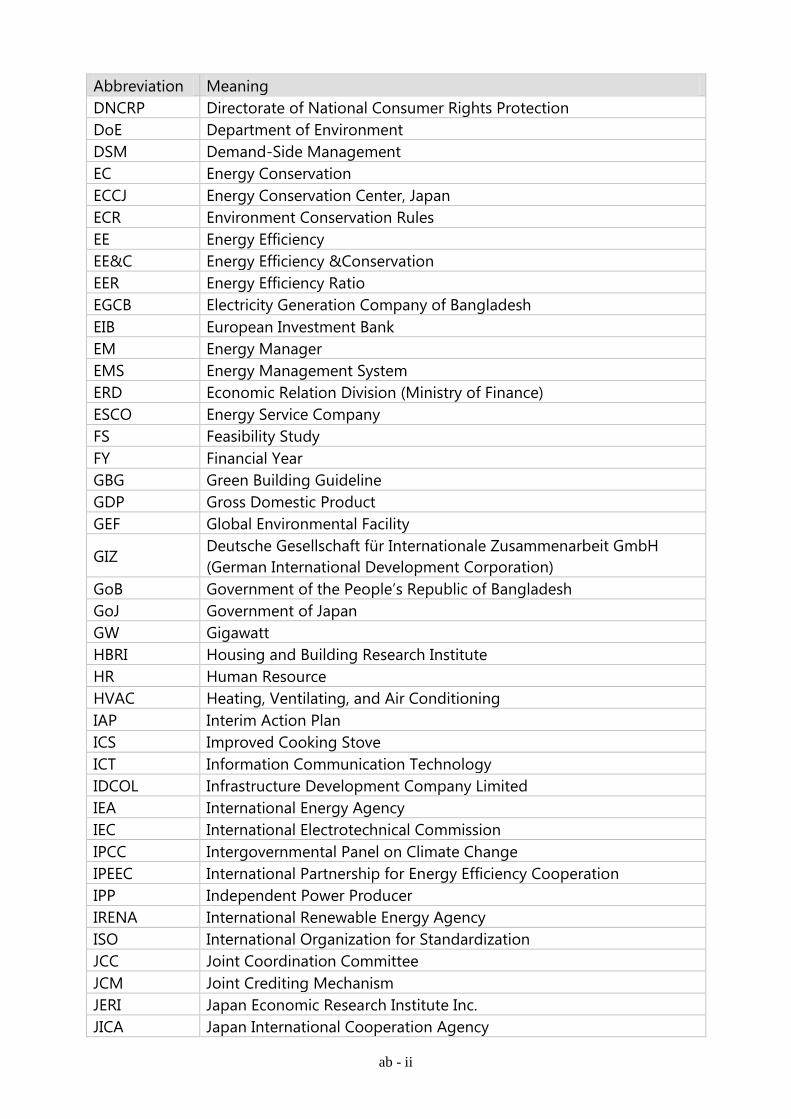
Abbreviation Meaning
DNCRP Directorate of National Consumer Rights Protection
DoE Department of Environment
DSM Demand-Side Management
EC Energy Conservation
ECCJ Energy Conservation Center, Japan
ECR Environment Conservation Rules
EE Energy Efficiency
EE&C Energy Efficiency &Conservation
EER Energy Efficiency Ratio
EGCB Electricity Generation Company of Bangladesh
EIB European Investment Bank
EM Energy Manager
EMS Energy Management System
ERD Economic Relation Division (Ministry of Finance)
ESCO Energy Service Company
FS Feasibility Study
FY Financial Year
GBG Green Building Guideline
GDP Gross Domestic Product
GEF Global Environmental Facility
GIZ Deutsche Gesellschaft für Internationale Zusammenarbeit GmbH
(German International Development Corporation)
GoB Government of the People’s Republic of Bangladesh
GoJ Government of Japan
GW Gigawatt
HBRI Housing and Building Research Institute
HR Human Resource
HVAC Heating, Ventilating, and Air Conditioning
IAP Interim Action Plan
ICS Improved Cooking Stove
ICT Information Communication Technology
IDCOL Infrastructure Development Company Limited
IEA International Energy Agency
IEC International Electrotechnical Commission
IPCC Intergovernmental Panel on Climate Change
IPEEC International Partnership for Energy Efficiency Cooperation
IPP Independent Power Producer
IRENA International Renewable Energy Agency
ISO International Organization for Standardization
JCC Joint Coordination Committee
JCM Joint Crediting Mechanism
JERI Japan Economic Research Institute Inc.
JICA Japan International Cooperation Agency
ab - iii
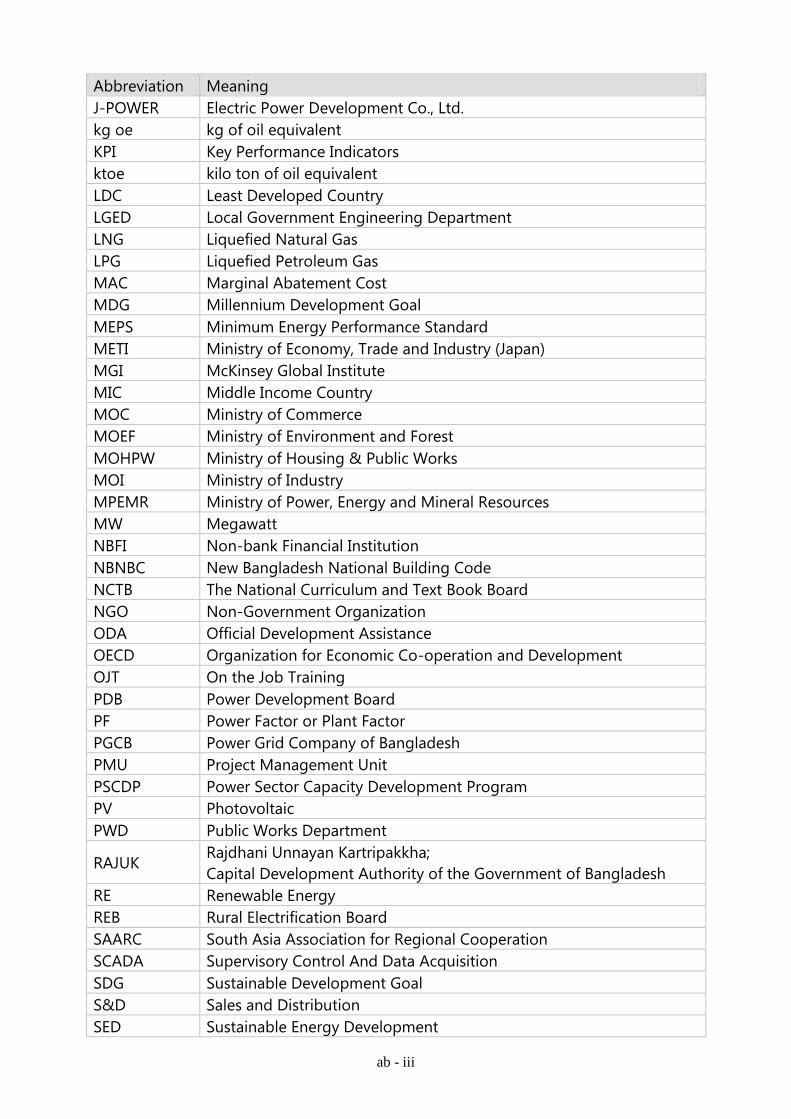
Abbreviation Meaning
J-POWER Electric Power Development Co., Ltd.
kg oe kg of oil equivalent
KPI Key Performance Indicators
ktoe kilo ton of oil equivalent
LDC Least Developed Country
LGED Local Government Engineering Department
LNG Liquefied Natural Gas
LPG Liquefied Petroleum Gas
MAC Marginal Abatement Cost
MDG Millennium Development Goal
MEPS Minimum Energy Performance Standard
METI Ministry of Economy, Trade and Industry (Japan)
MGI McKinsey Global Institute
MIC Middle Income Country
MOC Ministry of Commerce
MOEF Ministry of Environment and Forest
MOHPW Ministry of Housing & Public Works
MOI Ministry of Industry
MPEMR Ministry of Power, Energy and Mineral Resources
MW Megawatt
NBFI Non-bank Financial Institution
NBNBC New Bangladesh National Building Code
NCTB The National Curriculum and Text Book Board
NGO Non-Government Organization
ODA Official Development Assistance
OECD Organization for Economic Co-operation and Development
OJT On the Job Training
PDB Power Development Board
PF Power Factor or Plant Factor
PGCB Power Grid Company of Bangladesh
PMU Project Management Unit
PSCDP Power Sector Capacity Development Program
PV Photovoltaic
PWD Public Works Department
RAJUK Rajdhani Unnayan Kartripakkha;
Capital Development Authority of the Government of Bangladesh
RE Renewable Energy
REB Rural Electrification Board
SAARC South Asia Association for Regional Cooperation
SCADA Supervisory Control And Data Acquisition
SDG Sustainable Development Goal
S&D Sales and Distribution
SED Sustainable Energy Development
ab - iv
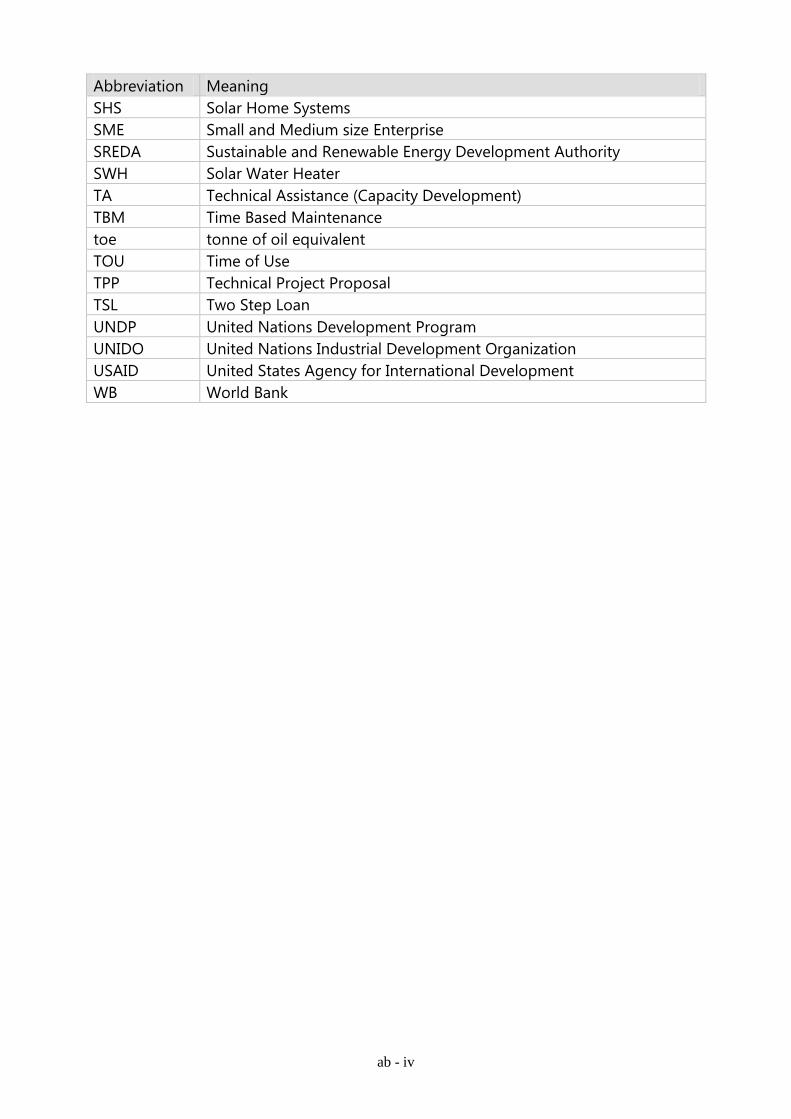
Abbreviation Meaning
SHS Solar Home Systems
SME Small and Medium size Enterprise
SREDA Sustainable and Renewable Energy Development Authority
SWH Solar Water Heater
TA Technical Assistance (Capacity Development)
TBM Time Based Maintenance
toe tonne of oil equivalent
TOU Time of Use
TPP Technical Project Proposal
TSL Two Step Loan
UNDP United Nations Development Program
UNIDO United Nations Industrial Development Organization
USAID United States Agency for International Development
WB World Bank
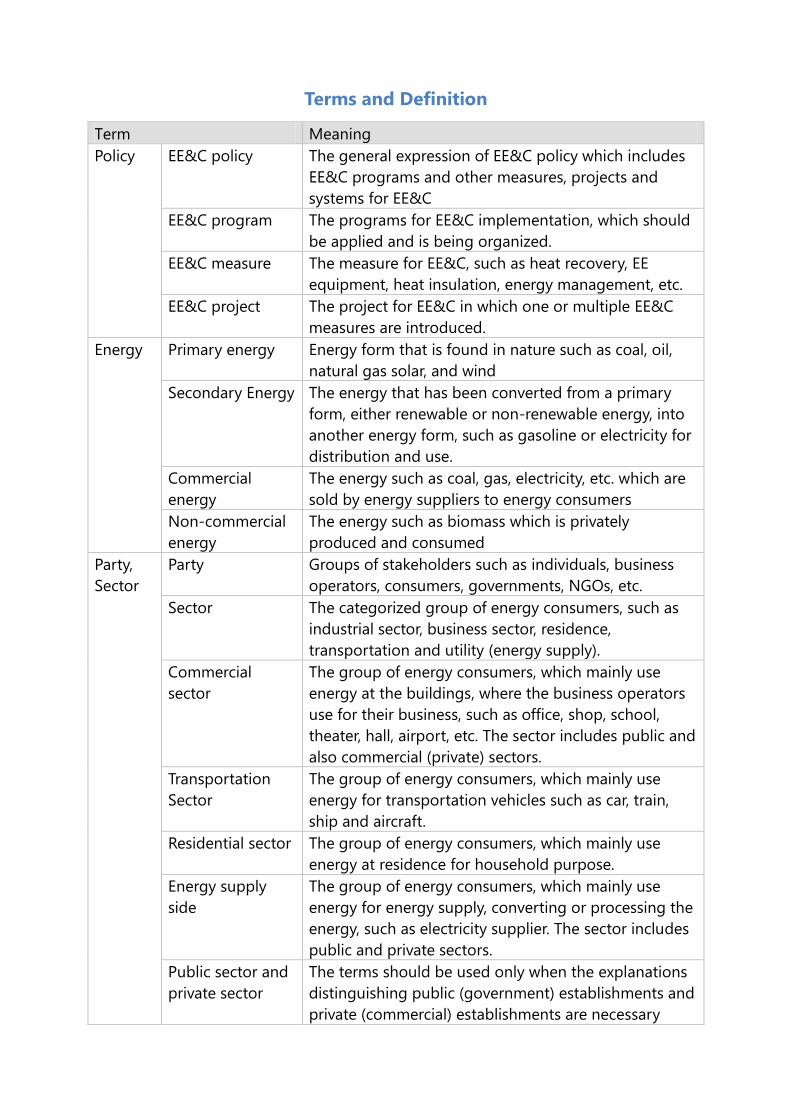
Terms and Definition
Term Meaning
Policy EE&C policy The general expression of EE&C policy which includes
EE&C programs and other measures, projects and
systems for EE&C
EE&C program The programs for EE&C implementation, which should
be applied and is being organized.
EE&C measure The measure for EE&C, such as heat recovery, EE
equipment, heat insulation, energy management, etc.
EE&C project The project for EE&C in which one or multiple EE&C
measures are introduced.
Energy Primary energy Energy form that is found in nature such as coal, oil,
natural gas solar, and wind
Secondary Energy The energy that has been converted from a primary
form, either renewable or non-renewable energy, into
another energy form, such as gasoline or electricity for
distribution and use.
Commercial
energy
The energy such as coal, gas, electricity, etc. which are
sold by energy suppliers to energy consumers
Non-commercial
energy
The energy such as biomass which is privately
produced and consumed
Party,
Sector
Party Groups of stakeholders such as individuals, business
operators, consumers, governments, NGOs, etc.
Sector The categorized group of energy consumers, such as
industrial sector, business sector, residence,
transportation and utility (energy supply).
Commercial
sector
The group of energy consumers, which mainly use
energy at the buildings, where the business operators
use for their business, such as office, shop, school,
theater, hall, airport, etc. The sector includes public and
also commercial (private) sectors.
Transportation
Sector
The group of energy consumers, which mainly use
energy for transportation vehicles such as car, train,
ship and aircraft.
Residential sector The group of energy consumers, which mainly use
energy at residence for household purpose.
Energy supply
side
The group of energy consumers, which mainly use
energy for energy supply, converting or processing the
energy, such as electricity supplier. The sector includes
public and private sectors.
Public sector and
private sector
The terms should be used only when the explanations
distinguishing public (government) establishments and
private (commercial) establishments are necessary
ab - iv
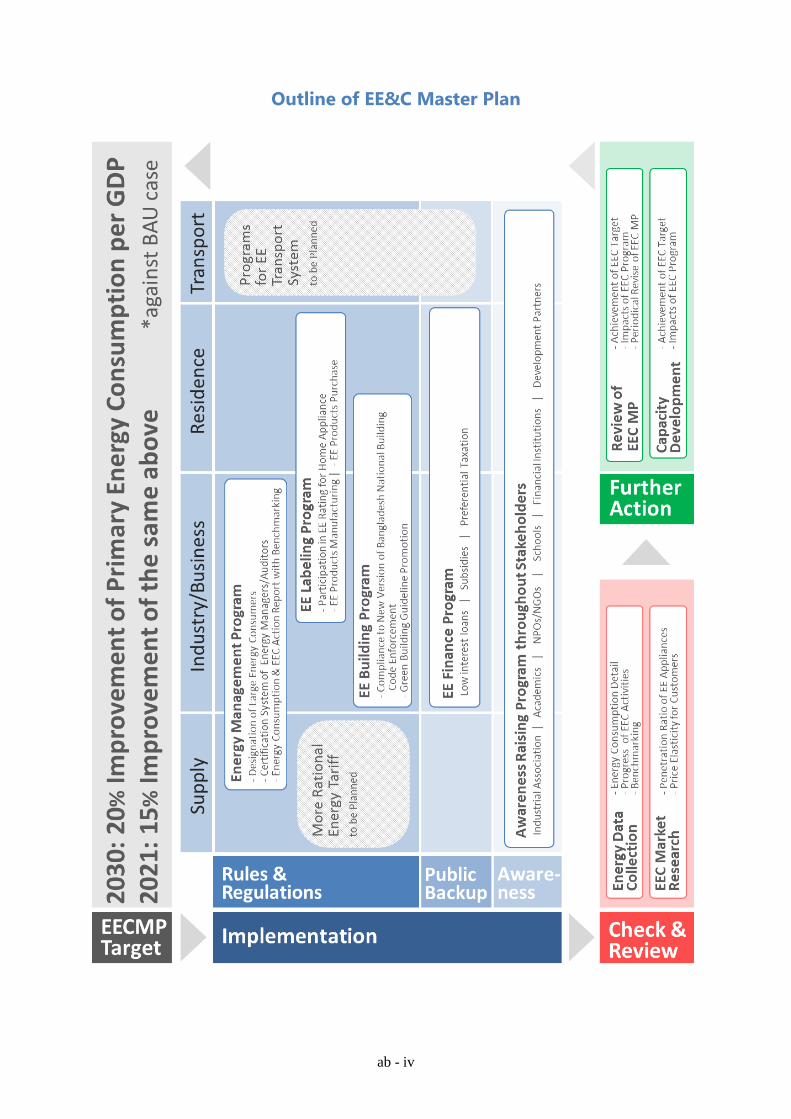
Outline of EE&C Master Plan
ab - iv
Executive Summary
1. Background
1.1 Energy Demand
Bangladesh is a densely populated country with about 161 million people living in 147,570
square kilometers of land. In order to maintain a sustainable GDP growth of 7% and above up to
2020 and beyond, the Government of Bangladesh (GOB) needs to meet the essential energy
needs of the people and industries. For this purpose, demand-side energy management is just as
important as supply-side infrastructure development. The Sustainable & Renewable Energy
Development Authority (SREDA) was thus established by Bangladesh Parliament in May 2012
as a national nodal organization for promoting demand-side energy efficiency and conservation
in the country.
A rapidly growing country like Bangladesh needs a huge amount of energy to feed its large
growth appetite. There is no room for wasting energy.
Energy Efficiency (EE) means high competitiveness; it means producing more with less energy.
Thus earned “energy savings” can be wisely reinvested. Business establishments can reinvest
them to expand their businesses. The households can reinvest them for their children’s’
education and health cares. The Government can invest less in energy subsidies and more in
industrial development.
EE is about national energy security; the Government can reduce import of expensive fuels,
which is expected to increase in early 2020’s, and improve the international balance of
payments.
The Government aims to improve energy intensity (national primary energy consumption per
gross domestic product/GDP) in 2030 by 20% compared to the 2013 level: A total of 95 million
toe (113 billion m3 of gas equivalent) is expected to be saved in the period. Energy savings will
amount to BDT 768 billion in total, or an annual average BDT 51 billion at the current weighted
average natural gas price. This goal will not be attained without the Government’s strong
leadership, peoples’ consciousness and actions to realize it.
In 2030, the total primary energy consumption of Bangladesh, excluding transportation and
biomass, is estimated to reach over 72 Mtoe, triple the size of 2013. (See Figure 1-1) It is now
the high time for stakeholders to start Energy Efficiency & Conservation (EE&C). Before the
country’s natural gas reserves start to decrease in 2018, before the imports of coal and LNG
starts to increase in 2021-22, and before the country’s industrial structure change from labor
intensive to energy intensive ones, the Government must strive ahead with the promotion of
EE&C, to urge the general public to lead energy efficient, non-energy wasting and most
productive lives.
ab - iv
1.2 Energy Supply
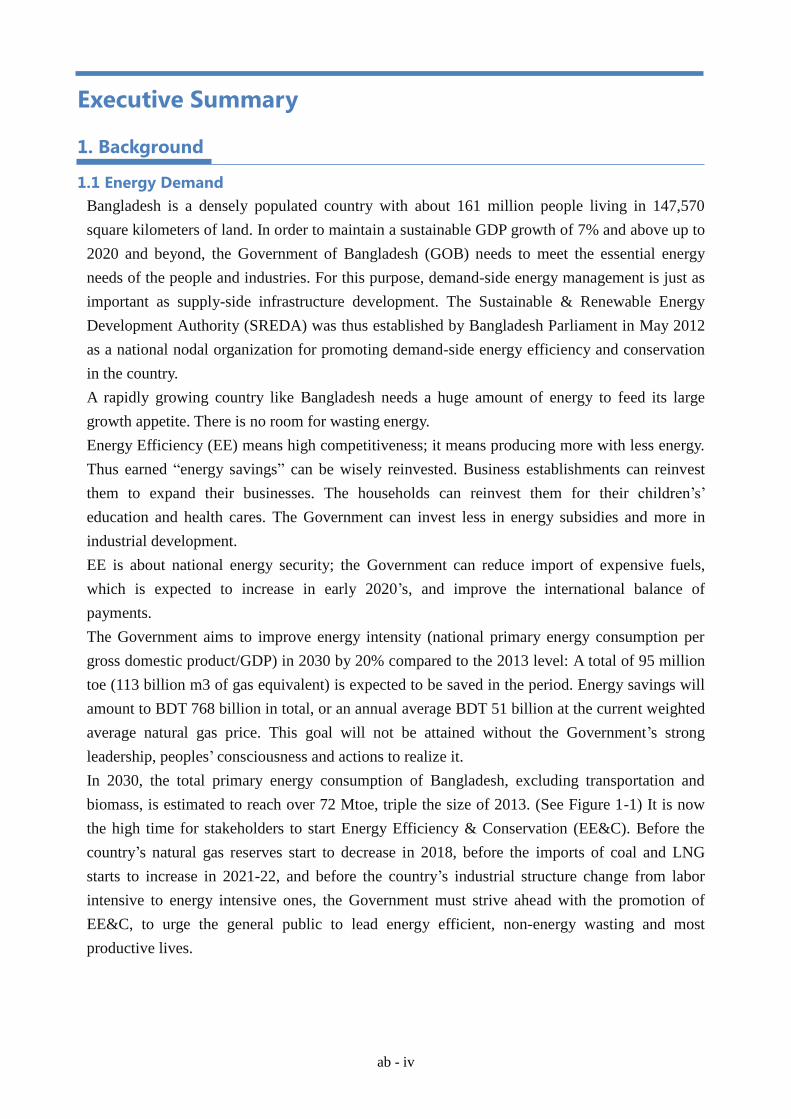
Bangladesh has been able to exploit its abundant natural gas reserves. As shown in Figure 1-2,
around one fourth of its energy supply depends on natural gas. It is anticipated, however, that the
gas supply will reach its peak in 2018 and gradually decrease thereafter. Therefore, the country
cannot build another gas fired power plants, but instead resort to other natural resources for
power generation, such as oil, LNG and coal, as shown in Figure 1-3. The Government plans to
develop the Matarbari Island area to build ports and facilities which allow imports of coals and
liquefied natural gas (LNG) for power generations from after 2021 and 2022, respectively. The
development of other type of power generation (such as nuclear and hydro power generation)
awaits negotiation with partner countries, and seems not able to start operation before 2030.
Figure 1-2 Trend of Source of Energy Supply
Source: IEA country statistics, excluding biomass
It is expected that by taking the EE&C scenario (i.e., 20% energy efficiency improvement by
2030 compared with the 2013 level), the electricity demand in 2030 will be reduced by 8GW
compared with the BAU case. This will lead to the decrease in the amount of fuel imports for
power generation, resulting in a cumulative savings of DBT 2.3trillion between 2015 and 2030
or an average annual savings of 135 billion taka, which is equivalent of 6% of national budget
and 1% of GDP (2013).
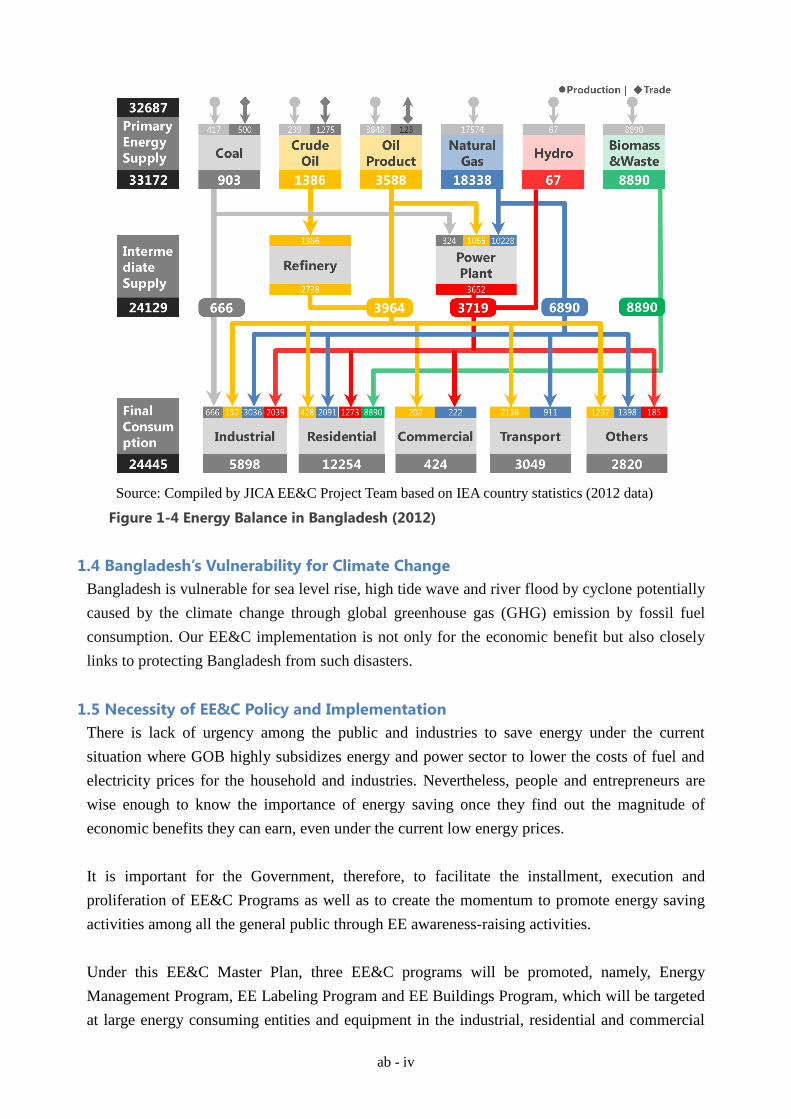
1.3 Energy Balance in Bangladesh
Figure 1-4 shows the energy balance of Bangladesh in 2012 with data mainly from International
Energy Agency (IEA). Our primary energy supply is 33,172 ktoe, of which 55% is dependent on
domestic natural gas, followed by 27% of biomass & waste in rural area and 15% of imported
oil. On the demand side, out of 24,445 ktoe final consumption, the industrial sector uses 24%
and residential sector (excluding biomass & waste) follows at 15%.
ab - iv
Source: Compiled by JICA EE&C Project Team based on IEA country statistics (2012 data)
Figure 1-4 Energy Balance in Bangladesh (2012)
1.4 Bangladesh’s Vulnerability for Climate Change
Bangladesh is vulnerable for sea level rise, high tide wave and river flood by cyclone potentially
caused by the climate change through global greenhouse gas (GHG) emission by fossil fuel
consumption. Our EE&C implementation is not only for the economic benefit but also closely
links to protecting Bangladesh from such disasters.
1.5 Necessity of EE&C Policy and Implementation
There is lack of urgency among the public and industries to save energy under the current
situation where GOB highly subsidizes energy and power sector to lower the costs of fuel and
electricity prices for the household and industries. Nevertheless, people and entrepreneurs are
wise enough to know the importance of energy saving once they find out the magnitude of
economic benefits they can earn, even under the current low energy prices.
It is important for the Government, therefore, to facilitate the installment, execution and
proliferation of EE&C Programs as well as to create the momentum to promote energy saving
activities among all the general public through EE awareness-raising activities.
Under this EE&C Master Plan, three EE&C programs will be promoted, namely, Energy
Management Program, EE Labeling Program and EE Buildings Program, which will be targeted
at large energy consuming entities and equipment in the industrial, residential and commercial
ab - iv
sectors. During the period between 2015 and 2030, a total of 5.3 Mtoe/ year or the energy
savings of approx. BDT 100 billion/year can be achieved through the adoption and
implementation of the three EE&C Programs.
In addition, the Government considers it important to provide EE Finance Program to raise EE
awareness among the power end users and boost their investments in EE products. Financial
incentives such as loan interest loans, subsides and preferential tax will be provided to lessen the
financial burden (initial cots) of end users who will purchase high energy efficient electric
appliances and industrial equipment.
2. Master Plan
2.1 Objective of Energy Efficiency and Conservation Master Plan
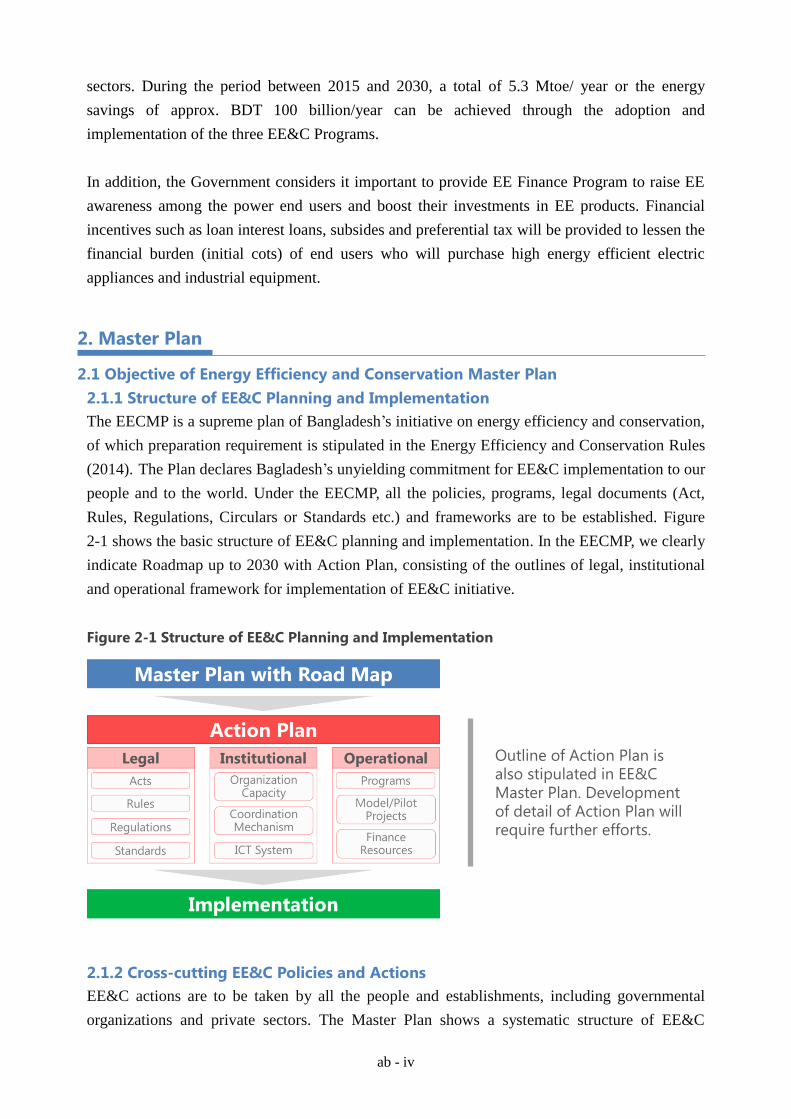
2.1.1 Structure of EE&C Planning and Implementation
The EECMP is a supreme plan of Bangladesh’s initiative on energy efficiency and conservation,
of which preparation requirement is stipulated in the Energy Efficiency and Conservation Rules
(2014). The Plan declares Bagladesh’s unyielding commitment for EE&C implementation to our
people and to the world. Under the EECMP, all the policies, programs, legal documents (Act,
Rules, Regulations, Circulars or Standards etc.) and frameworks are to be established. Figure
2-1 shows the basic structure of EE&C planning and implementation. In the EECMP, we clearly
indicate Roadmap up to 2030 with Action Plan, consisting of the outlines of legal, institutional
and operational framework for implementation of EE&C initiative.
Figure 2-1 Structure of EE&C Planning and Implementation
2.1.2 Cross-cutting EE&C Policies and Actions
EE&C actions are to be taken by all the people and establishments, including governmental
organizations and private sectors. The Master Plan shows a systematic structure of EE&C
Outline of Action Plan is also stipulated in EE&C Master Plan. Development of detail of Action Plan will require further efforts.
ab - iv
policies/programs and actions carried out by ourselves. More elaborated plan is to be
implemented through cross-cutting discussions among the related stakeholders.
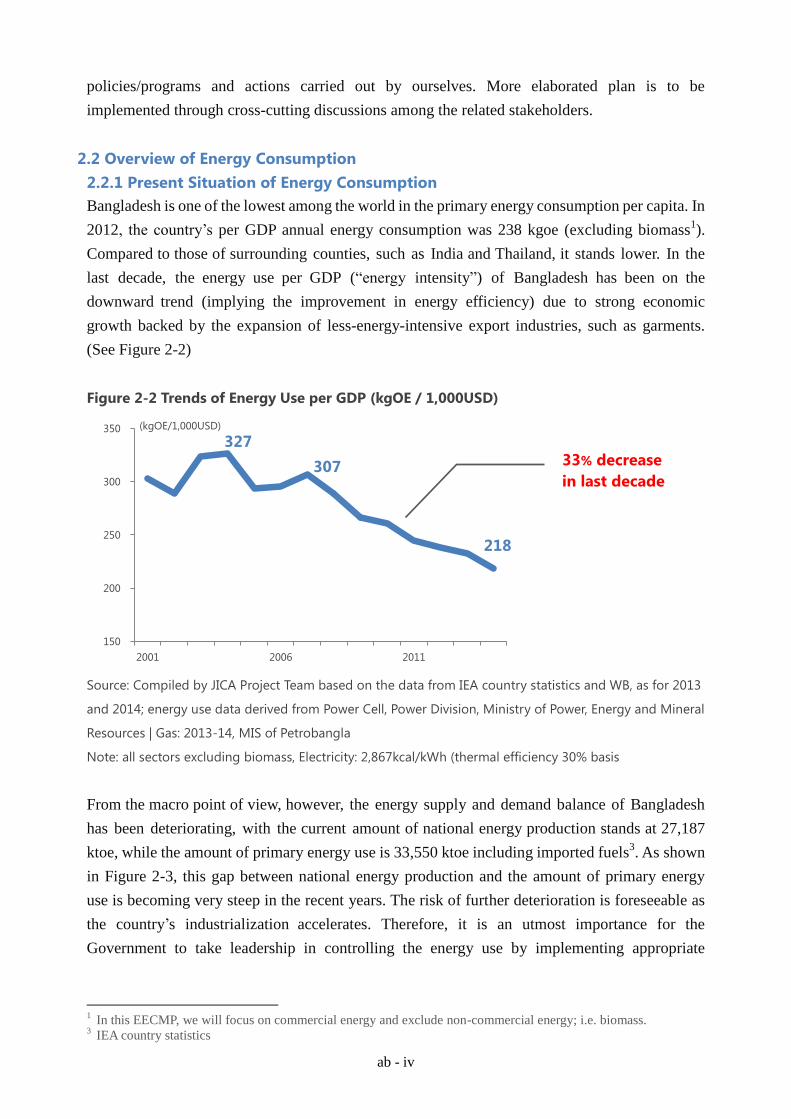
2.2 Overview of Energy Consumption
2.2.1 Present Situation of Energy Consumption
Bangladesh is one of the lowest among the world in the primary energy consumption per capita. In
2012, the country’s per GDP annual energy consumption was 238 kgoe (excluding biomass1).
Compared to those of surrounding counties, such as India and Thailand, it stands lower. In the
last decade, the energy use per GDP (“energy intensity”) of Bangladesh has been on the
downward trend (implying the improvement in energy efficiency) due to strong economic
growth backed by the expansion of less-energy-intensive export industries, such as garments.
(See Figure 2-2)
Figure 2-2 Trends of Energy Use per GDP (kgOE / 1,000USD)
Source: Compiled by JICA Project Team based on the data from IEA country statistics and WB, as for 2013
and 2014; energy use data derived from Power Cell, Power Division, Ministry of Power, Energy and Mineral
Resources | Gas: 2013-14, MIS of Petrobangla
Note: all sectors excluding biomass, Electricity: 2,867kcal/kWh (thermal efficiency 30% basis
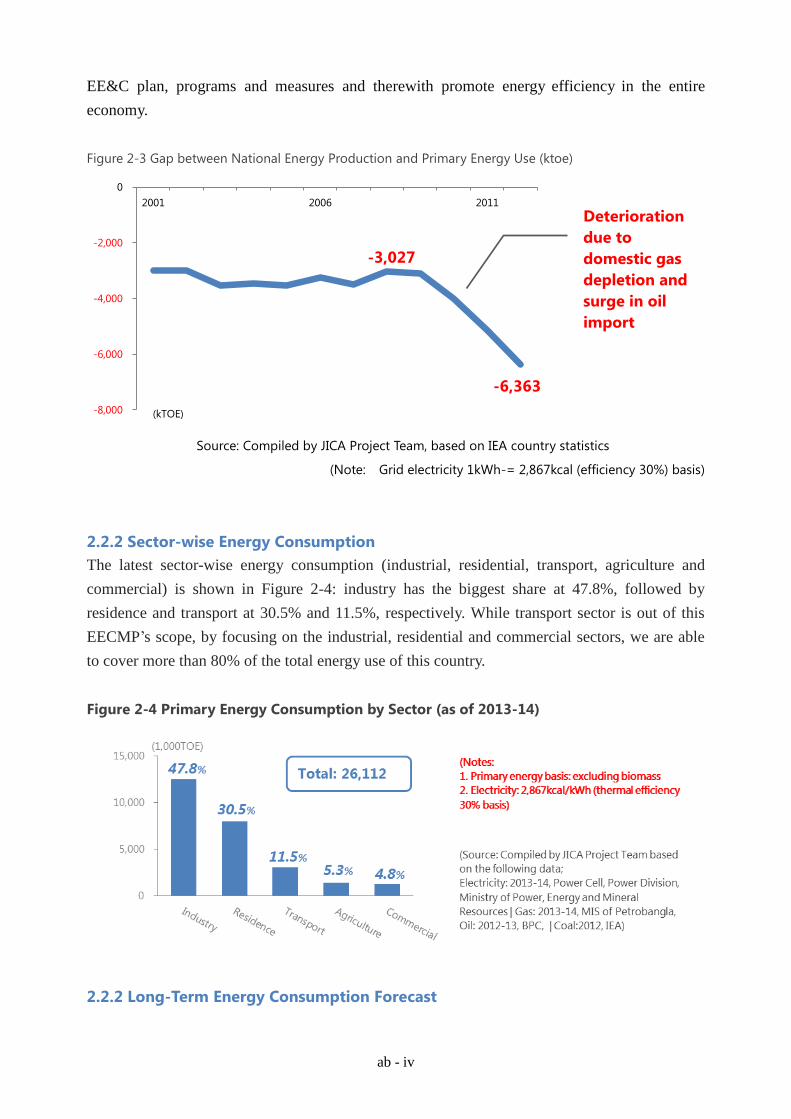
From the macro point of view, however, the energy supply and demand balance of Bangladesh
has been deteriorating, with the current amount of national energy production stands at 27,187
ktoe, while the amount of primary energy use is 33,550 ktoe including imported fuels3. As shown
in Figure 2-3, this gap between national energy production and the amount of primary energy
use is becoming very steep in the recent years. The risk of further deterioration is foreseeable as
the country’s industrialization accelerates. Therefore, it is an utmost importance for the
Government to take leadership in controlling the energy use by implementing appropriate
1 In this EECMP, we will focus on commercial energy and exclude non-commercial energy; i.e. biomass.
3 IEA country statistics
327
307
218
150
200
250
300
350
2001 2006 2011
(kgOE/1,000USD)
33% decrease
in last decade
ab - iv
EE&C plan, programs and measures and therewith promote energy efficiency in the entire
economy.
Figure 2-3 Gap between National Energy Production and Primary Energy Use (ktoe)
Source: Compiled by JICA Project Team, based on IEA country statistics
(Note: Grid electricity 1kWh-= 2,867kcal (efficiency 30%) basis)
2.2.2 Sector-wise Energy Consumption
The latest sector-wise energy consumption (industrial, residential, transport, agriculture and
commercial) is shown in Figure 2-4: industry has the biggest share at 47.8%, followed by
residence and transport at 30.5% and 11.5%, respectively. While transport sector is out of this
EECMP’s scope, by focusing on the industrial, residential and commercial sectors, we are able
to cover more than 80% of the total energy use of this country.
Figure 2-4 Primary Energy Consumption by Sector (as of 2013-14)
2.2.2 Long-Term Energy Consumption Forecast
-3,027
-6,363
-8,000
-6,000
-4,000
-2,000
0
2001 2006 2011
(kTOE)
Deterioration
due to
domestic gas
depletion and
surge in oil
import
ab - iv
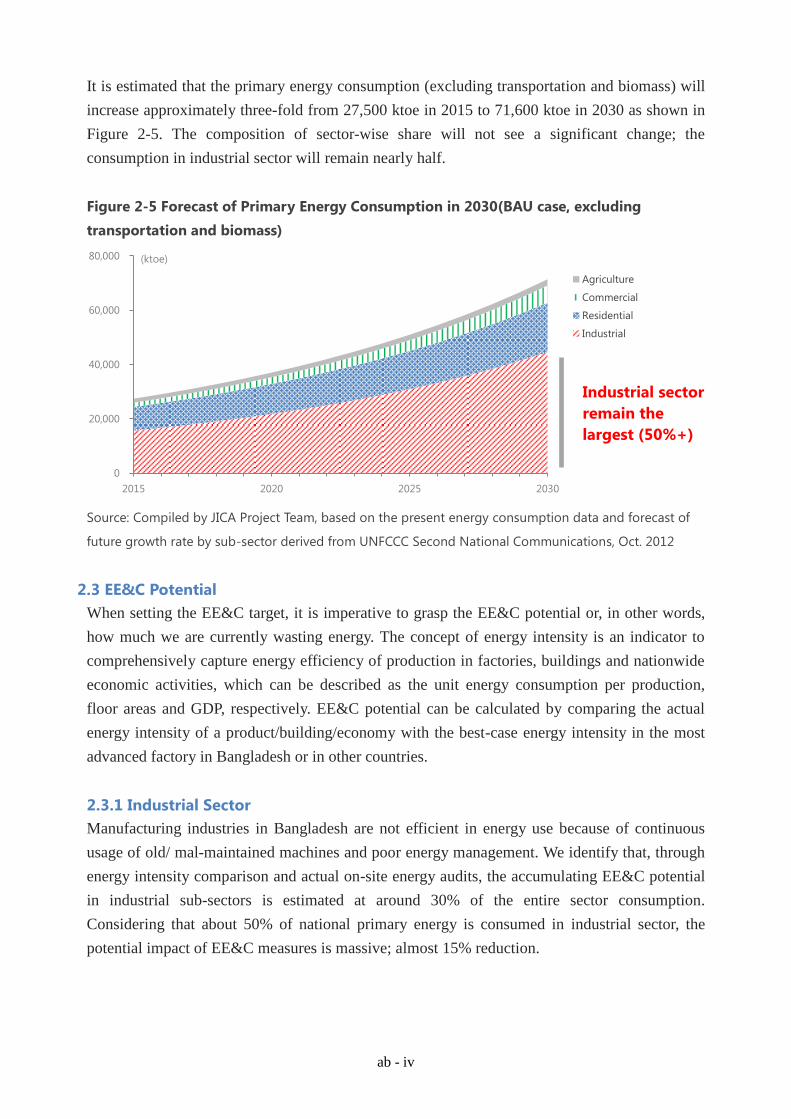
It is estimated that the primary energy consumption (excluding transportation and biomass) will
increase approximately three-fold from 27,500 ktoe in 2015 to 71,600 ktoe in 2030 as shown in
Figure 2-5. The composition of sector-wise share will not see a significant change; the
consumption in industrial sector will remain nearly half.
Figure 2-5 Forecast of Primary Energy Consumption in 2030(BAU case, excluding
transportation and biomass)
Source: Compiled by JICA Project Team, based on the present energy consumption data and forecast of
future growth rate by sub-sector derived from UNFCCC Second National Communications, Oct. 2012
2.3 EE&C Potential
When setting the EE&C target, it is imperative to grasp the EE&C potential or, in other words,
how much we are currently wasting energy. The concept of energy intensity is an indicator to
comprehensively capture energy efficiency of production in factories, buildings and nationwide
economic activities, which can be described as the unit energy consumption per production,
floor areas and GDP, respectively. EE&C potential can be calculated by comparing the actual
energy intensity of a product/building/economy with the best-case energy intensity in the most
advanced factory in Bangladesh or in other countries.
2.3.1 Industrial Sector
Manufacturing industries in Bangladesh are not efficient in energy use because of continuous
usage of old/ mal-maintained machines and poor energy management. We identify that, through
energy intensity comparison and actual on-site energy audits, the accumulating EE&C potential
in industrial sub-sectors is estimated at around 30% of the entire sector consumption.
Considering that about 50% of national primary energy is consumed in industrial sector, the
potential impact of EE&C measures is massive; almost 15% reduction.
0
20,000
40,000
60,000
80,000
2015 2020 2025 2030
(ktoe)
Agriculture
Commercial
Residential
Industrial
Industrial sector
remain the
largest (50%+)
ab - iv
2.3.2 Residential Sector
If all the existing home appliances in residences are to be replaced by the highest efficiency
products (as of today), huge scale of energy consumption reduction can be achieved. It is
calculated that maximum potential is 36% reduction in energy consumption.
2.3.3 Commercial Sector (Buildings)
Electricity is the main mode of energy in commercial buildings. In detail, nearly 50% of the
total energy is consumed by ACs and 10-30% by lighting systems. It is expected that a simple
replacement of ACs and lighting systems with energy efficiency ones alone can save about 50%
of total electricity consumptions in the commercial sector. It should be noted, however, that
luminance improvement and additional AC systems for better space condition are not included
here.
2.4 Toward “Self-Reliant EE&C Society”: Target and Implementation Roadmap
There are several indicators to evaluate the improvement of future national energy efficiency,
such as energy consumption per capita, energy consumption per Growth Domestic Product
(GDP) and the reduction amount of energy consumption, etc. Energy consumption per capita
is not suitable for developing countries like Bangladesh. And in case of evaluating by the
reduction amount, it is not easy to fix the national baseline in the future. Besides energy
consumption per GDP can consider both the energy efficiency and increase of national economy.
Therefore we will use “primary energy consumption per GDP” as an indicator to evaluate future
national energy efficiency.
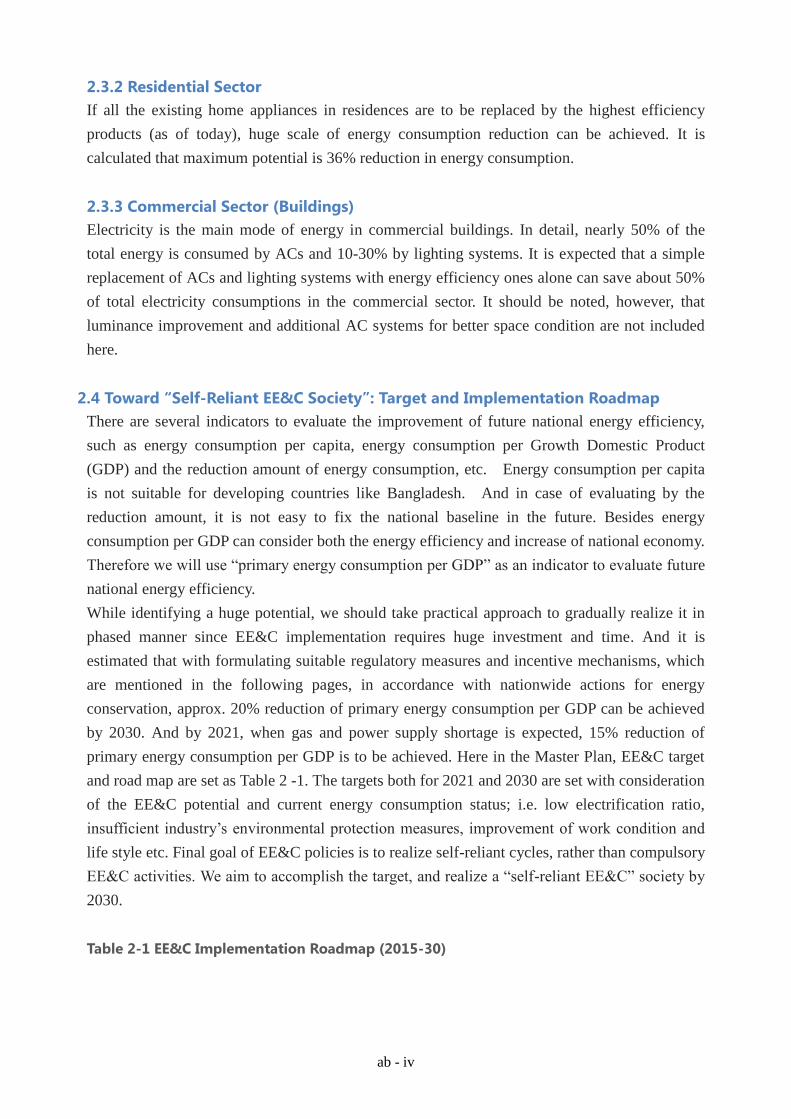
While identifying a huge potential, we should take practical approach to gradually realize it in
phased manner since EE&C implementation requires huge investment and time. And it is
estimated that with formulating suitable regulatory measures and incentive mechanisms, which
are mentioned in the following pages, in accordance with nationwide actions for energy
conservation, approx. 20% reduction of primary energy consumption per GDP can be achieved
by 2030. And by 2021, when gas and power supply shortage is expected, 15% reduction of
primary energy consumption per GDP is to be achieved. Here in the Master Plan, EE&C target
and road map are set as Table 2 -1. The targets both for 2021 and 2030 are set with consideration
of the EE&C potential and current energy consumption status; i.e. low electrification ratio,
insufficient industry’s environmental protection measures, improvement of work condition and
life style etc. Final goal of EE&C policies is to realize self-reliant cycles, rather than compulsory
EE&C activities. We aim to accomplish the target, and realize a “self-reliant EE&C” society by
2030.
Table 2-1 EE&C Implementation Roadmap (2015-30)
ab - iv
3. Action Plan
3.1 Overview
The Action Plan containing the EE&C policies and programs frameworks and organization
structure is prepared to show practical methodology to achieve and accomplish the targets set in
the EECMP.
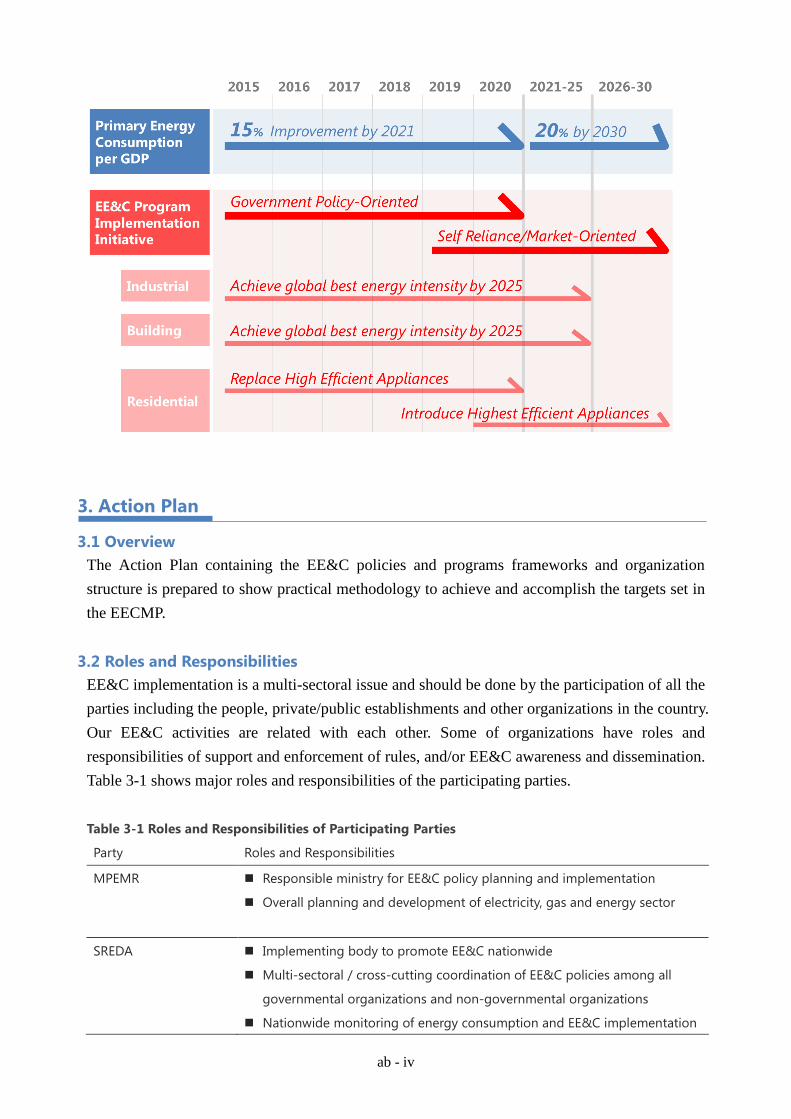
3.2 Roles and Responsibilities
EE&C implementation is a multi-sectoral issue and should be done by the participation of all the
parties including the people, private/public establishments and other organizations in the country.
Our EE&C activities are related with each other. Some of organizations have roles and
responsibilities of support and enforcement of rules, and/or EE&C awareness and dissemination.
Table 3-1 shows major roles and responsibilities of the participating parties.
Table 3-1 Roles and Responsibilities of Participating Parties
Party Roles and Responsibilities
MPEMR Responsible ministry for EE&C policy planning and implementation
Overall planning and development of electricity, gas and energy sector
SREDA Implementing body to promote EE&C nationwide
Multi-sectoral / cross-cutting coordination of EE&C policies among all
governmental organizations and non-governmental organizations
Nationwide monitoring of energy consumption and EE&C implementation
ab - iv
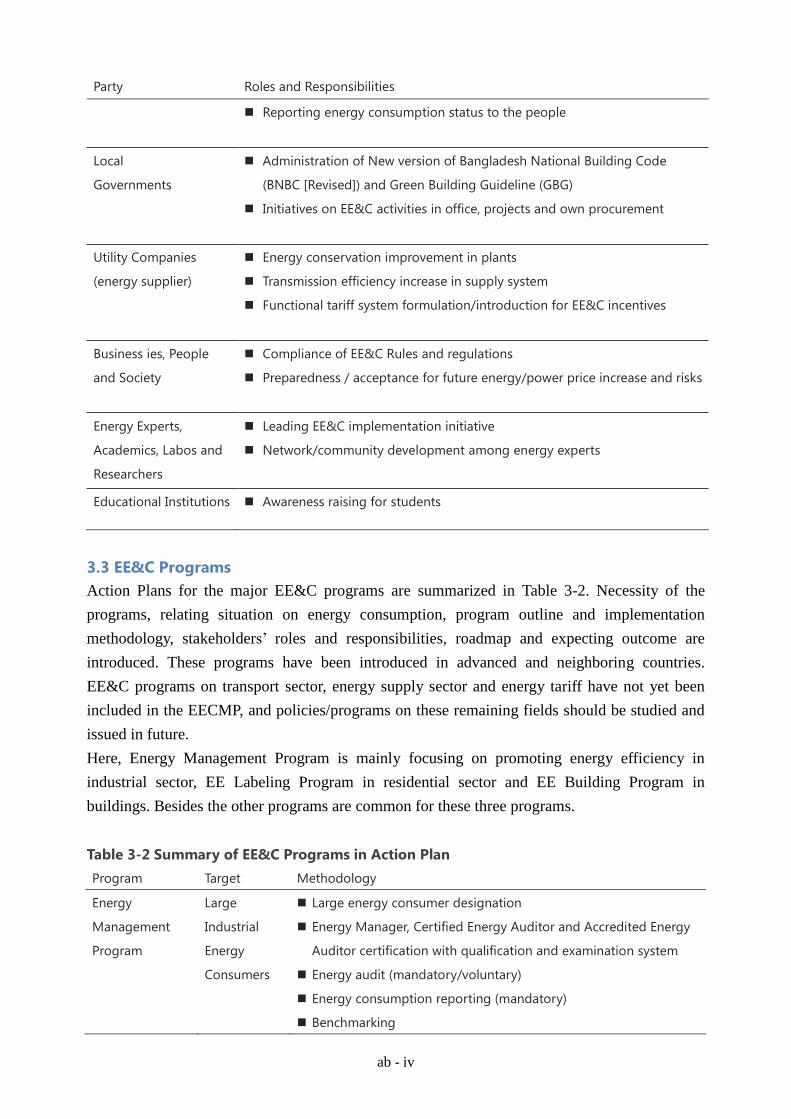
Party Roles and Responsibilities
Reporting energy consumption status to the people
Local
Governments
Administration of New version of Bangladesh National Building Code
(BNBC [Revised]) and Green Building Guideline (GBG)
Initiatives on EE&C activities in office, projects and own procurement
Utility Companies
(energy supplier)
Energy conservation improvement in plants
Transmission efficiency increase in supply system
Functional tariff system formulation/introduction for EE&C incentives
Business ies, People
and Society
Compliance of EE&C Rules and regulations
Preparedness / acceptance for future energy/power price increase and risks
Energy Experts,
Academics, Labos and
Researchers
Leading EE&C implementation initiative
Network/community development among energy experts
Educational Institutions Awareness raising for students
3.3 EE&C Programs
Action Plans for the major EE&C programs are summarized in Table 3-2. Necessity of the
programs, relating situation on energy consumption, program outline and implementation
methodology, stakeholders’ roles and responsibilities, roadmap and expecting outcome are
introduced. These programs have been introduced in advanced and neighboring countries.
EE&C programs on transport sector, energy supply sector and energy tariff have not yet been
included in the EECMP, and policies/programs on these remaining fields should be studied and
issued in future.
Here, Energy Management Program is mainly focusing on promoting energy efficiency in
industrial sector, EE Labeling Program in residential sector and EE Building Program in
buildings. Besides the other programs are common for these three programs.
Table 3-2 Summary of EE&C Programs in Action Plan
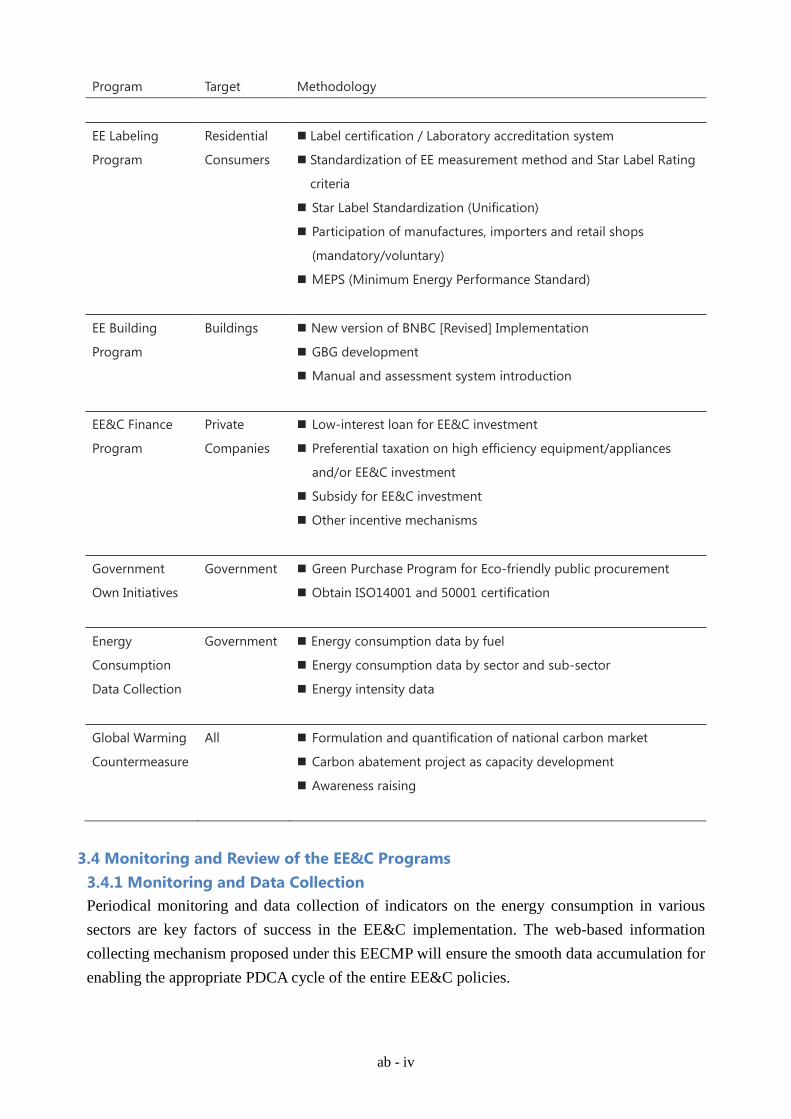
Program Target Methodology
Energy
Management
Program
Large
Industrial
Energy
Consumers
Large energy consumer designation
Energy Manager, Certified Energy Auditor and Accredited Energy
Auditor certification with qualification and examination system
Energy audit (mandatory/voluntary)
Energy consumption reporting (mandatory)
Benchmarking
ab - iv
Program Target Methodology
EE Labeling
Program
Residential
Consumers
Label certification / Laboratory accreditation system
Standardization of EE measurement method and Star Label Rating
criteria
Star Label Standardization (Unification)
Participation of manufactures, importers and retail shops
(mandatory/voluntary)
MEPS (Minimum Energy Performance Standard)
EE Building
Program
Buildings New version of BNBC [Revised] Implementation
GBG development
Manual and assessment system introduction
EE&C Finance
Program
Private
Companies
Low-interest loan for EE&C investment
Preferential taxation on high efficiency equipment/appliances
and/or EE&C investment
Subsidy for EE&C investment
Other incentive mechanisms
Government
Own Initiatives
Government Green Purchase Program for Eco-friendly public procurement
Obtain ISO14001 and 50001 certification
Energy
Consumption
Data Collection
Government Energy consumption data by fuel
Energy consumption data by sector and sub-sector
Energy intensity data
Global Warming
Countermeasure
All Formulation and quantification of national carbon market
Carbon abatement project as capacity development
Awareness raising
3.4 Monitoring and Review of the EE&C Programs
3.4.1 Monitoring and Data Collection
Periodical monitoring and data collection of indicators on the energy consumption in various
sectors are key factors of success in the EE&C implementation. The web-based information
collecting mechanism proposed under this EECMP will ensure the smooth data accumulation for
enabling the appropriate PDCA cycle of the entire EE&C policies.
ab - iv
3.4.2 Review of EECMP
All the data are maintained by SREDA as a regulatory authority for the EE&C initiative.
SREDA is mandated to analyze them and review the progress of the EECMP and subordinate
programs. The annual reporting in this regard should be presented to the Joint Coordination
Committee, chaired by SREDA Chairman with participation from all the relevant
ministries/agencies, for the follow-up of the EECMP. Result of the review will be reflected in
the details in Action Plan. The annual report will be uploaded on SREDA website for disclosure
to the public.
3.4.3 Revision of EECMP
The EECMP should be periodically revised along with the progress of initiative in accordance
with the EE&C program development. We intend to make a next revision in five years: i.e. year
2020.
4. Economic Analysis
4.1 Overview
Economic viability of each EE&C measure has to be verified by the cost-benefit analysis;
clarifying and comparing its costs and benefits. Although energy consumption reduction is the
primary and direct benefit of EE&C measures, secondary and indirect benefit shall, in some
cases, be taken into consideration in order to justify the costs involved. From the viewpoint of
effective allocation of limited resources, the Government will compare candidate EE&C
measures and projects according to their cost effectiveness (or costs per unit of energy saved),
since the Government has responsibility in prioritizing allocation of limited resources to
economically viable projects and to avoid implementation of projects with less economic values.
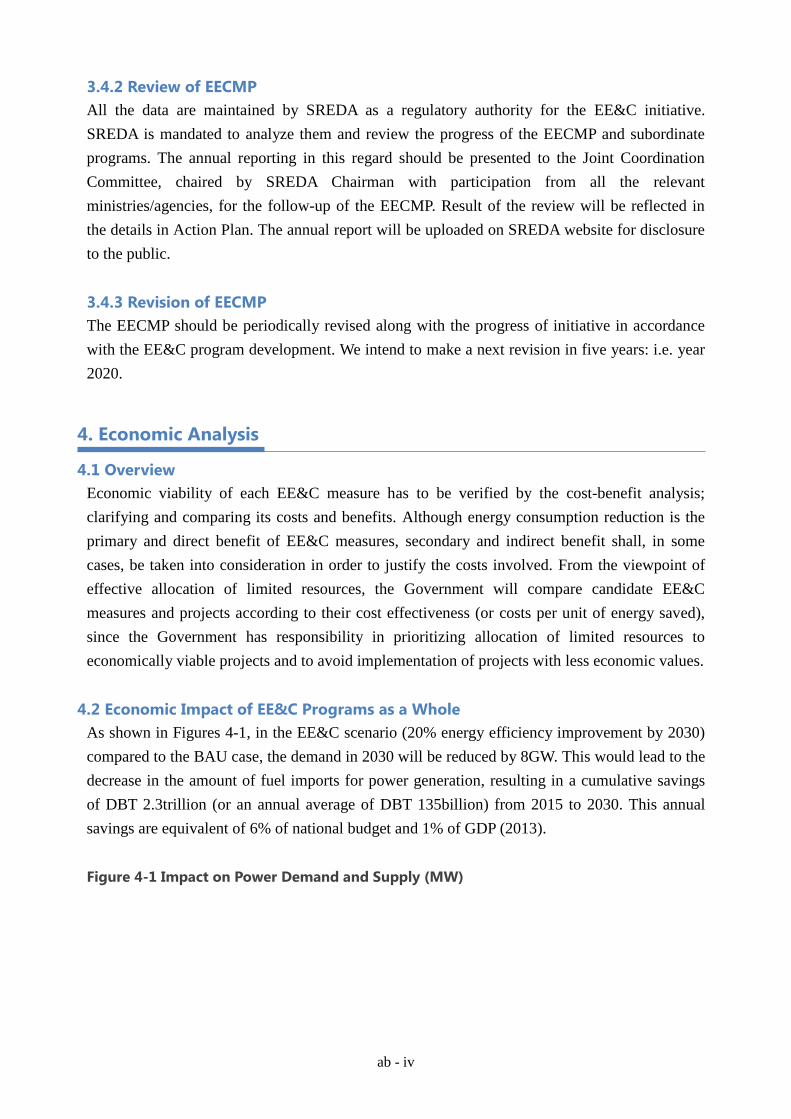
4.2 Economic Impact of EE&C Programs as a Whole
As shown in Figures 4-1, in the EE&C scenario (20% energy efficiency improvement by 2030)
compared to the BAU case, the demand in 2030 will be reduced by 8GW. This would lead to the
decrease in the amount of fuel imports for power generation, resulting in a cumulative savings
of DBT 2.3trillion (or an annual average of DBT 135billion) from 2015 to 2030. This annual
savings are equivalent of 6% of national budget and 1% of GDP (2013).
Figure 4-1 Impact on Power Demand and Supply (MW)
ab - iv
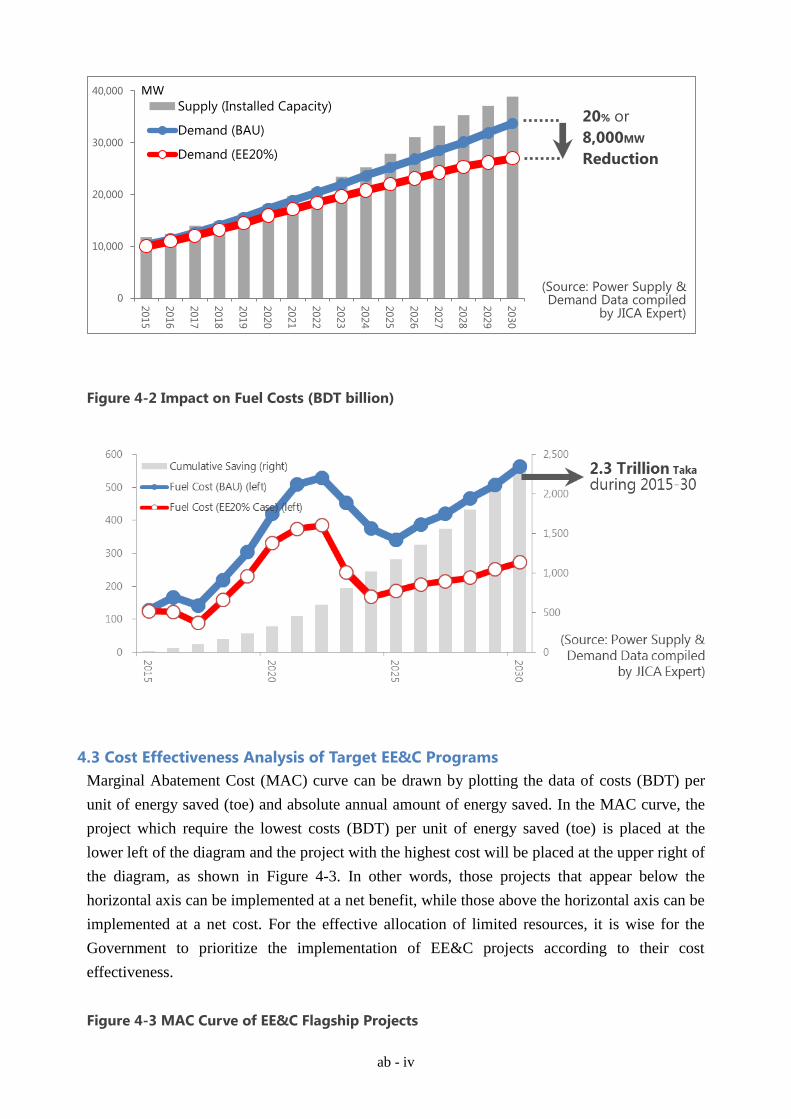
Figure 4-2 Impact on Fuel Costs (BDT billion)
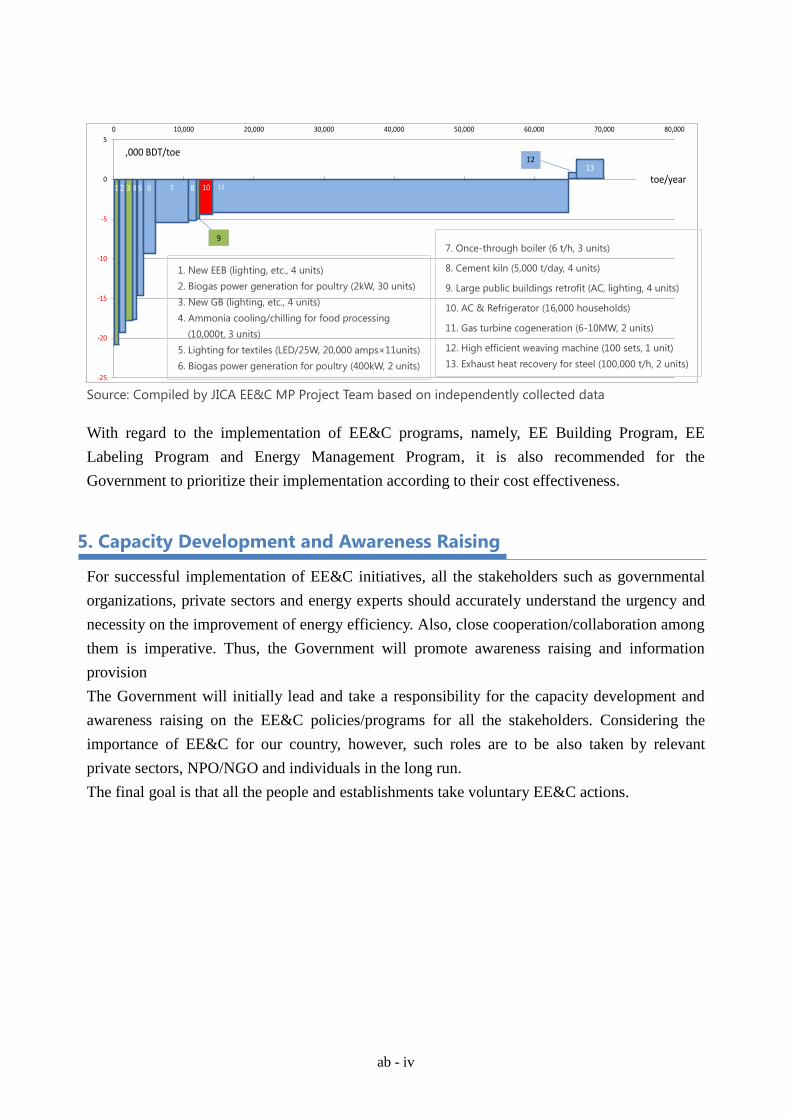
4.3 Cost Effectiveness Analysis of Target EE&C Programs
Marginal Abatement Cost (MAC) curve can be drawn by plotting the data of costs (BDT) per
unit of energy saved (toe) and absolute annual amount of energy saved. In the MAC curve, the
project which require the lowest costs (BDT) per unit of energy saved (toe) is placed at the
lower left of the diagram and the project with the highest cost will be placed at the upper right of
the diagram, as shown in Figure 4-3. In other words, those projects that appear below the
horizontal axis can be implemented at a net benefit, while those above the horizontal axis can be
implemented at a net cost. For the effective allocation of limited resources, it is wise for the
Government to prioritize the implementation of EE&C projects according to their cost
effectiveness.
Figure 4-3 MAC Curve of EE&C Flagship Projects
0
10,000
20,000
30,000
40,000
2015
2016
2017
2018
2019
2020
2021
2022
2023
2024
2025
2026
2027
2028
2029
2030
Supply (Installed Capacity)
Demand (BAU)
Demand (EE20%)
MW
(Source: Power Supply & Demand Data compiled
by JICA Expert)
20% or
8,000MW
Reduction
ab - iv
Source: Compiled by JICA EE&C MP Project Team based on independently collected data
With regard to the implementation of EE&C programs, namely, EE Building Program, EE
Labeling Program and Energy Management Program, it is also recommended for the
Government to prioritize their implementation according to their cost effectiveness.
5. Capacity Development and Awareness Raising
For successful implementation of EE&C initiatives, all the stakeholders such as governmental
organizations, private sectors and energy experts should accurately understand the urgency and
necessity on the improvement of energy efficiency. Also, close cooperation/collaboration among
them is imperative. Thus, the Government will promote awareness raising and information
provision
The Government will initially lead and take a responsibility for the capacity development and
awareness raising on the EE&C policies/programs for all the stakeholders. Considering the
importance of EE&C for our country, however, such roles are to be also taken by relevant
private sectors, NPO/NGO and individuals in the long run.
The final goal is that all the people and establishments take voluntary EE&C actions.
-25
-20
-15
-10
-5
0
5
0 10,000 20,000 30,000 40,000 50,000 60,000 70,000 80,000
,000 BDT/toe
toe/year1 2 4 5 6 7 8
13
113 10
9
12
1. New EEB (lighting, etc., 4 units)
2. Biogas power generation for poultry (2kW, 30 units)
3. New GB (lighting, etc., 4 units)
4. Ammonia cooling/chilling for food processing
(10,000t, 3 units)
5. Lighting for textiles (LED/25W, 20,000 amps×11units)
6. Biogas power generation for poultry (400kW, 2 units)
7. Once-through boiler (6 t/h, 3 units)
8. Cement kiln (5,000 t/day, 4 units)
9. Large public buildings retrofit (AC, lighting, 4 units)
10. AC & Refrigerator (16,000 households)
11. Gas turbine cogeneration (6-10MW, 2 units)
12. High efficient weaving machine (100 sets, 1 unit)
13. Exhaust heat recovery for steel (100,000 t/h, 2 units)
1
Chapter 1 Introduction
1.1 Background
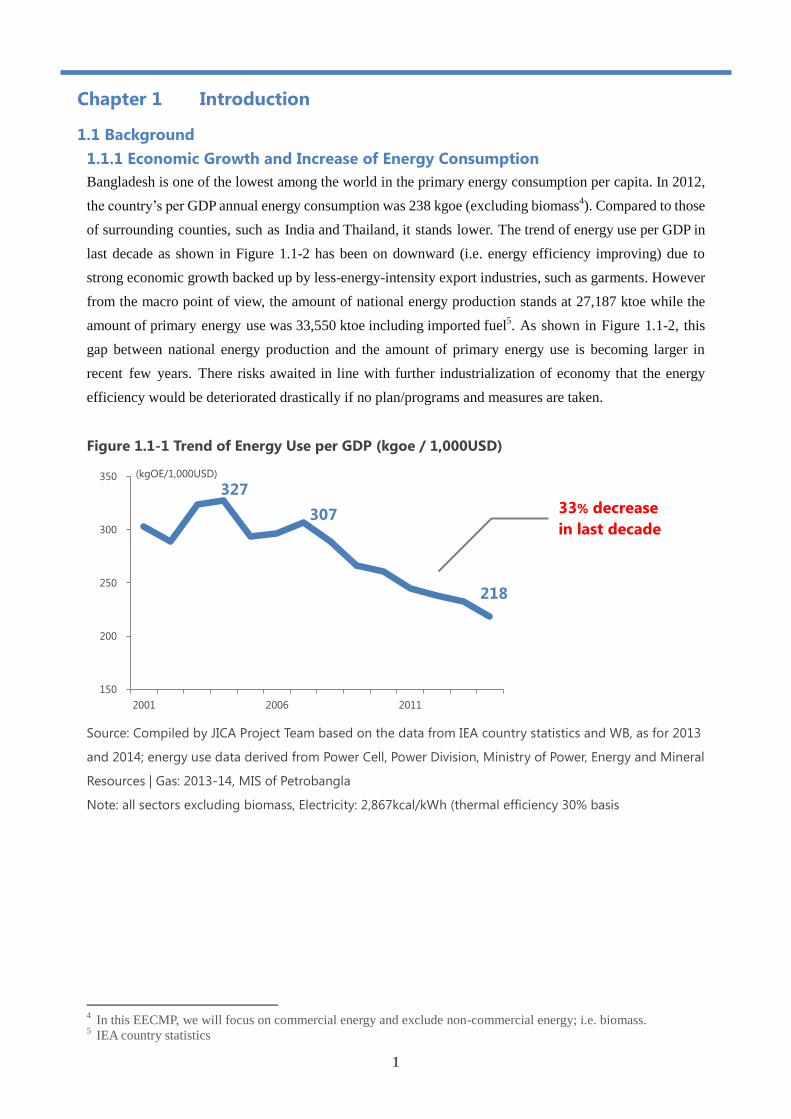
1.1.1 Economic Growth and Increase of Energy Consumption
Bangladesh is one of the lowest among the world in the primary energy consumption per capita. In 2012,
the country’s per GDP annual energy consumption was 238 kgoe (excluding biomass4). Compared to those
of surrounding counties, such as India and Thailand, it stands lower. The trend of energy use per GDP in
last decade as shown in Figure 1.1-2 has been on downward (i.e. energy efficiency improving) due to
strong economic growth backed up by less-energy-intensity export industries, such as garments. However
from the macro point of view, the amount of national energy production stands at 27,187 ktoe while the
amount of primary energy use was 33,550 ktoe including imported fuel5. As shown in Figure 1.1-2, this
gap between national energy production and the amount of primary energy use is becoming larger in
recent few years. There risks awaited in line with further industrialization of economy that the energy
efficiency would be deteriorated drastically if no plan/programs and measures are taken.
Figure 1.1-1 Trend of Energy Use per GDP (kgoe / 1,000USD)
Source: Compiled by JICA Project Team based on the data from IEA country statistics and WB, as for 2013
and 2014; energy use data derived from Power Cell, Power Division, Ministry of Power, Energy and Mineral
Resources | Gas: 2013-14, MIS of Petrobangla
Note: all sectors excluding biomass, Electricity: 2,867kcal/kWh (thermal efficiency 30% basis
4 In this EECMP, we will focus on commercial energy and exclude non-commercial energy; i.e. biomass.
5 IEA country statistics
327
307
218
150
200
250
300
350
2001 2006 2011
(kgOE/1,000USD)
33% decrease
in last decade
2
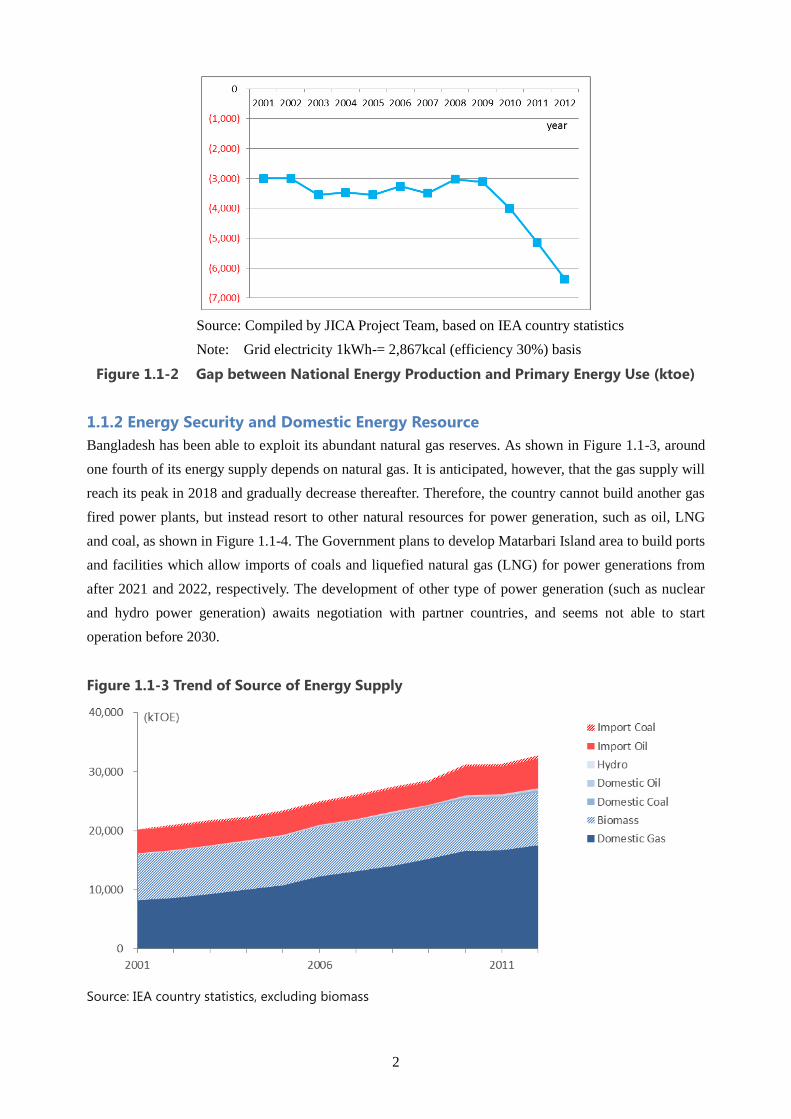
Source: Compiled by JICA Project Team, based on IEA country statistics
Note: Grid electricity 1kWh-= 2,867kcal (efficiency 30%) basis
Figure 1.1-2 Gap between National Energy Production and Primary Energy Use (ktoe)
1.1.2 Energy Security and Domestic Energy Resource
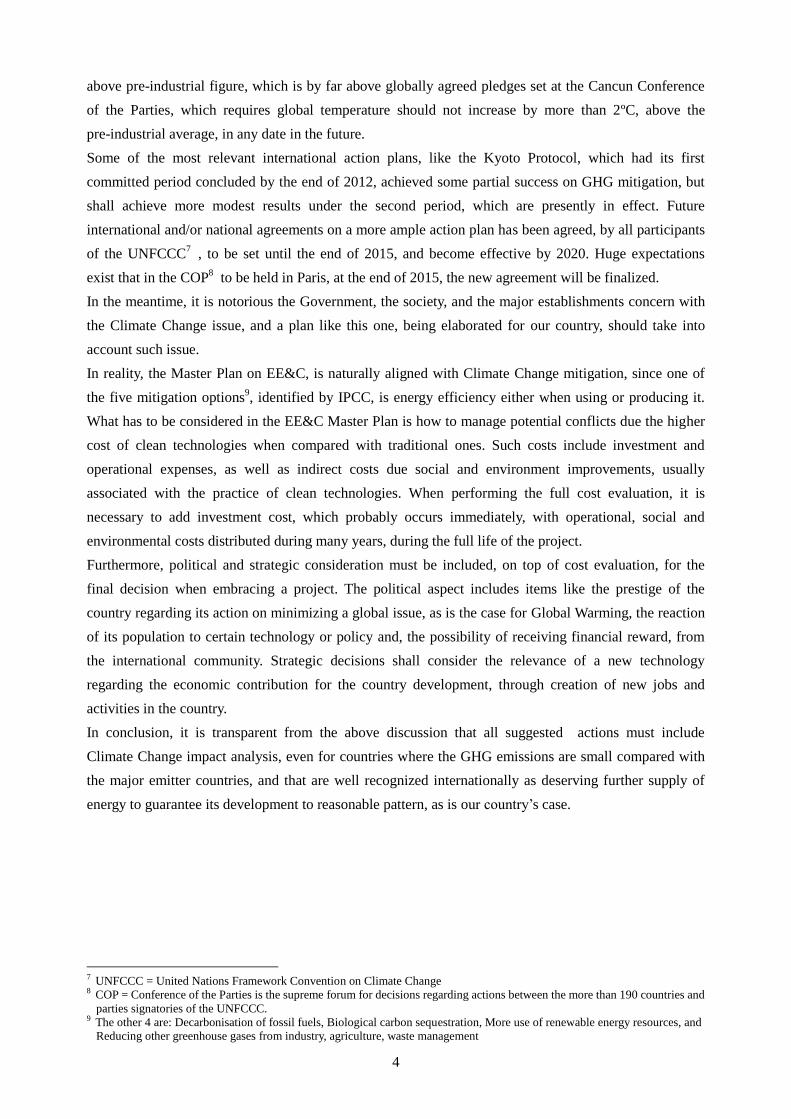
Bangladesh has been able to exploit its abundant natural gas reserves. As shown in Figure 1.1-3, around
one fourth of its energy supply depends on natural gas. It is anticipated, however, that the gas supply will
reach its peak in 2018 and gradually decrease thereafter. Therefore, the country cannot build another gas
fired power plants, but instead resort to other natural resources for power generation, such as oil, LNG
and coal, as shown in Figure 1.1-4. The Government plans to develop Matarbari Island area to build ports
and facilities which allow imports of coals and liquefied natural gas (LNG) for power generations from
after 2021 and 2022, respectively. The development of other type of power generation (such as nuclear
and hydro power generation) awaits negotiation with partner countries, and seems not able to start
operation before 2030.
Figure 1.1-3 Trend of Source of Energy Supply
Source: IEA country statistics, excluding biomass
3
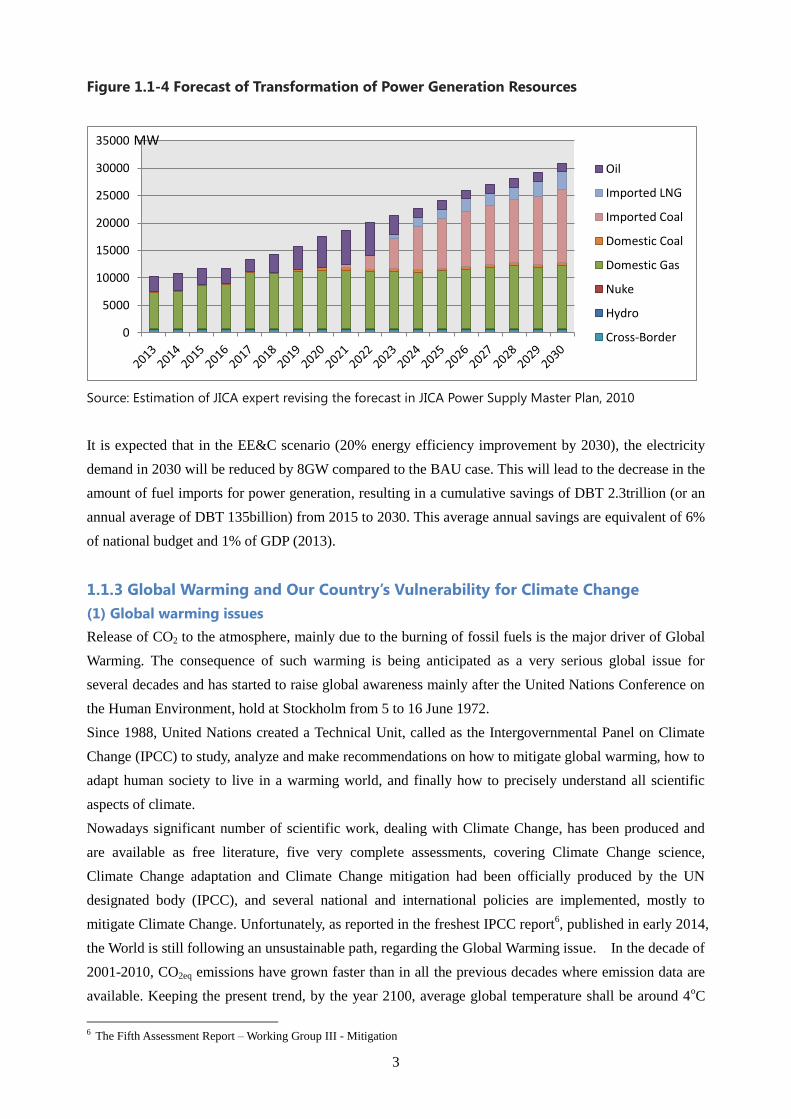
Figure 1.1-4 Forecast of Transformation of Power Generation Resources
Source: Estimation of JICA expert revising the forecast in JICA Power Supply Master Plan, 2010
It is expected that in the EE&C scenario (20% energy efficiency improvement by 2030), the electricity
demand in 2030 will be reduced by 8GW compared to the BAU case. This will lead to the decrease in the
amount of fuel imports for power generation, resulting in a cumulative savings of DBT 2.3trillion (or an
annual average of DBT 135billion) from 2015 to 2030. This average annual savings are equivalent of 6%
of national budget and 1% of GDP (2013).
1.1.3 Global Warming and Our Country’s Vulnerability for Climate Change
(1) Global warming issues
Release of CO2 to the atmosphere, mainly due to the burning of fossil fuels is the major driver of Global
Warming. The consequence of such warming is being anticipated as a very serious global issue for
several decades and has started to raise global awareness mainly after the United Nations Conference on
the Human Environment, hold at Stockholm from 5 to 16 June 1972.
Since 1988, United Nations created a Technical Unit, called as the Intergovernmental Panel on Climate
Change (IPCC) to study, analyze and make recommendations on how to mitigate global warming, how to
adapt human society to live in a warming world, and finally how to precisely understand all scientific
aspects of climate.
Nowadays significant number of scientific work, dealing with Climate Change, has been produced and
are available as free literature, five very complete assessments, covering Climate Change science,
Climate Change adaptation and Climate Change mitigation had been officially produced by the UN
designated body (IPCC), and several national and international policies are implemented, mostly to
mitigate Climate Change. Unfortunately, as reported in the freshest IPCC report6, published in early 2014,
the World is still following an unsustainable path, regarding the Global Warming issue. In the decade of
2001-2010, CO2eq emissions have grown faster than in all the previous decades where emission data are
available. Keeping the present trend, by the year 2100, average global temperature shall be around 4oC
6 The Fifth Assessment Report – Working Group III - Mitigation
0
5000
10000
15000
20000
25000
30000
35000
Oil
Imported LNG
Imported Coal
Domestic Coal
Domestic Gas
Nuke
Hydro
Cross-Border
MMW
4
above pre-industrial figure, which is by far above globally agreed pledges set at the Cancun Conference
of the Parties, which requires global temperature should not increase by more than 2ºC, above the
pre-industrial average, in any date in the future.
Some of the most relevant international action plans, like the Kyoto Protocol, which had its first
committed period concluded by the end of 2012, achieved some partial success on GHG mitigation, but
shall achieve more modest results under the second period, which are presently in effect. Future
international and/or national agreements on a more ample action plan has been agreed, by all participants
of the UNFCCC7 , to be set until the end of 2015, and become effective by 2020. Huge expectations
exist that in the COP8 to be held in Paris, at the end of 2015, the new agreement will be finalized.
In the meantime, it is notorious the Government, the society, and the major establishments concern with
the Climate Change issue, and a plan like this one, being elaborated for our country, should take into
account such issue.
In reality, the Master Plan on EE&C, is naturally aligned with Climate Change mitigation, since one of
the five mitigation options9, identified by IPCC, is energy efficiency either when using or producing it.
What has to be considered in the EE&C Master Plan is how to manage potential conflicts due the higher
cost of clean technologies when compared with traditional ones. Such costs include investment and
operational expenses, as well as indirect costs due social and environment improvements, usually
associated with the practice of clean technologies. When performing the full cost evaluation, it is
necessary to add investment cost, which probably occurs immediately, with operational, social and
environmental costs distributed during many years, during the full life of the project.
Furthermore, political and strategic consideration must be included, on top of cost evaluation, for the
final decision when embracing a project. The political aspect includes items like the prestige of the
country regarding its action on minimizing a global issue, as is the case for Global Warming, the reaction
of its population to certain technology or policy and, the possibility of receiving financial reward, from
the international community. Strategic decisions shall consider the relevance of a new technology
regarding the economic contribution for the country development, through creation of new jobs and
activities in the country.
In conclusion, it is transparent from the above discussion that all suggested actions must include
Climate Change impact analysis, even for countries where the GHG emissions are small compared with
the major emitter countries, and that are well recognized internationally as deserving further supply of
energy to guarantee its development to reasonable pattern, as is our country’s case.
7 UNFCCC = United Nations Framework Convention on Climate Change 8 COP = Conference of the Parties is the supreme forum for decisions regarding actions between the more than 190 countries and
parties signatories of the UNFCCC. 9 The other 4 are: Decarbonisation of fossil fuels, Biological carbon sequestration, More use of renewable energy resources, and
Reducing other greenhouse gases from industry, agriculture, waste management
5
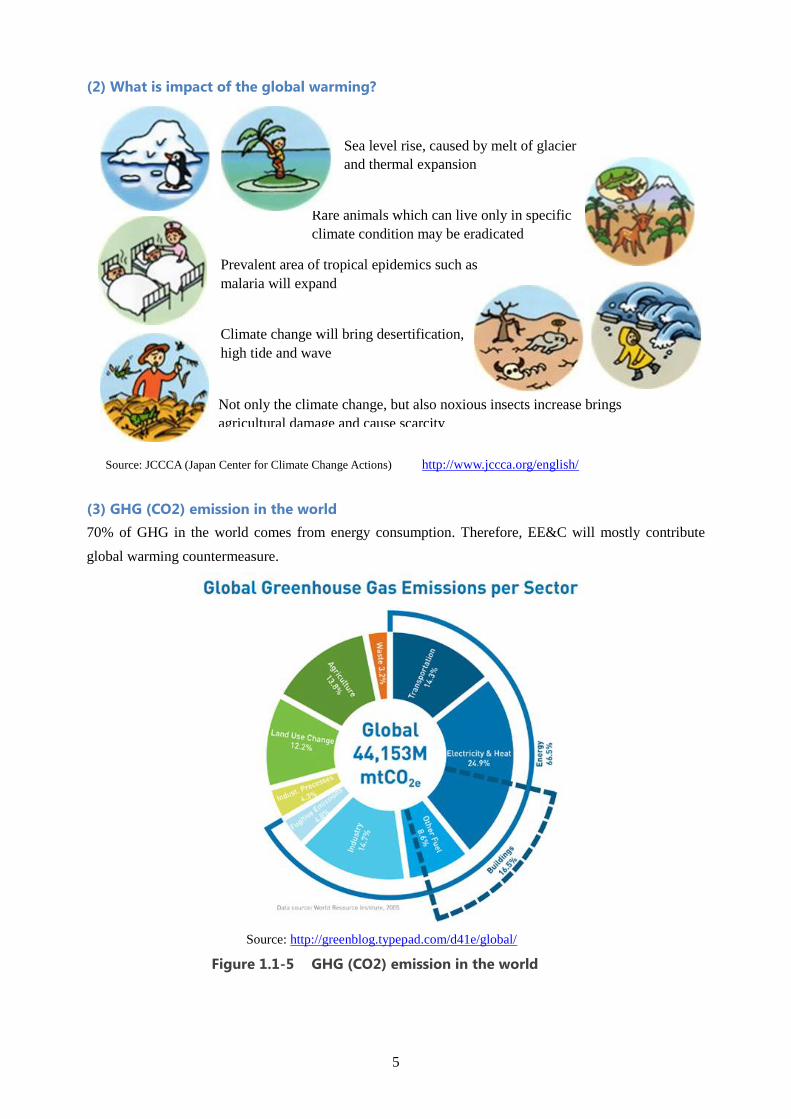
(2) What is impact of the global warming?
Source: JCCCA (Japan Center for Climate Change Actions) http://www.jccca.org/english/
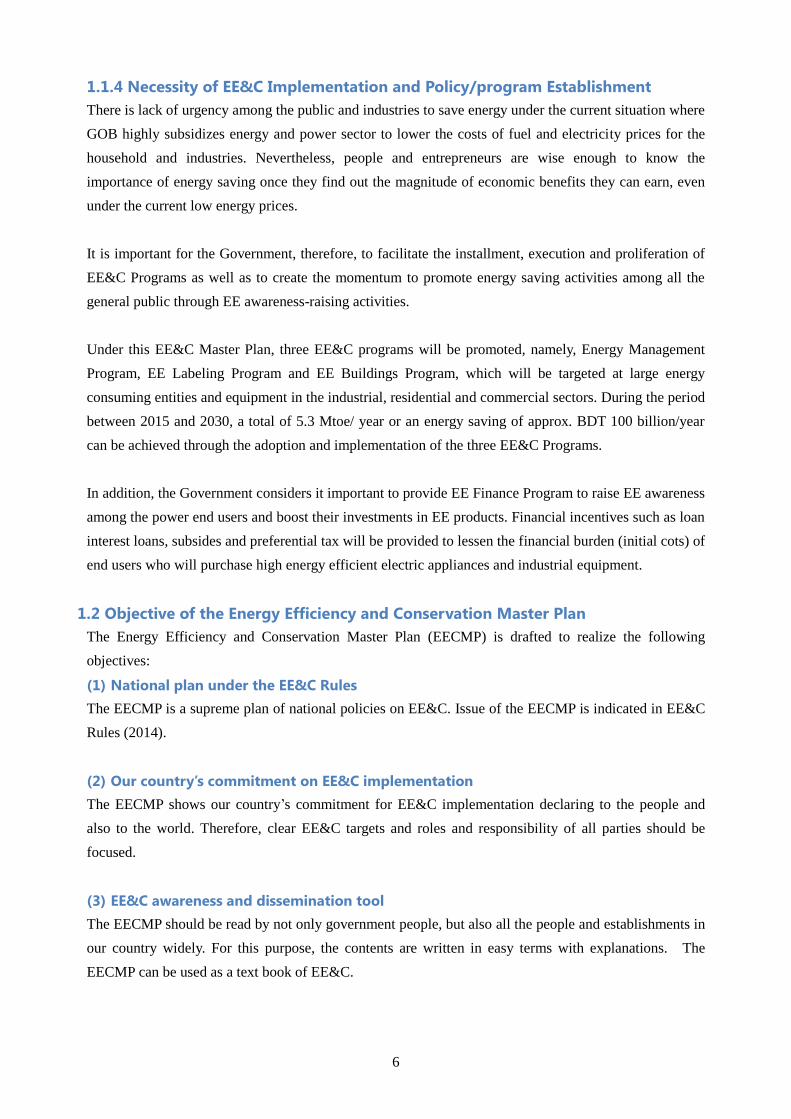
(3) GHG (CO2) emission in the world
70% of GHG in the world comes from energy consumption. Therefore, EE&C will mostly contribute
global warming countermeasure.
Source: http://greenblog.typepad.com/d41e/global/
Figure 1.1-5 GHG (CO2) emission in the world
Sea level rise, caused by melt of glacier
and thermal expansion
Rare animals which can live only in specific
climate condition may be eradicated
Prevalent area of tropical epidemics such as
malaria will expand
Climate change will bring desertification,
high tide and wave
Not only the climate change, but also noxious insects increase brings
agricultural damage and cause scarcity
6
1.1.4 Necessity of EE&C Implementation and Policy/program Establishment
There is lack of urgency among the public and industries to save energy under the current situation where
GOB highly subsidizes energy and power sector to lower the costs of fuel and electricity prices for the
household and industries. Nevertheless, people and entrepreneurs are wise enough to know the
importance of energy saving once they find out the magnitude of economic benefits they can earn, even
under the current low energy prices.
It is important for the Government, therefore, to facilitate the installment, execution and proliferation of
EE&C Programs as well as to create the momentum to promote energy saving activities among all the
general public through EE awareness-raising activities.
Under this EE&C Master Plan, three EE&C programs will be promoted, namely, Energy Management
Program, EE Labeling Program and EE Buildings Program, which will be targeted at large energy
consuming entities and equipment in the industrial, residential and commercial sectors. During the period
between 2015 and 2030, a total of 5.3 Mtoe/ year or an energy saving of approx. BDT 100 billion/year
can be achieved through the adoption and implementation of the three EE&C Programs.
In addition, the Government considers it important to provide EE Finance Program to raise EE awareness
among the power end users and boost their investments in EE products. Financial incentives such as loan
interest loans, subsides and preferential tax will be provided to lessen the financial burden (initial cots) of
end users who will purchase high energy efficient electric appliances and industrial equipment.
1.2 Objective of the Energy Efficiency and Conservation Master Plan
The Energy Efficiency and Conservation Master Plan (EECMP) is drafted to realize the following
objectives:
(1) National plan under the EE&C Rules
The EECMP is a supreme plan of national policies on EE&C. Issue of the EECMP is indicated in EE&C
Rules (2014).
(2) Our country’s commitment on EE&C implementation
The EECMP shows our country’s commitment for EE&C implementation declaring to the people and
also to the world. Therefore, clear EE&C targets and roles and responsibility of all parties should be
focused.
(3) EE&C awareness and dissemination tool
The EECMP should be read by not only government people, but also all the people and establishments in
our country widely. For this purpose, the contents are written in easy terms with explanations. The
EECMP can be used as a text book of EE&C.
7
(4) Sort of cross-cutting EE&C policies/programs and actions
EE&C actions are to be taken by all the people and establishments, including governmental organization,
individuals, NPO/NGO and other establishments relating each other. The EECMP shows a systematic
structure of EE&C policies/programs and actions sorting cross-cutting EE&C policies/programs and
actions.
1.3 Overview of Energy and Electricity
1.3.1 Present Situation of Energy Consumption
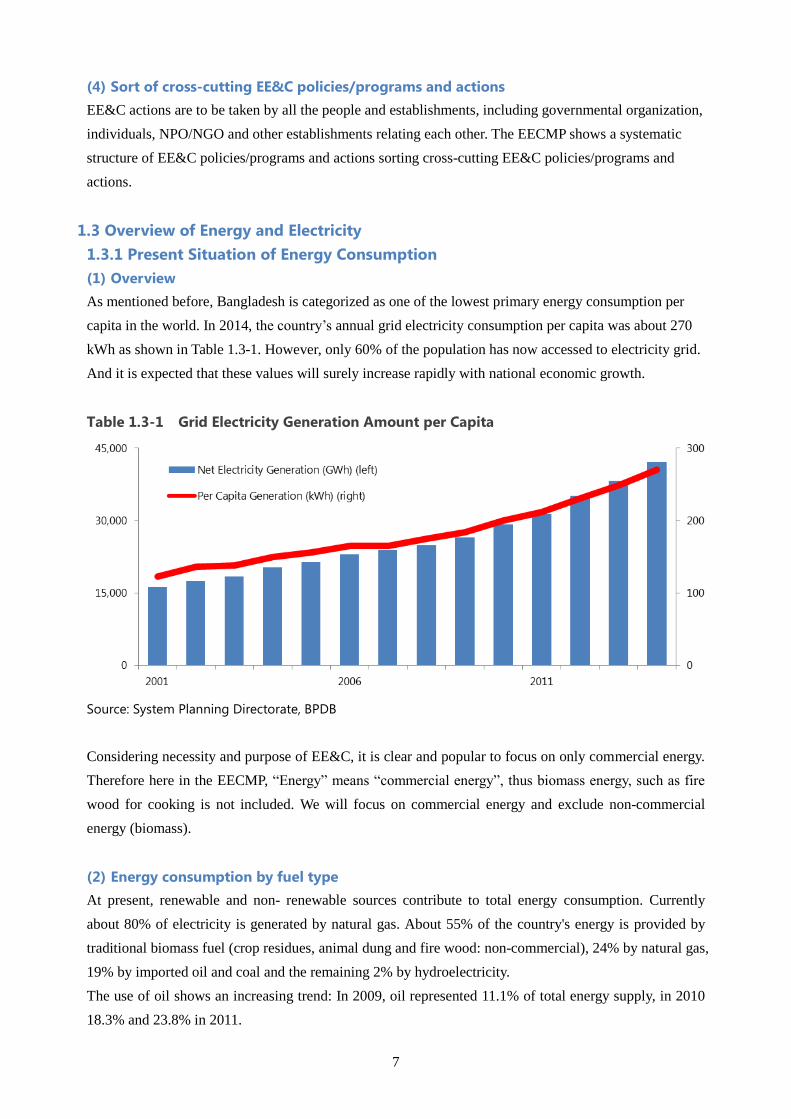
(1) Overview
As mentioned before, Bangladesh is categorized as one of the lowest primary energy consumption per
capita in the world. In 2014, the country’s annual grid electricity consumption per capita was about 270
kWh as shown in Table 1.3-1. However, only 60% of the population has now accessed to electricity grid.
And it is expected that these values will surely increase rapidly with national economic growth.
Table 1.3-1 Grid Electricity Generation Amount per Capita
Source: System Planning Directorate, BPDB
Considering necessity and purpose of EE&C, it is clear and popular to focus on only commercial energy.
Therefore here in the EECMP, “Energy” means “commercial energy”, thus biomass energy, such as fire
wood for cooking is not included. We will focus on commercial energy and exclude non-commercial
energy (biomass).
(2) Energy consumption by fuel type
At present, renewable and non- renewable sources contribute to total energy consumption. Currently
about 80% of electricity is generated by natural gas. About 55% of the country's energy is provided by
traditional biomass fuel (crop residues, animal dung and fire wood: non-commercial), 24% by natural gas,
19% by imported oil and coal and the remaining 2% by hydroelectricity.
The use of oil shows an increasing trend: In 2009, oil represented 11.1% of total energy supply, in 2010
18.3% and 23.8% in 2011.
8
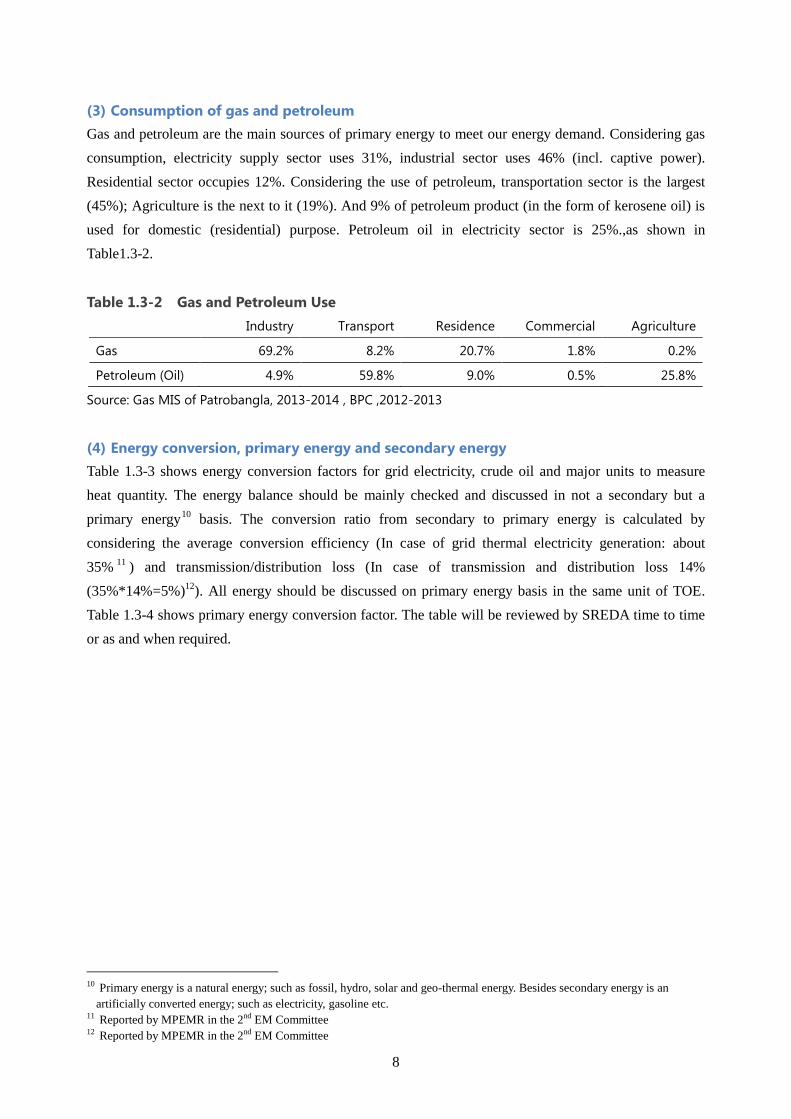
(3) Consumption of gas and petroleum
Gas and petroleum are the main sources of primary energy to meet our energy demand. Considering gas
consumption, electricity supply sector uses 31%, industrial sector uses 46% (incl. captive power).
Residential sector occupies 12%. Considering the use of petroleum, transportation sector is the largest
(45%); Agriculture is the next to it (19%). And 9% of petroleum product (in the form of kerosene oil) is
used for domestic (residential) purpose. Petroleum oil in electricity sector is 25%.,as shown in
Table1.3-2.
Table 1.3-2 Gas and Petroleum Use
Industry Transport Residence Commercial Agriculture
Gas 69.2% 8.2% 20.7% 1.8% 0.2%
Petroleum (Oil) 4.9% 59.8% 9.0% 0.5% 25.8%
Source: Gas MIS of Patrobangla, 2013-2014 , BPC ,2012-2013
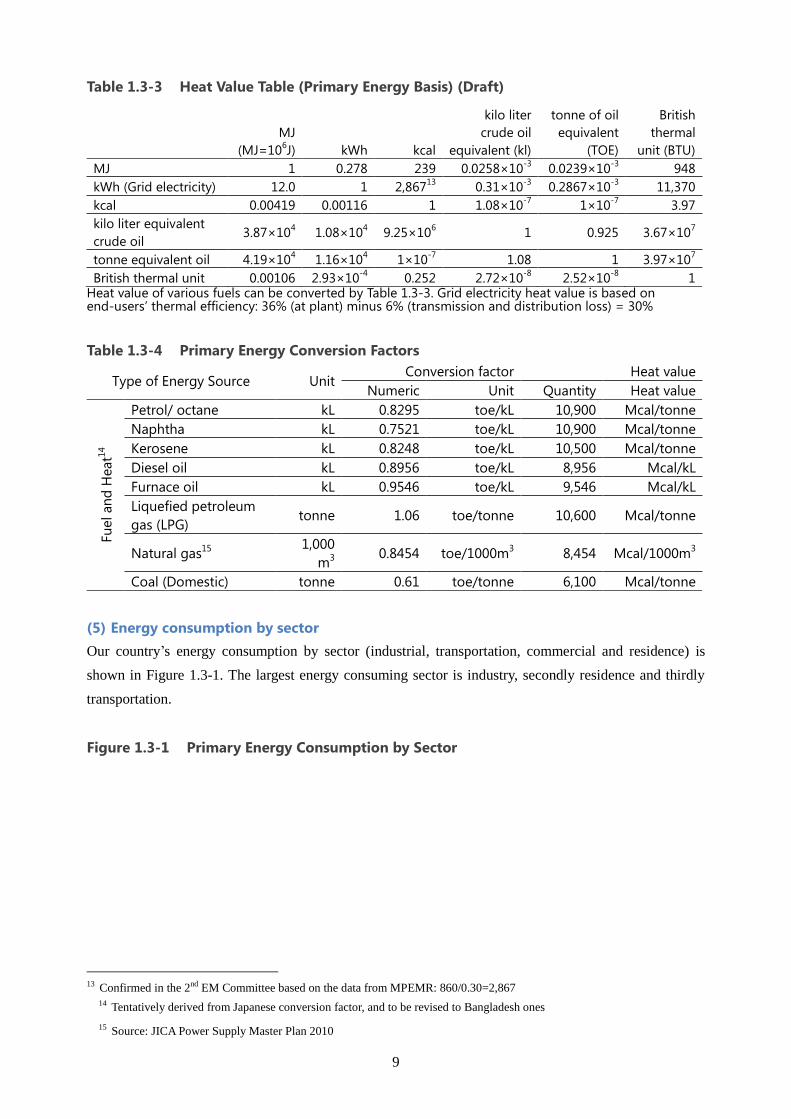
(4) Energy conversion, primary energy and secondary energy
Table 1.3-3 shows energy conversion factors for grid electricity, crude oil and major units to measure
heat quantity. The energy balance should be mainly checked and discussed in not a secondary but a
primary energy10
basis. The conversion ratio from secondary to primary energy is calculated by
considering the average conversion efficiency (In case of grid thermal electricity generation: about
35%11
) and transmission/distribution loss (In case of transmission and distribution loss 14%
(35%*14%=5%)12
). All energy should be discussed on primary energy basis in the same unit of TOE.
Table 1.3-4 shows primary energy conversion factor. The table will be reviewed by SREDA time to time
or as and when required.
10 Primary energy is a natural energy; such as fossil, hydro, solar and geo-thermal energy. Besides secondary energy is an
artificially converted energy; such as electricity, gasoline etc. 11 Reported by MPEMR in the 2nd EM Committee 12 Reported by MPEMR in the 2nd EM Committee
9
Table 1.3-3 Heat Value Table (Primary Energy Basis) (Draft)
MJ
(MJ=106J) kWh kcal
kilo liter
crude oil
equivalent (kl)
tonne of oil
equivalent
(TOE)
British
thermal
unit (BTU)
MJ 1 0.278 239 0.0258×10⁻³
0.0239×10⁻³
948
kWh (Grid electricity) 12.0 1 2,86713
0.31×10⁻³
0.2867×10⁻³
11,370
kcal 0.00419 0.00116 1 1.08×10⁻⁷
1×10⁻⁷
3.97
kilo liter equivalent
crude oil 3.87×10
4 1.08×10
4 9.25×10
6 1 0.925 3.67×10
7
tonne equivalent oil 4.19×10⁴ 1.16×10
4 1×10
-7 1.08 1 3.97×10
7
British thermal unit 0.00106 2.93×10⁻⁴
0.252 2.72×10⁻⁸
2.52×10⁻⁸
1 Heat value of various fuels can be converted by Table 1.3-3. Grid electricity heat value is based on end-users’ thermal efficiency: 36% (at plant) minus 6% (transmission and distribution loss) = 30%
Table 1.3-4 Primary Energy Conversion Factors
Type of Energy Source Unit Conversion factor Heat value
Numeric Unit Quantity Heat value
Fu
el an
d H
eat1
4
Petrol/ octane kL 0.8295 toe/kL 10,900 Mcal/tonne
Naphtha kL 0.7521 toe/kL 10,900 Mcal/tonne
Kerosene kL 0.8248 toe/kL 10,500 Mcal/tonne
Diesel oil kL 0.8956 toe/kL 8,956 Mcal/kL
Furnace oil kL 0.9546 toe/kL 9,546 Mcal/kL
Liquefied petroleum
gas (LPG) tonne 1.06 toe/tonne 10,600 Mcal/tonne
Natural gas15
1,000
m3
0.8454 toe/1000m3 8,454 Mcal/1000m
3
Coal (Domestic) tonne 0.61 toe/tonne 6,100 Mcal/tonne
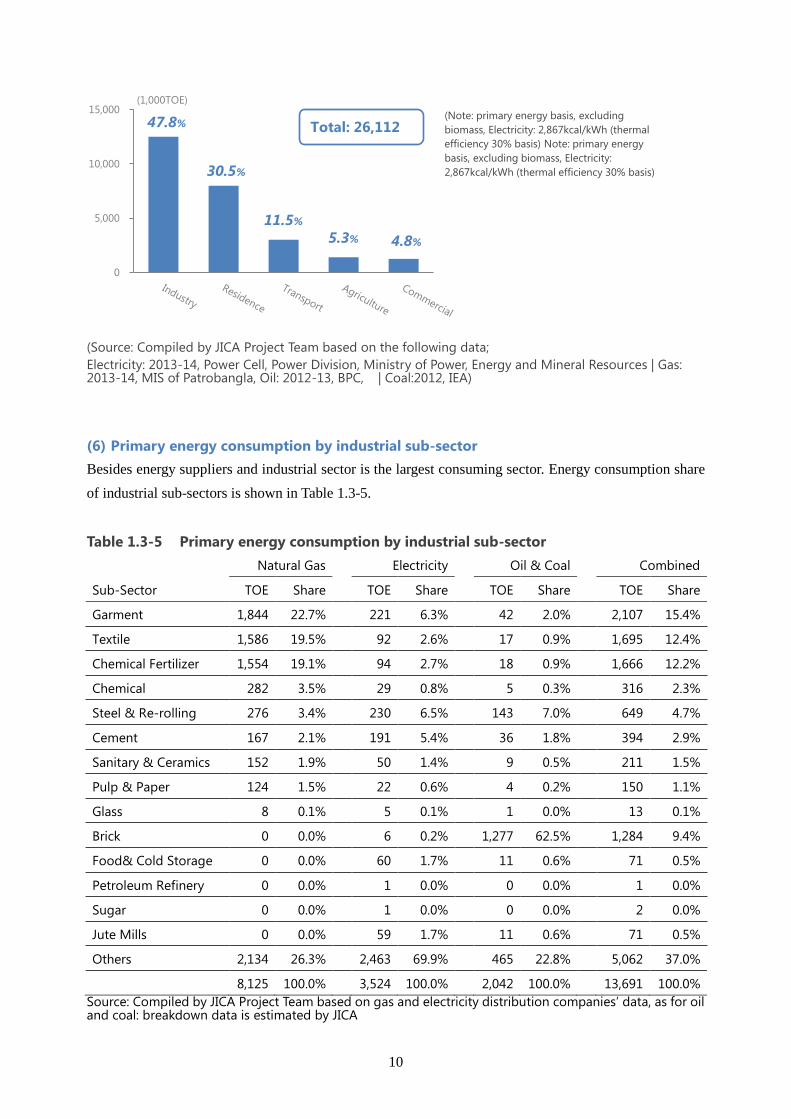
(5) Energy consumption by sector
Our country’s energy consumption by sector (industrial, transportation, commercial and residence) is
shown in Figure 1.3-1. The largest energy consuming sector is industry, secondly residence and thirdly
transportation.
Figure 1.3-1 Primary Energy Consumption by Sector
13 Confirmed in the 2nd EM Committee based on the data from MPEMR: 860/0.30=2,867
14 Tentatively derived from Japanese conversion factor, and to be revised to Bangladesh ones
15 Source: JICA Power Supply Master Plan 2010
10
(Source: Compiled by JICA Project Team based on the following data;
Electricity: 2013-14, Power Cell, Power Division, Ministry of Power, Energy and Mineral Resources | Gas: 2013-14, MIS of Patrobangla, Oil: 2012-13, BPC, | Coal:2012, IEA)
(6) Primary energy consumption by industrial sub-sector
Besides energy suppliers and industrial sector is the largest consuming sector. Energy consumption share
of industrial sub-sectors is shown in Table 1.3-5.
Table 1.3-5 Primary energy consumption by industrial sub-sector
Natural Gas Electricity Oil & Coal Combined
Sub-Sector TOE Share TOE Share TOE Share TOE Share
Garment 1,844 22.7% 221 6.3% 42 2.0% 2,107 15.4%
Textile 1,586 19.5% 92 2.6% 17 0.9% 1,695 12.4%
Chemical Fertilizer 1,554 19.1% 94 2.7% 18 0.9% 1,666 12.2%
Chemical 282 3.5% 29 0.8% 5 0.3% 316 2.3%
Steel & Re-rolling 276 3.4% 230 6.5% 143 7.0% 649 4.7%
Cement 167 2.1% 191 5.4% 36 1.8% 394 2.9%
Sanitary & Ceramics 152 1.9% 50 1.4% 9 0.5% 211 1.5%
Pulp & Paper 124 1.5% 22 0.6% 4 0.2% 150 1.1%
Glass 8 0.1% 5 0.1% 1 0.0% 13 0.1%
Brick 0 0.0% 6 0.2% 1,277 62.5% 1,284 9.4%
Food& Cold Storage 0 0.0% 60 1.7% 11 0.6% 71 0.5%
Petroleum Refinery 0 0.0% 1 0.0% 0 0.0% 1 0.0%
Sugar 0 0.0% 1 0.0% 0 0.0% 2 0.0%
Jute Mills 0 0.0% 59 1.7% 11 0.6% 71 0.5%
Others 2,134 26.3% 2,463 69.9% 465 22.8% 5,062 37.0%
8,125 100.0% 3,524 100.0% 2,042 100.0% 13,691 100.0%
Source: Compiled by JICA Project Team based on gas and electricity distribution companies’ data, as for oil and coal: breakdown data is estimated by JICA
0
5,000
10,000
15,000(1,000TOE)
47.8%
30.5%
11.5%
5.3% 4.8%
Total: 26,112 (Note: primary energy basis, excluding
biomass, Electricity: 2,867kcal/kWh (thermal
efficiency 30% basis) Note: primary energy
basis, excluding biomass, Electricity:
2,867kcal/kWh (thermal efficiency 30% basis)
11
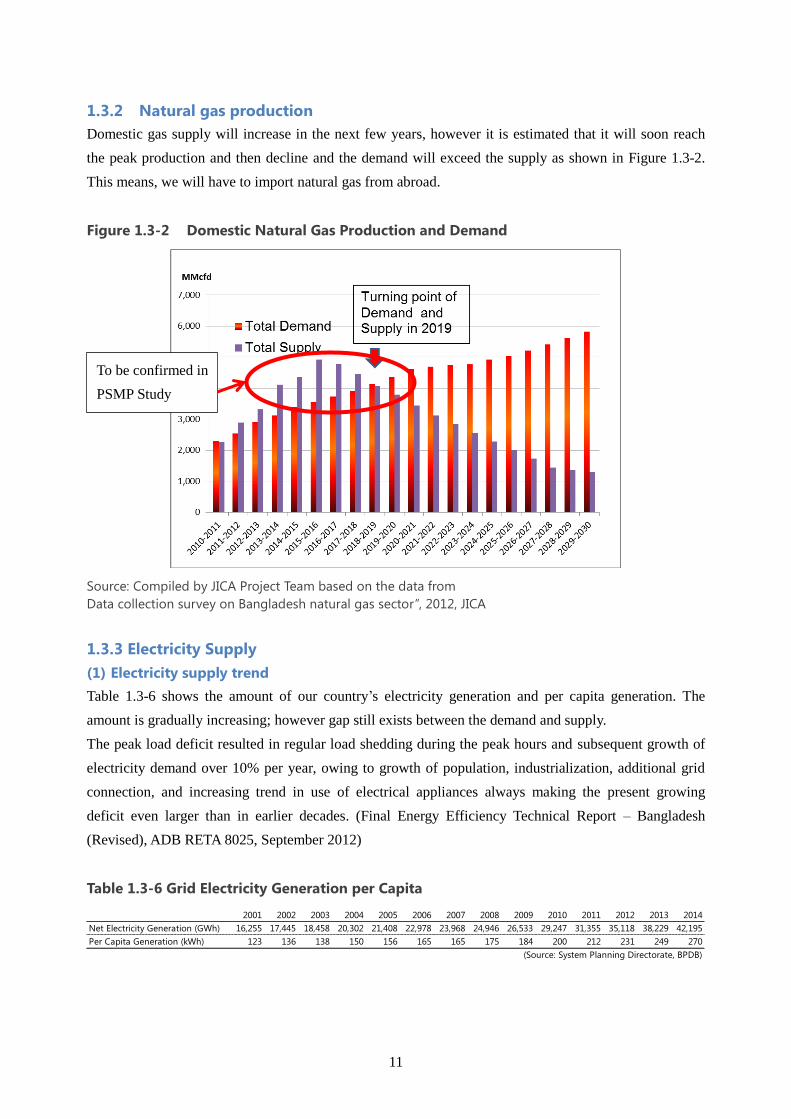
1.3.2 Natural gas production
Domestic gas supply will increase in the next few years, however it is estimated that it will soon reach
the peak production and then decline and the demand will exceed the supply as shown in Figure 1.3-2.
This means, we will have to import natural gas from abroad.
Figure 1.3-2 Domestic Natural Gas Production and Demand
Source: Compiled by JICA Project Team based on the data from
Data collection survey on Bangladesh natural gas sector”, 2012, JICA
1.3.3 Electricity Supply
(1) Electricity supply trend
Table 1.3-6 shows the amount of our country’s electricity generation and per capita generation. The
amount is gradually increasing; however gap still exists between the demand and supply.
The peak load deficit resulted in regular load shedding during the peak hours and subsequent growth of
electricity demand over 10% per year, owing to growth of population, industrialization, additional grid
connection, and increasing trend in use of electrical appliances always making the present growing
deficit even larger than in earlier decades. (Final Energy Efficiency Technical Report – Bangladesh
(Revised), ADB RETA 8025, September 2012)
Table 1.3-6 Grid Electricity Generation per Capita
2001 2002 2003 2004 2005 2006 2007 2008 2009 2010 2011 2012 2013 2014
Net Electricity Generation (GWh) 16,255 17,445 18,458 20,302 21,408 22,978 23,968 24,946 26,533 29,247 31,355 35,118 38,229 42,195
Per Capita Generation (kWh) 123 136 138 150 156 165 165 175 184 200 212 231 249 270
(Source: System Planning Directorate, BPDB)
To be confirmed in
PSMP Study
12
(2) Electricity generation fuel mix
Table 1.3-7 shows the fuel mix used for electricity generation. As noted, electricity is strongly relaying
on fossil fuels.
Table 1.3-7 Electricity Generation Fuel Mix (2013-14)
Electricity generation:42,195 GWh
Hydro 1.39%
Gas 72.42%
HFO 15.44%
HSD 2.91%
Coal 2.46%
Import from India 5.37% (Source: System Planning Directorate, MPEMR)
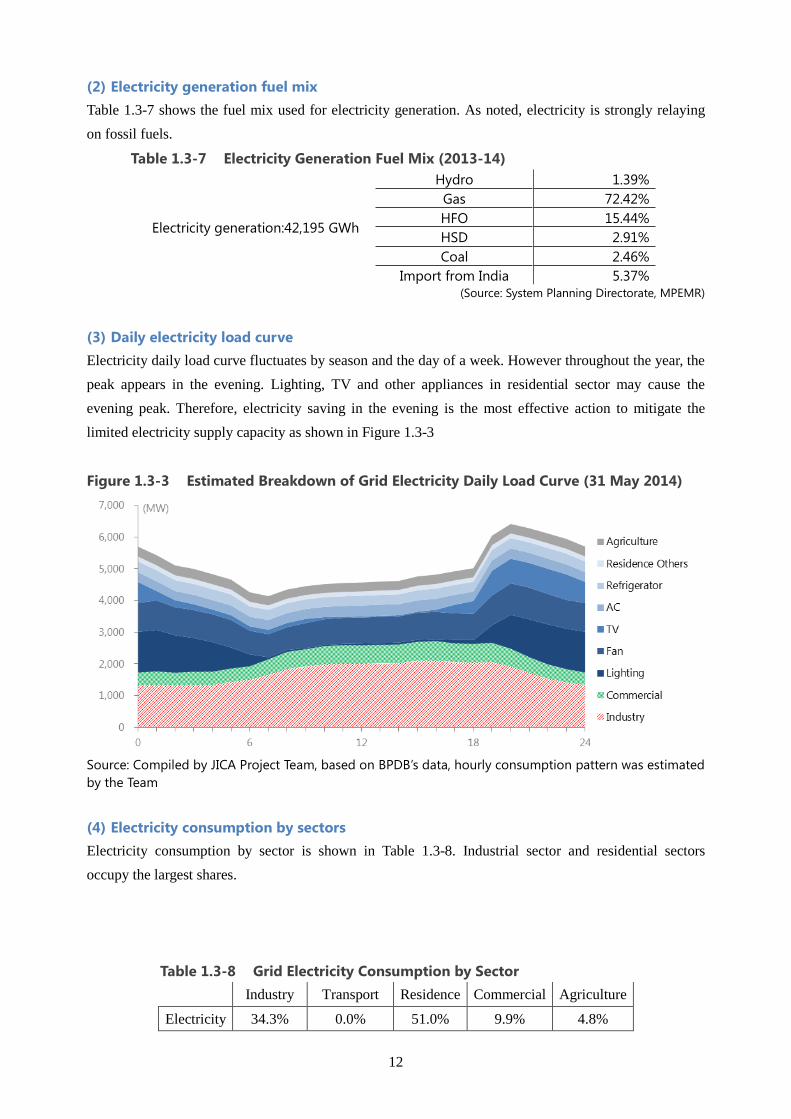
(3) Daily electricity load curve
Electricity daily load curve fluctuates by season and the day of a week. However throughout the year, the
peak appears in the evening. Lighting, TV and other appliances in residential sector may cause the
evening peak. Therefore, electricity saving in the evening is the most effective action to mitigate the
limited electricity supply capacity as shown in Figure 1.3-3
Figure 1.3-3 Estimated Breakdown of Grid Electricity Daily Load Curve (31 May 2014)
Source: Compiled by JICA Project Team, based on BPDB’s data, hourly consumption pattern was estimated
by the Team
(4) Electricity consumption by sectors
Electricity consumption by sector is shown in Table 1.3-8. Industrial sector and residential sectors
occupy the largest shares.
Table 1.3-8 Grid Electricity Consumption by Sector
Industry Transport Residence Commercial Agriculture
Electricity 34.3% 0.0% 51.0% 9.9% 4.8%
13
Source: Power Cell, Power Division, Ministry of Power, Energy and Mineral
Resources,2013-14
(5) Electricity supply expansion plan
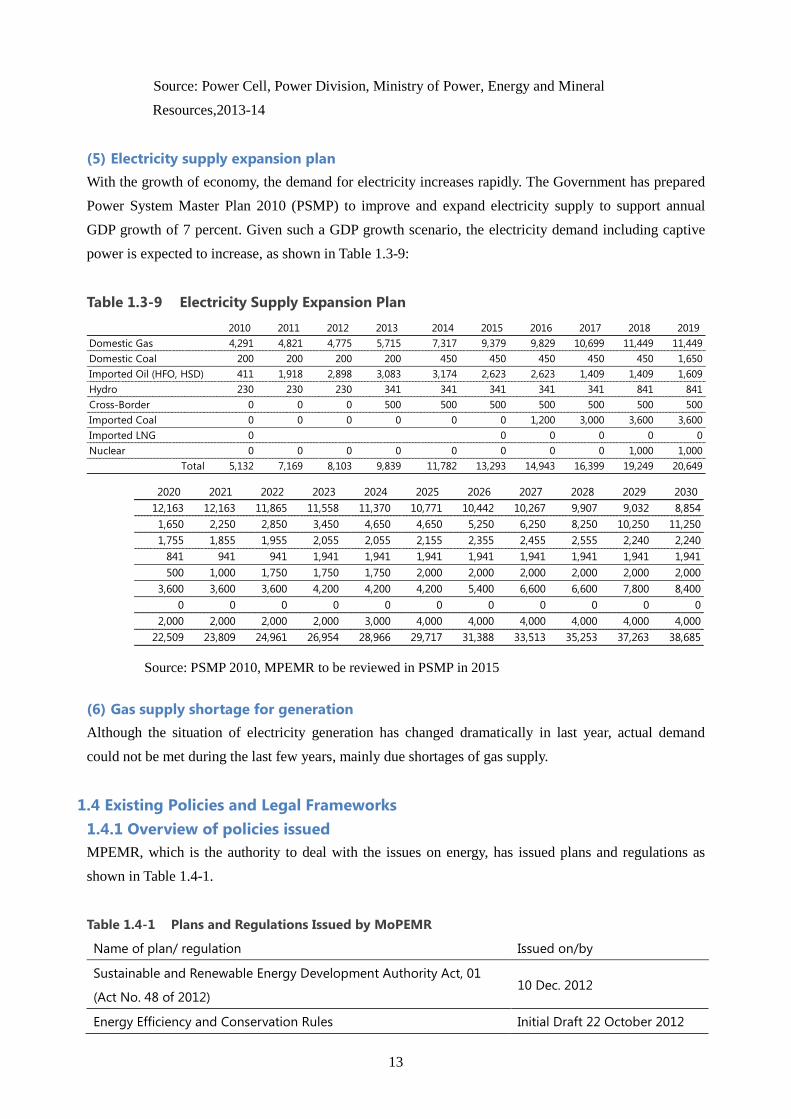
With the growth of economy, the demand for electricity increases rapidly. The Government has prepared
Power System Master Plan 2010 (PSMP) to improve and expand electricity supply to support annual
GDP growth of 7 percent. Given such a GDP growth scenario, the electricity demand including captive
power is expected to increase, as shown in Table 1.3-9:
Table 1.3-9 Electricity Supply Expansion Plan
(6) Gas supply shortage for generation
Although the situation of electricity generation has changed dramatically in last year, actual demand
could not be met during the last few years, mainly due shortages of gas supply.
1.4 Existing Policies and Legal Frameworks
1.4.1 Overview of policies issued
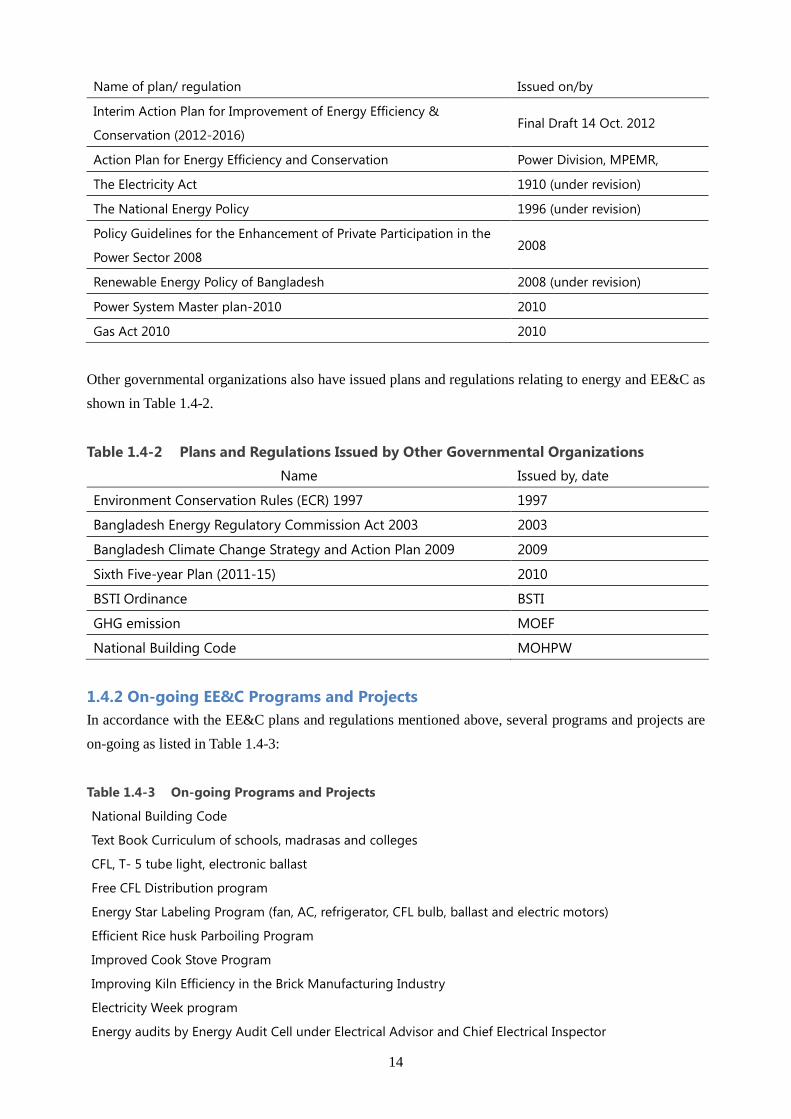
MPEMR, which is the authority to deal with the issues on energy, has issued plans and regulations as
shown in Table 1.4-1.
Table 1.4-1 Plans and Regulations Issued by MoPEMR
Name of plan/ regulation Issued on/by
Sustainable and Renewable Energy Development Authority Act, 01
(Act No. 48 of 2012) 10 Dec. 2012
Energy Efficiency and Conservation Rules Initial Draft 22 October 2012
2010 2011 2012 2013 2014 2015 2016 2017 2018 2019
Domestic Gas 4,291 4,821 4,775 5,715 7,317 9,379 9,829 10,699 11,449 11,449
Domestic Coal 200 200 200 200 450 450 450 450 450 1,650
Imported Oil (HFO, HSD) 411 1,918 2,898 3,083 3,174 2,623 2,623 1,409 1,409 1,609
Hydro 230 230 230 341 341 341 341 341 841 841
Cross-Border 0 0 0 500 500 500 500 500 500 500
Imported Coal 0 0 0 0 0 0 1,200 3,000 3,600 3,600
Imported LNG 0 0 0 0 0 0
Nuclear 0 0 0 0 0 0 0 0 1,000 1,000
Total 5,132 7,169 8,103 9,839 11,782 13,293 14,943 16,399 19,249 20,649
2020 2021 2022 2023 2024 2025 2026 2027 2028 2029 2030
12,163 12,163 11,865 11,558 11,370 10,771 10,442 10,267 9,907 9,032 8,854
1,650 2,250 2,850 3,450 4,650 4,650 5,250 6,250 8,250 10,250 11,250
1,755 1,855 1,955 2,055 2,055 2,155 2,355 2,455 2,555 2,240 2,240
841 941 941 1,941 1,941 1,941 1,941 1,941 1,941 1,941 1,941
500 1,000 1,750 1,750 1,750 2,000 2,000 2,000 2,000 2,000 2,000
3,600 3,600 3,600 4,200 4,200 4,200 5,400 6,600 6,600 7,800 8,400
0 0 0 0 0 0 0 0 0 0 0
2,000 2,000 2,000 2,000 3,000 4,000 4,000 4,000 4,000 4,000 4,000
22,509 23,809 24,961 26,954 28,966 29,717 31,388 33,513 35,253 37,263 38,685
Source: PSMP 2010, MPEMR to be reviewed in PSMP in 2015
14
Name of plan/ regulation Issued on/by
Interim Action Plan for Improvement of Energy Efficiency &
Conservation (2012-2016) Final Draft 14 Oct. 2012
Action Plan for Energy Efficiency and Conservation Power Division, MPEMR,
The Electricity Act 1910 (under revision)
The National Energy Policy 1996 (under revision)
Policy Guidelines for the Enhancement of Private Participation in the
Power Sector 2008 2008
Renewable Energy Policy of Bangladesh 2008 (under revision)
Power System Master plan-2010 2010
Gas Act 2010 2010
Other governmental organizations also have issued plans and regulations relating to energy and EE&C as
shown in Table 1.4-2.
Table 1.4-2 Plans and Regulations Issued by Other Governmental Organizations
Name Issued by, date
Environment Conservation Rules (ECR) 1997 1997
Bangladesh Energy Regulatory Commission Act 2003 2003
Bangladesh Climate Change Strategy and Action Plan 2009 2009
Sixth Five-year Plan (2011-15) 2010
BSTI Ordinance BSTI
GHG emission MOEF
National Building Code MOHPW
1.4.2 On-going EE&C Programs and Projects
In accordance with the EE&C plans and regulations mentioned above, several programs and projects are
on-going as listed in Table 1.4-3:
Table 1.4-3 On-going Programs and Projects
National Building Code
Text Book Curriculum of schools, madrasas and colleges
CFL, T- 5 tube light, electronic ballast
Free CFL Distribution program
Energy Star Labeling Program (fan, AC, refrigerator, CFL bulb, ballast and electric motors)
Efficient Rice husk Parboiling Program
Improved Cook Stove Program
Improving Kiln Efficiency in the Brick Manufacturing Industry
Electricity Week program
Energy audits by Energy Audit Cell under Electrical Advisor and Chief Electrical Inspector
15
1.5 Stakeholder’s Participation in EE&C Planning and Policy Making
Nobody can live without energy, and all of us have responsibility on energy use. In order to mobilize
EE&C activities nationwide, EE&C policies and programs should be prepared getting as much as
opinions and ideas from all concerned stakeholders and building a consensus among them; such as
governmental organizations, individuals, establishments, residences, schools and industries,.
It is important to hold not only governmental officials meetings but also open discussion meetings
inviting related stakeholders, including those from private sectors. Such manner will shorten the time for
wider dissemination of the EE&C plans and regulations to the people and businesses.
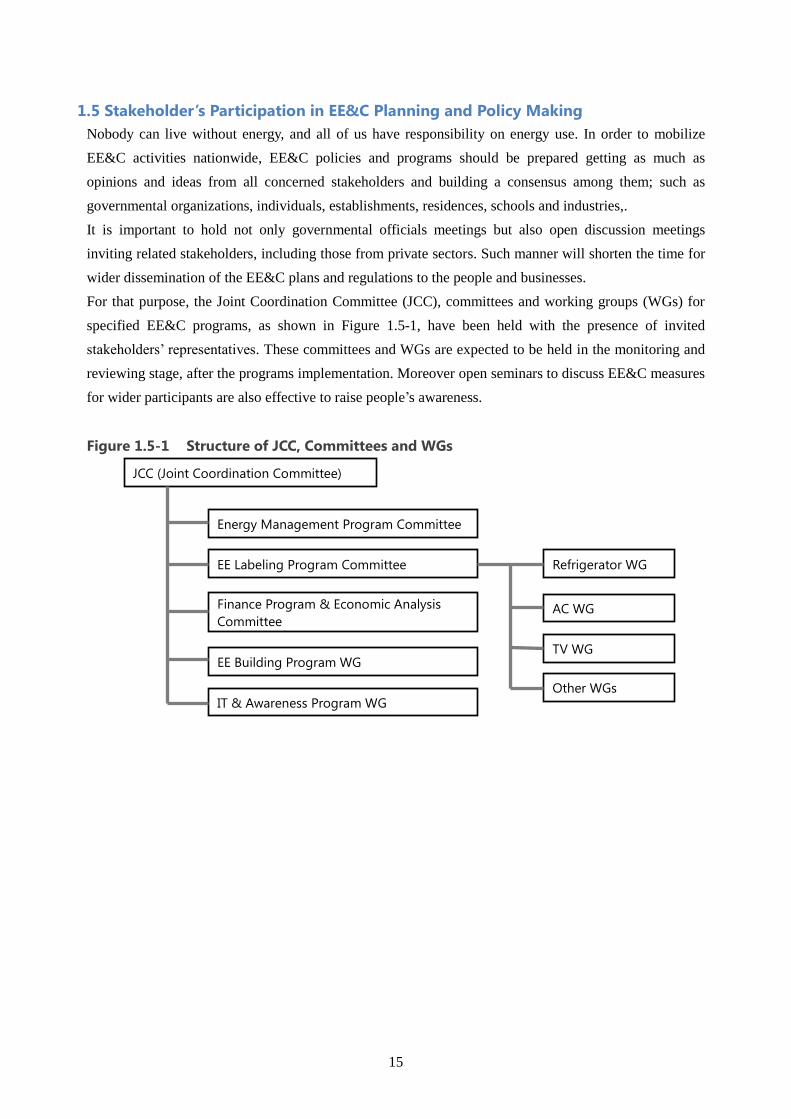
For that purpose, the Joint Coordination Committee (JCC), committees and working groups (WGs) for
specified EE&C programs, as shown in Figure 1.5-1, have been held with the presence of invited
stakeholders’ representatives. These committees and WGs are expected to be held in the monitoring and
reviewing stage, after the programs implementation. Moreover open seminars to discuss EE&C measures
for wider participants are also effective to raise people’s awareness.
Figure 1.5-1 Structure of JCC, Committees and WGs
JCC (Joint Coordination Committee)
Energy Management Program Committee
EE Labeling Program Committee
EE Building Program WG
Finance Program & Economic Analysis
Committee
IT & Awareness Program WG
Refrigerator WG
AC WG
TV WG
Other WGs
16
Chapter 2 Energy Efficiency and Conservation Master Plan
2.1 Master Plan
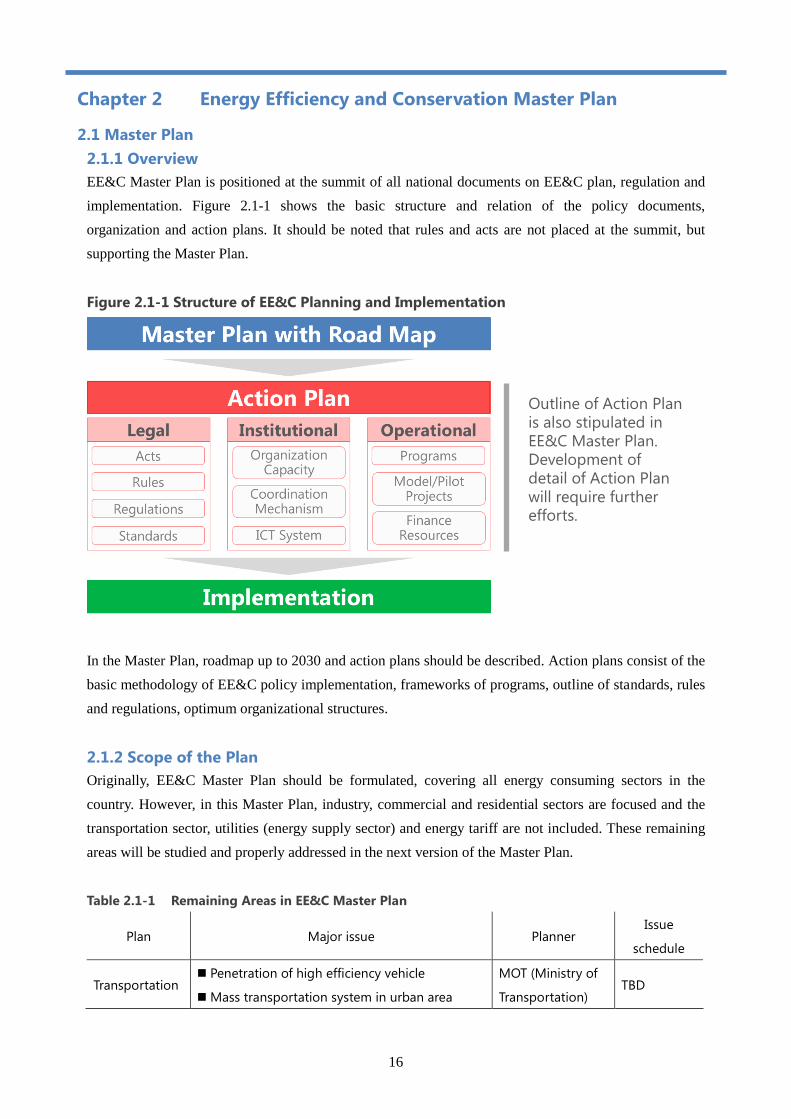
2.1.1 Overview
EE&C Master Plan is positioned at the summit of all national documents on EE&C plan, regulation and
implementation. Figure 2.1-1 shows the basic structure and relation of the policy documents,
organization and action plans. It should be noted that rules and acts are not placed at the summit, but
supporting the Master Plan.
Figure 2.1-1 Structure of EE&C Planning and Implementation
In the Master Plan, roadmap up to 2030 and action plans should be described. Action plans consist of the
basic methodology of EE&C policy implementation, frameworks of programs, outline of standards, rules
and regulations, optimum organizational structures.
2.1.2 Scope of the Plan
Originally, EE&C Master Plan should be formulated, covering all energy consuming sectors in the
country. However, in this Master Plan, industry, commercial and residential sectors are focused and the
transportation sector, utilities (energy supply sector) and energy tariff are not included. These remaining
areas will be studied and properly addressed in the next version of the Master Plan.
Table 2.1-1 Remaining Areas in EE&C Master Plan
Plan Major issue Planner Issue
schedule
Transportation Penetration of high efficiency vehicle
Mass transportation system in urban area
MOT (Ministry of
Transportation) TBD
Outline of Action Plan is also stipulated in EE&C Master Plan. Development of detail of Action Plan will require further efforts.
17
Plan Major issue Planner Issue
schedule
Utilities
High efficiency generation
Transmission loss reduction, power factor
improvement
Energy management at energy supply plants
Power Division,
MPEMR
BERC
2015
Energy tariff
Subsidy reduction
TOU (Time of Use)
Measurement charge (provision of meters)
Power Division,
MPEMR TBD
2.1.3 Present Energy Consumption as the “Baseline”
Present energy consumption situation is summarized in Chapter1.3. A baseline which indicates
nationwide energy consumption should be fixed in order to set EE&C target. The baseline should be set
in energy intensity basis, which is calculated by primary energy consumption and GDP in 2013-14 as
shown in Table 2.1-2.
Table 2.1-2 GDP and primary energy consumption in 2013-14
GDP in 2013-14 (billion
USD)
Final energy consumption in 2013-14
(primary energy basis, excluding
transportation & biomass) (1,000toe)
Final energy consumption/ GDP
(kg OE/ 1,000USD)
130 24,409 188
(Source: Compiled by JICA Project Team based on the following data sources: GDP from WB website,
energy consumption from mainly distribution companies’ data (oil & coal: 2012-13 data))
2.1.4 Energy Consumption in 2030, BAU Scenario
Figure 2.1-2 shows the forecast of primary energy consumption by sector up to 2030. Annual economic
growth rate is assumed as 7.0%.
Figure 2.1-2 Primary Energy Consumption Forecast for 2030 (BAU case)
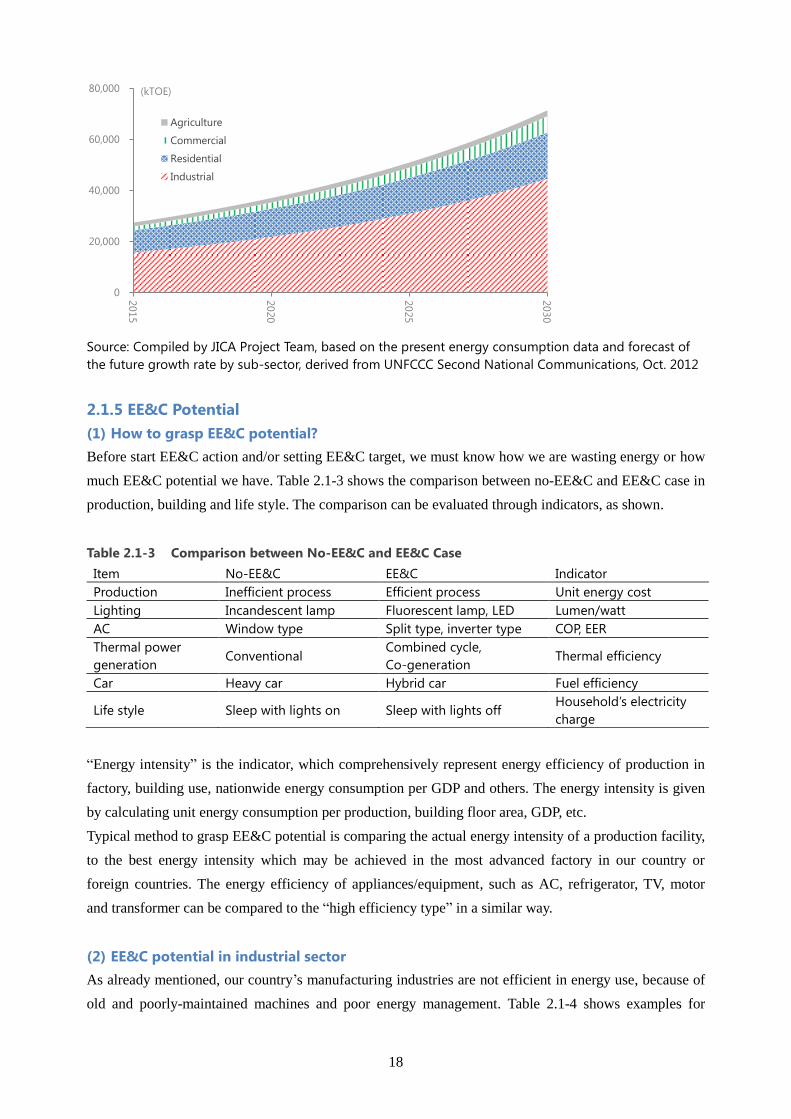
18
Source: Compiled by JICA Project Team, based on the present energy consumption data and forecast of
the future growth rate by sub-sector, derived from UNFCCC Second National Communications, Oct. 2012
2.1.5 EE&C Potential
(1) How to grasp EE&C potential?
Before start EE&C action and/or setting EE&C target, we must know how we are wasting energy or how
much EE&C potential we have. Table 2.1-3 shows the comparison between no-EE&C and EE&C case in
production, building and life style. The comparison can be evaluated through indicators, as shown.
Table 2.1-3 Comparison between No-EE&C and EE&C Case
Item No-EE&C EE&C Indicator
Production Inefficient process Efficient process Unit energy cost
Lighting Incandescent lamp Fluorescent lamp, LED Lumen/watt
AC Window type Split type, inverter type COP, EER
Thermal power
generation Conventional
Combined cycle,
Co-generation Thermal efficiency
Car Heavy car Hybrid car Fuel efficiency
Life style Sleep with lights on Sleep with lights off Household’s electricity
charge
“Energy intensity” is the indicator, which comprehensively represent energy efficiency of production in
factory, building use, nationwide energy consumption per GDP and others. The energy intensity is given
by calculating unit energy consumption per production, building floor area, GDP, etc.
Typical method to grasp EE&C potential is comparing the actual energy intensity of a production facility,
to the best energy intensity which may be achieved in the most advanced factory in our country or
foreign countries. The energy efficiency of appliances/equipment, such as AC, refrigerator, TV, motor
and transformer can be compared to the “high efficiency type” in a similar way.
(2) EE&C potential in industrial sector
As already mentioned, our country’s manufacturing industries are not efficient in energy use, because of
old and poorly-maintained machines and poor energy management. Table 2.1-4 shows examples for
0
20,000
40,000
60,000
80,000
2015
2020
2025
2030
(kTOE)
Agriculture
Commercial
Residential
Industrial
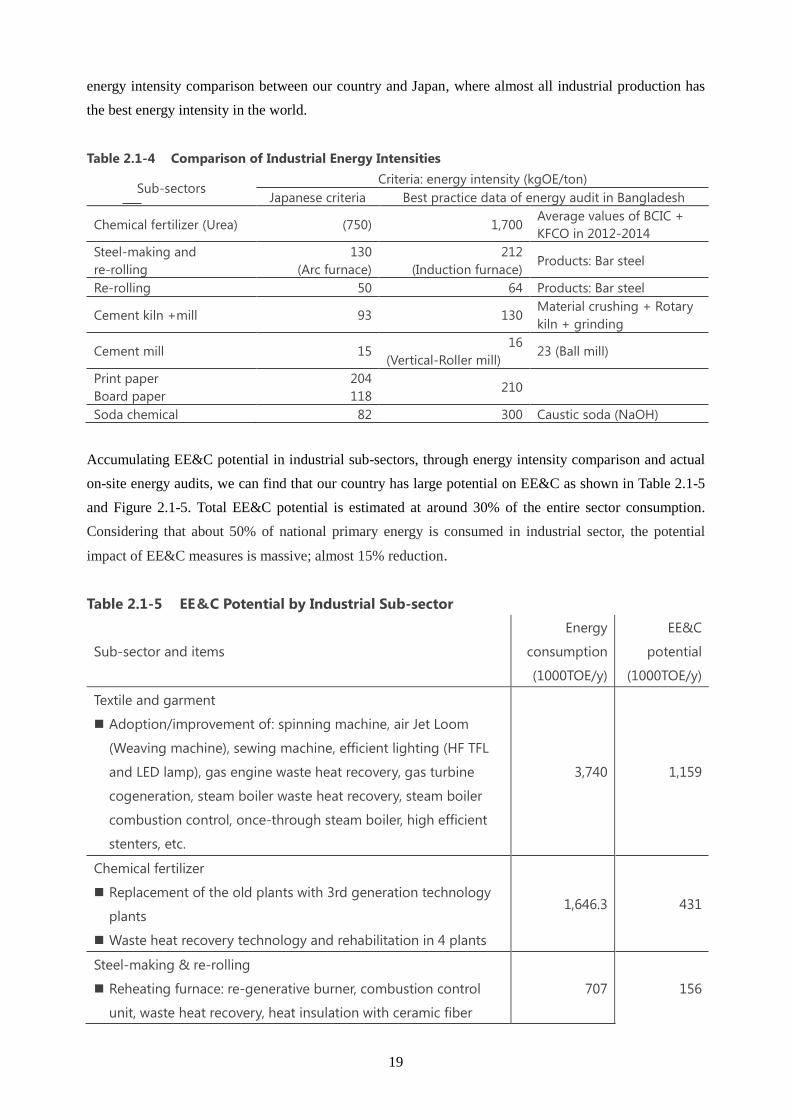
19
energy intensity comparison between our country and Japan, where almost all industrial production has
the best energy intensity in the world.
Table 2.1-4 Comparison of Industrial Energy Intensities
Sub-sectors Criteria: energy intensity (kgOE/ton)
Japanese criteria Best practice data of energy audit in Bangladesh
Chemical fertilizer (Urea) (750) 1,700 Average values of BCIC +
KFCO in 2012-2014
Steel-making and
re-rolling
130
(Arc furnace)
212
(Induction furnace) Products: Bar steel
Re-rolling 50 64 Products: Bar steel
Cement kiln +mill 93 130 Material crushing + Rotary
kiln + grinding
Cement mill 15 16
(Vertical-Roller mill) 23 (Ball mill)
Print paper 204 210
Board paper 118
Soda chemical 82 300 Caustic soda (NaOH)
Accumulating EE&C potential in industrial sub-sectors, through energy intensity comparison and actual
on-site energy audits, we can find that our country has large potential on EE&C as shown in Table 2.1-5
and Figure 2.1-5. Total EE&C potential is estimated at around 30% of the entire sector consumption.
Considering that about 50% of national primary energy is consumed in industrial sector, the potential
impact of EE&C measures is massive; almost 15% reduction.
Table 2.1-5 EE&C Potential by Industrial Sub-sector
Sub-sector and items
Energy
consumption
(1000TOE/y)
EE&C
potential
(1000TOE/y)
Textile and garment
Adoption/improvement of: spinning machine, air Jet Loom
(Weaving machine), sewing machine, efficient lighting (HF TFL
and LED lamp), gas engine waste heat recovery, gas turbine
cogeneration, steam boiler waste heat recovery, steam boiler
combustion control, once-through steam boiler, high efficient
stenters, etc.
3,740 1,159
Chemical fertilizer
Replacement of the old plants with 3rd generation technology
plants
Waste heat recovery technology and rehabilitation in 4 plants
1,646.3 431
Steel-making & re-rolling
Reheating furnace: re-generative burner, combustion control
unit, waste heat recovery, heat insulation with ceramic fiber
707 156
20
Sub-sector and items
Energy
consumption
(1000TOE/y)
EE&C
potential
(1000TOE/y)
Replacement of induction furnace with arc furnaces
Cement grinding
Replacement with vertical roller mill 358 75
Cold strage
Renewal of gas compressor 60 31
Chemical
Improvement of caustic soda electrolytic process 310 5
Others 5,626 482
Energy management in all sub-sectors
Enforcement of energy management: DCs, EM, Energy audit 1281
Total 12,447 3,620
(-31%)
Source: JICA Project for EE&C Master Pan
A: Present energy consumption B: EE&C case energy consumption
Source: Compiled by JICA Project Team based on the data from gas and electricity distribution companies’ data
Figure 2.1-3 Industrial Sector’s EE&C Potential
(3) EE&C potential in residential sector
Efficient type products are available at the home appliance market, however the sales are minor at
present. If all existing home appliances in residences are replaced by the highest efficiency type products,
huge scale of energy consumption reduction can be achieved. This is the meaning of “EE&C Potential”.
Table 2.1-6 shows rough estimation of energy consumption reduction rates (EE rate) by appliances
introduced by the current EE technologies, and Figure 2.1-6 shows present electricity consumption by
home appliance (A) and EE case electricity consumption (B) using the EE rates given in Table 2.1-6.
EE&C potential is estimated at around 36%.
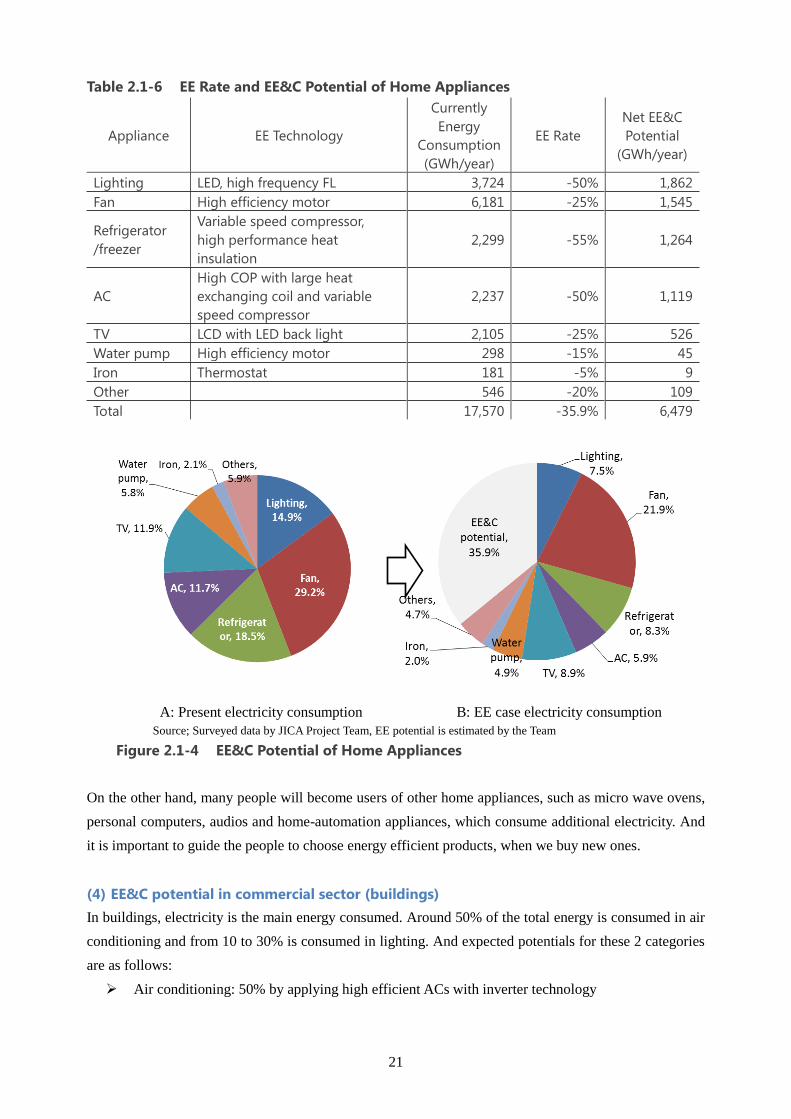
21
Table 2.1-6 EE Rate and EE&C Potential of Home Appliances
Appliance EE Technology
Currently
Energy
Consumption
(GWh/year)
EE Rate
Net EE&C
Potential
(GWh/year)
Lighting LED, high frequency FL 3,724 -50% 1,862
Fan High efficiency motor 6,181 -25% 1,545
Refrigerator
/freezer
Variable speed compressor,
high performance heat
insulation
2,299 -55% 1,264
AC
High COP with large heat
exchanging coil and variable
speed compressor
2,237 -50% 1,119
TV LCD with LED back light 2,105 -25% 526
Water pump High efficiency motor 298 -15% 45
Iron Thermostat 181 -5% 9
Other 546 -20% 109
Total 17,570 -35.9% 6,479
A: Present electricity consumption B: EE case electricity consumption
Source; Surveyed data by JICA Project Team, EE potential is estimated by the Team
Figure 2.1-4 EE&C Potential of Home Appliances
On the other hand, many people will become users of other home appliances, such as micro wave ovens,
personal computers, audios and home-automation appliances, which consume additional electricity. And
it is important to guide the people to choose energy efficient products, when we buy new ones.
(4) EE&C potential in commercial sector (buildings)
In buildings, electricity is the main energy consumed. Around 50% of the total energy is consumed in air
conditioning and from 10 to 30% is consumed in lighting. And expected potentials for these 2 categories
are as follows:
Air conditioning: 50% by applying high efficient ACs with inverter technology
22
Lighting: 50% by applying high efficient lighting system, such as LED lamp, T5 florescent lamp
with electronic ballast or utilizing solar light
Thus total EE&C potential for commercial sector is supposed to be about 50 %.
2.1.6 Target for 2030
There are several indicators to evaluate the improvement of future national energy efficiency, such as
energy consumption per capita, energy consumption per Growth Domestic Product (GDP) and the
reduction amount of energy consumption etc. Energy consumption per capita is not suitable for
developing countries like Bangladesh. And in case of evaluating by the reduction amount, it is not easy
to fix the national baseline in the future. Besides energy consumption per GDP can consider both the
energy efficiency and increase of national economy. Therefore we will use “primary energy consumption
per GDP” as an indicator to evaluate future national energy efficiency.
As mentioned in the last paragraph, theoretically EE&C potential for major energy consuming sectors
ranges from 31% to 50%. However, there exist a quite large number of low efficient factories, buildings
and home appliances. Changing these into higher efficient ones is not easy and takes time. And it is
estimated that with formulating suitable regulatory measures and incentive mechanisms, which are
mentioned in the following pages, in accordance with nationwide actions for energy conservation, 20%
reduction of primary energy consumption per GDP can be achieved by 2030. And by 2021, when gas and
power supply shortage is expected, 15% reduction of primary energy consumption per GDP is to be
achieved. Here in the Master Plan, EE&C target and road map are set as Table 2.1-7. The targets both for
2021 and 2030 are set with consideration of the EE&C potential and current energy consumption status;
i.e. low electrification ratio, insufficient industry’s environmental protection measures, improvement of
work condition and life style etc. Final goal of EE&C policies is to realize self-reliant cycles, rather than
compulsory EE&C activities. We aim to accomplish the target, and realize a “self-reliant EE&C” society
by 2030.
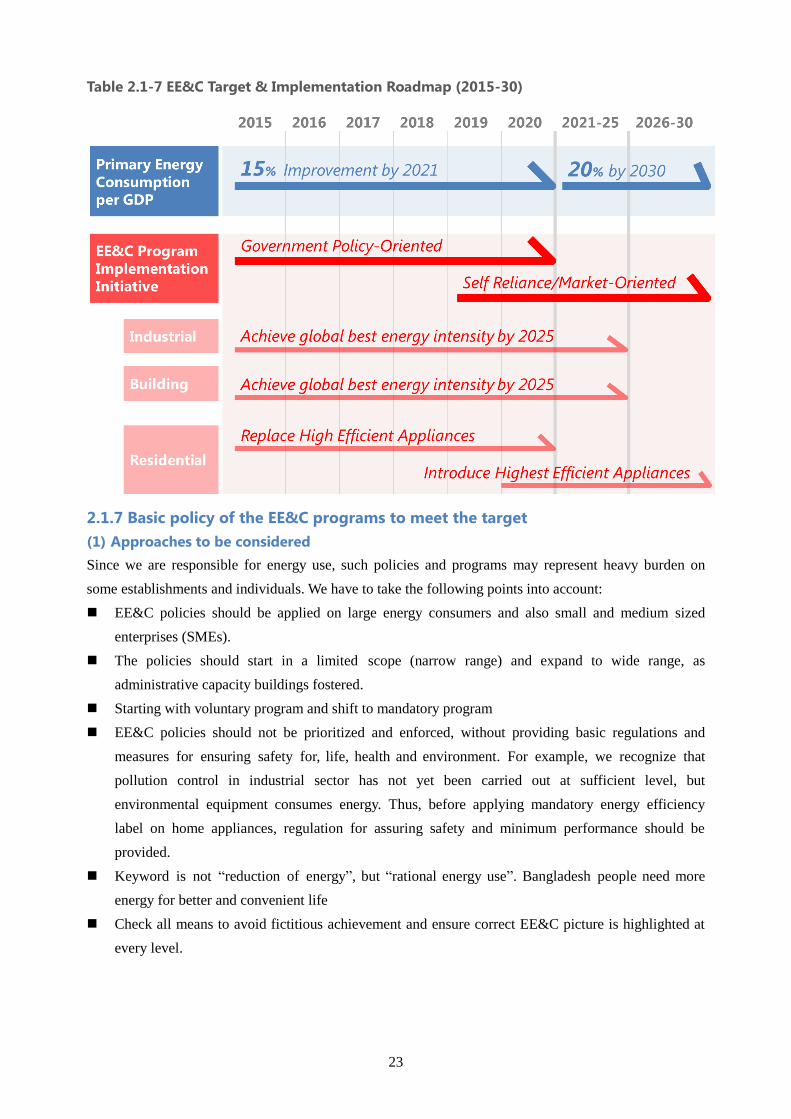
23
Table 2.1-7 EE&C Target & Implementation Roadmap (2015-30)
2.1.7 Basic policy of the EE&C programs to meet the target
(1) Approaches to be considered
Since we are responsible for energy use, such policies and programs may represent heavy burden on
some establishments and individuals. We have to take the following points into account:
EE&C policies should be applied on large energy consumers and also small and medium sized
enterprises (SMEs).
The policies should start in a limited scope (narrow range) and expand to wide range, as
administrative capacity buildings fostered.
Starting with voluntary program and shift to mandatory program
EE&C policies should not be prioritized and enforced, without providing basic regulations and
measures for ensuring safety for, life, health and environment. For example, we recognize that
pollution control in industrial sector has not yet been carried out at sufficient level, but
environmental equipment consumes energy. Thus, before applying mandatory energy efficiency
label on home appliances, regulation for assuring safety and minimum performance should be
provided.
Keyword is not “reduction of energy”, but “rational energy use”. Bangladesh people need more
energy for better and convenient life
Check all means to avoid fictitious achievement and ensure correct EE&C picture is highlighted at
every level.
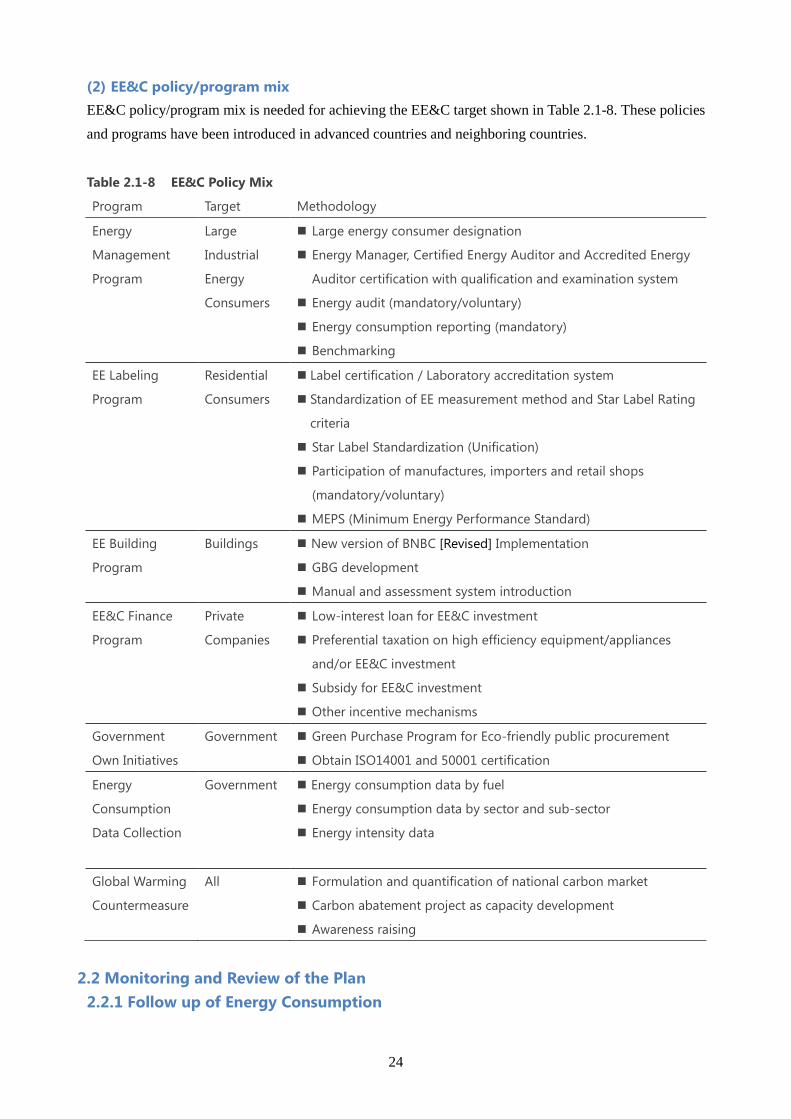
24
(2) EE&C policy/program mix
EE&C policy/program mix is needed for achieving the EE&C target shown in Table 2.1-8. These policies
and programs have been introduced in advanced countries and neighboring countries.
Table 2.1-8 EE&C Policy Mix
Program Target Methodology
Energy
Management
Program
Large
Industrial
Energy
Consumers
Large energy consumer designation
Energy Manager, Certified Energy Auditor and Accredited Energy
Auditor certification with qualification and examination system
Energy audit (mandatory/voluntary)
Energy consumption reporting (mandatory)
Benchmarking
EE Labeling
Program
Residential
Consumers
Label certification / Laboratory accreditation system
Standardization of EE measurement method and Star Label Rating
criteria
Star Label Standardization (Unification)
Participation of manufactures, importers and retail shops
(mandatory/voluntary)
MEPS (Minimum Energy Performance Standard)
EE Building
Program
Buildings New version of BNBC [Revised] Implementation
GBG development
Manual and assessment system introduction
EE&C Finance
Program
Private
Companies
Low-interest loan for EE&C investment
Preferential taxation on high efficiency equipment/appliances
and/or EE&C investment
Subsidy for EE&C investment
Other incentive mechanisms
Government
Own Initiatives
Government Green Purchase Program for Eco-friendly public procurement
Obtain ISO14001 and 50001 certification
Energy
Consumption
Data Collection
Government Energy consumption data by fuel
Energy consumption data by sector and sub-sector
Energy intensity data
Global Warming
Countermeasure
All Formulation and quantification of national carbon market
Carbon abatement project as capacity development
Awareness raising
2.2 Monitoring and Review of the Plan
2.2.1 Follow up of Energy Consumption
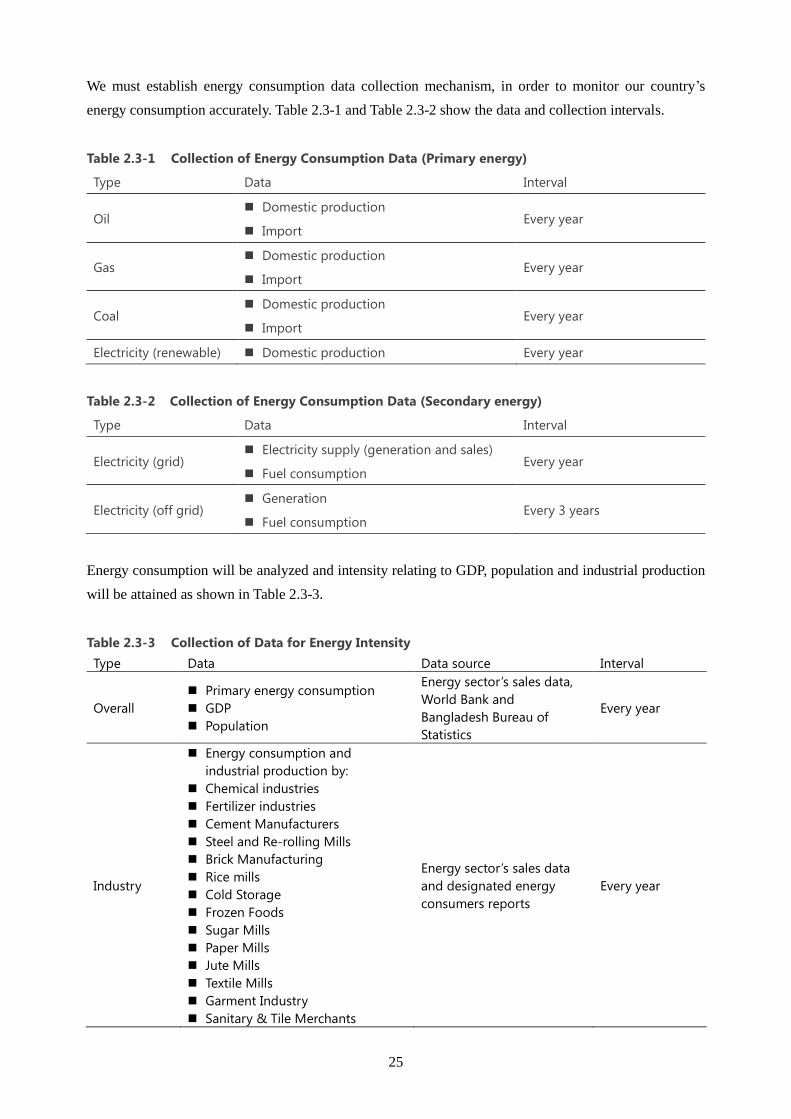
25
We must establish energy consumption data collection mechanism, in order to monitor our country’s
energy consumption accurately. Table 2.3-1 and Table 2.3-2 show the data and collection intervals.
Table 2.3-1 Collection of Energy Consumption Data (Primary energy)
Type Data Interval
Oil Domestic production
Import Every year
Gas Domestic production
Import Every year
Coal Domestic production
Import Every year
Electricity (renewable) Domestic production Every year
Table 2.3-2 Collection of Energy Consumption Data (Secondary energy)
Type Data Interval
Electricity (grid) Electricity supply (generation and sales)
Fuel consumption Every year
Electricity (off grid) Generation
Fuel consumption Every 3 years
Energy consumption will be analyzed and intensity relating to GDP, population and industrial production
will be attained as shown in Table 2.3-3.
Table 2.3-3 Collection of Data for Energy Intensity
Type Data Data source Interval
Overall
Primary energy consumption
GDP
Population
Energy sector’s sales data,
World Bank and
Bangladesh Bureau of
Statistics
Every year
Industry
Energy consumption and
industrial production by:
Chemical industries
Fertilizer industries
Cement Manufacturers
Steel and Re-rolling Mills
Brick Manufacturing
Rice mills
Cold Storage
Frozen Foods
Sugar Mills
Paper Mills
Jute Mills
Textile Mills
Garment Industry
Sanitary & Tile Merchants
Energy sector’s sales data
and designated energy
consumers reports
Every year
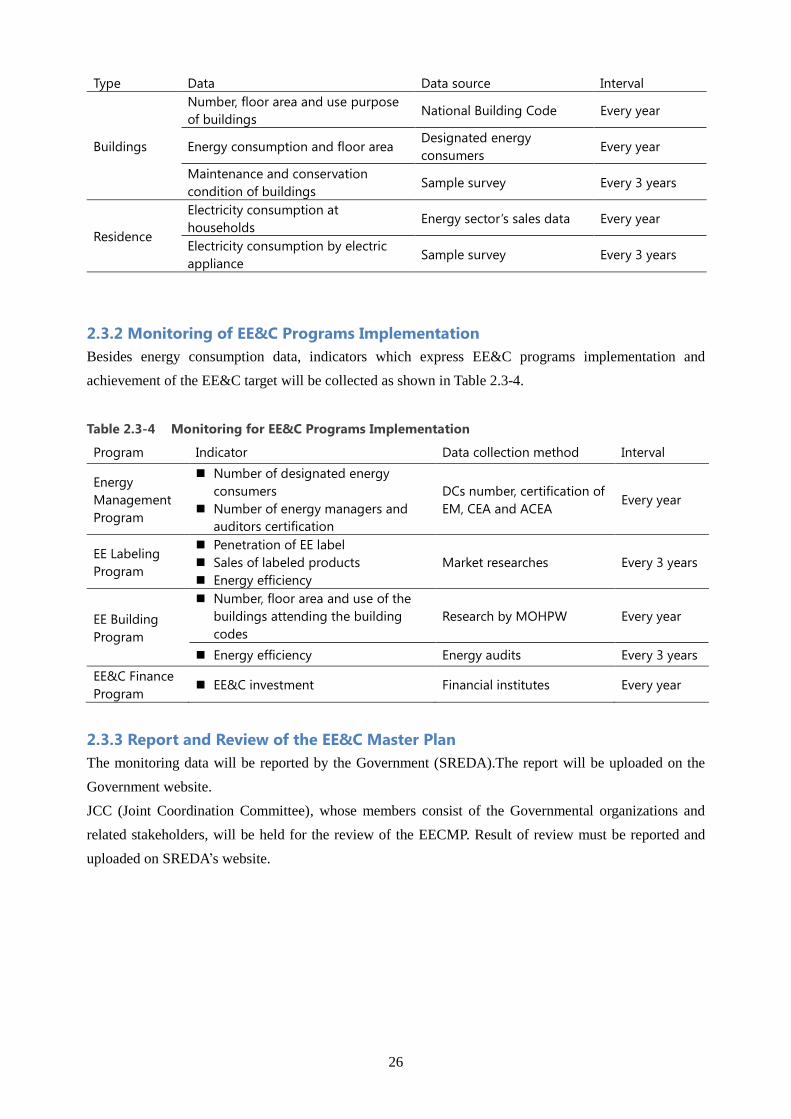
26
Type Data Data source Interval
Buildings
Number, floor area and use purpose
of buildings National Building Code Every year
Energy consumption and floor area Designated energy
consumers Every year
Maintenance and conservation
condition of buildings Sample survey Every 3 years
Residence
Electricity consumption at
households Energy sector’s sales data Every year
Electricity consumption by electric
appliance Sample survey Every 3 years
2.3.2 Monitoring of EE&C Programs Implementation
Besides energy consumption data, indicators which express EE&C programs implementation and
achievement of the EE&C target will be collected as shown in Table 2.3-4.
Table 2.3-4 Monitoring for EE&C Programs Implementation
Program Indicator Data collection method Interval
Energy
Management
Program
Number of designated energy
consumers
Number of energy managers and
auditors certification
DCs number, certification of
EM, CEA and ACEA Every year
EE Labeling
Program
Penetration of EE label
Sales of labeled products
Energy efficiency
Market researches Every 3 years
EE Building
Program
Number, floor area and use of the
buildings attending the building
codes
Research by MOHPW Every year
Energy efficiency Energy audits Every 3 years
EE&C Finance
Program EE&C investment Financial institutes Every year
2.3.3 Report and Review of the EE&C Master Plan
The monitoring data will be reported by the Government (SREDA).The report will be uploaded on the
Government website.
JCC (Joint Coordination Committee), whose members consist of the Governmental organizations and
related stakeholders, will be held for the review of the EECMP. Result of review must be reported and
uploaded on SREDA’s website.
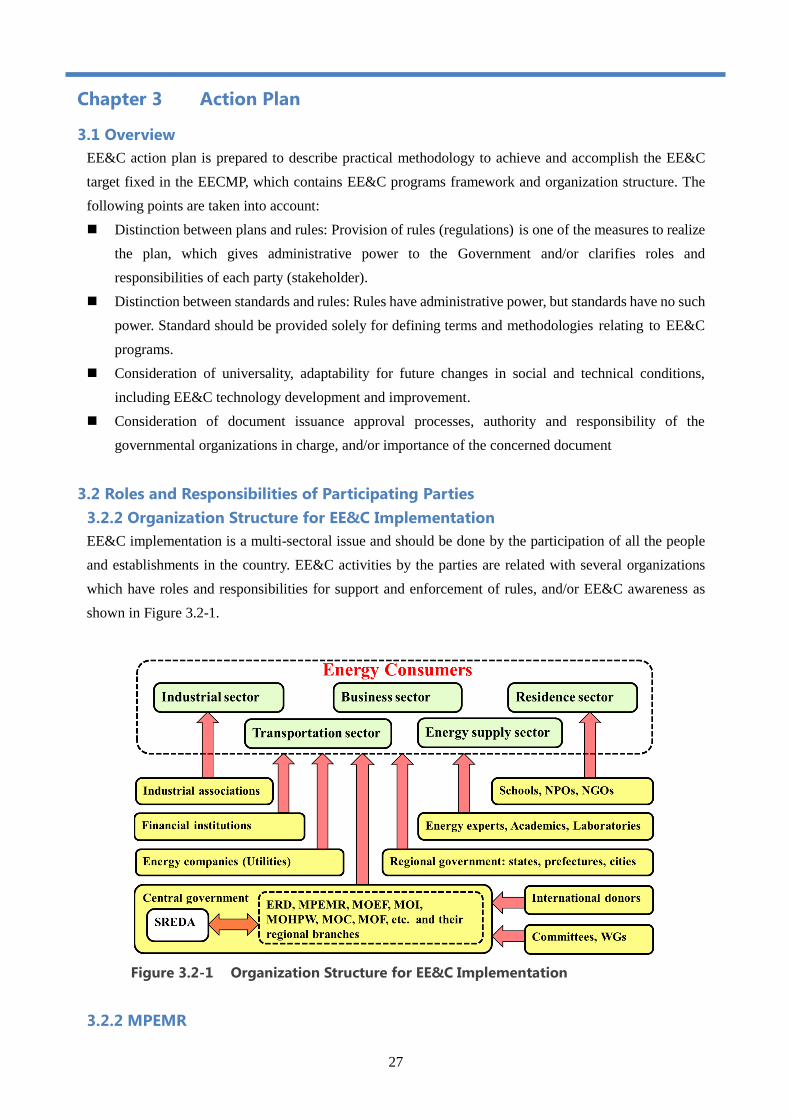
27
Chapter 3 Action Plan
3.1 Overview
EE&C action plan is prepared to describe practical methodology to achieve and accomplish the EE&C
target fixed in the EECMP, which contains EE&C programs framework and organization structure. The
following points are taken into account:
Distinction between plans and rules: Provision of rules (regulations) is one of the measures to realize
the plan, which gives administrative power to the Government and/or clarifies roles and
responsibilities of each party (stakeholder).
Distinction between standards and rules: Rules have administrative power, but standards have no such
power. Standard should be provided solely for defining terms and methodologies relating to EE&C
programs.
Consideration of universality, adaptability for future changes in social and technical conditions,
including EE&C technology development and improvement.
Consideration of document issuance approval processes, authority and responsibility of the
governmental organizations in charge, and/or importance of the concerned document
3.2 Roles and Responsibilities of Participating Parties
3.2.2 Organization Structure for EE&C Implementation
EE&C implementation is a multi-sectoral issue and should be done by the participation of all the people
and establishments in the country. EE&C activities by the parties are related with several organizations
which have roles and responsibilities for support and enforcement of rules, and/or EE&C awareness as
shown in Figure 3.2-1.
Figure 3.2-1 Organization Structure for EE&C Implementation
3.2.2 MPEMR
28
(1) Comprehensive Energy and EE&C policy implementation
Ministry of Power, Energy and Mineral Resources (MPEMR), has a responsibility for the overall
planning and development of the energy and electricity sector. The ministry has two separate divisions
namely: (i) Power Division and (ii) Energy and Mineral Resources Division and, each division is headed
by a Secretary. The Power Division is responsible for the electricity sector including implementation of
energy efficiency and renewable energy programs. The Energy and Mineral Resources Division is
responsible for exploration and management of natural gas and mineral resources.
MPEMR also has a responsibility for EE&C on energy/electricity supply and energy tariff as the
remaining part of the EE&C Master Plan.
(2) Multiple EE&C policies
MPEMR should formulate and implement multiple EE&C policies including voluntary program,
mandatory program, financial program, informational program, environmental assessment and provision
of infrastructure, in coordination with the necessary mandates.
(3) Consideration of EE&C on other policies
MPEMR should consider EE&C, when formulating and implementing their policies even when the
subjects are not concerned with energy or EE&C.
(4) Government own initiative on EE&C implementation
MPEMR should lead government own initiatives of EE&C activities at its working places and in projects,
in order to promote EE&C and lead all entities’ EE&C implementation.
3.2.3 SREDA
(1) Establishment of SREDA
Based on the recognition that efficient energy use in demand side is essential, the Government
established Sustainable and Renewable Energy Development Authority (SREDA) in 2012, which is the
implementating agency for EE&C and renewable energy development under MPEMR.
(2) National representative on EE&C policies
SREDA’s status is a national EE&C policy representative. It has roles and responsibility on the following
activities.
National information center of energy and EE&C
Cross cutting (multi-sectoral) coordination of EE&C policies among all governmental organizations
and also non-governmental organizations, including EE&C requirement into other governmental
organizations’ policies
Formulation and implementation of its own EE&C policies, such as energy management program, EE
labeling program etc.
Nationwide monitoring of energy consumption and EE&C implementation and its reporting to the
people
29
Advocacy and awareness raising
(3) Relevant activities on EE&C implementation
Besides the above roles for the national representative, SREDA will have the following relevant actions:
Conducting studies, research, development and pilot demonstrations for all stakeholders
Provide training for capacity development at institutional levels
Providing advisory services to the private sector corporate bodies, government and non-governmental
organizations
Promote local and international experience sharing in the field of RE, EE&C for capacity
development
Manage EE&C finances to promote innovative pilot projects in the country to enhance RE, EE&C
coverage in the country
Documentation and dissemination of results and information
Strengthening consultancy services to establishments in the field of energy conservation.
Establish close cooperation with the private sector by creating linkages with appropriate personnel in
different establishments at root level and top level. Inter-ministerial focal points
Development of expertise for successive implementation of EE&C throughout the country
3.2.4 Other Governmental Organizations
(1) BERC
The Bangladesh Energy Regulatory Commission (BERC) was formulated under the Act of Parliament in
March 2003, with the mandate to regulate the electricity, gas and petroleum sectors. Apart from the other
activities, BERC is also empowered to ensure energy efficiency in generation, exploration, production,
transmission and distribution levels of the related sectors.
BERC has a responsibility for formulating EE&C plan on electricity supply as the remaining part of the
EECMP.
(2) BSTI
BSTI has provided BDSs (Bangladesh Standards) on energy efficiency (EE) measurement for the EE
labeling program. It has the following roles and responsibility:
Issue of BDSs relating with the EE labeling program
Conduct of energy efficiency tests required for the EE labeling program
(3) MOI, BAB
MOI positions as the authority, administrating the industrial sectors, which should join in the energy
management program and EE labeling program and other EE&C programs. MOI has the following roles
and responsibility:
Cooperation in the enforcement of energy management program with SREDA
Cooperation in the enforcement of EE labeling program with SREDA, especially on encouraging
appliance manufacturers participation on the program
Coordination and monitoring of industrial associations on EE&C activities
30
BAB (Bangladesh Accreditation Board) belongs to MOI, and is an accreditation body for ISO9000,
14001 and 50001, which have a relation with EE&C. BAB is expected to have the following roles and
responsibility:
Accreditation of laboratories for energy efficiency measurement tests on the EE Labeling Program,
based on ISO17025, etc.
Roles on energy manager/auditor licensing system
(4) MOF and Governmental financial institutes
Ministry of Finance (MOF) is responsible for making budgets for EE&C policy promotion activities.
MOF allocates budgets to relevant ministries and governmental organizations which request for financial
support. For investments for both public and private establishments, MOF provides loans through
government financial institutions, Bangladesh Bank (BB) and Infrastructure Development Corporation
Ltd. (IDCOL), delegated by Subsidiary Loan Agreement (SLA) or Administrative Agreement (AA). For
promoting EE&C through financial incentives, Sustainability and Renewable Energy Development
Authority Fund (SREDA Fund) is another option. SREDA Fund is a fund for EE&C activities conducted
by SREDA. SREDA Fund can be sourced through funds from grants or loans obtained from the
Government, local authorities, international donor agencies, benefit obtained from business (consultancy,
fees), etc.
BB and IDCOL are key financial institutions to support financial incentives for EE&C. They handle
funds budgeted from MOF according to SLA and lend money to establishments or individuals who need
money for investing in energy efficiency (EE) facilities and equipment. Both BB and IDCOL have
already had experiences as a financial promoter of EE&C investment. BB is the central bank of
Bangladesh; however, BB has the role of a development finance institution which supports business.
Therefore, BB can take the role of supporting establishments by lending money via PFIs (Participating
Financial Institutions).
(5) MOEF (Ministry of Environment and Forest)
MOEF is the responsible authority for global warming issues, which should be tightly dealt with energy
and EE&C policies. MOEF has the following roles and responsibility:
Countermeasures for global warming should be well coordinated with EE&C policies.
Also, ozone layer destructive material emission relating to refrigerants used in AC, refrigerator and
chilling machine should be coordinated with high energy efficiency products.
Provision of regulations on pollution control and waste disposal, applicable to EE&C policies
implementation (eccentric EE&C implementation without human life and health care should be
avoided).
(6) MOC (Ministry of Commerce)
Activation of energy efficient product trade is expected for the promotion of EE&C in our country. For
that purpose, MOC has the following roles and responsibility:
31
Encouragement of trade of (high) energy efficiency products, including removal of NTB (Non-Tariff
Barrier) collaborating with foreign countries
Awareness and dissemination to the traders, retail shops and consumers
(7) MOHPW (Ministry of Housing and Public Works)
MOHPW has started New Version of Bangladesh National Building Code (BNBC [Revised]) and Green
Building Guideline (GBG) which can promote EE&C at buildings. Therefore, MOHPW is expected to
take following roles and responsibilities:
To implement BNBC [Revised] steadily, including continuous up-dating the regulation
To widely promote and spread GBGTo coordinate EE requirement in the building codes with SREDA
Awareness and dissemination to the building owners, developers, designers and building users
To support Ministry of Transportation for preparing EE&C plans on transportation
(8) Ministry of Transportation
The EE&C Master Plan has been made excluding plans for EE&C on transportation sector. This Ministry
is expected to take the following roles and responsibilities:
To prepare EE&C plans on transportation sector and add them to the EECMP
To make coordination with SREDA especially on the level of EE&C requirement
(9) Ministry of Education
Awareness and dissemination of EE&C is the basic policy of self-reliant EE&C implementation.
Ministry of Education is expected to be in charge of this field and have the following roles and
responsibility:
Introduction of EE&C, as one of themes for environmental education
Initial instruction of EE&C to teachers
EE&C improvement in schools
Promotion of EE&C activities in households through students
Promotion of self-reliant EE&C activities of the children
(10) Ministry of Agriculture
Modernization and mechanization in our country’s agriculture will accelerate growth in energy
consumption. Ministry of Agriculture is expected to take the following roles and responsibility:
Education of irrigation consumers including concerned organizations staffs
Introduction of irrigation based on RE on massive scale
(11) Ministry of Information
Medias is influential on EE&C awareness and dissemination. Ministry of Information is expected to have
roles and responsibility relating on media’s activities in EE&C.
3.2.5 Local Governments
32
Local governments are expected to take the following roles and responsibilities considering their
condition on environment and society respectively:
To make efforts to plan, formulate and implement their own EE&C policies, considering their social
and natural condition
To conduct urban planning, namely “Low carbon city”, in which low energy consumption occurs by
means of EE buildings and public transportation system
To take initiatives and develop projects on EE&C activities on their own office, in order to lead the
people and establishments in the area and motive them to take same EE&C actions are expected to
occur in public hospitals, schools and other institutes under the local governments.
It may be welcome to take more advanced (progressive) policy than the Government
Administration of BNBC [Revised] and GBG
3.2.6 Energy Supply Side
Energy supply companies are also large energy users. Therefore, they are expected to take the following
roles and responsibilities:
To improve energy conversion and transmission efficiency at their plants and delivery system
To give instruction and advisory on EE&C to customers (energy consumers), using the direct
connection with them.
To collect/analyze energy consumption data, including its delivery to SREDA for monitoring
nationwide energy consumption
To prepare EE&C plan for energy supply sectors as the remaining part of the EECMP
To formulate a functional tariff system, in order to foster EE&C and peak shifting incentives
3.2.7 Establishments (Business Operators)
The establishments include both private and public sectors, which are expected to have the following
roles and responsibilities:
(1) Compliance with EE&C rules and regulations
Business entities should keep and follow the EE&C rules and regulations, which will be introduced and
scheduled to be officially issued by the Government, such as energy management program, EE Labeling
Program and EE Building Program.
(2) EE&C as a social responsibility
Business entities should understand that energy is a social common resource, which should be used fairly
and rationally. They should make plans for efficient energy use, monitor their energy use, and frequently
review their EE&C implementation situation. They should instruct the employees about rational energy
use, and jointly improve the activities with the other establishments, associations, unions and
central/local governments, sharing information and technologies on EE&C.
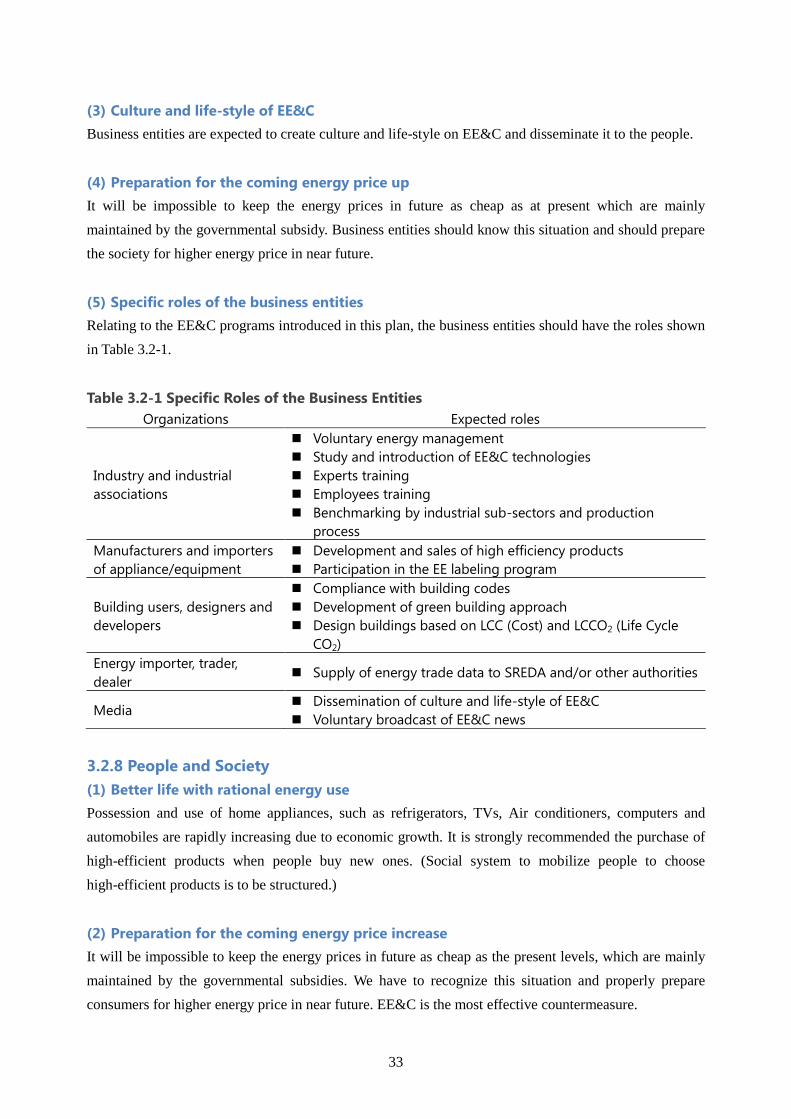
33
(3) Culture and life-style of EE&C
Business entities are expected to create culture and life-style on EE&C and disseminate it to the people.
(4) Preparation for the coming energy price up
It will be impossible to keep the energy prices in future as cheap as at present which are mainly
maintained by the governmental subsidy. Business entities should know this situation and should prepare
the society for higher energy price in near future.
(5) Specific roles of the business entities
Relating to the EE&C programs introduced in this plan, the business entities should have the roles shown
in Table 3.2-1.
Table 3.2-1 Specific Roles of the Business Entities
Organizations Expected roles
Industry and industrial
associations
Voluntary energy management
Study and introduction of EE&C technologies
Experts training
Employees training
Benchmarking by industrial sub-sectors and production
process
Manufacturers and importers
of appliance/equipment
Development and sales of high efficiency products
Participation in the EE labeling program
Building users, designers and
developers
Compliance with building codes
Development of green building approach
Design buildings based on LCC (Cost) and LCCO2 (Life Cycle
CO2)
Energy importer, trader,
dealer Supply of energy trade data to SREDA and/or other authorities
Media Dissemination of culture and life-style of EE&C
Voluntary broadcast of EE&C news
3.2.8 People and Society
(1) Better life with rational energy use
Possession and use of home appliances, such as refrigerators, TVs, Air conditioners, computers and
automobiles are rapidly increasing due to economic growth. It is strongly recommended the purchase of
high-efficient products when people buy new ones. (Social system to mobilize people to choose
high-efficient products is to be structured.)
(2) Preparation for the coming energy price increase
It will be impossible to keep the energy prices in future as cheap as the present levels, which are mainly
maintained by the governmental subsidies. We have to recognize this situation and properly prepare
consumers for higher energy price in near future. EE&C is the most effective countermeasure.
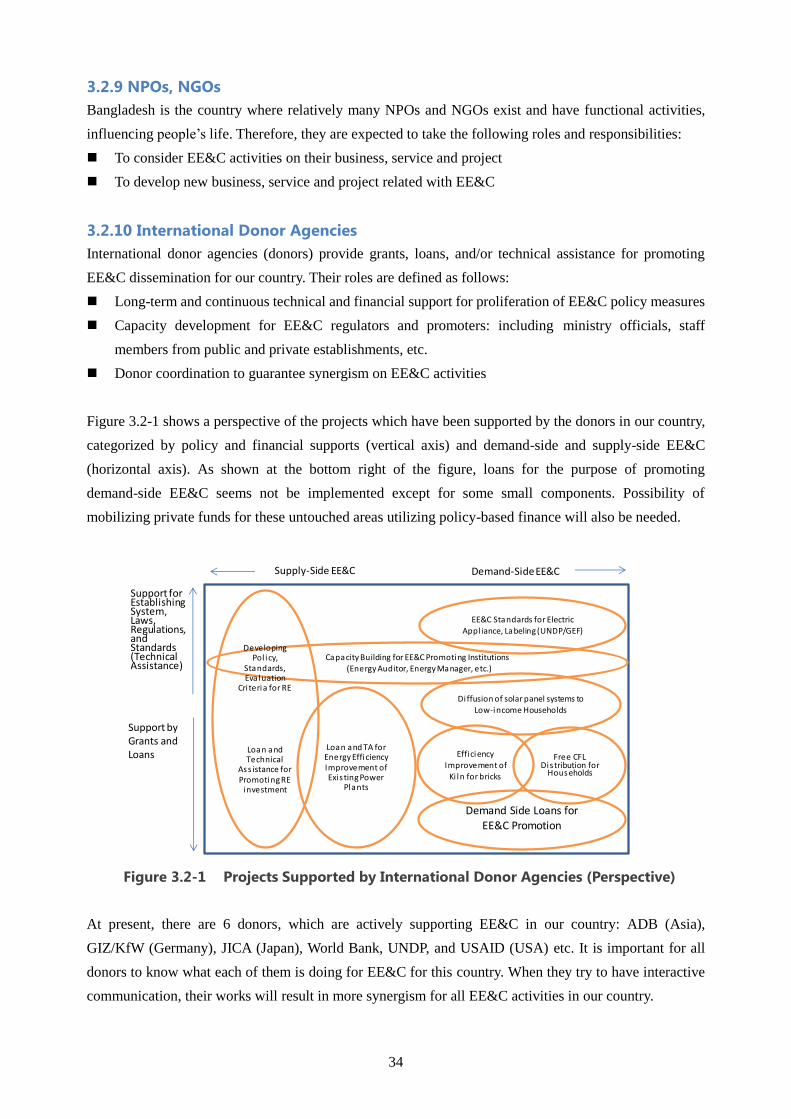
34
3.2.9 NPOs, NGOs
Bangladesh is the country where relatively many NPOs and NGOs exist and have functional activities,
influencing people’s life. Therefore, they are expected to take the following roles and responsibilities:
To consider EE&C activities on their business, service and project
To develop new business, service and project related with EE&C
3.2.10 International Donor Agencies
International donor agencies (donors) provide grants, loans, and/or technical assistance for promoting
EE&C dissemination for our country. Their roles are defined as follows:
Long-term and continuous technical and financial support for proliferation of EE&C policy measures
Capacity development for EE&C regulators and promoters: including ministry officials, staff
members from public and private establishments, etc.
Donor coordination to guarantee synergism on EE&C activities
Figure 3.2-1 shows a perspective of the projects which have been supported by the donors in our country,
categorized by policy and financial supports (vertical axis) and demand-side and supply-side EE&C
(horizontal axis). As shown at the bottom right of the figure, loans for the purpose of promoting
demand-side EE&C seems not be implemented except for some small components. Possibility of
mobilizing private funds for these untouched areas utilizing policy-based finance will also be needed.
Figure 3.2-1 Projects Supported by International Donor Agencies (Perspective)
At present, there are 6 donors, which are actively supporting EE&C in our country: ADB (Asia),
GIZ/KfW (Germany), JICA (Japan), World Bank, UNDP, and USAID (USA) etc. It is important for all
donors to know what each of them is doing for EE&C for this country. When they try to have interactive
communication, their works will result in more synergism for all EE&C activities in our country.
Capacity Building for EE&C Promoting Institutions(Energy Auditor, Energy Manager, etc.)
EE&C Standards for Electric Appl iance, Labeling (UNDP/GEF)
Loan and TA for Energy Efficiency Improvement ofExis ting Power
Plants
Di ffusion of solar panel systems to Low-income Households
DevelopingPol icy,
Standards, Eva luation
Cri teria for RE
Loan and Technical
Ass istance for Promoting RE
investment
Support for EstablishingSystem,Laws,Regulations,and Standards(Technical Assistance)
Support byGrants and Loans
Demand Side Loans for EE&C Promotion
EfficiencyImprovement of
Ki ln for bricks
Supply-Side EE&C Demand-Side EE&C
Free CFL Distribution for
Households
35
3.2.11 Energy Experts
Energy experts who have experiences to work at energy consuming industries and/or have knowledge
about energy and EE&C are expected to take the following roles and responsibilities:
To be a leader of EE&C implementation
To watch and share the latest EE&C technologies and do their own capacity development
Networking and information share among the energy experts
Establishing the community of energy experts
3.2.12 Academics, Laboratories and Researchers
Many professors and researchers are interested in the energy situation in our country and carrying out
studies on energy issues. They are expected to take the following roles and responsibilities:
To stimulate young generation people to become energy experts
To participate in the committees and WGs for EE&C policy making, and to give advice and opinion
from neutral view point position
To carry out researches and development of the themes for rational energy supply and EE&C
To take parts in energy efficiency measurement and test for appliances/equipment as 3rd party
laboratory
3.2.13 Committees and WGs
Several committees and working groups (WGs) should be formulated inviting relevant stakeholders,
governmental organizations and academies to figure out an effective and feasible plan. Committees and
WGs are expected to be continuously formulated focusing on the following roles and responsibilities:
To periodically monitor and review implementation and achievement of the Master Plan
To disseminate the Plan and programs through the industrial associations ,which take parts in the
committees and/or WGs
3.3 EE&C Programs (Overview)
Action plans for the major EE&C policies and programs shown in Table 2.1-1 are drafted in this clause.
Necessity of policies and programs covering the relating situation on energy consumption, program
outline and implementation methodology, stakeholders’ roles and responsibilities, roadmap and expected
outcome are introduced hereinafter.
Action plan on transportation sector, energy supply sector and energy tariff have not yet been included in
the Master Plan. Policies on these remaining fields should be studied and issued in future.
3.4 Energy Management Program
3.4.1 Overview
Energy supply companies (energy and power suppliers) and industrial sectors are the main consumers of
energy and responsible for the increase of primary energy consumption as shown in Figure 3.4-1 and 4-2.
Due to inefficient and old boilers, furnaces and motors used in the industries, a huge amount of energy is
being wasted. The electricity consumption is increasing rapidly especially in the residential sector,
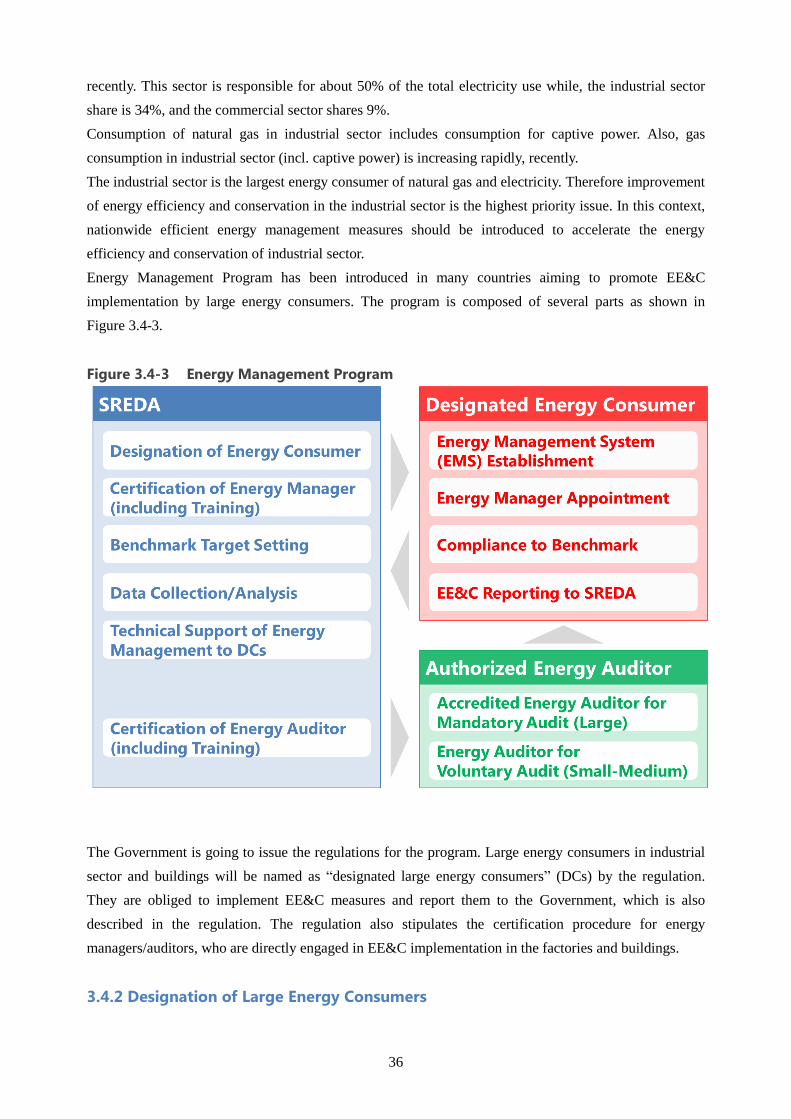
36
recently. This sector is responsible for about 50% of the total electricity use while, the industrial sector
share is 34%, and the commercial sector shares 9%.
Consumption of natural gas in industrial sector includes consumption for captive power. Also, gas
consumption in industrial sector (incl. captive power) is increasing rapidly, recently.
The industrial sector is the largest energy consumer of natural gas and electricity. Therefore improvement
of energy efficiency and conservation in the industrial sector is the highest priority issue. In this context,
nationwide efficient energy management measures should be introduced to accelerate the energy
efficiency and conservation of industrial sector.
Energy Management Program has been introduced in many countries aiming to promote EE&C
implementation by large energy consumers. The program is composed of several parts as shown in
Figure 3.4-3.
Figure 3.4-3 Energy Management Program
The Government is going to issue the regulations for the program. Large energy consumers in industrial
sector and buildings will be named as “designated large energy consumers” (DCs) by the regulation.
They are obliged to implement EE&C measures and report them to the Government, which is also
described in the regulation. The regulation also stipulates the certification procedure for energy
managers/auditors, who are directly engaged in EE&C implementation in the factories and buildings.
3.4.2 Designation of Large Energy Consumers
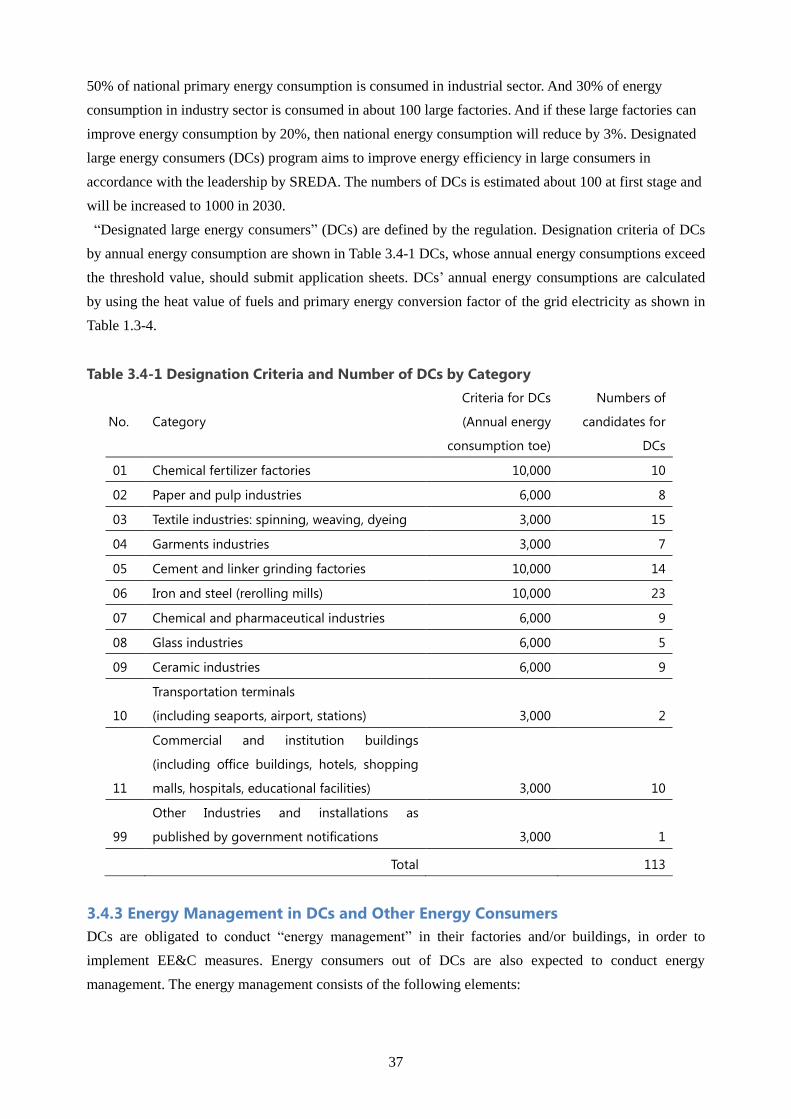
37
50% of national primary energy consumption is consumed in industrial sector. And 30% of energy
consumption in industry sector is consumed in about 100 large factories. And if these large factories can
improve energy consumption by 20%, then national energy consumption will reduce by 3%. Designated
large energy consumers (DCs) program aims to improve energy efficiency in large consumers in
accordance with the leadership by SREDA. The numbers of DCs is estimated about 100 at first stage and
will be increased to 1000 in 2030.
“Designated large energy consumers” (DCs) are defined by the regulation. Designation criteria of DCs
by annual energy consumption are shown in Table 3.4-1 DCs, whose annual energy consumptions exceed
the threshold value, should submit application sheets. DCs’ annual energy consumptions are calculated
by using the heat value of fuels and primary energy conversion factor of the grid electricity as shown in
Table 1.3-4.
Table 3.4-1 Designation Criteria and Number of DCs by Category
No. Category
Criteria for DCs
(Annual energy
consumption toe)
Numbers of
candidates for
DCs
01 Chemical fertilizer factories 10,000 10
02 Paper and pulp industries 6,000 8
03 Textile industries: spinning, weaving, dyeing 3,000 15
04 Garments industries 3,000 7
05 Cement and linker grinding factories 10,000 14
06 Iron and steel (rerolling mills) 10,000 23
07 Chemical and pharmaceutical industries 6,000 9
08 Glass industries 6,000 5
09 Ceramic industries 6,000 9
10
Transportation terminals
(including seaports, airport, stations) 3,000 2
11
Commercial and institution buildings
(including office buildings, hotels, shopping
malls, hospitals, educational facilities) 3,000 10
99
Other Industries and installations as
published by government notifications 3,000 1
Total 113
3.4.3 Energy Management in DCs and Other Energy Consumers
DCs are obligated to conduct “energy management” in their factories and/or buildings, in order to
implement EE&C measures. Energy consumers out of DCs are also expected to conduct energy
management. The energy management consists of the following elements:
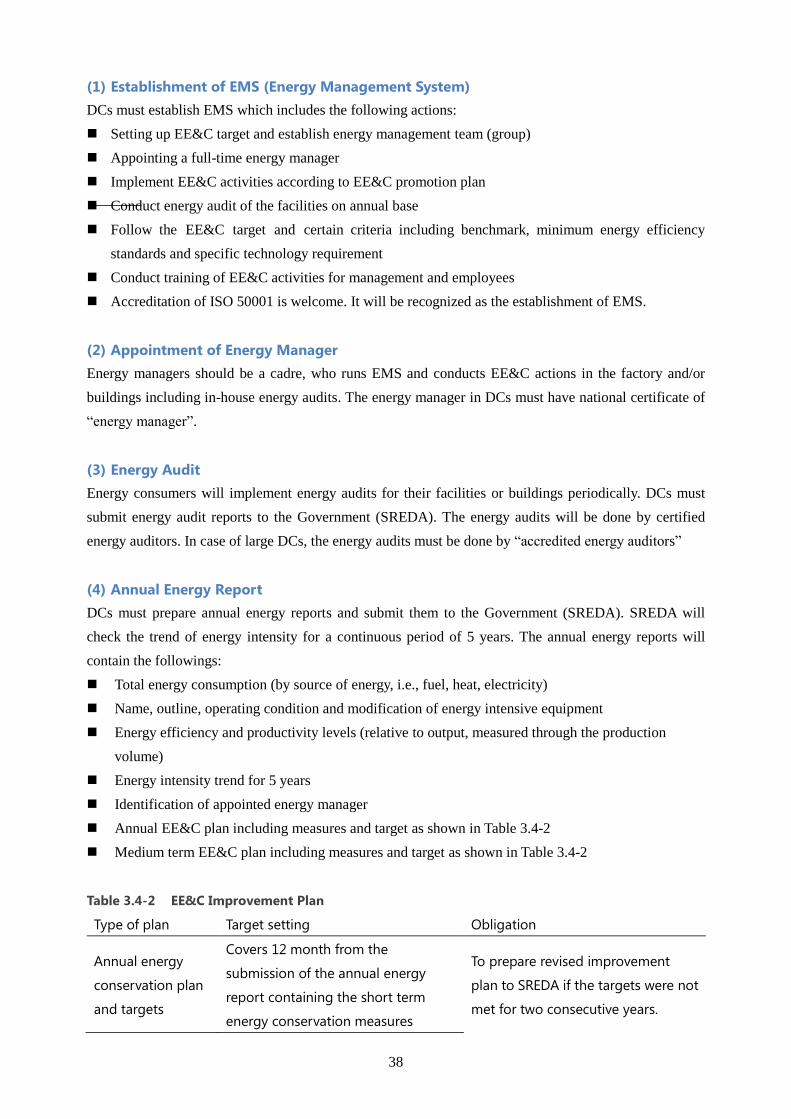
38
(1) Establishment of EMS (Energy Management System)
DCs must establish EMS which includes the following actions:
Setting up EE&C target and establish energy management team (group)
Appointing a full-time energy manager
Implement EE&C activities according to EE&C promotion plan
Conduct energy audit of the facilities on annual base
Follow the EE&C target and certain criteria including benchmark, minimum energy efficiency
standards and specific technology requirement
Conduct training of EE&C activities for management and employees
Accreditation of ISO 50001 is welcome. It will be recognized as the establishment of EMS.
(2) Appointment of Energy Manager
Energy managers should be a cadre, who runs EMS and conducts EE&C actions in the factory and/or
buildings including in-house energy audits. The energy manager in DCs must have national certificate of
“energy manager”.
(3) Energy Audit
Energy consumers will implement energy audits for their facilities or buildings periodically. DCs must
submit energy audit reports to the Government (SREDA). The energy audits will be done by certified
energy auditors. In case of large DCs, the energy audits must be done by “accredited energy auditors”
(4) Annual Energy Report
DCs must prepare annual energy reports and submit them to the Government (SREDA). SREDA will
check the trend of energy intensity for a continuous period of 5 years. The annual energy reports will
contain the followings:
Total energy consumption (by source of energy, i.e., fuel, heat, electricity)
Name, outline, operating condition and modification of energy intensive equipment
Energy efficiency and productivity levels (relative to output, measured through the production
volume)
Energy intensity trend for 5 years
Identification of appointed energy manager
Annual EE&C plan including measures and target as shown in Table 3.4-2
Medium term EE&C plan including measures and target as shown in Table 3.4-2
Table 3.4-2 EE&C Improvement Plan
Type of plan Target setting Obligation
Annual energy
conservation plan
and targets
Covers 12 month from the
submission of the annual energy
report containing the short term
energy conservation measures
To prepare revised improvement
plan to SREDA if the targets were not
met for two consecutive years.
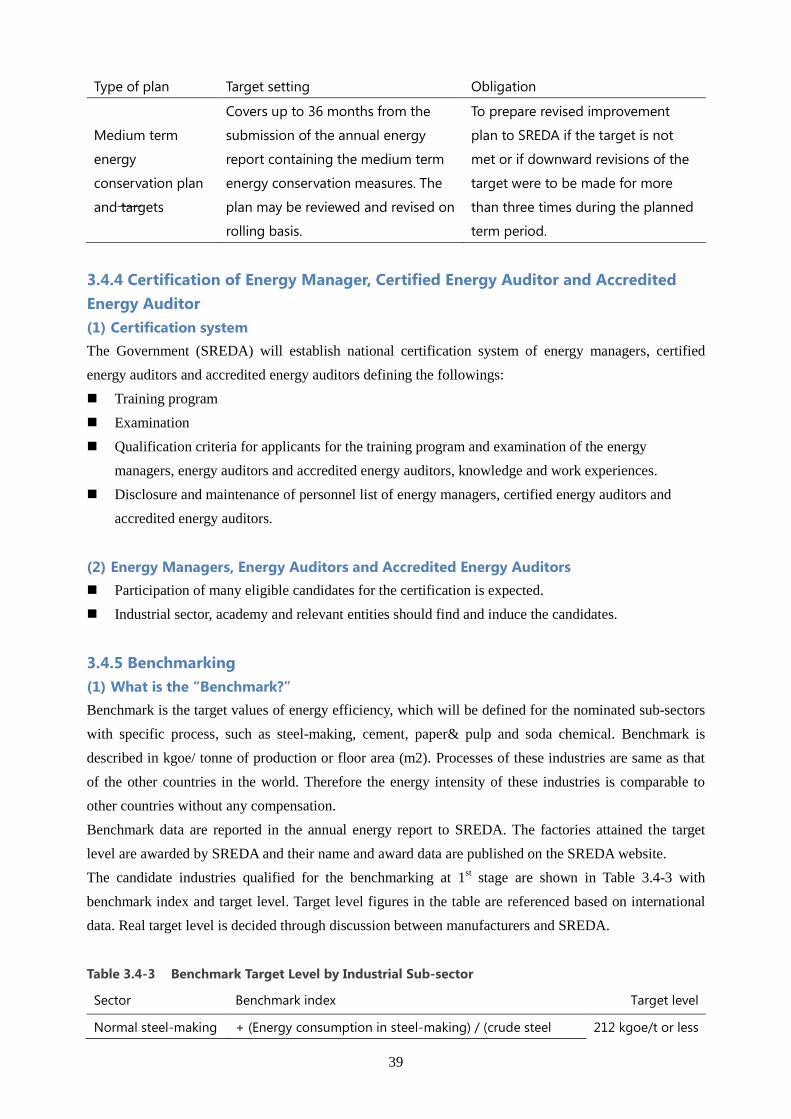
39
Type of plan Target setting Obligation
Medium term
energy
conservation plan
and targets
Covers up to 36 months from the
submission of the annual energy
report containing the medium term
energy conservation measures. The
plan may be reviewed and revised on
rolling basis.
To prepare revised improvement
plan to SREDA if the target is not
met or if downward revisions of the
target were to be made for more
than three times during the planned
term period.
3.4.4 Certification of Energy Manager, Certified Energy Auditor and Accredited
Energy Auditor
(1) Certification system
The Government (SREDA) will establish national certification system of energy managers, certified
energy auditors and accredited energy auditors defining the followings:
Training program
Examination
Qualification criteria for applicants for the training program and examination of the energy
managers, energy auditors and accredited energy auditors, knowledge and work experiences.
Disclosure and maintenance of personnel list of energy managers, certified energy auditors and
accredited energy auditors.
(2) Energy Managers, Energy Auditors and Accredited Energy Auditors
Participation of many eligible candidates for the certification is expected.
Industrial sector, academy and relevant entities should find and induce the candidates.
3.4.5 Benchmarking
(1) What is the “Benchmark?”
Benchmark is the target values of energy efficiency, which will be defined for the nominated sub-sectors
with specific process, such as steel-making, cement, paper& pulp and soda chemical. Benchmark is
described in kgoe/ tonne of production or floor area (m2). Processes of these industries are same as that
of the other countries in the world. Therefore the energy intensity of these industries is comparable to
other countries without any compensation.
Benchmark data are reported in the annual energy report to SREDA. The factories attained the target
level are awarded by SREDA and their name and award data are published on the SREDA website.
The candidate industries qualified for the benchmarking at 1st stage are shown in Table 3.4-3 with
benchmark index and target level. Target level figures in the table are referenced based on international
data. Real target level is decided through discussion between manufacturers and SREDA.
Table 3.4-3 Benchmark Target Level by Industrial Sub-sector
Sector Benchmark index Target level
Normal steel-making + (Energy consumption in steel-making) / (crude steel 212 kgoe/t or less
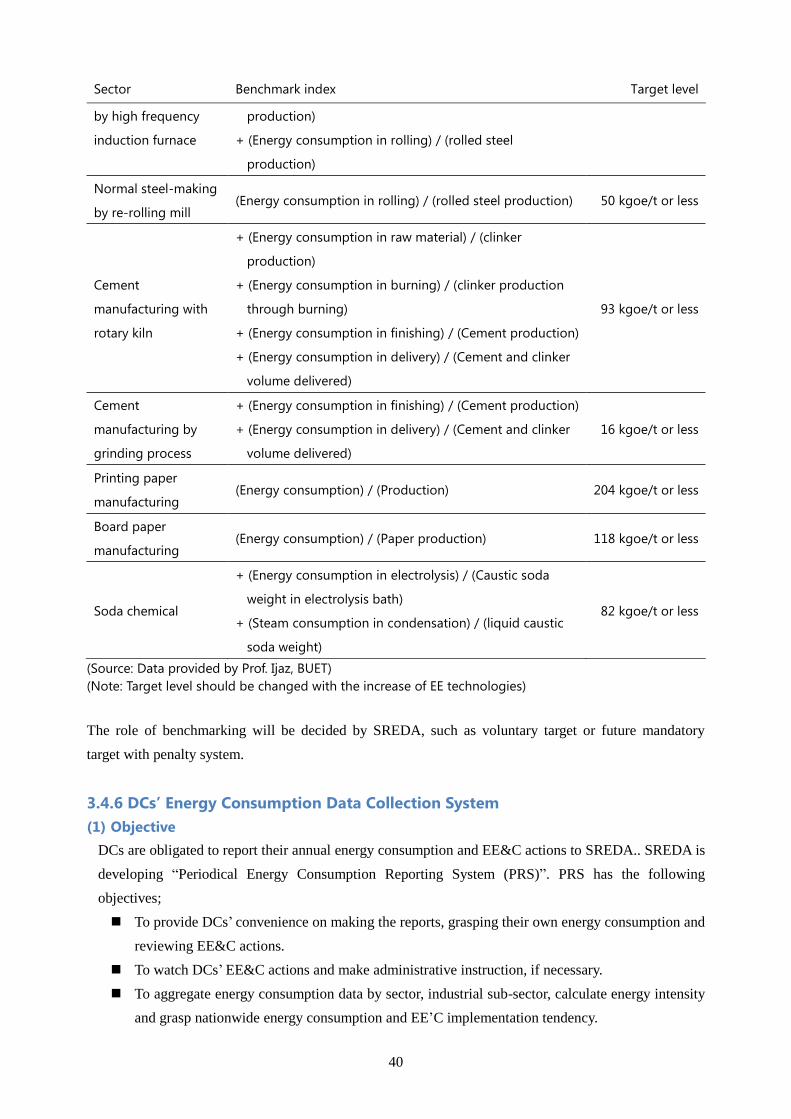
40
Sector Benchmark index Target level
by high frequency
induction furnace
production)
+ (Energy consumption in rolling) / (rolled steel
production)
Normal steel-making
by re-rolling mill (Energy consumption in rolling) / (rolled steel production) 50 kgoe/t or less
Cement
manufacturing with
rotary kiln
+ (Energy consumption in raw material) / (clinker
production)
+ (Energy consumption in burning) / (clinker production
through burning)
+ (Energy consumption in finishing) / (Cement production)
+ (Energy consumption in delivery) / (Cement and clinker
volume delivered)
93 kgoe/t or less
Cement
manufacturing by
grinding process
+ (Energy consumption in finishing) / (Cement production)
+ (Energy consumption in delivery) / (Cement and clinker
volume delivered)
16 kgoe/t or less
Printing paper
manufacturing (Energy consumption) / (Production) 204 kgoe/t or less
Board paper
manufacturing (Energy consumption) / (Paper production) 118 kgoe/t or less
Soda chemical
+ (Energy consumption in electrolysis) / (Caustic soda
weight in electrolysis bath)
+ (Steam consumption in condensation) / (liquid caustic
soda weight)
82 kgoe/t or less
(Source: Data provided by Prof. Ijaz, BUET)
(Note: Target level should be changed with the increase of EE technologies)
The role of benchmarking will be decided by SREDA, such as voluntary target or future mandatory
target with penalty system.
3.4.6 DCs’ Energy Consumption Data Collection System
(1) Objective
DCs are obligated to report their annual energy consumption and EE&C actions to SREDA.. SREDA is
developing “Periodical Energy Consumption Reporting System (PRS)”. PRS has the following
objectives;
To provide DCs’ convenience on making the reports, grasping their own energy consumption and
reviewing EE&C actions.
To watch DCs’ EE&C actions and make administrative instruction, if necessary.
To aggregate energy consumption data by sector, industrial sub-sector, calculate energy intensity
and grasp nationwide energy consumption and EE’C implementation tendency.
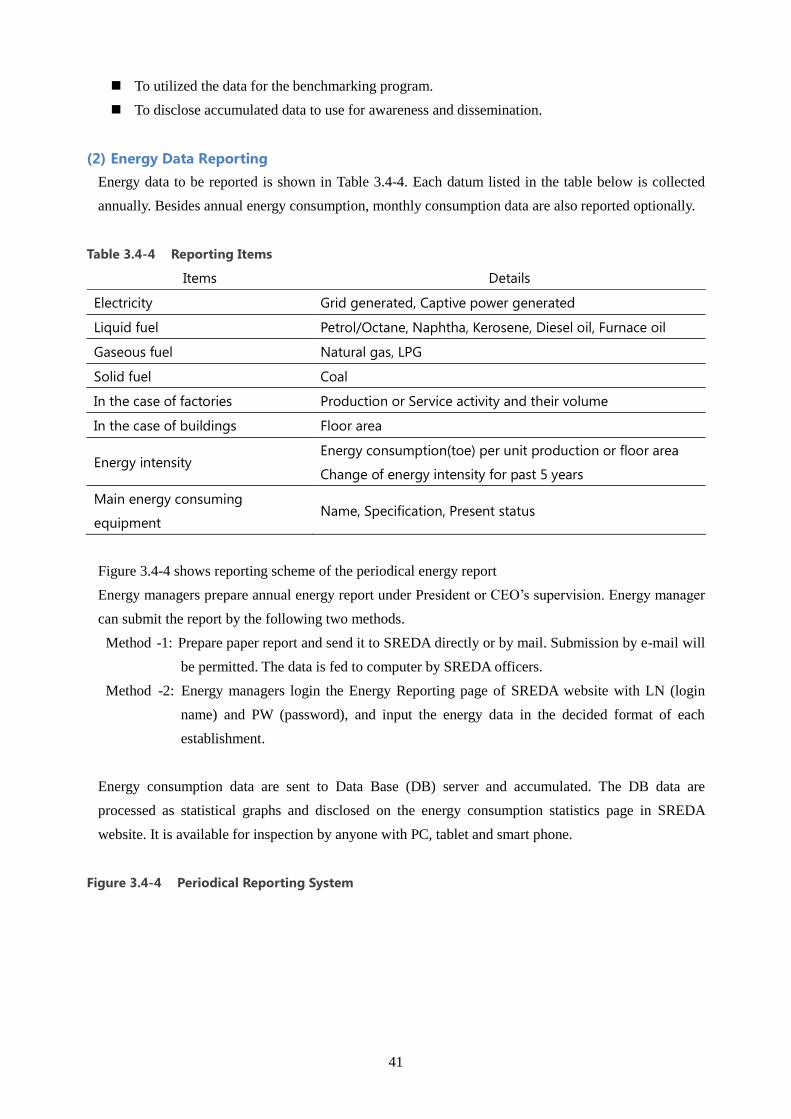
41
To utilized the data for the benchmarking program.
To disclose accumulated data to use for awareness and dissemination.
(2) Energy Data Reporting
Energy data to be reported is shown in Table 3.4-4. Each datum listed in the table below is collected
annually. Besides annual energy consumption, monthly consumption data are also reported optionally.
Table 3.4-4 Reporting Items
Items Details
Electricity Grid generated, Captive power generated
Liquid fuel Petrol/Octane, Naphtha, Kerosene, Diesel oil, Furnace oil
Gaseous fuel Natural gas, LPG
Solid fuel Coal
In the case of factories Production or Service activity and their volume
In the case of buildings Floor area
Energy intensity Energy consumption(toe) per unit production or floor area
Change of energy intensity for past 5 years
Main energy consuming
equipment Name, Specification, Present status
Figure 3.4-4 shows reporting scheme of the periodical energy report
Energy managers prepare annual energy report under President or CEO’s supervision. Energy manager
can submit the report by the following two methods.
Method -1: Prepare paper report and send it to SREDA directly or by mail. Submission by e-mail will
be permitted. The data is fed to computer by SREDA officers.
Method -2: Energy managers login the Energy Reporting page of SREDA website with LN (login
name) and PW (password), and input the energy data in the decided format of each
establishment.
Energy consumption data are sent to Data Base (DB) server and accumulated. The DB data are
processed as statistical graphs and disclosed on the energy consumption statistics page in SREDA
website. It is available for inspection by anyone with PC, tablet and smart phone.
Figure 3.4-4 Periodical Reporting System
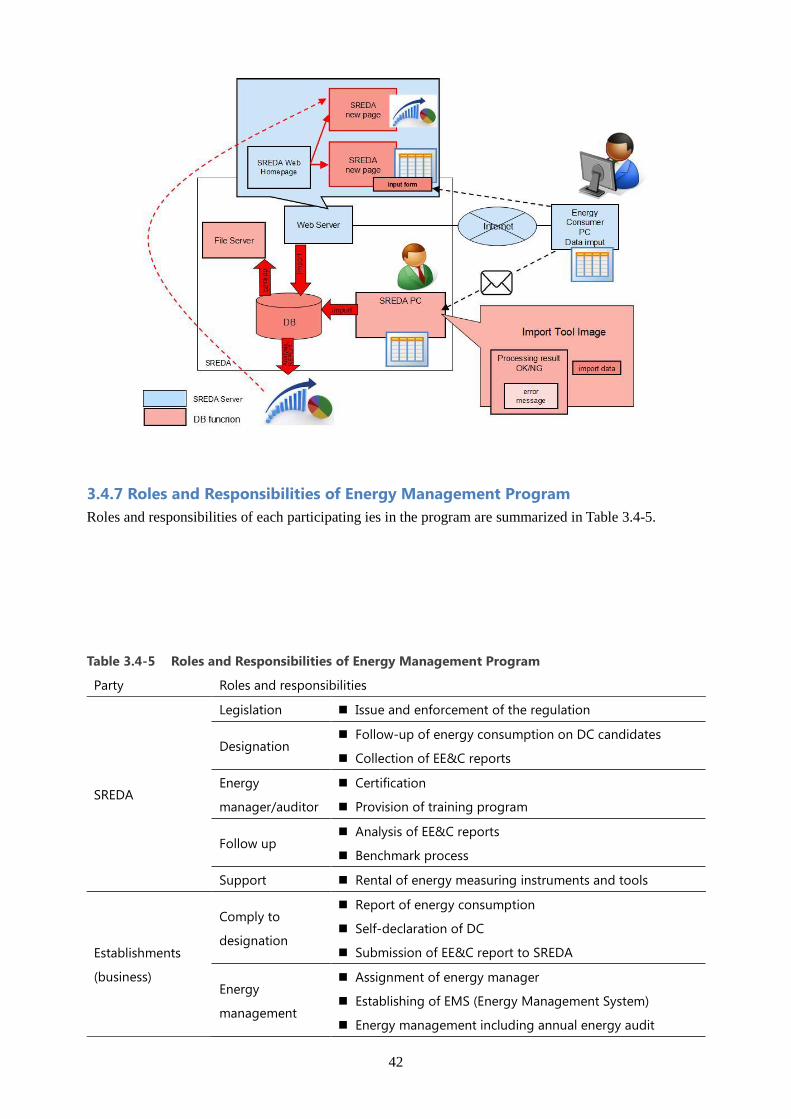
42
3.4.7 Roles and Responsibilities of Energy Management Program
Roles and responsibilities of each participating ies in the program are summarized in Table 3.4-5.
Table 3.4-5 Roles and Responsibilities of Energy Management Program
Party Roles and responsibilities
SREDA
Legislation Issue and enforcement of the regulation
Designation Follow-up of energy consumption on DC candidates
Collection of EE&C reports
Energy
manager/auditor
Certification
Provision of training program
Follow up Analysis of EE&C reports
Benchmark process
Support Rental of energy measuring instruments and tools
Establishments
(business)
Comply to
designation
Report of energy consumption
Self-declaration of DC
Submission of EE&C report to SREDA
Energy
management
Assignment of energy manager
Establishing of EMS (Energy Management System)
Energy management including annual energy audit
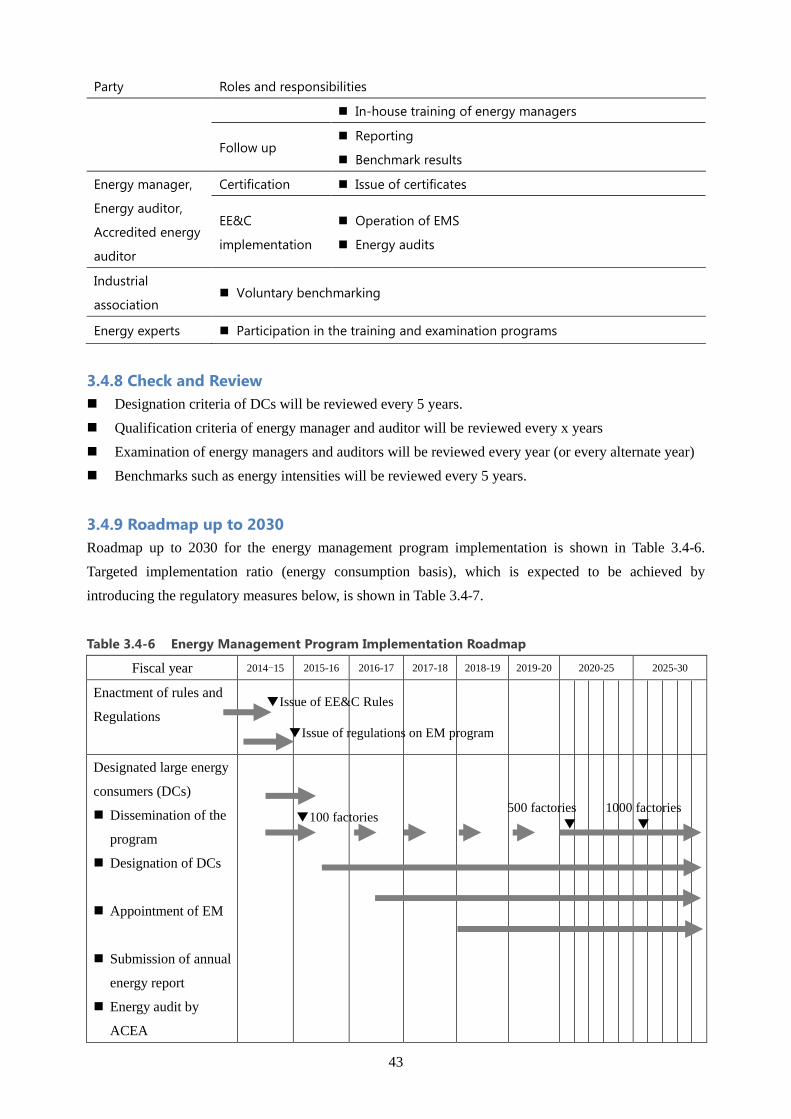
43
Party Roles and responsibilities
In-house training of energy managers
Follow up Reporting
Benchmark results
Energy manager,
Energy auditor,
Accredited energy
auditor
Certification Issue of certificates
EE&C
implementation
Operation of EMS
Energy audits
Industrial
association Voluntary benchmarking
Energy experts Participation in the training and examination programs
3.4.8 Check and Review
Designation criteria of DCs will be reviewed every 5 years.
Qualification criteria of energy manager and auditor will be reviewed every x years
Examination of energy managers and auditors will be reviewed every year (or every alternate year)
Benchmarks such as energy intensities will be reviewed every 5 years.
3.4.9 Roadmap up to 2030
Roadmap up to 2030 for the energy management program implementation is shown in Table 3.4-6.
Targeted implementation ratio (energy consumption basis), which is expected to be achieved by
introducing the regulatory measures below, is shown in Table 3.4-7.
Table 3.4-6 Energy Management Program Implementation Roadmap
Fiscal year 2014-15 2015-16 2016-17 2017-18 2018-19 2019-20 2020-25 2025-30
Enactment of rules and
Regulations
Designated large energy
consumers (DCs)
Dissemination of the
program
Designation of DCs
Appointment of EM
Submission of annual
energy report
Energy audit by
ACEA
▼Issue of EE&C Rules
▼Issue of regulations on EM program
▼100 factories 500 factories
▼
1000 factories
▼
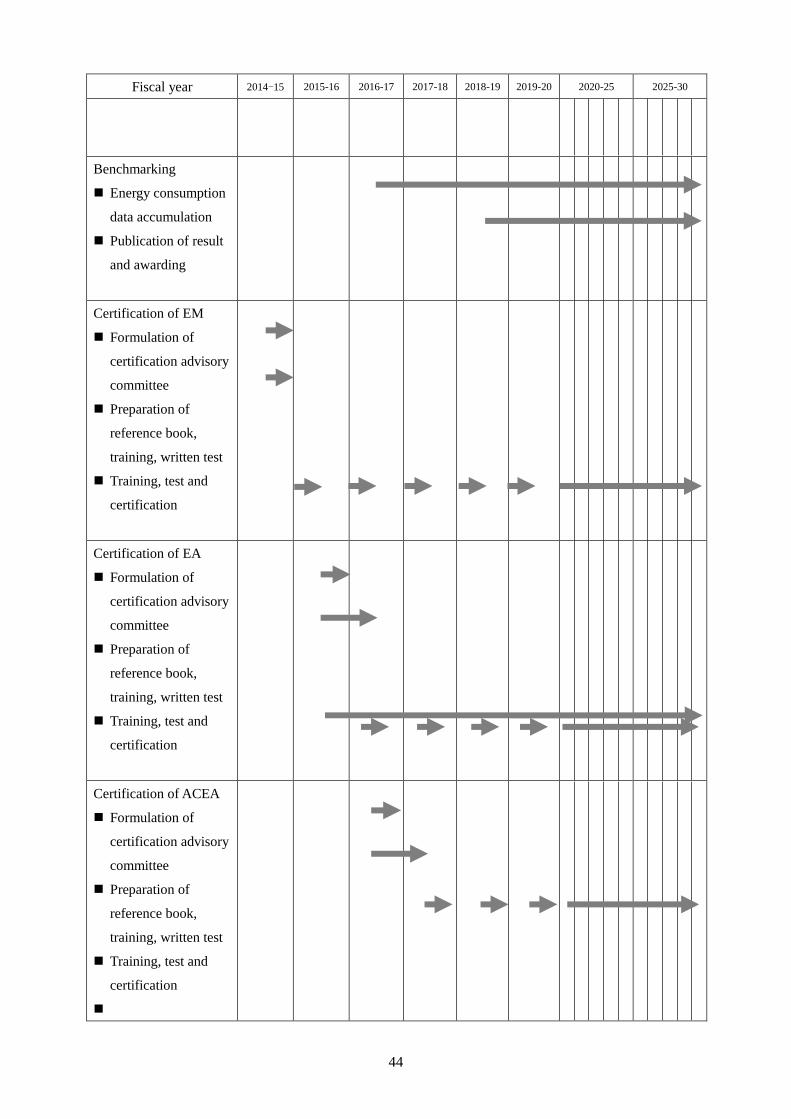
44
Fiscal year 2014-15 2015-16 2016-17 2017-18 2018-19 2019-20 2020-25 2025-30
Benchmarking
Energy consumption
data accumulation
Publication of result
and awarding
Certification of EM
Formulation of
certification advisory
committee
Preparation of
reference book,
training, written test
Training, test and
certification
Certification of EA
Formulation of
certification advisory
committee
Preparation of
reference book,
training, written test
Training, test and
certification
Certification of ACEA
Formulation of
certification advisory
committee
Preparation of
reference book,
training, written test
Training, test and
certification
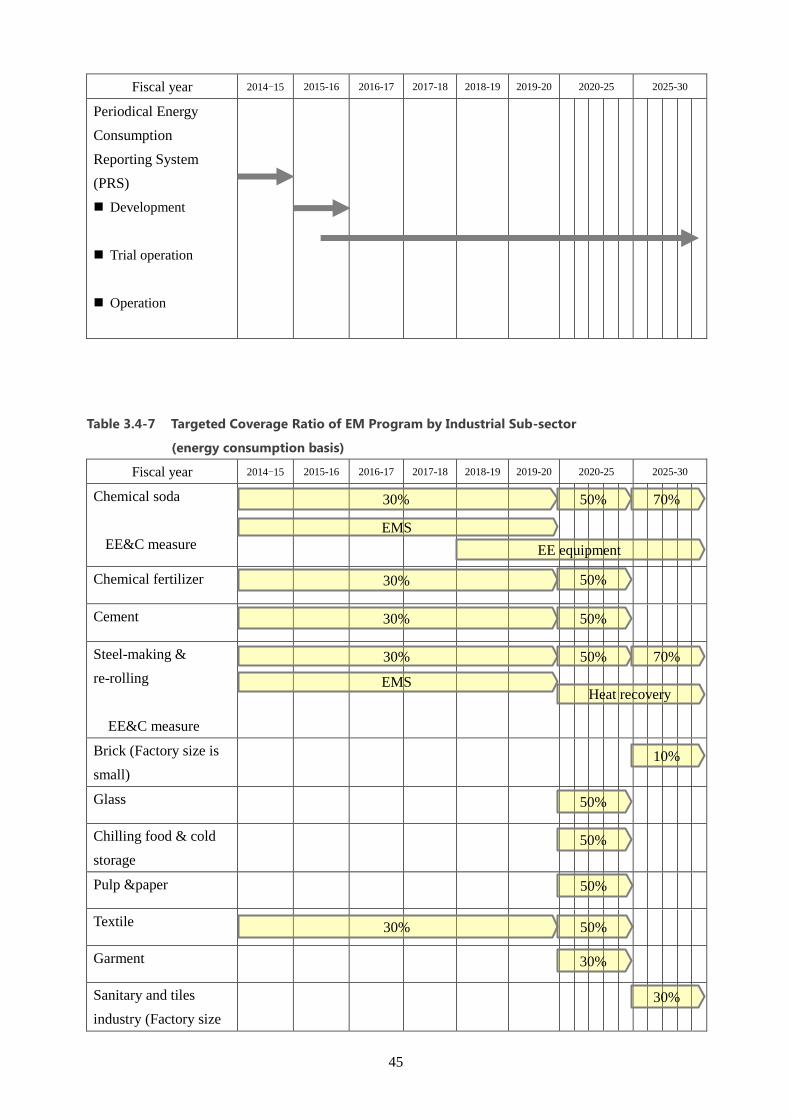
45
Fiscal year 2014-15 2015-16 2016-17 2017-18 2018-19 2019-20 2020-25 2025-30
Periodical Energy
Consumption
Reporting System
(PRS)
Development
Trial operation
Operation
Table 3.4-7 Targeted Coverage Ratio of EM Program by Industrial Sub-sector
(energy consumption basis)
Fiscal year 2014-15 2015-16 2016-17 2017-18 2018-19 2019-20 2020-25 2025-30
Chemical soda
EE&C measure
Chemical fertilizer
Cement
Steel-making &
re-rolling
EE&C measure
Brick (Factory size is
small)
Glass
Chilling food & cold
storage
Pulp &paper
Textile
Garment
Sanitary and tiles
industry (Factory size
30% 50% 70%
30% 50% 70%
EMS
EE equipment
EMS Heat recovery
10%
30%
30%
50%
50%
50%
50%
50%
50%
30%
30%
30%
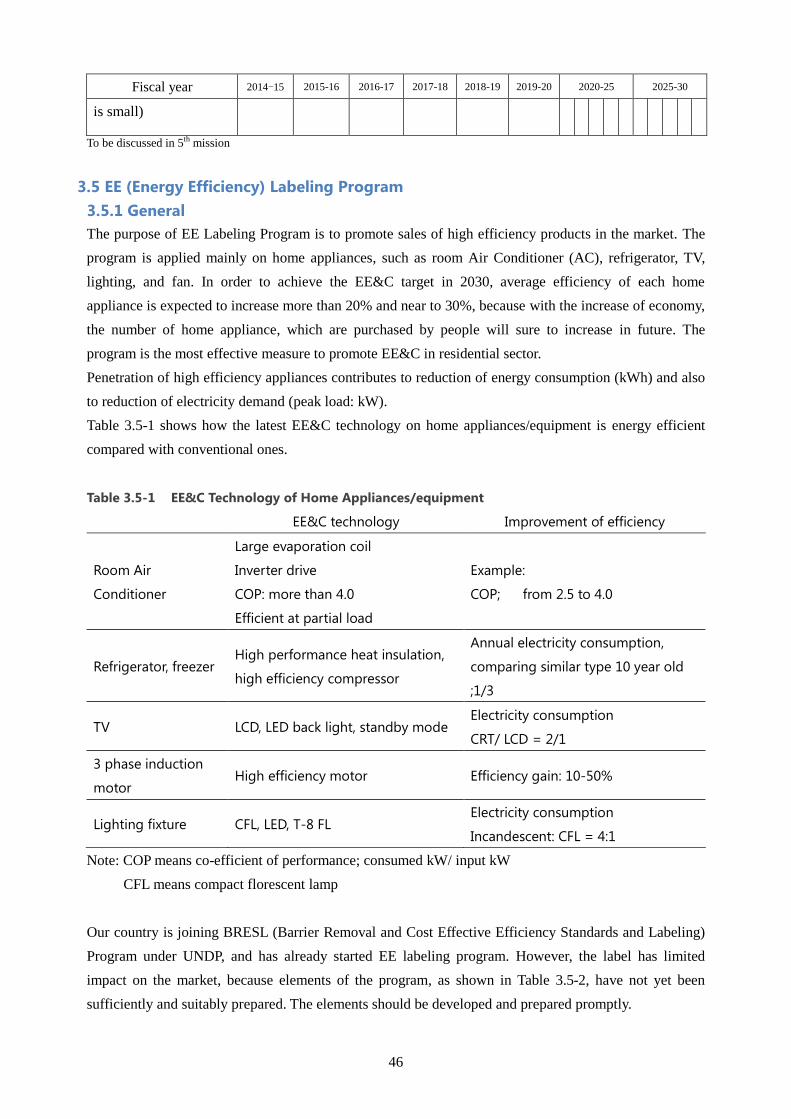
46
Fiscal year 2014-15 2015-16 2016-17 2017-18 2018-19 2019-20 2020-25 2025-30
is small)
To be discussed in 5th mission
3.5 EE (Energy Efficiency) Labeling Program
3.5.1 General
The purpose of EE Labeling Program is to promote sales of high efficiency products in the market. The
program is applied mainly on home appliances, such as room Air Conditioner (AC), refrigerator, TV,
lighting, and fan. In order to achieve the EE&C target in 2030, average efficiency of each home
appliance is expected to increase more than 20% and near to 30%, because with the increase of economy,
the number of home appliance, which are purchased by people will sure to increase in future. The
program is the most effective measure to promote EE&C in residential sector.
Penetration of high efficiency appliances contributes to reduction of energy consumption (kWh) and also
to reduction of electricity demand (peak load: kW).
Table 3.5-1 shows how the latest EE&C technology on home appliances/equipment is energy efficient
compared with conventional ones.
Table 3.5-1 EE&C Technology of Home Appliances/equipment
EE&C technology Improvement of efficiency
Room Air
Conditioner
Large evaporation coil
Inverter drive
COP: more than 4.0
Efficient at partial load
Example:
COP; from 2.5 to 4.0
Refrigerator, freezer High performance heat insulation,
high efficiency compressor
Annual electricity consumption,
comparing similar type 10 year old
;1/3
TV LCD, LED back light, standby mode Electricity consumption
CRT/ LCD = 2/1
3 phase induction
motor High efficiency motor Efficiency gain: 10-50%
Lighting fixture CFL, LED, T-8 FL Electricity consumption
Incandescent: CFL = 4:1
Note: COP means co-efficient of performance; consumed kW/ input kW
CFL means compact florescent lamp
Our country is joining BRESL (Barrier Removal and Cost Effective Efficiency Standards and Labeling)
Program under UNDP, and has already started EE labeling program. However, the label has limited
impact on the market, because elements of the program, as shown in Table 3.5-2, have not yet been
sufficiently and suitably prepared. The elements should be developed and prepared promptly.
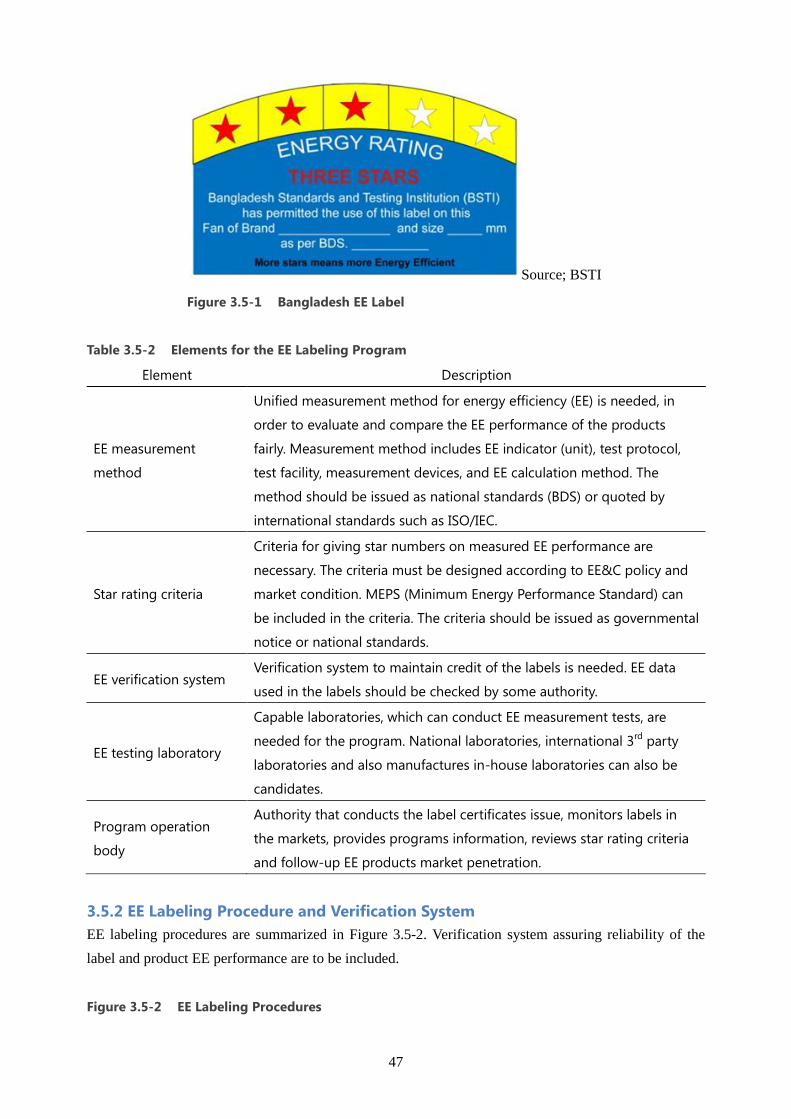
47
Source; BSTI
Figure 3.5-1 Bangladesh EE Label
Table 3.5-2 Elements for the EE Labeling Program
Element Description
EE measurement
method
Unified measurement method for energy efficiency (EE) is needed, in
order to evaluate and compare the EE performance of the products
fairly. Measurement method includes EE indicator (unit), test protocol,
test facility, measurement devices, and EE calculation method. The
method should be issued as national standards (BDS) or quoted by
international standards such as ISO/IEC.
Star rating criteria
Criteria for giving star numbers on measured EE performance are
necessary. The criteria must be designed according to EE&C policy and
market condition. MEPS (Minimum Energy Performance Standard) can
be included in the criteria. The criteria should be issued as governmental
notice or national standards.
EE verification system Verification system to maintain credit of the labels is needed. EE data
used in the labels should be checked by some authority.
EE testing laboratory
Capable laboratories, which can conduct EE measurement tests, are
needed for the program. National laboratories, international 3rd
party
laboratories and also manufactures in-house laboratories can also be
candidates.
Program operation
body
Authority that conducts the label certificates issue, monitors labels in
the markets, provides programs information, reviews star rating criteria
and follow-up EE products market penetration.
3.5.2 EE Labeling Procedure and Verification System
EE labeling procedures are summarized in Figure 3.5-2. Verification system assuring reliability of the
label and product EE performance are to be included.
Figure 3.5-2 EE Labeling Procedures
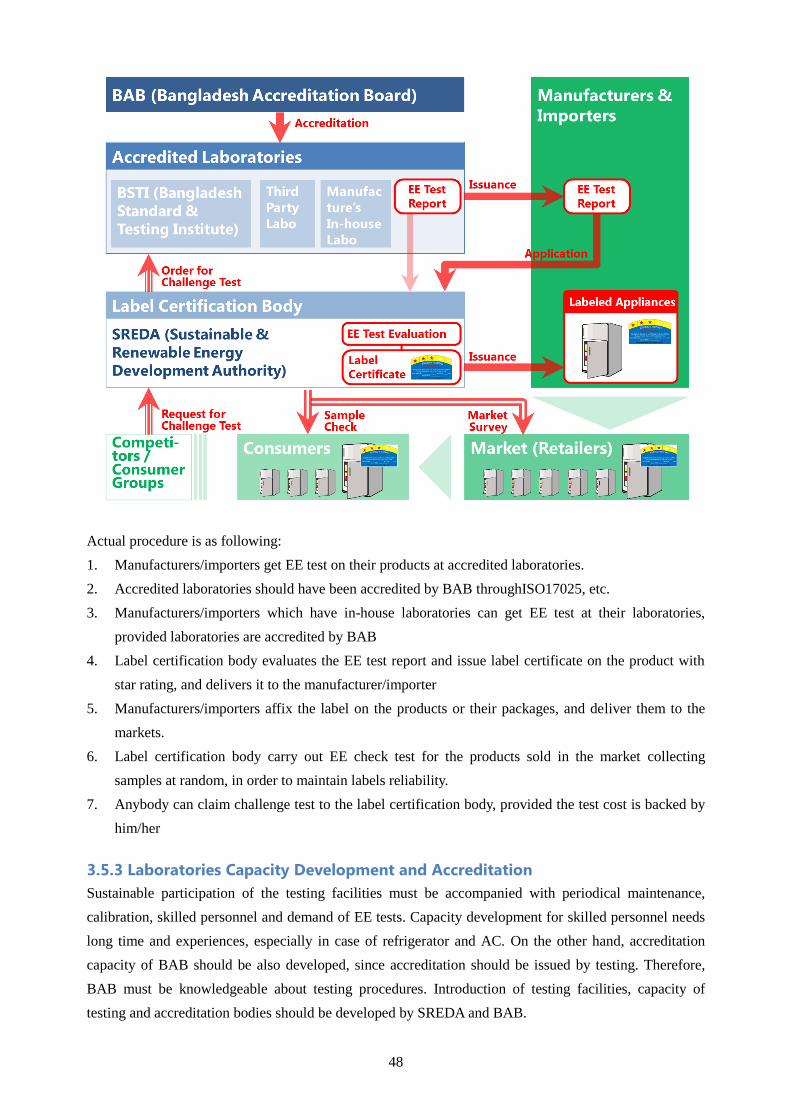
48
Actual procedure is as following:
1. Manufacturers/importers get EE test on their products at accredited laboratories.
2. Accredited laboratories should have been accredited by BAB throughISO17025, etc.
3. Manufacturers/importers which have in-house laboratories can get EE test at their laboratories,
provided laboratories are accredited by BAB
4. Label certification body evaluates the EE test report and issue label certificate on the product with
star rating, and delivers it to the manufacturer/importer
5. Manufacturers/importers affix the label on the products or their packages, and deliver them to the
markets.
6. Label certification body carry out EE check test for the products sold in the market collecting
samples at random, in order to maintain labels reliability.
7. Anybody can claim challenge test to the label certification body, provided the test cost is backed by
him/her
3.5.3 Laboratories Capacity Development and Accreditation
Sustainable participation of the testing facilities must be accompanied with periodical maintenance,
calibration, skilled personnel and demand of EE tests. Capacity development for skilled personnel needs
long time and experiences, especially in case of refrigerator and AC. On the other hand, accreditation
capacity of BAB should be also developed, since accreditation should be issued by testing. Therefore,
BAB must be knowledgeable about testing procedures. Introduction of testing facilities, capacity of
testing and accreditation bodies should be developed by SREDA and BAB.
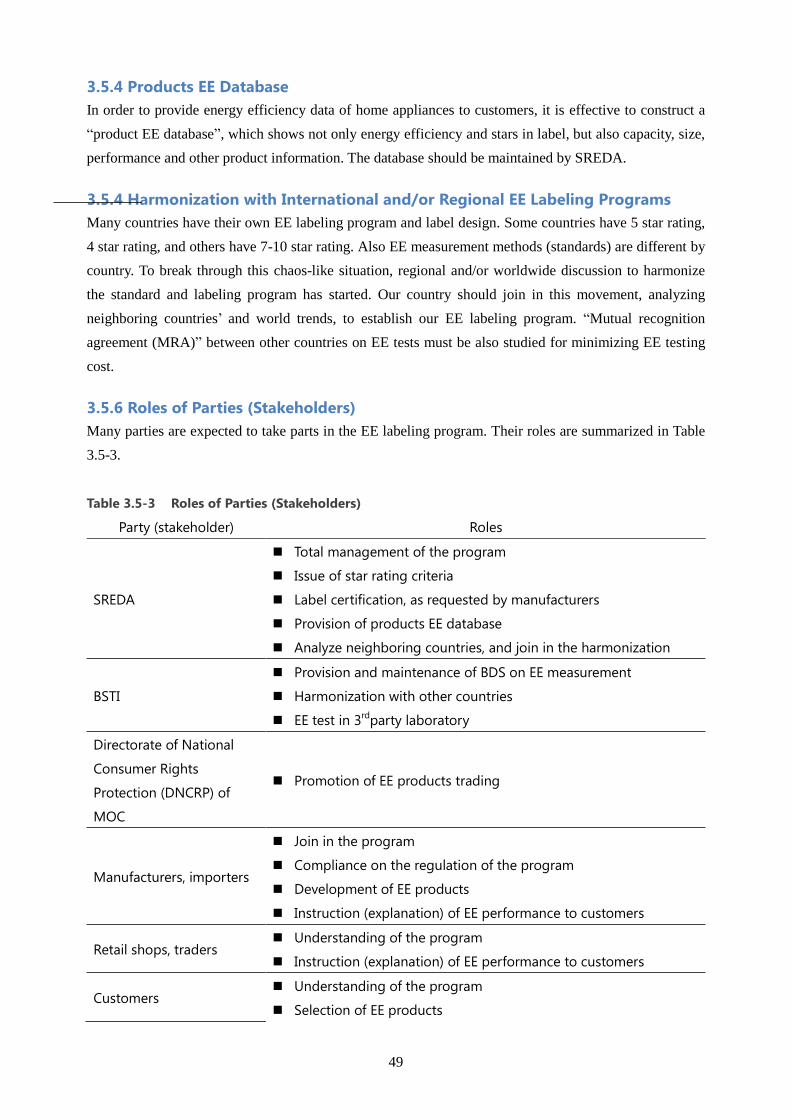
49
3.5.4 Products EE Database
In order to provide energy efficiency data of home appliances to customers, it is effective to construct a
“product EE database”, which shows not only energy efficiency and stars in label, but also capacity, size,
performance and other product information. The database should be maintained by SREDA.
3.5.4 Harmonization with International and/or Regional EE Labeling Programs
Many countries have their own EE labeling program and label design. Some countries have 5 star rating,
4 star rating, and others have 7-10 star rating. Also EE measurement methods (standards) are different by
country. To break through this chaos-like situation, regional and/or worldwide discussion to harmonize
the standard and labeling program has started. Our country should join in this movement, analyzing
neighboring countries’ and world trends, to establish our EE labeling program. “Mutual recognition
agreement (MRA)” between other countries on EE tests must be also studied for minimizing EE testing
cost.
3.5.6 Roles of Parties (Stakeholders)
Many parties are expected to take parts in the EE labeling program. Their roles are summarized in Table
3.5-3.
Table 3.5-3 Roles of Parties (Stakeholders)
Party (stakeholder) Roles
SREDA
Total management of the program
Issue of star rating criteria
Label certification, as requested by manufacturers
Provision of products EE database
Analyze neighboring countries, and join in the harmonization
BSTI
Provision and maintenance of BDS on EE measurement
Harmonization with other countries
EE test in 3rd
party laboratory
Directorate of National
Consumer Rights
Protection (DNCRP) of
MOC
Promotion of EE products trading
Manufacturers, importers
Join in the program
Compliance on the regulation of the program
Development of EE products
Instruction (explanation) of EE performance to customers
Retail shops, traders Understanding of the program
Instruction (explanation) of EE performance to customers
Customers Understanding of the program
Selection of EE products
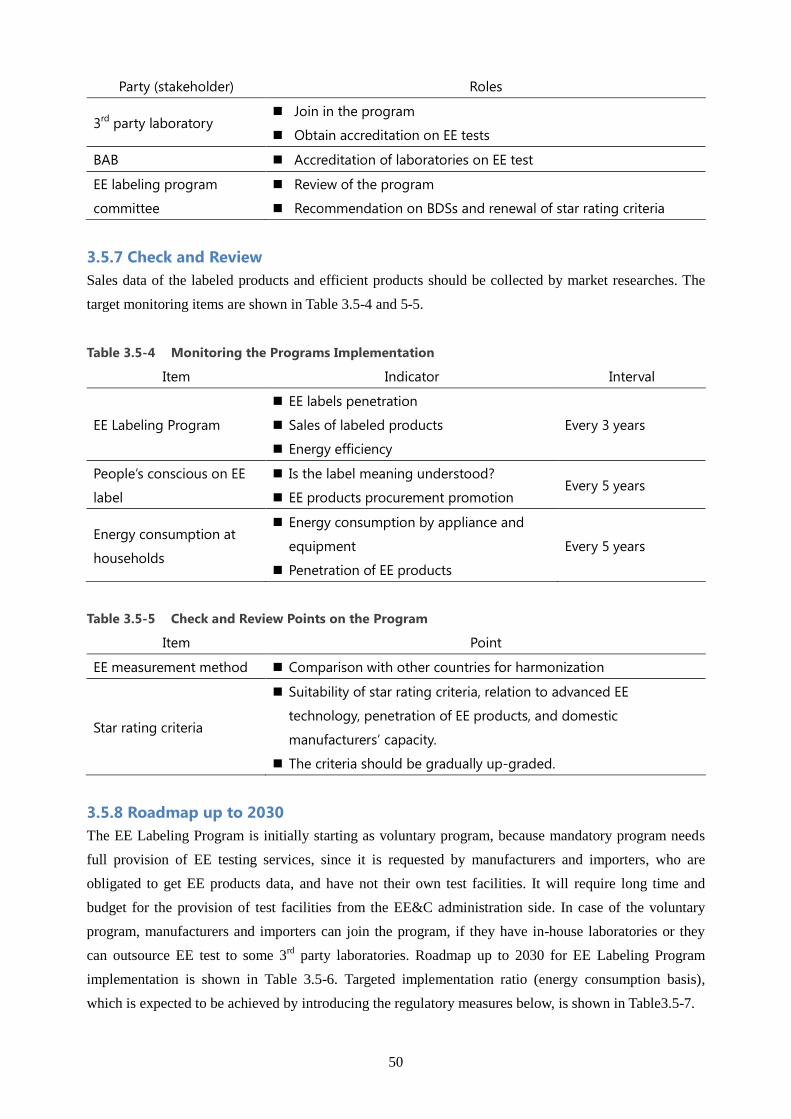
50
Party (stakeholder) Roles
3rd
party laboratory Join in the program
Obtain accreditation on EE tests
BAB Accreditation of laboratories on EE test
EE labeling program
committee
Review of the program
Recommendation on BDSs and renewal of star rating criteria
3.5.7 Check and Review
Sales data of the labeled products and efficient products should be collected by market researches. The
target monitoring items are shown in Table 3.5-4 and 5-5.
Table 3.5-4 Monitoring the Programs Implementation
Item Indicator Interval
EE Labeling Program
EE labels penetration
Sales of labeled products
Energy efficiency
Every 3 years
People’s conscious on EE
label
Is the label meaning understood?
EE products procurement promotion Every 5 years
Energy consumption at
households
Energy consumption by appliance and
equipment
Penetration of EE products
Every 5 years
Table 3.5-5 Check and Review Points on the Program
Item Point
EE measurement method Comparison with other countries for harmonization
Star rating criteria
Suitability of star rating criteria, relation to advanced EE
technology, penetration of EE products, and domestic
manufacturers’ capacity.
The criteria should be gradually up-graded.
3.5.8 Roadmap up to 2030
The EE Labeling Program is initially starting as voluntary program, because mandatory program needs
full provision of EE testing services, since it is requested by manufacturers and importers, who are
obligated to get EE products data, and have not their own test facilities. It will require long time and
budget for the provision of test facilities from the EE&C administration side. In case of the voluntary
program, manufacturers and importers can join the program, if they have in-house laboratories or they
can outsource EE test to some 3rd
party laboratories. Roadmap up to 2030 for EE Labeling Program
implementation is shown in Table 3.5-6. Targeted implementation ratio (energy consumption basis),
which is expected to be achieved by introducing the regulatory measures below, is shown in Table3.5-7.
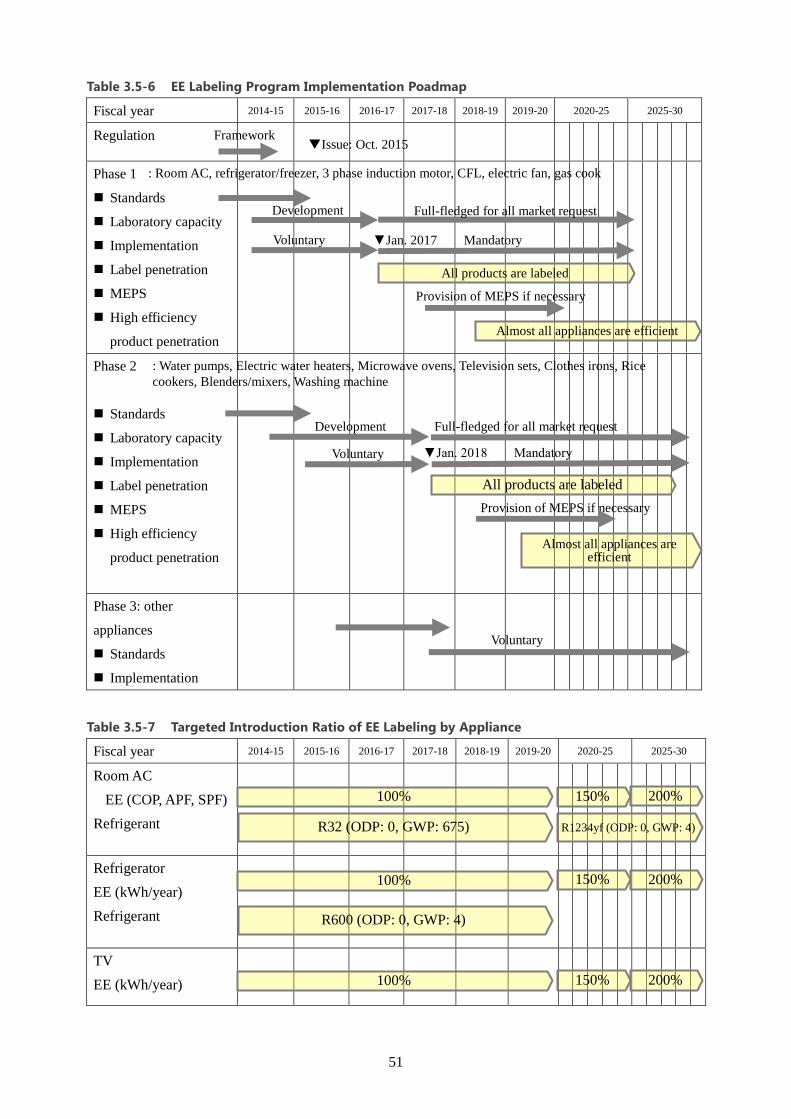
51
Table 3.5-6 EE Labeling Program Implementation Poadmap
Fiscal year 2014-15 2015-16 2016-17 2017-18 2018-19 2019-20 2020-25 2025-30
Regulation
Phase 1
Standards
Laboratory capacity
Implementation
Label penetration
MEPS
High efficiency
product penetration
Phase 2
Standards
Laboratory capacity
Implementation
Label penetration
MEPS
High efficiency
product penetration
Phase 3: other
appliances
Standards
Implementation
Table 3.5-7 Targeted Introduction Ratio of EE Labeling by Appliance
Fiscal year 2014-15 2015-16 2016-17 2017-18 2018-19 2019-20 2020-25 2025-30
Room AC
EE (COP, APF, SPF)
Refrigerant
Refrigerator
EE (kWh/year)
Refrigerant
TV
EE (kWh/year)
▼Issue: Oct. 2015 Framework
All products are labeled
Voluntary ▼Jan. 2017 Mandatory
: Room AC, refrigerator/freezer, 3 phase induction motor, CFL, electric fan, gas cook
stove
Full-fledged for all market request Development
Almost all appliances are efficient
Provision of MEPS if necessary
All products are labeled
▼Jan. 2018 Mandatory Voluntary
: Water pumps, Electric water heaters, Microwave ovens, Television sets, Clothes irons, Rice
cookers, Blenders/mixers, Washing machine
Development Full-fledged for all market request
Provision of MEPS if necessary
Almost all appliances are efficient
Voluntary
150% 200%
R1234yf (ODP: 0, GWP: 4)
100%
R32 (ODP: 0, GWP: 675)
150% 200%
R600 (ODP: 0, GWP: 4)
100%
150% 200% 100%
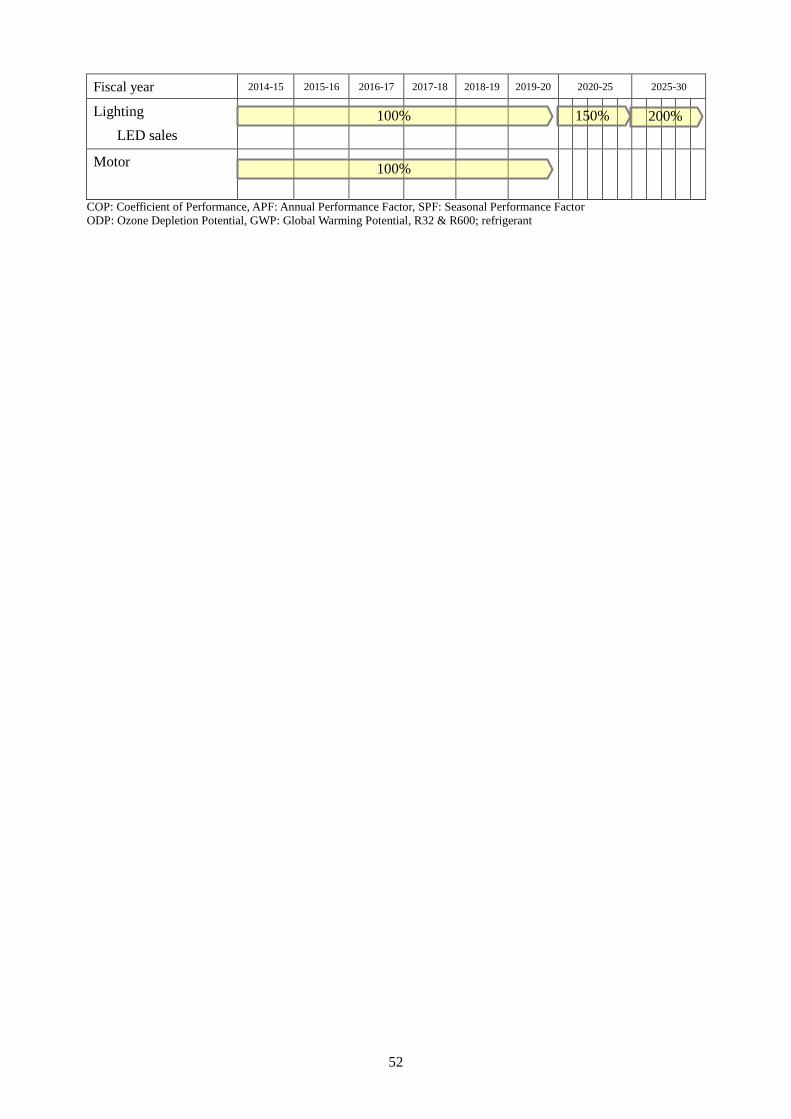
52
Fiscal year 2014-15 2015-16 2016-17 2017-18 2018-19 2019-20 2020-25 2025-30
Lighting
LED sales
Motor
COP: Coefficient of Performance, APF: Annual Performance Factor, SPF: Seasonal Performance Factor
ODP: Ozone Depletion Potential, GWP: Global Warming Potential, R32 & R600; refrigerant
150% 200% 100%
100%
53
3.6 EE Building Program
3.6.1 Overview
The existing energy consumption ratio is not so large compared with industrial and residential sectors.
Besides the energy consumption is rapidly increasing in buildings in Bangladesh. Especially new
buildings construction is remarkable in city area. Therefore it is needed to implement an effective counter
measures to mitigate this issue. And New Version of Bangladesh National Building Code (BNBC
[Revised]) is going to be published by Ministry of Housing and Public Works (MOHPW), taking into
consideration energy conservation in buildings as well. BNBC [Revised] is the core program for
promoting EE buildings.
EE&C measures for buildings are as followings:
Reduction of incoming heat from outside to inside by means of heat insulation, air-tight
door/window and sun shine control
Introduction of energy efficiency building equipment and appliances
Appropriate use, operation and maintenance of the building and building equipment
However, these EE&C measures and rational energy use are not yet sufficiently implemented in
Bangladesh.
Bangladesh National Building Code (BNBC) is the mandatory program which provides regulation and/or
minimum requirement of building type (office, residence, commercial building, etc.), size (height, floor
area), structure strength, indoor condition, construction material, etc.
Currently, addition of energy efficiency requirement of buildings in the code is on-going. BNBC
[Revised], will be issued instead of the existing BNBC, by MOHPW. BNBC [Revised] will be the core
program for promoting EE&C in Buildings and contain the following requirement on building energy
efficiency:
Heat insulation and/or ventilation performance of building envelope
Energy efficiency of building equipment (HVAC, lighting, fans, hot water supply, lift, escalator,
renewable energy options)
Water efficiency and management
On the other hand, Green Building Guideline (GBG) is a voluntary program that provides
recommendations not only on energy/water use efficiency but also on reduction of environmental impact
caused by building construction, use and decommissioning. Development of green building guideline is
an international movement. GBG is planned for the completion by 2025.
EE&C requirement issues in BNCB [Revised] are the minimum standards. On the other hand, EE&C
requirement issues in GBG will be recommended and effective since it allows obtaining upper-grade
EE&C performance than the buildings fulfilling BNCB [Revised].
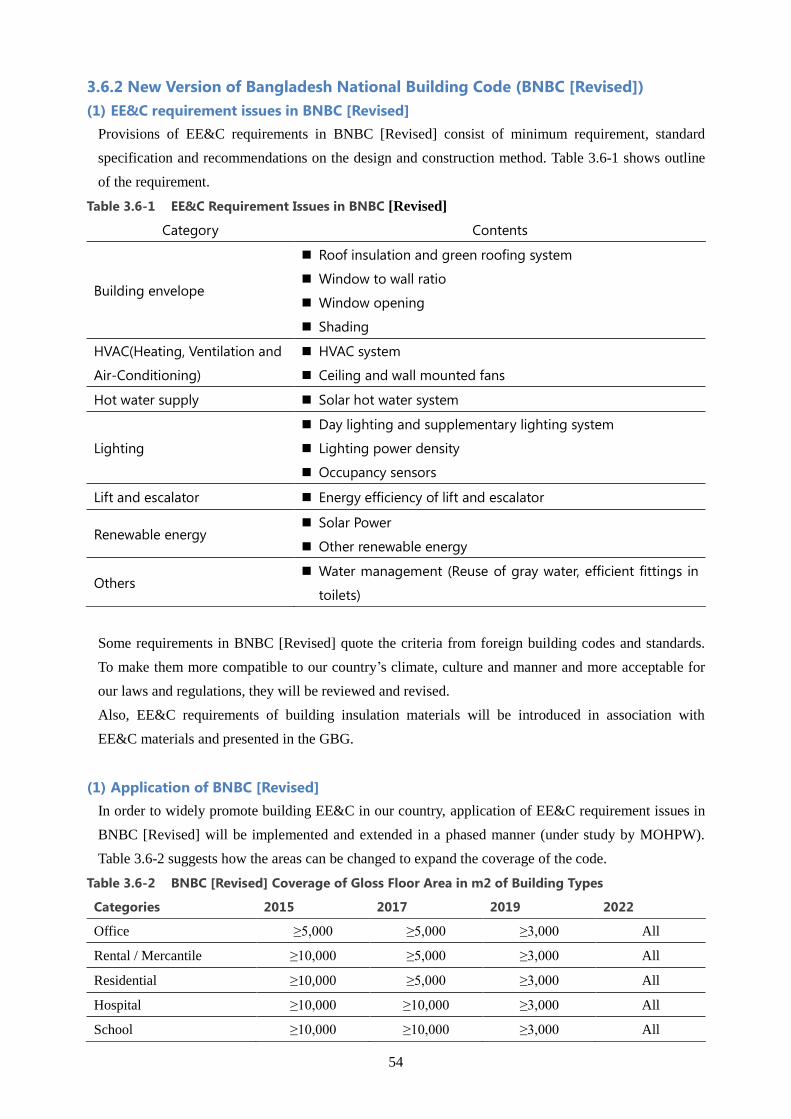
54
3.6.2 New Version of Bangladesh National Building Code (BNBC [Revised])
(1) EE&C requirement issues in BNBC [Revised]
Provisions of EE&C requirements in BNBC [Revised] consist of minimum requirement, standard
specification and recommendations on the design and construction method. Table 3.6-1 shows outline
of the requirement.
Table 3.6-1 EE&C Requirement Issues in BNBC [Revised]
Category Contents
Building envelope
Roof insulation and green roofing system
Window to wall ratio
Window opening
Shading
HVAC(Heating, Ventilation and
Air-Conditioning)
HVAC system
Ceiling and wall mounted fans
Hot water supply Solar hot water system
Lighting
Day lighting and supplementary lighting system
Lighting power density
Occupancy sensors
Lift and escalator Energy efficiency of lift and escalator
Renewable energy Solar Power
Other renewable energy
Others Water management (Reuse of gray water, efficient fittings in
toilets)
Some requirements in BNBC [Revised] quote the criteria from foreign building codes and standards.
To make them more compatible to our country’s climate, culture and manner and more acceptable for
our laws and regulations, they will be reviewed and revised.
Also, EE&C requirements of building insulation materials will be introduced in association with
EE&C materials and presented in the GBG.
(1) Application of BNBC [Revised]
In order to widely promote building EE&C in our country, application of EE&C requirement issues in
BNBC [Revised] will be implemented and extended in a phased manner (under study by MOHPW).
Table 3.6-2 suggests how the areas can be changed to expand the coverage of the code.
Table 3.6-2 BNBC [Revised] Coverage of Gloss Floor Area in m2 of Building Types
Categories 2015 2017 2019 2022
Office ≥5,000 ≥5,000 ≥3,000 All
Rental / Mercantile ≥10,000 ≥5,000 ≥3,000 All
Residential ≥10,000 ≥5,000 ≥3,000 All
Hospital ≥10,000 ≥10,000 ≥3,000 All
School ≥10,000 ≥10,000 ≥3,000 All
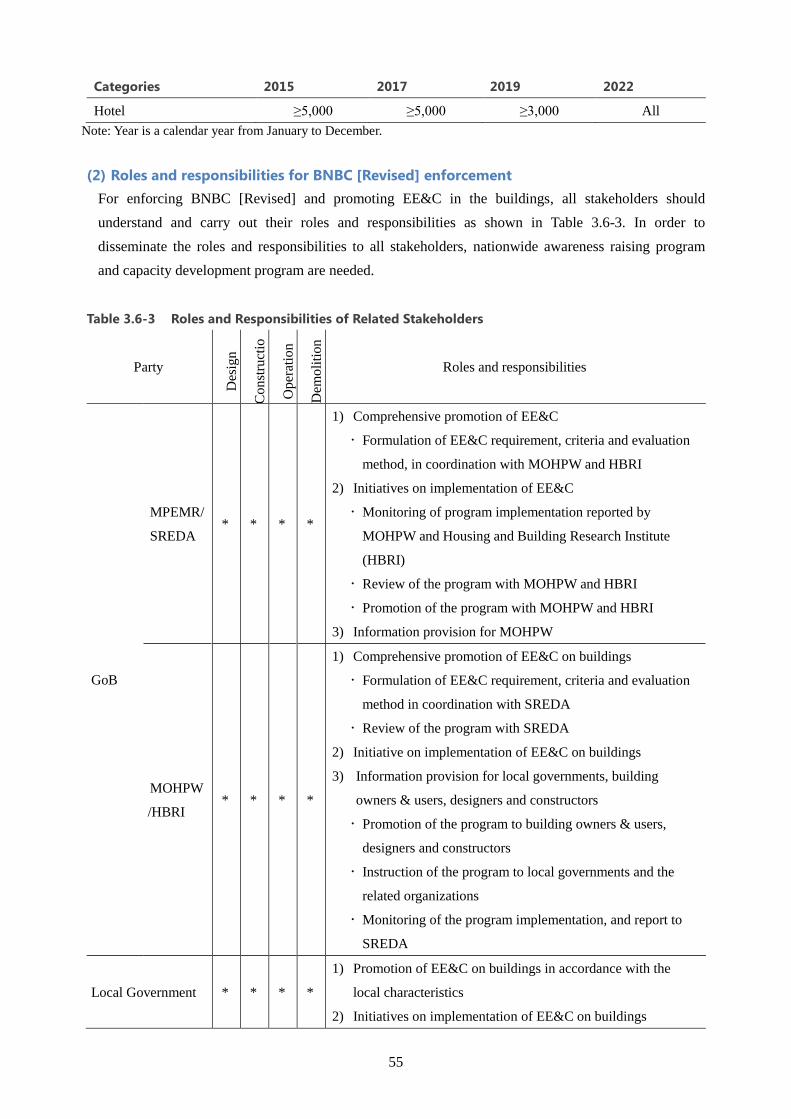
55
Categories 2015 2017 2019 2022
Hotel ≥5,000 ≥5,000 ≥3,000 All
Note: Year is a calendar year from January to December.
(2) Roles and responsibilities for BNBC [Revised] enforcement
For enforcing BNBC [Revised] and promoting EE&C in the buildings, all stakeholders should
understand and carry out their roles and responsibilities as shown in Table 3.6-3. In order to
disseminate the roles and responsibilities to all stakeholders, nationwide awareness raising program
and capacity development program are needed.
Table 3.6-3 Roles and Responsibilities of Related Stakeholders
Party
Des
ign
Co
nst
ruct
io
n
Op
erat
ion
Dem
oli
tio
n
Roles and responsibilities
GoB
MPEMR/
SREDA * * * *
1) Comprehensive promotion of EE&C
Formulation of EE&C requirement, criteria and evaluation
method, in coordination with MOHPW and HBRI
2) Initiatives on implementation of EE&C
Monitoring of program implementation reported by
MOHPW and Housing and Building Research Institute
(HBRI)
Review of the program with MOHPW and HBRI
Promotion of the program with MOHPW and HBRI
3) Information provision for MOHPW
MOHPW
/HBRI * * * *
1) Comprehensive promotion of EE&C on buildings
Formulation of EE&C requirement, criteria and evaluation
method in coordination with SREDA
Review of the program with SREDA
2) Initiative on implementation of EE&C on buildings
3) Information provision for local governments, building
owners & users, designers and constructors
Promotion of the program to building owners & users,
designers and constructors
Instruction of the program to local governments and the
related organizations
Monitoring of the program implementation, and report to
SREDA
Local Government * * * *
1) Promotion of EE&C on buildings in accordance with the
local characteristics
2) Initiatives on implementation of EE&C on buildings
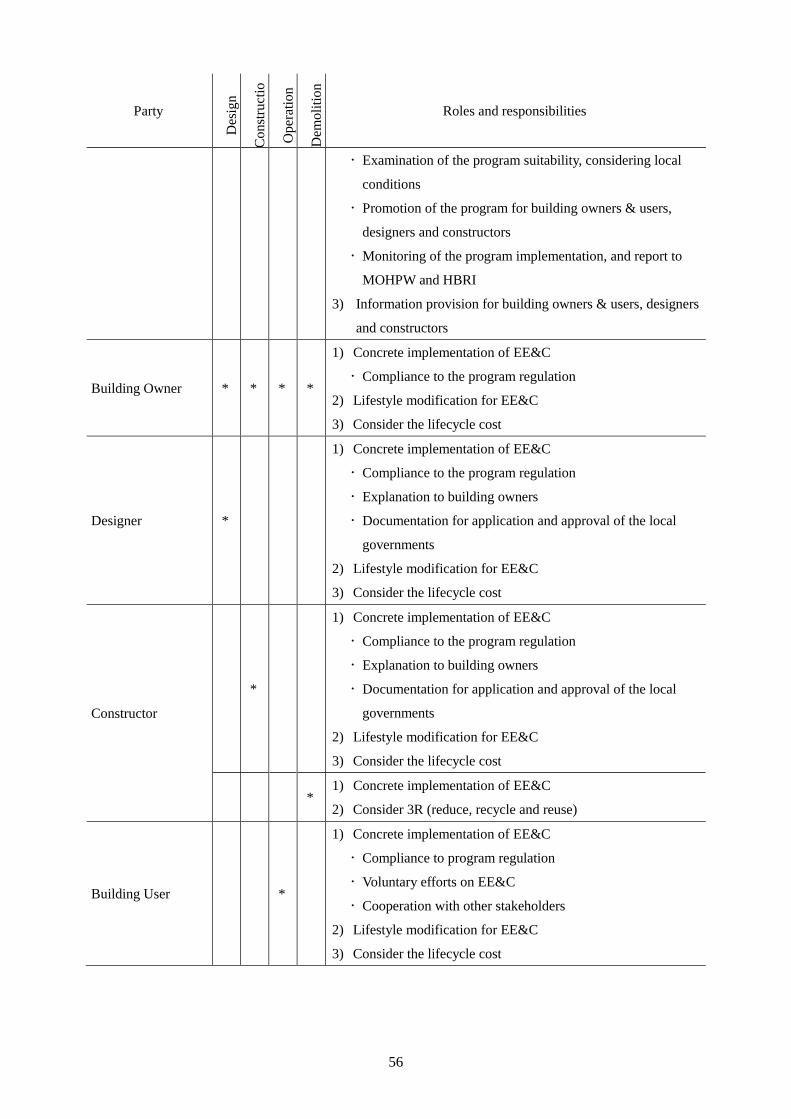
56
Party
Des
ign
Co
nst
ruct
io
n
Op
erat
ion
Dem
oli
tio
n
Roles and responsibilities
Examination of the program suitability, considering local
conditions
Promotion of the program for building owners & users,
designers and constructors
Monitoring of the program implementation, and report to
MOHPW and HBRI
3) Information provision for building owners & users, designers
and constructors
Building Owner * * * *
1) Concrete implementation of EE&C
Compliance to the program regulation
2) Lifestyle modification for EE&C
3) Consider the lifecycle cost
Designer *
1) Concrete implementation of EE&C
Compliance to the program regulation
Explanation to building owners
Documentation for application and approval of the local
governments
2) Lifestyle modification for EE&C
3) Consider the lifecycle cost
Constructor
*
1) Concrete implementation of EE&C
Compliance to the program regulation
Explanation to building owners
Documentation for application and approval of the local
governments
2) Lifestyle modification for EE&C
3) Consider the lifecycle cost
* 1) Concrete implementation of EE&C
2) Consider 3R (reduce, recycle and reuse)
Building User *
1) Concrete implementation of EE&C
Compliance to program regulation
Voluntary efforts on EE&C
Cooperation with other stakeholders
2) Lifestyle modification for EE&C
3) Consider the lifecycle cost
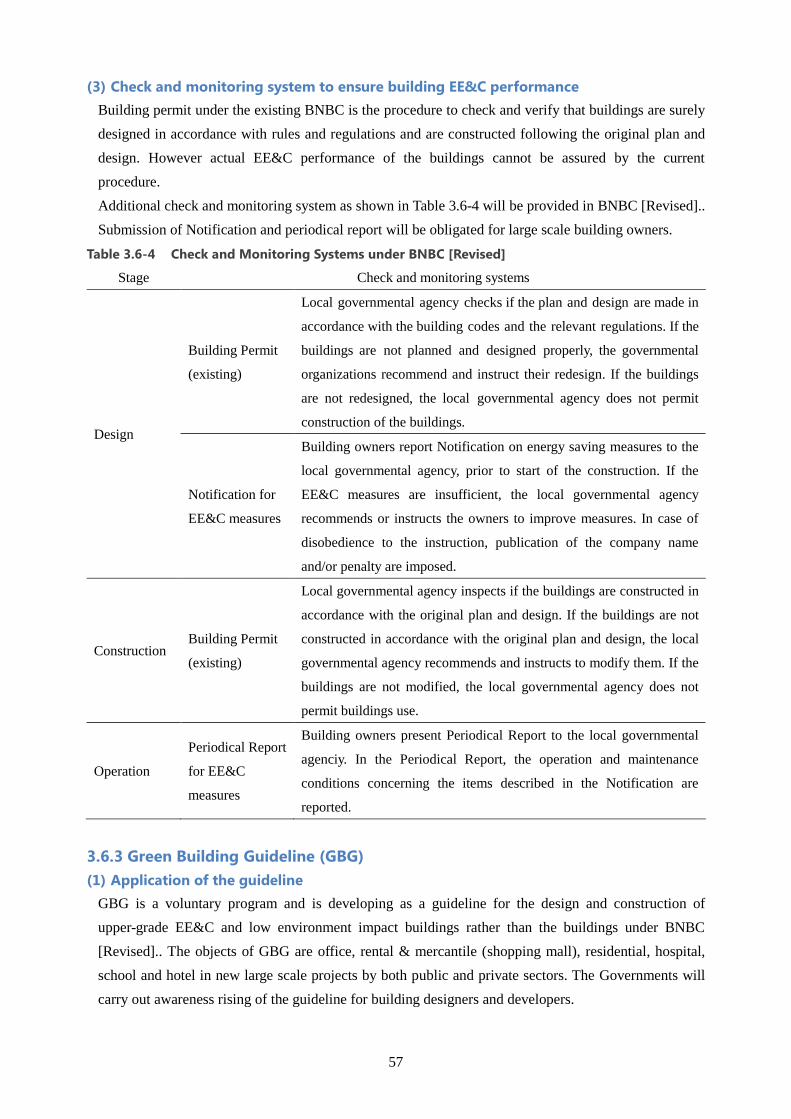
57
(3) Check and monitoring system to ensure building EE&C performance
Building permit under the existing BNBC is the procedure to check and verify that buildings are surely
designed in accordance with rules and regulations and are constructed following the original plan and
design. However actual EE&C performance of the buildings cannot be assured by the current
procedure.
Additional check and monitoring system as shown in Table 3.6-4 will be provided in BNBC [Revised]..
Submission of Notification and periodical report will be obligated for large scale building owners.
Table 3.6-4 Check and Monitoring Systems under BNBC [Revised]
Stage Check and monitoring systems
Design
Building Permit
(existing)
Local governmental agency checks if the plan and design are made in
accordance with the building codes and the relevant regulations. If the
buildings are not planned and designed properly, the governmental
organizations recommend and instruct their redesign. If the buildings
are not redesigned, the local governmental agency does not permit
construction of the buildings.
Notification for
EE&C measures
Building owners report Notification on energy saving measures to the
local governmental agency, prior to start of the construction. If the
EE&C measures are insufficient, the local governmental agency
recommends or instructs the owners to improve measures. In case of
disobedience to the instruction, publication of the company name
and/or penalty are imposed.
Construction Building Permit
(existing)
Local governmental agency inspects if the buildings are constructed in
accordance with the original plan and design. If the buildings are not
constructed in accordance with the original plan and design, the local
governmental agency recommends and instructs to modify them. If the
buildings are not modified, the local governmental agency does not
permit buildings use.
Operation
Periodical Report
for EE&C
measures
Building owners present Periodical Report to the local governmental
agenciy. In the Periodical Report, the operation and maintenance
conditions concerning the items described in the Notification are
reported.
3.6.3 Green Building Guideline (GBG)
(1) Application of the guideline
GBG is a voluntary program and is developing as a guideline for the design and construction of
upper-grade EE&C and low environment impact buildings rather than the buildings under BNBC
[Revised].. The objects of GBG are office, rental & mercantile (shopping mall), residential, hospital,
school and hotel in new large scale projects by both public and private sectors. The Governments will
carry out awareness rising of the guideline for building designers and developers.
58
(2) EE&C recommendation in GBG
GBG is developed to reduce not only energy and water consumptions but also environmental impacts
during construction, use and decommissioning of the buildings. GBG, as a voluntary program, will
give recommendation on use of energy and water, waste management, indoor environmental condition,
material use at construction and other environmental issues.
3.6.4 Other Programs for Promoting EE&C in Buildings
(1) Development of EE&C building manual
In order to encourage proper and effective EE&C implementation in BNBC [Revised]., EE&C building
manual for local governments, building owners and users, designers and constructors, will be
developed and published by MOHPW, in the initial BNBC [Revised] implementation stage. The
manual shall include detailed explanations and concrete construction methods for EE&C measures
described in BNBC [Revised].. Also the manual will include not only general measures applicable to
all buildings but, also, a variety of recommended measures appropriate and economically beneficial
depending on the specific conditions of the individual building and location.
(2) Development of Green Building Assessment System
Green Building Assessment System will be developed by MOHPW, in association with the GBG
development and is compatible to our country’s climate, culture and manner and is acceptable for
Bangladeshi laws and regulations. The system will start to be voluntarily applied for large scale
development projects such as shopping mall, airport building, hotel and hospital.
In the future, the Green Building Assessment System with GBG will be used as an evaluation method
for certification of “Green building” and/or “Net zero energy building”. Green building owners may be
rewarded or incentives may be given.
(3) EE&C for existing buildings under Energy Management Program
In order to encourage energy efficient operation of existing buildings, retrofit with energy efficient
technologies and other measures able to reduce energy consumption in existing buildings will be
supported.
In the near future, large scale buildings classified as designated large consumers under the energy
management program will implement EE&C activities or retrofitting under the program to be leaded by
SREDA. SREDA will develop criteria and list buildings, classified as designated large consumers
under the energy management program, in association with MOHPW and HBRI.
In the future, MOHPW and HBRI, in cooperation with SREDA, will expand EE&C measures in BNBC
[Revised] and GBG to existing buildings.
3.6.5 Check and Review of the Programs
(1) Check and review of the programs
MOHPW and HBRI will regularly check and review the progress situations for BNBC [Revised].
implementation and GBG development. If any delay and/or changes on the situations arise, MOHPW
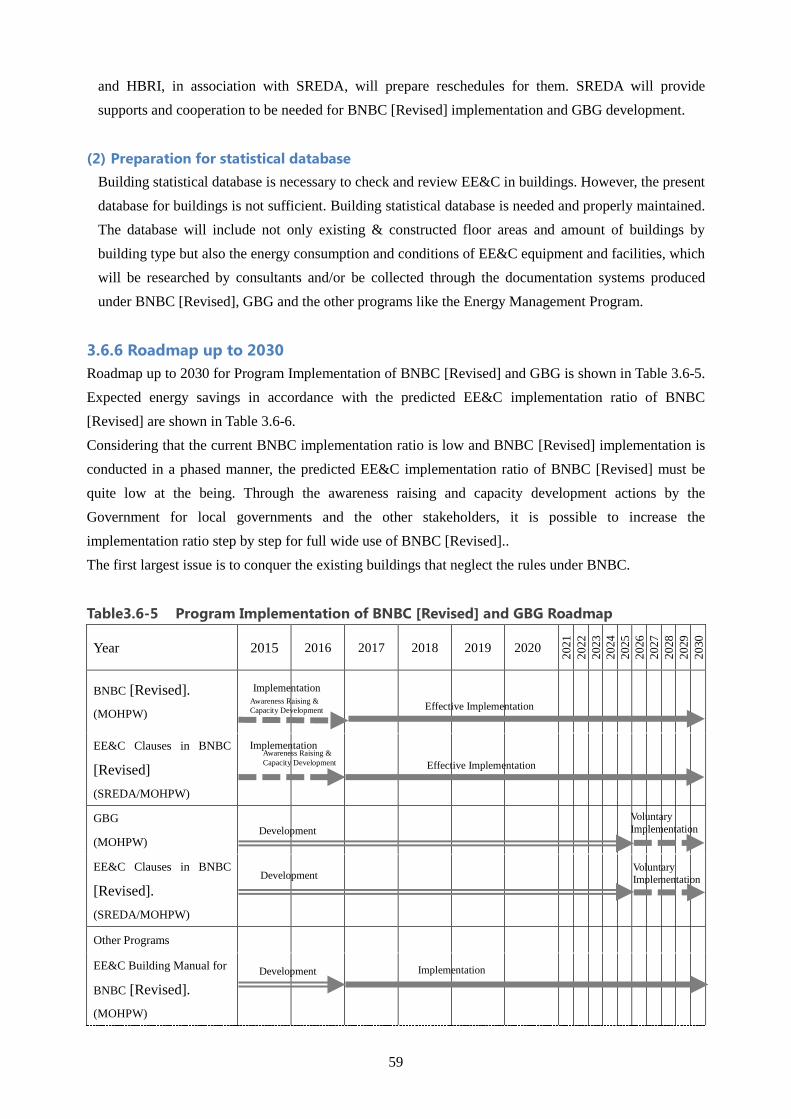
59
and HBRI, in association with SREDA, will prepare reschedules for them. SREDA will provide
supports and cooperation to be needed for BNBC [Revised] implementation and GBG development.
(2) Preparation for statistical database
Building statistical database is necessary to check and review EE&C in buildings. However, the present
database for buildings is not sufficient. Building statistical database is needed and properly maintained.
The database will include not only existing & constructed floor areas and amount of buildings by
building type but also the energy consumption and conditions of EE&C equipment and facilities, which
will be researched by consultants and/or be collected through the documentation systems produced
under BNBC [Revised], GBG and the other programs like the Energy Management Program.
3.6.6 Roadmap up to 2030
Roadmap up to 2030 for Program Implementation of BNBC [Revised] and GBG is shown in Table 3.6-5.
Expected energy savings in accordance with the predicted EE&C implementation ratio of BNBC
[Revised] are shown in Table 3.6-6.
Considering that the current BNBC implementation ratio is low and BNBC [Revised] implementation is
conducted in a phased manner, the predicted EE&C implementation ratio of BNBC [Revised] must be
quite low at the being. Through the awareness raising and capacity development actions by the
Government for local governments and the other stakeholders, it is possible to increase the
implementation ratio step by step for full wide use of BNBC [Revised]..
The first largest issue is to conquer the existing buildings that neglect the rules under BNBC.
Table3.6-5 Program Implementation of BNBC [Revised] and GBG Roadmap
Year 2015 2016 2017 2018 2019 2020
20
21
20
22
20
23
20
24
20
25
20
26
20
27
20
28
20
29
20
30
BNBC [Revised].
(MOHPW)
EE&C Clauses in BNBC
[Revised]
(SREDA/MOHPW)
GBG
(MOHPW)
EE&C Clauses in BNBC
[Revised].
(SREDA/MOHPW)
Other Programs
EE&C Building Manual for
BNBC [Revised].
(MOHPW)
Effective Implementation
Awareness Raising &
Capacity Development Effective Implementation
Implementation
Voluntary
Implementation Development
Voluntary
Implementation Development
Implementation Development
Awareness Raising &
Capacity Development
Implementation
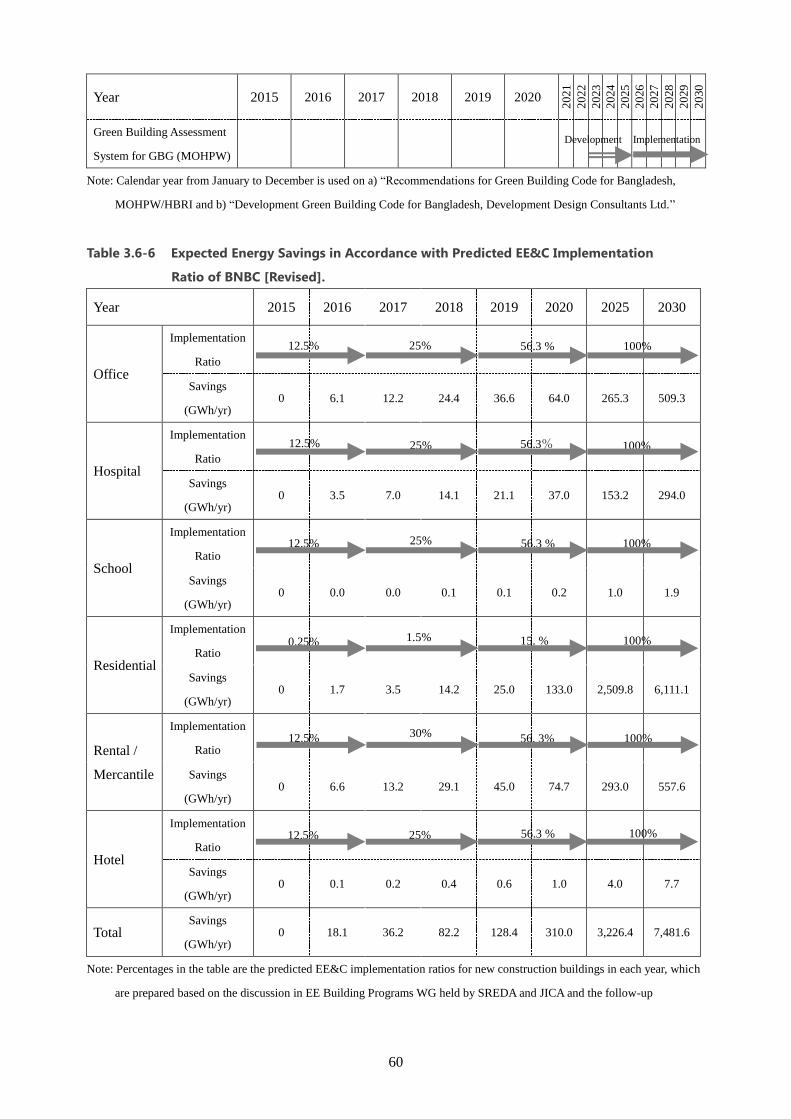
60
Year 2015 2016 2017 2018 2019 2020
20
21
20
22
20
23
20
24
20
25
20
26
20
27
20
28
20
29
20
30
Green Building Assessment
System for GBG (MOHPW)
Note: Calendar year from January to December is used on a) “Recommendations for Green Building Code for Bangladesh,
MOHPW/HBRI and b) “Development Green Building Code for Bangladesh, Development Design Consultants Ltd.”
Table 3.6-6 Expected Energy Savings in Accordance with Predicted EE&C Implementation
Ratio of BNBC [Revised].
Year 2015 2016 2017 2018 2019 2020 2025 2030
Office
Implementation
Ratio
Savings
(GWh/yr) 0 6.1 12.2 24.4 36.6 64.0 265.3 509.3
Hospital
Implementation
Ratio
Savings
(GWh/yr) 0 3.5 7.0 14.1 21.1 37.0 153.2 294.0
School
Implementation
Ratio
Savings
(GWh/yr) 0 0.0 0.0 0.1 0.1 0.2 1.0 1.9
Residential
Implementation
Ratio
Savings
(GWh/yr) 0 1.7 3.5 14.2 25.0 133.0 2,509.8 6,111.1
Rental /
Mercantile
Implementation
Ratio
Savings
(GWh/yr) 0 6.6 13.2 29.1 45.0 74.7 293.0 557.6
Hotel
Implementation
Ratio
Savings
(GWh/yr) 0 0.1 0.2 0.4 0.6 1.0 4.0 7.7
Total Savings
(GWh/yr) 0 18.1 36.2 82.2 128.4 310.0 3,226.4 7,481.6
Note: Percentages in the table are the predicted EE&C implementation ratios for new construction buildings in each year, which
are prepared based on the discussion in EE Building Programs WG held by SREDA and JICA and the follow-up
12.5% 25%
Implementation Development
56.3 % 100%
12.5% 25% 56.3% 100%
12.5% 25% 56.3 % 100%
0.25% 1.5% 15. % 100%
12.5% 30% 56. 3% 100%
12.5% 25% 56.3 % 100%
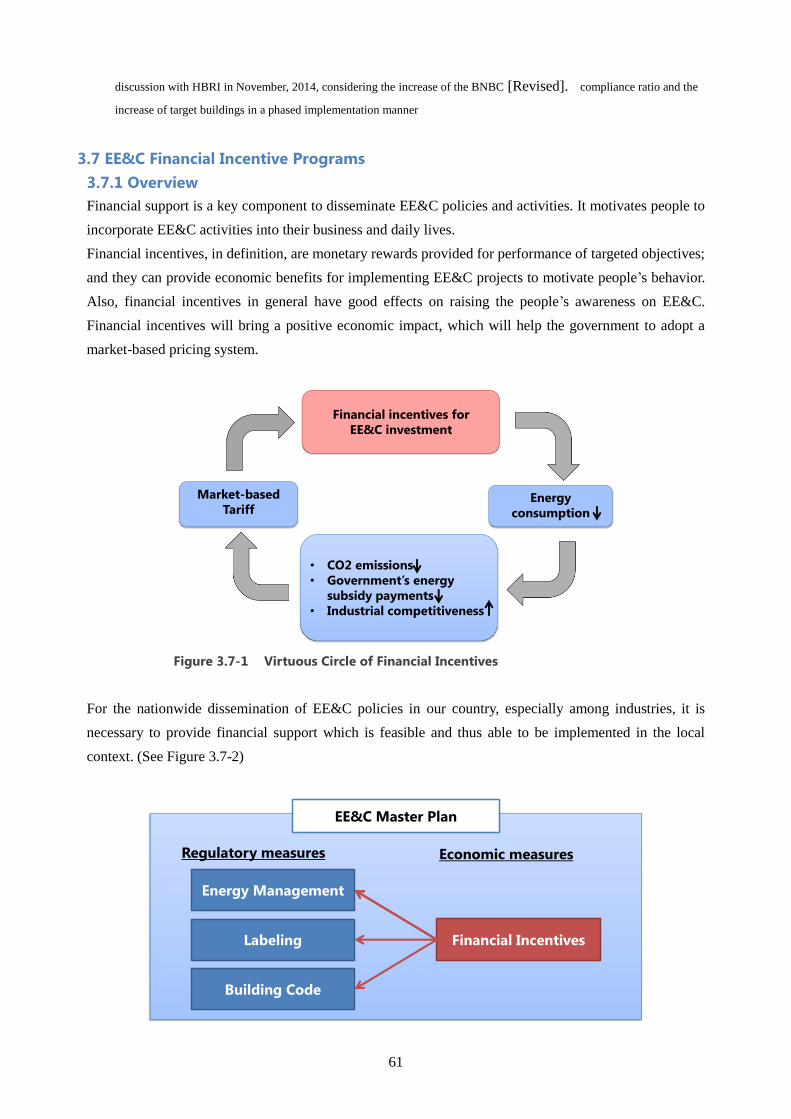
61
discussion with HBRI in November, 2014, considering the increase of the BNBC [Revised]. compliance ratio and the
increase of target buildings in a phased implementation manner
3.7 EE&C Financial Incentive Programs
3.7.1 Overview
Financial support is a key component to disseminate EE&C policies and activities. It motivates people to
incorporate EE&C activities into their business and daily lives.
Financial incentives, in definition, are monetary rewards provided for performance of targeted objectives;
and they can provide economic benefits for implementing EE&C projects to motivate people’s behavior.
Also, financial incentives in general have good effects on raising the people’s awareness on EE&C.
Financial incentives will bring a positive economic impact, which will help the government to adopt a
market-based pricing system.
Figure 3.7-1 Virtuous Circle of Financial Incentives
For the nationwide dissemination of EE&C policies in our country, especially among industries, it is
necessary to provide financial support which is feasible and thus able to be implemented in the local
context. (See Figure 3.7-2)
Financial incentives for
EE&C investment
Energy
consumption
• CO2 emissions
• Government’s energy
subsidy payments
• Industrial competitiveness
Market-based
Tariff
EE&C Master Plan
Labeling
Regulatory measures
Building Code
Energy Management
Financial Incentives
Economic measures
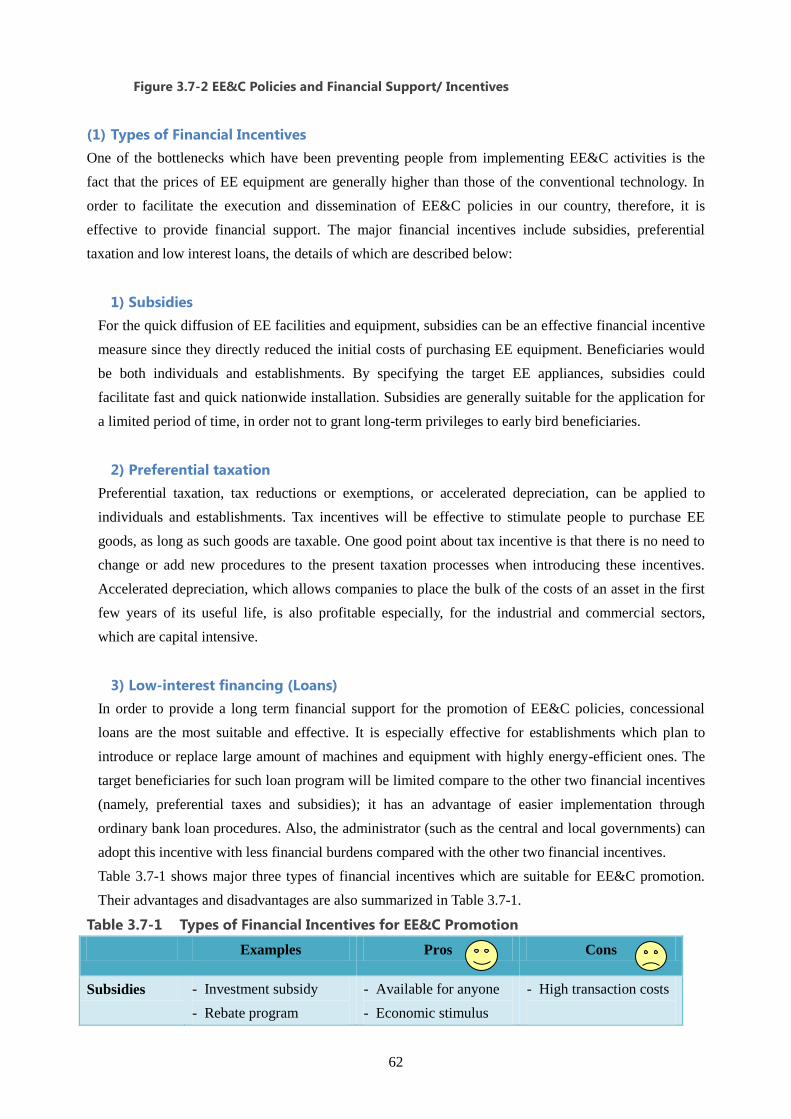
62
Figure 3.7-2 EE&C Policies and Financial Support/ Incentives
(1) Types of Financial Incentives
One of the bottlenecks which have been preventing people from implementing EE&C activities is the
fact that the prices of EE equipment are generally higher than those of the conventional technology. In
order to facilitate the execution and dissemination of EE&C policies in our country, therefore, it is
effective to provide financial support. The major financial incentives include subsidies, preferential
taxation and low interest loans, the details of which are described below:
1) Subsidies
For the quick diffusion of EE facilities and equipment, subsidies can be an effective financial incentive
measure since they directly reduced the initial costs of purchasing EE equipment. Beneficiaries would
be both individuals and establishments. By specifying the target EE appliances, subsidies could
facilitate fast and quick nationwide installation. Subsidies are generally suitable for the application for
a limited period of time, in order not to grant long-term privileges to early bird beneficiaries.
2) Preferential taxation
Preferential taxation, tax reductions or exemptions, or accelerated depreciation, can be applied to
individuals and establishments. Tax incentives will be effective to stimulate people to purchase EE
goods, as long as such goods are taxable. One good point about tax incentive is that there is no need to
change or add new procedures to the present taxation processes when introducing these incentives.
Accelerated depreciation, which allows companies to place the bulk of the costs of an asset in the first
few years of its useful life, is also profitable especially, for the industrial and commercial sectors,
which are capital intensive.
3) Low-interest financing (Loans)
In order to provide a long term financial support for the promotion of EE&C policies, concessional
loans are the most suitable and effective. It is especially effective for establishments which plan to
introduce or replace large amount of machines and equipment with highly energy-efficient ones. The
target beneficiaries for such loan program will be limited compare to the other two financial incentives
(namely, preferential taxes and subsidies); it has an advantage of easier implementation through
ordinary bank loan procedures. Also, the administrator (such as the central and local governments) can
adopt this incentive with less financial burdens compared with the other two financial incentives.
Table 3.7-1 shows major three types of financial incentives which are suitable for EE&C promotion.
Their advantages and disadvantages are also summarized in Table 3.7-1.
Table 3.7-1 Types of Financial Incentives for EE&C Promotion
Examples Pros Cons
Subsidies - Investment subsidy
- Rebate program
- Available for anyone
- Economic stimulus
- High transaction costs
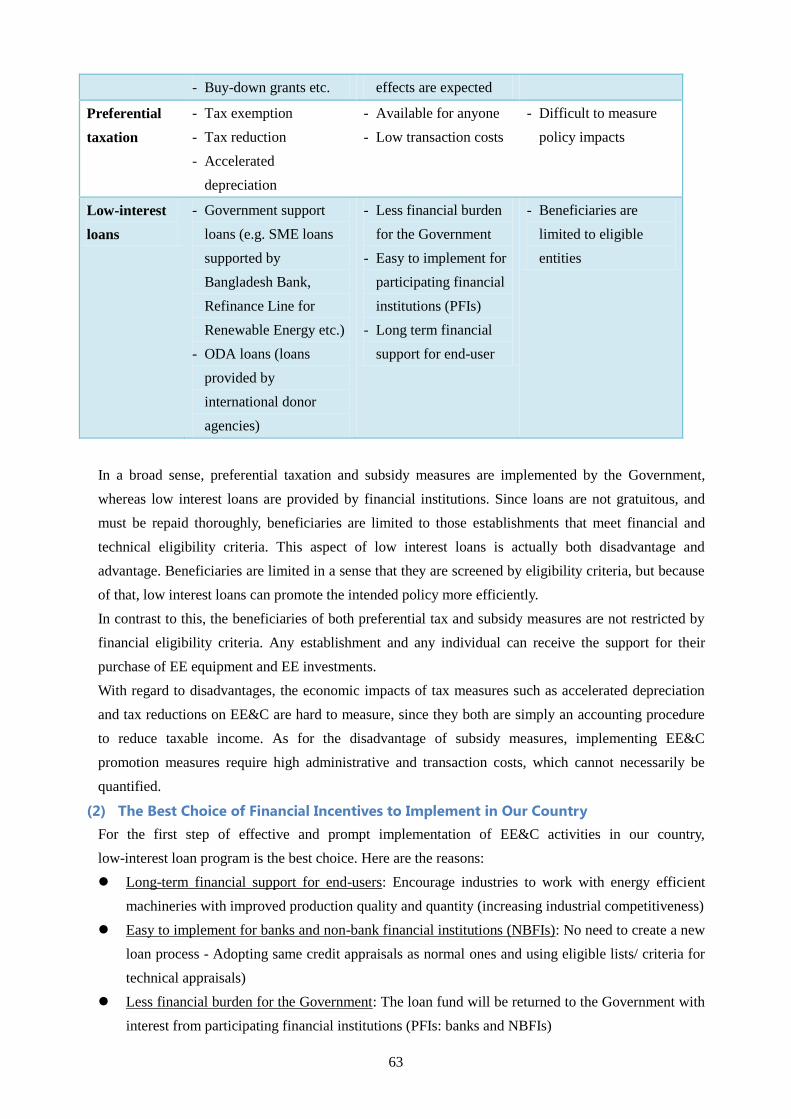
63
- Buy-down grants etc. effects are expected
Preferential
taxation
- Tax exemption
- Tax reduction
- Accelerated
depreciation
- Available for anyone
- Low transaction costs
- Difficult to measure
policy impacts
Low-interest
loans
- Government support
loans (e.g. SME loans
supported by
Bangladesh Bank,
Refinance Line for
Renewable Energy etc.)
- ODA loans (loans
provided by
international donor
agencies)
- Less financial burden
for the Government
- Easy to implement for
participating financial
institutions (PFIs)
- Long term financial
support for end-user
- Beneficiaries are
limited to eligible
entities
In a broad sense, preferential taxation and subsidy measures are implemented by the Government,
whereas low interest loans are provided by financial institutions. Since loans are not gratuitous, and
must be repaid thoroughly, beneficiaries are limited to those establishments that meet financial and
technical eligibility criteria. This aspect of low interest loans is actually both disadvantage and
advantage. Beneficiaries are limited in a sense that they are screened by eligibility criteria, but because
of that, low interest loans can promote the intended policy more efficiently.
In contrast to this, the beneficiaries of both preferential tax and subsidy measures are not restricted by
financial eligibility criteria. Any establishment and any individual can receive the support for their
purchase of EE equipment and EE investments.
With regard to disadvantages, the economic impacts of tax measures such as accelerated depreciation
and tax reductions on EE&C are hard to measure, since they both are simply an accounting procedure
to reduce taxable income. As for the disadvantage of subsidy measures, implementing EE&C
promotion measures require high administrative and transaction costs, which cannot necessarily be
quantified.
(2) The Best Choice of Financial Incentives to Implement in Our Country
For the first step of effective and prompt implementation of EE&C activities in our country,
low-interest loan program is the best choice. Here are the reasons:
Long-term financial support for end-users: Encourage industries to work with energy efficient
machineries with improved production quality and quantity (increasing industrial competitiveness)
Easy to implement for banks and non-bank financial institutions (NBFIs): No need to create a new
loan process - Adopting same credit appraisals as normal ones and using eligible lists/ criteria for
technical appraisals)
Less financial burden for the Government: The loan fund will be returned to the Government with
interest from participating financial institutions (PFIs: banks and NBFIs)
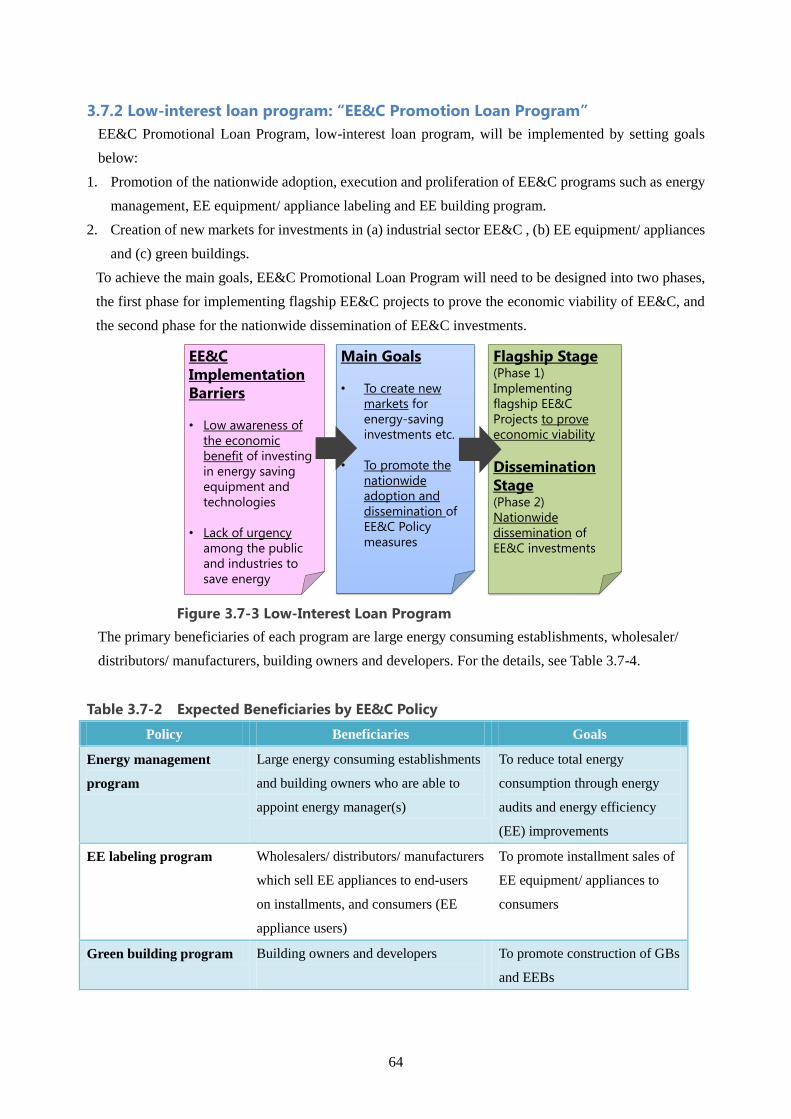
64
3.7.2 Low-interest loan program: “EE&C Promotion Loan Program”
EE&C Promotional Loan Program, low-interest loan program, will be implemented by setting goals
below:
1. Promotion of the nationwide adoption, execution and proliferation of EE&C programs such as energy
management, EE equipment/ appliance labeling and EE building program.
2. Creation of new markets for investments in (a) industrial sector EE&C , (b) EE equipment/ appliances
and (c) green buildings.
To achieve the main goals, EE&C Promotional Loan Program will need to be designed into two phases,
the first phase for implementing flagship EE&C projects to prove the economic viability of EE&C, and
the second phase for the nationwide dissemination of EE&C investments.
Figure 3.7-3 Low-Interest Loan Program
The primary beneficiaries of each program are large energy consuming establishments, wholesaler/
distributors/ manufacturers, building owners and developers. For the details, see Table 3.7-4.
Table 3.7-2 Expected Beneficiaries by EE&C Policy
Policy Beneficiaries Goals
Energy management
program
Large energy consuming establishments
and building owners who are able to
appoint energy manager(s)
To reduce total energy
consumption through energy
audits and energy efficiency
(EE) improvements
EE labeling program Wholesalers/ distributors/ manufacturers
which sell EE appliances to end-users
on installments, and consumers (EE
appliance users)
To promote installment sales of
EE equipment/ appliances to
consumers
Green building program Building owners and developers
To promote construction of GBs
and EEBs
Main Goals
• To create new
markets for
energy-saving
investments etc.
• To promote the
nationwide
adoption and
dissemination of
EE&C Policy
measures
Flagship Stage(Phase 1)
Implementing
flagship EE&C
Projects to prove
economic viability
Dissemination
Stage(Phase 2)
Nationwide
dissemination of
EE&C investments
EE&C
Implementation
Barriers
• Low awareness of
the economic
benefit of investing
in energy saving
equipment and
technologies
• Lack of urgency
among the public
and industries to
save energy
65
(1) Flagship Stage
Flagship project stage is necessary to show the economic benefits of EE&C investments to enlighten
the general public, especially in the industrial and residential sectors, which are the largest energy
consumers in this country. In addition, flagship projects will contribute to the creation of viable and
bankable energy efficiency markets for EE equipment/ appliances, green buildings and industrial sector
energy management, which is indispensable to convince private sector investors, namely, financial
institutions and establishments. In order to meet these objectives, it is important that flagship projects
shall be selected carefully in order to ensure their technical viability as well as financial profitability.
(2) Dissemination Stage
Dissemination stage will be implemented in order to facilitate the execution and nationwide
proliferation of the three EE&C policy measures. In this stage, participating financial institutions,
namely, banks and non-bank financial institutions including leasing companies and ESCOs (See BOX
1) are urged to provide finance for EE&C investments by end users. In order to make this stage
successful, the following activities need to be provided:
- Education of financial institutions (both executives and loan officers) on the economic benefits of
EE&C financing (based on the results of flagship projects), financial appraisals method of EE&C
projects taking into account the value of energy-saving benefits and the concept of life cycle costs
(see BOX 2)
- EE awareness-raising of establishments in industrial sector by introducing the economic benefits of
flagship projects, the concepts of simple payback period (see BOX 3) and life cycle costs
According to our survey, average EE improvement of 36% and 30% between 2015 and 2030 can be
expected in residential and industrial sector, respectively, considering the current levels of technology
in the country. Even under the current low energy prices there is obviously a huge energy saving
potential. Adequate financial incentives, therefore, will be needed to motivate financial institutions,
establishments in industrial sector, owners of buildings and the households to save energy which unless
otherwise will be wasted.
66
BOX 1 ESCO and quasi-ESCO services
ESCO (Energy Service Company) provides a comprehensive energy-saving services (including
provision of energy-saving solutions, instalment of EE equipment, maintenance and operation of
installed equipment). ESCO engages in a performance based contract with a client firm guaranteeing
certain level of energy efficiency (EE) improvements (i.e. reduction of energy consumption and/or
costs) and, in return, receives remuneration out of thus achieved energy savings.
The source of payments to such ESCO services derives from the energy-savings achieved, and the total
payment amount will be arranged so as not to exceed the client’s current total energy bill.
There are two major types of models in ESCO business: 1) the guaranteed savings mode in which
ESCOs provide clients with performance guarantees, but no financing; and 2) the shared savings model
in which ESCOs provide performance guarantees as well as financing.
In the former model, clients themselves procure funds from banks based on their credibility and make
repayments out of energy cost savings. And in the latter, energy cost savings will be split between the
client and ESCO based on a pre-determined rate. There are also cases where ESCOs are in alliance with
banks and leasing companies.
There also exists quasi-ESCO businesses to which no one provides performance guarantees, but
financial institutions (such as banks, leasing companies and ESCOs) agree to provide financing based
on cash flow expected to be generated from their energy-saving projects. In a quasi-ESCO project, a
client firm may enjoy an advantage of introducing EE equipment without any additional financial
burden, but at the same time, unlike an ordinary ESCO business, it will have no risk hedge against
underperformance due to incidents such as electricity price falls which make it impossible to achieve
expected energy cost reductions. In such a case it is important to involve well established and trusted
manufacturers which can provide high quality EE products with long warranty and good maintenance
services.
BOX 2 The concept of lifecycle cost (LCC) and EE product
The costs of ownership of an asset involve various costs throughout the useful life of the asset.
1) Initial purchase costs
2) Operation and maintenance (O&M) costs
3) Disposal costs
Especially when choosing over electric devices, one has to consider energy efficiency of the product,
since it will directly affect the costs of operation and maintenance through monthly energy bills.
Therefore, it is wise for all investors, business entities, government and the households, to always
consider the LCC when making a purchase decision. Highly energy efficient product may cost higher
at the initial purchase, however in the course of its useful life, O&M cost will be very small compared
to non-efficient products.
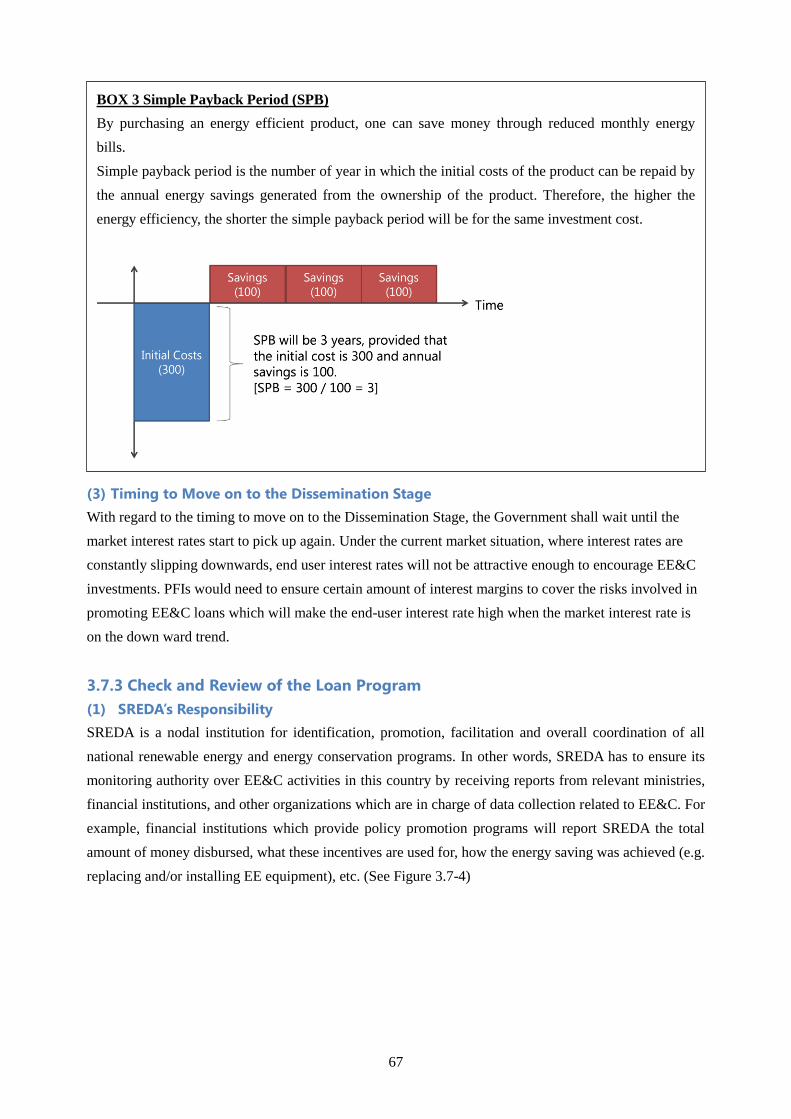
67
(3) Timing to Move on to the Dissemination Stage
With regard to the timing to move on to the Dissemination Stage, the Government shall wait until the
market interest rates start to pick up again. Under the current market situation, where interest rates are
constantly slipping downwards, end user interest rates will not be attractive enough to encourage EE&C
investments. PFIs would need to ensure certain amount of interest margins to cover the risks involved in
promoting EE&C loans which will make the end-user interest rate high when the market interest rate is
on the down ward trend.
3.7.3 Check and Review of the Loan Program
(1) SREDA’s Responsibility
SREDA is a nodal institution for identification, promotion, facilitation and overall coordination of all
national renewable energy and energy conservation programs. In other words, SREDA has to ensure its
monitoring authority over EE&C activities in this country by receiving reports from relevant ministries,
financial institutions, and other organizations which are in charge of data collection related to EE&C. For
example, financial institutions which provide policy promotion programs will report SREDA the total
amount of money disbursed, what these incentives are used for, how the energy saving was achieved (e.g.
replacing and/or installing EE equipment), etc. (See Figure 3.7-4)
BOX 3 Simple Payback Period (SPB)
By purchasing an energy efficient product, one can save money through reduced monthly energy
bills.
Simple payback period is the number of year in which the initial costs of the product can be repaid by
the annual energy savings generated from the ownership of the product. Therefore, the higher the
energy efficiency, the shorter the simple payback period will be for the same investment cost.
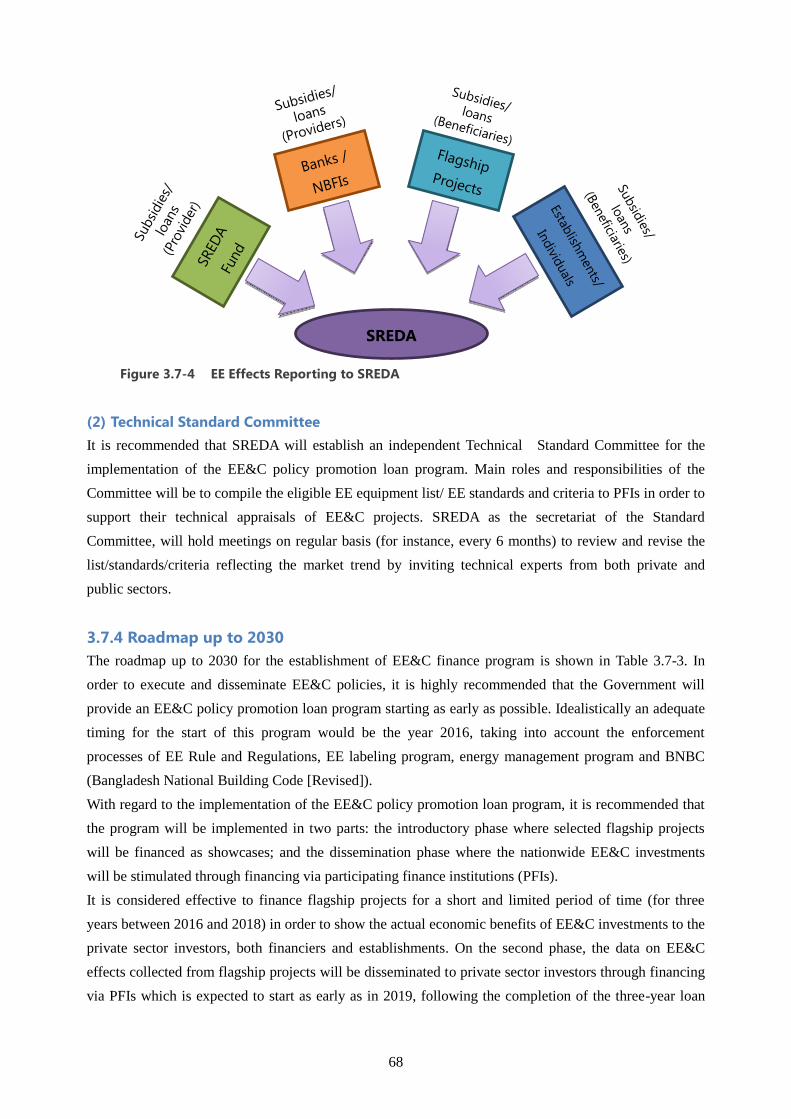
68
Figure 3.7-4 EE Effects Reporting to SREDA
(2) Technical Standard Committee
It is recommended that SREDA will establish an independent Technical Standard Committee for the
implementation of the EE&C policy promotion loan program. Main roles and responsibilities of the
Committee will be to compile the eligible EE equipment list/ EE standards and criteria to PFIs in order to
support their technical appraisals of EE&C projects. SREDA as the secretariat of the Standard
Committee, will hold meetings on regular basis (for instance, every 6 months) to review and revise the
list/standards/criteria reflecting the market trend by inviting technical experts from both private and
public sectors.
3.7.4 Roadmap up to 2030
The roadmap up to 2030 for the establishment of EE&C finance program is shown in Table 3.7-3. In
order to execute and disseminate EE&C policies, it is highly recommended that the Government will
provide an EE&C policy promotion loan program starting as early as possible. Idealistically an adequate
timing for the start of this program would be the year 2016, taking into account the enforcement
processes of EE Rule and Regulations, EE labeling program, energy management program and BNBC
(Bangladesh National Building Code [Revised]).
With regard to the implementation of the EE&C policy promotion loan program, it is recommended that
the program will be implemented in two parts: the introductory phase where selected flagship projects
will be financed as showcases; and the dissemination phase where the nationwide EE&C investments
will be stimulated through financing via participating finance institutions (PFIs).
It is considered effective to finance flagship projects for a short and limited period of time (for three
years between 2016 and 2018) in order to show the actual economic benefits of EE&C investments to the
private sector investors, both financiers and establishments. On the second phase, the data on EE&C
effects collected from flagship projects will be disseminated to private sector investors through financing
via PFIs which is expected to start as early as in 2019, following the completion of the three-year loan
SREDA
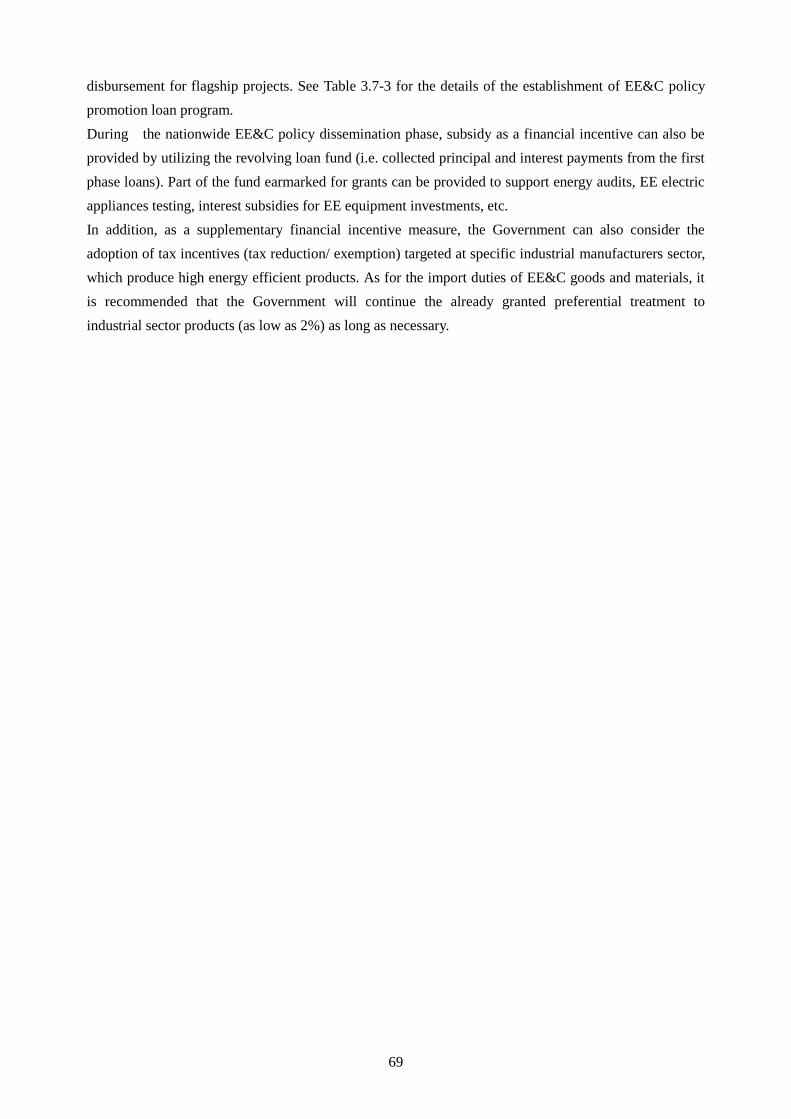
69
disbursement for flagship projects. See Table 3.7-3 for the details of the establishment of EE&C policy
promotion loan program.
During the nationwide EE&C policy dissemination phase, subsidy as a financial incentive can also be
provided by utilizing the revolving loan fund (i.e. collected principal and interest payments from the first
phase loans). Part of the fund earmarked for grants can be provided to support energy audits, EE electric
appliances testing, interest subsidies for EE equipment investments, etc.
In addition, as a supplementary financial incentive measure, the Government can also consider the
adoption of tax incentives (tax reduction/ exemption) targeted at specific industrial manufacturers sector,
which produce high energy efficient products. As for the import duties of EE&C goods and materials, it
is recommended that the Government will continue the already granted preferential treatment to
industrial sector products (as low as 2%) as long as necessary.
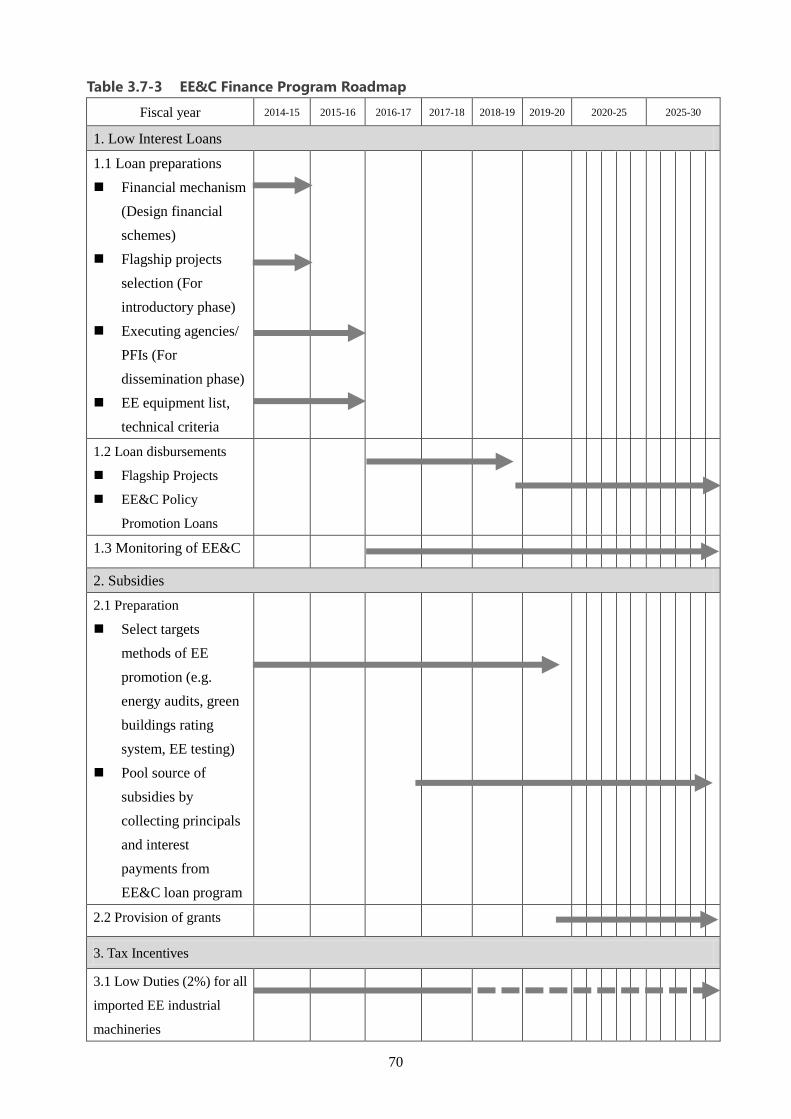
70
Table 3.7-3 EE&C Finance Program Roadmap
Fiscal year 2014-15 2015-16 2016-17 2017-18 2018-19 2019-20 2020-25 2025-30
1. Low Interest Loans
1.1 Loan preparations
Financial mechanism
(Design financial
schemes)
Flagship projects
selection (For
introductory phase)
Executing agencies/
PFIs (For
dissemination phase)
EE equipment list,
technical criteria
1.2 Loan disbursements
Flagship Projects
EE&C Policy
Promotion Loans
1.3 Monitoring of EE&C
2. Subsidies
2.1 Preparation
Select targets
methods of EE
promotion (e.g.
energy audits, green
buildings rating
system, EE testing)
Pool source of
subsidies by
collecting principals
and interest
payments from
EE&C loan program
2.2 Provision of grants
3. Tax Incentives
3.1 Low Duties (2%) for all
imported EE industrial
machineries
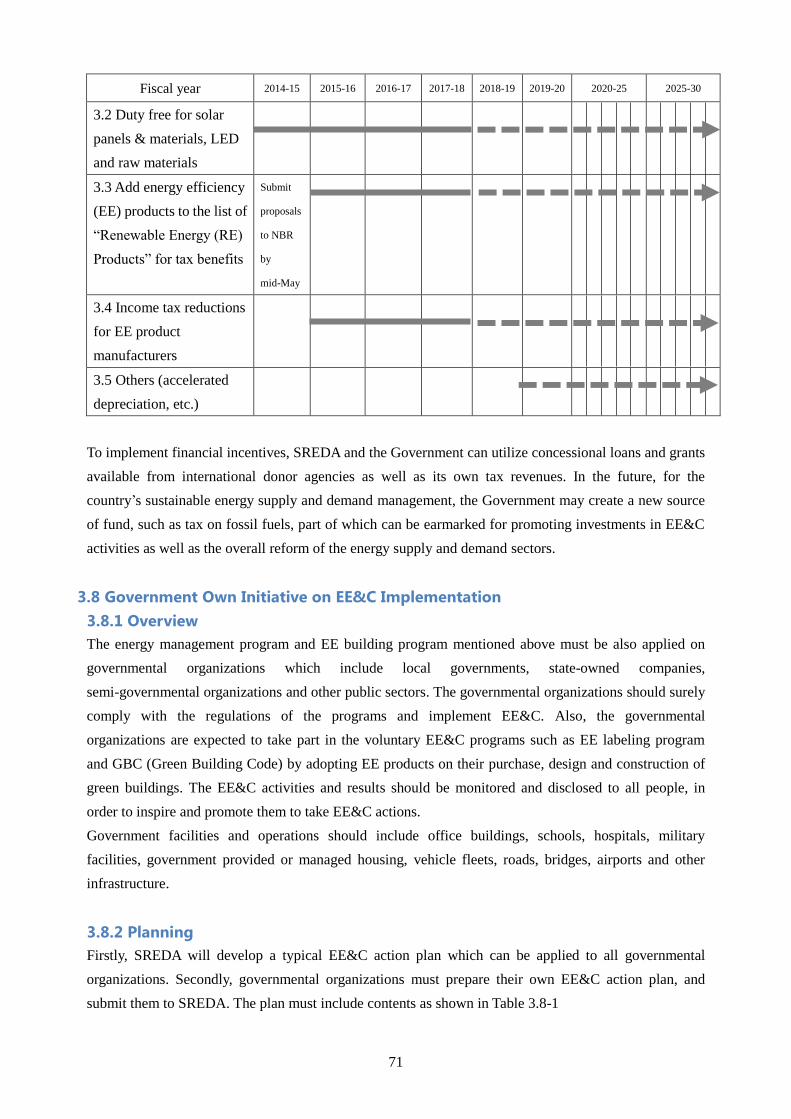
71
Fiscal year 2014-15 2015-16 2016-17 2017-18 2018-19 2019-20 2020-25 2025-30
3.2 Duty free for solar
panels & materials, LED
and raw materials
3.3 Add energy efficiency
(EE) products to the list of
“Renewable Energy (RE)
Products” for tax benefits
Submit
proposals
to NBR
by
mid-May
3.4 Income tax reductions
for EE product
manufacturers
3.5 Others (accelerated
depreciation, etc.)
To implement financial incentives, SREDA and the Government can utilize concessional loans and grants
available from international donor agencies as well as its own tax revenues. In the future, for the
country’s sustainable energy supply and demand management, the Government may create a new source
of fund, such as tax on fossil fuels, part of which can be earmarked for promoting investments in EE&C
activities as well as the overall reform of the energy supply and demand sectors.
3.8 Government Own Initiative on EE&C Implementation
3.8.1 Overview
The energy management program and EE building program mentioned above must be also applied on
governmental organizations which include local governments, state-owned companies,
semi-governmental organizations and other public sectors. The governmental organizations should surely
comply with the regulations of the programs and implement EE&C. Also, the governmental
organizations are expected to take part in the voluntary EE&C programs such as EE labeling program
and GBC (Green Building Code) by adopting EE products on their purchase, design and construction of
green buildings. The EE&C activities and results should be monitored and disclosed to all people, in
order to inspire and promote them to take EE&C actions.
Government facilities and operations should include office buildings, schools, hospitals, military
facilities, government provided or managed housing, vehicle fleets, roads, bridges, airports and other
infrastructure.
3.8.2 Planning
Firstly, SREDA will develop a typical EE&C action plan which can be applied to all governmental
organizations. Secondly, governmental organizations must prepare their own EE&C action plan, and
submit them to SREDA. The plan must include contents as shown in Table 3.8-1
72
Table 3.8-1 Governmental organizations’ EE&C Action Plan (examples of contents)
Item Contents, example
EE&C target Annual energy consumption, unit energy consumption per production,
etc.
Energy management Appointment of energy manager
Monitoring Energy consumption data collection mechanism
Check and review Formulation of third party committee
Action plan EE&C actions which are customized for each organization:
Use of buildings, vehicle, office automation machine, etc.
Capacity development,
awareness, training Periodical implementation
Procurement, outsourcing Consideration of EE&C and life-cycle on procurement and outsourcing
Other Accreditation of ISO14000, ISO50001 by organization
3.8.3 EE&C Implementation
The governmental organizations must conduct EE&C actions according to the plan, and make efforts to
achieve the EE&C target.
3.8.4 Monitoring, Reporting and Disclosure
Governmental organizations must report their monitoring result on the EE&C action, and disclose it to
the public annually. SREDA will analyze the reports. When some negligence on EE&C implementation
is found, it must give necessary instruction to the governmental organizations.
3.8.5 Support Services by SREDA
SREDA will provide information on energy efficient products recommended for government
procurement, energy efficient design features for new buildings, good practices for energy management
and retrofit, and or advisory services for EE&C planning and implementation including energy audits.
3.8.6 Check and Review of the Program
Check and review of the program must be done by the governmental organizations individually. SREDA
will check and review nationwide performance of the Government own EE&C initiative.
3.8.7 Roadmap up to 2030
As shown in “Phase 1”, SREDA and the governmental organizations must start the program. Table
3.8-2 shows the roadmap of the program implementation for the governmental organizations up to 2030.
Table3.8-3 shows the targeted implementation ratio by program.
Table 3.8-2 Program Implementation for Governmental organizations Roadmap
Fiscal year 2014-15 2015-16 2016-17 2017-18 2018-19 2019-20 2020-25 2025-30
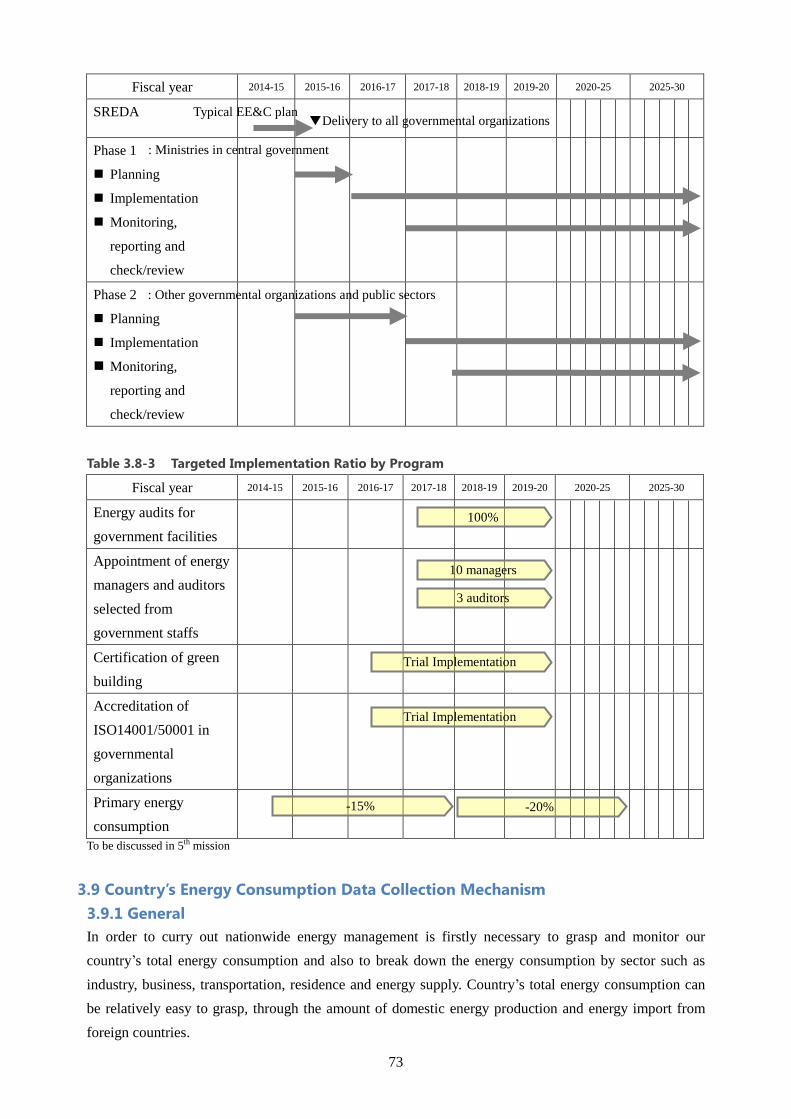
73
Fiscal year 2014-15 2015-16 2016-17 2017-18 2018-19 2019-20 2020-25 2025-30
SREDA
Phase 1
Planning
Implementation
Monitoring,
reporting and
check/review
Phase 2
Planning
Implementation
Monitoring,
reporting and
check/review
Table 3.8-3 Targeted Implementation Ratio by Program
Fiscal year 2014-15 2015-16 2016-17 2017-18 2018-19 2019-20 2020-25 2025-30
Energy audits for
government facilities
Appointment of energy
managers and auditors
selected from
government staffs
Certification of green
building
Accreditation of
ISO14001/50001 in
governmental
organizations
Primary energy
consumption
To be discussed in 5th mission
3.9 Country’s Energy Consumption Data Collection Mechanism
3.9.1 General
In order to curry out nationwide energy management is firstly necessary to grasp and monitor our
country’s total energy consumption and also to break down the energy consumption by sector such as
industry, business, transportation, residence and energy supply. Country’s total energy consumption can
be relatively easy to grasp, through the amount of domestic energy production and energy import from
foreign countries.
▼Delivery to all governmental organizations Typical EE&C plan
: Ministries in central government
: Other governmental organizations and public sectors
100%
10 managers
3 auditors
Trial Implementation
Trial Implementation
-15% -20%
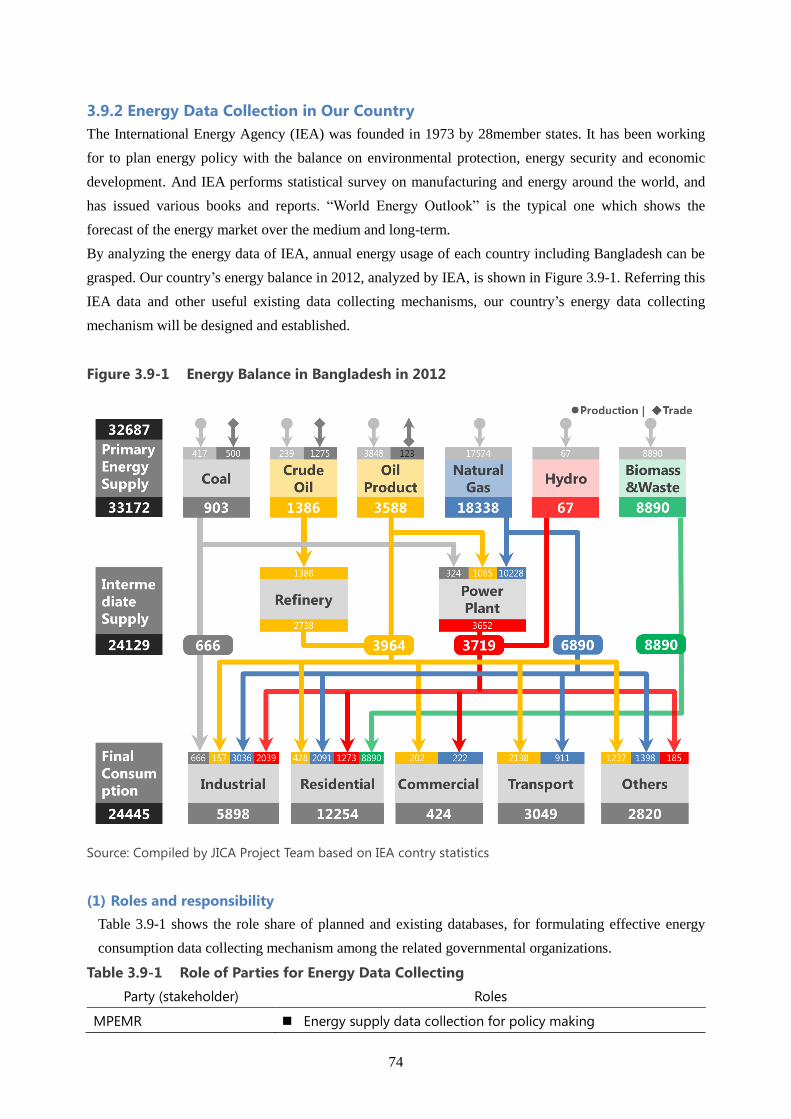
74
3.9.2 Energy Data Collection in Our Country
The International Energy Agency (IEA) was founded in 1973 by 28member states. It has been working
for to plan energy policy with the balance on environmental protection, energy security and economic
development. And IEA performs statistical survey on manufacturing and energy around the world, and
has issued various books and reports. “World Energy Outlook” is the typical one which shows the
forecast of the energy market over the medium and long-term.
By analyzing the energy data of IEA, annual energy usage of each country including Bangladesh can be
grasped. Our country’s energy balance in 2012, analyzed by IEA, is shown in Figure 3.9-1. Referring this
IEA data and other useful existing data collecting mechanisms, our country’s energy data collecting
mechanism will be designed and established.
Figure 3.9-1 Energy Balance in Bangladesh in 2012
Source: Compiled by JICA Project Team based on IEA contry statistics
(1) Roles and responsibility
Table 3.9-1 shows the role share of planned and existing databases, for formulating effective energy
consumption data collecting mechanism among the related governmental organizations.
Table 3.9-1 Role of Parties for Energy Data Collecting
Party (stakeholder) Roles
MPEMR Energy supply data collection for policy making
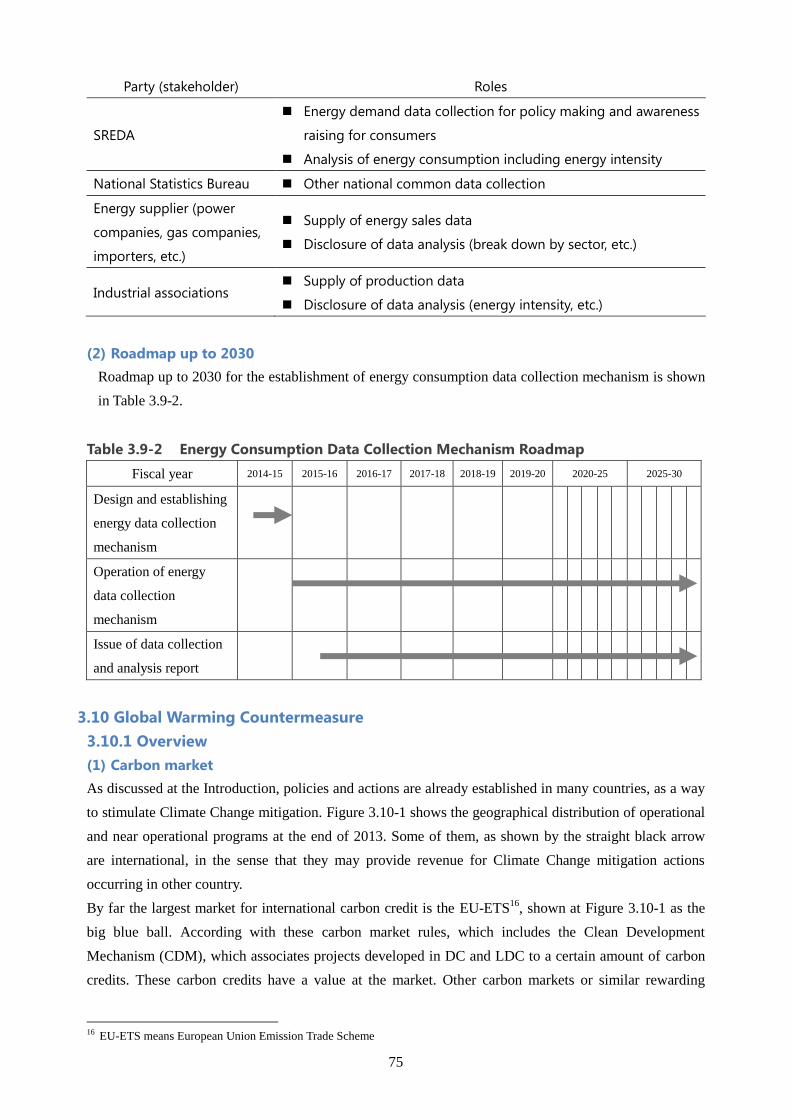
75
Party (stakeholder) Roles
SREDA
Energy demand data collection for policy making and awareness
raising for consumers
Analysis of energy consumption including energy intensity
National Statistics Bureau Other national common data collection
Energy supplier (power
companies, gas companies,
importers, etc.)
Supply of energy sales data
Disclosure of data analysis (break down by sector, etc.)
Industrial associations Supply of production data
Disclosure of data analysis (energy intensity, etc.)
(2) Roadmap up to 2030
Roadmap up to 2030 for the establishment of energy consumption data collection mechanism is shown
in Table 3.9-2.
Table 3.9-2 Energy Consumption Data Collection Mechanism Roadmap
Fiscal year 2014-15 2015-16 2016-17 2017-18 2018-19 2019-20 2020-25 2025-30
Design and establishing
energy data collection
mechanism
Operation of energy
data collection
mechanism
Issue of data collection
and analysis report
3.10 Global Warming Countermeasure
3.10.1 Overview
(1) Carbon market
As discussed at the Introduction, policies and actions are already established in many countries, as a way
to stimulate Climate Change mitigation. Figure 3.10-1 shows the geographical distribution of operational
and near operational programs at the end of 2013. Some of them, as shown by the straight black arrow
are international, in the sense that they may provide revenue for Climate Change mitigation actions
occurring in other country.
By far the largest market for international carbon credit is the EU-ETS16
, shown at Figure 3.10-1 as the
big blue ball. According with these carbon market rules, which includes the Clean Development
Mechanism (CDM), which associates projects developed in DC and LDC to a certain amount of carbon
credits. These carbon credits have a value at the market. Other carbon markets or similar rewarding
16 EU-ETS means European Union Emission Trade Scheme
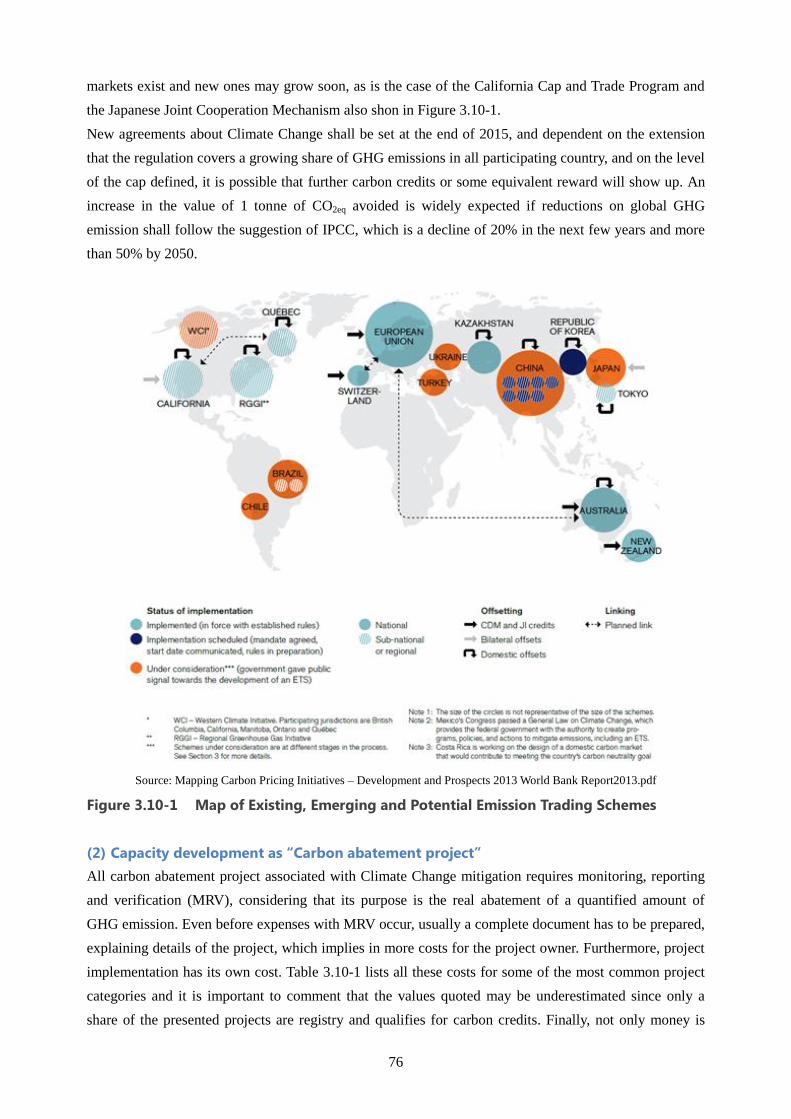
76
markets exist and new ones may grow soon, as is the case of the California Cap and Trade Program and
the Japanese Joint Cooperation Mechanism also shon in Figure 3.10-1.
New agreements about Climate Change shall be set at the end of 2015, and dependent on the extension
that the regulation covers a growing share of GHG emissions in all participating country, and on the level
of the cap defined, it is possible that further carbon credits or some equivalent reward will show up. An
increase in the value of 1 tonne of CO2eq avoided is widely expected if reductions on global GHG
emission shall follow the suggestion of IPCC, which is a decline of 20% in the next few years and more
than 50% by 2050.
Source: Mapping Carbon Pricing Initiatives – Development and Prospects 2013 World Bank Report2013.pdf
Figure 3.10-1 Map of Existing, Emerging and Potential Emission Trading Schemes
(2) Capacity development as “Carbon abatement project”
All carbon abatement project associated with Climate Change mitigation requires monitoring, reporting
and verification (MRV), considering that its purpose is the real abatement of a quantified amount of
GHG emission. Even before expenses with MRV occur, usually a complete document has to be prepared,
explaining details of the project, which implies in more costs for the project owner. Furthermore, project
implementation has its own cost. Table 3.10-1 lists all these costs for some of the most common project
categories and it is important to comment that the values quoted may be underestimated since only a
share of the presented projects are registry and qualifies for carbon credits. Finally, not only money is
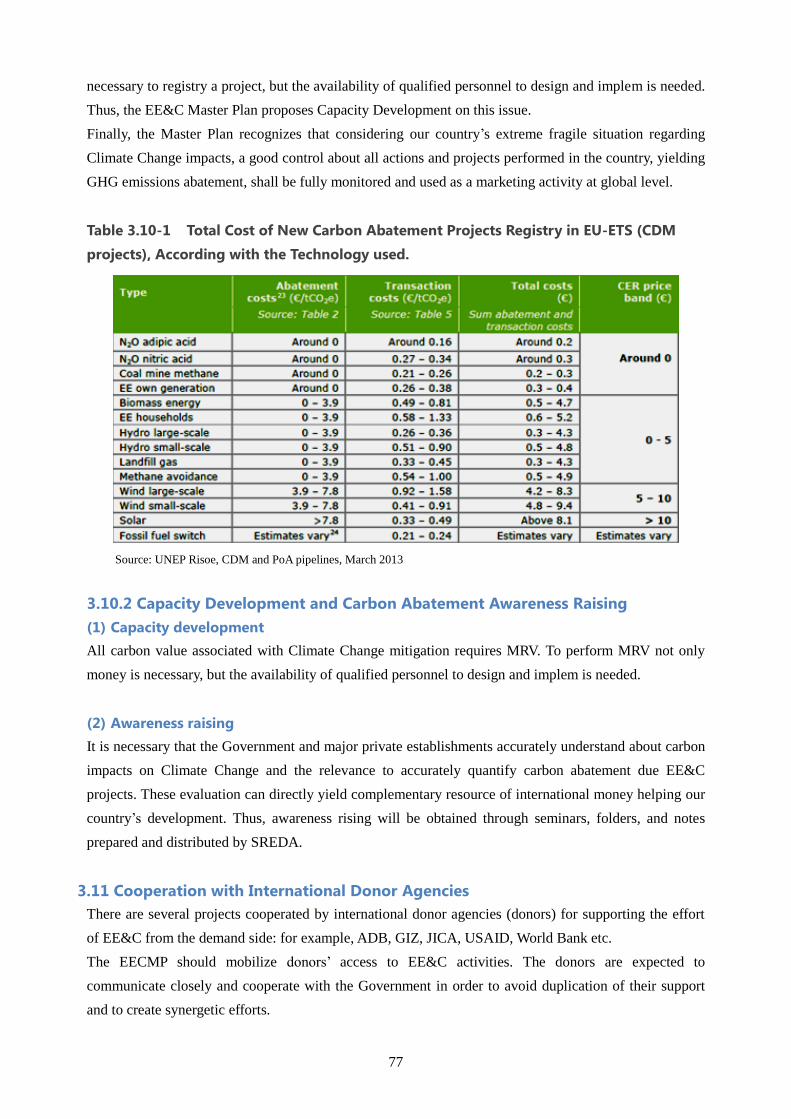
77
necessary to registry a project, but the availability of qualified personnel to design and implem is needed.
Thus, the EE&C Master Plan proposes Capacity Development on this issue.
Finally, the Master Plan recognizes that considering our country’s extreme fragile situation regarding
Climate Change impacts, a good control about all actions and projects performed in the country, yielding
GHG emissions abatement, shall be fully monitored and used as a marketing activity at global level.
Table 3.10-1 Total Cost of New Carbon Abatement Projects Registry in EU-ETS (CDM
projects), According with the Technology used.
Source: UNEP Risoe, CDM and PoA pipelines, March 2013
3.10.2 Capacity Development and Carbon Abatement Awareness Raising
(1) Capacity development
All carbon value associated with Climate Change mitigation requires MRV. To perform MRV not only
money is necessary, but the availability of qualified personnel to design and implem is needed.
(2) Awareness raising
It is necessary that the Government and major private establishments accurately understand about carbon
impacts on Climate Change and the relevance to accurately quantify carbon abatement due EE&C
projects. These evaluation can directly yield complementary resource of international money helping our
country’s development. Thus, awareness rising will be obtained through seminars, folders, and notes
prepared and distributed by SREDA.
3.11 Cooperation with International Donor Agencies
There are several projects cooperated by international donor agencies (donors) for supporting the effort
of EE&C from the demand side: for example, ADB, GIZ, JICA, USAID, World Bank etc.
The EECMP should mobilize donors’ access to EE&C activities. The donors are expected to
communicate closely and cooperate with the Government in order to avoid duplication of their support
and to create synergetic efforts.
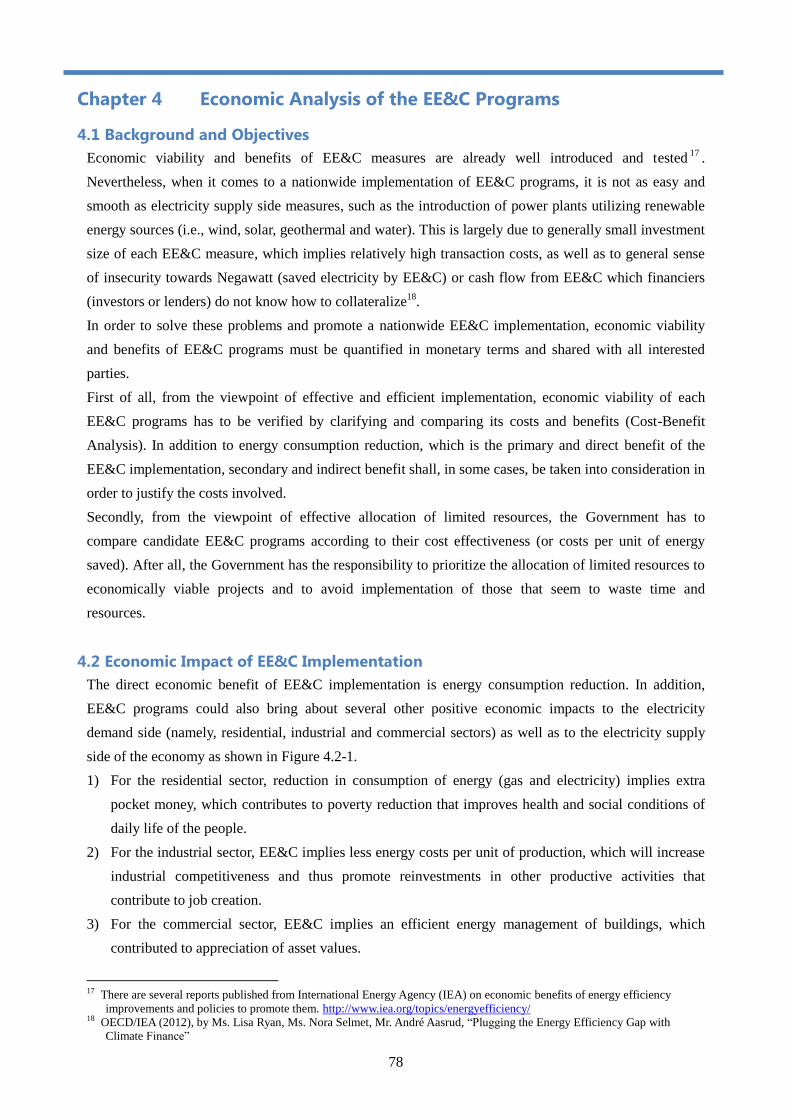
78
Chapter 4 Economic Analysis of the EE&C Programs
4.1 Background and Objectives
Economic viability and benefits of EE&C measures are already well introduced and tested17
.
Nevertheless, when it comes to a nationwide implementation of EE&C programs, it is not as easy and
smooth as electricity supply side measures, such as the introduction of power plants utilizing renewable
energy sources (i.e., wind, solar, geothermal and water). This is largely due to generally small investment
size of each EE&C measure, which implies relatively high transaction costs, as well as to general sense
of insecurity towards Negawatt (saved electricity by EE&C) or cash flow from EE&C which financiers
(investors or lenders) do not know how to collateralize18
.
In order to solve these problems and promote a nationwide EE&C implementation, economic viability
and benefits of EE&C programs must be quantified in monetary terms and shared with all interested
parties.
First of all, from the viewpoint of effective and efficient implementation, economic viability of each
EE&C programs has to be verified by clarifying and comparing its costs and benefits (Cost-Benefit
Analysis). In addition to energy consumption reduction, which is the primary and direct benefit of the
EE&C implementation, secondary and indirect benefit shall, in some cases, be taken into consideration in
order to justify the costs involved.
Secondly, from the viewpoint of effective allocation of limited resources, the Government has to
compare candidate EE&C programs according to their cost effectiveness (or costs per unit of energy
saved). After all, the Government has the responsibility to prioritize the allocation of limited resources to
economically viable projects and to avoid implementation of those that seem to waste time and
resources.
4.2 Economic Impact of EE&C Implementation
The direct economic benefit of EE&C implementation is energy consumption reduction. In addition,
EE&C programs could also bring about several other positive economic impacts to the electricity
demand side (namely, residential, industrial and commercial sectors) as well as to the electricity supply
side of the economy as shown in Figure 4.2-1.
1) For the residential sector, reduction in consumption of energy (gas and electricity) implies extra
pocket money, which contributes to poverty reduction that improves health and social conditions of
daily life of the people.
2) For the industrial sector, EE&C implies less energy costs per unit of production, which will increase
industrial competitiveness and thus promote reinvestments in other productive activities that
contribute to job creation.
3) For the commercial sector, EE&C implies an efficient energy management of buildings, which
contributed to appreciation of asset values.
17 There are several reports published from International Energy Agency (IEA) on economic benefits of energy efficiency
improvements and policies to promote them. http://www.iea.org/topics/energyefficiency/ 18 OECD/IEA (2012), by Ms. Lisa Ryan, Ms. Nora Selmet, Mr. André Aasrud, “Plugging the Energy Efficiency Gap with
Climate Finance”
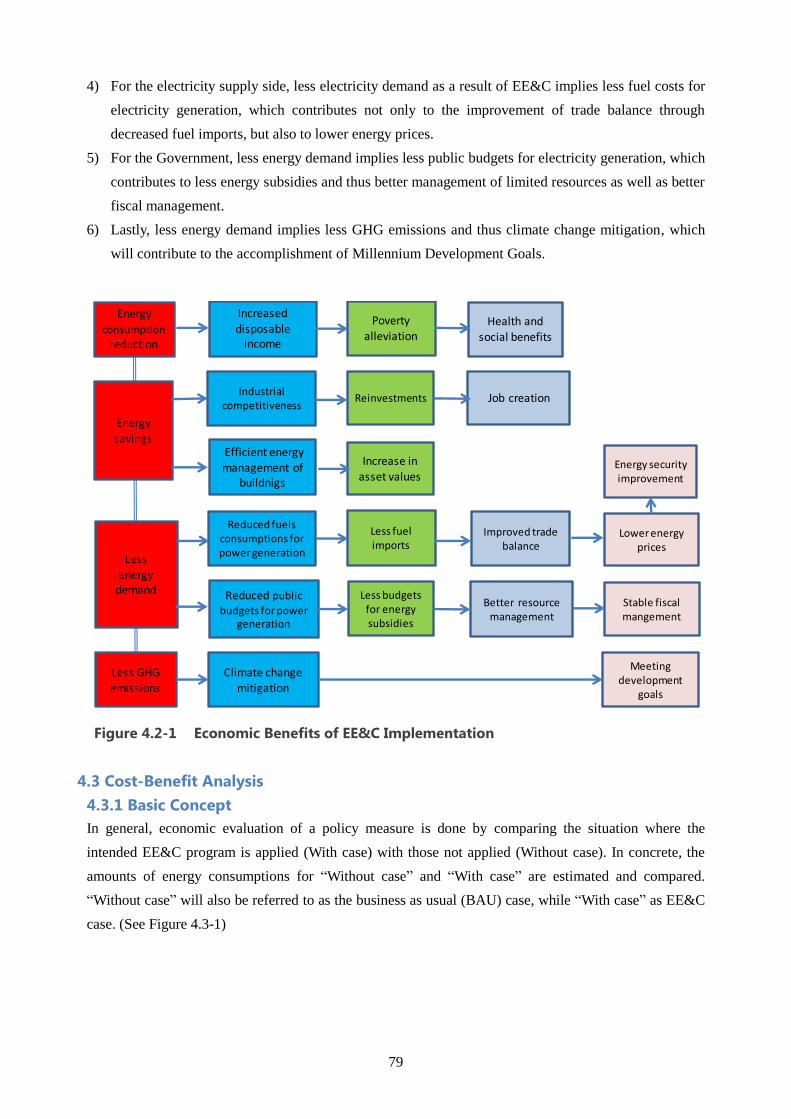
79
4) For the electricity supply side, less electricity demand as a result of EE&C implies less fuel costs for
electricity generation, which contributes not only to the improvement of trade balance through
decreased fuel imports, but also to lower energy prices.
5) For the Government, less energy demand implies less public budgets for electricity generation, which
contributes to less energy subsidies and thus better management of limited resources as well as better
fiscal management.
6) Lastly, less energy demand implies less GHG emissions and thus climate change mitigation, which
will contribute to the accomplishment of Millennium Development Goals.
Figure 4.2-1 Economic Benefits of EE&C Implementation
4.3 Cost-Benefit Analysis
4.3.1 Basic Concept
In general, economic evaluation of a policy measure is done by comparing the situation where the
intended EE&C program is applied (With case) with those not applied (Without case). In concrete, the
amounts of energy consumptions for “Without case” and “With case” are estimated and compared.
“Without case” will also be referred to as the business as usual (BAU) case, while “With case” as EE&C
case. (See Figure 4.3-1)
Energy consumption
reduction
Increased disposable
income
Poverty alleviation
Energy savings
Energy securityimprovement
Industrialcompetitiveness
Climate change
mitigation
Lessenergy
demand
Lower energy prices
Better resource management
Meetingdevelopment
goals
Reduced public
budgets for power generation
Health and social benefits
Job creation
Increase in asset values
Reduced fuels consumptions forpower generation
Reinvestments
Efficient energy
management of buildnigs
Less GHG
emissions
Stable fiscalmangement
Less fuelimports
Less budgets for energy subsidies
Improved trade balance
80
Figure 4.3-1 With (EE&C) vs. Without (BAU) Comparison (Image)
4.3.2 Calculation Method and Data
How do you quantify EE&C programs? In principle, due to data limitations, each program will be
independently quantified according to its data availability. In one case where time series data is available,
energy consumption data before and after the adoption of the target EE&C program can be calculated
and compared. In the other case where the target beneficiary (end user) is clearly focused, energy
consumption of target and non-target beneficiaries can be calculated and compared.
As a matter of fact, all EE&C programs to be implemented under this MP are new and to be introduced
for the first time in our country. Since there is no time sequential data available from the past, target vs.
non-target comparisons will be conducted for the economic evaluation of each EE&C program. Publicly
disclosed statistics and data will be utilized for the evaluation; and in some cases where adequate data is
not available, raw data must also be collected independently through sample surveys.
4.3.3 Secondary and Indirect Economic Benefits
The primary and direct economic benefit of EE&C programs is energy savings or economic value of
reduced amount of energy consumption. This can be calculated by multiplying the total reduced amount
of energy consumptions (converted into toe) by the unit price of energy (BDT/ toe).
In the country where energy prices (gas and electricity prices) are politically subsidized and kept lower
than the market prices, however, direct economic benefit is sometimes not enough to cover the costs of
the target policy measure. In such a case, secondary and indirect economic benefits (such as those listed
in Figure 4.2-1) have to be taken into account in the calculation of economic benefits so as to justify
economic viability of the target EE&C program.
4.3.4 Identification of Cost and Benefit Factors
As the first step to quantify economic viability and benefits of EE&C programs, both cost and benefit
factors must be identified and listed up. (See Table 4.3-1) In general, economic evaluation of regulatory
measures (such as energy management, EE labeling and EE building) face more difficulty in identifying
2015 2020 2025 2030
Without (BAU) case With (EE&C) case
Energy savings: Energy consumption difference between With & Without cases
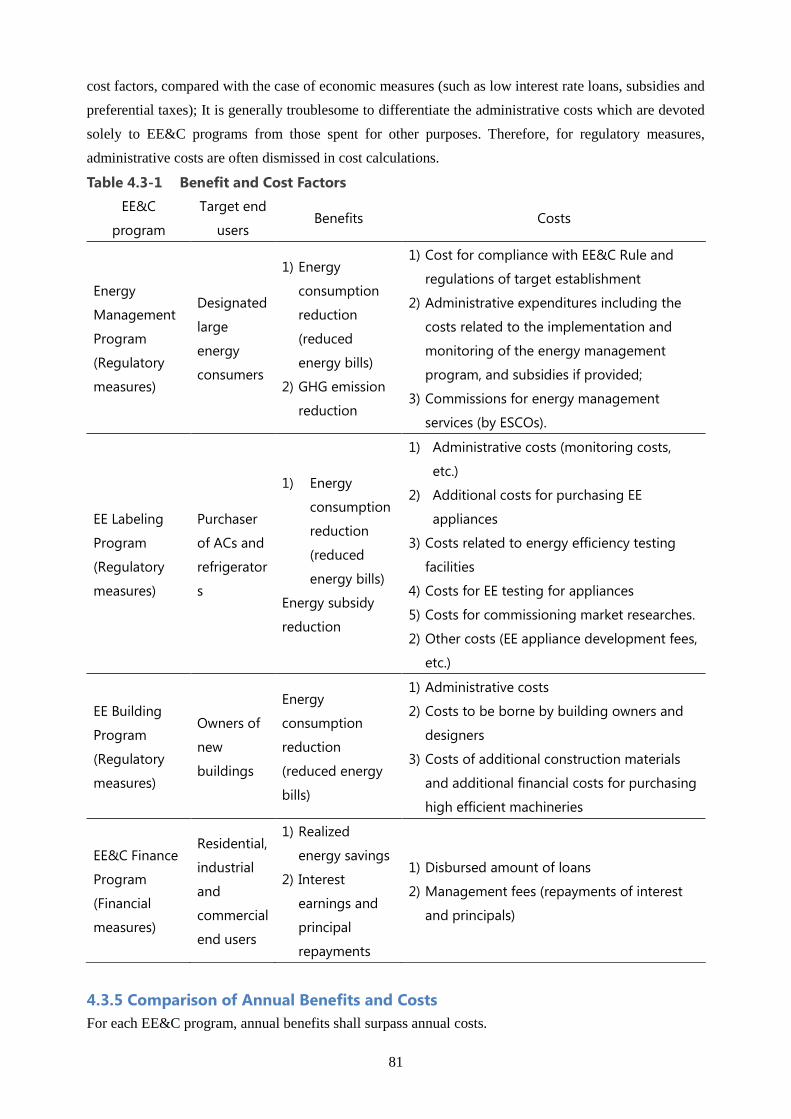
81
cost factors, compared with the case of economic measures (such as low interest rate loans, subsidies and
preferential taxes); It is generally troublesome to differentiate the administrative costs which are devoted
solely to EE&C programs from those spent for other purposes. Therefore, for regulatory measures,
administrative costs are often dismissed in cost calculations.
Table 4.3-1 Benefit and Cost Factors
EE&C
program
Target end
users Benefits Costs
Energy
Management
Program
(Regulatory
measures)
Designated
large
energy
consumers
1) Energy
consumption
reduction
(reduced
energy bills)
2) GHG emission
reduction
1) Cost for compliance with EE&C Rule and
regulations of target establishment
2) Administrative expenditures including the
costs related to the implementation and
monitoring of the energy management
program, and subsidies if provided;
3) Commissions for energy management
services (by ESCOs).
EE Labeling
Program
(Regulatory
measures)
Purchaser
of ACs and
refrigerator
s
1) Energy
consumption
reduction
(reduced
energy bills)
Energy subsidy
reduction
1) Administrative costs (monitoring costs,
etc.)
2) Additional costs for purchasing EE
appliances
3) Costs related to energy efficiency testing
facilities
4) Costs for EE testing for appliances
5) Costs for commissioning market researches.
2) Other costs (EE appliance development fees,
etc.)
EE Building
Program
(Regulatory
measures)
Owners of
new
buildings
Energy
consumption
reduction
(reduced energy
bills)
1) Administrative costs
2) Costs to be borne by building owners and
designers
3) Costs of additional construction materials
and additional financial costs for purchasing
high efficient machineries
EE&C Finance
Program
(Financial
measures)
Residential,
industrial
and
commercial
end users
1) Realized
energy savings
2) Interest
earnings and
principal
repayments
1) Disbursed amount of loans
2) Management fees (repayments of interest
and principals)
4.3.5 Comparison of Annual Benefits and Costs
For each EE&C program, annual benefits shall surpass annual costs.
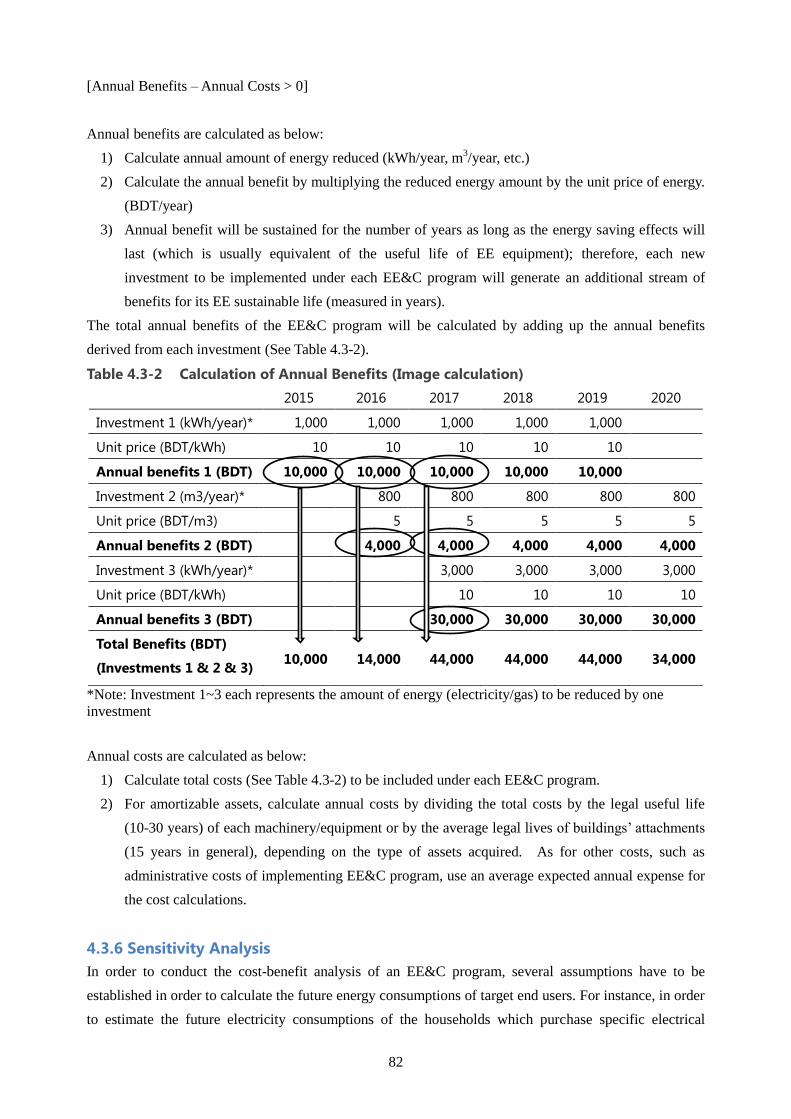
82
[Annual Benefits – Annual Costs > 0]
Annual benefits are calculated as below:
1) Calculate annual amount of energy reduced (kWh/year, m3/year, etc.)
2) Calculate the annual benefit by multiplying the reduced energy amount by the unit price of energy.
(BDT/year)
3) Annual benefit will be sustained for the number of years as long as the energy saving effects will
last (which is usually equivalent of the useful life of EE equipment); therefore, each new
investment to be implemented under each EE&C program will generate an additional stream of
benefits for its EE sustainable life (measured in years).
The total annual benefits of the EE&C program will be calculated by adding up the annual benefits
derived from each investment (See Table 4.3-2).
Table 4.3-2 Calculation of Annual Benefits (Image calculation)
2015 2016 2017 2018 2019 2020
Investment 1 (kWh/year)* 1,000 1,000 1,000 1,000 1,000
Unit price (BDT/kWh) 10 10 10 10 10
Annual benefits 1 (BDT) 10,000 10,000 10,000 10,000 10,000
Investment 2 (m3/year)* 800 800 800 800 800
Unit price (BDT/m3) 5 5 5 5 5
Annual benefits 2 (BDT) 4,000 4,000 4,000 4,000 4,000
Investment 3 (kWh/year)* 3,000 3,000 3,000 3,000
Unit price (BDT/kWh) 10 10 10 10
Annual benefits 3 (BDT) 30,000 30,000 30,000 30,000
Total Benefits (BDT)
(Investments 1 & 2 & 3) 10,000 14,000 44,000 44,000 44,000 34,000
*Note: Investment 1~3 each represents the amount of energy (electricity/gas) to be reduced by one
investment
Annual costs are calculated as below:
1) Calculate total costs (See Table 4.3-2) to be included under each EE&C program.
2) For amortizable assets, calculate annual costs by dividing the total costs by the legal useful life
(10-30 years) of each machinery/equipment or by the average legal lives of buildings’ attachments
(15 years in general), depending on the type of assets acquired. As for other costs, such as
administrative costs of implementing EE&C program, use an average expected annual expense for
the cost calculations.
4.3.6 Sensitivity Analysis
In order to conduct the cost-benefit analysis of an EE&C program, several assumptions have to be
established in order to calculate the future energy consumptions of target end users. For instance, in order
to estimate the future electricity consumptions of the households which purchase specific electrical
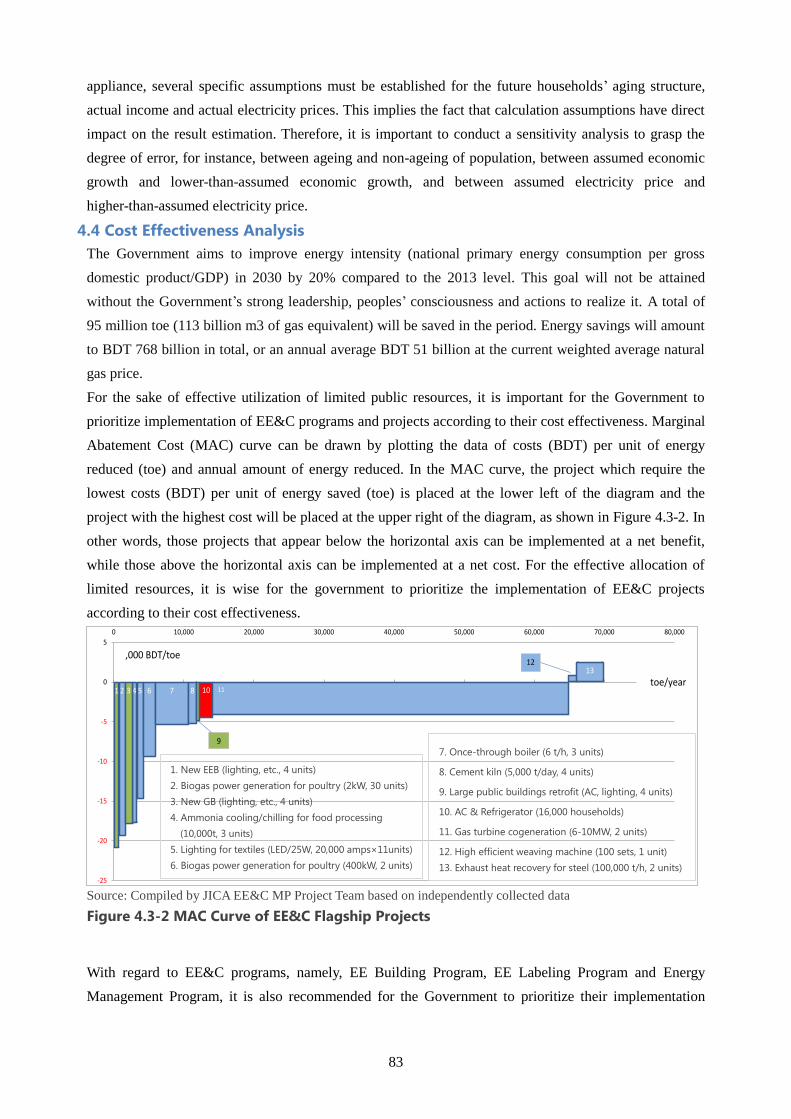
83
appliance, several specific assumptions must be established for the future households’ aging structure,
actual income and actual electricity prices. This implies the fact that calculation assumptions have direct
impact on the result estimation. Therefore, it is important to conduct a sensitivity analysis to grasp the
degree of error, for instance, between ageing and non-ageing of population, between assumed economic
growth and lower-than-assumed economic growth, and between assumed electricity price and
higher-than-assumed electricity price.
4.4 Cost Effectiveness Analysis
The Government aims to improve energy intensity (national primary energy consumption per gross
domestic product/GDP) in 2030 by 20% compared to the 2013 level. This goal will not be attained
without the Government’s strong leadership, peoples’ consciousness and actions to realize it. A total of
95 million toe (113 billion m3 of gas equivalent) will be saved in the period. Energy savings will amount
to BDT 768 billion in total, or an annual average BDT 51 billion at the current weighted average natural
gas price.
For the sake of effective utilization of limited public resources, it is important for the Government to
prioritize implementation of EE&C programs and projects according to their cost effectiveness. Marginal
Abatement Cost (MAC) curve can be drawn by plotting the data of costs (BDT) per unit of energy
reduced (toe) and annual amount of energy reduced. In the MAC curve, the project which require the
lowest costs (BDT) per unit of energy saved (toe) is placed at the lower left of the diagram and the
project with the highest cost will be placed at the upper right of the diagram, as shown in Figure 4.3-2. In
other words, those projects that appear below the horizontal axis can be implemented at a net benefit,
while those above the horizontal axis can be implemented at a net cost. For the effective allocation of
limited resources, it is wise for the government to prioritize the implementation of EE&C projects
according to their cost effectiveness.
Source: Compiled by JICA EE&C MP Project Team based on independently collected data
Figure 4.3-2 MAC Curve of EE&C Flagship Projects
With regard to EE&C programs, namely, EE Building Program, EE Labeling Program and Energy
Management Program, it is also recommended for the Government to prioritize their implementation
-25
-20
-15
-10
-5
0
5
0 10,000 20,000 30,000 40,000 50,000 60,000 70,000 80,000
,000 BDT/toe
toe/year1 2 4 5 6 7 8
13
113 10
9
12
1. New EEB (lighting, etc., 4 units)
2. Biogas power generation for poultry (2kW, 30 units)
3. New GB (lighting, etc., 4 units)
4. Ammonia cooling/chilling for food processing
(10,000t, 3 units)
5. Lighting for textiles (LED/25W, 20,000 amps×11units)
6. Biogas power generation for poultry (400kW, 2 units)
7. Once-through boiler (6 t/h, 3 units)
8. Cement kiln (5,000 t/day, 4 units)
9. Large public buildings retrofit (AC, lighting, 4 units)
10. AC & Refrigerator (16,000 households)
11. Gas turbine cogeneration (6-10MW, 2 units)
12. High efficient weaving machine (100 sets, 1 unit)
13. Exhaust heat recovery for steel (100,000 t/h, 2 units)

84
according to their cost effectiveness. Most of the projects to be promoted under these three Programs are
cost effective and can be implemented with a net benefit..
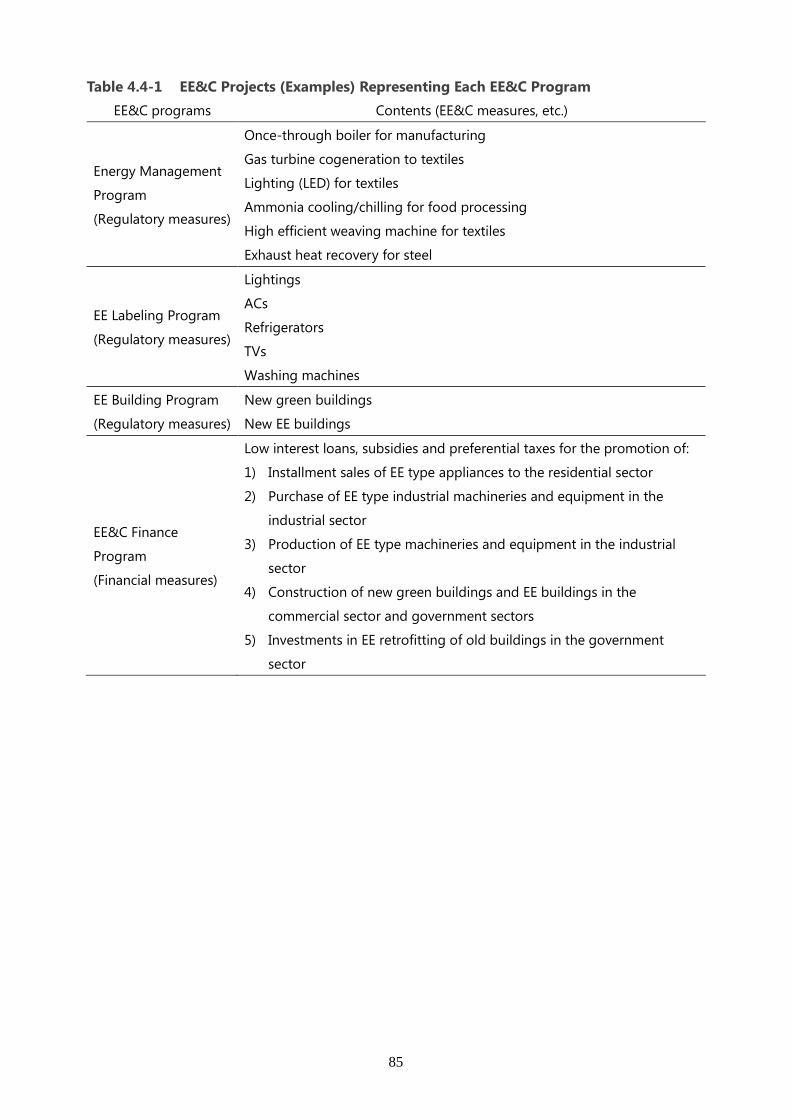
85
Table 4.4-1 EE&C Projects (Examples) Representing Each EE&C Program
EE&C programs Contents (EE&C measures, etc.)
Energy Management
Program
(Regulatory measures)
Once-through boiler for manufacturing
Gas turbine cogeneration to textiles
Lighting (LED) for textiles
Ammonia cooling/chilling for food processing
High efficient weaving machine for textiles
Exhaust heat recovery for steel
EE Labeling Program
(Regulatory measures)
Lightings
ACs
Refrigerators
TVs
Washing machines
EE Building Program
(Regulatory measures)
New green buildings
New EE buildings
EE&C Finance
Program
(Financial measures)
Low interest loans, subsidies and preferential taxes for the promotion of:
1) Installment sales of EE type appliances to the residential sector
2) Purchase of EE type industrial machineries and equipment in the
industrial sector
3) Production of EE type machineries and equipment in the industrial
sector
4) Construction of new green buildings and EE buildings in the
commercial sector and government sectors
5) Investments in EE retrofitting of old buildings in the government
sector
86
Chapter 5 Capacity Development and EE&C Awareness Raising
5.1 Overview
5.1.1 Roles of the Government on capacity development and awareness raising
Initially, the Government should lead and have a responsibility for capacity development and awareness
raising to promote EE&C. Besides considering the importance of EE&C for our country, such roles are to
be taken not only by the Government but also by relevant private sectors, NPO/NGO, individuals and
other entities. Thus nationwide structure for EE&C awareness raising has to be formulated.
5.1.2 Capacity development
For EE&C implementation, capacity development for governmental organizations, private sectors and
energy experts is needed. It is important to cooperate with related organizations and programs to
implement these activities effectively.
5.1.3 Awareness raising
It is necessary that all the people accurately understand about the energy and natural resource issues, for
nationwide EE&C implementation. In order to realize this, the Government should promote an awareness
raising and information provision for all stakeholders more effectively. The final goal is that all the
people and establishment take voluntary EE&C actions.
5.2 Roles of the Government on Capacity Development and Awareness Raising
SREDA should be the leading agency on capacity development and awareness raising. It carries out the
following roles and actions in cooperation with the related governmental and/or private organizations and
programs.
Preparation of regulations and guidelines for EE&C implementation, specifying good practices and
developing pilot and demonstration projects as a showcasing
Capacity development of the other governmental organizations
Capacity development of energy experts
Capacity development of private sectors
Awareness raising for residential sector
Other governmental organizations conduct capacity development and awareness raising for themselves
and their sub-structuring organizations and related stakeholders, such as schools, industrial associations,
etc.
5.3 Capacity Development for the Government
5.3.1 SREDA
SREDA should lead overall issues to promote EE&C in our country. And it has the responsibility to
formulate capacity development programs for the governmental organizations (both central and local).
87
Nationwide EE&C cannot be realized only by SREDA, but by the comprehensive cooperation and
partnership among other governmental organizations and local governments.
5.4 Capacity Development for Energy Experts
Energy experts, who have knowledge, experiences and interest in EE&C, are the candidates for future
certified energy managers, energy auditors and accredited energy auditors. SREDA should develop the
capacity of these energy experts, through training programs. Besides because of the limitation of
SREDA’s capacity, not only SREDA but also our country’s social systems should focus on the capacity
development for energy experts; such as university curricula, internal training courses in establishments,
publication of educational materials and introduction of success experiences from abroad etc.
5.5 Capacity Development and Awareness Raising for Private Sectors
5.5.1 Overview
Capacity development and awareness raising for private sectors will be implemented though National
EE&C award, in accordance with the yearly electricity week, monthly seminar and monthly focus group
seminar. Focus group seminars should be implemented focusing on the effective target sectors.
5.5.2 National EE&C Award and Yearly Electricity Week
National EE&C award should be given for the establishments and energy managers, whose activities are
worth being highly evaluated and to be good examples for the people. The targets of EE&C award
consist of public buildings and commercial buildings.
National EE&C award ceremony, exhibition of energy technologies and equipment, and international
seminars and workshop on EE&C is to be held in the yearly electricity week, which is held early
December. Educational materials, such as leaflets, posters and booklets are to be distributed during the
event.
5.5.3 Monthly Seminar and Monthly Focus Group Discussion
SREDA is carrying out seminars and focus groups (important consumers to implement EE measures at
time) discussion for target energy consumers on monthly basis . And these activities should be ifostered
and continued.
5.5.4 Efforts by Industrial Association
All industrial associations are conscious of cost reduction and sustainable operation of their business. In
this context, the Government should communicate with them and make information exchanges on
effective EE&C measures and imaginable future risks on energy supply etc. SREDA and related
governmental organizations should lead to establish an EE&C focusing committee in each industrial
sub-sector.
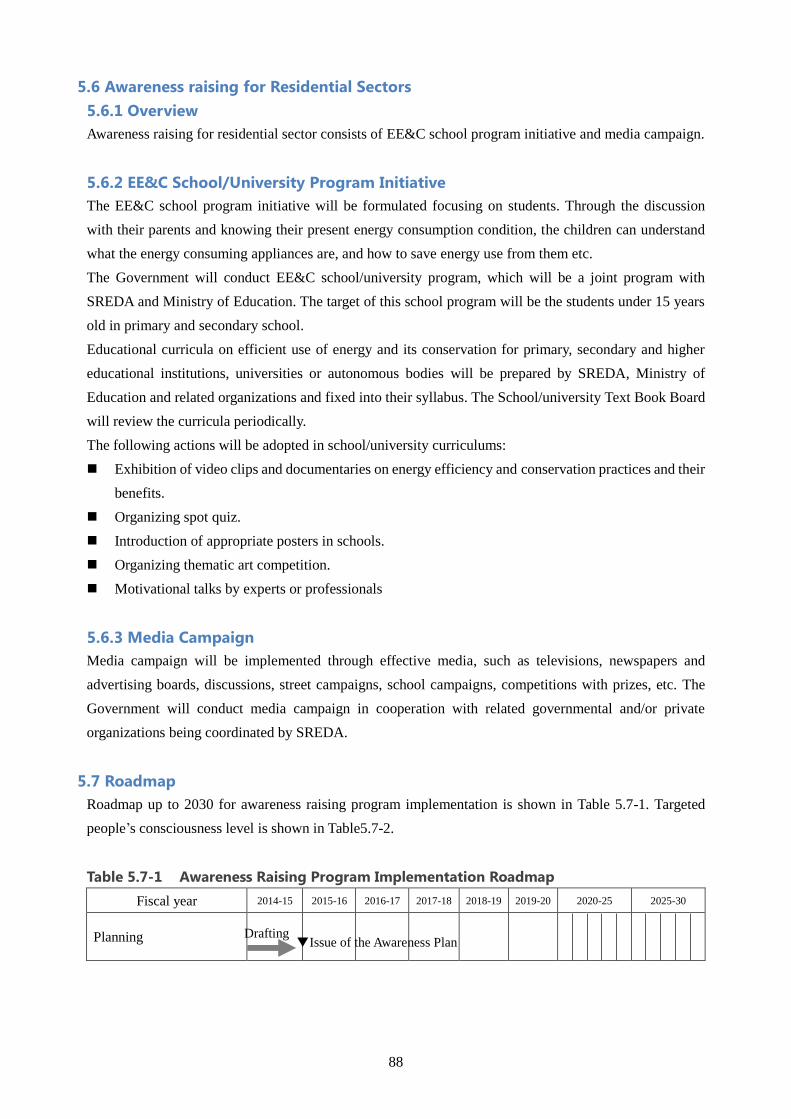
88
5.6 Awareness raising for Residential Sectors
5.6.1 Overview
Awareness raising for residential sector consists of EE&C school program initiative and media campaign.
5.6.2 EE&C School/University Program Initiative
The EE&C school program initiative will be formulated focusing on students. Through the discussion
with their parents and knowing their present energy consumption condition, the children can understand
what the energy consuming appliances are, and how to save energy use from them etc.
The Government will conduct EE&C school/university program, which will be a joint program with
SREDA and Ministry of Education. The target of this school program will be the students under 15 years
old in primary and secondary school.
Educational curricula on efficient use of energy and its conservation for primary, secondary and higher
educational institutions, universities or autonomous bodies will be prepared by SREDA, Ministry of
Education and related organizations and fixed into their syllabus. The School/university Text Book Board
will review the curricula periodically.
The following actions will be adopted in school/university curriculums:
Exhibition of video clips and documentaries on energy efficiency and conservation practices and their
benefits.
Organizing spot quiz.
Introduction of appropriate posters in schools.
Organizing thematic art competition.
Motivational talks by experts or professionals
5.6.3 Media Campaign
Media campaign will be implemented through effective media, such as televisions, newspapers and
advertising boards, discussions, street campaigns, school campaigns, competitions with prizes, etc. The
Government will conduct media campaign in cooperation with related governmental and/or private
organizations being coordinated by SREDA.
5.7 Roadmap
Roadmap up to 2030 for awareness raising program implementation is shown in Table 5.7-1. Targeted
people’s consciousness level is shown in Table5.7-2.
Table 5.7-1 Awareness Raising Program Implementation Roadmap
Fiscal year 2014-15 2015-16 2016-17 2017-18 2018-19 2019-20 2020-25 2025-30
Planning
Drafting ▼Issue of the Awareness Plan
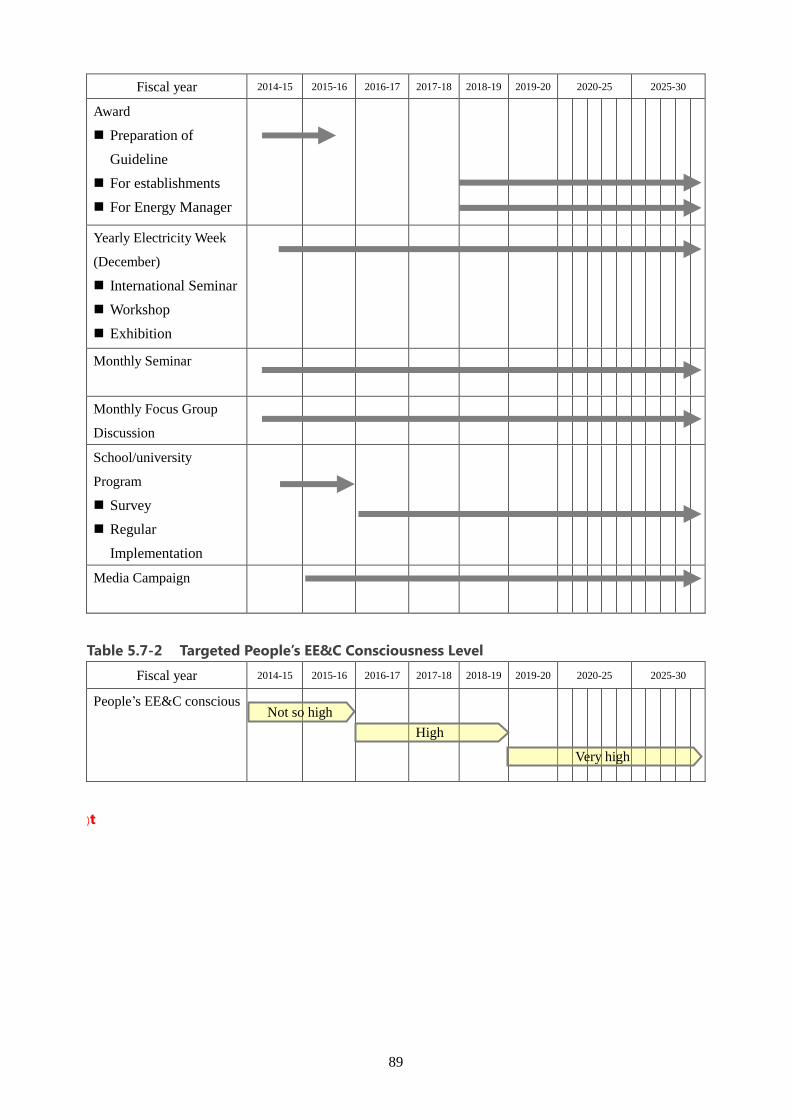
89
Fiscal year 2014-15 2015-16 2016-17 2017-18 2018-19 2019-20 2020-25 2025-30
Award
Preparation of
Guideline
For establishments
For Energy Manager
Yearly Electricity Week
(December)
International Seminar
Workshop
Exhibition
Monthly Seminar
Monthly Focus Group
Discussion
School/university
Program
Survey
Regular
Implementation
Media Campaign
Table 5.7-2 Targeted People’s EE&C Consciousness Level
Fiscal year 2014-15 2015-16 2016-17 2017-18 2018-19 2019-20 2020-25 2025-30
People’s EE&C conscious
)t
Not so high
High
Very high
Top Related