


Languages
Pages
Legal


Energy Conservation
At Kraft Foods, Albany Boyang Li
Advisor: Karl DeWahl
On-site Supervisor: Clinton Buchner

Plant Overview
Plant: Began in 1929, Albany, MN
Square Footage: 84,800 sq. ft.
Employees: 69
Production Lines:
• 3 Spray Dryers (Cheese Powder)
• 1 Dry Blend (Flavored Powder )
• 2 Thermal Reactors (Grill)
• 1 Semi-Soft (Liquid Cheese)

Motivations for Change
• Sustainability Project in Kraft
• Sustainability Team Formed in 2009
• Rising Energy Costs
• Energy Curtailment

Reasons for MnTAP Assistance
• Assist Sustainability Team
• Benchmarking
• Compartmentalizing Energy Consumption
• Compressed Air System Study
• Efficiency Study (Boiler, Steam Coil, and Burner)
• Discover Future Improvement Opportunities

Approach
• Understand Current Systems
• Literature Review
• Data Logging
• Using PLC to Collect Real Time Data
• Interaction and Feedbacks from the Operators
• Vendor Contacts

Process
Condensate
Steam
Inlet
Air
Burner Steam
Coil Natural Gas
Steam
Coil Burner
Air
Cheese Slurry
Fig. Schematic Process Diagram
Cheese Powder
1)
2) Heated
Air
Burner Room
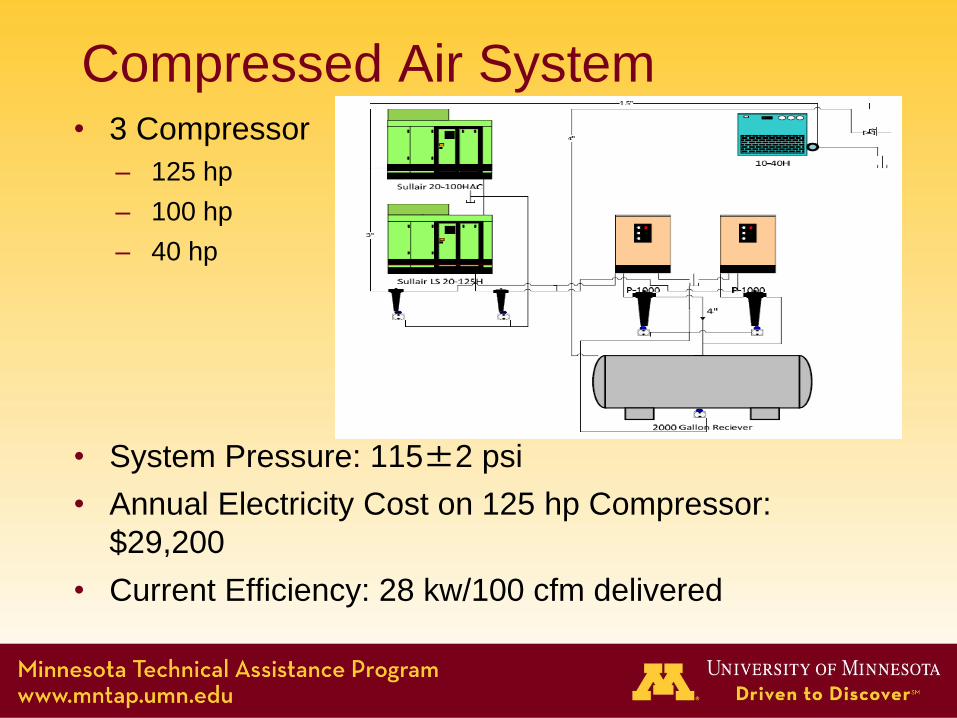
Compressed Air System • 3 Compressor
– 125 hp
– 100 hp
– 40 hp
• System Pressure: 115±2 psi
• Annual Electricity Cost on 125 hp Compressor:
$29,200
• Current Efficiency: 28 kw/100 cfm delivered

Compressed Air System (Ctd.)
1) Repairing the Air Leaks
2) Compressed Air System Pressure Reduction
3) Applying Advanced Control Strategy (VFD retrofitting)

Compressed Air System (Ctd.)
Recommendation Utility
Savings Annual Savings Status
Repairing air leaks
(Air leak percent drops
down to 15%)
107,000 KWH $6,400-7,500 In Progress
Determine Air Leaks
Initial Pressure
(psig)
End Pressure
(psig) Time (min) Leakage (%)
115 ± 1 58 ± 1 11’21 37
Table. Draw Down Test Result
Helped to Develop Air Leak Preventive Maintenance
Table. Savings for Repairing Air Leaks

Compressed Air System(Ctd.)
60 psig
92 psig
97.5 psig
117 psig
Supply Demand
Distribution System
Pressure Drop
Regulated Uses
Pressure Drop Across Compressor
System
+
Regulator
Figure. Current System Pressure Profile

Compressed Air System(Ctd.)
60 psig
80 psig
83 psig
85 psig
Distribution System
Pressure Drop
Regulated Uses
Recommendation Utility
Savings
Implementation
Cost
Annual
Savings
Payback
Period Status
Lowering the
system pressure
from 115 psi to 85
psi
73,000
KWH $2,400
$4,400-
$5,100 6 months Pending
Supply Demand
Figure. Improved System Pressure Profile

Compressed Air System (Ctd.) Fig. Average Power vs. Capacity of compressor with different control
Recommendation Utility
Savings
Implementation
Cost
Annual
Savings
Payback
Period Status
VFD retrofitting
If reached 21.8
kw/100acfm
38,700 KWH $7,250 $5,300 -$6,200 1.2 to 1.4
years Recommended
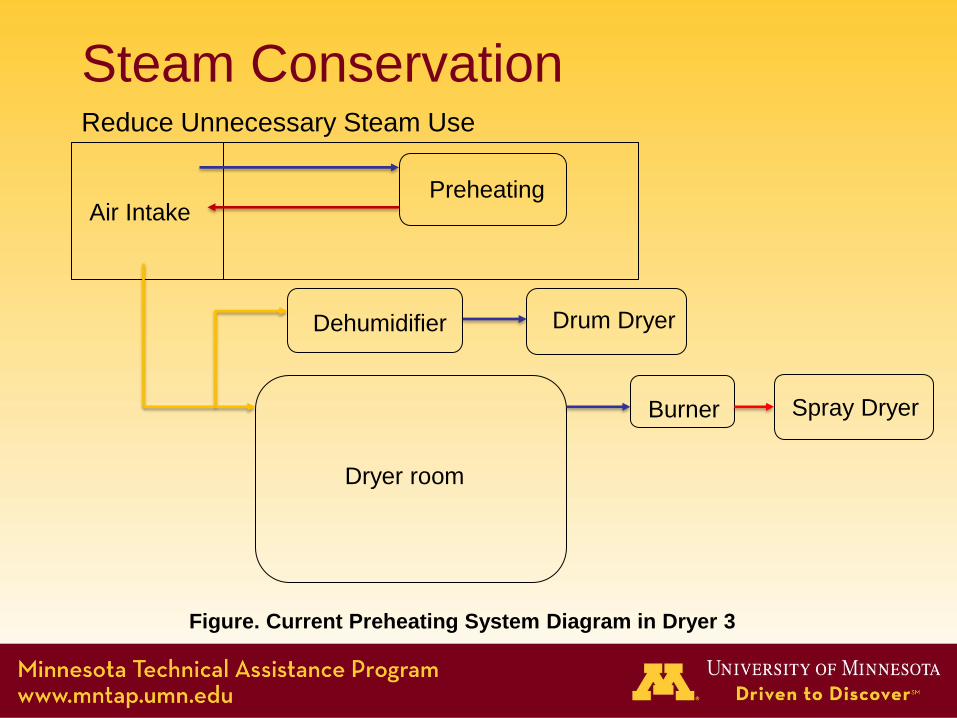
Steam Conservation Reduce Unnecessary Steam Use
Air Intake Preheating
Dehumidifier Drum Dryer
Dryer room
Burner Spray Dryer
Figure. Current Preheating System Diagram in Dryer 3

Steam Conservation (Ctd.) With Preheating System Turned Off
Air Intake Preheating
Dehumidifier Drum Dryer
Dryer room
Burner Spray Dryer
Figure. Improved Preheating System Diagram in Dryer 3

Steam Conservation (Ctd.)
Recommendation Utility Saving Implementation
Cost
Annual
Savings
Payback
Period Status
Shutting down
Steam Use in SA-4
411,000 lbs
Steam $0 $2,800 0 months Pending
Turn off the Supply
Fan 11,700KWH $0 $ 900 0 months Pending
Table. Savings if Preheating System is turned off in the Summer
Future Opportunities
• Research in the possibility that if preheating system can be turned
off in the winter

Future Opportunities
1) Reduce Unnecessary Steam Use
2) Increase Boiler Efficiency
3) Improve Current Dryer Performance

Approach
1) Programming in PLC, collecting and processing real time data
Figure. Display Panel for Dryer Utility Use

Approach 1) Programming in PLC, collecting and processing real time data
Figure. Display Panel for Boiler Utility Use
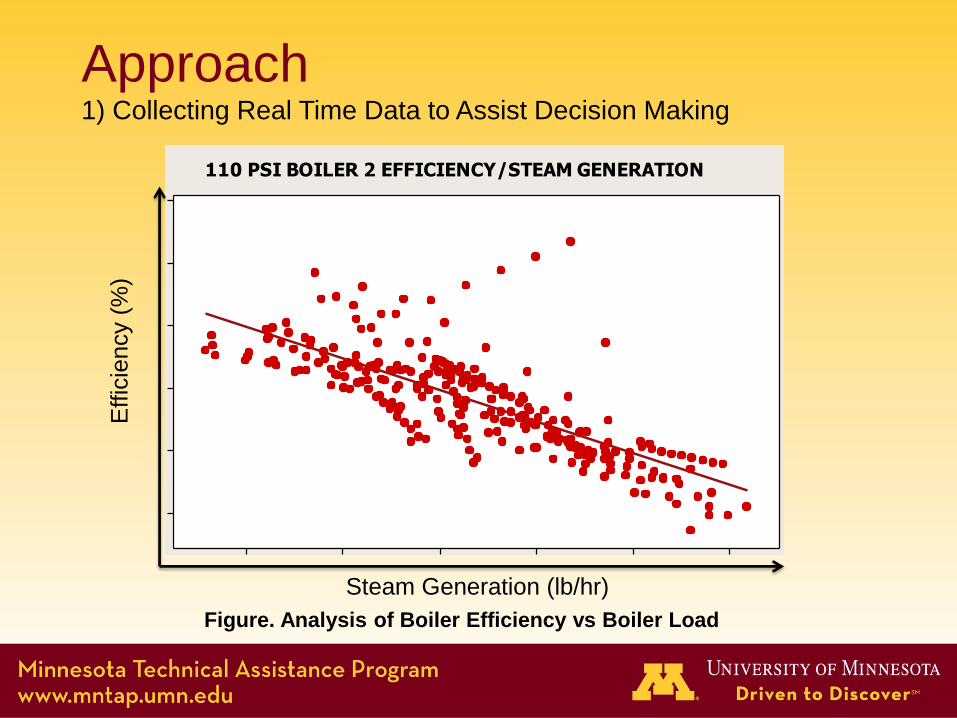
Approach 1) Collecting Real Time Data to Assist Decision Making
185001800017500170001650016000
88
86
84
82
80
78
GENERATION
EFF
ICIE
NC
Y
110 PSI BOILER 2 EFFICIENCY/STEAM GENERATION
Effic
iency (
%)
Steam Generation (lb/hr)
Figure. Analysis of Boiler Efficiency vs Boiler Load

Approach
2) Understanding the Influence of Moisture Content on Dryer
Performance.
Condensate
Steam
Inlet Air
Burner Steam
Coil Natural
Gas

Approach
2) Understanding the Limitation of Steam and Reduce Unnecessary
Steam Use
Steam Use (lb/hr)
Tem
pera
ture
(F
)
Steam Use (lb/hr) N
atu
ral G
as U
se (
scf)
Wasted
Energy

Approach 3) Computational Model to Assist Decision Making
O
pera
tin
g C
ost in $
/hr
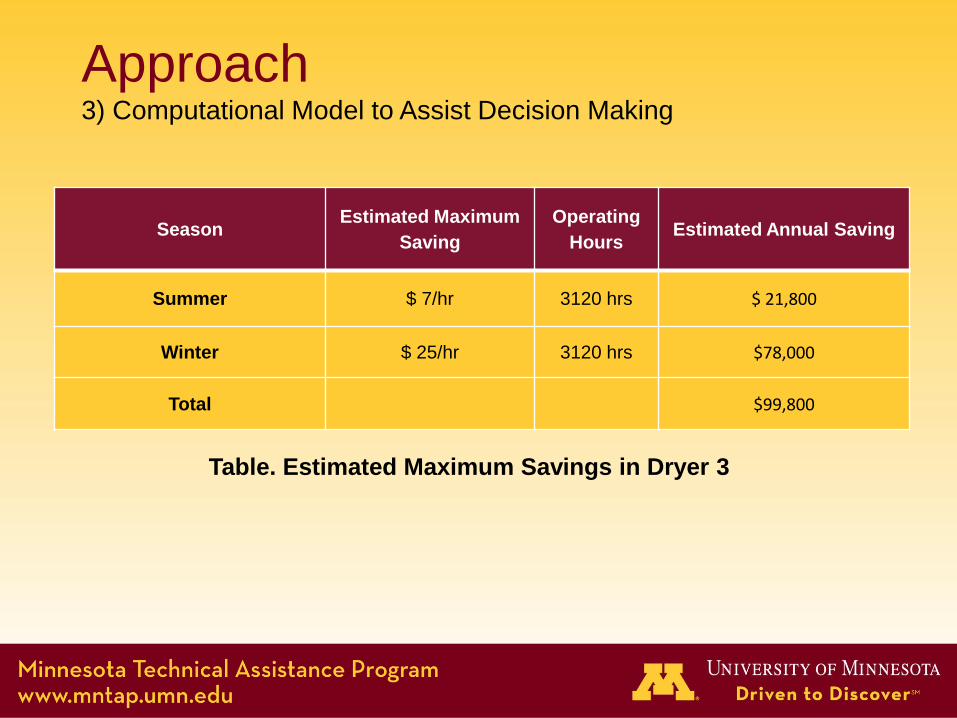
Season Estimated Maximum
Saving
Operating
Hours Estimated Annual Saving
Summer $ 7/hr 3120 hrs $ 21,800
Winter $ 25/hr 3120 hrs $78,000
Total $99,800
Table. Estimated Maximum Savings in Dryer 3
Approach 3) Computational Model to Assist Decision Making

Recommendation Summary
Recommendation Annual Utility
Saving Annual Savings Status
Lowering the system
pressure from 115 psi to 85
psi
73,000 KWH $4,400-5,100 Pending
VFD retrofitting
If reached 21.8 kw/100acfm 38,700 KWH $5,300-6,200 Recommended
Repairing air leaks
(Air leak percent drops
down to 15%)
107,000 KWH $6,400-7,500 In Progress
Shutting down Preheating
Unit in Dryer 3 411,000 lbs Steam $2,800 Pending
Turn off the Supply Fan in
Preheating Unit 11,700 KWH $ 900 Pending
Total $19,800-22,500

• Technical Understanding Acquired
• Industrial Environment Exposure
• Data Analysis
• Programming Skills
• Project Cost Understanding
• Vendor Contact
• Working Alone As Well As in Groups
Personal Benefits

Questions
Thanks!
Top Related