


Languages
Pages
Legal


Employee Engagement: Business Buzz or Serious Business?
IABC International Conference
June 28, 2005
Susan M. Suver
VP, Global Human Resources
Arrow Electronics, Inc.

2
Employee Engagement Defined
► Two components:
► Rational Engagement: the involvement, understanding and motivation an employee has in his/her job
► Emotional Engagement: the attitudinal attachment an employee has to his/her company; source of pride
► Excelling at only one is not sufficient to drive engagement
► Must measure and understand both aspects to produce most actionable performance indicators

3
Why Is Employee Engagement Important?
EmotionalEmotionalEngagementEngagement
RationalRationalEngagementEngagement
Emotional EngagementEmotional Engagement
► I am proud to tell others I work for my company
► The work I have to do is reasonable
► I am unlikely to look for a job in another company in the next 12 months
► I would recommend my company to a close friend as a good place to work
► My company inspires me to do my best work
Rational EngagementRational Engagement
► I am willing to put in a great deal of effort beyond what is normally expected to help my company be successful
► I understand how my work group contributes to the success of my company
► I understand how my role is related to my company’s overall goals, objectives, and direction
► My job provides me with a sense of personal accomplishment

4
Does Engagement Matter? Yes. Just Look At Motivation...
Highly engaged 45% more motivated than those disengaged
Individual Motivation ScoreOverall U.S. sample*
Source: Towers Perrin 2003 Talent Report: New Realities in Today’s Workforce.
48
7892
Disengaged ModeratelyEngaged
HighlyEngaged
5
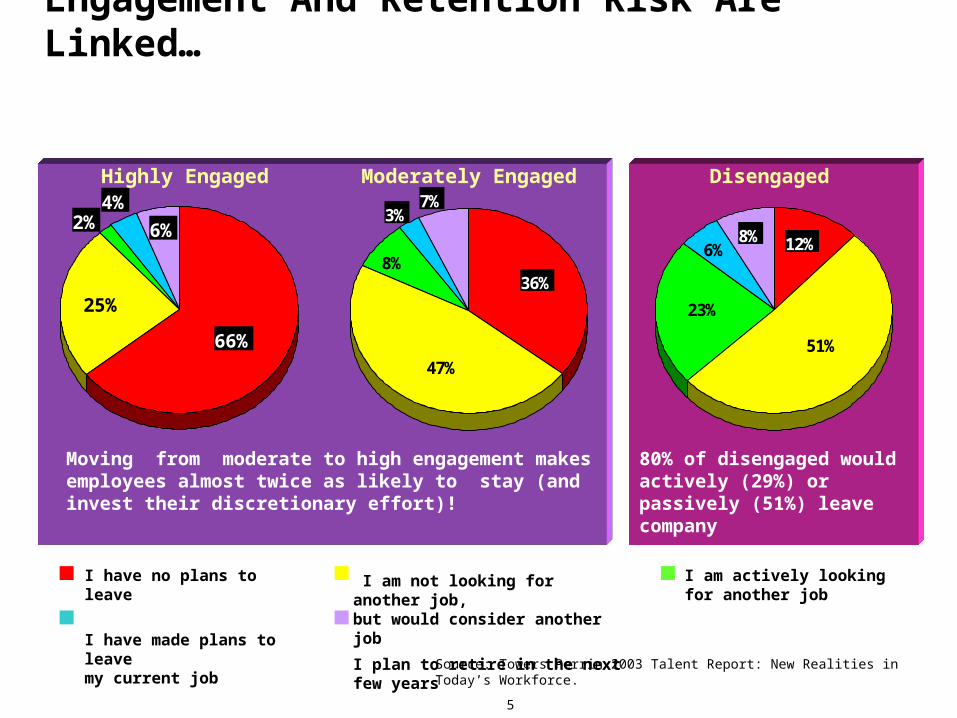
2%4%
25%
66%
6%3%
8%
47%
36%
7%
6% 12%
23%
51%
8%
Engagement And Retention Risk Are Linked…
I have no plans to leave
I have made plans to leavemy current job
I am actively looking for another job
I am not looking for another job,but would consider another job
I plan to retire in the next few years
Moving from moderate to high engagement makes employees almost twice as likely to stay (and invest their discretionary effort)!
80% of disengaged would actively (29%) or passively (51%) leave company
Source: Towers Perrin 2003 Talent Report: New Realities in Today’s Workforce.
Highly Engaged DisengagedModerately Engaged
6
10%
14%
18%
22%
26%
30%
LOW HIGH
Strong Correlation Between High Engagement And Financial Performance
Operating Margin With 5%, 10%, 15% Change in Engagement
% Change in Employee Engagement
Current
12.1%
5%
12.9%
10%
13.7%
15%
14.5%
Source: Towers Perrin 2003 Talent Report: New Realities in Today’s Workforce.
Engagement Index Score
Revenue Growth
19%
21%
23%
25%
27%
LOW HIGH
SG&A
NOTE: Employee engagement strongly correlated to intention to stay
Intent to Stay
For a $10B company, that’s $80,000,000

7
Takeaway #1: The real business impact of employee engagement
• The Corporate Leadership Council’s research has found that organizations are (rightly) turning their attention to their employees’ level of engagement.
• A Council survey of more than 50,000 employees at 59 member organizations in 27 countries and 10 industries demonstrates the real bottom-line impact of employee engagement. Highly committed employees perform up to 20 percentile points better and are 87% less likely to leave the organization than employees with low levels of commitment.
• The Council’s analysis has yielded the two “rules” appearing at the bottom of this slide, which further convey the significant impact of employee engagement on the business.
The Business Case for EngagementEmployee engagement drives employee performance and workforce retention
Maximum Impact of DiscretionaryEffort on Performance Percentile
NumberofEmployees
50th
Percentile70th
Percentile
Maximum Impact of Engagementon the Probability of Departure
Probabilityof Departurein Next 12Months
StrongDisengagement
StrongEngagement
9.2%
1.2%
87%
The “10:6:2” Rule• Every 10% improvement in commitment can increase an employee’s effort level by 6%.
• Every 6% improvement in commitment can improve an employee’s performance by 2 percentile points.
The “10:6:2” Rule• Every 10% improvement in commitment can increase an employee’s effort level by 6%.
• Every 6% improvement in commitment can improve an employee’s performance by 2 percentile points.
The “10:9” Rule
Every 10% improvement in commitment can decrease an employee’s probability of departure by 9%.
The “10:9” Rule
Every 10% improvement in commitment can decrease an employee’s probability of departure by 9%.
Source: Corporate Leadership Council 2004 Employee Engagement Survey.

8
The Risk of Workforce DisengagementThe majority of employees are “up for grabs”—neither fully committed nor
uncommitted
Takeaway #2: Most employees are not highly committed to their organizations
• Of concern, given this potential impact of engagement, the Council’s 2004 Employee Engagement Survey identified significant employee ambivalence about their organizations.
• The Council’s research found that only 11% of employees demonstrate very strong commitment to their organizations, while 13% are actively disengaged.
• This examination further revealed, however, a real opportunity: 76% of employees are only moderately committed to their organizations. Organizations seeking to reap the benefits of a highly engaged workforce should therefore seek to sway these “agnostic” employees towards the “true believer” level of engagement.
The State of Workforce Engagement
The “Disaffected”
Poor performers putting in minimal effort and exhibiting strong noncommitment to their organizations, jobs, managers, and teams
The “Agnostics” The “True Believers”
These employees exhibit moderate commitment to their work, teams, managers, and organizations
High performers with low retention risk, who exhibit very strong emotional and rational commitment to their jobs, teams, managers, and organizations
13%
20% 29% 27%
11%Leaning Toward Disengagement
NeutralLeaning Toward Engagement
Source: Corporate Leadership Council 2004 Employee Engagement Survey.

9
Takeaway #3: There is a significant range in employee commitment between organizations
• Also worthy of attention, the Council has identified a significant variation in engagement levels between surveyed organizations.
• On this slide, you will observe a meaningful distinction in the engagement levels (and the related impact on discretionary effort and intent to stay) of employees at two participating organizations at either end of the workforce commitment scale.
• The Council’s research indicates, in fact, that organizational differences are the only major demographic category accounting for variation in workforce commitment, suggesting that organizations cannot simply “write off” certain employee segments (such as Generation X) as being likely to be disengaged.
The True Difference Engagement Can MakeThe example of two organizations participating in the 2004 Employee
Engagement Survey
Source: Corporate Leadership Council 2004 Employee Engagement Survey.
Percentage ofWorkforce in
Highest Categoryof Intent to Stay
42.9%
15.3%
OrganizationA
OrganizationB
The “True Believers”
The “Disaffected”
Discretionary Effort
Intent to Stay
The “TrueBelievers”
Percentage ofWorkforce
24%
3%
OrganizationA
OrganizationB
“Disaffected”Percentage of
Workforce5%
17%
OrganizationA
OrganizationB
Percentage ofWorkforce in
Highest Categoryof Discretionary
Effort
15.8%
3%
OrganizationA
OrganizationB

10
Takeaway #4: A list of top commitment drivers promoting discretionary effort and retention
• The chart at right provides a “checklist” of levers that organizations seeking to improve workforce commitment—and thereby to increase employee discretionary effort and intent to stay—might seek to employ.
• You will observe the importance of clarity about how to do one’s job, and a belief in the importance to it, to employee discretionary effort and intent to stay.
• Further, prominent among these top levers of engagement are managerial attributes, including excellence in people and process management.
Checklist for Driving Workforce Performance and
Retention Through Engagement
Lever Percentage Impact—
Discretionary Effort
Percentage Impact—Intent to
Stay
Employees understand connection between work and organizational strategy
32.8 36.4
Employees understand importance of their jobs to organizational success
30.3 34.1
Internal communication 29.2 37.5
Manager demonstrates strong commitment to diversity
28.5 36.5
Manager demonstrates honesty and integrity
27.9 35.1
Manager adapts to changing circumstances
27.6 36.1
Manager clearly articulates organizational goals
27.6 35.7
Manager possesses needed job skills 27.2 35.8
Select Levers of Employee Commitment, Listed with Maximum Potential Percentage Impact on Employee Discretionary Effort and Intent to Stay
Source: Corporate Leadership Council 2004 Employee Engagement Survey.

11
Takeaway #4: A list of top commitment drivers promoting discretionary effort and retention
• The chart at right provides a “checklist” of levers that organizations seeking to improve workforce commitment—and thereby to increase employee discretionary effort and intent to stay—might seek to employ.
• You will observe the importance of clarity about how to do one’s job, and a belief in the importance to it, to employee discretionary effort and intent to stay.
• Further, prominent among these top levers of engagement are managerial attributes, including excellence in people and process management.
Checklist for Driving Workforce Performance and
Retention Through Engagement
Lever Percentage Impact—Discretionary
Effort
Percentage Impact—Intent to
Stay
Manager sets realistic performance expectations
27.1 35.6
Manager puts the right people in the right roles at the right time
26.9 36.8
Manager helps find solutions to problems on the job
26.8 35.4
Manager breaks down projects into manageable components
26.7 35.6
Select Levers of Employee Commitment, Listed with Maximum PotentialPercentage Impact on Employee Discretionary Effort and Intent to Stay
Source: Corporate Leadership Council 2004 Employee Engagement Survey.
The Journey to High-Performance Through Leadership Involvement and Employee Engagement
Arrow Electronics, Inc.

13
Key Factors in Decision to Drive Engagement► 2000 bust in the dot com, high tech and telecom sectors left
electronics manufacturers and distributors overbuilt
► New CEO Bill Mitchell arrives 1Q03 with 3 areas of focus: grow the business, return to profitability, build a winning team
► Shift from 20 years of M&A to organic growth a fundamental strategic and operating shift
► Legacy leaders were entrepreneurial, patriarchal, autocratic. Businesses operate in silos
► Unwritten lifetime employment “contract” with employees created high company loyalty, high entitlement, high pay vs high-performance, high accountability
► Success in high-performing, organic growth strategy would require substantial re-orientation of the leaders and workforce. A top-down, high involvement strategy in order.
► Employee involvement would be required to execute, and to resume prior high levels of employee morale and confidence in management.
► Alignment of business acumen, processes and performance standards required to rebuild “DNA” of gene pool

14
Arrow’s Culture Change Strategy: Convert to high-performance, accountability using Shared Leadership and Employee Engagement
Define the competencies, skills, behaviors and practices necessary to create a common, unified culture capable of driving global strategy
execution and supporting Arrow’s values.
Design and deploy change management methods and new internal communication processes that will power the new Arrow culture.

15
The Architecture Of Culture
Element E
Element C
Element B
Element A
Element D
Vision
Vivid Description About Desired Future State Of Company
Values
Deeply Held Beliefs Of Company; Principals That Guide The Way The Company Operates; Software For Building Culture
Company Practices, Policies, Programs, Structures, Systems, Processes, Ceremonies, And Routines
Framework For Driving Desired Employee Behaviors; Hardware For Building Culture
Employee Behaviors
Conduct And Actions Of Company Employees; Beliefs Turned Into Action
Culture
The Exhibition And Aggregation Of Employee Behavioral Norms And Values

16
2003: What was our Operating Culture? Could it get us to new strategy successfully?
Culture Assessment►2003 Towers-Perrin quantitative web-based culture assessment
survey (4,000 employees, 77% response, 8 languages, all regions)►20 focus groups (300 employees), 16 executive interviews
External Benchmarking►7 leading companies►Extensive secondary research
Evaluate Communication Capabilities►Management capability►Vehicle inventory►Culture survey inputs

17
High-Performance Cultural Attributes
► Communicating/Involving
► Employee Engagement
► Cost Focused
► Collaborative
► Customer Focused
► Innovative
► Empowering/Decision-Making Authority
► Performance/Results Oriented
► Trusting
► Change Readiness/Action Oriented/Process Discipline
► Accountable
High-performing companies typically score better on these attributes
Arrow survey also indicates these as critical gaps
Source: Towers Perrin 2003 Talent Management study

18
From Today to Tomorrow
Strengths
► Cost-focus
► Customer service mentality
► Loyalty
Areas for Improvement
► Separate
► Family
► Hierarchy
► Crisis-focused
TodayToday TomorrowTomorrowEngaged Workforce
Strengths
► Cost-focus
► Customer service execution
► Loyalty
► Shared leadership
► Performance-based team
► Empowered employees
► Sustained performance
► Continuous improvement

19
Change Drivers that Produce Business Results…
► Leadership Alignment with Strategy, Financial and Operating Models
► Employee Engagement
► Communication Environment, Tools, and Processes
► Continuous Improvement Mindset and Processes

20
Aligning Leadership with Vision, Values, Strategy
Our Vision
To be the Clear #1 worldwide provider of products, services and solutions that connects technology with customers, powers the supply
chain and delivers premium investment results.
Our Values
►Ethical
►Open and Courageous
►High-Performing, Accountable Teams
►Working Effectively with No Barriers
►Innovate and Execute
►Passion for Service Excellence

21
The Arrow Strategy
Execution LeadershipStrategy
Clear #1
Strategy for the future - Strengthen Arrow – Build the team
FinancialStability
SharedLeadership
Operational Excellence
Growth

22
The Road to High-Performance
EnablersGetting started
LeadershipCommunicationInvolvement
LeadershipCommunicationInvolvement
EmbeddersMaking it stick
Communicating/InvolvingChange/Action/ProcessPerformance/Results Oriented/Customer Focused
Communicating/InvolvingChange/Action/ProcessPerformance/Results Oriented/Customer Focused
Recommendation #1
Embed Arrow values into daily behavior of all leaders/employees to drive successful execution of business strategy
Recommendation #4 Establish continuous improvement culture to drive operational effectiveness, customer satisfaction and sustainable competitive advantage
Desired Culture and Engaged Workforce
that Executes Intended Strategy
Effectively
Desired Culture and Engaged Workforce
that Executes Intended Strategy
Effectively
IntendedStrategy
Recommendation #2
Create a communication infrastructure and environment that enables job understanding, involvement, motivation
MeasurementMeasurement
Recommendation #3
Improve business performance by increasing high-performance, employee engagement

23
The Tools, Process and Discipline
► Upgraded Employee Communications► New talent and vehicles► The “value creators”:
— Managers as dialogue leaders
— On-boarding, Benefits, Development, Performance Differentiation
► Continuous Process Improvement – Lean Sigma
► Voice of the Customer
► Shared Leadership Model ► Top 375 = Performance Leadership: Executive teams build new strategy► All managers = Leadership Inspires Full Engagement (LIFE): learn new strategy,
plan and manage execution in regional/local markets
► Leader Performance Criteria (financial, operating, individual and team leadership, talent-related, change agility, org savvy, strategic thinking)
► Rewards► Pay for Performance, Introduction of Non-financial goals, Discretionary bonuses
► Recognition ► High profile assignments; access to senior leaders► Mentoring, executive education, public and private kudos on performance, invest
time to know what’s on the mind of your key employees

24
Measuring & Monitoring Progress What we have:
► Financial metrics
► Operating metrics
What we are (re)building:
Key Performance Metrics ► Annual Employee Engagement & Culture Assessment
— Understanding Strategy; Aligned Goal-Setting
— Seeking & implementing ideas from all levels► Leadership Success Model
— Redefining High Performers and High Potentials
— Retention
— Readiness for new roles
— Assimilation success► Productivity► Customer Satisfaction

25
Year 1 Progress ► Nov 2004 survey: 11,200 employees, 84% participation rate, hundreds of focus
groups
► Two clear strengths: Ethics and Passion for Service Excellence
► Company-wide efforts (e.g., Shared Leadership) are beginning to have a positive impact
► Higher scores on involvement, confidence in senior leadership
► More employees understand the business strategy
► Percent of highly engaged Executives increased in 2004
► Engagement of recent hires up
► Asia showed significant overall improvement
► Degree of engagement impacted by many changes (e.g., restructuring, downsizing, leadership changes)

26
Early Results and Some Lessons Learned…
1)Focus on targeted, manageable results
2)Accept that you cannot change everything at once without creating chaos
3)Don’t underestimate the impact of organizational change to undercut your progress
4)Engagement is a continuous process – management’s credibility requires constant discipline and determination over time

27
Summary► Driving to Higher Levels of Engagement is a Journey
► Engagement begins with the end in mind and requires a road map to get there
► Alignment of practices, intent, process and discipline are must haves.
► Communication is a fundamental driver of understanding the work and its relationship to strategy
► Leaders using high degrees of involvement, coaching, recognition drive higher levels of engagement
► When understanding and involvement are high, discretionary effort increases and retention risk decreases

28
QUESTIONS?
Top Related