


Languages
Pages
Legal

Lehrstuhl für Physiologie
Fakultät Wissenschaftszentrum Weihenstephan für
Ernährung, Landnutzung und Umwelt
Technische Universität München
Effekte von sekundären Pflanzeninhaltsstoffen aus Apfel- und Rotweintrester auf das Verdauungs- und Immunsystem bei Nutztieren
Julia Maria Sehm
Vollständiger Abdruck der von der Fakultät Wissenschaftszentrum Weihenstephan für
Ernährung, Landnutzung und Umwelt der Technischen Universität München zur
Erlangung des akademischen Grades eines
Doktors der Agrarwissenschaften
genehmigten Dissertation.
Vorsitzender: Univ.-Prof. Dr. Dieter R. Treutter
Prüfer der Dissertation: 1. Univ.-Prof. Dr. Heinrich H.D. Meyer
2. Univ.-Prof. Dr. Jürgen Polster
Die Dissertation wurde am 31.08.2006 bei der Technischen Universität München
eingereicht und durch die Fakultät Wissenschaftszentrum Weihenstephan für
Ernährung, Landnutzung und Umwelt am 29.11.2006 angenommen.
Vorwort
Vorwort Zuerst möchte ich mich bei Prof. Dr. H.H.D. Meyer für die Überlassung des Themas und
die sehr guten Arbeitsbedingungen bedanken.
Dr. habil. M.W. Pfaffl danke ich für seinen fachlichen Ratschlag und die
wissenschaftliche Betreuung meiner Arbeit.
Vielen Dank auch an die „Freunde und Förderer der Physiologie“ und das „Bayerische
Staatsministerium für Landwirtschaft und Forsten“ für die Finanzierung dieses
Projektes.
Bedanken möchte ich mich ebenfalls bei Dr. Lindermayer, Prof. Polster und Prof.
Treutter für die sehr gute Zusammenarbeit.
Inge Celler, Tamara Dicker, Anja Härter, Marlene Kramler, Doreen Tetzlaff und Angela
Sachsenhauser sowie allen Mitarbeitern des Institutes für Physiologie sei Dank für ihre
Unterstützung und die Vermittlung ihres methodischen Wissens.
Mein besonderer Dank gehört all den fleißigen Helfern des Schlachthofes Grub und des
Lehrstuhl für Physiologie, die mich an den Schlachttagen tatkräftig unterstützt haben.
Des Weiteren gilt mein herzlicher Dank den Studenten Katrin Beerbaum, Christian
Biegel, Claudia Dummer und Katharina Werkstätter, die als Praktikanten oder im
Rahmen von Semester- bzw. Bachelorarbeiten mitgeholfen haben.
Für das angenehme Arbeitsklima bedanke ich mich bei allen Mitarbeitern des Institutes,
vor allem bei der „Denkerzentrale“, recht herzlich.
Besonders bedanken möchte ich mich bei meiner Familie, meinem Mann Thorsten und
unserer Tochter Johanna, für die Unterstützung und die Geduld, ohne die ich diese
Arbeit nie zu Ende gebracht hätte.
I
Inhaltsverzeichnis
Inhaltsverzeichnis Abkürzungen VI
1. ZUSAMMENFASSUNG 1
2. ABSTRACT 2
3. EINFÜHRUNG 3
3.1 Funktionelle Histologie des Darmes am Beispiel des Schweins 3
3.2 Darmimmunologie 5
3.3 Sekundäre Pflanzeninhaltsstoffe - Flavonoide 6
3.4 Apfeltrester 8
3.5 Weintrester 9
4. FRAGESTELLUNG 10
5. MATERIAL UND METHODEN 11
5.1 Vorversuch 11
5.1.1 Zellkultur 11
5.1.2 Behandlung 1: Verschiedene Konzentrationen 11
5.1.3 Behandlung 2: Verschiedene Behandlungsabläufe 11
5.1.4 RNA Extraktion aus Zellkultur 11
5.1.5 Two-step RT-PCR 12
5.1.6 Statistik 12
5.2 Fütterungsversuch 12
5.2.1 Tiere 12
5.2.2 Futtermittel 13
5.2.3 Probengewinnung 13
5.2.4 Polyphenoluntersuchung in Futtermitteln, Darminhalten und Geweben 14
5.2.5 Kotuntersuchungen 14
5.2.6 Untersuchung des Blutes 14
5.2.7 Histologische Untersuchungen 14
5.2.8 RNA Extraktion aus Gewebe 15
5.2.9 One-step RT-PCR 15
5.2.10 Statistik 16
6. ERGEBNISSE 17
6.1 Zellkultur 17
6.1.1 Expressionsanalyse: Verschiedene Konzentrationen 17
6.1.2 Expressionsanalyse: Verschiedene Behandlungsabläufe 18
III
II
Inhaltsverzeichnis
6.2 Fütterungsversuch 19
6.2.1 Allgemeine Wachstumsdaten 19
6.2.2 Polyphenole in Futter und Darminhalten 19
6.2.3 Bakterienzusammensetzung im Kot 20
6.2.4 Blutbild 20
6.2.5 Morphologie in Jejunum, Ileum und Colon 21
6.2.6 Expressionsanalysen 22
6.2.6.1 Blut 22
6.2.6.2 Gastrointestinaltrakt 23
6.2.6.3 Organe 23
7. DISKUSSION 26
7.1. Methodische Diskussion 26
7.1.1 Zellkultur 26
7.1.2 Histologie 27
7.1.3 Hochdurchsatz PCR 28
7.2. Physiologische Diskussion 30
7.2.1 Zellkultur 30
7.2.2 Fütterungsversuch 31
8. SCHLUSSFOLGERUNGEN 37
9. LITERATUR 39
ANHANG 55
Lebenslauf 55
Betreute Arbeiten 56
Publikationen 57
III
ABKÜRZUNGSVERZEICHNIS AT Ferkel, die mit 3,5% TS Apfeltrester in der Ration gefüttert worden sind
cDNA komplementäre DNA
ConA Concanavalin A
CP crossing point
CT threshold cycle
DMAZA Dimethylaminozimtaldehyd
DNA Desoxyribonucleinsäure
EDTA Ethylendiaminetraessigsäure
EGCG (-)-Epigallocatechin gallat
FKS Fötales Kälberserum
GAPDH Glycerinaldehyd-3-phosphat- dehydrogenase
GKZ Gesamtkeimzahl
HbE Hämoglobingehalt pro Erythrozyt
IGF Insulinähnlicher Wachstumsfaktor (insulin like growth factor)
IL Interleukin
KBE Koloniebildende Einheit
MCV Volumen-Inhalt des Einzel-Erythrozyten (mean corpuscular volume)
NFκB Nukleärer Faktor kappa B
PCR Polymerase Ketten Reaktion (polymerase chain reaction)
PP Peyersche Platten
RNA Ribonukleinsäure
RPMI Roswell Park Memorial Institute
RWT Ferkel, die mit 3,5% TS Rotweintrester in TS gefüttert worden sind
RT Reverse Transkription
SR Ferkel, die mit der Standard-/Kontrollration gefüttert worden sind
TNF Tumor Nekrose Faktor
TS Trockensubstanz
WBZ Weiße Blutzellen
55 IV
Zusammenfassung
1. ZUSAMMENFASSUNG Der Forschungsschwerpunkt dieser Doktorarbeit war die immun-modulatorische
Wirkung von polyphenolreichen Trestern auf die Physiologie von wachsenden Ferkeln
in der Zeit des Absetzens. Ein besonderer Aspekt war die Verwendung natürlicher
Reststoffe aus der Getränkeherstellung, dem Apfel- und dem Rotweintrester.
In einem in vitro Vorversuch wurden primäre weiße Blutzellen mit den Polyphenolen
Catechin und EGCG stimuliert. Zusammenfassend konnte man positive Effekte durch
die Flavanoid-Behandlung sowohl auf die immunrelevanten Zytokine als auch auf die
Expression der Transkriptionsfaktoren feststellen. Höhere Flavanoidgaben zeigten
ausgeprägtere Einflüsse als geringere, wobei EGCG die mRNA Genexpression stärker
veränderte als Catechin.
Im Fütterungsversuch wurden 78 Ferkel mit 3,5% TS Apfel- oder Rotweintrester bzw.
einer Standardration gefüttert. Als Beobachtungszeitraum wurden die Tage um den
Absetztermin gewählt, da dann die meisten immunrelevanten Veränderungen in der
Umwelt und beim Futterwechsel stattfinden und die meisten Ferkelverluste zu
verzeichnen sind.
Spuren der wichtigsten Polyphenolvertreter waren in den tierischen Organen und
Geweben nachweisbar. Die beiden polyphenolreichen Fütterungen zeigten einen
positiven Einfluss auf die Bakterienpopulationen im Colon. Die Anzahl der E. coli
Bakterien wurde weniger, während sich die Anzahl der gesundheitsfördernden
Laktobazillen erhöhte. Die Ergebnisse des Blutbildes zeigten, dass die Leukozytenzahl
in der Kontrollgruppe anstieg, was auf eine Aktivierung des Immunsystems hinweist; in
den Behandlungsgruppen zeigten sich keine Veränderungen.
In den darmmorphometrischen Studien via Histologie ergaben sich unterschiedliche
Effekte der polyphenolreichen Fütterungen in Jejunum, Ileum und Colon. Die
Lymphfollikelflächen der Peyerschen Platten im Ileum nahmen nur in der Kontrollgruppe
zu, was wie im Falle des Blutbildes für eine Aktivierung des Lymphsystems in der nicht
behandelten Kontrollgruppe spricht. In den Expressionsanalysen wurde gezeigt, dass
Caspase 3 im Jejunum mit der Zeit abreguliert, im Colon dagegen aufreguliert wurde.
Die Veränderungen waren in den Behandlungsgruppen oft signifikant größer als in der
Kontrollgruppe.
Die in vivo Studie zeigte, dass sich die beiden Tresterfütterungen bei den Ferkeln
gesundheitsfördernd auswirkten. Sowohl die Darmflora als auch die Darmzotten wurden
von beiden Tresterfütterungen positiv beeinflusst.
1
Abstract
2. ABSTRACT The main research focus of this doctoral thesis was the immunomodulatory effect of
polyphenol-rich pomaces on the physiology of growing piglets undergoing the stage of
weaning. A special aspect was the application of natural residues derived from
beverage manufacturing, i.e. apple and red-wine pomace.
In a preliminary experiment conducted in vitro, primary white blood cells were stimulated
with the polyphenols Catechin and EGCG. In summary, the positive effects of flavonoid
treatment were determined on both the immune-relevant cytokines and the expression
of transcription factors. Higher flavonoid administrations displayed more distinct effects,
whereby EGCG modified mRNA gene expression more than Catechin.
In a feeding experiment, 78 piglets were fed with 3.5 percent dry matter apple or red-
wine pomace. The days around the date of weaning were chosen as the period of
observation, since most changes of immunological relevance in the environment and
due to the change of nutrition take place during this time, which is also characterized by
a maximum mortality rate among piglets.
Traces of the main polyphenol species were detectable in the organs and tissues of the
animals. The two polyphenol-rich feedings displayed a positive influence on the
bacterial populations in the colon. The number of E. coli cells reduced, whereas the
number of health-supporting Lactobacilli increased. The results of the differential blood
cell count revealed that the number of leukocytes increased in the control group,
indicating an activation of the immune system. No alterations were found in the
treatment groups.
Histomorphometric studies of the intestines showed various effects elicited by the
polyphenol-rich feed on jejunum, ileum and colon. The surfaces of the lymph follicles of
the ileal Peyer’s plaques only increased in the control group, which is indicative of an
activation of the immune system in the untreated controls, as had been revealed by the
differential blood cell count. Expression analyses demonstrated that Caspase 3 activity
was reduced in the jejunum, but induced in the colon. The changes in the treatment
groups were often significantly greater than in the control group.
The in vivo study showed that both pomace feeding regimes produced positive health
effects in piglets. Both the gut microflora and the intestinal villi were positively influenced
by both pomace feeding regimes.
2
Einführung
3. EINFÜHRUNG 3.1 Funktionelle Histologie des Darmes am Beispiel des Schweins
Der Intestinaltrakt umfasst ca. 5% des Körpergewichts und ist mit ca. 200 m² die größte
Oberfläche des Körpers (Roitt et al., 1995; Löffler, 1994). Hier befindet sich auch der
größte und komplexeste Anteil des Immunsystems (Roitt et al., 1995). Bei einem
ausgewachsenen Schwein besteht der Intestinaltrakt aus durchschnittlich 18 m
Dünndarm und 4 m Dickdarm. Der Dünndarm wird in Zwölffingerdarm (Duodenum),
Leerdarm (Jejunum) und Hüftdarm (Ileum) unterteilt, der Dickdarm in Blinddarm
(Caecum), Grimmdarm (Colon) und Mastdarm (Rectum).
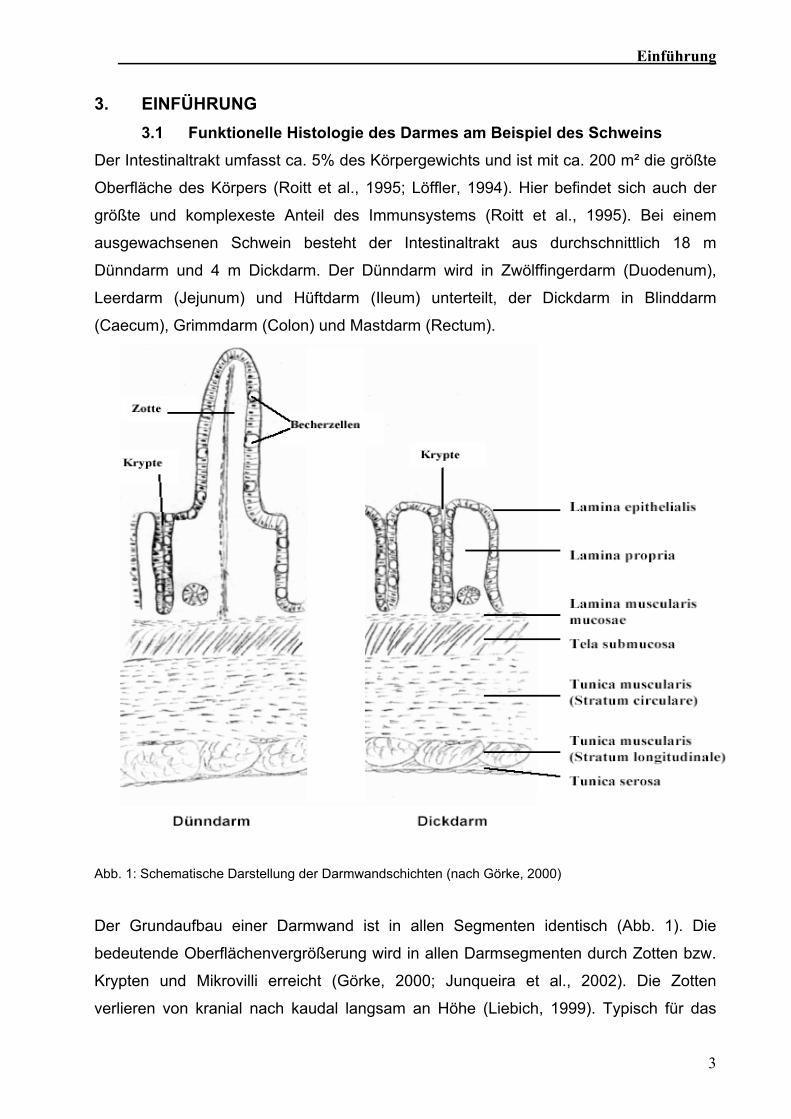
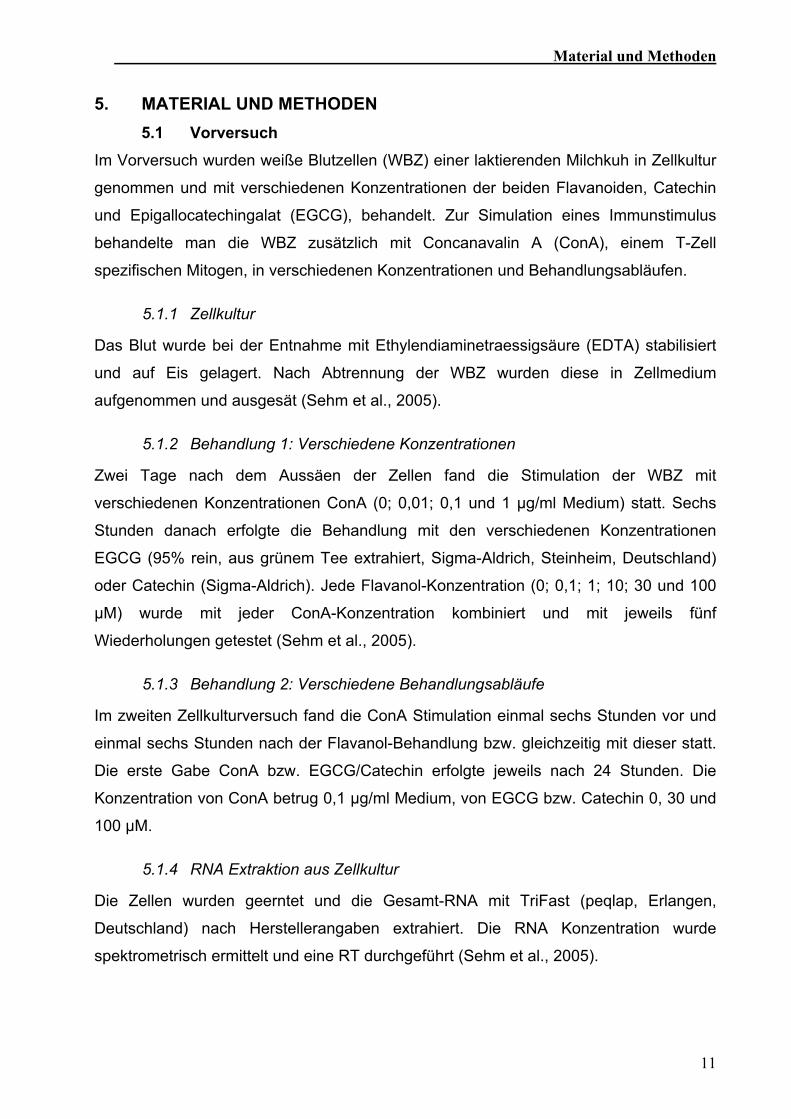
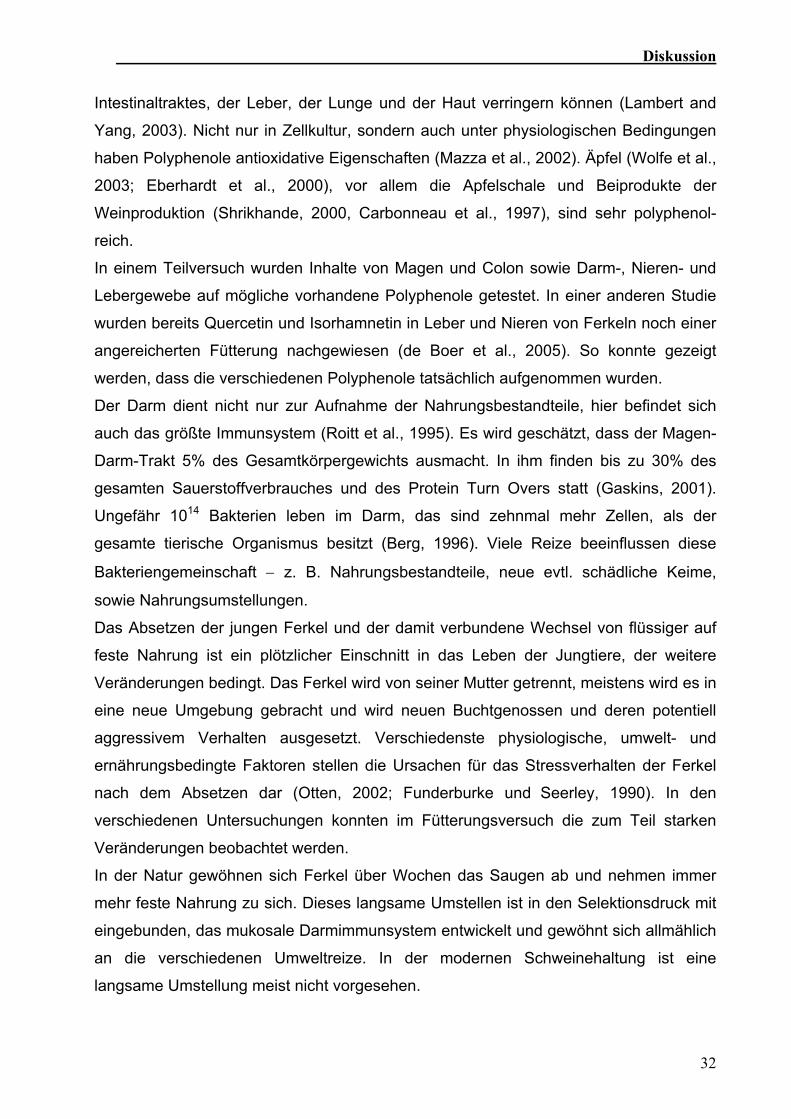
Abb. 1: Schematische Darstellung der Darmwandschichten (nach Görke, 2000)
Der Grundaufbau einer Darmwand ist in allen Segmenten identisch (Abb. 1). Die
bedeutende Oberflächenvergrößerung wird in allen Darmsegmenten durch Zotten bzw.
Krypten und Mikrovilli erreicht (Görke, 2000; Junqueira et al., 2002). Die Zotten
verlieren von kranial nach kaudal langsam an Höhe (Liebich, 1999). Typisch für das
3
Einführung
Ileum und das Jejunum sind die Kerckring-Falten. Sie ragen in das Darmlumen hinein
und sind nur aus Mukosa und Submukosa aufgebaut (Junqueira et al., 2002).
Eine Besonderheit im Dünndarm stellen die Peyerschen Platten (PP) dar. Im Ileum
nimmt die Zahl der Peyerschen Platten, im Vergleich zum Jejunum, zu (Kolb, 1991).
Über diesen Peyerschen Platten befinden sich viele M-Zellen und nur wenige
Becherzellen und eher kurze, unterschiedlich geformte Darmzotten. Das 70 cm bis 100
cm lange Ileum wird ausgezeichnet durch eine kontinuierliche PP (Görke, 2000). Nach
der Geburt werden bei Schweinen keine neuen PP angelegt. Das Größenwachstum der
PP wird von Haltungsbedingungen und Erregerexposition beeinflusst. Bei konventionell
gehaltenen Ferkeln verdreifacht sich die Länge der jejunalen PP und ilealen PP bis zum
38. Lebenstag, während sich bei keimfrei gehaltenen Ferkeln die Länge der ilealen PP
verdoppelt und die Länge der jejunalen PP gleich bleibt. Mikrobielle Antigene sind, wie
Nahrungsantigene wichtig für die Entwicklung von aktiven Follikeln in den PP (Van
Briel, 2002).
Die Epithelzellen am Grund der Krypten sind undifferenziert und teilen sich ständig
mitotisch. Die Tochterzellen wandern bis zur Zottenspitze, differenzieren sich aus und
erneuern abgeschilferte Zellen. Beim neugeborenen Schwein beträgt die Lebensdauer
einer Deckepithelzelle 10-14 Tage, beim adulten 2-5 Tage (Klein, 2001; Junqueira et
al., 2002). Wichtig bei der Zellerneuerung des Darmepithels sind einerseits die
Zellproliferation und andererseits die Apoptose. Überflüssige Zellen werden durch
diesen programmierten Zelltod zerstört.
Die Apoptose kann über zwei verschiedene Wege eingeleitet werden: Beim
mitochondrialen Weg führen pro-apoptotische Proteine der Bax-Familie bei zellulärem
Stress zur Aktivierung der Signalkaskade (Löffler und Petrides, 2003; Zimmermann et
al., 2001). Der zweite Weg führt über sogenannte Todesrezeptoren wie den FAS-
Rezeptor oder den TNF-Rezeptor (Tumor-Nekrose-Faktor-Rezeptor). Zytokine wie TNF
oder Interferon-γ bewirken eine verstärkte Rezeptorexpression (Zimmermann et al.,
2001). Am Ende der intrazellulären Signalkaskaden steht die Caspase 3 als
Schlüsselenzym der Apoptose. Sie aktiviert weitere Caspasen und DNAsen, die für die
Fragmentierung der DNA verantwortlich sind (Enari et al., 1998; Lui et al., 1997).
Zur Apoptose können auch verschiedenste Umwelteinflüsse wie UV-Strahlen oder
oxidativer Stress führen (Löffler und Petrides, 2003; Hug, 2000). Polyphenole z. B.
spielen eine Rolle bei der Aktivierung der Apoptosekaskade in Krebszellen (Dong,
2000; Lin et al., 1999; Yang et al., 2002).
4
Einführung
In den Darm gelangen nicht nur Nährstoffe, sondern auch verschiedenste Pathogene,
deshalb befindet sich hier das größte Immunsystem des Körpers.
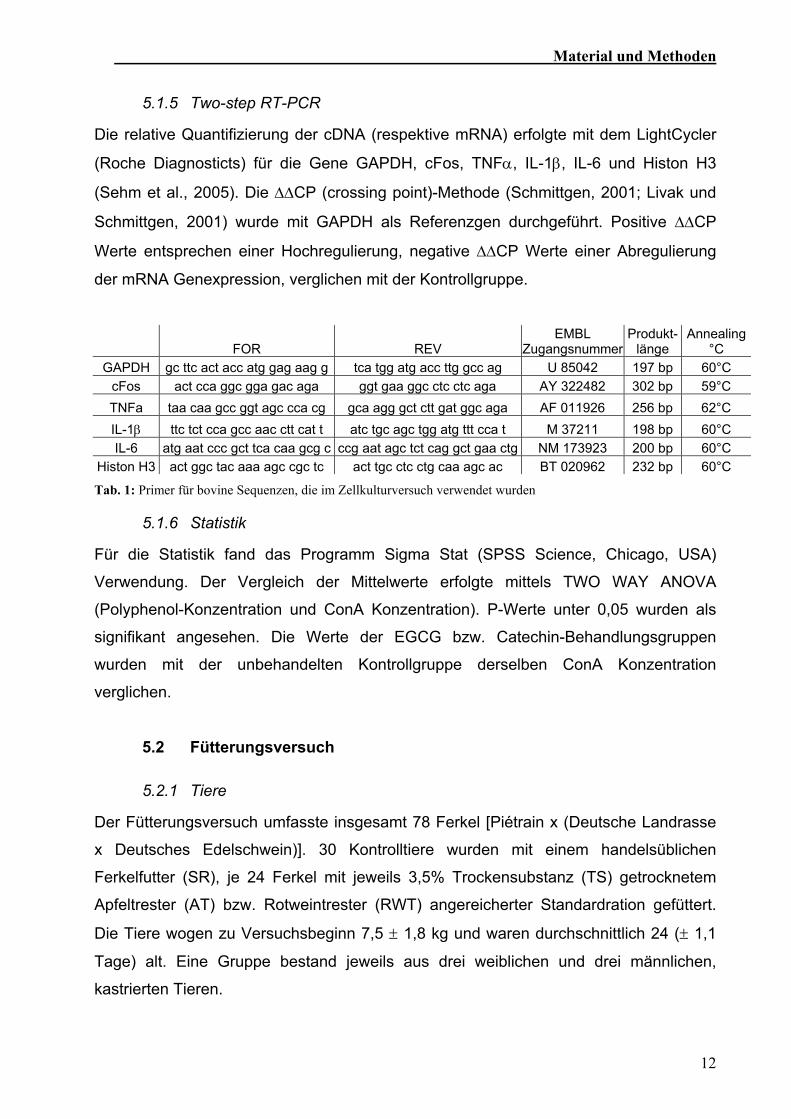
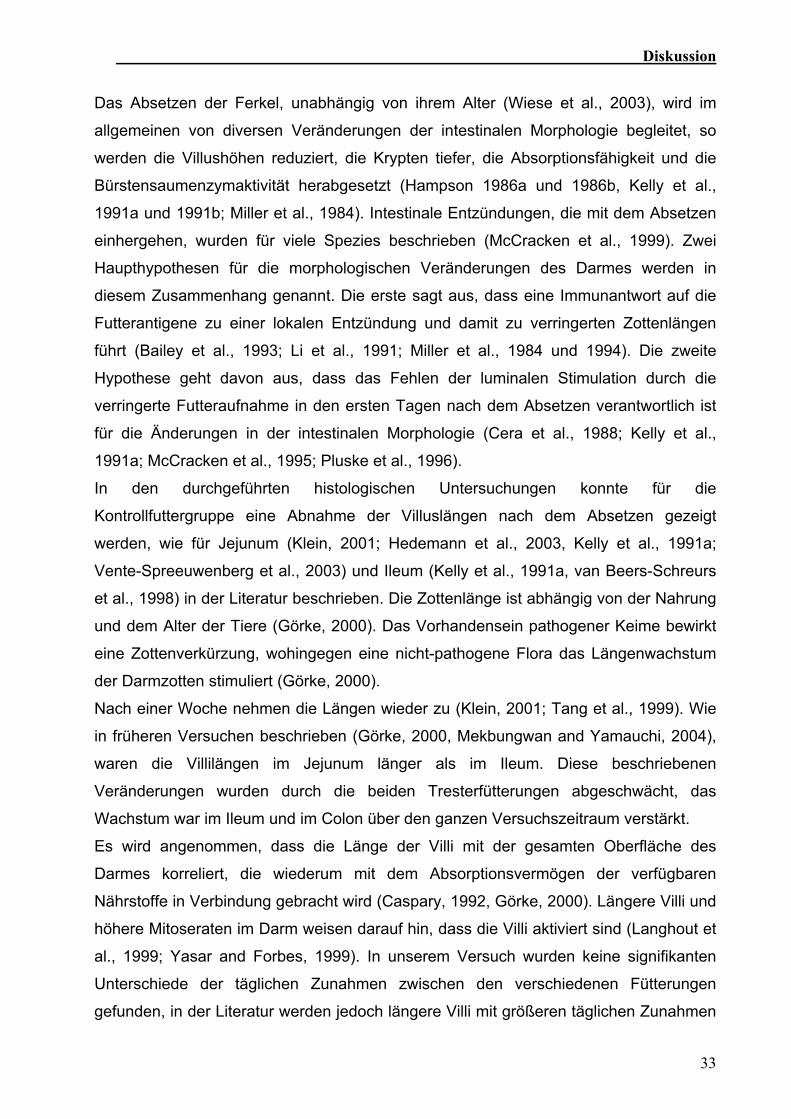
3.2 Darmimmunologie Das darm-assoziierte Immunsystem gehört zum mukosa-assoziierten Immunsystem. Es
stellt das System mit der größten Oberfläche dar und repräsentiert mit 80% den
Hauptanteil des Gesamtimmunsystems (Krüger, 2005). Folgende Abwehrzellen
arbeiten im Immunsystem des Darmes:
- Lymphfollikel der Peyerschen Platten (PP) mit B-Zellen und T-Zellen
- Kleine Lymphfollikel und Lymphozyten-Ansammlungen
- Intraepitheliale Lymphozyten
- Dentritische Zellen
- T-Zellen der Lamina propria: CD4, CD8, γ/δ
- Plasmazellen der Lamina propria
- Makrophagen
- Mastzellen (Van Briel, 2002)
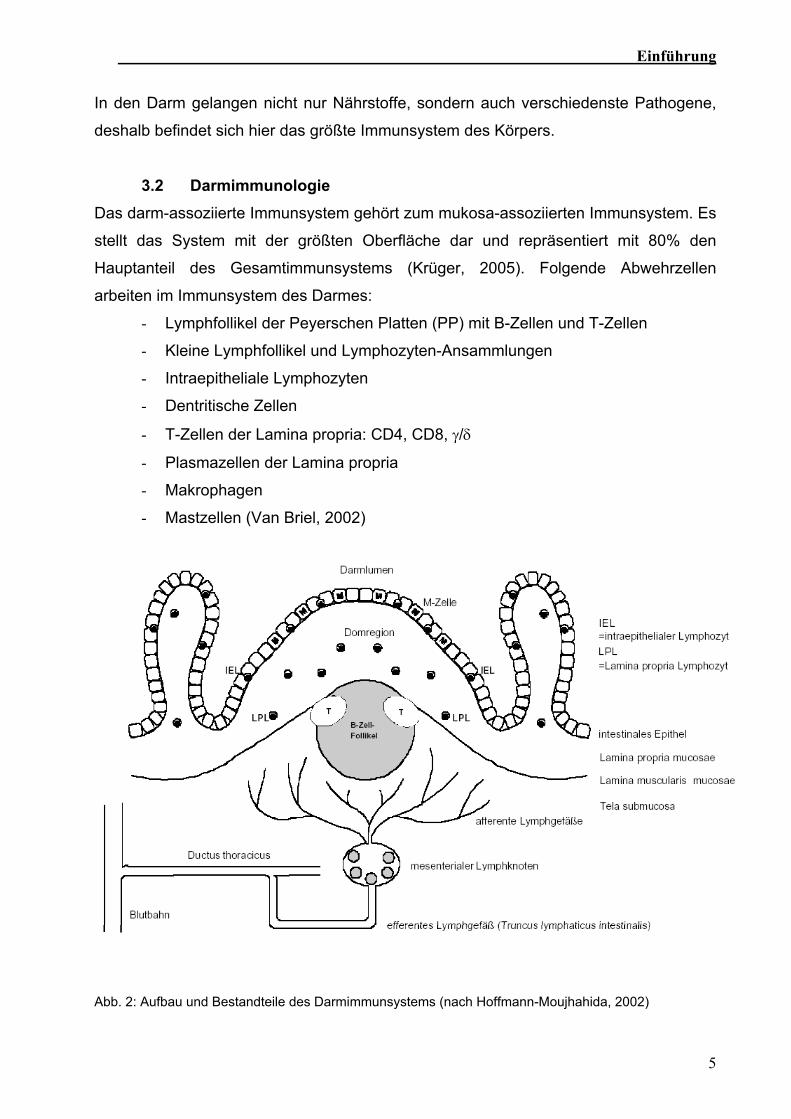
Abb. 2: Aufbau und Bestandteile des Darmimmunsystems (nach Hoffmann-Moujhahida, 2002)
5
Einführung
Im Darmimmunsystem findet die Präsentation der Antigene, welche von den M-Zellen
aufgenommen wurden, in der Domregion der Peyerschen Platten statt (Abb. 2). Diese
führt zur Aktivierung und Proliferation von B- und T-Zellen in den Peyerschen Platten
(Duchmann et al., 1999; Hoffmann-Moujahid, 2002; Mowat, 2003). Die
antigenaktivierten T- und B-Zellen verlassen die Peyerschen Platten über afferente
Lymphgefäße und gelangen dann in mesenteriale Lymphknoten (Roitt el al., 1995).
Zytokine sind regulatorisch wirkende, hormonähnliche Signalstoffe des Organismus, die
die Aktivitäten des humoralen und zellulären Immunsystems steuern. Zytokine werden
auch von intestinalen Epithelzellen gebildet (Ruemmele et al., 2002). Die verschiedenen
Zytokine, die von einer bestimmten Zelle sezerniert werden, erzeugen über ein
Zytokinnetzwerk vielfältige Wirkungen. Bestimmte Zytokine, wie TGFβ, Interleukin (IL)
1α und IL-6 werden im intestinalen Epithelium ständig exprimiert und spielen eine Rolle
für den basalen Influx der Immunzellen in die Mukosa, für das Wachstum der
Epithelzellen und für die Homöostase (Stadnyk, 1994). Zytokine beeinflussen auch die
Entwicklung und Reifung von Immunzellen und spielen eine entscheidende Rolle bei
der Auslösung, Regulation und Beendigung einer Immunantwort (Janeway und Travers,
1997). TNFα z. B. wird von vielen Zelltypen als Reaktion auf eine Entzündung, Infektion
oder Verletzung produziert, darunter auch Makrophagen, Monozyten und Lymphozyten
(Baud und Karin, 2001).
Neben einer effektiven Abwehr von Pathogenen muss das Darmimmunsystem
zuverlässig harmlose Nahrungsantigene und Bakterien als solche erkennen und
tolerieren, um überflüssige und schädliche Abwehrreaktionen zu vermeiden. Dies wird
als orale Toleranz bezeichnet (Duchmann et al., 1999; Hoffmann-Moujahid, 2002). Es
gibt neben den klassischen Nährstoffen auch Stoffe, die positive Einflüsse auf das
Darmsystem oder den ganzen Organismus besitzen, ohne einen Nährwert im engeren
Sinne zu haben. Dazu zählen Futterzusatzstoffe, wie Antibiotika, Probiotika, Prebiotika,
Säuren oder auch sekundäre Pflanzeninhaltstoffe.
3.3 Sekundäre Pflanzeninhaltsstoffe - Flavonoide Man schätzt, dass es etwa 10.000 verschiedene sekundäre Pflanzeninhaltsstoffe im
Pflanzenreich gibt, davon sind über 4.000 bereits identifiziert (Middleton et al., 2000). Zu
ihnen zählen z. B. Carotinoide, Phytosterine, Polyphenole, Saponine, Terpene, Phytin-
säure, Sulfide und Protease-Inhibitoren. Polyphenole werden in Phenolsäuren und
Flavonoide unterschieden.
6
Einführung
In den Pflanzen wirken Polyphenole antimikrobiell − als Schutz vor Insekten und gegen
Wundstress (Feucht und Treutter, 1989). Viele Blütenfarben basieren auf Phenolbasis
und sichern so das Überleben der Blütenpflanzen (Feucht und Treutter, 1989).
Die in der Nahrung am häufigsten vorkommenden Polyphenole sind Flavonoide (Böhm
et al., 1998). Man findet sie vor allem als Pigmente oder Bitterstoffe in Obst und
Gemüse, wie zum Beispiel in blauen Trauben, Grapefruits oder Sojabohnen (Watzl und
Leitzmann, 1999).
Strukturell gesehen bestehen alle Flavonoide aus zwei aromatischen und einem O-
heterozyklischen Ring. Derzeit sind etwa 6.500 verschiedene Strukturen bekannt (Watzl
und Rechkemmer, 2001). Anhand der strukturellen Unterschiede lassen sie sich in
Gruppen einteilen, z. B. Flavone, Flavonole, Flavanole (Catechine) und Anthocyane
(Watzl und Rechkemmer, 2001; Treutter 1989). Abgesehen von den meist als
Aglykonen vorliegenden Flavanolen, die auch in oligomerer Form z. B. in Äpfeln und
Rotwein gefunden werden, kommen die meisten Flavonoide als Flavonoidglykoside vor
(Watzl und Rechkemmer, 2001). Typische Vertreter der Flavanole sind Catechin,
Epicatechin, Epigallocatechin, Epicatechingallat und Epigallocatechingallate (Lambert
und Yang, 2003). Das Procyanidin B1 besteht aus je einem Molekül der monomeren
Flavanole Catechin und Epicatechin. Das Procyanidin B2 besteht formal aus zwei
Epicatechin-Einheiten, das Procyanidin C1 aus drei (Peterek, 2004).
Es wird angenommen, dass Flavonoide in der Nahrung sowohl antioxidative,
antimikrobielle als auch antivirale Wirkung entfalten können (Watzl und Leitzmann,
1999; Watzl und Rechkemmer, 2001). Nach epidemiologischen Studien schützt eine
polyphenolreiche Ernährung vor kardiovaskulären Krankheiten (Ness und Powles,
1997) und vor verschiedenen Krebsarten (Steinmetz und Potter, 1996). In
Tierversuchen sind antikanzerogene Eigenschaften der Flavonoide gegen Dickdarm-,
Brust- und Hautkrebs nachgewiesen worden (Watzl und Leitzmann, 1999; Watzl und
Rechkemmer, 2001).
Der immun-modulatorische Charakter der Flavonoide äußert sich in einer
Immunsuppression (Watzl und Leitzmann, 1999). Meist sorgen Flavonoide für eine
Blockade von Enzymsystemen oder von Sekretion pro-inflammatorischer Zytokine, was
sich in der Hemmung des Lymphozytenwachstums, der zytotoxischen T-Lymphozyten
und der „Natural Killer Cells“ äußert. Die Antigenpräsentation durch Makrophagen, die
Interleukin-2-Sekretion und Rezeptor-Expression sowie die Histaminfreisetzung aus
Mastzellen werden ebenfalls behindert. Eine Immunantwort in Form von
7
Einführung
Entzündungsreaktionen beziehungsweise allergischen Reaktionen könnte durch
Flavonoide gehemmt oder abgeschwächt werden (Watzl und Leitzmann, 1999; Watzl
und Rechkemmer, 2001).
Nach der Aufnahme von 300 ml Wein ist die PP-Konzentration im Darm mit ungefähr 3
mM sehr hoch. Dadurch können im Colon lokale antioxidative und antikanzerogene
Effekte hervorgerufen werden (Watzl und Leitzmann, 1999; Watzl und Rechkemmer,
2001). Die vorhandenen Daten zur Absorption von Polyphenolen sind immer noch
gering und oft kontrovers. In vivo Studien mit Ratten bzw. Menschen deuten an, dass
die biologische Verfügbarkeit von Polyphenolen abhängig vom Experiment und der
chemischen Struktur der jeweiligen Mischung der Polyphenole stark variiert (Hollman et
al., 1995 und 1997). Es wird davon ausgegangen, dass Polyphenole konzentrations-
abhängig aufgenommen werden (Carbonaro und Grant, 2005; Carbonaro et al., 2001).
Zahlreiche pharmakologische Wirkungen der Flavonoide sind bereits nachgewiesen;
tatsächlich können nur wenige Flavonoidpräperate eine ausgeprägte Wirksamkeit in
vivo erzielen. Gründe für diese Diskrepanz sind möglicherweise ein partieller Abbau
bzw. eine partielle Umsetzung von Flavonoiden durch die Darmflora (Spencer, 2003),
eine unzureichende Resorption und eine rasche Ausscheidung und Metabolisierung
nach erfolgter Resorption (Böhm et al., 1998).
In der Natur liegen Polyphenole in Verbindung mit anderen Nährstoffen vor, was sich
wiederum auf die Aufnahme auswirkt (Böhm et al., 1998). Nicht nur Obst und Gemüse
sind reich an Polyphenolen, sondern auch deren Trester (Sanchez-Rabaneda et al.,
2004; Mazza, 1995).
3.4 Apfeltrester Bei der Gewinnung von Apfelsaft fällt als Reststoff Apfeltrester an. Der durchschnittliche
Gehalt an Polyphenolen beträgt 3 g/kg Frischgewicht in Äpfeln, und variiert von 0,5-11
g/kg (Stoll, 1997). Apfeltrester ist reich an sekundären Inhaltsstoffen; zirka 80% der
Polyphenole verbleiben mit der Apfelschale im Trester. In Deutschland fallen jährlich
ungefähr 250.000 Tonnen Apfeltrester an (FAOSTAT).
Die Apfelschale enthält hauptsächlich Procyanidine, Catechin, Epicatechin, Phoridzin
und Quercetinkonjugate als Polyphenole. Dabei sind Quercetinkunjugate ausschließlich
in der Apfelschale vorhanden (Escarpa und Gonzalez, 1998). Apfelschalen besitzen
zwei- bis sechsmal so viele Phenole und zwei- bis dreimal so viele Flavonoide als das
Fruchtfleisch (Wolfe et al., 2003).
8
Einführung
Inhaltsstoffe von Äpfeln zeigten in Zellkulturversuchen antiproliferative Eigenschaften
(Eberhardt et al., 2000; Wolfe et al., 2003; da Silva Porto et al., 2003). Viele
epidemiologische Studien beweisen eine Beziehung zwischen dem Konsum von Äpfeln
und einem reduzierten Risiko von chronischen Erkrankungen wie kardiovaskuläre
Erkrankungen, Krebs und Asthma (Woods et al., 2003; Willett, 2002; Ames et al., 1993).
In vitro Studien und Tierversuche haben gezeigt, dass der Konsum von Äpfeln die
Lipidoxidation inhibiert und das Cholesterin reduziert (Boyer und Liu, 2004).
In der Schweinefütterung ist bereits bekannt, dass Apfeltrester die durch das Mykotoxin
Deoxynivalenol verursachte Wachstumsreduktion vermindert (Gutzwiller und Stoll,
2005).
3.5 Weintrester Rot- und Weißweintrester fallen bei der Weinerzeugung an. Während weiße Trauben
direkt nach der Ernte mit den Stielen gepresst werden, werden bei der
Rotweinherstellung die Trauben erst entrappt, d. h. die Beeren werden vom Stiel
entfernt und als Maische mit dem Zusatz von Hefe zur Gärung gebracht. Nach drei bis
fünf Tagen Gärung wird die Maische abgewirzt (=ausgepresst). Bei beiden Weinsorten
bleibt der Trester als Reststoff übrig. Ein Liter Rotwein enthält etwa 2 g Polyphenole
(Scalbert und Williamson, 2000). 1999 wurden in Deutschland 10.000.000 Hektoliter
Wein ausgebaut (70% Weißwein, 30% Rotwein). Das bedeutet, dass jährlich ungefähr
2.500.000 Tonnen Trester anfallen (Weinstatistik, 1999). Im Trester verbleiben beim
Pressen circa zwei Drittel der Polyphenole (Mazza, 1995).
Wein enthält eine Reihe von sekundären Pflanzeninhaltsstoffen, wie zum Beispiel
phenolische Säuren, Stilbene und Flavonoide (Soleas et al., 1997). Im Rotwein sind vor
allem Anthocyane enthalten. Die Flavonoide kommen überwiegend in der Traubenhaut
und in den Kernen vor, Flavonole und Anthocyane in der Haut, Catechine und
Leukoanthocyane in den Kernen. Im Rotwein machen Flavonoide circa 85% der
gesamten Phenole aus (Soleas et al., 1997).
9
Fragestellung
4. FRAGESTELLUNG In der EU sind Antibiotika als Leistungsförderer in der Tierernährung seit 1. Januar 2006
(Verordnung (EG) Nr. 183/2003 Artikel 11 Absatz 2) verboten. Vier verschiedene
Wirkungen sind bisher für die positiven Effekte der antibiotischen Leistungsförderer
nachgewiesen: Inhibition von subklinischen Infekten, Reduktion von
wachstumshemmenden mikrobiellen Metaboliten, Reduktion des Nährstoffverbrauchs
durch Bakterien und Erhöhung der Nährstoffaufnahme durch eine dünnere Darmwand
(Francois, 1962; Visek, 1978; Anderson et al., 1999).
Um die Darmgesundheit der Tiere zu gewährleisten und um finanzielle Verluste durch
geringere tägliche Zunahmen und Totalverluste zu minimieren, werden alternative
Futterzusätze, wie Probiotika, Prebiotika, Synbiotika, organische Säuren und deren
Salze, Enzyme, Kräuter, Seltene Erden und Pflanzenextrakte wie sekundäre Pflanzen-
inhaltsstoffe diskutiert (Bach Knudsen, 2001; Scalbert and Williamson, 2000;
Bezkorovainy, 2001; Recht, 2005).
In dieser Studie sollen verschiedene sekundäre Pflanzeninhaltsstoffe, als
Reinsubstanzen und als natürliches Gemisch im Trester auf ihre positive Wirkung auf
das Entzündungsgeschehen, die Darmmorphologie, das Darmimmunsystem und die
Darmflora von Absetzferkeln getestet werden.
Ziel dieser Dissertation war erstens die Auswirkungen von den Polyphenolen
Epigallcatechin-3-Gallate (EGCG) und Catechin auf Entzündungsmarker in vitro zu
testen. Zweitens sollten polyphenolreicher Apfel- und Rotweintrester in vivo auf seine
Fähigkeit, die Darmgesundheit und das Entzündungs- und Apoptosegeschehen zu
beeinflussen, untersucht werden. Dabei sollten moderne biotechnologische Techniken
wie Histologie, HPLC und two-step RT-PCR eingesetzt und eine real-time one-step RT-
PCR etabliert werden.
Durch den komplexen Aufbau des Fütterungsversuches waren nicht nur die Einflüsse
der polyphenolreichen Fütterungen mit einer Kontrollfütterung eingehend zu vergleichen
werden, sondern durch die Tiere in einer definierten Wachstumsphase vor und während
des Absetzens zu untersuchen.
10
Material und Methoden
5. MATERIAL UND METHODEN 5.1 Vorversuch
Im Vorversuch wurden weiße Blutzellen (WBZ) einer laktierenden Milchkuh in Zellkultur
genommen und mit verschiedenen Konzentrationen der beiden Flavanoiden, Catechin
und Epigallocatechingalat (EGCG), behandelt. Zur Simulation eines Immunstimulus
behandelte man die WBZ zusätzlich mit Concanavalin A (ConA), einem T-Zell
spezifischen Mitogen, in verschiedenen Konzentrationen und Behandlungsabläufen.
5.1.1 Zellkultur
Das Blut wurde bei der Entnahme mit Ethylendiaminetraessigsäure (EDTA) stabilisiert
und auf Eis gelagert. Nach Abtrennung der WBZ wurden diese in Zellmedium
aufgenommen und ausgesät (Sehm et al., 2005).
5.1.2 Behandlung 1: Verschiedene Konzentrationen
Zwei Tage nach dem Aussäen der Zellen fand die Stimulation der WBZ mit
verschiedenen Konzentrationen ConA (0; 0,01; 0,1 und 1 µg/ml Medium) statt. Sechs
Stunden danach erfolgte die Behandlung mit den verschiedenen Konzentrationen
EGCG (95% rein, aus grünem Tee extrahiert, Sigma-Aldrich, Steinheim, Deutschland)
oder Catechin (Sigma-Aldrich). Jede Flavanol-Konzentration (0; 0,1; 1; 10; 30 und 100
µM) wurde mit jeder ConA-Konzentration kombiniert und mit jeweils fünf
Wiederholungen getestet (Sehm et al., 2005).
5.1.3 Behandlung 2: Verschiedene Behandlungsabläufe
Im zweiten Zellkulturversuch fand die ConA Stimulation einmal sechs Stunden vor und
einmal sechs Stunden nach der Flavanol-Behandlung bzw. gleichzeitig mit dieser statt.
Die erste Gabe ConA bzw. EGCG/Catechin erfolgte jeweils nach 24 Stunden. Die
Konzentration von ConA betrug 0,1 µg/ml Medium, von EGCG bzw. Catechin 0, 30 und
100 µM.
5.1.4 RNA Extraktion aus Zellkultur
Die Zellen wurden geerntet und die Gesamt-RNA mit TriFast (peqlap, Erlangen,
Deutschland) nach Herstellerangaben extrahiert. Die RNA Konzentration wurde
spektrometrisch ermittelt und eine RT durchgeführt (Sehm et al., 2005).
11
Material und Methoden
5.1.5 Two-step RT-PCR
Die relative Quantifizierung der cDNA (respektive mRNA) erfolgte mit dem LightCycler
(Roche Diagnosticts) für die Gene GAPDH, cFos, TNFα, IL-1β, IL-6 und Histon H3
(Sehm et al., 2005). Die ∆∆CP (crossing point)-Methode (Schmittgen, 2001; Livak und
Schmittgen, 2001) wurde mit GAPDH als Referenzgen durchgeführt. Positive ∆∆CP
Werte entsprechen einer Hochregulierung, negative ∆∆CP Werte einer Abregulierung
der mRNA Genexpression, verglichen mit der Kontrollgruppe.
FOR REV EMBL
Zugangsnummer Produkt-
länge Annealing
°C GAPDH gc ttc act acc atg gag aag g tca tgg atg acc ttg gcc ag U 85042 197 bp 60°C
cFos act cca ggc gga gac aga ggt gaa ggc ctc ctc aga AY 322482 302 bp 59°C TNFa taa caa gcc ggt agc cca cg gca agg gct ctt gat ggc aga AF 011926 256 bp 62°C IL-1β ttc tct cca gcc aac ctt cat t atc tgc agc tgg atg ttt cca t M 37211 198 bp 60°C IL-6 atg aat ccc gct tca caa gcg c ccg aat agc tct cag gct gaa ctg NM 173923 200 bp 60°C
Histon H3 act ggc tac aaa agc cgc tc act tgc ctc ctg caa agc ac BT 020962 232 bp 60°C
Tab. 1: Primer für bovine Sequenzen, die im Zellkulturversuch verwendet wurden
5.1.6 Statistik
Für die Statistik fand das Programm Sigma Stat (SPSS Science, Chicago, USA)
Verwendung. Der Vergleich der Mittelwerte erfolgte mittels TWO WAY ANOVA
(Polyphenol-Konzentration und ConA Konzentration). P-Werte unter 0,05 wurden als
signifikant angesehen. Die Werte der EGCG bzw. Catechin-Behandlungsgruppen
wurden mit der unbehandelten Kontrollgruppe derselben ConA Konzentration
verglichen.
5.2 Fütterungsversuch
5.2.1 Tiere
Der Fütterungsversuch umfasste insgesamt 78 Ferkel [Piétrain x (Deutsche Landrasse
x Deutsches Edelschwein)]. 30 Kontrolltiere wurden mit einem handelsüblichen
Ferkelfutter (SR), je 24 Ferkel mit jeweils 3,5% Trockensubstanz (TS) getrocknetem
Apfeltrester (AT) bzw. Rotweintrester (RWT) angereicherter Standardration gefüttert.
Die Tiere wogen zu Versuchsbeginn 7,5 ± 1,8 kg und waren durchschnittlich 24 (± 1,1
Tage) alt. Eine Gruppe bestand jeweils aus drei weiblichen und drei männlichen,
kastrierten Tieren.
12
Material und Methoden
5.2.2 Futtermittel
Der Apfeltrester wurde von der Fachhochschule Weihenstephan, der Weintrester vom
Weingut Armin Loos (Weingut Loos in Dingolshausen) zur Verfügung gestellt. Die
Trester wurden aus dem üblichen Verfahren entnommen, auf -20°C gekühlt und
anschließend in der Versuchsstation Grub getrocknet. Im Lehrstuhl für Obstbau wurden
die verschiedenen Futtermittel auf Polyphenole getestet (s. 4.2.2). Energie, Fett, Protein
und Eiweiß waren in den verschiedenen Rationen ausbalanciert (Sehm et al., in press).
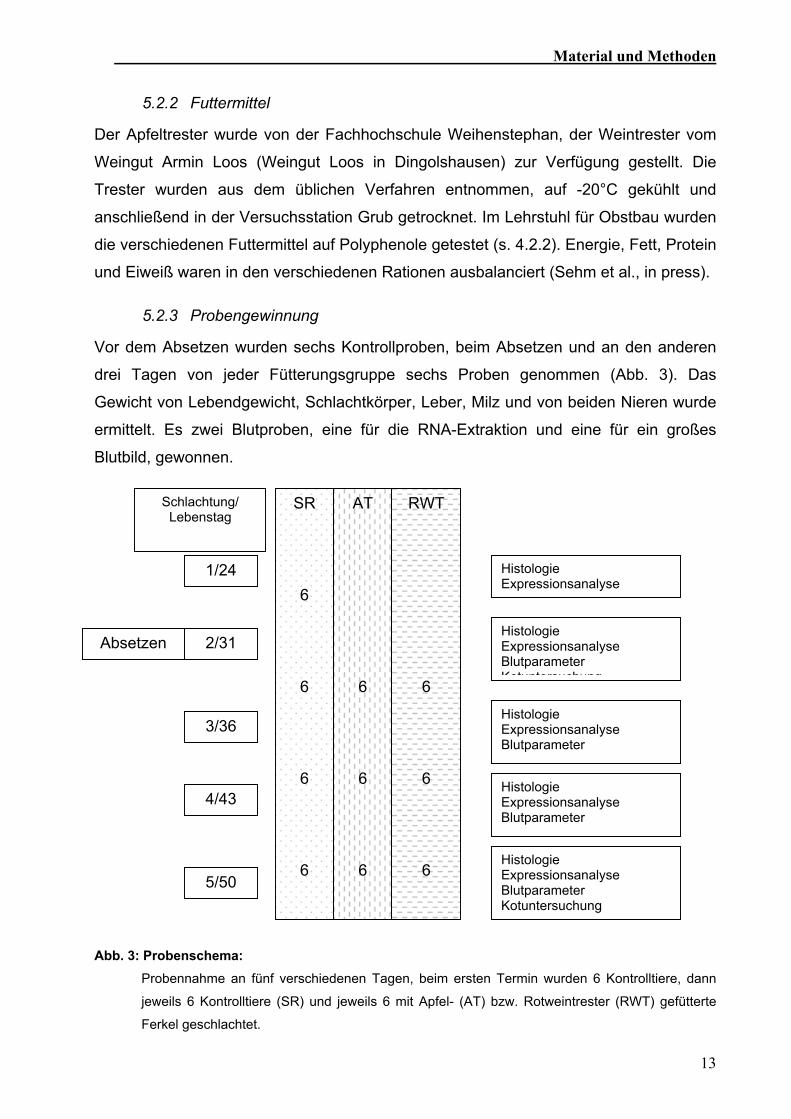
5.2.3 Probengewinnung
Vor dem Absetzen wurden sechs Kontrollproben, beim Absetzen und an den anderen
drei Tagen von jeder Fütterungsgruppe sechs Proben genommen (Abb. 3). Das
Gewicht von Lebendgewicht, Schlachtkörper, Leber, Milz und von beiden Nieren wurde
ermittelt. Es zwei Blutproben, eine für die RNA-Extraktion und eine für ein großes
Blutbild, gewonnen.
RWT 6 6 6
AT 6 6 6
SR 6 6 6 6
Schlachtung/ Lebenstag
1/24 Histologie Expressionsanalyse
Histologie Expressionsanalyse Blutparameter Kotuntersuchung
2/31 Absetzen
Histologie Expressionsanalyse Blutparameter
3/36
Histologie Expressionsanalyse Blutparameter
4/43
Histologie Expressionsanalyse Blutparameter Kotuntersuchung
5/50
Abb. 3: Probenschema:
Probennahme an fünf verschiedenen Tagen, beim ersten Termin wurden 6 Kontrolltiere, dann
jeweils 6 Kontrolltiere (SR) und jeweils 6 mit Apfel- (AT) bzw. Rotweintrester (RWT) gefütterte
Ferkel geschlachtet.
13
Material und Methoden
Von Leber, Milz, Niere, mesenterialen Lymphknoten, Magen, Jejunum, Ileum, Colon
und Muskel entnahm man circa 0,5 cm³ große Gewebeproben für die RNA-Extraktion
und fror sie sofort in flüssigem Stickstoff ein. Von Jejunum, Ileum, Colon und
mesenterialen Lymphknoten wurden zusätzlich Gewebeproben in 3,7%iger
Formaldehydlösung für die histologischen Untersuchungen fixiert. Bei der 2. und bei der
5. Schlachtung wurden Inhaltsproben aus dem Colon genommen. Von den 18 ältesten
Tieren wurden sowohl Inhaltsproben von Magen und Colon, als auch Gewebeproben
von Ileum, Leber und Niere für eine Polyphenolanalyse eingefroren.
5.2.4 Polyphenoluntersuchung in Futtermitteln, Darminhalten und Geweben
In Zusammenarbeit mit dem Lehrstuhl für Obstbau (Prof. Treutter) fanden die
Untersuchungen von Futtermitteln, Darminhaltsproben und Gewebeproben auf
Polyphenole statt.
Die Phenole wurden mit Ethanol bzw. mit Säure extrahiert (Sehm et al. in Vorbereitung).
Die Trennung und quantitative Bestimmung der phenolischen Inhaltsstoffe der Proben
erfolgten durch eine Kombination aus einer Hochdruckflüssigkeitschromatographie
(HPLC) mit UV-Detektion (bei 280nm) und einer Nachsäulenderivatisierung (Treutter,
1989). Mit der Zumischung von DMAZA entstehen vorübergehend selektive Bindungen
des Reagenz an Flavanole. Diese Derivatisierungsprodukte können bei einer
Wellenlänge von 640nm sensitiv detektiert werden (Treutter, 1989).
5.2.5 Kotuntersuchungen
Die Kotproben wurden beim Tiergesundheitsdienst Bayern in Grub auf die Gesamtzahl
der aeroben und anaeroben Bakterien, Streptococci, Lactobacilli, E. coli und C.
perfingens nach der Methode von Bollmann getestet (Bollmann, 2002).
5.2.6 Untersuchung des Blutes
Das große Blutbild wurde in einem tierärztlichen Labor erstellt (vetmed Labor,
Ludwigsburg, Deutschland). Dabei wurden Erythrozyten, Hämoglobin, Hämatokrit und
Thrombozyten bestimmt. Leukozyten wurden in Lymphozyten, Monozyten,
segmentkernige, stabkernige, basophile und eosinophile Granulozyten unterschieden.
5.2.7 Histologische Untersuchungen
In den drei Darmabschnitten Jejunum, Ileum und Colon sind HE-Übersichtsfärbungen
durchgeführt worden (Sehm et al., in press). In Jejunum und Ileum wurden je drei
14
Material und Methoden
Zottendicken, Kryptentiefen und Zottenlängen, im Colon Zottendicken und Kryptentiefen
aller 78 Tiere vermessen. Daraus wurde eine idealisierte Zottenfläche errechnet. Die
Ermittlung der Flächen der PP, ebenfalls als Mittelwert aus drei Werten, erfolgte per
Hand. Außerdem wurden zehn Epithelzellen im jejunalem Zottenrand vermessen (Sehm
et al., in press).
5.2.8 RNA Extraktion aus Gewebe
Jeweils 50mg Gewebe wurden auf 500 µl TriFast (PeqLab) eingewogen und mit Hilfe
vom UltraTurrax (IKA, Staufen, Germany) zerkleinert. Danach verlief die Extraktion der
Gesamt-RNA und die Messung der RNA-Menge und Qualität analog zur Zellkultur
(Sehm et al., 2005).
5.2.9 One-step RT-PCR
Im Gegensatz zu der Zellkultur wurde die Expressionsanalyse im Tierversuch im one-
step-Verfahren durchgeführt. Um im Hochdurchsatz arbeiten zu können, wurde der ep
realplex Cycler (Eppendorf, Hamburg) mit 96-well-Format verwendet. Die relative
Quantifizierung der mRNA erfolgte für Histon, NFκB, TNFα, IL-10, IGF-1, Cyclin D1 und
Caspase 3 (Sehm et al., accepted).
For Rev EMBL
Zugangsnummer Produkt-
länge Annealing
°C Histon act cgc tac aaa agc cgc tc act tgc ctc ctg caa agc ac NM 213930 232 60 NFκB ggt gga gaa ctt tga gcc tc cca gag acc tca tag ttg tcc NM 003998 230 58 TNFα ccc cca gaa gga aga gtt tc ttg gcc cct gaa gag gac X 57321 246 60 IL-10 act tta agg gtt acc tgg gtt g gta gac acc cct ctc ttg ga NM 214041 349 60 IGF-1 cgc atc tct tct atc tgg cc ctg agc ctt ggg cat gtc X 15726 311 60
Cyclin D1 tcc tgt gct gcg aag tgg a ggt cca ggt agt tca tgg c BC 014078 246 60 Caspase 3 tgt gtg ctt cta agc cat gg agt tct gtg cct cgg cag NM 214131 160 60
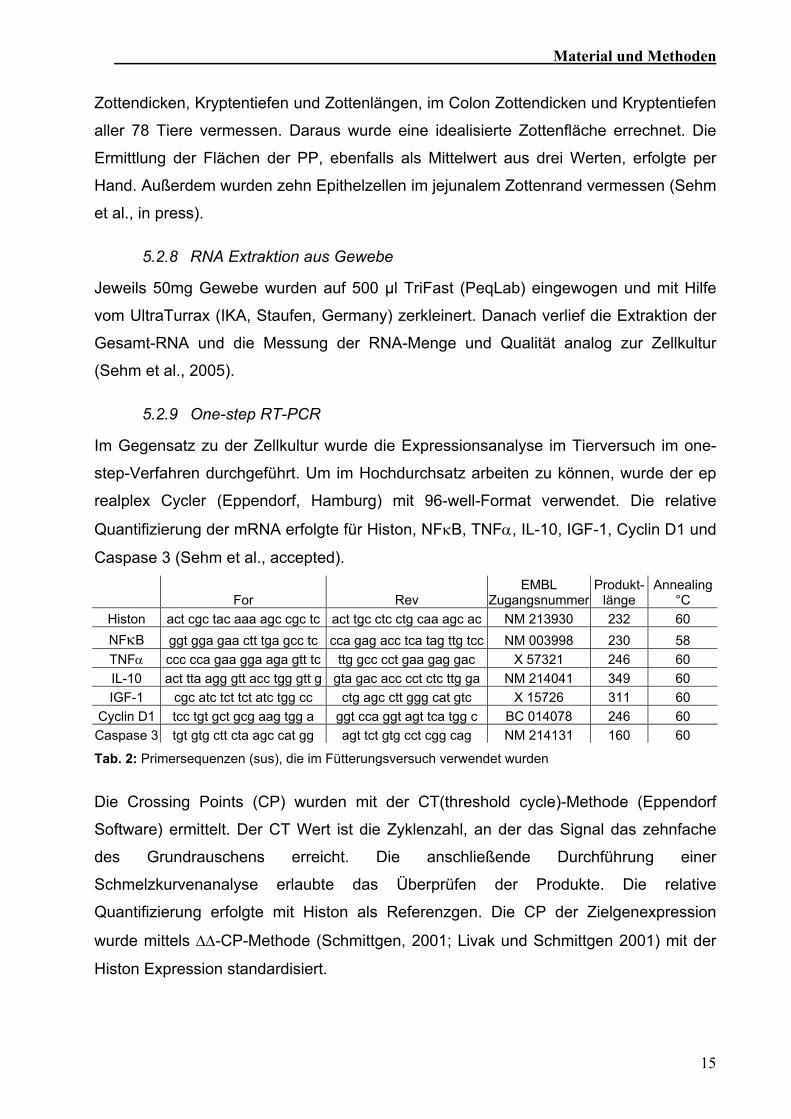
Tab. 2: Primersequenzen (sus), die im Fütterungsversuch verwendet wurden
Die Crossing Points (CP) wurden mit der CT(threshold cycle)-Methode (Eppendorf
Software) ermittelt. Der CT Wert ist die Zyklenzahl, an der das Signal das zehnfache
des Grundrauschens erreicht. Die anschließende Durchführung einer
Schmelzkurvenanalyse erlaubte das Überprüfen der Produkte. Die relative
Quantifizierung erfolgte mit Histon als Referenzgen. Die CP der Zielgenexpression
wurde mittels ∆∆-CP-Methode (Schmittgen, 2001; Livak und Schmittgen 2001) mit der
Histon Expression standardisiert.
15

Material und Methoden
5.2.10 Statistik
Für die statistischen Berechnungen wurde Sigma Stat 2.03 (SPSS Science, Chicago,
USA) verwendet. Der Vergleich der Mittelwerte erfolgte mittels TWO WAY ANOVA
(Zeitpunkt und Fütterung). Die Apfeltrester- und die Rotweintrestergruppe wurde mit der
Kontrollgruppe zum jeweiligen Zeitpunkt verglichen (P Werte unter 0,05 signifikant).
Zusätzlich wurden lineare Regressionen über die Zeit von den drei Fütterungsgruppen
berechnet.
16
Ergebnisse
6. ERGEBNISSE 6.1 Zellkultur
Alle getesteten Gene zeigten einen Scheitelpunkt in der Schmelzkurvenanalyse
(LightCycler Software 3.5; Roche Diagnostics, Mannheim) und eine Einzelbande in
einer hochauflösenden 4%igen Agarose-Gelelektophorese. Weder ConA-Stimulation
noch Catechin- bzw. EGCG-Behandlung beeinflusste die mRNA Expression des
Referenz-Gens GAPDH (Sehm et al., 2005).
6.1.1 Expressionsanalyse: Verschiedene Konzentrationen
Im ersten Zellkulturansatz, in dem zuerst mit ConA und dann mit EGCG bzw. Catechin
stimuliert wurde, reduzierte sich die Gesamt-RNA-Menge jedes Zellkulturansatzes
durch die Polyphenolgabe. Bei Catechin (p<0,005) war die Reduktion durchgehend, bei
EGCG (p<0,001) wurde bei niedrigeren Konzentrationen bis zu 1 µM eine Induktion der
Gesamt-RNA-Konzentration festgestellt (Sehm et al., 2005).
Catechin verursachte eine Aufregulierung der TNFα mRNA Expression (p<0,05),
besonders bei geringen ConA Konzentrationen. EGCG erhöhte TNFα mRNA
Expression nur in Konzentrationen bis zu 1 µM. Hohe ConA Gaben überlagerten die
Effekte von EGCG und Catechin.
Die Behandlung mit den beiden Flavonoiden beeinflusste die IL-6 und IL-1β
Expressionshöhen nicht. ConA hatte nur wenig Effekt auf die Induktion oder Repression
der Genexpression von IL-6 und IL-1β in der untersuchten bovinen Zellkultur.
Die RNA-Synthese von Histon H3 war über die Konzentraten hinweg gleichmäßig,
unabhängig von Flavanol und ConA Stimulation, wie man es von einem Referenz-Gen
erwartet (Sehm et al., 2005). Lediglich bei einer Flavanolgabe von 10-30 µM ohne
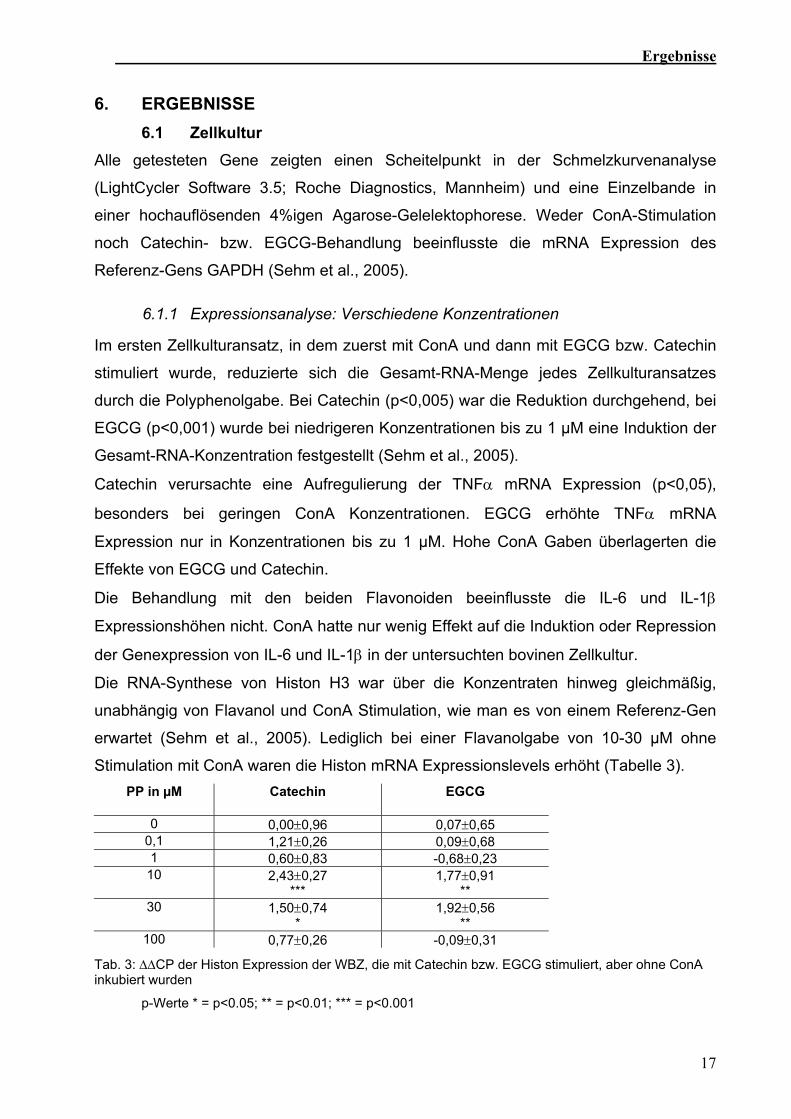
Stimulation mit ConA waren die Histon mRNA Expressionslevels erhöht (Tabelle 3). PP in µM Catechin EGCG
0 0,00±0,96 0,07±0,65 0,1 1,21±0,26 0,09±0,68 1 0,60±0,83 -0,68±0,23
10 2,43±0,27 ***
1,77±0,91 **
30 1,50±0,74 *
1,92±0,56 **
100 0,77±0,26 -0,09±0,31
Tab. 3: ∆∆CP der Histon Expression der WBZ, die mit Catechin bzw. EGCG stimuliert, aber ohne ConA inkubiert wurden
p-Werte * = p<0.05; ** = p<0.01; *** = p<0.001
17
Ergebnisse
6.1.2 Expressionsanalyse: Verschiedene Behandlungsabläufe
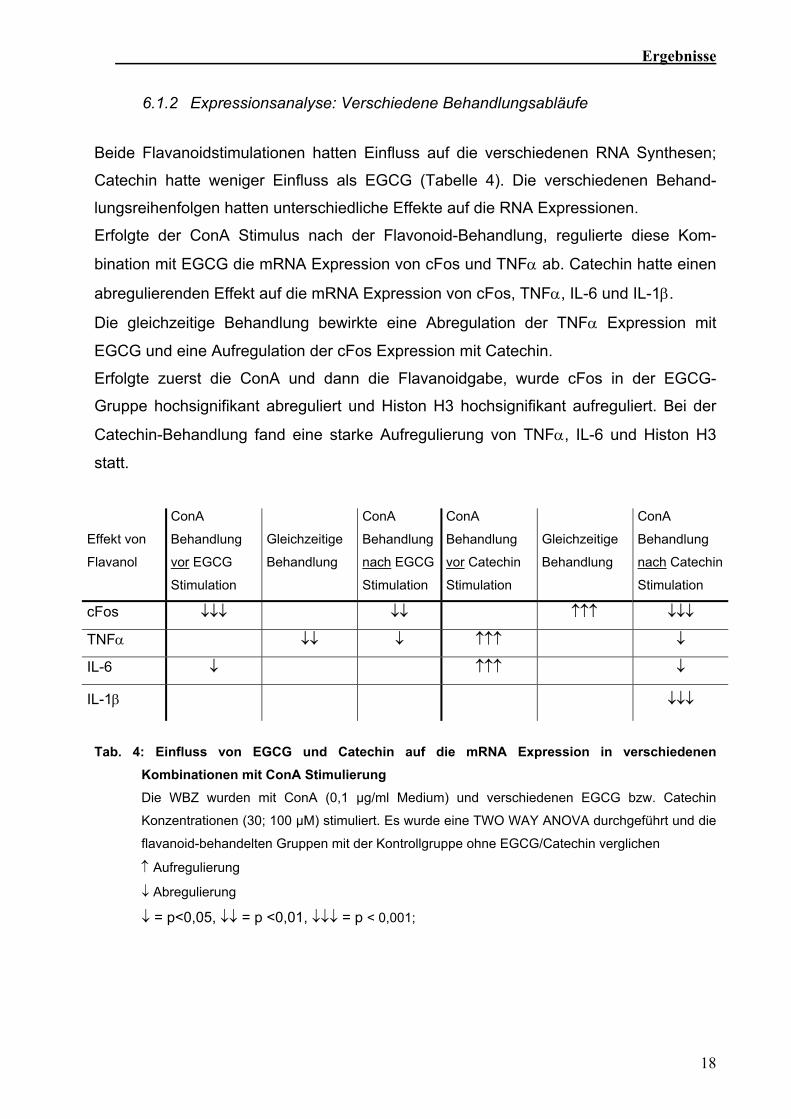
Beide Flavanoidstimulationen hatten Einfluss auf die verschiedenen RNA Synthesen;
Catechin hatte weniger Einfluss als EGCG (Tabelle 4). Die verschiedenen Behand-
lungsreihenfolgen hatten unterschiedliche Effekte auf die RNA Expressionen.
Erfolgte der ConA Stimulus nach der Flavonoid-Behandlung, regulierte diese Kom-
bination mit EGCG die mRNA Expression von cFos und TNFα ab. Catechin hatte einen
abregulierenden Effekt auf die mRNA Expression von cFos, TNFα, IL-6 und IL-1β.
Die gleichzeitige Behandlung bewirkte eine Abregulation der TNFα Expression mit
EGCG und eine Aufregulation der cFos Expression mit Catechin.
Erfolgte zuerst die ConA und dann die Flavanoidgabe, wurde cFos in der EGCG-
Gruppe hochsignifikant abreguliert und Histon H3 hochsignifikant aufreguliert. Bei der
Catechin-Behandlung fand eine starke Aufregulierung von TNFα, IL-6 und Histon H3
statt.
Effekt von
Flavanol
ConA
Behandlung
vor EGCG
Stimulation
Gleichzeitige
Behandlung
ConA
Behandlung
nach EGCG
Stimulation
ConA
Behandlung
vor Catechin
Stimulation
Gleichzeitige
Behandlung
ConA
Behandlung
nach Catechin
Stimulation
cFos ↓↓↓ ↓↓ ↑↑↑ ↓↓↓
TNFα ↓↓ ↓ ↑↑↑ ↓
IL-6 ↓ ↑↑↑ ↓
IL-1β ↓↓↓
Tab. 4: Einfluss von EGCG und Catechin auf die mRNA Expression in verschiedenen
Kombinationen mit ConA Stimulierung Die WBZ wurden mit ConA (0,1 µg/ml Medium) und verschiedenen EGCG bzw. Catechin
Konzentrationen (30; 100 µM) stimuliert. Es wurde eine TWO WAY ANOVA durchgeführt und die
flavanoid-behandelten Gruppen mit der Kontrollgruppe ohne EGCG/Catechin verglichen
↑ Aufregulierung
↓ Abregulierung
↓ = p<0,05, ↓↓ = p <0,01, ↓↓↓ = p < 0,001;
18
Ergebnisse
6.2 Fütterungsversuch
6.2.1 Allgemeine Wachstumsdaten
Alle Tiere waren während des Versuchs gesund, manche Tiere schieden einen weichen
Kot aus. Keines der Tiere musste während der Versuchszeit medizinisch behandelt
werden. Zwischen den verschiedenen Behandlungen zeigten sich weder Unterschiede
bei der Aufnahme von Futter und Energie noch bei den täglichen Zunahmen. Die
täglichen Futteraufnahmen beliefen sich in der ersten Woche nach dem Absetzen auf
0,13 kg/Tag, auf 0,31 kg/Tag in der zweiten und auf 0,55 kg/Tag in der dritten Woche.
An den verschiedenen Schlachtterminen hatten die Tiere ein durchschnittliches Gewicht
von 8,6 ± 0,7 kg, dann 7,5 ± 1,1 kg, 8,7 ± 1,0 kg, 10,8 ± 1,4 kg und 13,15 ± 1,6 kg. Die
Lebend- und Schlachtgewichte nahmen mit dem Lebensalter zu; zwischen den
Fütterungsgruppen zeigten sich jedoch keine Unterschiede.
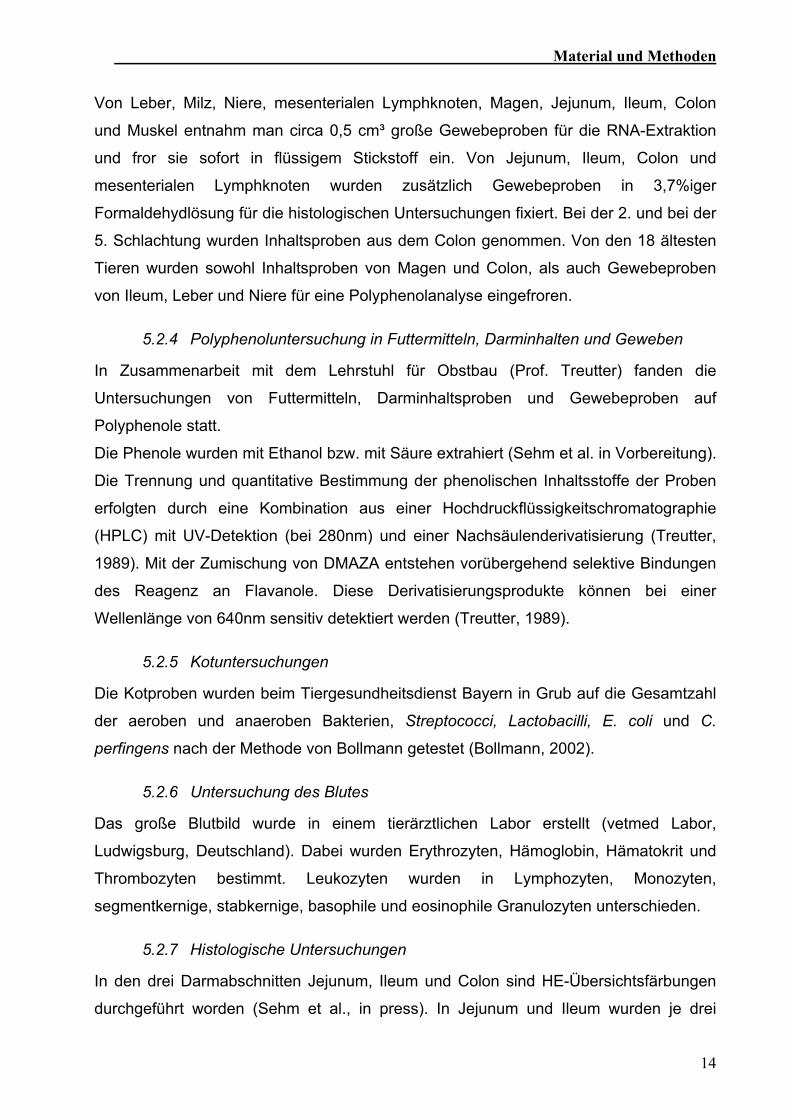
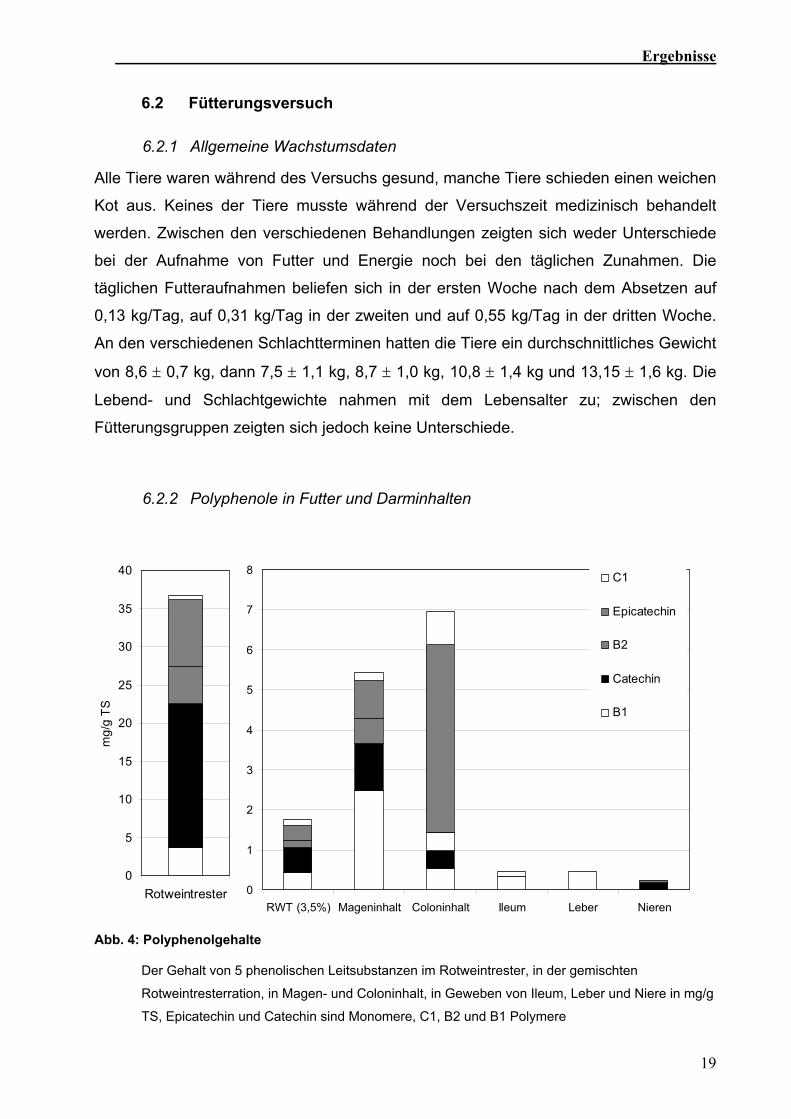
6.2.2 Polyphenole in Futter und Darminhalten
0
1
2
3
4
5
6
7
8
RWT (3,5%) Mageninhalt Coloninhalt Ileum Leber Nieren
C1
Epicatechin
B2
Catechin
B1
0
5
10
15
20
25
30
35
40
Rotweintrester
mg/
g TS
Abb. 4: Polyphenolgehalte
Der Gehalt von 5 phenolischen Leitsubstanzen im Rotweintrester, in der gemischten
Rotweintresterration, in Magen- und Coloninhalt, in Geweben von Ileum, Leber und Niere in mg/g
TS, Epicatechin und Catechin sind Monomere, C1, B2 und B1 Polymere
19
Ergebnisse
Fünf Flavanole wurden als Leitsubstanzen ausgewertet (Abb. 4). Catechin und
Epicatechin sind Monomere. Das Procyanidin B1 besteht aus je einem Molekül der
monomeren Flavanole. Das Procyanidin B2 besteht formal aus zwei Epicatechin-
Einheiten, das Procyanidin C1 aus drei (Peterek, 2004).
Die Polyphenolanalysen ergaben, dass sich C1, B2 und Epicatechin in der
Trockenmasse relativ zu dem Futter anreichern (Abb. 4). Die verschiedenen Gewebe
enthielten Spuren der einzelnen Polyphenole (Sehm et al., in Vorbereitung).
6.2.3 Bakterienzusammensetzung im Kot
Die RWT wiesen einen weicheren Kot auf als die beiden anderen Fütterungsgruppen.
Die aerobe Gesamtkeimzahl nahm während des Versuches über alle
Fütterungsgruppen hinweg zu, die Anzahl der anaeroben Keime wies keine
signifikanten Unterschiede zwischen den Zeitpunkten auf. Die Anzahl der Steptococci /
Enterococci nahm sowohl in der SR, als auch in der RWT zu, während sie sich bei der
AT nicht veränderte. In der zweiten Messung wiesen die AT und die RWT einen
signifikanten Anstieg der Anzahl der Laktobazillen zur ersten Messung auf (Sehm et al.,
in Vorbereitung).
6.2.4 Blutbild
Der Verlauf der verschiedenen getesteten Blutparameter ist in Tabelle 5 dargestellt.
Stabkernige (0±0), basophile (0,32±0,78) and eosinophile Granulozyten (0,48±1,05)
kamen in so geringer Anzahl vor, dass sie nicht statistisch ausgewertet wurden. Die
Zahl der Leukozyten stieg in der SR über die Zeit an. Hämoglobingehalt und Hämatokrit
fielen über die Zeit ab. Beide Parameter veränderten sich in den Tresterfütterungen
stärker als in der SR. Die Anzahl der Thrombozyten veränderte sich nur in der RWT,
dort nahm sie hoch signifikant zu (Sehm et al., in Vorbereitung).
20
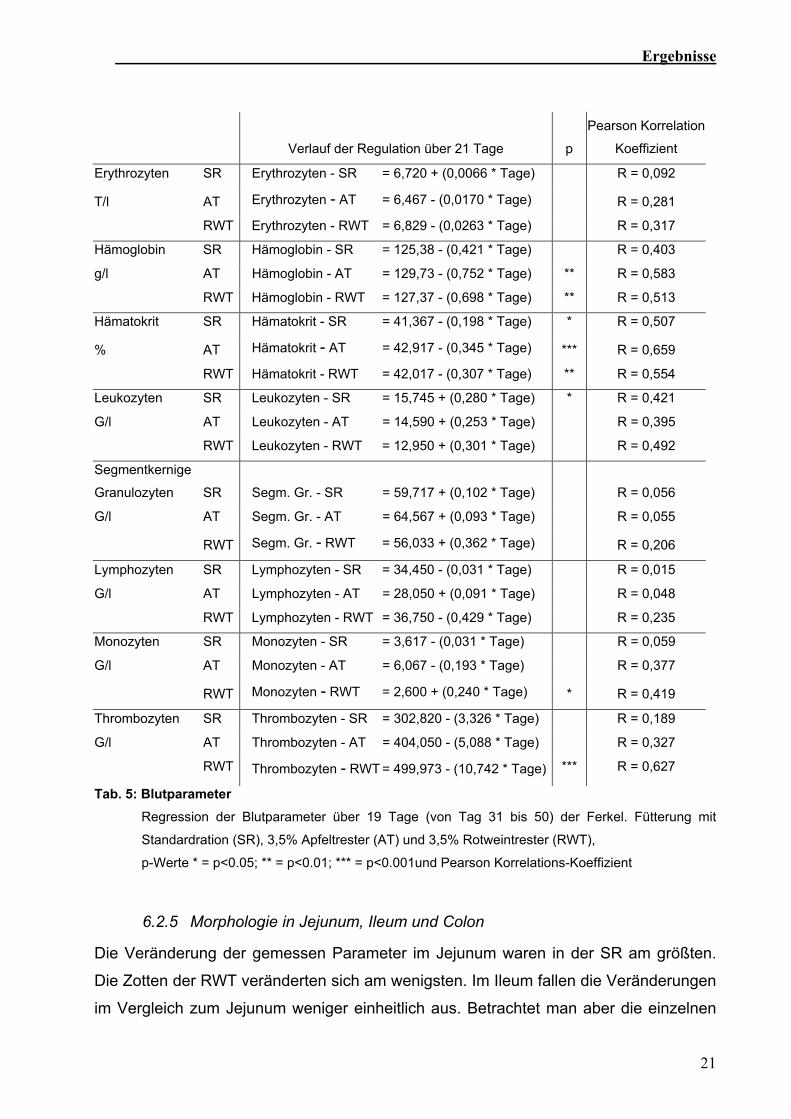
Ergebnisse
Verlauf der Regulation über 21 Tage p
Pearson Korrelation
Koeffizient
Erythrozyten SR Erythrozyten - SR = 6,720 + (0,0066 * Tage) R = 0,092
T/l AT Erythrozyten - AT = 6,467 - (0,0170 * Tage) R = 0,281
RWT Erythrozyten - RWT = 6,829 - (0,0263 * Tage) R = 0,317
Hämoglobin SR Hämoglobin - SR = 125,38 - (0,421 * Tage) R = 0,403
g/l AT Hämoglobin - AT = 129,73 - (0,752 * Tage) ** R = 0,583
RWT Hämoglobin - RWT = 127,37 - (0,698 * Tage) ** R = 0,513
Hämatokrit SR Hämatokrit - SR = 41,367 - (0,198 * Tage) * R = 0,507
% AT Hämatokrit - AT = 42,917 - (0,345 * Tage) *** R = 0,659
RWT Hämatokrit - RWT = 42,017 - (0,307 * Tage) ** R = 0,554
Leukozyten SR Leukozyten - SR = 15,745 + (0,280 * Tage) * R = 0,421
G/l AT Leukozyten - AT = 14,590 + (0,253 * Tage) R = 0,395
RWT Leukozyten - RWT = 12,950 + (0,301 * Tage) R = 0,492
Segmentkernige
Granulozyten SR Segm. Gr. - SR = 59,717 + (0,102 * Tage) R = 0,056
G/l AT Segm. Gr. - AT = 64,567 + (0,093 * Tage) R = 0,055
RWT Segm. Gr. - RWT = 56,033 + (0,362 * Tage) R = 0,206
Lymphozyten SR Lymphozyten - SR = 34,450 - (0,031 * Tage) R = 0,015
G/l AT Lymphozyten - AT = 28,050 + (0,091 * Tage) R = 0,048
RWT Lymphozyten - RWT = 36,750 - (0,429 * Tage) R = 0,235
Monozyten SR Monozyten - SR = 3,617 - (0,031 * Tage) R = 0,059
G/l AT Monozyten - AT = 6,067 - (0,193 * Tage) R = 0,377
RWT Monozyten - RWT = 2,600 + (0,240 * Tage) * R = 0,419
Thrombozyten SR Thrombozyten - SR = 302,820 - (3,326 * Tage) R = 0,189
G/l AT Thrombozyten - AT = 404,050 - (5,088 * Tage) R = 0,327
RWT Thrombozyten - RWT = 499,973 - (10,742 * Tage) *** R = 0,627
Tab. 5: Blutparameter Regression der Blutparameter über 19 Tage (von Tag 31 bis 50) der Ferkel. Fütterung mit
Standardration (SR), 3,5% Apfeltrester (AT) und 3,5% Rotweintrester (RWT),
p-Werte * = p<0.05; ** = p<0.01; *** = p<0.001und Pearson Korrelations-Koeffizient
6.2.5 Morphologie in Jejunum, Ileum und Colon
Die Veränderung der gemessen Parameter im Jejunum waren in der SR am größten.
Die Zotten der RWT veränderten sich am wenigsten. Im Ileum fallen die Veränderungen
im Vergleich zum Jejunum weniger einheitlich aus. Betrachtet man aber die einzelnen
21
Ergebnisse
Beobachtungszeitpunkte und wertet diese mit einer TWO WAY ANOVA aus, ist
erkennbar, dass die Villihöhe der SR nach dem Absetzen signifikant abnimmt, die
polyphenolreichen Fütterungsgruppen aber keine Veränderungen zeigen. Die
geringsten Veränderungen sind im Colon in der SR zu finden, die größten in der AT.
Die Lymphfollikelflächen im Ileum nahmen bei den SR am stärksten zu. Bei den RWT
und AT veränderten sich die PP nur geringfügig.
Um festzustellen, ob die Ursache der Längenveränderungen im Zellwachstum oder im
Zellenzuwachs liegt, wurden im Jejunum Epithelzellen ausgezählt. Dabei ließen sich
keine Veränderungen der Zellgröße durch die verschiedenen Fütterungen oder über die
Zeit feststellen (Sehm et al., in press).
6.2.6 Expressionsanalysen
Weder die verschiedenen Behandlungszeitpunkte noch die Art der Fütterung
beeinflussten die extrahierte Gesamt-RNA-Mengen und die Transkriptionsaktivität des
Referenz-Gens Histon während des Versuches in den verschiedenen Organen und
Geweben. Fünf verschiedene Faktoren wurden in einer one-step RT-PCR untersucht,
IL-10, TNFα und NFκB als anti- und pro-infammatorische Marker, Caspase 3 und Cyclin
D1 als Apoptose und Zellzyklusmarker (Sehm et al., accepted).
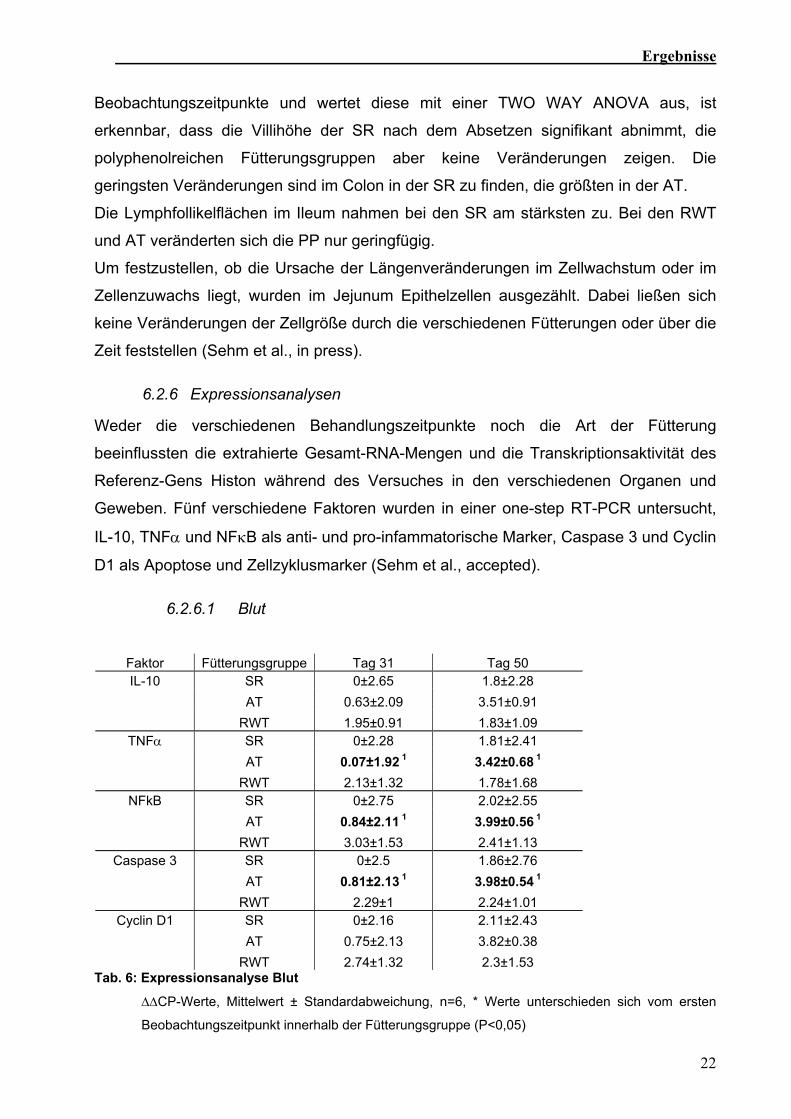
6.2.6.1 Blut
Faktor Fütterungsgruppe Tag 31 Tag 50 IL-10 SR 0±2.65 1.8±2.28
AT 0.63±2.09 3.51±0.91 RWT 1.95±0.91 1.83±1.09
TNFα SR 0±2.28 1.81±2.41 AT 0.07±1.92 1 3.42±0.68 1 RWT 2.13±1.32 1.78±1.68
NFkB SR 0±2.75 2.02±2.55 AT 0.84±2.11 1 3.99±0.56 1 RWT 3.03±1.53 2.41±1.13
Caspase 3 SR 0±2.5 1.86±2.76 AT 0.81±2.13 1 3.98±0.54 1 RWT 2.29±1 2.24±1.01
Cyclin D1 SR 0±2.16 2.11±2.43 AT 0.75±2.13 3.82±0.38 RWT 2.74±1.32 2.3±1.53
Tab. 6: Expressionsanalyse Blut
∆∆CP-Werte, Mittelwert ± Standardabweichung, n=6, * Werte unterschieden sich vom ersten
Beobachtungszeitpunkt innerhalb der Fütterungsgruppe (P<0,05)
22
Ergebnisse
Zwischen den verschiedenen Zeitpunkten gab es nur signifikante Unterschiede
innerhalb der Apfeltrestergruppe. TNFα (p=0,033), NFκB (p=0,024) und Caspase 3
(p=0,019) mRNA Expression nahmen während des Versuchszeitraumes signifikant zu
(Sehm et al., in Vorbereitung).
6.2.6.2 Gastrointestinaltrakt
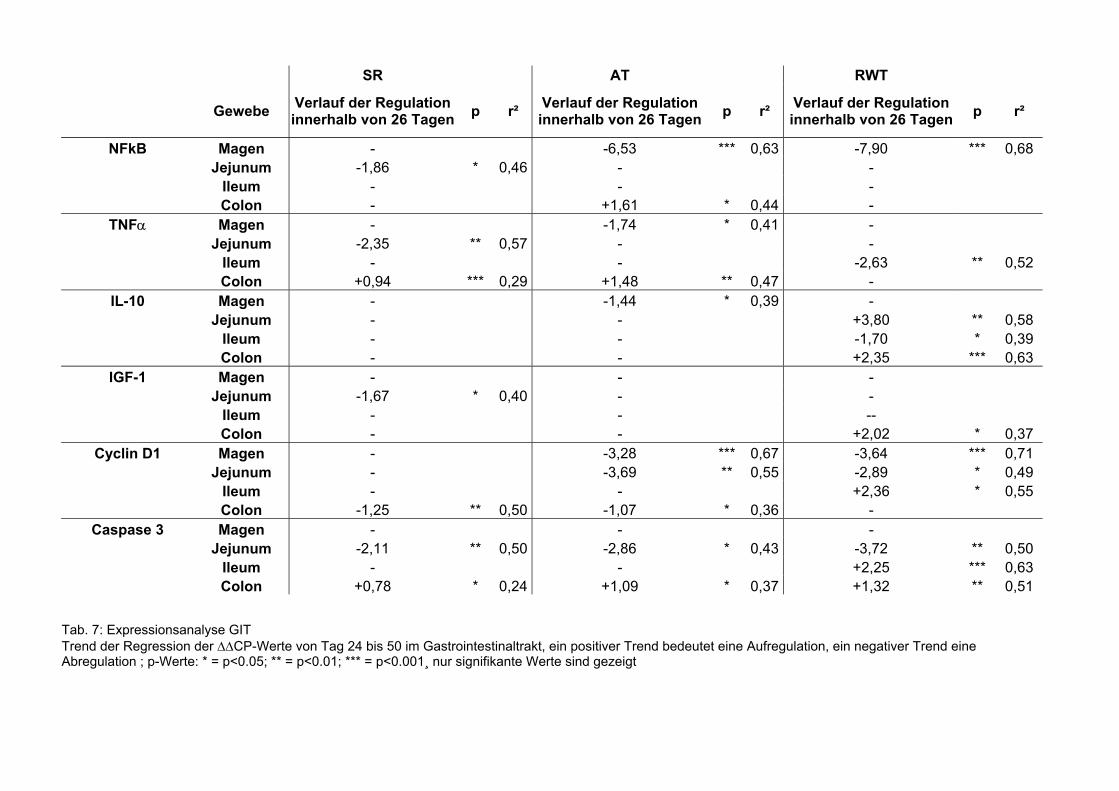
Die mRNA Expressionen des Gastrointestinaltraktes wurden über Regressionsanalysen
ausgewertet und sind in der Tabelle 7 zusammengefasst. Zwischen den verschiedenen
Fütterungsgruppen zeigten sich innerhalb eines Zeitpunkts keine Unterschiede. Im
Gastrointestinaltrakt gab es keine signifikanten Regulierungen der mRNA Expression
von NFκB über die Zeit hinweg.
Die mRNA Expression von TNFα nahm während der Zeit im Jejunum (p=0,008), im
Ileum (p=0,038) und im Colon (p=0,013) ab, im Magen fiel sie zuerst und stieg dann an.
Die mRNA Expression von Caspase 3 war im Ileum (p<0,001) und im Colon (p<0,001)
über den Versuchzeitraum hochreguliert. Cyclin D1 war im Colon nach unten reguliert
(p=0,007). Ein Abfall der IL-10 mRNA Expression wurde im Jejunum (p=0,031), eine
Steigung im Colon (p<0,001) festgestellt (Sehm et al., accepted).
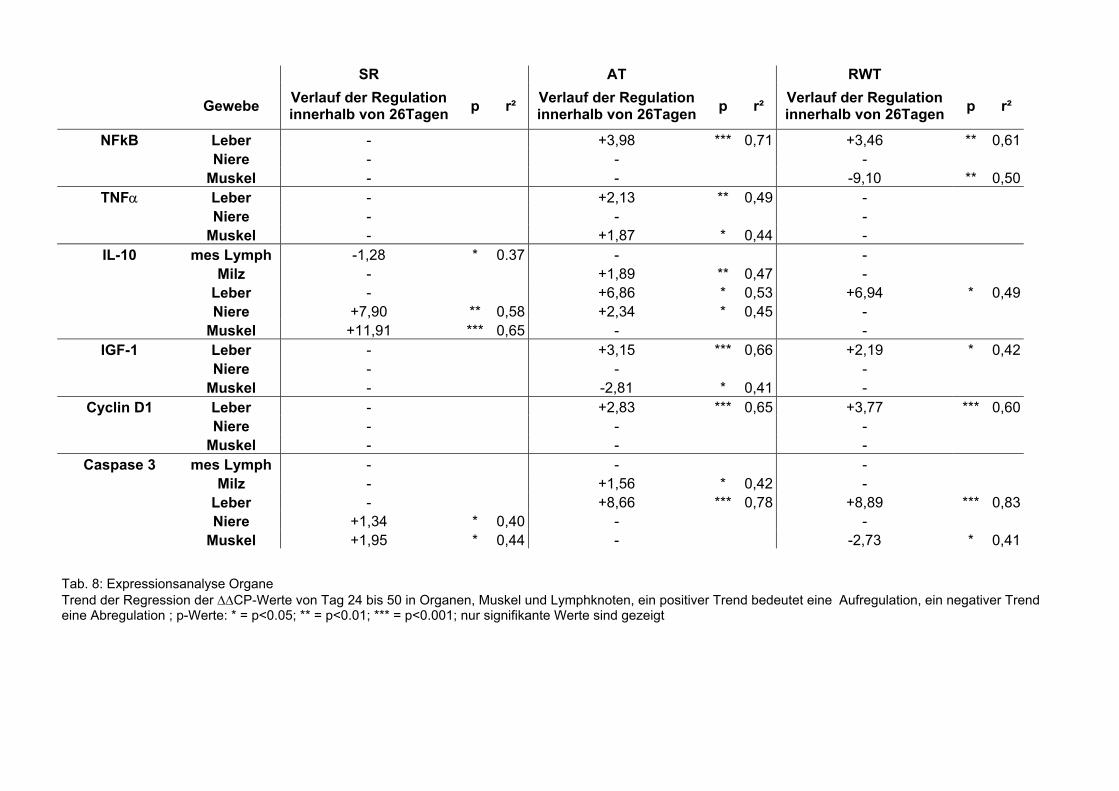
6.2.6.3 Organe
Die Regressionsanalysen der mRNA-Expression in den Organen sind in Tabelle 8
dargestellt. In den mesenterialen Lymphknoten, den Nieren und der Milz gab es nur
signifikante Veränderungen in der IL-10 und der Caspase-3 mRNA-Expression.
Die Expression von NFκB (AT; p<0,001, RWT; p<0,01), TNFα (AT; p<0,01), IL10 (AT;
p<0,05, RWT; p<0,05), IGF-1 (AT; p<0,001, RWT p<0,05), Cyclin D1 (AT; p<0,001,
RWT; p<0,001) und Caspase 3 (AT; p<0,001, RWT; p<0,001) veränderte sich
signifikant in der Leber. Alle beobachteten Genexpressionen steigerten sich in AT und
RWT über die 26 Tage (Sehm et al., accepted).
23
24
SR AT RWT
Gewebe Verlauf der Regulation innerhalb von 26 Tagen p r² Verlauf der Regulation
innerhalb von 26 Tagen p r² Verlauf der Regulation innerhalb von 26 Tagen p r²
NFkB Magen - -6,53 *** 0,63 -7,90 *** 0,68Jejunum -1,86 * 0,46 - -
Ileum - - -Colon - +1,61 * 0,44 -
TNFα Magen - -1,74 * 0,41 -Jejunum -2,35 ** 0,57 - -
Ileum - - -2,63 ** 0,52Colon +0,94 *** 0,29 +1,48 ** 0,47 -
IL-10 Magen - -1,44 * 0,39 -Jejunum - - +3,80 ** 0,58
Ileum - - -1,70 * 0,39Colon - - +2,35 *** 0,63
IGF-1 Magen - - - Jejunum -1,67 * 0,40 - -
Ileum - - --Colon - - +2,02 * 0,37
Cyclin D1 Magen - -3,28 *** 0,67 -3,64 *** 0,71Jejunum - -3,69 ** 0,55 -2,89 * 0,49
Ileum - - +2,36 * 0,55Colon -1,25 ** 0,50 -1,07 * 0,36 -
Caspase 3 Magen - - -Jejunum -2,11 ** 0,50 -2,86 * 0,43 -3,72 ** 0,50
Ileum - - +2,25 *** 0,63Colon +0,78 * 0,24 +1,09 * 0,37 +1,32 ** 0,51
Tab. 7: Expressionsanalyse GIT Trend der Regression der ∆∆CP-Werte von Tag 24 bis 50 im Gastrointestinaltrakt, ein positiver Trend bedeutet eine Aufregulation, ein negativer Trend eine Abregulation ; p-Werte: * = p<0.05; ** = p<0.01; *** = p<0.001¸ nur signifikante Werte sind gezeigt
25
SR AT RWT
Gewebe Verlauf der Regulation innerhalb von 26Tagen p r² Verlauf der Regulation
innerhalb von 26Tagen p r² Verlauf der Regulation innerhalb von 26Tagen p r²
NFkB Leber - +3,98 *** 0,71 +3,46 ** 0,61Niere - - -
Muskel - - -9,10 ** 0,50TNFα Leber - +2,13 ** 0,49 -
Niere - - -Muskel - +1,87 * 0,44 -
IL-10 mes Lymph -1,28 * 0.37 - -Milz - +1,89 ** 0,47 -
Leber - +6,86 * 0,53 +6,94 * 0,49Niere +7,90 ** 0,58 +2,34 * 0,45 -
Muskel +11,91 *** 0,65 - - IGF-1 Leber - +3,15 *** 0,66 +2,19 * 0,42
Niere - - - Muskel - -2,81 * 0,41 -
Cyclin D1 Leber - +2,83 *** 0,65 +3,77 *** 0,60Niere - - -
Muskel - - -Caspase 3 mes Lymph - - -
Milz - +1,56 * 0,42 -Leber - +8,66 *** 0,78 +8,89 *** 0,83Niere +1,34 * 0,40 - -
Muskel +1,95 * 0,44 - -2,73 * 0,41
Tab. 8: Expressionsanalyse Organe Trend der Regression der ∆∆CP-Werte von Tag 24 bis 50 in Organen, Muskel und Lymphknoten, ein positiver Trend bedeutet eine Aufregulation, ein negativer Trend eine Abregulation ; p-Werte: * = p<0.05; ** = p<0.01; *** = p<0.001; nur signifikante Werte sind gezeigt
Diskussion
7. DISKUSSION 7.1. Methodische Diskussion 7.1.1 Zellkultur
Es ist bekannt, dass primäre Zellkulturen und etablierte Zelllinien unterschiedlich auf
Behandlung mit Polyphenolen reagieren (Borska et al., 2003; Chen et al., 1998;
Middleton et al., 2000; Kuo, 2002). Deswegen wurde für den Zellkulturversuch die
primäre bovine WBZ gewählt. Primäre Zellkulturen, die als Modell dienen, haben
gegenüber stabil transformierten Zelllinien den Vorteil, dass sie nativ gewonnen werden
und einer Gewebekultur gleichkommen und somit eher mit der nativen Situation
vergleichbar sind (Bodine und Komm, 2002; Murakami und Sekiya, 1998). Stabil
transformierte Zelllinien sind potenziell unsterblich und sind oft aus Krebsgewebe
entnommen. Grundsätzlich ist es schwierig, Zellkulturergebnisse auf einen kompletten
Organismus zu übertragen, da die Zellen aus dem Zell-Zell-Kontakt und dem Zell-
Verband herausgelöst sind und deshalb die verschiedenen Interaktionen mit
angrenzenden Geweben und Organen fehlen.
Die Etablierung der Primärzellen erfolgte gemäß der Arbeitsgruppe Pfaffl (Prgomet et
al., 2005). Der standardisierte Versuchaufbau ermöglichte es, viele
Stimulationskombinationen durchzuführen und zu vergleichen. Das Medium enthielt
fötales Kälberserum (FKS), in dem wie in allen Seren viele verschiedene Inhaltsstoffe
vorhanden sind. Die genaue inhaltliche Zusammensetzung sowie die Mengenverteilung
der einzelnen Substanzen unterliegen der individuellen Variationsbreite und sind nur
bedingt durch den Hersteller beeinflussbar (Lindl und Bauer, 1994). Daher ist bei allen
Versuchsansätzen dieselbe Charge FKS verwendet worden.
Die verwendeten Stimulationssubstanzen sind isolierte Reinsubstanzen, die eine immer
gleiche Behandlung ermöglichten. Die Behandlung mit einzelnen Flavanolen kann nur
Modell sein, da in der Nahrung Polyphenole als unterschiedliche Metaboliten und immer
in Kombination mit anderen Nähr- und Wirkstoffen vorkommen (Watzl und
Rechkemmer, 2001; Watzl und Leitzmann, 1999). Ein Vorteil der Zellkultur gegenüber
dem Tierversuch ist die Möglichkeit, definierte Dosen an den Zielzellen einzusetzen.
Außerdem kann man so unphysiologisch hohe Dosen anwenden, die ein Tier nicht
aufnehmen kann bzw., die dem Tier schaden könnten.
26
Diskussion
7.1.2 Histologie
Bei der Gewebeentnahme ist es wichtig, an den jeweils identischen oder zumindest
vergleichbaren Körperstellen und Organpositionen Gewebestücke zu entnehmen. Man
kann dabei den gleichen prozentualen Abstand oder den gleichen absoluten Abstand
von den Übergängen der verschiedenen Darmabschnitte verwenden (Görke, 2000). Um
eine Vermessung der gesamten Darmabschnitte zu vermeiden, wurde hier der absolute
Abstand gewählt.
Bei der Fixierung der Gewebestückchen in 3,7%-igem Formalin kommt es zur
Gewebeschrumpfung (Romeis, 1989). Daher ist es sinnvoll, die Fixierung standardisiert
durchzuführen und das Gewebe gleich lang zu fixieren. Das war nicht exakt möglich, da
die Probenentnahme den ganzen Tag in Anspruch nahm, aber die Proben am Folgetag
gleichzeitig im Einbettautomaten weiter behandelt werden mussten. Ein weiterer
Nachteil dieser Methode ist, dass sich bei der Fixierung die Gewebeteile in sich
verdrehen können und die Zotten nicht optimal dargestellt werden können, wenn sie
schräg angeschnitten werden. Deshalb wurden jeweils Darmabschnitte und
Dünnschnitte gewählt, in denen die Zotten in voller Länge dargestellt waren. Die
Vermessungen erfolgten auf diesen Abbildungen an den längsten Zotten. Mit der
Einbettungsmethode von Görke (2000) könnte man diese Verdrehungen vermeiden.
Das Gewebe wird bei diesem Verfahren direkt bei der Schlachtung mit Stecknadeln
plan auf einem Styroporblock befestigt.
Die HE-Färbung ist eine etablierte Übersichtsfärbung und sehr gut geeignet, die Zotten
darzustellen (Linden et al., 1992). Die HE-Färbung ist einfach durchzuführen und
unanfällig für Fehler. So stellen kleine Schwankungen in den Färbezeiten oder in den
Konzentrationen der Färbemittel kein zusätzliches Problem dar. Da bei dieser
histologischen Methode keine „Draufsicht“ realisierbar ist, konnte nicht festgestellt
werden, ob schmälere Villi weiter auseinander stehen als breitere.
Das mikroskopische Bild wird direkt an einen Computer weitergegeben und mittels
bildverarbeitenden Software ausgewertet. Der Vorteil der Onlineverarbeitung der Bilder,
ist die große Genauigkeit, Reproduzierbarkeit und Schnelligkeit. Zu dem kann man die
Bilder mit den gemessenen Strecken abspeichern und so einfach nachkontrollieren. Die
histomorphometrische Vermessung mittels HE-Färbung ist eine kostengünstige
Methode, den Zustand der Darmabschnitte einzuschätzen.
27
Diskussion
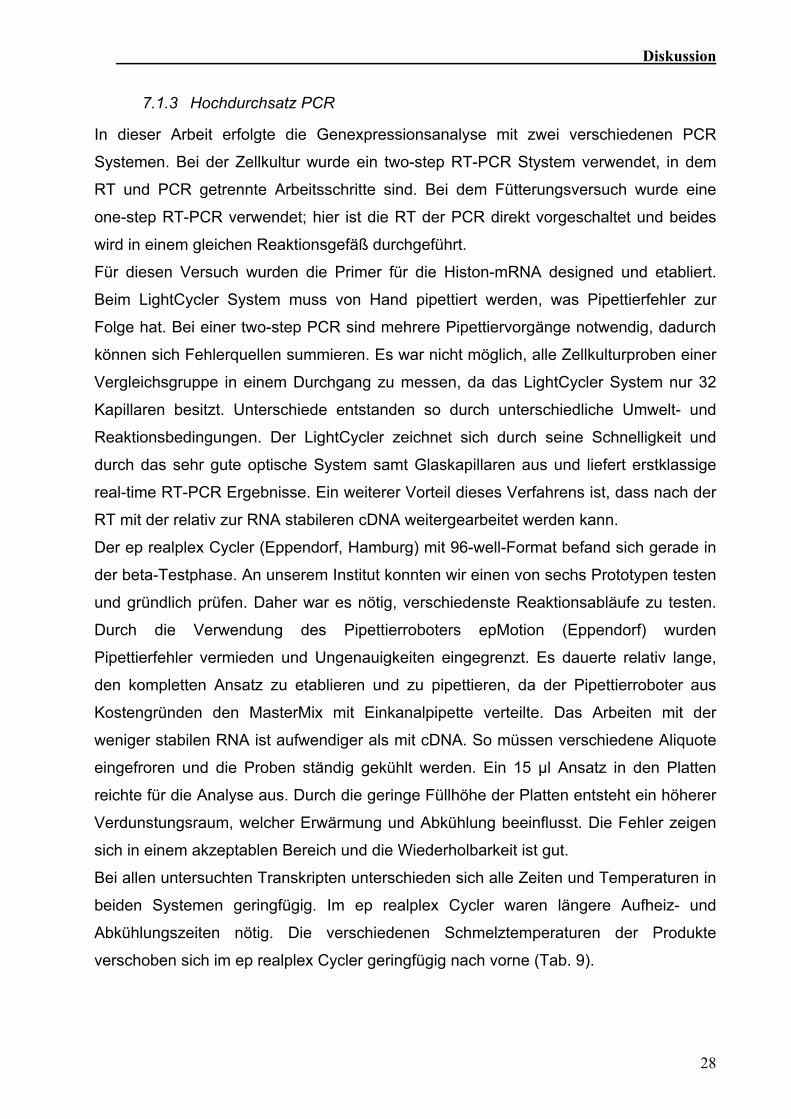
7.1.3 Hochdurchsatz PCR
In dieser Arbeit erfolgte die Genexpressionsanalyse mit zwei verschiedenen PCR
Systemen. Bei der Zellkultur wurde ein two-step RT-PCR Stystem verwendet, in dem
RT und PCR getrennte Arbeitsschritte sind. Bei dem Fütterungsversuch wurde eine
one-step RT-PCR verwendet; hier ist die RT der PCR direkt vorgeschaltet und beides
wird in einem gleichen Reaktionsgefäß durchgeführt.
Für diesen Versuch wurden die Primer für die Histon-mRNA designed und etabliert.
Beim LightCycler System muss von Hand pipettiert werden, was Pipettierfehler zur
Folge hat. Bei einer two-step PCR sind mehrere Pipettiervorgänge notwendig, dadurch
können sich Fehlerquellen summieren. Es war nicht möglich, alle Zellkulturproben einer
Vergleichsgruppe in einem Durchgang zu messen, da das LightCycler System nur 32
Kapillaren besitzt. Unterschiede entstanden so durch unterschiedliche Umwelt- und
Reaktionsbedingungen. Der LightCycler zeichnet sich durch seine Schnelligkeit und
durch das sehr gute optische System samt Glaskapillaren aus und liefert erstklassige
real-time RT-PCR Ergebnisse. Ein weiterer Vorteil dieses Verfahrens ist, dass nach der
RT mit der relativ zur RNA stabileren cDNA weitergearbeitet werden kann.
Der ep realplex Cycler (Eppendorf, Hamburg) mit 96-well-Format befand sich gerade in
der beta-Testphase. An unserem Institut konnten wir einen von sechs Prototypen testen
und gründlich prüfen. Daher war es nötig, verschiedenste Reaktionsabläufe zu testen.
Durch die Verwendung des Pipettierroboters epMotion (Eppendorf) wurden
Pipettierfehler vermieden und Ungenauigkeiten eingegrenzt. Es dauerte relativ lange,
den kompletten Ansatz zu etablieren und zu pipettieren, da der Pipettierroboter aus
Kostengründen den MasterMix mit Einkanalpipette verteilte. Das Arbeiten mit der
weniger stabilen RNA ist aufwendiger als mit cDNA. So müssen verschiedene Aliquote
eingefroren und die Proben ständig gekühlt werden. Ein 15 µl Ansatz in den Platten
reichte für die Analyse aus. Durch die geringe Füllhöhe der Platten entsteht ein höherer
Verdunstungsraum, welcher Erwärmung und Abkühlung beeinflusst. Die Fehler zeigen
sich in einem akzeptablen Bereich und die Wiederholbarkeit ist gut.
Bei allen untersuchten Transkripten unterschieden sich alle Zeiten und Temperaturen in
beiden Systemen geringfügig. Im ep realplex Cycler waren längere Aufheiz- und
Abkühlungszeiten nötig. Die verschiedenen Schmelztemperaturen der Produkte
verschoben sich im ep realplex Cycler geringfügig nach vorne (Tab. 9).
28
Diskussion
two-step one-step
RT 65°C 5min 50°C 10min
37°C 60min 95°C 5min
99°C 1min
Denaturierung 95°C 1min
45 Zyklen 95°C 15sek 95°C 15sek
60°C 10sek 60°C 20sek
72°C 20ek 72°C 30sek
Schmelzkurve 12min 20min
Kühlen 4°C 1min 4°C 1min
Tab. 9: Protokoll der one-step und two-step-PCR
Bei der two-step PCR wurden die Proben nach der RT bei –20°C eingefroren und vor der PCR
ein Denaturierungsschritt eingefügt.
Nachdem bei den zwei Ansätzen mit verschiedenen Spezies gearbeitet wurde, mussten
teilweise neue Primer-Paare für die PCR entworfen und entwickelt werden. Einige
Primer arbeiteten mit den verschiedenen Reagenzien unterschiedlich bzw.
funktionierten gar nicht. Die nochmalige Optimierung aller Primer und der jeweiligen
Temperaturen für das ep realplex Cycler Systems erfolgte in der Testphase.
29
Diskussion
7.2. Physiologische Diskussion
7.2.1 Zellkultur
Leukozyten spielen eine zentrale Rolle im Immunsystem. Deshalb bot sich die primäre
bovine Zellkultur als ideales Model für den Vorversuch an. Die immun-modulatorischen
Effekte von EGCG und Catechin wurden in verschiedenen Konzentrationen und in
verschiedenen Kombinationen mit einem Stimulus (ConA-Behandlung) getestet (Sehm
et al., 2005).
Vor allem Flavanole zeigen in Zellkultur- und in vivo Experimenten immun-
modulatorische Effekte (Ahmad et al., 2000). Ebenso wurden anti-proliferative
Eigenschaften von polyphenolreichen Apfelextrakten in Zellkultur gezeigt (Eberhardt et
al., 2000; Wolfe et al., 2003). Dabei verhalten sich primäre Zellkulturen und etablierte
Zelllinien oft gegensätzlich und man kommt zu unterschiedlichen physiologischen
Schlussfolgerungen (Chen et al., 1998; Middleton et al., 2000; Kuo, 2002). Die
Flavonoide EGCG und Catechin hatten verschiedene stimulierende Wirkungen auf
bovine WBZ. In unseren Studien bewirkten höhere EGCG- und Catechin-
Konzentrationen eine Verringerung der gesamten RNA Expression, wobei EGCG den
größeren Effekt zeigte.
Die Behandlung mit Catechin beeinflusste die cFos Expression kaum, eine EGCG
Behandlung in hohen Dosen reduzierte sie. Wurden die Zellen ConA ausgesetzt,
induzierte das die cFos Expression, was einer generellen Stimulation der mRNA
Expression entspricht. Die Stimulation mit ConA hob die Reduktion der cFos mRNA
Expression durch die EGCG Behandlung wieder auf. Ein Versuch mit einer humanen
Hautzellkultur zeigte eine reduzierende Wirkung von EGCG auf cFos (Chen et al.,
1999). Bei hohen EGCG Konzentrationen korrelierten diese Ergebnisse mit der Gesamt
RNA-Menge, dem geringeren Zell-Turn-Over und den anti-kanzerogenen Effekten.
Die TNFα Expression zeigte ein Flavanoid spezifisches Expressionsmuster. Die
Expression von TNFα wurde durch hohe Catechin (10-100 µM) und physiologische
EGCG Konzentrationen (bis zu 0,1 µM) stimuliert. Beide Effekte waren von den
verschiedenen ConA Stimulationen überlagert, die ebenfalls die pro-inflammatorische
TNFα Expression steigern konnte (Gantner et al., 1995; Zhao et al., 2004). In der
Literatur werden die Effekte von EGCG auf die TNFα mRNA Expression kontrovers
wiedergegeben (Sakagami et al., 1995; Fujiki et al., 2000; Suganuma et al., 2000;
Crouvezier et al., 2001). Es werden sowohl stimulierende als auch hemmende Effekte
30
Diskussion
beobachtet. In Zelllinien wurde eine Inhibierung der TNFα mRNA Expression mit EGCG
oder Catechin mehrfach berichtet (Suganuma et al., 2000; Fujiki et al., 1999; Choi und
Hwang, 2003).
Bei dem zweiten Versuchsansatz wurde festgestellt, dass EGCG und Catechin meist
die beobachteten mRNA Expressionen abregulierte. Wenn Catechin aber gleichzeitig
oder erst nach der ConA Stimulation gegeben wurde, zeigte es entweder gar keinen
Effekt oder einen erhöhenden.
In der primären WBZ Kultur wurde das Expressionslevel von IL-1β und IL-6 kaum
beeinflusst. Eine Catechin Behandlung vor der ConA Stimulation reduzierte die IL-1β
Expression stark, gleichzeitig wurde die IL-6 Expression verringert. Erfolgte die ConA
Behandlung vor der Flavanoidgabe, verringerte sich die IL-6 Expression mit EGCG und
erhöhte sich mit anschließender Catechingabe. Die Effekte von Flavanoiden auf
Zelllinien und primäre Zellen sind unterschiedlich (Ahmad et al., 2000). In Studien mit
humanen Leukozyten reduzierten Flavanoide die Produktion von IL-1β (Crouvezier et
al., 2001). Beide pro-inflammatorischen Zytokine TNFα und IL-1β reagierten ähnlich in
diesen Untersuchungen (Ahmad et al., 2000; Crouvezier et al., 2001).
Histon wurde in früheren Studien mit Flavanoid-Behandlung kaum beachtet. In unseren
Zellkulturversuchen konnten die Flavonoide die Histon Expression nur wenig
beeinflussen. Es ist noch nicht belegt, ob EGCG einen Einfluss auf die Histon H3
Genexpressionsaktivität hat, da EGCG in vitro an das Histonprotein, ein Histonsulfat,
binden kann (Polster et al., 2003).
Zusammenfassend kann man im Zellkulturversuch bei beiden Flavanoiden
hauptsächlich positive Effekte sowohl auf die immunrelevanten Zytokine als auch auf
die Expression der Transkriptionsfaktoren feststellen. Höhere Flavanoidgaben zeigten
ausgeprägtere Einflüsse als geringere, wobei EGCG die mRNA Genexpression mehr
veränderte als Catechin (Sehm et al., 2005).
7.2.2 Fütterungsversuch
Die verschiedenen Effekte der Flavanole in vitro (Calixto et al., 2003 und 2004) stehen
in Verbindung mit den Erkenntnissen, dass der Verzehr von polyphenolreichen
Nahrungsmitteln die Aktivität von Blutblättchen verringert, den Cholesterinstoffwechsel
positiv beeinflusst und vor verschiedenen Krebsarten schützen kann (Santos-Buelga
and Scalbert, 2000; Eberhardt et al., 2000). Tiermodelle zeigten, dass Polyphenole das
Risiko einer Krebsentstehung des Mund- und Rachenraumes, des Magens, des
31
Diskussion
Intestinaltraktes, der Leber, der Lunge und der Haut verringern können (Lambert and
Yang, 2003). Nicht nur in Zellkultur, sondern auch unter physiologischen Bedingungen
haben Polyphenole antioxidative Eigenschaften (Mazza et al., 2002). Äpfel (Wolfe et al.,
2003; Eberhardt et al., 2000), vor allem die Apfelschale und Beiprodukte der
Weinproduktion (Shrikhande, 2000, Carbonneau et al., 1997), sind sehr polyphenol-
reich.
In einem Teilversuch wurden Inhalte von Magen und Colon sowie Darm-, Nieren- und
Lebergewebe auf mögliche vorhandene Polyphenole getestet. In einer anderen Studie
wurden bereits Quercetin und Isorhamnetin in Leber und Nieren von Ferkeln noch einer
angereicherten Fütterung nachgewiesen (de Boer et al., 2005). So konnte gezeigt
werden, dass die verschiedenen Polyphenole tatsächlich aufgenommen wurden.
Der Darm dient nicht nur zur Aufnahme der Nahrungsbestandteile, hier befindet sich
auch das größte Immunsystem (Roitt et al., 1995). Es wird geschätzt, dass der Magen-
Darm-Trakt 5% des Gesamtkörpergewichts ausmacht. In ihm finden bis zu 30% des
gesamten Sauerstoffverbrauches und des Protein Turn Overs statt (Gaskins, 2001).
Ungefähr 1014 Bakterien leben im Darm, das sind zehnmal mehr Zellen, als der
gesamte tierische Organismus besitzt (Berg, 1996). Viele Reize beeinflussen diese
Bakteriengemeinschaft − z. B. Nahrungsbestandteile, neue evtl. schädliche Keime,
sowie Nahrungsumstellungen.
Das Absetzen der jungen Ferkel und der damit verbundene Wechsel von flüssiger auf
feste Nahrung ist ein plötzlicher Einschnitt in das Leben der Jungtiere, der weitere
Veränderungen bedingt. Das Ferkel wird von seiner Mutter getrennt, meistens wird es in
eine neue Umgebung gebracht und wird neuen Buchtgenossen und deren potentiell
aggressivem Verhalten ausgesetzt. Verschiedenste physiologische, umwelt- und
ernährungsbedingte Faktoren stellen die Ursachen für das Stressverhalten der Ferkel
nach dem Absetzen dar (Otten, 2002; Funderburke und Seerley, 1990). In den
verschiedenen Untersuchungen konnten im Fütterungsversuch die zum Teil starken
Veränderungen beobachtet werden.
In der Natur gewöhnen sich Ferkel über Wochen das Saugen ab und nehmen immer
mehr feste Nahrung zu sich. Dieses langsame Umstellen ist in den Selektionsdruck mit
eingebunden, das mukosale Darmimmunsystem entwickelt und gewöhnt sich allmählich
an die verschiedenen Umweltreize. In der modernen Schweinehaltung ist eine
langsame Umstellung meist nicht vorgesehen.
32
Diskussion
Das Absetzen der Ferkel, unabhängig von ihrem Alter (Wiese et al., 2003), wird im
allgemeinen von diversen Veränderungen der intestinalen Morphologie begleitet, so
werden die Villushöhen reduziert, die Krypten tiefer, die Absorptionsfähigkeit und die
Bürstensaumenzymaktivität herabgesetzt (Hampson 1986a und 1986b, Kelly et al.,
1991a und 1991b; Miller et al., 1984). Intestinale Entzündungen, die mit dem Absetzen
einhergehen, wurden für viele Spezies beschrieben (McCracken et al., 1999). Zwei
Haupthypothesen für die morphologischen Veränderungen des Darmes werden in
diesem Zusammenhang genannt. Die erste sagt aus, dass eine Immunantwort auf die
Futterantigene zu einer lokalen Entzündung und damit zu verringerten Zottenlängen
führt (Bailey et al., 1993; Li et al., 1991; Miller et al., 1984 und 1994). Die zweite
Hypothese geht davon aus, dass das Fehlen der luminalen Stimulation durch die
verringerte Futteraufnahme in den ersten Tagen nach dem Absetzen verantwortlich ist
für die Änderungen in der intestinalen Morphologie (Cera et al., 1988; Kelly et al.,
1991a; McCracken et al., 1995; Pluske et al., 1996).
In den durchgeführten histologischen Untersuchungen konnte für die
Kontrollfuttergruppe eine Abnahme der Villuslängen nach dem Absetzen gezeigt
werden, wie für Jejunum (Klein, 2001; Hedemann et al., 2003, Kelly et al., 1991a;
Vente-Spreeuwenberg et al., 2003) und Ileum (Kelly et al., 1991a, van Beers-Schreurs
et al., 1998) in der Literatur beschrieben. Die Zottenlänge ist abhängig von der Nahrung
und dem Alter der Tiere (Görke, 2000). Das Vorhandensein pathogener Keime bewirkt
eine Zottenverkürzung, wohingegen eine nicht-pathogene Flora das Längenwachstum
der Darmzotten stimuliert (Görke, 2000).
Nach einer Woche nehmen die Längen wieder zu (Klein, 2001; Tang et al., 1999). Wie
in früheren Versuchen beschrieben (Görke, 2000, Mekbungwan and Yamauchi, 2004),
waren die Villilängen im Jejunum länger als im Ileum. Diese beschriebenen
Veränderungen wurden durch die beiden Tresterfütterungen abgeschwächt, das
Wachstum war im Ileum und im Colon über den ganzen Versuchszeitraum verstärkt.
Es wird angenommen, dass die Länge der Villi mit der gesamten Oberfläche des
Darmes korreliert, die wiederum mit dem Absorptionsvermögen der verfügbaren
Nährstoffe in Verbindung gebracht wird (Caspary, 1992, Görke, 2000). Längere Villi und
höhere Mitoseraten im Darm weisen darauf hin, dass die Villi aktiviert sind (Langhout et
al., 1999; Yasar and Forbes, 1999). In unserem Versuch wurden keine signifikanten
Unterschiede der täglichen Zunahmen zwischen den verschiedenen Fütterungen
gefunden, in der Literatur werden jedoch längere Villi mit größeren täglichen Zunahmen
33
Diskussion
in Verbindung gebracht (Zijlstra et al., 1996), kürzere mit verringerten täglichen
Zunahmen (Zijlstra et al., 1997). Das Ileum weist generell eine größere
Längenzunahme der Villi als das Jejunum auf. Im Ileum wird eine größere
Proliferationsrate als im Jejunum angenommen (Wiese et al., 2003).
Die größeren Villilängen und die erhöhte Mitoserate im Intestinaltrakt wurden in anderen
Studien als morphologische Indikatoren für eine Aktivierung der Villi gesehen (Langhout
et al., 1999; Yasar and Forbes, 1999).
Die Zellgrößen der Darmepithelzellen veränderten sich über den Versuchszeitraum
nicht. Deshalb kann davon ausgegangen werden, dass die Anzahl der Zellen bei
längeren Villi gestiegen ist. Die Annahme, dass das Längenwachstum der Villi von einer
Zellvermehrung herrührt und nicht von einer Zellvergrößerung, deckt sich mit anderen
Beobachtungen (Lauronen et al., 1998, Mei und Xu, 2005).
Die Peyerschen Platten (PP) wurden in der Kontrollgruppe über den Versuchszeitraum
signifikant größer (21%), in den Behandlungsgruppen fanden keine Veränderungen
statt. Das ist ein Hinweis darauf, dass in der Kontrollgruppe die PP aktiviert waren.
Flavonoide sind dafür bekannt, einen blockierenden Effekt auf Lymphzellwachstum, T-
Zellen und Natural Killer Zellen zu haben (Lampe, 1999; Watzl und Rechkemmer,
2001).
Im Colon lagen bei beiden polyphenolreichen Fütterungen größere Kryptentiefe und
Flächen vor. In einem anderen Versuch konnten nur bei Tieren mit einer Infektion
Veränderungen im mittleren Colon festgestellt werden (Petkevicius et al., 2003). Im
Colon von Ratten mit Polyphenolen und Tanninen aus Wein wurde keine erhöhte
Apoptoserate, jedoch ein Rückgang der Kryptenzellzahl festgestellt (Caderni et al.,
1999).
In den verschiedenen Darmabschnitten wurden vergleichende Expressionsstudien an
Markergenen des Immunsystems, der Apoptose und des Zellzyklus durchgeführt. Der
Gastrointestinaltrakt und mehrere Organe der Ferkel wurden in einer one-step RT-PCR
auf verschiedene anti-inflammatorische, IL-10, pro-inflammatorische, TNFα und NFκB,
Apoptose- und Zellzyklusmarker, Caspase 3 und Cyclin D1 untersucht.
Verschiedene Zytokine, wie TGFβ, IL-1α und IL-6 werden in dem intestinalen Epithel
exprimiert und spielen eine Rolle bei der Einwanderung der Immunzellen in die Mukosa
und bei dem Epithelzellwachstum (Stadnyk, 1994). Andere Zytokine, wie IL-8, IL-1β und
TNFα mRNA werden ebenfalls von normalen Epithelzellen exprimiert und sind als
Antwort auf eine mikrobielle Infektion signifikant erhöht (Jung et al., 1995; Pie et al.,
34
Diskussion
2004). Nach einer bakteriellen oder viralen Infektion bei Schweinen findet eine lokale
Expression von IL-1α, IL-6 und TNFα statt (Murtaugh et al., 1996; Fossum, 1998).
Im Gastrointestinaltrakt wurden in dieser Studie nur im Colon der Kontroll- und
Apfeltrestertiere steigende TNFα mRNA Expressionsdaten gefunden. Der
Entzündungsprozess ist selbstlimitierend, da auf die Produktion pro-inflammatorischer
Zytokine direkt die Produktion anti-inflammatorischer Zytokine, wie IL-10 und IL-13, folgt
(Philpott und Ferguson, 2004). In dieser Untersuchung zeichneten sich in den beiden
Trestergruppen verschiedene Verläufe von IL-10 im Gastrointestinaltrakt ab. Im Magen
und im Ileum verstärkte sich die Expression, im Jejunum und Colon schwächte sie ab.
In den meisten getesteten Geweben und Organen reagierten die TNFα und NFκB
Expressionen vergleichbar. TNFα ist ein wichtiges Zytokin, das von Makrophagen,
Monozyten, Lymphozyten, Keratinozyten, Fibroblasten und anderen Zelltypen als
Antwort auf einen Infekt, eine Verletzung oder andere Umwelteinflüsse gebildet wird
(Baud und Karin, 2001). Werden Zellen TNFα ausgesetzt, kann das zu einer
Aktivierung der Caspase-Kaskade und Apoptose führen (Chang und Yang, 2000).
TNFα löst die Aktivierung von zwei wichtigen Transkriptionsfaktoren, AP-1 und NFκB,
aus (Barnes und Karin, 1997; Shaulin und Karin, 2001).
Als zentrale Antwort auf eine Entzündung wird der Transkriptionsfaktor NFκB aktiviert,
der wiederum ein Hauptregulator von vielen pro-inflammatorischen Zytokinen ist
(Baldwin, 1996; Ghosh und Karin, 2002). Durch die Aktivierung von NFκB wird im
Weiteren die gesamte Zellproliferation gefördert (Guttridge et al., 1999; Hinz et al.,
1999) und die Zellen werden vor Apoptose geschützt (Beg und Baltimore, 1996; Van
Antwerp et al., 1996). Die Expression von NFκB und Caspase 3 verlief in diesem
Versuch nicht einheitlich korreliert. Während des Beginns einer Entzündung wird NFκB
mit pro-inflammatorischen Genen in Verbindung gebracht, bei einer abklingenden
Entzündung mit der Expression von anti-inflammatorischen Zytokinen und der Induktion
von Apoptose (Lawrence et al., 2002).
Caspase 3 spielt eine zentrale Rolle in der Regelung der Apoptose. Die Inhibierung von
Caspase 3 verringert den Zelltod durch Apoptose (Heczko et al., 2001). In Ileum und
Colon zeigte sich ein Anstieg der Caspase 3 mRNA Expression, im Jejunum gab es
dagegen einen signifikanten Abfall.
Generelle Wachstumsfaktoren wie z. B. IGF-1 induzieren die Produktion von Cyclin D1
(Albanese et al., 1999). Cyclin D1 steht im physiologischen Zusammenhang mit über 30
Transkriptionsfaktoren und Mitregulatoren (Wang et al., 2004; Zhang et al., 1999;
35
Diskussion
Horstmann et al., 2000; Inoue and Sherr, 1998). Die Cyclin D1 mRNA Expression fiel
sowohl in der Apfeltrestergruppe als auch in der Weintrestergruppe im Dünndarm ab.
Gleichzeitig stieg der Caspase 3 Level im Colon. Cyclin D1 fiel in der Kontroll- und in
der Apfeltrestergruppe. Die Effekte waren in der Rotweingruppe am stärksten, in der
Kontrollgruppe am schwächsten. Bei Ratten mit induzierten Tumoren konnte eine
Fütterung mit Rotweinextraktion zu einer Reduktion der Tumore führen, die
Apoptoserate war bei diesen Tieren in den Tumoren erhöht (Caderni et al., 2000). Die
Tresterfütterungen stimulierten die Cyclin D1 mRNA Expression in der Leber. Es ist
bekannt, dass Apfel- und Traubenextrakte eine stärkere Aktivierung der Caspase 3, der
Caspase 7 und eine Teilung der poly-(ADP-ribose) Polymerase in Jurkat T-Zellen
hervorrufen (Chen et al., 2004). In den histomorphologischen Untersuchungen wurde
eine Zunahme der Villilänge im Jejunum beobachtet. Ein Zusammenhang mit der
geringeren Caspase 3 Expression wird vermutet.
Die mRNA Expressionen der getesteten Transkripte stiegen in den beiden
polyphenolreichen Fütterungen mehrheitlich an. Auch in der Zellkultur zeigte sich in
physiologischen Konzentrationen von EGCG eine Stimulierung der Gesamt-RNA-
Menge. In Jejunum und Ileum war der Zell-Turn over herabgesetzt. Die beiden
Tresterfütterungen zeigten positive Effekte auf die Darmgesundheit. So wurde nach
dem Absetzen keine Abnahme der Villi in Jejunum und Ileum beobachtet, die PP
zeigten geringere Flächenzunahmen und die Anzahl der Laktobazillen im Coloninhalt
nahm zu.
36
Schlussfolgerungen
8. SCHLUSSFOLGERUNGEN Nach dem Verbot von Antibiotika als Leistungsförderer für Tiere in der EU (Verordnung
EG Nr. 183/2003 Artikel 11 Absatz 2), wird nach potenten und umweltfreundlichen
Alternativen, die das Immunsystem stabilisieren, ohne gesundheitliche Risiken für
Mensch und Tier zu beinhalten, gesucht. In der Ferkelfütterung drängen viele
alternative Futtermittelzusätze auf den Markt. Von Substanzen, die als Pro-, Prä- und
Synbiotika wirken sollen, bis hin zu Kräutermischungen und seltenen Erden sind
verschiedenste Futtermittelzusätze und Additive im Handel erhältlich.
Durch die Fütterung kann die Kompetenz des Immunsystems stark beeinflusst werden
und somit auch die Pathogenese von Erkrankungen teils erheblich moduliert werden.
Bis heute wurde hauptsächlich der Einfluss der essentiellen Nährstoffe untersucht, die
Wirkungen der sekundären Pflanzenstoffe auf das Immunsystem und die
Ernährungsphysiologie stehen noch im Hintergrund. Physiologische Prozesse wie Zell-
differenzierung, Zellproliferation und programmierter Zelltod (Apoptose) und deren
Beeinflussbarkeit durch natürlich vorkommende Wirkstoffe erlangen in der
Humanernährung im Zusammenhang mit Tumorentwicklung und Darmerkrankungen
zunehmendes Interesse. Vor dem Hintergrund des heutigen Verbots antibiotischer
Futterzusatzstoffe mit leistungsfördernder und darmstabilisierender Wirkung in der
Tierernährung sind diese Vorgänge von größter Bedeutung (Witte, 1999).
Über die immun-stimulierenden und immun-modulatorischen Wirkmechanismen in vivo
von sekundären Pflanzenstoffen liegen bisher wenige wissenschaftliche Kenntnisse vor.
Reststoffe aus der Lebensmittelproduktion, wie Trester, werden noch wenig beachtet,
obwohl man sie kostengünstig in der Tierfütterung einsetzen könnte. Im Mittelpunkt der
Diskussion steht die antioxidative Wirkung und die vermittelte Immunmodulation.
Hinweise für eine Beeinflussung des Immunsystems durch sekundäre Pflanzenstoffe
gibt es für Carotinoide, Flavonoide, Saponine und Sulfide. Des Weiteren ist bekannt,
dass Flavonoide die Aktivität von Immunzellen sowie von wichtigen Schlüsselenzymen
beeinflussen und einzelne Schritte in der Signaltransduktion hemmen können.
In dieser Arbeit wurden Futtermittelzusätze getestet, die sich positiv auf die Gesundheit
auswirken sollen. Ein besonderer Aspekt war die Verwendung natürlicher Reststoffe
aus der Getränkeherstellung. Dadurch bekommt dieser Fütterungsansatz einen
ökologischen Aspekt. Sowohl die Darmflora als auch die Darmzotten wurden von
beiden Tresterfütterungen positiv beeinflusst. Die Rotweintresterfütterung reduzierte
zusätzlich die Thrombozytenzahl.
37
Schlussfolgerungen
Um die Leistungsfähigkeit der beiden hier getesteten polyphenolreichen Zusatzstoffe
abschließend bewerten zu können, sind weitere Feldversuche mit Immunstimuli
notwendig. Bei der praktischen Umsetzung könnten Obst- und Weinbauern für den
neuen Absatzmarkt ihrer Restprodukte sensibilisiert werden. Getrockneter Apfeltrester
wird − auch für andere Spezies bereits als Futtermittel vertrieben. Weintrester wird bis
jetzt kaum über den Handel als Futtermittel für Schweine vermarktet.
Da die Erhaltung der Tiergesundheit immer mehr in den Blickpunkt der Öffentlichkeit
rückt, beschäftigen sich weitere Arbeiten mit der aktuellen Problematik der
antibiotikafreien Aufzucht von gesunden Jungtieren (Kroismayr et al., 2005; Fleige et
al., 2005).
38
Literatur
9. LITERATUR
Ahmad N, Gupta S, Mukhktar H, 2000: Green tea polyphenol epigallocatechin-3gallate
differentially modulates nuclear factor kappa B in cancer cells versus normal cells. Arch
Bioch And Biophysics 376, 338-346.
Albanese C, D'Amico M, Reutens AT, Fu M, Watanabe G, Lee RJ, Kitsis RN, Henglein
B, Avantaggiati M, Somasundaram K, Thimmapay B, Pestell RG, 1999: Activation of the
cyclin D1 gene by the E1A-associated protein p300 through AP-1 inhibits cellular
apoptosis. J Biol Chem 274, 34186-95.
Ames BN, Shigenaga MK, Hagen TM, 1993: Oxidants, antioxidants, and the
degenerative diseases of aging. Proc Natl Acad Sci 90, 7915-22.
Anderson DB, McCracken VJ, Aminov RI, Simpson JM, Mackie RI, Verstegen MWA,
Gaskins HR, 1999: Gut microbiology and growth-promoting antibiotics in swine. Nutr
Abstr Rev, Series B 70, 101-108.
Van Antwerp DJ, Martin SJ, Kafri T, Green DR, Verma IM, 1996: Suppression of TNF-
alpha-induced apoptosis by NF-kappaB. Science 274, 787-9.
Bach Knudsen KE, 2001: Development of antibiotic resistance and options to replace
antimocrobials in animals diets. Proc Nutr Soc 60, 291-299.
Bailey CJ, Hembry RM, Alexander A, Irving MH, Grant ME, Shuttleworth CA, 1994:
Distribution of the matrix metalloproteinases stromelysin, gelatinases A and B, and
collagenase in Crohn's disease and normal intestine. J Clin Pathol 47, 113-6.
Baldwin AS Jr, 1996: The NF-kappa B and I kappa B protein new discoveries and
insights. Annu Rev Immunol 14, 649-83.
Baud V, Karin M, 2001: Signal transduction by tumor necrosis factor and its relatives.
Trends Cell Biol 11, 372-7.
39
Literatur
Van Beers-Schreurs HMG, Nabuurs MJA, Vellenga L, Kalsbeck van der Valk HJ,
Wensing T, Breukink HJ, 1998: Weaning and the weanling diet influence the villous
height and crypt depth in the small intestine of pigs and alter the concentrations of
short-chain fatty acids in the large intestine and blood. J Nutr 128, 947-53.
Beg AA, Baltimore D, 1996: An essential role for NF-kappaB in preventing TNF-alpha-
induced cell death. Science 274, 782-4.
Berg RD, 1996: The indigenous gastrointestinal microflora. Trends Microbiol 4, 430-5.
Bezkorovainy A, 2001: Probiotics: determinants of survival and growth in the gut. Am J
Clin Nutr 73, 399-405.
Bodine PV, Komm BS, 2002: Tissue culture models for studies of hormone and vitamin
action in bone cells. Vitam Horm 64, 101-51.
de Boer VC, Dihal AA, van der Woude H, Arts IC, Wolffram S, Alink GM, Rietjens IM,
Keijer J, Hollman PC, 2005: Tissue distribution of quercetin in rats and pigs. J Nutr 135,
1718-25.
Böhm H, Boeing H, Hempel J, Raab B, Kroke, A, 1998: Flavonole, Flavone und
Anthocyane als natürliche Antioxidantien der Nahrung und ihre mögliche Rolle bei der
Prävention chronischer Erkrankungen. Z Ernährungswiss 37,147-163.
Bollmann S, 2002: Untersuchungen zur Wirkung nichtantibiotischer Futterzusätze auf
die Darmflora sowie den Verlauf einer experimentellen Escheria coli- bzw Salmonella
Derby-Infektion bei Schweinen, Dissertation, Tierärztliche Hochschule Hannover.
Borska S, Gebarowska E, Wysocka T, Drag-Zalesinska M, Zabel M, 2003: Induction of
apoptosis by EGCG in selected tumour cell lines in vitro. Folia Histochem Cytobiol 41,
229-32.
Boyer J, Liu RH, 2004: Apple phytochemicals and their health benefits. J Nutr. 12, 3-5.
40
Literatur
Van Briel C, 2002: Veränderung der Anzahl und Verteilung von Plasmazellen und
Lymphozytenpopulationen in der Darmschleimhaut des Schweines nach Applikation
von Probiotika, Dissertation, Tierärztliche Hochschule Hannover.
Caderni G, De Filippo C, Luceri C, Salvadori M, Giannini A, Biggeri A, Remy S,
Cheynier V, Dolara P, 2000: Effects of black tea, green tea and wine extracts on
intestinal carcinogenesis induced by azoxymethane in F344 rats. Carcinogenesis 21,
1965-9.
Caderni G, Remy S, Cheynier V, Morozzi G, Dolara P, 1999: Effect of complex
polyphenols on colon carcinogenesis. Eur J Nutr 38, 126-32.
Calixto JB, Campos MM, Otuki M, Santos AR, 2004: Anti-inflammatory compounds of
plant origin Part II modulation of pro-inflammatory cytokines, chemokines and adhesion
molecules. Planta Med 70, 93-103.
Calixto JB, Otuki MF, Santos AR, 2003: Anti-inflammatory compounds of plant origin
Part I Action on arachidonic acid pathway, nitric oxide and nuclear factor kappa B (NF-
kappaB). Planta Med 69, 973-83.
Carbonaro M, Grant G, 2005: Absorption of quercetin and rutin in rat small intestine.
Ann Nutr Metab 49, 178-82.
Carbonaro M, Grant G, Pusztai A, 2001: Evaluation of polyphenol bioavailability in rat
small intestine. Eur J Nutr 40, 84-90.
Carbonneau MA, Leger CL, Monnier L, Bonnet C, Michael F, Fouret G, Dedieu F,
Descomps B, 1997: Supplementation with wine phenolic compounds increases the
antioxidant capacity of plasma and vitamin E of low-density lipoprotein without changing
the lipoprotein Cu(2+)-oxidizability: possible explanation by phenolic location. Eur J Clin
Nutr 51, 982-690.
Caspary WF, 1992: Physiology and pathophysiology of intestinal absorption. Am J Clin
Nutr 55, 299-308.
41
Literatur
Cera KR, Mahan DC, Cross RF, Reinhart GA, Whitmoyer RE, 1988: Effect of age,
weaning and postweaning diet on small intestinal growth and jejunal morphology in
young swine. J Anim Sci 66, 574-84.
Chang HY, Yang X, 2000: Proteases for cell suicidefunctions and regulation of
caspases. Microbiol Mol Biol Rev 64, 821-46.
Chen MS, Chen D, Dou QP, 2004: Inhibition of proteasome activity by various fruits and
vegetables is associated with cancer cell death. In Vivo 18, 73-80.
Chen W, Dong Z, Valcic S, Timmermann B, Bowden G, 1999: Inhibition of ultravoilet B-
induced c-fos gene expression and p38 mitogen-activated protein kinase activation by (-
)-epigellocatechin gallate inhuman keratinocyte cell line. Mol Carcinog 24, 79-84.
Chen Z, Schell J, Ho C, Chen K, 1998: Green tea epigallocatechin gallate shows a
pronounced growth inhibitory effect on cancerous cells but not on their normal
counterparts. Cancer Lett 129, 173-179.
Choi EM, Hwang JK, 2003: Effects of (+)-catechin on the function of osteoblastic cells.
Biol Pharm Bull 26, 523-6.
Crouvezier S, Powell B, Keir D, Yapoob P, 2001: The effects of phenolic components of
tea on the production of pro- and anti-infammatory cytokines by human leukocytes in
vitro. Cytokine 280-286.
Dong Z, 2000: Effects of food factors on signal transduction pathways. Biofactors 12,
17-28.
Duchmann R, Hoffmann J, Marth T, Schneider T, Stallmach A, Zeitz M, 1999:
Mukosales Immunsystem im Darm – Immunologische Grundlagen chronisch
entzündlicher Darmerkrankungen und der HIV-induzierten Enteropathie, Magazin
Forschung 1, 47-64.
42
Literatur
Eberhardt M, Lee C, Liu RH, 2000: Antioxidant activity of fresh apples. Nature 405, 903-
904.
Enari M, Sakahira H, Yokoyama H, Okawa K, Iwamatsu A, Nagata A, 1998: Caspase-
activated Dnas that degredes DNA during apoptosis, and its inhibitor ICAD. Nature 391,
43-50.
Escarpa A, Gonzalez M, 1998: High-performance liquid chromatogrphy with diodearrey
detection for the performance of phenoloc compounds in peel and pulp from different
apple varieties. J Chromat A 823, 331-337.
FAOSTAT-FAO Statistical Database, http://faostat.fao.org/
Feucht W, Treutter D, 1989: Phenolische Naturstoffe, Obst- und Gartenbauverlag,
München.
Fleige S, Preißinger W, Meyer HHD, Pfaffl MW, 2005: Einfluss einer synbiotischen
Fütterung mit Lactulose und Enterococcus faecium auf die Darmgesundheit bei
Milchkälbern – In: Abstractband der „Milchkonferenz 2005“, 29.-30.09.2005, Deutsche
Gesellschaft für Milchwissenschaft, Kiel, 47-48.
Fossum C, 1998: Cytokines as markers for infections and their effect on growth
performance and well-being in the pig. Domest Anim Endocrinol 15, 439-44.
Francois AC, 1962: Mode of action of antibiotics on growth. World Rev Nutr Diet 3, 21.
Fujiki H, Suganuma M, Okabe S, Sueoka E, Suga K, Imai K, Nakachi K, Kimura S,
1999: Mechanistic findings of green tea as cancer preventive for humans. Proc Soc Exp
Biol Med 220, 225-8.
Fujiki H, Suganuma M, Okabe S, Sueoka E, Suga K, Imai K, Nakachi K, 2000: A new
concept of tumor promotion by tumor necrosis factor-alpha, and cancer preventive
agents (-)-epigallocatechin gallate and green tea- a review. Cancer Detect Prev 24, 91-
99.
43
Literatur
Funderburke DW, Seerley RW, 1990: The effects of postweaning stressors on pig
weight change, blood, liver and digestive tract characteristics. J Anim Sci 68, 155-162.
Gantner F, Leist M, Lohse AW, Germann PG, Tiegs G, 1995: Concanavalin A-induced
T-cell-mediated hepatic injury in mice: the role of tumor necrosis factor. Hepatology 21,
190-8.
Gaskins HR, 2001: Intestinal bacteria and their influence on swine growth. In: Swine
Nutrition Lewis AJ, Southern LL, CRC Press, New York, 585-606.
Ghosh S, Karin M, 2002: Missing pieces in the NF-kappaB puzzle. Cell 109, 81-96
Review.
Görke B, 2000: Untersuchung der Schleimhautmorphologie im Dünn- und Dickdarm
nach oraler Applikation von Saccharomyces boulardii und Bacillus cereus var toyoi beim
Schwein, Dissertation, Tierärztliche Hochschule Hannover.
Guttridge DC, Albanese C, Reuther JY, Pestell RG, Baldwin AS Jr, 1999: NF-kappaB
controls cell growth and differentiation through transcriptional regulation of cyclin D1.
Mol Cell Biol 19, 5785-99.
Gutzwiller A, Stoll P, 2005: Apfeltrester im Schweinefutter reduziert die durch das
Mykotoxin Deoxynivalenol verursachte Wachtumsreduktion, Beiträge zur 8.
Wissenschaftstagung Ökologischer Landbau-Ende der Nische, Kassel, 1.-4.3.2005.
Hampson DJ, 1986a: Attempts to modify changes in the piglet small intestine after
weaning. Res Vet Sci 40, 313-7.
Hampson DJ, 1986b: Alterations in piglet small intestinal structure at weaning. Res Vet
Sci 40, 32-40.
44
Literatur
Heczko U, Carthy CM, O'Brien BA, Finlay BB, 2001: Decreased apoptosis in the ileum
and ileal Peyer's patches: a feature after infection with rabbit enteropathogenic
Escherichia coli O103. Infect Immun 69, 4580-9.
Hedemann MS, HØjsgaard S, Jensen BB, 2003: Small intestinal morphology and
activity of intestinal peptidases in piglets around weaning. J Anim Physiol A Anim Nutr
87, 32-41.
Hinz M, Krappmann D, Eichten A, Heder A, Scheidereit C, Strauss M, 1999: NF-kappaB
function in growth controlregulation of cyclin D1 expression and G0/G1-to-S-phase
transition. Mol Cell Biol 19, 2690-8.
Hoffmann-Moujahid A, 2002: Immunreaktionen in der Darmwand und Darmlymphe nach
Gabe bakterieller Antigene in das Darmlumen, Dissertation, Tierärztliche Hochschule
Hannover.
Hollman PC, van Trijp JM, Buysman MN, van der Gaag MS, Mengelers MJ, de Vries
JH, Katan MB, 1997: Relative bioavailability of the antioxidant flavonoid quercetin from
various foods in man. FEBS Lett 418, 152-6.
Hollman PC, de Vries JH, van Leeuwen SD, Mengelers MJ, Katan MB, 1995:
Absorption of dietary quercetin glycosides and quercetin in healthy ileostomy
volunteers. Am J Clin Nutr 62, 1276-82.
Horstmann S, Ferrari S, Klempnauer KH, 2000: Regulation of B-Myb activity by cyclin
D1. Oncogene 19, 298-306.
Hug H, 2000: Apoptose: Die Selbstvernichtung der Zelle als Überlebensschutz. Biologie
in unserer Zeit 30, 128–135.
Inoue K, Sherr CJ, 1998: Gene expression and cell cycle arrest mediated by
transcription factor DMP1 is antagonized by D-type cyclins through a cyclin-dependent-
kinase-independent mechanism. Mol Cell Biol 18, 1590-600.
45
Literatur
Janeway C, Travers P, Immunologie, 1997, Spektrum Verlag, Heidelberg.
Jung HC, Eckmann L, Yang SK, Panja A, Fierer J, Morzycka-Wroblewska E, Kagnoff
MF, 1995: A distinct array of proinflammatory cytokines is expressed in human colon
epithelial cells in response to bacterial invasion. J Clin Invest 95, 55-65.
Junqueira LC, Carneiro J, Kelley RO, 2002, Histologie, Springer Verlag, Berlin.
Kelly D, Smyth JA, McCracken KJ, 1991a: Digestive development of the early-weaned
pig 1 Effect of continuous nutrient supply on the development of the digestive tract and
on changes in digestive enzyme activity during the first week post-weaning. Br J Nutr
65, 169-80.
Kelly D, Smyth JA, McCracken KJ, 1991b: Digestive development of the early-weaned
pig. 2. Effect of level of food intake on digestive enzyme activity during the immediate
post-weaning period. Br J Nutr 65, 181-8.
Klein C, 2001: PTHr und Milch stimulieren einen VitD - unabhängigen aktiven
Calciumtransport im Darm von Saugferkeln, Dissertation, Tierärztliche Hochschule
Hannover.
Kolb GMH, 1991: Vergleichende Histologie, Cytologie und Mikroanatomie der Tiere,
Springer Verlag, Berlin.
Kroismayr A, Sehm J, Mayer HHD, Schreiner M, Foißy H, Wetscherek W, Windisch W,
2005: Effect of essential oils or Avilamycin on microbial, histological and molecular-
biological parameters of gut health in weaned piglets, 4. BOKU Symposium
Tierernährung, 27. Oktober 2005 Wien.
Krüger M, 2005: Beeinflussung der Magen-Darm-Flora von Schweinen und deren
immunologischen Folgen. Nutztierpraxis Aktuell 48-53.
Kuo S, 2002: Flavonoids and gene expression in mammalian cells. Adv Exp Med Biol
505, 191-200.
46
Literatur
Lambert JD, Yang CS, 2003: Cancer chemopreventive activity and bioavailability of tea
and tea polyphenols. Mutat Res 523-524, 201-208.
Lampe JW, 1999: Health effects of vegetables and fruit: assessing mechanisms of
action in human experimental studies. Am J Clin Nutr 70, 475-490.
Langhout DJ, Schutte JB, Van Leevwen F, Wiebenga J, Tamminga S, 1999: Effect of
dietary high and low methyllated citrus pectin on the activity of the ileal microflora and
morphology of the small intestine wall of broiler chicks. Brit Poult Sci 40, 340-347.
Lauronen J, Pakarinen MP, Kuusanmaki P, Savilahti E, Vento P, Paavonen T,
Halttunen J, 1998: Intestinal adaptation after massive proximal small-bowel resection in
the pig. Scand J Gastroenterol 33, 152-8.
Lawrence T, Gilroy DW, Colville-Nash PR, Willoughby DA, 2002: Anti-inflammatory lipid
mediators and insights into the resolution of inflammation. Nat Rev Immunol 2, 787-95.
Li DF, Nelssen JL, Reddy PG, Blecha F, Klemm R, Goodband RD, 1991:
Interrelationship between hypersensitivity to soybean proteins and growth performance
in early-weaned pigs. J Anim Sci 69, 4062-9.
Liebich, 1999: Funktionelle Histologie der Haussäugetiere, Schattauer Verlag, Stuttgart.
Lin JK, Liang YC, Lin-Shiau SY, 1999: Cancer chemoprevention by tea polyphenols
through mitotic signal transduction blockade. Biochem Pharmacol 58, 911-5.
Linden MD, Torres FX, Kubus J, Zarbo RJ, 1992: Clinical application of morphologic
and immunocytochemical assessments of cell proliferation. Am J Clin Pathol 97, 4-13.
Lindl T, Bauer J, 1994: Zell- und Gewebekultur: Einführung in die Grundlagen sowie
ausgewählter Methoden und Anwendungen, Gustav Fischer Verlag, Stuttgart, Jena,
New York.
47
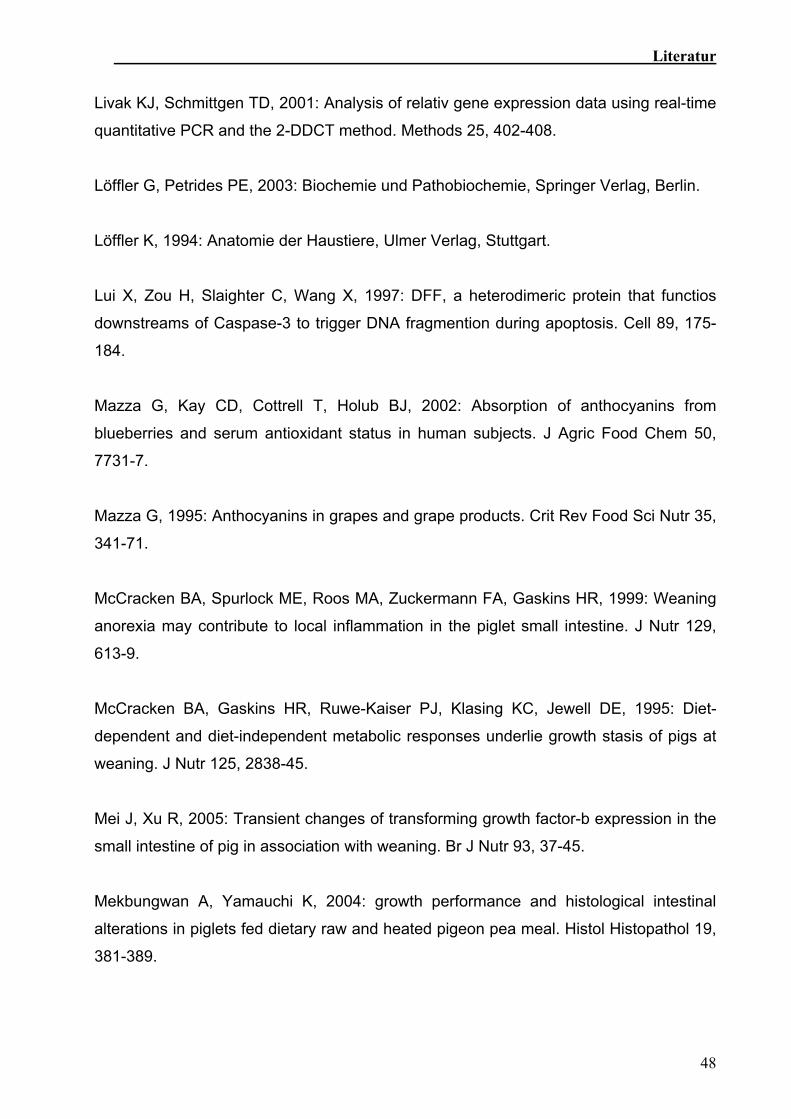
Literatur
Livak KJ, Schmittgen TD, 2001: Analysis of relativ gene expression data using real-time
quantitative PCR and the 2-DDCT method. Methods 25, 402-408.
Löffler G, Petrides PE, 2003: Biochemie und Pathobiochemie, Springer Verlag, Berlin.
Löffler K, 1994: Anatomie der Haustiere, Ulmer Verlag, Stuttgart.
Lui X, Zou H, Slaighter C, Wang X, 1997: DFF, a heterodimeric protein that functios
downstreams of Caspase-3 to trigger DNA fragmention during apoptosis. Cell 89, 175-
184.
Mazza G, Kay CD, Cottrell T, Holub BJ, 2002: Absorption of anthocyanins from
blueberries and serum antioxidant status in human subjects. J Agric Food Chem 50,
7731-7.
Mazza G, 1995: Anthocyanins in grapes and grape products. Crit Rev Food Sci Nutr 35,
341-71.
McCracken BA, Spurlock ME, Roos MA, Zuckermann FA, Gaskins HR, 1999: Weaning
anorexia may contribute to local inflammation in the piglet small intestine. J Nutr 129,
613-9.
McCracken BA, Gaskins HR, Ruwe-Kaiser PJ, Klasing KC, Jewell DE, 1995: Diet-
dependent and diet-independent metabolic responses underlie growth stasis of pigs at
weaning. J Nutr 125, 2838-45.
Mei J, Xu R, 2005: Transient changes of transforming growth factor-b expression in the
small intestine of pig in association with weaning. Br J Nutr 93, 37-45.
Mekbungwan A, Yamauchi K, 2004: growth performance and histological intestinal
alterations in piglets fed dietary raw and heated pigeon pea meal. Histol Histopathol 19,
381-389.
48
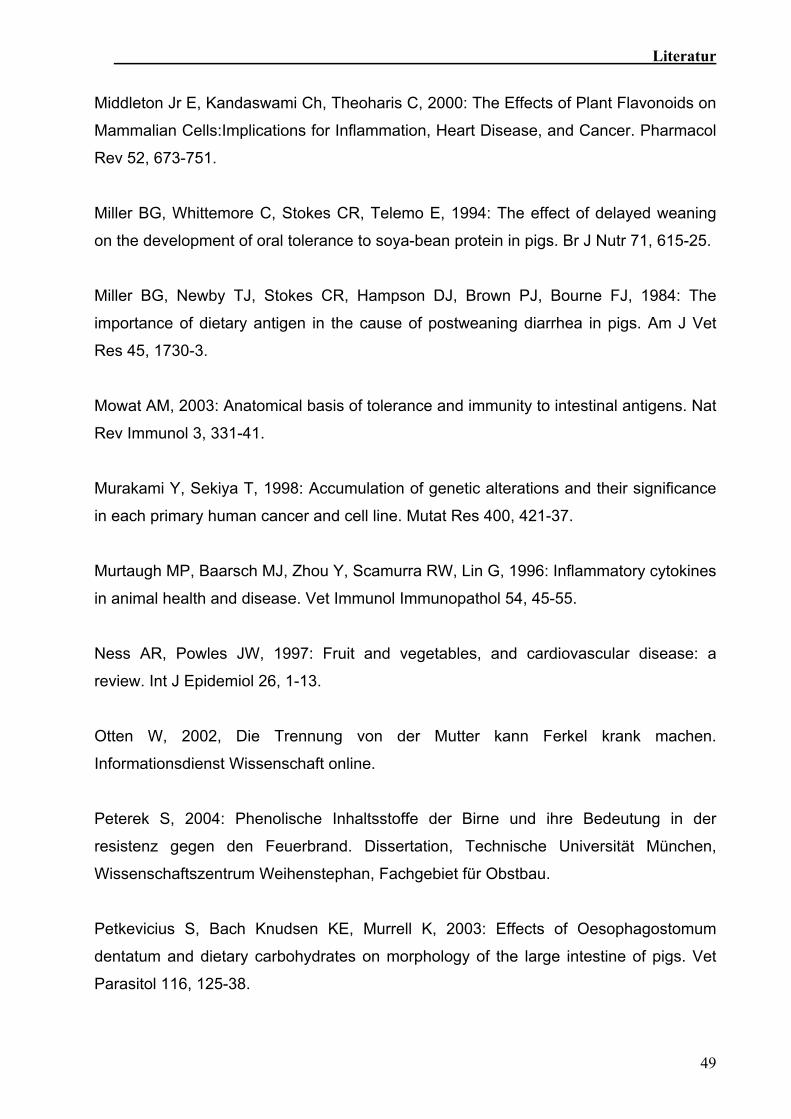
Literatur
Middleton Jr E, Kandaswami Ch, Theoharis C, 2000: The Effects of Plant Flavonoids on
Mammalian Cells:Implications for Inflammation, Heart Disease, and Cancer. Pharmacol
Rev 52, 673-751.
Miller BG, Whittemore C, Stokes CR, Telemo E, 1994: The effect of delayed weaning
on the development of oral tolerance to soya-bean protein in pigs. Br J Nutr 71, 615-25.
Miller BG, Newby TJ, Stokes CR, Hampson DJ, Brown PJ, Bourne FJ, 1984: The
importance of dietary antigen in the cause of postweaning diarrhea in pigs. Am J Vet
Res 45, 1730-3.
Mowat AM, 2003: Anatomical basis of tolerance and immunity to intestinal antigens. Nat
Rev Immunol 3, 331-41.
Murakami Y, Sekiya T, 1998: Accumulation of genetic alterations and their significance
in each primary human cancer and cell line. Mutat Res 400, 421-37.
Murtaugh MP, Baarsch MJ, Zhou Y, Scamurra RW, Lin G, 1996: Inflammatory cytokines
in animal health and disease. Vet Immunol Immunopathol 54, 45-55.
Ness AR, Powles JW, 1997: Fruit and vegetables, and cardiovascular disease: a
review. Int J Epidemiol 26, 1-13.
Otten W, 2002, Die Trennung von der Mutter kann Ferkel krank machen.
Informationsdienst Wissenschaft online.
Peterek S, 2004: Phenolische Inhaltsstoffe der Birne und ihre Bedeutung in der
resistenz gegen den Feuerbrand. Dissertation, Technische Universität München,
Wissenschaftszentrum Weihenstephan, Fachgebiet für Obstbau.
Petkevicius S, Bach Knudsen KE, Murrell K, 2003: Effects of Oesophagostomum
dentatum and dietary carbohydrates on morphology of the large intestine of pigs. Vet
Parasitol 116, 125-38.
49
Literatur
Philpott M, Ferguson LR, 2004: Immunonutrition and cancer. Mutant Res 551, 29-42.
Pie S, Lalles JP, Blazy F, Laffitte J, Sebe B, Oswald IP, 2004: Weaining is associated
with an upregulation of expression of inflammatory cytokines in the intestine of piglets. J
nutr 134, 641-647.
Pluske JR, Thompson MJ, Atwood CS, Bird PH, Williams IH, Hartmann PE, 1996:
Maintenance of villus height and crypt depth, and enhancement of disaccharide
digestion and monosaccharide absorption, in piglets fed on cows' whole milk after
weaning. Br J Nutr 76, 409-22.
Polster J, Dithmar H, Feucht W, 2003: Are histones the targets for flava-3-ols
(catechins) in nuclei? Biol Chem 384, 997-1006.
Prgomet C, Sarikaya H, Bruckmaier RM, Pfaffl MW, 2005: Short-term effects on pro-
inflammatory cytokine, lactoferrin and CD14 mRNA expression levels in bovine
immunoseparated milk and blood cells treated by LPS. J Vet Med A Physiol Pathol Clin
Med 52, 317-24.
Recht J, 2005, Einfluss Seltener Erden in Verbindung mit phytogenen Zusatzstoffen auf
Leistungsparameter beim Ferkel. Dissertation, Tierärztliche Fakultät der Ludwigs-
Maximilians-Universität München.
Roitt IM, Brostoff J, Male DK, 1995: Kurzes Lehrbuch der Immunologie. Georg Thieme
Verlag Stuttgart.
Romeis B, 1989: Mikroskopische Technik, Leibniz Verlag, München.
Ruemmele FM, Seidman EG, Lentze MJ, 2002: Regulation of intestinal epithelial cell
apoptosis and the pathogenesis of inflammatory bowel disorders. J Pediatr
Gastroenterol Nutr 34, 254-60.
50
Literatur
Sakagami H, Takeda M, Sugaya K, Omata T, Takahashi H, Yamamura M, Hara Y,
Shimamura T, 1995: Stimulation by epigallocatechin gallate of interleukin-1 production
by human peripheral blood mononuclear cells. Anticancer Res 15, 971-4.
Sanchez-Rabaneda F, Jauregui O, Lamuela-Raventos RM, Viladomat F, Bastida J,
Codina C, 2004: Qualitative analysis of phenolic compounds in apple pomace using
liquid chromatography coupled to mass spectrometry in tandem mode. Rapid Commun
Mass Spectrom 18, 553-63.
Scalbert A, Williamson G, 2000: Dietary intake and biovailability of polyphenolsa. J Nutr
130, 2073-2085.
Schmittgen TD, 2001: Real time quantitative PCR. methods 25, 383-385.
Sehm J, Polster J, Pfaffl MW, 2005: Effects of varied EGCG and (+)-Catechin
concentrations on pro-inflammatory cytokines mRNA expression in ConA stimulated
primary white blood cell cultures. J Agric Food Chem 53, 6907-6911.
Sehm J, Lindermayer H, Dummer C, Pfaffl MW: The influence of polyphenol rich apple
pomace or red wine pomace diet on the gut morphology in weaning piglets. J Anim
Physiol Anim Nutr. in press.
Sehm J, Lindermayer H, Meyer HHD, Pfaffl MW: The influence of apple- and red-wine
pomace rich diet on mRNA expression of inflammatory and apoptotic markers in
different piglet organs. Anim Sci. Accepted.
Sehm J, Treutter D, Lindermayer H, Pfaffl MW: The influence of normal, apple pomace
added and red wine pomace added diet on blood parameters and faces in piglets. Anim
Feed Sci Technol. in Vorbereitung.
Shaulian E, Karin M, 2001: AP-1 in cell proliferation and survival. Oncogene. 20, 2390-
400.
Shrikhande AJ, 2000: Wine by-products with health benefits. Food Re Int 33, 469-474.
51
Literatur
Sigma Stat, User’s Manual, Jandel Scientific Software, USA, 1995, Version 5.0.
Da Silva Porto P, Laranjinha J, de Freitas V, 2003: Antioxidant protectio of low density
lipoprotein by procyanidins: structure/activity relationships. Biochem Pharmacol 66, 947-
954.
Soleas GJ, Diamandis EP, Goldberg DM, 1997: Wine as a biological fluid: history,
production, and role in disease prevention. J Clin Lab Anal 11, 287-313.
Spencer JP, 2003: Metabolism of tea flavonoids in the gastrointestinal tract. J Nutr 133,
3255-3261.
Stadnyk AW, 1994: Cytokine production by epithelial cells. FASEB J 8, 1041-7.
Santos-Buelga C, Scalbert A, 2000. Proanthocyanidins and tannin-like compounds
nature, occurence, dietary intake and effects on nutrition and health. J Sci Food Agr 80,
1094-1117.
Steinmetz KA, Potter JD, 1996: Vegetables, fruit, and cancer prevention: a review. J Am
Diet Assoc 96, 1027-39.
Stoll, Der Apfel, 1997, Verlag Negiri, Zürich.
Suganuma M, Sueoka E, Sueoka N, Okabe S, Fujiki H, 2000: Mechanisms of cancer
prevention by tea polyphenols based on inhibition of TNF-alpha expression. Biofactors
13, 67-72.
Tang M, Laarveld B, Van Kessel AG, Hamilton D, Estrada A, Patience JF, 1999: Effect
of segregated early weaning on postweaning small intestinal development in pigs. J
Anim Sci 77, 3191-200.
Treutter D, 1989: chemical reaction detection of catechins and proanthocyanidins with
4-dimethylaminocinnamaldehyde. J Chromatogr 467, 185-193.
52
Literatur
Vente-Spreeuwenberg MAM, Verdonk JMAJ, Verstegen MWA, Beynen AC, 2003: Villus
height and gut development in weaned piglets receiving diets containing either glucose,
lactose or starch. Br J Nutr 90, 907-13.
Visek WJ, 1978: The mode of growth promotion by antibiotics. J Anim Sci 46, 1447-
1469.
Wang C, Li Z, Fu M, Bouras T, Pestell RG, 2004: Signal transduction mediated by cyclin
D1from mitogens to cell proliferationa molecular target with therapeutic potential.
Cancer Treat Res 119, 217-3.
Watzl B, Leitzmann C, „Bioaktive Substanzen in Lebensmitteln“, Hippokrates Verlag,
1999.
Watzl B, Rechkemmer G, 2001: Flavonoide, Ernährungs-Umschau 48, 498-502.
Weinstatistik, 1999; www.deutscheweine.de.
Wiese F, Simon O, Weyrauch KD, 2003: Morphology of the small intestine of weaned
piglets and a novel method for morphometric evaluation. Anat Histol Embryol 32, 102-9.
Willett WC, 2002: Balancing life-style and genomics research for disease prevention.
Science 296, 695-8.
Witte W, 1999: Antibiotic resistance in gram-positive bacteria: epidemiological aspects.
J Antimicrob Chemother 44 Suppl A, 1-9.
Wolfe K, Wu X, Liu R H, 2003: Antioxidant activity of fresh peels. J Agric Food Chem
51, 253-256.
Woods RK, Walters EH, Raven JM, Wolfe R, Ireland PD, Thien FC, Abramson MJ,
2003: Food and nutrient intakes and asthma risk in young adults. Am J Clin Nutr 78,
414-21.
53
Literatur
Yang CS, Maliakal P, Meng X, 2002: Inhibition of carciogenesis by tea. Annu Rev
Pharmacol Toxicol 42, 25-45.
Yasar S, Forbes JM, 1999: Performance and gastro-intestinal response of broiler chicks
fed on cereal grain-based foods soaked in water. Bri Poult Sci 40, 65-67.
Zijstra RT, Whang KY, Easter RA, Odle J, 1996: Effect of feeding a milk replacer to
early-weaned pigs on growth, body composition, and small intestinal morphology,
compared with suckled littermates. J Anim Sci 74, 2948-2959.
Zijlstra RT, Donovan SM, Odle J, Gelberg HB, Petschow BW, Gaskins HR, 1997:
Protein-energy malnutrition delays small intestinal recovery in neonatal pigs infected
with rotavirus. J Nutr 127, 118-127.
Zhang JM, Wie Q, Zhao X, Paterson BM, 1999: Coupling of the cell cycle and
myogenesis through the cyclin D1-dependent interaction of MyoD with cdk4. The EMBO
journal 18, 926-33.
Zhao Y, Liu J, Wang J, Wang L, Yin H, Tan R, Xu Q, 2004: Fumigaclavine C improves
concanavalin A-induced liver injury in mice mainly via inhibiting TNF-alpha production
and lymphocyte adhesion to extracellular matrices. J Pharm Pharmacol 56, 775-82.
Zimmermann KC, Bonzon C, Green DR, 2001: The machinery of programmed cell
death. Pharmacol Ther 92, 57-70.
54
Anhang
ANHANG Lebenslauf Julia Maria Sehm, geb. Herzig
Geburtsdatum 14. Juli 1978
Geburtsort Freising
Familienstand verheiratet
Kind Johanna 11. Juni 2005
Ausbildung: 08/1985 – 08/1987 Grundschule Sankt Georg in Freising
08/1987 – 08/1989 Grundschule Sankt Korbinian in Freising
08/1989 – 08/1998 Josef-Hofmiller-Gymnasium in Freising
Abschluss mit dem Zeugnis der Allgemeinen Hochschulreife
11/1998 – 10/2002 Studium der Agrarwissenschaften an der TUM
Abschluss: Diplomargraringenieurin Univ/
Seit 11/2002 Doktorand, Physiologie,TUM-Weihenstephan
Praktikum: 06/1998 - 10/1998 Ringenberg, Feldhof, Obstbaubetrieb
03/1999 - 04/1999 Versuchsstation Thalhausen TUM, Schwerpunkt
Schweinehaltung
bisherige Arbeitstellen (ausschließlich Praktikumsstellen): 03/2000 – 05/2000 wissenschaftliche Hilfskraft am Lehrstuhl für Tierzucht
03/2001 – 10/2003 wissenschaftliche Hilfskraft am Lehrstuhl für Physiologie
07/2003 – 06/2005 Forschung im Rahmen des Projektes „Stimulation der
körpereigenen Immunabwehr: Effekte von sekundären
Pflanzeninhaltstoffen auf das Immunsystem“ (Bayerisches
Staatsministerium für Landwirtschaft und Forsten, L/a-7606.2-
494) als wissenschaftlicher Mitarbeiter am Lehrstuhl für
Physiologie
55
Anhang
Betreute Arbeiten
Großpraktika:
Katrin Beerbaum: Auswirkungen von Catechin und EGCG auf die Genexpression
Christian Biegel: Etablierung und Validierung einer Hochdurchsatz qRT-PCR:
Quantitative Bestimmung pro-inflammatorischer Genexpression in Ferkelgeweben
Marco Nörenberg: Auswirkungen von sekundären Pflanzeninhaltsstoffen auf die
Morphologie des Schweinedarmes
Seminararbeit:
Claudia Dummer: „Auswirkungen der oralen Applikation von Apfel- und
Rotweintrester auf die Morphologie des Schweinedarmes“
Vortrag: Endokrinologisch-molekularbiologisches Kolloquium, Montag, den
12.07.2004
Bachelor Arbeit
Katharina Werkstetter: „Entwicklung und Optimierung einer Caspase-3
immunhistologischen Färbung in Ileum und Colon zur Messung der Apoptoserate“
Vortrag: Endokrinologisch-molekularbiologisches Kolloquium, Montag, den
12.07.2004
56
Anhang
Publikationen
Orginalarbeiten Sehm J, Polster J, Pfaffl MW, 2005: Effects of varied EGCG and (+)-Catechin
concentrations on pro-inflammatory cytokines mRNA expression in ConA stimulated
primary white blood cell cultures. J Agric Food Chem 53, 6907-6911.
Sehm J, Lindermayer H, Dummer C, Pfaffl MW: The influence of polyphenol rich
apple pomace or red wine pomace diet on the gut morphology in weaning piglets. J
Anim Physiol Anim Nutr. in press.
Sehm J, Lindermayer H, Meyer HHD, Pfaffl MW: The influence of apple- and red-
wine pomace rich diet on mRNA expression of inflammatory and apoptotic markers in
different piglet organs. Anim Sci. Accepted.
Sehm J, Treutter D, Lindermayer H, Pfaffl MW: The influence of normal, apple
pomace added and red wine pomace added diet on blood parameters and faces in
piglets. Anim Feed Sci Technol. in Vorbereitung.
Fleige S, Walf V, Huch S, Prgomet C, Sehm J, Pfaffl MW: Comparison of relative
mRNA quantification models and the impact of RNA integrity in quantitative real-time
RT-PCR. Biotechnol Lett. in press.
Kroismayr A, Sehm J, Pfaffl M, Plitzner C, Windisch W: Influence of essential oils or
Avilamycin on gut morphology and blood parameters of weaned piglets. J Anim
Physiol Anim Nutr. in Vorbereitung.
Kroismayr A, Sehm J, Pfaffl M, Windisch W: m-RNA expression of inflammatory and
apoptotic genes in weaned piglets fed with essential oils or Avilamycin. J Anim
Physiol Anim Nutr. in Vorbereitung.
57

Anhang
Abstracts und Poster Herzig J, Polster J, Pfaffl M.W: Immune stimulation of primary white blood cells
cultured with two types of Catechins at different time points. – In: Abstractband der
“1st International Conference on Polyphenols and Health”, Vichy, France, 18-
21.11.2003, Abstr. No. P164.
Herzig J, Dummer C, Pfaffl MW: "An apple a day keeps the doctor away!" Influence
of different flavanol rich feeding regimens on the villi and crypt morphology in
jejunum, ileum, and colon of young piglets. – In: Abstractband der “XXII International
Conference on Polyphenols”, University of Helsinki, Finnland, 25.-28.08.2004, 11-12,
Abstr. No. P375.
Herzig J, Pfaffl MW: Effects of immune stimulation on expression of pro-inflammatory
factors in primary white blood cells cultured with various concentrations of EGCG or
(+)-catechin. – In: Abstractband der XXII International Conference on Polyphenols,
University of Helsinki, Finnland 25.-28.08.2004, 469-470.
Kroismayr A, Sehm J, Mayer H, Schreiner M, Foissy H, Wetscherek W, Windisch W:
Effect of essential oils or Avilamycin on microbial, histological and molecular-
biological parameters of gut health in weaned piglets. In: Abteilung Tierische
Lebensmittel, Tierernährung und Ernährungsphysiologie, BOKU Wien: 4. Boku-
Symposium Tierernährung, 27.10.2005, Universität für Bodenkultur Wien.
Kroismayr A, Sehm J, Plitzner C, Windisch, W: Effect of an essential oil blend
(oregano, anis, citrus peels) or Avilamycin on growth performance, microbiological
and histological parameter, and mRNA expression of inflammatory and apototic
genes in the gut of weaned piglets. In: Proceedings of the Society of Nutrition
Physiology: Gesellschaft für Ernährungsphysiologie, 21.-23.03.2006, Göttingen.
58
Anhang
Angehängte Publikationen Sehm J, Polster J, Pfaffl MW, 2005: Effects of varied EGCG and (+)-Catechin
concentrations on pro-inflammatory cytokines mRNA expression in ConA stimulated
primary white blood cell cultures. J Agric Food Chem 53, 6907-6911.
Sehm J, Lindermayer H, Dummer C, Pfaffl MW: The influence of polyphenol rich
apple pomace or red wine pomace diet on the gut morphology in weaning piglets. J
Anim Physiol Anim Nutr. in press.
Sehm J, Lindermayer H, Meyer HHD, Pfaffl MW: The influence of apple- and red-
wine pomace rich diet on mRNA expression of inflammatory and apoptotic markers in
different piglet organs. Anim Sci. Accepted.
Sehm J, Treutter D, Lindermayer H, Pfaffl MW: The influence of normal, apple
pomace added and red wine pomace added diet on blood parameters and faces in
piglets. Anim Feed Sci Technol. in Vorbereitung.
59
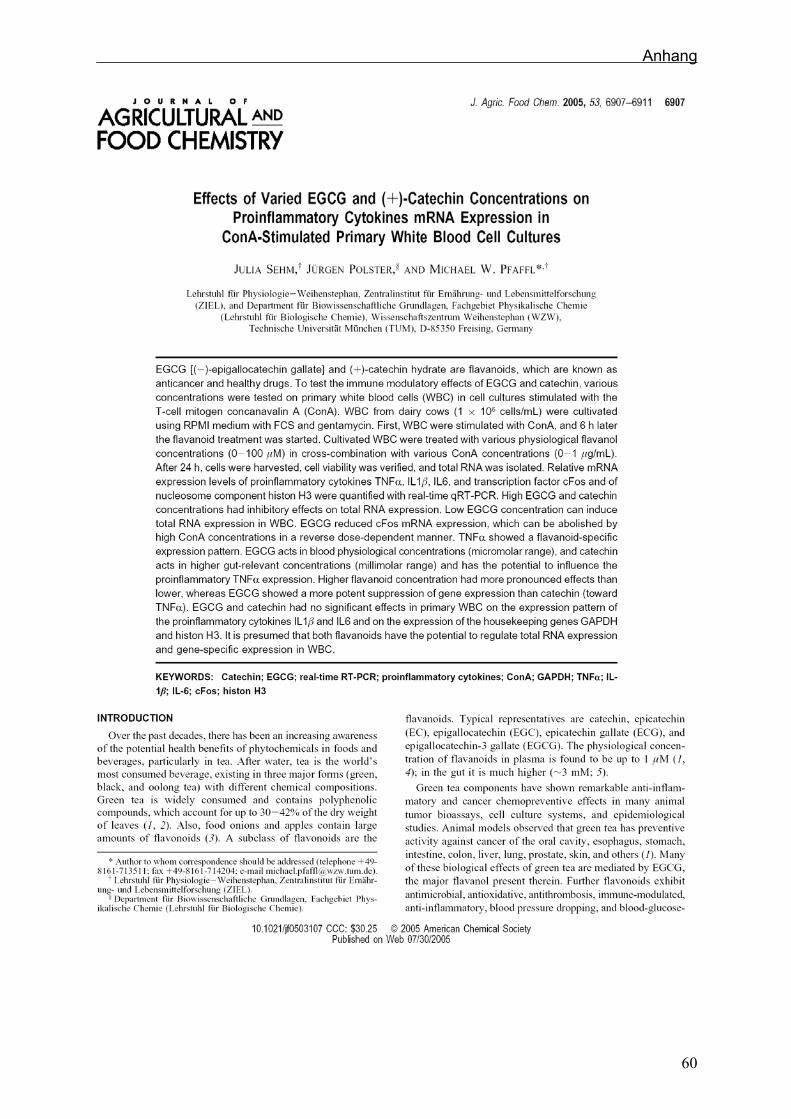
Anhang
60
Anhang
61
Anhang
62
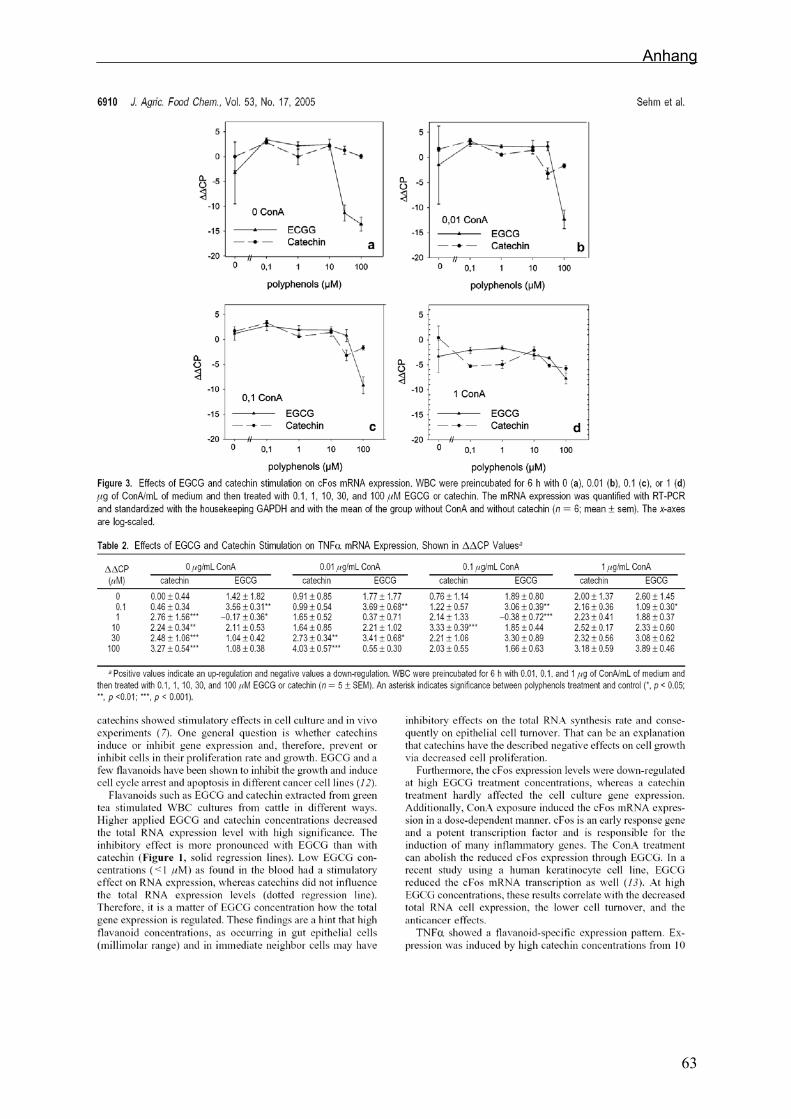
Anhang
63
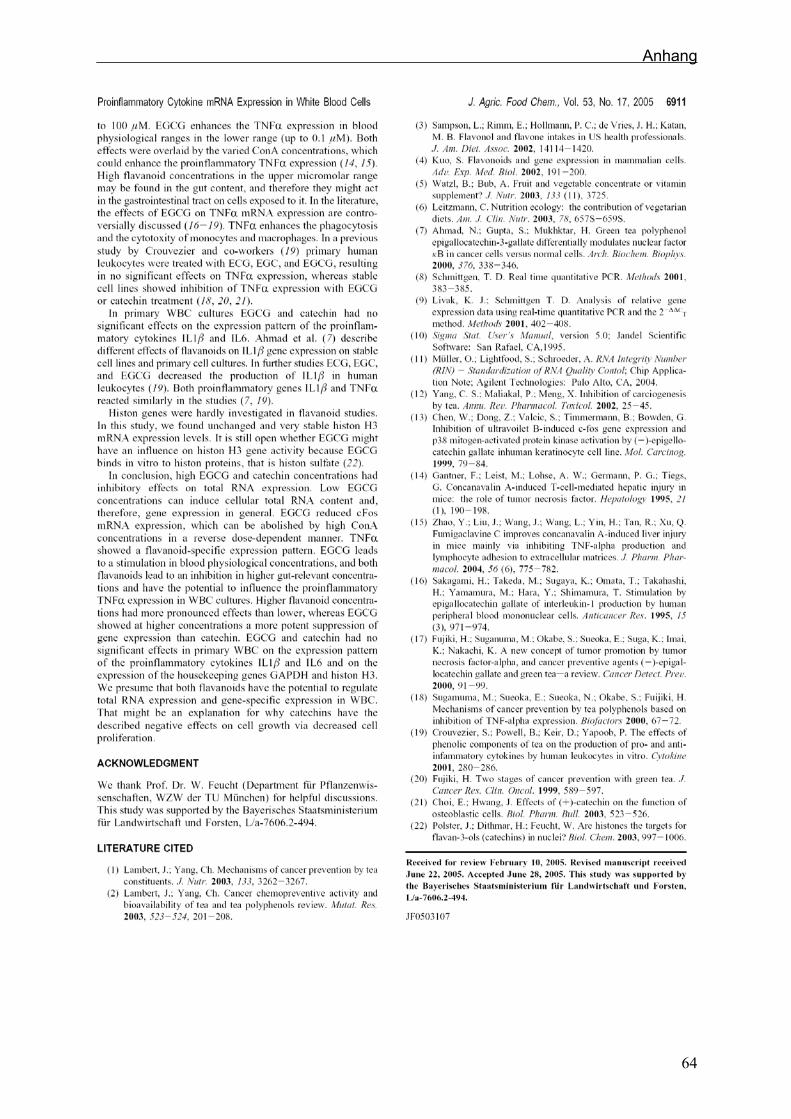
Anhang
64
Anhang
Manuskript :
The influence of apple pomace or red-wine pomace rich diet on the gut morphology in weaning piglets. J. Sehm1, H. Lindermayer2, C. Dummer1 and M. W. Pfaffl1*
1 Lehrstuhl für Physiologie, Wissenschaftszentrum Weihenstephan, Technische Universität München,
D-85354 Freising, Germany.
2 Institut für Tierernährung und Futterwirtschaft, Bayerische Landesanstalt für Landwirtschaft (LfL), D-
85586 Poing-Grub, Germany.
*Author for correspondence:
Michael W. Pfaffl
Lehrstuhl für Physiologie
Wissenschaftszentrum Weihenstephan
Weihenstephaner Berg 3
D-85354 Freising-Weihenstephan
Tel.: +49-8161-71 3511
Fax: +49-8161-71 4204
e-mail: [email protected]
Key words: Apple pomace, red-wine pomace, piglets, intestinal morphology
65
Anhang
Abstract Most of the piglets’ loss happens around weaning. Antibiotic additives in the diet help to decrease
these losses. Beginning in 2006 antibiotics will be forbidden by the EU as prophylactic tool in animal
diets, and it will be helpful to include other diet additives that have beneficial effects. Alternative food
ingredients are discussed, e.g. probiotics, prebiotics and synbiotics, as well as secondary plant
compounds, like polyphenols. In this study the effect of three different diets - normal piglets starter
without additives, with apple pomace or with red-wine pomace - on the intestinal morphology was
investigated from three days prior to weaning to four weeks post weaning. Villus height, crypt depth
and breadth of villi and crypts were determined in the jejunum, ileum and colon in 78 piglets.
Additionally the area of the peyer´s patches in the ileum was measured.
In jejunum and ileum the villus length in the control group decreased after weaning but increased over
the entire feeding experiment. In the two pomace groups no decrease was measured after weaning. In
jejunum an increase in villi breadth occurred, 73% in the control group and approximately 10% in both
treatment groups. A 35% increase was found in the ileum in all groups. Peyer´s patches area
increased about 20% in the control group, whereas in other groups no significant differences were
found. Thus apple and red-wine pomace are shown to have inhibitory effects on the jejunum villi
growth, and stimulating effects on villi length and crypt depths in colon. Apple and red-wine pomace
can also reduce the GALT activation via the peyer´s patches in the ileum. In conclusion, flavanoids
rich feeding regimen showed positive effects on villi morphology and may be an alternative to improve
pig health after the ban on antibiotics.
Introduction Pigs today grow much faster than ever before, not only because the feed formulation keeps up with
genetic improvement, but also through improved management practices (Bezkorovainy, 2001). In
addition sub-therapeutical levels of antibiotics have been used as growth promoters. However, the use
of antibiotics as feed additives is risky due to provocation of antibiotic resistance in pathogens (Bach
Knudsen, 2001). The long-term use of anti-microbial growth promoters may select for resistant
bacteria strains, and resistance may then be transferred to other bacteria (Aarestrup, 1999). In 2006,
EU laws against prophylactic use of antibiotics in animal feed will come into effect (BMVEL, 2005). It
will be useful to find other feed alternatives, which stabilize the gut environment and enhance piglet
health. Many studies assume that diets change the intestinal morphology and therefore affect piglets’
health (Hedemann et al., 2002; Boudry et al., 2004; Kotunia et al. 2004). However today alternative
feed ingredients are discussed to support gut health, e.g. probiotics, prebiotics and synbiotics, as well
as secondary plant components (Bach Knudsen, 2001, Scalbert and Williamson, 2000).
Apples and red-wine have high amounts of polyphenols and are well known as healthy drugs which
can modulate gut activity (Böhm et al., 1998). The average of the total polyphenol content is 0.3 g/kg
apple fresh weight (0.05 – 1.1 g/kg) (Stoll, 1997) and about 2 g/l red-wine (Scalbert and Williamson,
2000). The pomace of apples and grapes have also high concentrations of these polyphenols. The
main components of polyphenols in these by-products are flavan-3-ol and proanthocyanidine
(Gonzáles-Paramás et al., 2004, Schieber et al., 2001).
66

Anhang
During piglet weaning the feed changes suddenly from sow milk to pelleted dry feed. After weaning
piglets often get diarrhoea (van Beers-Schreurs, 1998), resulting in less daily weight gain, higher
individual support, and higher costs. “An apple a day keeps the doctor away” – this old saying was
tested in our study, using 3.5% freeze dried apple or red-wine pomace in piglets feed. The morphology
of three different segments of the intestinal tract (ileum, jejunum and colon) were investigated
histologically.
Material and methods Experiment and sampling In this study 78 cross breed piglets [Pietráin x (Deutsche Landrasse x Deutsches Edelschwein)] were
fed with three different feed compositions. The animals were housed at the experimental station
Osterseeon (Bayerische Landesanstalt für Landwirtschaft, Institut für Tierernährung und
Futterwirtschaft). 30 animals were fed with a control standard weaning diet (CD) (50% wheat, 23%
barley, 22% soy, 1% soy oil, 4% vitamins and minerals), 24 each got additionally apple pomace (AP)
or red-wine pomace (RWP), each 3.5% dry mass in total (table 1). Energy, protein, fat and starch were
balanced in all three diets. The first six control pigs were slaughtered one week before weaning (day
24), then every week 6 CD pigs, 6 AP and 6 RWP feed piglets were slaughtered (figure 1). At
weaning, piglets were grouped with identical age (31 ± 1.8 days), the same weight (7.5 ± 1.1 kg) and
half male, half female in every group. Piglets were weighed one week before weaning (day 24), at
weaning (day 31) and at live day 36, day 43 and day 50.
Pigs were killed after 26 day under treatment, by electric gripper and exsanguinated. A horizontal
incision along the midline was made to open the abdominal cavity, and all the internal organs were
excised. The empty bodyweight was measured. Tissue samples of 0.5 cm length were taken of the
central part of the following gut compartments: jejunum, ileum, and colon. Immediately after collection,
the tissue-samples were washed three times in 0.9% NaCl solution and fixed 48 h in 3.7% formalin
solution. After fixation the specimen were dehydrated and embedded in paraffin using an automated
embedding system (Sakura VIP 5, Digitana, Schweiz), at the LUA (Landesuntersuchungsamt,
Oberschleißheim, Germany). Sections from each sample cut at 8µm thickness and stained with
haematoxylin and eosin (HE) according to Mayer (Luna, 1968).
Histomorphometry
Digital microphotographs were obtained and evaluated with a graphic program (AxioVision 3.1,
Göttingen, Germany). The morphology in the intestine was measured with a Zeiss-Microscope
(Axioskop 2 plus with 10x/0.30 Plan-Neofluar objective, Göttingen, Germany). Only for the
measurement of the lymph follicle a Zeiss-Microscope (Stemi 2000 C, Göttingen, Germany) was used
with the 2.5x objective.
The measurements of villus height and crypt depths were done on three well-orientated crypt-villus
preparations for each slide. In total there were 234 (78 piglets, triplicates measurement)
measurements per category (length or width) within a tissue section (jejunum, ileum, colon). The
length of the villi was measured from the top of the villi to the Lamina muscularis mucosae, as shown
in figure 2. The width was defined as the distance from one crypts-villi-junction to the next. Out of
67
Anhang
these two lengths the virtual area was calculated (length x width). There are no villi in the colon, so the
length was measured only from the crypts.
Peyer´s patches area in the ileum were imaged and measured in triplicates (n = 234) by using digital
camera and axiovision software (Carl Zeiss Axio Cam MR, axiovision software, 3.0.6 SP3). The
outline of the peyer´s patches was performed by hand.
To measure the cell size of epithelial cells, ten intestinal epithelial cells were counted along the villi
and dimension measured.
Statistic
Group differences were compared with two way ANOVA (diets and age). Additional linear regression
was made from every measurement category and feeding group. The linear regression was made
using Sigma Stat (Version 3.0, Chicago, USA). P values less than 0.05 were considered significant.
Results All animals stayed healthy and no animal losses were registered during in the feeding experiment.
Some of the piglets excreted pasty faeces, but none of the pigs got ill and was treated for any disease.
Energy and feed intake and average daily gain did not differ between dietary treatments. Daily feed
intake was 130 g/d in the first, 310 g/d in the second and 550 g/d in the third week after weaning. In
the first treatment week before weaning, we had weight losses of 152 g/day, and afterwards weight
increase of 239 g/day, 299 g/day and 262 g/day in the different treatment weeks. The different
feedings had no significant effect on daily gain. At the different slaughter dates the piglets weighed 8.6
± 0.7 kg (day 24), 7.5 ± 1.1 kg (day 31), 8.7 ± 1.0 kg (day 36), 10.8 ± 1.4 kg (day 43) and 13.15 ± 1.6
kg (day 50). The weight increased significantly with age (p < 0.001), however, the three feeding
treatments showed no differences (figure 3). So the empty body weight was not affected by the
different diets.
Histomorphometry in jejunum In the jejunum villi-length and villi-diameter increased with age of the piglets. Over the four weeks the
villi-length from the control and the apple pomace group increased 21 % respectively 20 %, the villi-
length of the red-wine pomace only about 3.6 %. The villi breadth of the control group trend to
increased about 38 %, whereas the other two groups showed only an increase of 10 %. In table 2
relative growth of length, breath and area are shown during the 26 treatment days, compared to the
start at day 0. The trend of villi growth, shown as villi area (length x breath) over the 26 days feeding
period was significantly increased in the control (p < 0.001) and the apple pomace group (p <0.01).
The villi area as such of the control group was significantly smaller than the apple pomace group (p =
0.025) and the red-wine pomace (p = 0.017) group.
Histomorphometry in ileum The ileum villi-length started with 0.412 mm and increased in the control group about 20% over the
experimental period, in the other two groups about 30%. Also in ileum only the length of the villi in the
68
Anhang
control group decreased from the first to the second slaughtering. At the second (CD vs. AP p = 0.050;
CP vs. RWP p = 0.012) and the fifth (CD vs. AP p = 0.008; CP vs. RWP p = 0.003) slaughtering the
villi-length of the CD group was significantly smaller then in the treated groups.
The width of the villi increased about 40% in the CD and the RWP group and about 30% in the AP
group (table 3). There where no significant differences between the feeding regimens over the entire
feeding experiment in length or width of the villi. Peyer´s patches The measured area of the peyer´s patches located in the central piglet ileum, showed a highly significant increase only in control group (p = 0.007). Apple pomace and red-wine pomace group had no significant increase during the experiment (table 4).
Histomorphometry in colon The crypt-depths increased during the experiment, and the three treatments showed similar trends.
The control group and the red-wine pomace group showed an increase around 39-45% and the apple
pomace group about 53%. The breadths showed a small decrease in the control and wine pomace
group, whereas in the apple pomace group an increase was measured. The crypt area resulted in
highly significant increases (p < 0.001) for apple and red-wine feeding groups.
Epithelial cells In a sub-project the size of the epithelial cells was measured in jejunum of 6 piglets, to test if the villi or
the cells itself are growing under the influence of flavanols. In each count ten epithelial cells at the
outer line of villi were counted and the length of the cell row was measured. Cells sizes stayed
constant under all three feeding regimes and over 26 days (table 6).
Discussion Weaning is a sudden physiological event that influences intestinal structure and gut function in the
growing piglet. Our model combined different stressful events: weaning, psychological stress with the
separation from the mother and mixing with non-littermates, and nutritional stress. The weaning of
piglets, independent of their age, has generally an enormous effect on morphology of the villi in the
small intestine (Wiese et al., 2003). The different diets were found not to influence body growth
performance and daily gain of the piglets in the end. As shown in the literature, villi-length decreased
to a minimum around three days after weaning (Kelly et al., 1991; van Beers-Schreurs et al., 1998;
Klein, 2001; Hedemann et al., 2003; Vente-Spreeuwenberg et al., 2003). Afterwards the villi-length
increases again very rapidly (Tang et al., 1999). During the applied experiment the villi morphology
changed significantly in the jejunum and colon. The pomace diet seemed to decrease the rapid
changes in gut morphology after weaning, by increasing the growth in the ileum and colon over the
whole testing period. In the jejunum a villi-length decrease of 15% and in the ileum of 10% could be
shown. Boudry et al. (2004) found a decrease of 40% in the jejunum and no changes in the distal
ileum. The villi-length were longer in the jejunum than in the ileum, comparable to earlier feeding
experiments (Görke, 2000, Mekbungwan and Yamauchi, 2004). The ileum showed a greater increase
69
Anhang
of the villi size compared to the jejunum, but the pomace diets did not result in significant differences.
Wiese et al. (2003) determined a higher proliferation rate of the epithelial cells in the ileum than in the
jejunum. The intestine is the most important site of nutrient absorption, and its efficiency is correlated to the
surface area. It has been suggested that long villi result in an increased surface area capable of
greater absorption of available nutrients (Caspary, 1992, Görke, 2000). Therefore long-villi were
observed in the pigs showing an increased body weight gain (Zijlstra et al., 1996), whereas short-villi
were reported during malnutrition (Zijlstra et al., 1997). In further studies greater villus-height and
numerous mitosis in the intestine were morphologic indicators that the function of the intestinal villi
was activated (Langhout et al., 1999; Yasar and Forbes, 1999). As shown herein, the constant
epithelial cell breadth of 10 measured cells indicates that epithelial cells sizes stay constant in jejunum
and the villi itself is growing.
In the ileum no effect on the gut morphology were shown, but there seems to be a significant influence
on the GALT (gut-associated lymphoid tissue). The ileum incorporating peyer´s patches were 21%
enlarged in the control group over the 26 days treatment period (p < 0.007). This indicates peyer´s
patches or GALT activation in the flavanoids lacking feeding regimen and suggest an immune-
preventive effect of flavanols in the ileum immune system. As shown earlier, flavonoids have blocking
effects on lymphoid growth, T-cells and natural killer cells (Lampe, 1999).
The assumption that increased crypth-depth is an indication of increased cell production in the crypts
is widely accepted (Lauronen et al., 1998, Mei and Xu, 2005). In the colon, both flavanol-feeding
regiments can enhance the villi and crypt growth, measured by area (p < 0.001). Petkevicius et al.
(2003) find no changes in the middle colon with two different diets, but did with infected piglets. Conclusion Different polyphenol rich pomaces have diverse effects in the gastrointestinal tract. Apple and red-
wine pomace have inhibitory effects on the jejunum villi growth, whereas they have stimulating effect
on crypt size in piglet colon. Apple and red-wine pomace can reduce the GALT activation via the
peyer´s patches in the ileum. In conclusion, the flavanoids rich feeding regimen showed positive
effects on villi morphology and may a good alternative to improve pig health after the ban on
antibiotics.
Acknowledgements This study was supported by the Bayerisches Staatsministerium für Landwirtschaft und Forsten, L/a-7606.2-494. Special thanks to the Landesuntersuchungsamt (LUA) in Oberschleißheim for their excellent paraffin embedding. References: Aarestrup, F. M., 1999: Association between the consumption of antimicrobial agents in animal
husbandry and the occurrence of resistant bacteria among food animals. Int. J. Antimicrob.
Agents. 12(4), 279-85.
70
Anhang
Bach Knudsen, K. E., 2001: Development of antibiotic resistance and options to replace
antimocrobials in animals diets. Proc. Nutr. Soc. 60, 291-299.
Van Beers-Schreurs, H. M. G., Nabuurs, M. J. A., Vellenga, L., Kalsbeck- van der Valk, H. J.,
Wensing,T., Breukink, H.J., 1998: Weaning and the weanling diet influence the villous height and
crypt depth in the small intestine of pigs and alter the concentrations of short-chain fatty acids in
the large intestine and blood, J. Nutr. 128, 947-53.
Bezkorovainy, A., 2001: Probiotics: determinants of survival and growth in the gut. Am. J. Clin. Nutr.
73 (2 Suppl), 399S-405S.
BMVEL, 2003: Bericht über die Tagung des Rates für Landwirtschaft und Fischerei am 20. Februar
2003 in Brüssel.
Böhm, H., Boeing, H., Hempel, J., Raab, B., Kroke, A., 1998: Flavonole, Flavone and Anthocyane als
natürliche Antioxidantien der Nahrung und ihre mögliche Rolle bei der Prävention chronischer
Erkrankungen. Z. Ernährungswiss. 37, 147-163.
Boudry, G., Péron, V., Huërou-Luron, I. L., Lallés ,J. P., Séve, B., 2004: Weaning induces both
transient and long-lasting modifications of absorptive, secretory and barrier properties of piglet
intestine, J. Nutr. 134, 2256-2262.
Caspary, W. F., 1992: Physiology and pathophysiology of intestinal absorption. Am. J. Clin. Nutr. 55(1
Suppl), 299S-308S.
Görke, B., 2000: Untersuchungen der Schleimhautmorphologie im Dünn- und Dickdarm nach oraler
Applikation von saccharomyces boulardii und Bacillus cereus var. Toyoi beim Schwein,
Dissertation Hannover.
Gonzalez-Paramas, A. M., Esteban-Ruano, S., Santos-Buelga, C., de Pascual-Teresa, S., Rivas-
Gonzalo, J. C., 2004: Flavanol content and antioxidant activity in winery byproducts. J. Agric.
Food. Chem. 52(2), 234-8.
Hedemann, M. S., Hojsgaard, S., Jensen, B .B., 2003: Journal of animal nutrition, small intestinal
morphology and activity of intestinal peptidases in piglets around weaning. J. Anim. Physiol. A.
Anim. Nutr. 87, 32-41.
Kelly, D., Smyth, J. A.; MCCracken, K. J., 1991: Digestive development of the early-weaned pig. 2.
Effect of level of food intake on digestive enzyme activity during the immediate post-weaning
period. Br. J. Nutr. 65, 181-188.
Klein, C., 2001: PTHR und Milch stimulieren einen Vitamin D unabhängigen aktiven Calciumtransport
im Darm von Saugferkeln, Dissertation Hannover.
Kotunia, A., Wolinski, J., Laubitz, D., Jurkowska, M., Romé, V., Guilloteau, P., Zabieliski, R., 2004:
Effect of sodium butyrate on the small intestine development in neonatal piglets feed by artificial
sow. J. Physiol. Phar. 55, Suppl 2, 59-68.
Lampe, J. W., 1999: Health effects of vegetables and fruit: assessing mechanisms of action in human
experimental studies. Am. J. Clin. Nutr. 70(3 Suppl), 475S-490S.
Langhout, D. J., Schutte, J. B., Van Leevwen, P., Wiebenga, J., Tamminga, S., 1999: Effect of dietary
high and low methyllated citrus pectin on the activity of the ileal microflora and morphology of the
small intestine wall of broiler chicks. Brit. Poult. Sci., 40, 340-347.
71
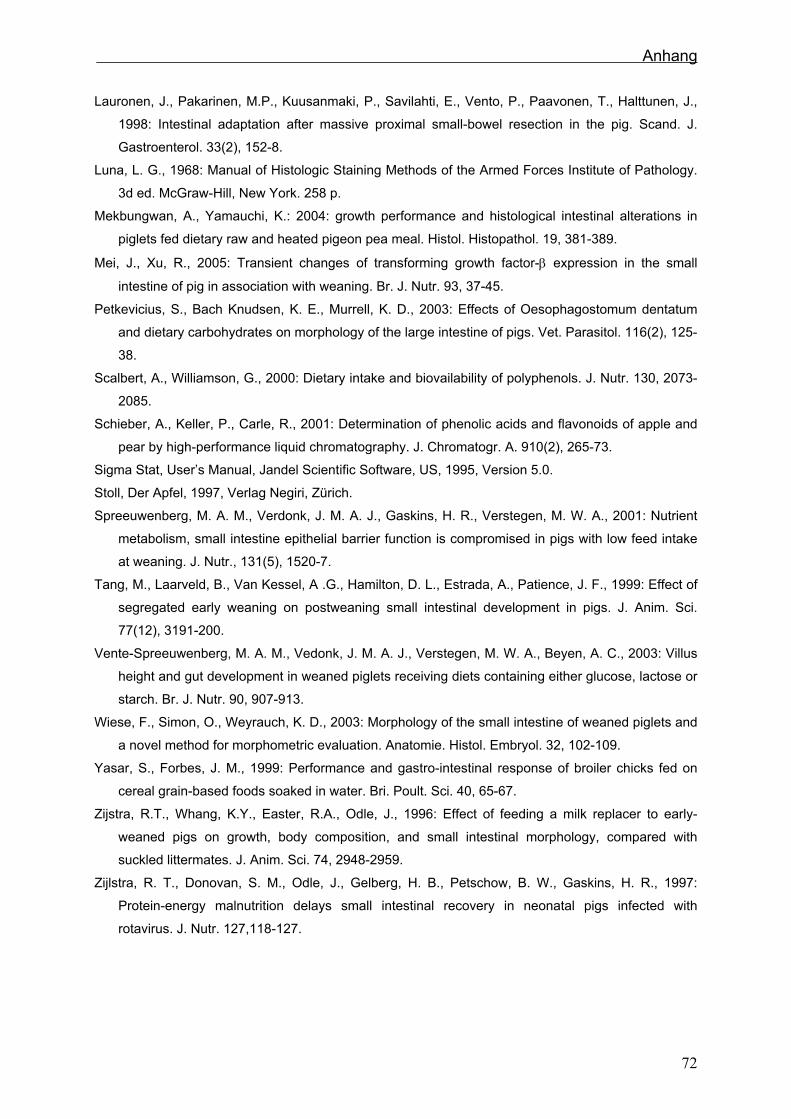
Anhang
Lauronen, J., Pakarinen, M.P., Kuusanmaki, P., Savilahti, E., Vento, P., Paavonen, T., Halttunen, J.,
1998: Intestinal adaptation after massive proximal small-bowel resection in the pig. Scand. J.
Gastroenterol. 33(2), 152-8.
Luna, L. G., 1968: Manual of Histologic Staining Methods of the Armed Forces Institute of Pathology.
3d ed. McGraw-Hill, New York. 258 p.
Mekbungwan, A., Yamauchi, K.: 2004: growth performance and histological intestinal alterations in
piglets fed dietary raw and heated pigeon pea meal. Histol. Histopathol. 19, 381-389.
Mei, J., Xu, R., 2005: Transient changes of transforming growth factor-β expression in the small
intestine of pig in association with weaning. Br. J. Nutr. 93, 37-45.
Petkevicius, S., Bach Knudsen, K. E., Murrell, K. D., 2003: Effects of Oesophagostomum dentatum
and dietary carbohydrates on morphology of the large intestine of pigs. Vet. Parasitol. 116(2), 125-
38.
Scalbert, A., Williamson, G., 2000: Dietary intake and biovailability of polyphenols. J. Nutr. 130, 2073-
2085.
Schieber, A., Keller, P., Carle, R., 2001: Determination of phenolic acids and flavonoids of apple and
pear by high-performance liquid chromatography. J. Chromatogr. A. 910(2), 265-73.
Sigma Stat, User’s Manual, Jandel Scientific Software, US, 1995, Version 5.0.
Stoll, Der Apfel, 1997, Verlag Negiri, Zürich.
Spreeuwenberg, M. A. M., Verdonk, J. M. A. J., Gaskins, H. R., Verstegen, M. W. A., 2001: Nutrient
metabolism, small intestine epithelial barrier function is compromised in pigs with low feed intake
at weaning. J. Nutr., 131(5), 1520-7.
Tang, M., Laarveld, B., Van Kessel, A .G., Hamilton, D. L., Estrada, A., Patience, J. F., 1999: Effect of
segregated early weaning on postweaning small intestinal development in pigs. J. Anim. Sci.
77(12), 3191-200.
Vente-Spreeuwenberg, M. A. M., Vedonk, J. M. A. J., Verstegen, M. W. A., Beyen, A. C., 2003: Villus
height and gut development in weaned piglets receiving diets containing either glucose, lactose or
starch. Br. J. Nutr. 90, 907-913.
Wiese, F., Simon, O., Weyrauch, K. D., 2003: Morphology of the small intestine of weaned piglets and
a novel method for morphometric evaluation. Anatomie. Histol. Embryol. 32, 102-109.
Yasar, S., Forbes, J. M., 1999: Performance and gastro-intestinal response of broiler chicks fed on
cereal grain-based foods soaked in water. Bri. Poult. Sci. 40, 65-67.
Zijstra, R.T., Whang, K.Y., Easter, R.A., Odle, J., 1996: Effect of feeding a milk replacer to early-
weaned pigs on growth, body composition, and small intestinal morphology, compared with
suckled littermates. J. Anim. Sci. 74, 2948-2959.
Zijlstra, R. T., Donovan, S. M., Odle, J., Gelberg, H. B., Petschow, B. W., Gaskins, H. R., 1997:
Protein-energy malnutrition delays small intestinal recovery in neonatal pigs infected with
rotavirus. J. Nutr. 127,118-127.
72
Anhang
Table 1: Dry mass, protein, fat, fibre, Nfe (N-free extract), ME (metabolisable energy) of the fed
diets in g per kg dry mass.
Dry mass Protein Fat Fibber NfE ME
feed [ g ] [ g ] [ g ] [ g ] [ g ] MJ
control diet (CD) 878.0 188.8 25.2 38.3 564.6 12.93
apple-pomace diet (AP) 880.0 182.7 25.2 42.6 571.6 12.95
red- wine pomace diet (RWP) 880.0 188.8 30.5 45.2 556.8 12.95
Table 2: Linear regression of growth of the different measurement category (length, breadth,
area) and in days (x) in mm (length and breadth) or mm² (area) in jejunum. The
percentage value shows the relative growth during the 26 days of treatment,
compared to the starting day 0. Significant growth over 26 days is indicated by p-
value.
Jejunum (Je) CD AP RWP
length (L)
[mm]
L(Je, CD) = 0.5108+0.004x
21.0%
L(Je, AP) = 0.5324+0.0038x
20.0%
L(JE, RWP) = 0.551+0.0007x
3.6%
breadth (B)
[mm]
B(Je, CD) = 0.0965+0.0013x
37.7%
B(Je, AP) =0.1064+0.0004x
10.5%
B (Je, RWP) = 0.1062+0.0004x
10.5%
area (A)
[mm2]
A(Je, CD) = 0.0473+0.0012x
71.0% (p < 0.001) A(Je, AP) = 0.0536+0.0007x
36.6% (p < 0.01) A(Je, RWP) = 0.0567+0.0004x
19.7%
73
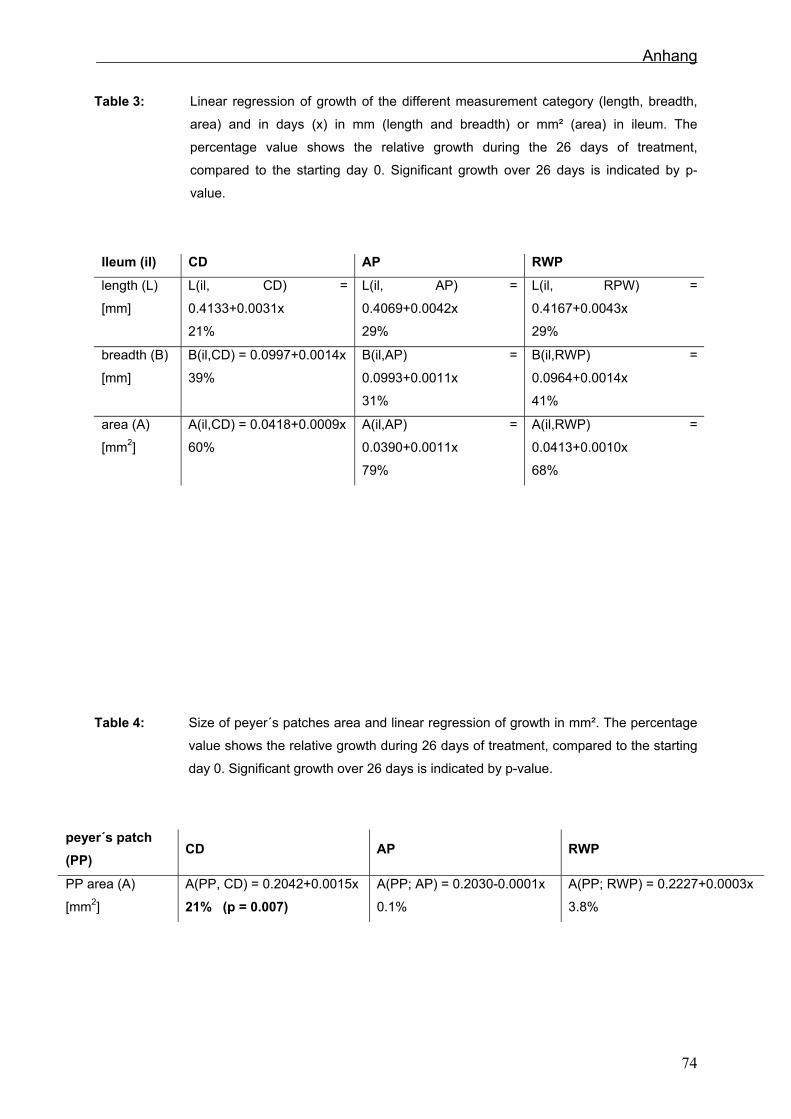
Anhang
Table 3: Linear regression of growth of the different measurement category (length, breadth,
area) and in days (x) in mm (length and breadth) or mm² (area) in ileum. The
percentage value shows the relative growth during the 26 days of treatment,
compared to the starting day 0. Significant growth over 26 days is indicated by p-
value.
Ileum (il) CD AP RWP
length (L)
[mm]
L(il, CD) =
0.4133+0.0031x
21%
L(il, AP) =
0.4069+0.0042x
29%
L(il, RPW) =
0.4167+0.0043x
29%
breadth (B)
[mm]
B(il,CD) = 0.0997+0.0014x
39%
B(il,AP) =
0.0993+0.0011x
31%
B(il,RWP) =
0.0964+0.0014x
41%
area (A)
[mm2]
A(il,CD) = 0.0418+0.0009x
60%
A(il,AP) =
0.0390+0.0011x
79%
A(il,RWP) =
0.0413+0.0010x
68%
Table 4: Size of peyer´s patches area and linear regression of growth in mm². The percentage
value shows the relative growth during 26 days of treatment, compared to the starting
day 0. Significant growth over 26 days is indicated by p-value.
peyer´s patch (PP)
CD AP RWP
PP area (A)
[mm2]
A(PP, CD) = 0.2042+0.0015x
21% (p = 0.007) A(PP; AP) = 0.2030-0.0001x
0.1%
A(PP; RWP) = 0.2227+0.0003x
3.8%
74
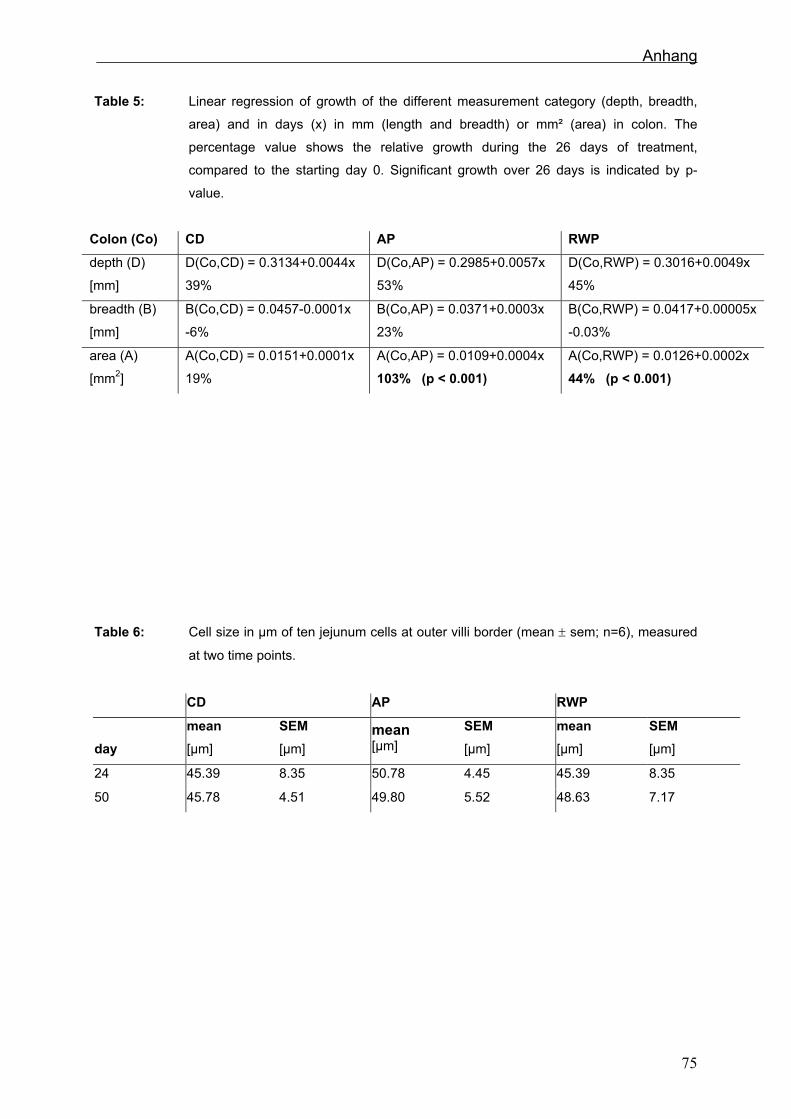
Anhang
Table 5: Linear regression of growth of the different measurement category (depth, breadth,
area) and in days (x) in mm (length and breadth) or mm² (area) in colon. The
percentage value shows the relative growth during the 26 days of treatment,
compared to the starting day 0. Significant growth over 26 days is indicated by p-
value.
Colon (Co) CD AP RWP
depth (D)
[mm]
D(Co,CD) = 0.3134+0.0044x
39%
D(Co,AP) = 0.2985+0.0057x
53%
D(Co,RWP) = 0.3016+0.0049x
45%
breadth (B)
[mm]
B(Co,CD) = 0.0457-0.0001x
-6%
B(Co,AP) = 0.0371+0.0003x
23%
B(Co,RWP) = 0.0417+0.00005x
-0.03%
area (A)
[mm2]
A(Co,CD) = 0.0151+0.0001x
19%
A(Co,AP) = 0.0109+0.0004x
103% (p < 0.001) A(Co,RWP) = 0.0126+0.0002x
44% (p < 0.001)
Table 6: Cell size in µm of ten jejunum cells at outer villi border (mean ± sem; n=6), measured
at two time points.
CD AP RWP
day mean [µm]
SEM [µm]
mean [µm]
SEM [µm]
mean [µm]
SEM [µm]
24 45.39 8.35 50.78 4.45 45.39 8.35
50 45.78 4.51 49.80 5.52 48.63 7.17
75
Anhang
76
Figure 1: Sampling scheme: Tissue sampling was done every week, so youngest piglets were
around three weeks, the oldest seven weeks old. From each feeding group (CD =
control diet, AP = apple pomace diet, RWP = red-wine pomace diet) six piglets were
killed at each time point. From every piglet specimen tissue samples of jejunum, ileum
and colon were taken.
slaughtering
/average age in
days
CD 6 6 6 6 6
AP 6 6 6 6
RWP 6 6 6 6
1/ 24
Jejunum
Ileum
Colon
weaning 2/ 31
3/ 36
4/ 43
5/ 50
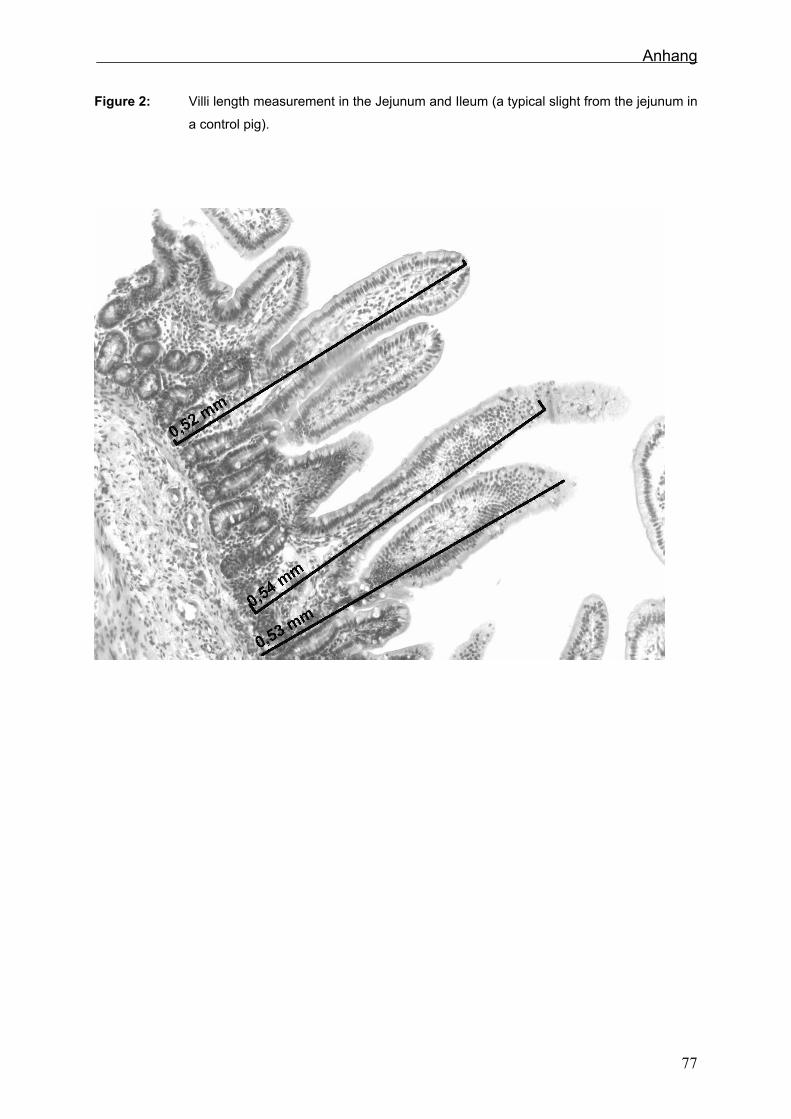
Anhang
Figure 2: Villi length measurement in the Jejunum and Ileum (a typical slight from the jejunum in
a control pig).
77
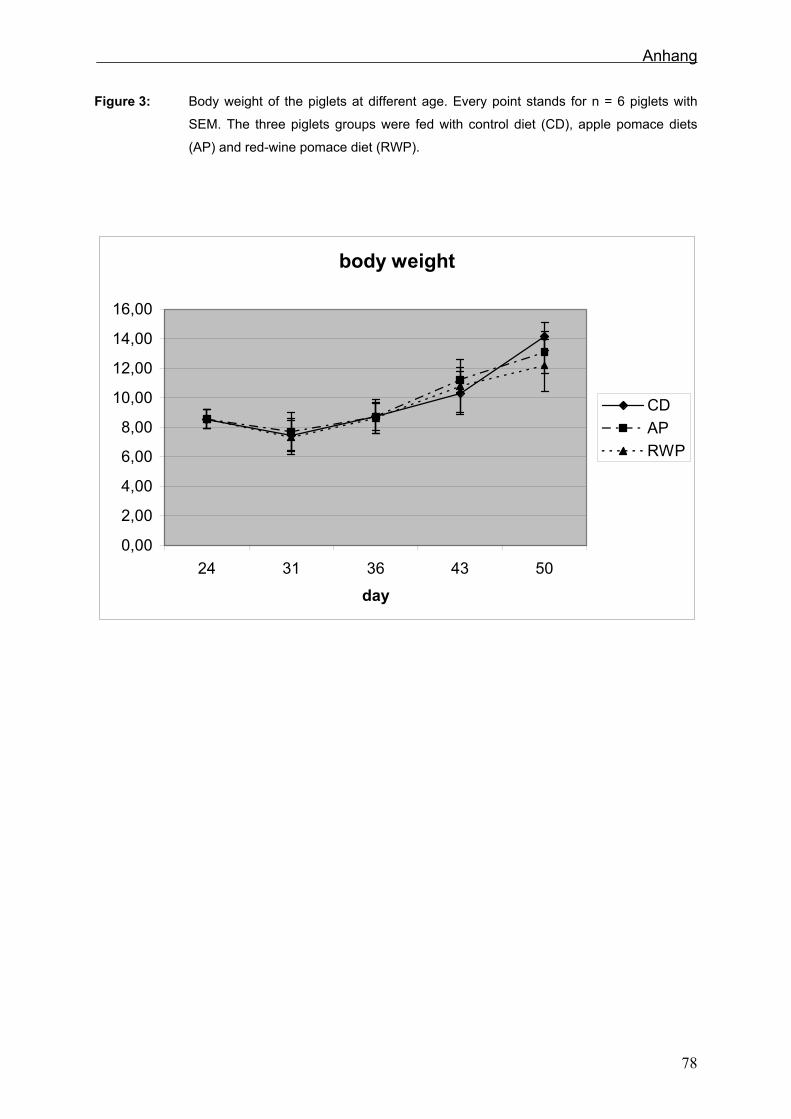
Anhang
Figure 3: Body weight of the piglets at different age. Every point stands for n = 6 piglets with
SEM. The three piglets groups were fed with control diet (CD), apple pomace diets
(AP) and red-wine pomace diet (RWP).
body weight
0,00
2,00
4,00
6,00
8,00
10,00
12,00
14,00
16,00
24 31 36 43 50
day
CDAPRWP
78
Anhang
Manuskript:
The influence of apple- and red-wine pomace rich diet on mRNA expression of inflammatory and apoptotic markers in different piglet organs.
J. Sehm1, H. Lindermayer2, H. H. D. Meyer1 and M. W. Pfaffl1*
1 Lehrstuhl für Physiologie, Wissenschaftszentrum Weihenstephan (WZW), Zentralinstitut für
Ernährung- und Lebensmittelforschung (ZIEL), Technische Universität München (TUM), D-85354
Freising, Germany
2 Institut für Tierernährung und Futterwirtschaft, Bayerische Landesanstalt für Landwirtschaft (LfL), D-
85586 Poing-Grub, Germany
*Author for correspondence:
Michael W. Pfaffl
Lehrstuhl für Physiologie
Zentralinstitut für Ernährung- und Lebensmittelforschung (ZIEL)
Technical University of Munich (TUM)
Wissenschaftszentrum Weihenstephan (WZW)
Weihenstephaner Berg 3
D-85354 Freising-Weihenstephan
Tel.: +49-8161-71 3511
Fax: +49-8161-71 4204
E-mail: [email protected]
Key words: Apple pomace, red-wine pomace, piglets, mRNA, qRT-PCR, inflammatory marker-genes,
apoptotic marker-genes
79
Anhang
Abstract
Flavan-3-ols are a class of flavonoids that are widely distributed in fruits and beverages including red
wine and apples. Consumption of food containing flavonoids has been shown to exhibit anti-microbial,
anti-oxidative, anti-inflammatory, and immune-modulating effects. To test the nutritional effects of
flavanols on gene-expression of inflammatory and apoptotic marker genes, piglets were fed with two
flavanoids rich feeding regimens: enriched with apple pomace (APD) or red-wine pomace (RWPD),
which were compared with a low flavanoid standard diet (SD). The influence on mRNA expression
levels was investigated in different immunological active tissues and in the gastro-intestinal tract (GIT).
The investigation took place from one week prior weaning to 19 days post weaning in 78 piglets. The
expression of the marker genes was determinate by one-step qRT-PCR: TNFα, NFκB as pro-
inflammatory, IL-10, as anti-inflammatory, Caspase 3 as apoptosis, Cyclin D1 as cell cycle marker and
of nucleosome component Histon H3 as reference gene.
The feeding regimens result in different regulation of mRNA gene expression in the all investigated
organs. We discovered significant differences between the applied diets, and significant changes
during feeding time curse. Both pomace treatments caused a significant up-regulation of all
investigated genes in liver. The effect of mesenterial lymph node and spleen was not prominent. In
GIT the treatment groups showed a inhibitory effects on gene expression mainly in stomach and
jejunum (NFκB , Cyclin D1 and Caspase 3). In Colon the trend of Caspase 3 was positive with the
greatest change in the RWPD group.
In jejunum and stomach the cell cycle turn over was decreased, whereas in liver the cell turn over was
highly increased. The influence on inflammatory marker is mainly relevant in stomach. We presume
that both flavanoid rich feedings have the potential to modulate the mRNA expressions of proliferation
and apoptotic marker genes in the tissues.
Introduction
Flavan-3-ols are a class of flavonoids that are widely distributed in fruits and beverages including
green tea, red wine, chocolate and apples (Guyot et al., 2003; Hammerstone et al., 1999, Damianaki
et al., 2000, Waterhouse et al., 1996). Although their intake levels are not precisely known, they are
likely the most abundant flavanoids in the human diet with estimates of consumption ranging from 0.1-
0.5 g/d (Santos-Buelga and Scalbert, 2000; Scalbert and Williamson, 2000). In addition to widely
reported in vitro biological activities of flavan-3-ols (Waterhouse et al., 1996), consumption of purified
monomers and food containing predominantly flavan-3-ols has been shown to reduce platelet activity,
fatty streak development and certain types of cancers (Santos-Buelga and Scalbert, 2000; Eberhardt
et al., 2000). Animal models observed that polyphenols have preventive activity against cancer of the
oral cavity, esophagus, stomach, intestine, colon, liver, lung, prostate, and skin (Lambert and Yang,
2003). Further flavonoids exhibit anti-microbial, anti-oxidative, anti-thromboses, immune-modulated,
anti-inflammatory, and showed blood pressure and blood-glucose reducing effects (Leitzmann, 2003).
In western countries apples were one of the main sources of dietary flavanoids that showed the
strongest associations with decreased human mortality (Boyer and Liu, 2004). The particular
mechanisms of action are impossible to establish without a complete understanding of their uptake as
well as their metabolism and distribution among tissues and cells (Boyer and Liu, 2004). The average
80
Anhang
of the total polyphenol content in apple is 0.3 g per kg fresh weight (0.05 – 1.1 g/kg) (Stoll, 1997) and
about 2 mg/litre red wine (Scalbert and Williamson, 2000). The pomace of apples and grapes also has
a high concentration of these polyphenols, whereas the main components are flavan-3-ole and pro-
anthocyanidine (Stoll, 1997, Shrikhande, 2000).
Since 1946, sub-therapeutical levels of antibiotics have been used as growth promoters in pig meat
production. Since then antibiotic additives became an important factor in pig production. However, the
use of antibiotics as feed additives is risky due the development of antibiotic resistance in pathogens
(Aarestrup, 1999, Bach Knudsen, 2001). Since beginning 2006 the antibiotics in animal feed is official
forbidden by the EU (BMVEL, 2005). Many studies assume, that antibiotics and special diets change
the intestinal morphology and therefore affect health (Hedemann et al., 2002; Boudry et al., 2004;
Kotunia et al. 2004). In the recent literature alternative feed ingredients are discussed, e.g. probiotics,
prebiotics and synbiotics, as well as secondary plant components (Bach Knudsen, 2001; Scalbert and
Williamson, 2000).
In this approach two different flavanol rich feeding regimens were applied in 78 young growing piglets
(freeze dried apple and red-wine pomace). The goal of this study was to show the influence of the
different flavanol rich diets on mRNA expression of pro- and anti-inflammatory, apoptotic and
proliferation markers in different organs and the GIT.
Material and methods
Animals
In this study 78 cross breed piglets [Pietráin x (Deutsche Landrasse x Deutsches Edelschwein)] were
fed with three different feed compositions. The animals were housed at the experimental station
Osterseeon (Bayerische Landesanstalt für Landwirtschaft, Institut für Tierernährung und
Futterwirtschaft). 30 animals were fed with a control standard weaning diet (SD) (50% wheat, 23%
barley, 22% soy, 1% soy oil, 4% vitamins and minerals), 24 each got additionally 3.5% dry mass apple
pomace (APD) or red-wine pomace (RWPD). Energy, protein, fat and starch were balanced in all three
diets (table 1). Live weight of piglets was monitored one week before weaning (live day 24, treatment
day 0), at weaning (live day 31) and at day 36, day 43 and day 50 (treatment day 26). The first six
control pigs were slaughtered one week before weaning. At weaning, piglets were grouped with
identical age (31 ± 1.8 days), weight (7.5 ± 1.1 kg) and half male, half female in every group. At
weaning and every following week 6 SD pigs, 6 APD and 6 RWPD feed piglets were slaughtered
(figure 1).
Piglets were killed by electric gripper and exsanguinated. A horizontal incision along the midline was
made to open the abdominal cavity, and all the organs were excised. Empty bodyweight, kidneys,
spleen and liver weights were measured at sampling. Tissue sample from mesenterial lymph nodes,
spleen, liver, kidney, muscle (longissimus dorsi), stomach, jejunum, ileum and colon were dissected,
cut into small pieces (about 0.5 cm³), aliquoted and immediately frozen in liquid nitrogen. Tissues were
stored at –80°C until total RNA extraction.
mRNA extraction
81
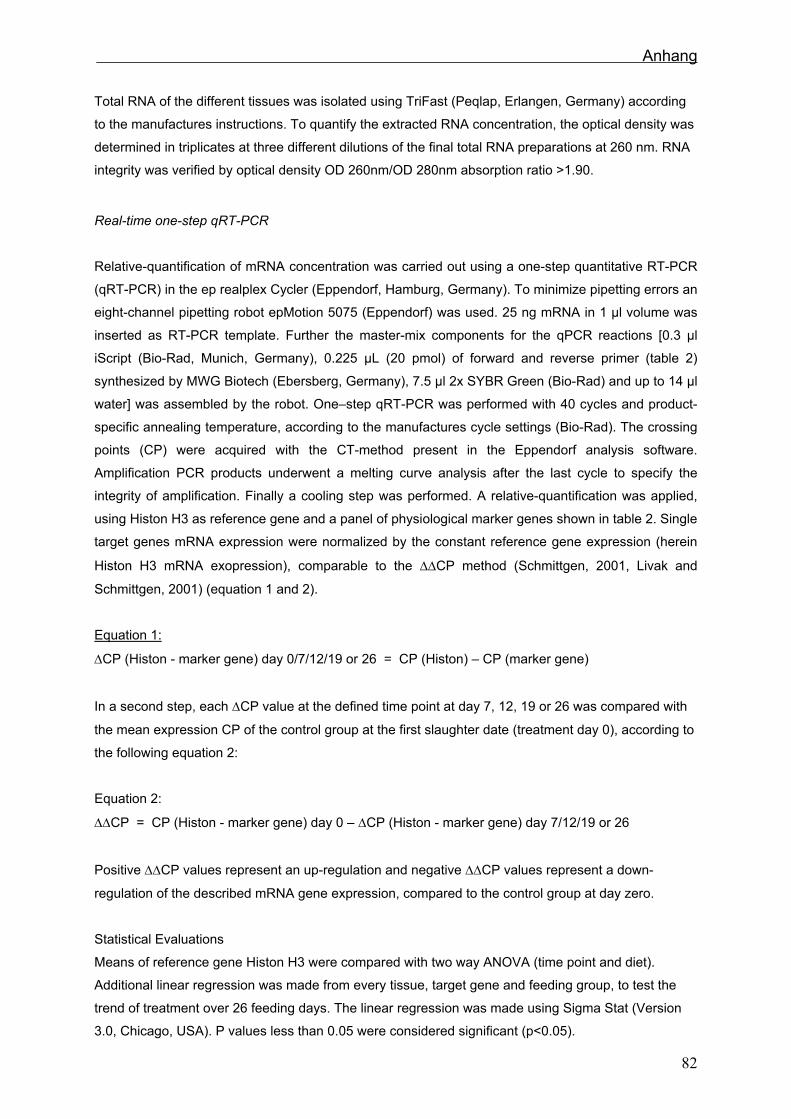
Anhang
Total RNA of the different tissues was isolated using TriFast (Peqlap, Erlangen, Germany) according
to the manufactures instructions. To quantify the extracted RNA concentration, the optical density was
determined in triplicates at three different dilutions of the final total RNA preparations at 260 nm. RNA
integrity was verified by optical density OD 260nm/OD 280nm absorption ratio >1.90. Real-time one-step qRT-PCR
Relative-quantification of mRNA concentration was carried out using a one-step quantitative RT-PCR
(qRT-PCR) in the ep realplex Cycler (Eppendorf, Hamburg, Germany). To minimize pipetting errors an
eight-channel pipetting robot epMotion 5075 (Eppendorf) was used. 25 ng mRNA in 1 µl volume was
inserted as RT-PCR template. Further the master-mix components for the qPCR reactions [0.3 µl
iScript (Bio-Rad, Munich, Germany), 0.225 µL (20 pmol) of forward and reverse primer (table 2)
synthesized by MWG Biotech (Ebersberg, Germany), 7.5 µl 2x SYBR Green (Bio-Rad) and up to 14 µl
water] was assembled by the robot. One–step qRT-PCR was performed with 40 cycles and product-
specific annealing temperature, according to the manufactures cycle settings (Bio-Rad). The crossing
points (CP) were acquired with the CT-method present in the Eppendorf analysis software.
Amplification PCR products underwent a melting curve analysis after the last cycle to specify the
integrity of amplification. Finally a cooling step was performed. A relative-quantification was applied,
using Histon H3 as reference gene and a panel of physiological marker genes shown in table 2. Single
target genes mRNA expression were normalized by the constant reference gene expression (herein
Histon H3 mRNA exopression), comparable to the ∆∆CP method (Schmittgen, 2001, Livak and
Schmittgen, 2001) (equation 1 and 2).
Equation 1:
∆CP (Histon - marker gene) day 0/7/12/19 or 26 = CP (Histon) – CP (marker gene)
In a second step, each ∆CP value at the defined time point at day 7, 12, 19 or 26 was compared with
the mean expression CP of the control group at the first slaughter date (treatment day 0), according to
the following equation 2:
Equation 2:
∆∆CP = CP (Histon - marker gene) day 0 – ∆CP (Histon - marker gene) day 7/12/19 or 26
Positive ∆∆CP values represent an up-regulation and negative ∆∆CP values represent a down-
regulation of the described mRNA gene expression, compared to the control group at day zero.
Statistical Evaluations
Means of reference gene Histon H3 were compared with two way ANOVA (time point and diet).
Additional linear regression was made from every tissue, target gene and feeding group, to test the
trend of treatment over 26 feeding days. The linear regression was made using Sigma Stat (Version
3.0, Chicago, USA). P values less than 0.05 were considered significant (p<0.05).
82
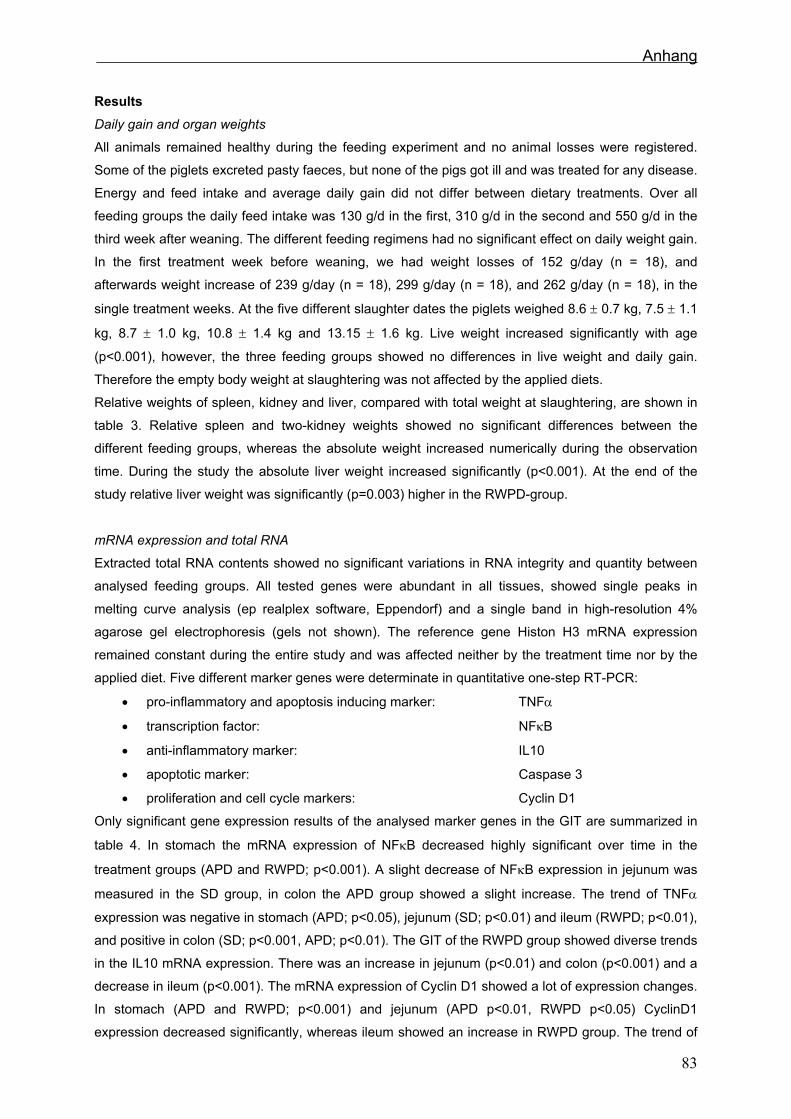
Anhang
Results Daily gain and organ weights
All animals remained healthy during the feeding experiment and no animal losses were registered.
Some of the piglets excreted pasty faeces, but none of the pigs got ill and was treated for any disease.
Energy and feed intake and average daily gain did not differ between dietary treatments. Over all
feeding groups the daily feed intake was 130 g/d in the first, 310 g/d in the second and 550 g/d in the
third week after weaning. The different feeding regimens had no significant effect on daily weight gain.
In the first treatment week before weaning, we had weight losses of 152 g/day (n = 18), and
afterwards weight increase of 239 g/day (n = 18), 299 g/day (n = 18), and 262 g/day (n = 18), in the
single treatment weeks. At the five different slaughter dates the piglets weighed 8.6 ± 0.7 kg, 7.5 ± 1.1
kg, 8.7 ± 1.0 kg, 10.8 ± 1.4 kg and 13.15 ± 1.6 kg. Live weight increased significantly with age
(p<0.001), however, the three feeding groups showed no differences in live weight and daily gain.
Therefore the empty body weight at slaughtering was not affected by the applied diets.
Relative weights of spleen, kidney and liver, compared with total weight at slaughtering, are shown in
table 3. Relative spleen and two-kidney weights showed no significant differences between the
different feeding groups, whereas the absolute weight increased numerically during the observation
time. During the study the absolute liver weight increased significantly (p<0.001). At the end of the
study relative liver weight was significantly (p=0.003) higher in the RWPD-group.
mRNA expression and total RNA
Extracted total RNA contents showed no significant variations in RNA integrity and quantity between
analysed feeding groups. All tested genes were abundant in all tissues, showed single peaks in
melting curve analysis (ep realplex software, Eppendorf) and a single band in high-resolution 4%
agarose gel electrophoresis (gels not shown). The reference gene Histon H3 mRNA expression
remained constant during the entire study and was affected neither by the treatment time nor by the
applied diet. Five different marker genes were determinate in quantitative one-step RT-PCR:
• pro-inflammatory and apoptosis inducing marker: TNFα
• transcription factor: NFκB
• anti-inflammatory marker: IL10
• apoptotic marker: Caspase 3
• proliferation and cell cycle markers: Cyclin D1
Only significant gene expression results of the analysed marker genes in the GIT are summarized in
table 4. In stomach the mRNA expression of NFκB decreased highly significant over time in the
treatment groups (APD and RWPD; p<0.001). A slight decrease of NFκB expression in jejunum was
measured in the SD group, in colon the APD group showed a slight increase. The trend of TNFα
expression was negative in stomach (APD; p<0.05), jejunum (SD; p<0.01) and ileum (RWPD; p<0.01),
and positive in colon (SD; p<0.001, APD; p<0.01). The GIT of the RWPD group showed diverse trends
in the IL10 mRNA expression. There was an increase in jejunum (p<0.01) and colon (p<0.001) and a
decrease in ileum (p<0.001). The mRNA expression of Cyclin D1 showed a lot of expression changes.
In stomach (APD and RWPD; p<0.001) and jejunum (APD p<0.01, RWPD p<0.05) CyclinD1
expression decreased significantly, whereas ileum showed an increase in RWPD group. The trend of
83
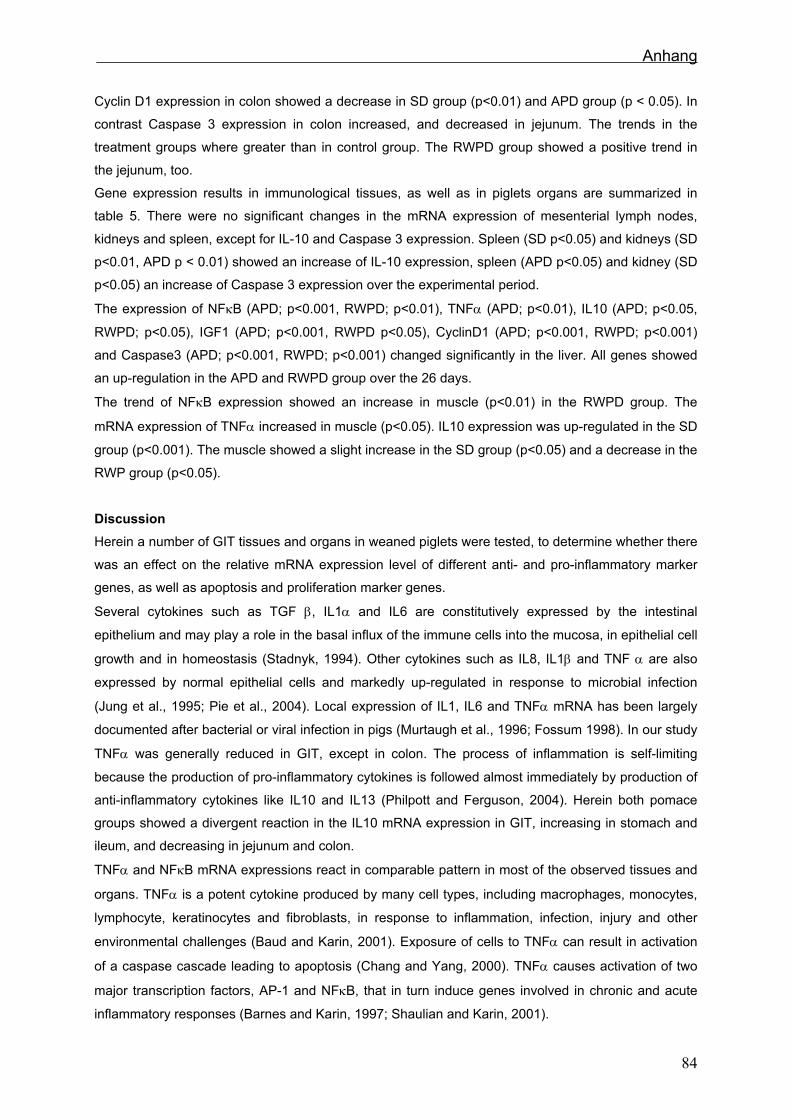
Anhang
Cyclin D1 expression in colon showed a decrease in SD group (p<0.01) and APD group (p < 0.05). In
contrast Caspase 3 expression in colon increased, and decreased in jejunum. The trends in the
treatment groups where greater than in control group. The RWPD group showed a positive trend in
the jejunum, too.
Gene expression results in immunological tissues, as well as in piglets organs are summarized in
table 5. There were no significant changes in the mRNA expression of mesenterial lymph nodes,
kidneys and spleen, except for IL-10 and Caspase 3 expression. Spleen (SD p<0.05) and kidneys (SD
p<0.01, APD p < 0.01) showed an increase of IL-10 expression, spleen (APD p<0.05) and kidney (SD
p<0.05) an increase of Caspase 3 expression over the experimental period.
The expression of NFκB (APD; p<0.001, RWPD; p<0.01), TNFα (APD; p<0.01), IL10 (APD; p<0.05,
RWPD; p<0.05), IGF1 (APD; p<0.001, RWPD p<0.05), CyclinD1 (APD; p<0.001, RWPD; p<0.001)
and Caspase3 (APD; p<0.001, RWPD; p<0.001) changed significantly in the liver. All genes showed
an up-regulation in the APD and RWPD group over the 26 days.
The trend of NFκB expression showed an increase in muscle (p<0.01) in the RWPD group. The
mRNA expression of TNFα increased in muscle (p<0.05). IL10 expression was up-regulated in the SD
group (p<0.001). The muscle showed a slight increase in the SD group (p<0.05) and a decrease in the
RWP group (p<0.05).
Discussion Herein a number of GIT tissues and organs in weaned piglets were tested, to determine whether there
was an effect on the relative mRNA expression level of different anti- and pro-inflammatory marker
genes, as well as apoptosis and proliferation marker genes.
Several cytokines such as TGF β, IL1α and IL6 are constitutively expressed by the intestinal
epithelium and may play a role in the basal influx of the immune cells into the mucosa, in epithelial cell
growth and in homeostasis (Stadnyk, 1994). Other cytokines such as IL8, IL1β and TNF α are also
expressed by normal epithelial cells and markedly up-regulated in response to microbial infection
(Jung et al., 1995; Pie et al., 2004). Local expression of IL1, IL6 and TNFα mRNA has been largely
documented after bacterial or viral infection in pigs (Murtaugh et al., 1996; Fossum 1998). In our study
TNFα was generally reduced in GIT, except in colon. The process of inflammation is self-limiting
because the production of pro-inflammatory cytokines is followed almost immediately by production of
anti-inflammatory cytokines like IL10 and IL13 (Philpott and Ferguson, 2004). Herein both pomace
groups showed a divergent reaction in the IL10 mRNA expression in GIT, increasing in stomach and
ileum, and decreasing in jejunum and colon.
TNFα and NFκB mRNA expressions react in comparable pattern in most of the observed tissues and
organs. TNFα is a potent cytokine produced by many cell types, including macrophages, monocytes,
lymphocyte, keratinocytes and fibroblasts, in response to inflammation, infection, injury and other
environmental challenges (Baud and Karin, 2001). Exposure of cells to TNFα can result in activation
of a caspase cascade leading to apoptosis (Chang and Yang, 2000). TNFα causes activation of two
major transcription factors, AP-1 and NFκB, that in turn induce genes involved in chronic and acute
inflammatory responses (Barnes and Karin, 1997; Shaulian and Karin, 2001).
84
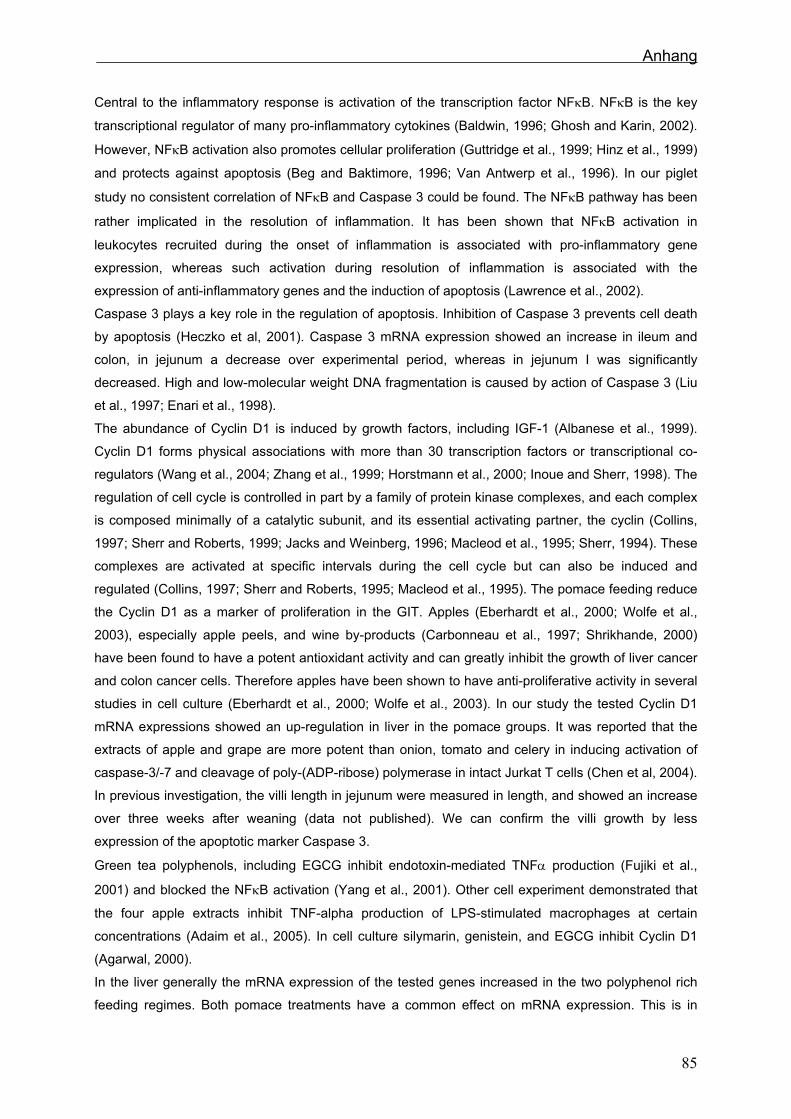
Anhang
Central to the inflammatory response is activation of the transcription factor NFκB. NFκB is the key
transcriptional regulator of many pro-inflammatory cytokines (Baldwin, 1996; Ghosh and Karin, 2002).
However, NFκB activation also promotes cellular proliferation (Guttridge et al., 1999; Hinz et al., 1999)
and protects against apoptosis (Beg and Baktimore, 1996; Van Antwerp et al., 1996). In our piglet
study no consistent correlation of NFκB and Caspase 3 could be found. The NFκB pathway has been
rather implicated in the resolution of inflammation. It has been shown that NFκB activation in
leukocytes recruited during the onset of inflammation is associated with pro-inflammatory gene
expression, whereas such activation during resolution of inflammation is associated with the
expression of anti-inflammatory genes and the induction of apoptosis (Lawrence et al., 2002).
Caspase 3 plays a key role in the regulation of apoptosis. Inhibition of Caspase 3 prevents cell death
by apoptosis (Heczko et al, 2001). Caspase 3 mRNA expression showed an increase in ileum and
colon, in jejunum a decrease over experimental period, whereas in jejunum I was significantly
decreased. High and low-molecular weight DNA fragmentation is caused by action of Caspase 3 (Liu
et al., 1997; Enari et al., 1998).
The abundance of Cyclin D1 is induced by growth factors, including IGF-1 (Albanese et al., 1999).
Cyclin D1 forms physical associations with more than 30 transcription factors or transcriptional co-
regulators (Wang et al., 2004; Zhang et al., 1999; Horstmann et al., 2000; Inoue and Sherr, 1998). The
regulation of cell cycle is controlled in part by a family of protein kinase complexes, and each complex
is composed minimally of a catalytic subunit, and its essential activating partner, the cyclin (Collins,
1997; Sherr and Roberts, 1999; Jacks and Weinberg, 1996; Macleod et al., 1995; Sherr, 1994). These
complexes are activated at specific intervals during the cell cycle but can also be induced and
regulated (Collins, 1997; Sherr and Roberts, 1995; Macleod et al., 1995). The pomace feeding reduce
the Cyclin D1 as a marker of proliferation in the GIT. Apples (Eberhardt et al., 2000; Wolfe et al.,
2003), especially apple peels, and wine by-products (Carbonneau et al., 1997; Shrikhande, 2000)
have been found to have a potent antioxidant activity and can greatly inhibit the growth of liver cancer
and colon cancer cells. Therefore apples have been shown to have anti-proliferative activity in several
studies in cell culture (Eberhardt et al., 2000; Wolfe et al., 2003). In our study the tested Cyclin D1
mRNA expressions showed an up-regulation in liver in the pomace groups. It was reported that the
extracts of apple and grape are more potent than onion, tomato and celery in inducing activation of
caspase-3/-7 and cleavage of poly-(ADP-ribose) polymerase in intact Jurkat T cells (Chen et al, 2004).
In previous investigation, the villi length in jejunum were measured in length, and showed an increase
over three weeks after weaning (data not published). We can confirm the villi growth by less
expression of the apoptotic marker Caspase 3.
Green tea polyphenols, including EGCG inhibit endotoxin-mediated TNFα production (Fujiki et al.,
2001) and blocked the NFκB activation (Yang et al., 2001). Other cell experiment demonstrated that
the four apple extracts inhibit TNF-alpha production of LPS-stimulated macrophages at certain
concentrations (Adaim et al., 2005). In cell culture silymarin, genistein, and EGCG inhibit Cyclin D1
(Agarwal, 2000). In the liver generally the mRNA expression of the tested genes increased in the two polyphenol rich
feeding regimes. Both pomace treatments have a common effect on mRNA expression. This is in
85
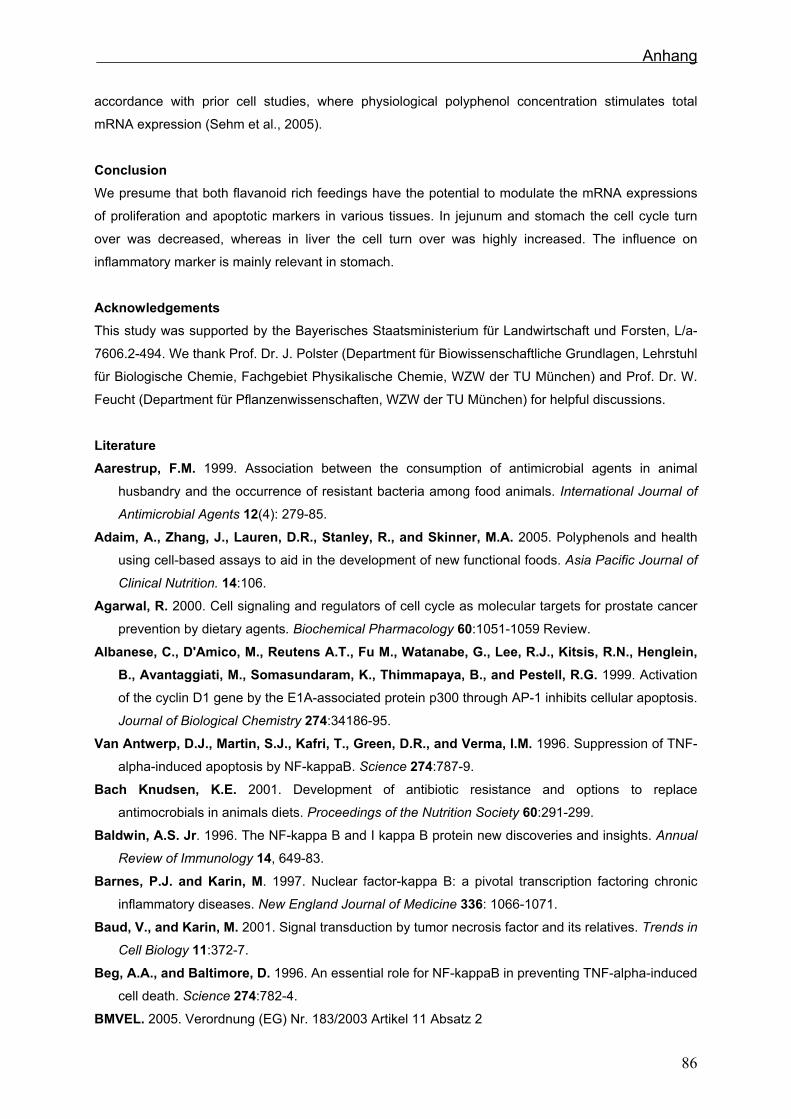
Anhang
accordance with prior cell studies, where physiological polyphenol concentration stimulates total
mRNA expression (Sehm et al., 2005).
Conclusion We presume that both flavanoid rich feedings have the potential to modulate the mRNA expressions
of proliferation and apoptotic markers in various tissues. In jejunum and stomach the cell cycle turn
over was decreased, whereas in liver the cell turn over was highly increased. The influence on
inflammatory marker is mainly relevant in stomach.
Acknowledgements This study was supported by the Bayerisches Staatsministerium für Landwirtschaft und Forsten, L/a-
7606.2-494. We thank Prof. Dr. J. Polster (Department für Biowissenschaftliche Grundlagen, Lehrstuhl
für Biologische Chemie, Fachgebiet Physikalische Chemie, WZW der TU München) and Prof. Dr. W.
Feucht (Department für Pflanzenwissenschaften, WZW der TU München) for helpful discussions.
Literature Aarestrup, F.M. 1999. Association between the consumption of antimicrobial agents in animal
husbandry and the occurrence of resistant bacteria among food animals. International Journal of
Antimicrobial Agents 12(4): 279-85.
Adaim, A., Zhang, J., Lauren, D.R., Stanley, R., and Skinner, M.A. 2005. Polyphenols and health
using cell-based assays to aid in the development of new functional foods. Asia Pacific Journal of
Clinical Nutrition. 14:106.
Agarwal, R. 2000. Cell signaling and regulators of cell cycle as molecular targets for prostate cancer
prevention by dietary agents. Biochemical Pharmacology 60:1051-1059 Review.
Albanese, C., D'Amico, M., Reutens A.T., Fu M., Watanabe, G., Lee, R.J., Kitsis, R.N., Henglein, B., Avantaggiati, M., Somasundaram, K., Thimmapaya, B., and Pestell, R.G. 1999. Activation
of the cyclin D1 gene by the E1A-associated protein p300 through AP-1 inhibits cellular apoptosis.
Journal of Biological Chemistry 274:34186-95.
Van Antwerp, D.J., Martin, S.J., Kafri, T., Green, D.R., and Verma, I.M. 1996. Suppression of TNF-
alpha-induced apoptosis by NF-kappaB. Science 274:787-9.
Bach Knudsen, K.E. 2001. Development of antibiotic resistance and options to replace
antimocrobials in animals diets. Proceedings of the Nutrition Society 60:291-299.
Baldwin, A.S. Jr. 1996. The NF-kappa B and I kappa B protein new discoveries and insights. Annual
Review of Immunology 14, 649-83.
Barnes, P.J. and Karin, M. 1997. Nuclear factor-kappa B: a pivotal transcription factoring chronic
inflammatory diseases. New England Journal of Medicine 336: 1066-1071.
Baud, V., and Karin, M. 2001. Signal transduction by tumor necrosis factor and its relatives. Trends in
Cell Biology 11:372-7.
Beg, A.A., and Baltimore, D. 1996. An essential role for NF-kappaB in preventing TNF-alpha-induced
cell death. Science 274:782-4.
BMVEL. 2005. Verordnung (EG) Nr. 183/2003 Artikel 11 Absatz 2
86
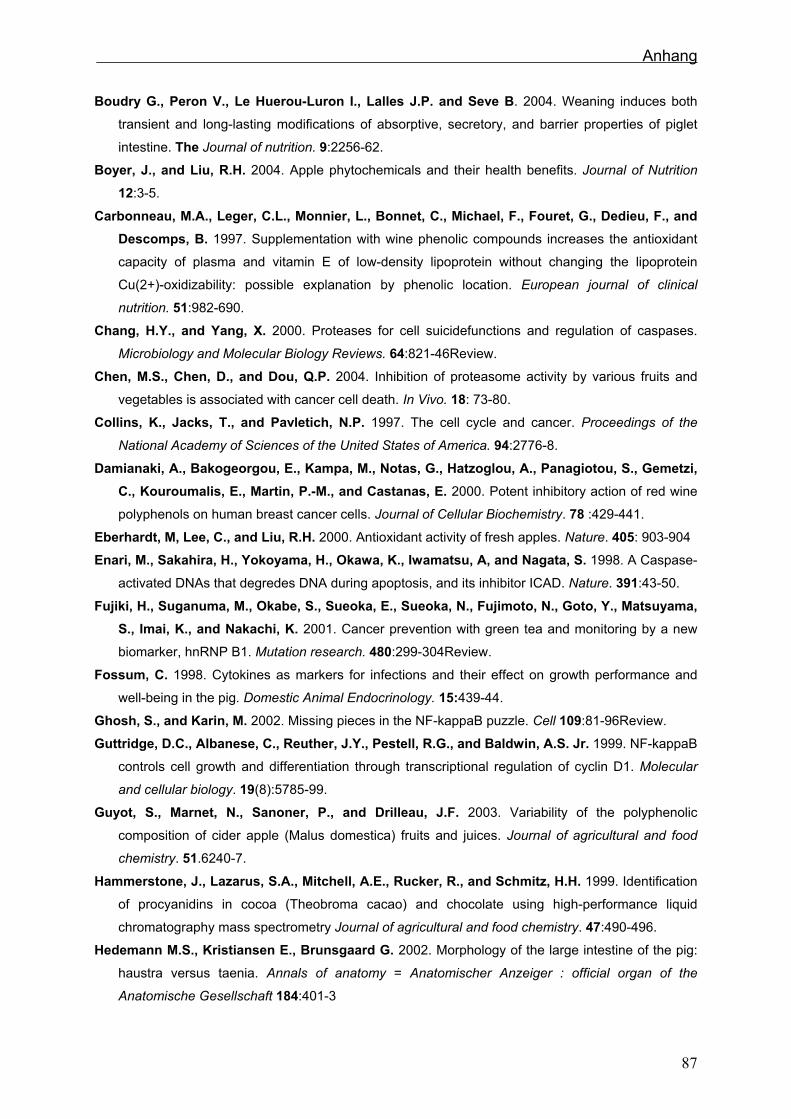
Anhang
Boudry G., Peron V., Le Huerou-Luron I., Lalles J.P. and Seve B. 2004. Weaning induces both
transient and long-lasting modifications of absorptive, secretory, and barrier properties of piglet
intestine. The Journal of nutrition. 9:2256-62.
Boyer, J., and Liu, R.H. 2004. Apple phytochemicals and their health benefits. Journal of Nutrition
12:3-5.
Carbonneau, M.A., Leger, C.L., Monnier, L., Bonnet, C., Michael, F., Fouret, G., Dedieu, F., and Descomps, B. 1997. Supplementation with wine phenolic compounds increases the antioxidant
capacity of plasma and vitamin E of low-density lipoprotein without changing the lipoprotein
Cu(2+)-oxidizability: possible explanation by phenolic location. European journal of clinical
nutrition. 51:982-690.
Chang, H.Y., and Yang, X. 2000. Proteases for cell suicidefunctions and regulation of caspases.
Microbiology and Molecular Biology Reviews. 64:821-46Review.
Chen, M.S., Chen, D., and Dou, Q.P. 2004. Inhibition of proteasome activity by various fruits and
vegetables is associated with cancer cell death. In Vivo. 18: 73-80.
Collins, K., Jacks, T., and Pavletich, N.P. 1997. The cell cycle and cancer. Proceedings of the
National Academy of Sciences of the United States of America. 94:2776-8.
Damianaki, A., Bakogeorgou, E., Kampa, M., Notas, G., Hatzoglou, A., Panagiotou, S., Gemetzi, C., Kouroumalis, E., Martin, P.-M., and Castanas, E. 2000. Potent inhibitory action of red wine
polyphenols on human breast cancer cells. Journal of Cellular Biochemistry. 78 :429-441.
Eberhardt, M, Lee, C., and Liu, R.H. 2000. Antioxidant activity of fresh apples. Nature. 405: 903-904
Enari, M., Sakahira, H., Yokoyama, H., Okawa, K., Iwamatsu, A, and Nagata, S. 1998. A Caspase-
activated DNAs that degredes DNA during apoptosis, and its inhibitor ICAD. Nature. 391:43-50.
Fujiki, H., Suganuma, M., Okabe, S., Sueoka, E., Sueoka, N., Fujimoto, N., Goto, Y., Matsuyama, S., Imai, K., and Nakachi, K. 2001. Cancer prevention with green tea and monitoring by a new
biomarker, hnRNP B1. Mutation research. 480:299-304Review.
Fossum, C. 1998. Cytokines as markers for infections and their effect on growth performance and
well-being in the pig. Domestic Animal Endocrinology. 15:439-44.
Ghosh, S., and Karin, M. 2002. Missing pieces in the NF-kappaB puzzle. Cell 109:81-96Review.
Guttridge, D.C., Albanese, C., Reuther, J.Y., Pestell, R.G., and Baldwin, A.S. Jr. 1999. NF-kappaB
controls cell growth and differentiation through transcriptional regulation of cyclin D1. Molecular
and cellular biology. 19(8):5785-99.
Guyot, S., Marnet, N., Sanoner, P., and Drilleau, J.F. 2003. Variability of the polyphenolic
composition of cider apple (Malus domestica) fruits and juices. Journal of agricultural and food
chemistry. 51.6240-7.
Hammerstone, J., Lazarus, S.A., Mitchell, A.E., Rucker, R., and Schmitz, H.H. 1999. Identification
of procyanidins in cocoa (Theobroma cacao) and chocolate using high-performance liquid
chromatography mass spectrometry Journal of agricultural and food chemistry. 47:490-496.
Hedemann M.S., Kristiansen E., Brunsgaard G. 2002. Morphology of the large intestine of the pig:
haustra versus taenia. Annals of anatomy = Anatomischer Anzeiger : official organ of the
Anatomische Gesellschaft 184:401-3
87
Anhang
Heczko, U., Carthy, C.M., O'Brien, B.A., and Finlay, B.B. 2001: Decreased apoptosis in the ileum
and ileal Peyer's patchesa feature after infection with rabbit enteropathogenic Escherichia coli
O103. Infection and immunity 69:4580-9.
Hinz, M., Krappmann, D., Eichten, A., Heder, A., Scheidereit, C., and Strauss, M. 1999. NF-
kappaB function in growth controlregulation of cyclin D1 expression and G0/G1-to-S-phase
transition. Molecular and cellular biology 19:2690-8.
Horstmann, S., Ferrari, S., and Klempnauer, K.H. 2000. Regulation of B-Myb activity by cyclin D1.
Oncogene 19:298-306.
Inoue, K., and Sherr, C.J. 1998. Gene expression and cell cycle arrest mediated by transcription
factor DMP1 is antagonized by D-type cyclins through a cyclin-dependent-kinase-independent
mechanism. Molecular and cellular biology 18:1590-600.
Jacks, T., and Weinberg, R.A. 1996. Cell-cycle control and its watchman. Nature 381:643-4.
Jung, H.C., Eckmann, L., Yang, S.K., Panja, A., Fierer, J., Morzycka-Wroblewska, E., and Kagnoff, M.F. 1995. A distinct array of proinflammatory cytokines is expressed in human colon
epithelial cells in response to bacterial invasion. The Journal of clinical investigation 95:55-65.
Kotunia A., Wolinski J., Laubitz D., Jurkowska M., Rome V., Guilloteau P., Zabielski R. 2004.
Effect of sodium butyrate on the small intestine development in neonatal piglets feed by artificial
sow. Journal of physiology and pharmacology : an official journal of the Polish Physiological
Societ. 55:59-68.
Lambert, J.; and Yang, Ch. 2003. Mechanisms of Cancer Prevention by Tea Constituents. Journal
Nutrition 133:3262-3267.
Lawrence, T., Gilroy, D.W., Colville-Nash, P.R., and Willoughby, D.A. 2002. Anti-inflammatory lipid
mediators and insights into the resolution of inflammation. Nature reviews. Immunology 2:787-
95Review.
Leitzmann, C. 2003. Nutrition ecologythe contribution of vegetarian diets. The American journal of
clinical nutrition 78:657-659.
Liao, S.S., Umekita, Y., Guo, J.T., Kokintis, J.M., and Hiipakka, R.A. 1995. Growth inhibition and
regression of human prostate and breast tumors in athymic mice by tea Epigallocatechin Gallate.
Cancer letters 96:239-243.
Livak, K.J., and Schmittgen, T. D. 2001. Analysis of relativ gene expression data using real-time
quantitative PCR and the 2-DDCT method. Methods 25:402-408.
Liu, Z.G., Baskaran, R., Lea-Chou, E.T., Wood, L.D., Chen, Y., Karin, M., and Wang, J.Y. 1996.
Three distinct signalling responses by murine fibroblasts to genotoxic stress. Nature 384:273-6.
Liu, X., Zou, H., Slaighter, C., and Wang, X. 1997. DFF, a heterodimeric protein that functios
downstreams of Caspase-3 to trigger DNA fragmention during apoptosis Cell 89: 175-184.
Macleod, K.F., Sherry, N., Hannon, G., Beach, D., Tokino, T., Kinzler, K., Vogelstein, B., and Jacks, T. 1995. p53-dependent and independent expression of p21 during cell growth,
differentiation, and DNA damage. Genes & development 9:935-44.
Murtaugh, M.P., Baarsch, M.J., Zhou, Y., Scamurra, R.W., and Lin, G. 1996. Inflammatory
cytokines in animal health and disease Veterinary immunology and immunopathology 54:45-55.
88
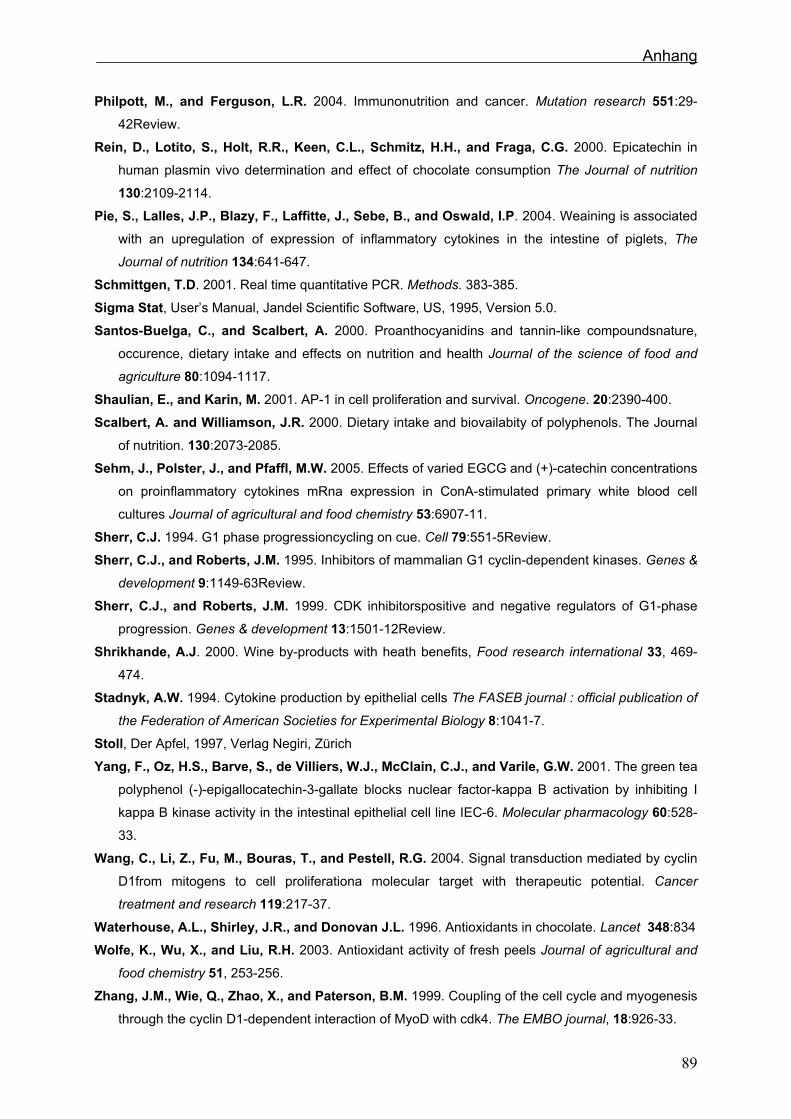
Anhang
Philpott, M., and Ferguson, L.R. 2004. Immunonutrition and cancer. Mutation research 551:29-
42Review.
Rein, D., Lotito, S., Holt, R.R., Keen, C.L., Schmitz, H.H., and Fraga, C.G. 2000. Epicatechin in
human plasmin vivo determination and effect of chocolate consumption The Journal of nutrition
130:2109-2114.
Pie, S., Lalles, J.P., Blazy, F., Laffitte, J., Sebe, B., and Oswald, I.P. 2004. Weaining is associated
with an upregulation of expression of inflammatory cytokines in the intestine of piglets, The
Journal of nutrition 134:641-647.
Schmittgen, T.D. 2001. Real time quantitative PCR. Methods. 383-385.
Sigma Stat, User’s Manual, Jandel Scientific Software, US, 1995, Version 5.0.
Santos-Buelga, C., and Scalbert, A. 2000. Proanthocyanidins and tannin-like compoundsnature,
occurence, dietary intake and effects on nutrition and health Journal of the science of food and
agriculture 80:1094-1117.
Shaulian, E., and Karin, M. 2001. AP-1 in cell proliferation and survival. Oncogene. 20:2390-400.
Scalbert, A. and Williamson, J.R. 2000. Dietary intake and biovailabity of polyphenols. The Journal
of nutrition. 130:2073-2085.
Sehm, J., Polster, J., and Pfaffl, M.W. 2005. Effects of varied EGCG and (+)-catechin concentrations
on proinflammatory cytokines mRna expression in ConA-stimulated primary white blood cell
cultures Journal of agricultural and food chemistry 53:6907-11.
Sherr, C.J. 1994. G1 phase progressioncycling on cue. Cell 79:551-5Review.
Sherr, C.J., and Roberts, J.M. 1995. Inhibitors of mammalian G1 cyclin-dependent kinases. Genes &
development 9:1149-63Review.
Sherr, C.J., and Roberts, J.M. 1999. CDK inhibitorspositive and negative regulators of G1-phase
progression. Genes & development 13:1501-12Review.
Shrikhande, A.J. 2000. Wine by-products with heath benefits, Food research international 33, 469-
474.
Stadnyk, A.W. 1994. Cytokine production by epithelial cells The FASEB journal : official publication of
the Federation of American Societies for Experimental Biology 8:1041-7.
Stoll, Der Apfel, 1997, Verlag Negiri, Zürich
Yang, F., Oz, H.S., Barve, S., de Villiers, W.J., McClain, C.J., and Varile, G.W. 2001. The green tea
polyphenol (-)-epigallocatechin-3-gallate blocks nuclear factor-kappa B activation by inhibiting I
kappa B kinase activity in the intestinal epithelial cell line IEC-6. Molecular pharmacology 60:528-
33.
Wang, C., Li, Z., Fu, M., Bouras, T., and Pestell, R.G. 2004. Signal transduction mediated by cyclin
D1from mitogens to cell proliferationa molecular target with therapeutic potential. Cancer
treatment and research 119:217-37.
Waterhouse, A.L., Shirley, J.R., and Donovan J.L. 1996. Antioxidants in chocolate. Lancet 348:834
Wolfe, K., Wu, X., and Liu, R.H. 2003. Antioxidant activity of fresh peels Journal of agricultural and
food chemistry 51, 253-256.
Zhang, J.M., Wie, Q., Zhao, X., and Paterson, B.M. 1999. Coupling of the cell cycle and myogenesis
through the cyclin D1-dependent interaction of MyoD with cdk4. The EMBO journal, 18:926-33.
89
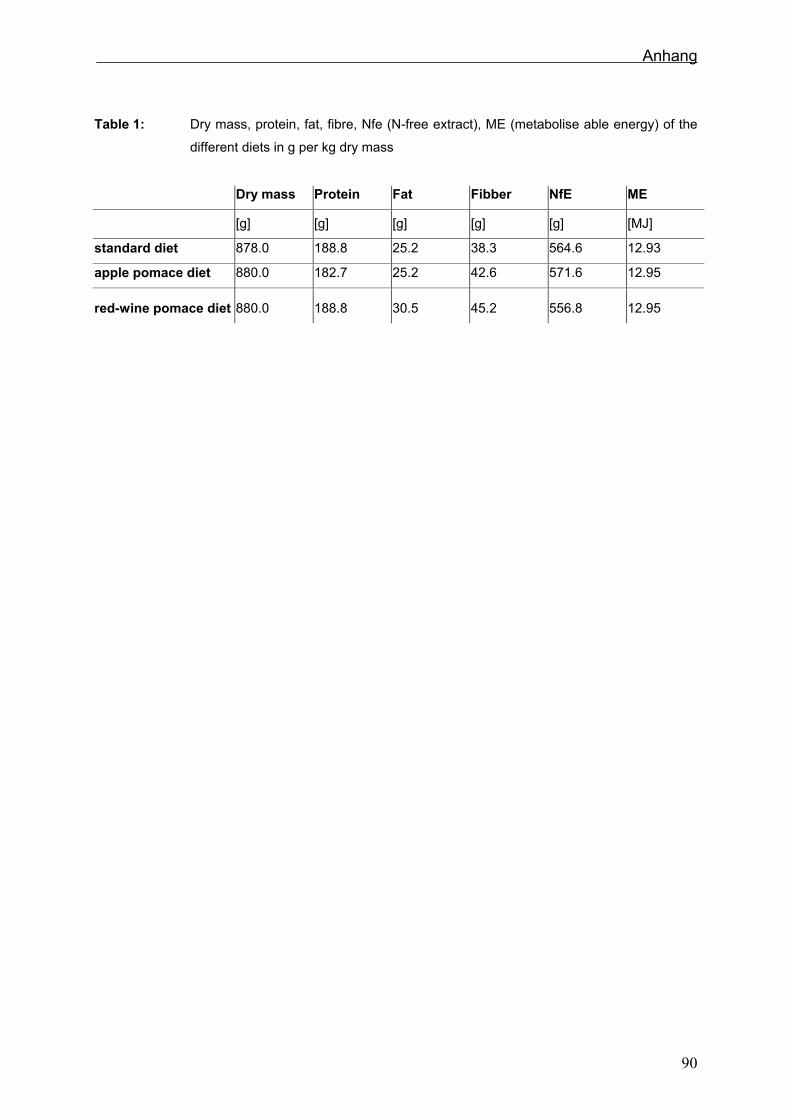
Anhang
Table 1: Dry mass, protein, fat, fibre, Nfe (N-free extract), ME (metabolise able energy) of the
different diets in g per kg dry mass
Dry mass Protein Fat Fibber NfE ME
[g] [g] [g] [g] [g] [MJ]
standard diet 878.0 188.8 25.2 38.3 564.6 12.93
apple pomace diet 880.0 182.7 25.2 42.6 571.6 12.95
red-wine pomace diet 880.0 188.8 30.5 45.2 556.8 12.95
90
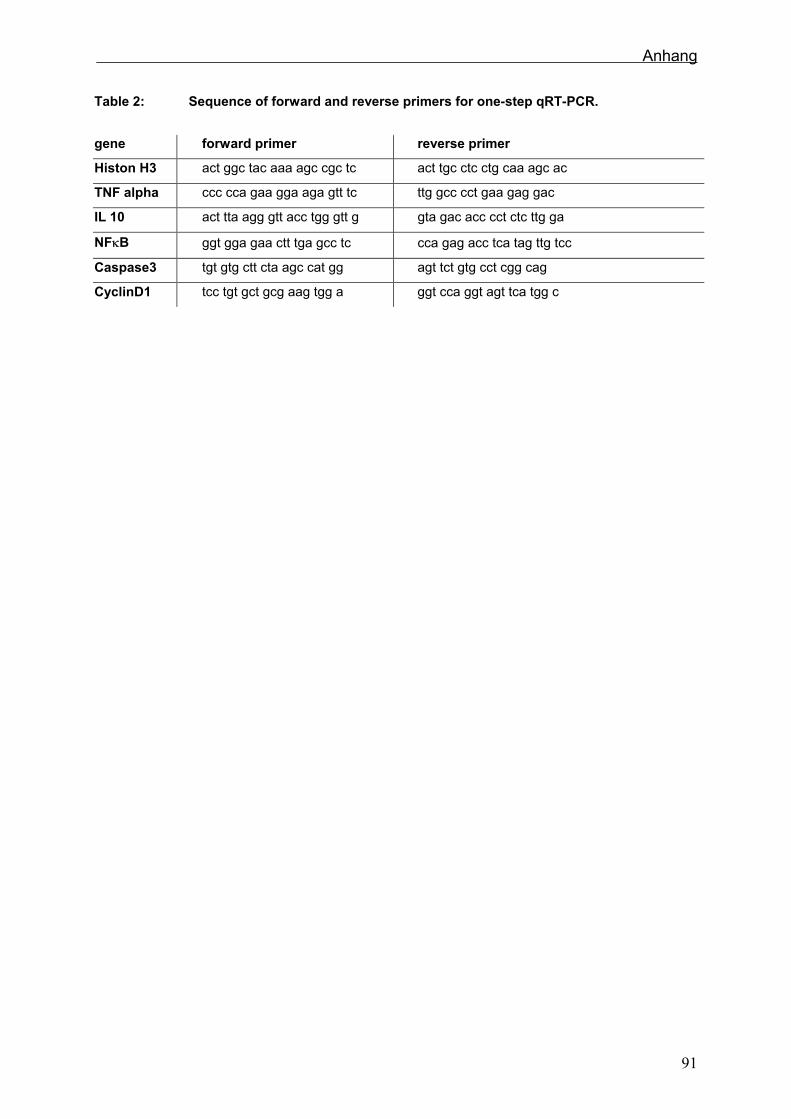
Anhang
Table 2: Sequence of forward and reverse primers for one-step qRT-PCR.
gene forward primer reverse primer
Histon H3 act ggc tac aaa agc cgc tc act tgc ctc ctg caa agc ac
TNF alpha ccc cca gaa gga aga gtt tc ttg gcc cct gaa gag gac
IL 10 act tta agg gtt acc tgg gtt g gta gac acc cct ctc ttg ga
NFκB ggt gga gaa ctt tga gcc tc cca gag acc tca tag ttg tcc
Caspase3 tgt gtg ctt cta agc cat gg agt tct gtg cct cgg cag
CyclinD1 tcc tgt gct gcg aag tgg a ggt cca ggt agt tca tgg c
91
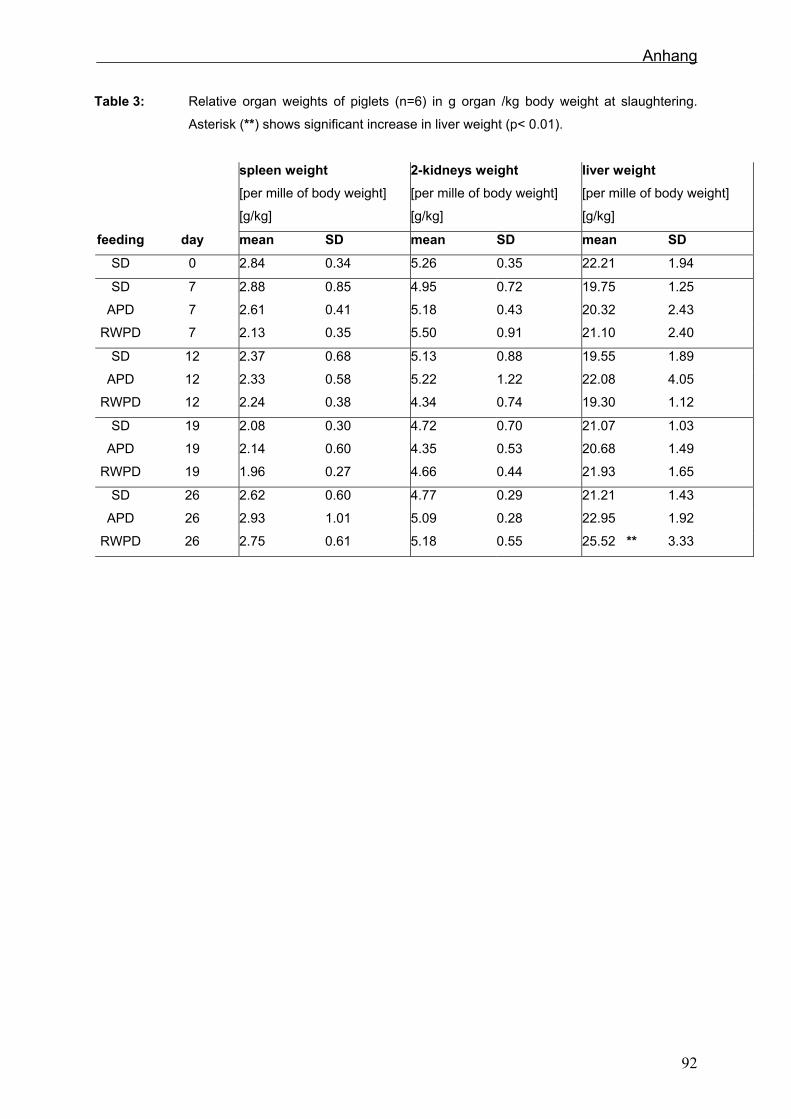
Anhang
Table 3: Relative organ weights of piglets (n=6) in g organ /kg body weight at slaughtering.
Asterisk (**) shows significant increase in liver weight (p< 0.01).
spleen weight [per mille of body weight]
[g/kg]
2-kidneys weight [per mille of body weight]
[g/kg]
liver weight [per mille of body weight]
[g/kg]
feeding day mean SD mean SD mean SD
SD 0 2.84 0.34 5.26 0.35 22.21 1.94
SD 7 2.88 0.85 4.95 0.72 19.75 1.25
APD 7 2.61 0.41 5.18 0.43 20.32 2.43
RWPD 7 2.13 0.35 5.50 0.91 21.10 2.40
SD 12 2.37 0.68 5.13 0.88 19.55 1.89
APD 12 2.33 0.58 5.22 1.22 22.08 4.05
RWPD 12 2.24 0.38 4.34 0.74 19.30 1.12
SD 19 2.08 0.30 4.72 0.70 21.07 1.03
APD 19 2.14 0.60 4.35 0.53 20.68 1.49
RWPD 19 1.96 0.27 4.66 0.44 21.93 1.65
SD 26 2.62 0.60 4.77 0.29 21.21 1.43
APD 26 2.93 1.01 5.09 0.28 22.95 1.92
RWPD 26 2.75 0.61 5.18 0.55 25.52 ** 3.33
92
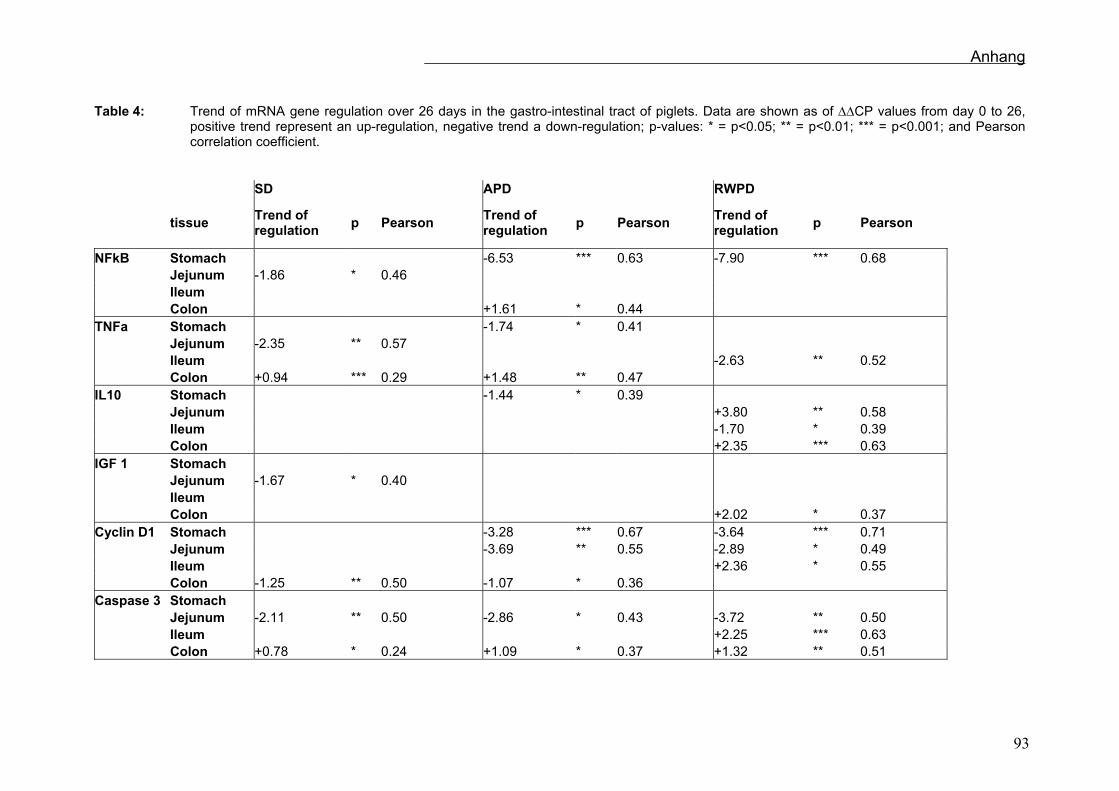
Anhang
Table 4: Trend of mRNA gene regulation over 26 days in the gastro-intestinal tract of piglets. Data are shown as of ∆∆CP values from day 0 to 26, positive trend represent an up-regulation, negative trend a down-regulation; p-values: * = p<0.05; ** = p<0.01; *** = p<0.001; and Pearson correlation coefficient.
SD APD RWPD
tissue Trend of regulation p Pearson Trend of
regulation p Pearson Trend of regulation p Pearson
NFkB Stomach -6.53 *** 0.63 -7.90 *** 0.68 Jejunum -1.86 * 0.46 Ileum Colon +1.61 * 0.44 TNFa Stomach -1.74 * 0.41 Jejunum -2.35 ** 0.57 Ileum -2.63 ** 0.52 Colon +0.94 *** 0.29 +1.48 ** 0.47 IL10 Stomach -1.44 * 0.39 Jejunum +3.80 ** 0.58 Ileum -1.70 * 0.39 Colon +2.35 *** 0.63 IGF 1 Stomach Jejunum -1.67 * 0.40 Ileum Colon +2.02 * 0.37 Cyclin D1 Stomach -3.28 *** 0.67 -3.64 *** 0.71 Jejunum -3.69 ** 0.55 -2.89 * 0.49 Ileum +2.36 * 0.55 Colon -1.25 ** 0.50 -1.07 * 0.36 Caspase 3 Stomach Jejunum -2.11 ** 0.50 -2.86 * 0.43 -3.72 ** 0.50 Ileum +2.25 *** 0.63 Colon +0.78 * 0.24 +1.09 * 0.37 +1.32 ** 0.51
55 93
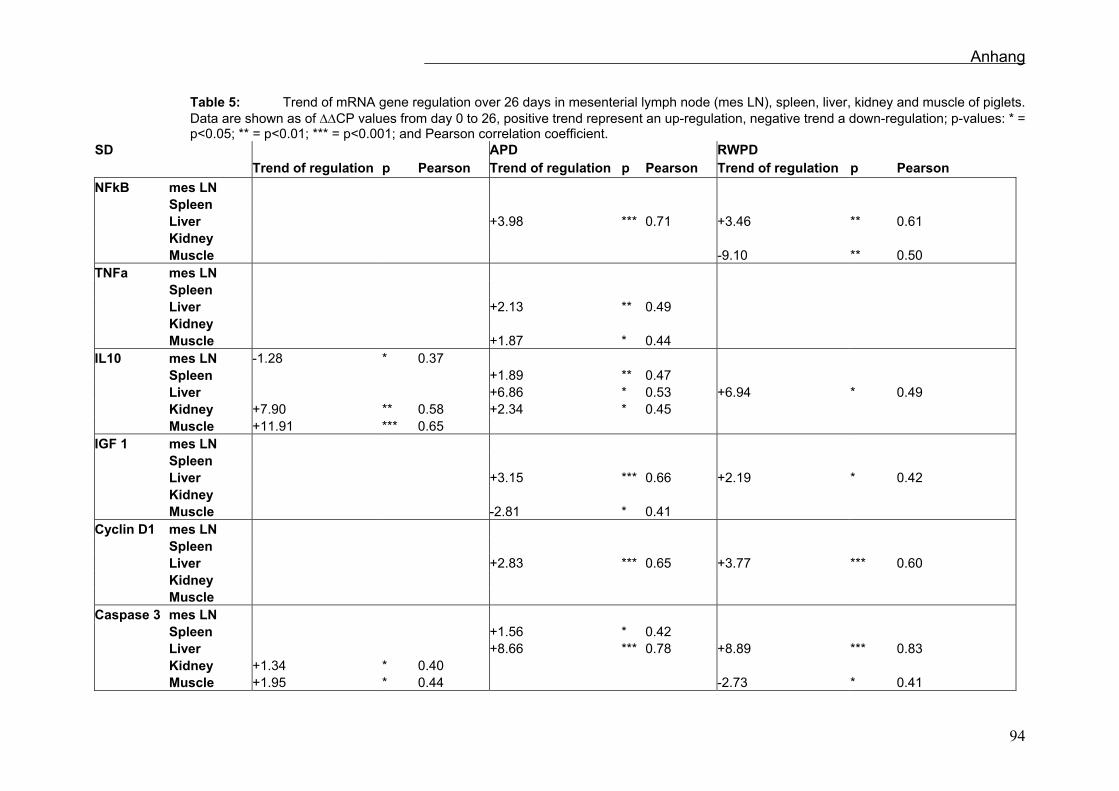
Anhang
Table 5: Trend of mRNA gene regulation over 26 days in mesenterial lymph node (mes LN), spleen, liver, kidney and muscle of piglets. Data are shown as of ∆∆CP values from day 0 to 26, positive trend represent an up-regulation, negative trend a down-regulation; p-values: * = p<0.05; ** = p<0.01; *** = p<0.001; and Pearson correlation coefficient.
SD APD RWPD Trend of regulation p Pearson Trend of regulation p Pearson Trend of regulation p Pearson NFkB mes LN Spleen Liver +3.98 *** 0.71 +3.46 ** 0.61 Kidney Muscle -9.10 ** 0.50 TNFa mes LN Spleen Liver +2.13 ** 0.49 Kidney Muscle +1.87 * 0.44 IL10 mes LN -1.28 * 0.37 Spleen +1.89 ** 0.47 Liver +6.86 * 0.53 +6.94 * 0.49 Kidney +7.90 ** 0.58 +2.34 * 0.45 Muscle +11.91 *** 0.65 IGF 1 mes LN Spleen Liver +3.15 *** 0.66 +2.19 * 0.42 Kidney Muscle -2.81 * 0.41 Cyclin D1 mes LN Spleen Liver +2.83 *** 0.65 +3.77 *** 0.60 Kidney Muscle Caspase 3 mes LN Spleen +1.56 * 0.42 Liver +8.66 *** 0.78 +8.89 *** 0.83 Kidney +1.34 * 0.40 Muscle +1.95 * 0.44 -2.73 * 0.41
94
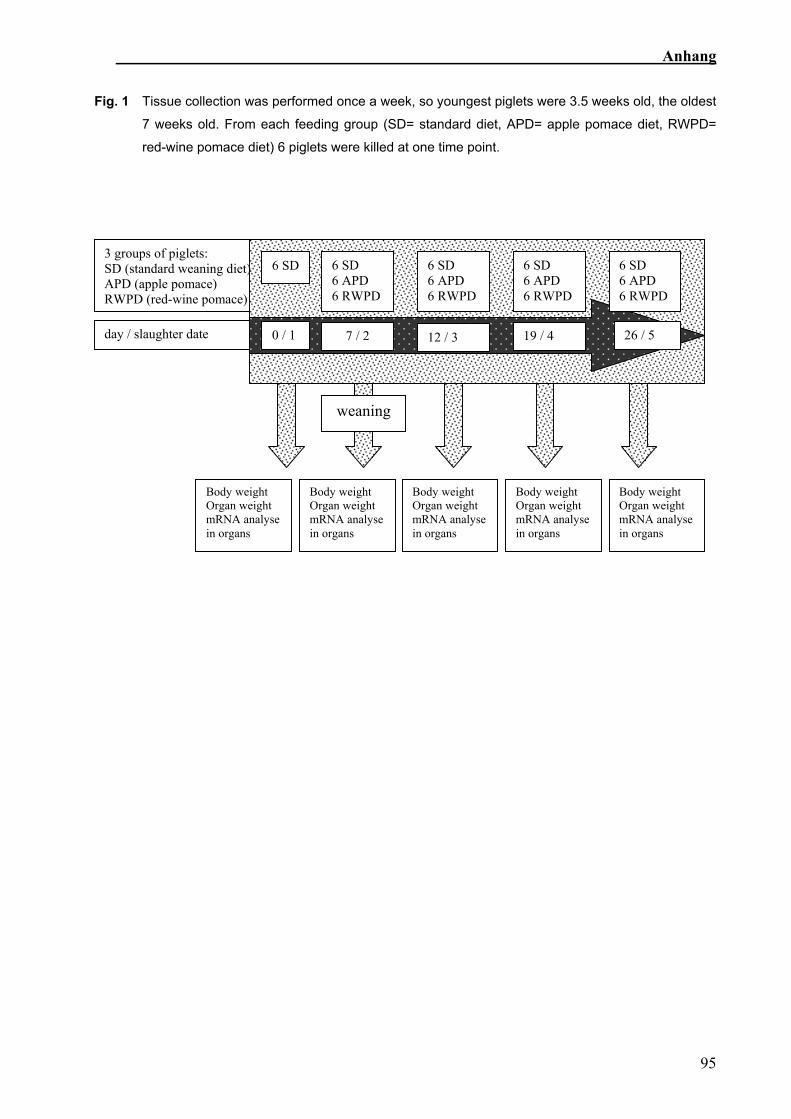
Anhang
Fig. 1 Tissue collection was performed once a week, so youngest piglets were 3.5 weeks old, the oldest
7 weeks old. From each feeding group (SD= standard diet, APD= apple pomace diet, RWPD=
red-wine pomace diet) 6 piglets were killed at one time point.
6 SD 6 SD 6 APD 6 RWPD
6 SD 6 APD 6 RWPD
6 SD 6 APD 6 RWPD
6 SD 6 APD 6 RWPD
3 groups of piglets: SD (standard weaning diet) APD (apple pomace) RWPD (red-wine pomace)
0 / 1 26 / 5 12 / 3 19 / 4 7 / 2 day / slaughter date
weaning
Body weight Organ weight mRNA analyse in organs
Body weight Organ weight mRNA analysein organs
Body weight Organ weight mRNA analysein organs
Body weight Organ weight mRNA analyse in organs
Body weight Organ weight mRNA analysein organs
95
Anhang
Manuskript
The influence of normal, apple pomace added and red wine pomace added
diet on blood parameters and faces in piglets
Julia Sehm1, Dieter Treutter2, H. Lindermayer3 and Michael Pfaffl1*
1 Lehrstuhl für Physiologie - Weihenstephan, Zentralinstitut für Ernährung- und
Lebensmittelforschung (ZIEL); Wissenschaftszentrum Weihenstephan (WZW), Technische
Universität München (TUM), D-85350 Freising, Germany
2 Fachgebiet Obstbau - Weihenstephan, Zentralinstitut für Ernährung- und
Lebensmittelforschung (ZIEL); Wissenschaftszentrum Weihenstephan (WZW), Technische
Universität München (TUM), D-85350 Freising, Germany
3 Institut für Tierernährung und Futterwirtschaft, Bayerische Landesanstalt für Landwirtschaft
(LfL), D-85586 Poing-Grub, Germany
*Author for correspondence:
Michael W. Pfaffl
Tel: +49-8161-713511
Fax: +49-8161-714204
E-mail: [email protected]
Key words:
Apple pomace, red wine pomace, piglets, blood, faces
96
Anhang
Abstract
Polyphenols have not only anti-cancer effects, but also antimicrobial, anti-oxidative, anti-
thrombotic, immune-modulated, anti-inflammatory, blood pressure dropping and blood-glucose-
level dropping effects. Epicatechin and catechin are flavan-3-ols, B1, B2 and C1 are
proanthocyanidins. These flavanoids are highly concentrated in different fruits and berries as
well as in fruit pomace. In the feeding experiment the effect of three different diets- normal
piglets starter without additives, with apple pomace respectively red-wine pomace, on blood
parameters and bacterial flora in faces was investigated from weaning to three weeks post
weaning in 36 piglets. Red wine pomace, gut content and tissues were analyzed with HPLC; we
find polyphenols in gastrointestinal tract content and traces in tissues. Only some blood
parameters were affected from the different diets. Hemoglobin and Hematocrit was down-
regulated in all groups over testing period, the trend was greater in the two pomace groups. In
pomace group there were more thrombocytes than in the standard group. The apple pomace fed
groups showed a higher number of lactobacilli at the end of the investigation. We suppose that
both polyphenol rich feedings have the potential to change positively the intestinal flora and
blood parameters. …
Introduction
The monomeric flavan-3-ols epicatechin and catechin and their oligomeric proanthocyandins B1,
B2 and C1 are high concentrated in several fruits and berries. Catechin and epicatechin are main
phenolic compounds in grape seed (Palma and Taylor, 1999). These are also the major
flavonoids present in grape skins in addition to various anthocyanins (Souquet et al., 2000).
Polyphenols are likely to prevent cancer as well as cardiovascular diseases. They increase the
plasma antioxidant capacity and are thought to inhibit oxidation of LDLs (Sembries et al., 2004).
They reduce the systolic pressure and the level of plasma cholesterol, as shown in animal and
97
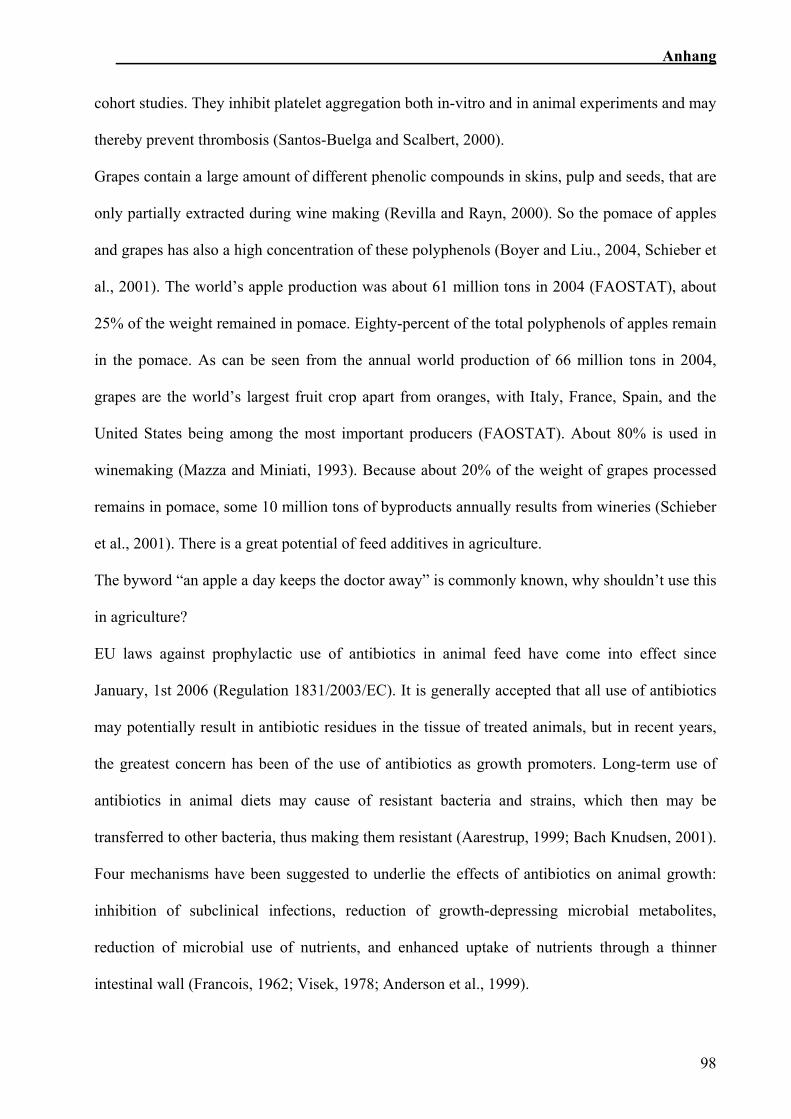
Anhang
cohort studies. They inhibit platelet aggregation both in-vitro and in animal experiments and may
thereby prevent thrombosis (Santos-Buelga and Scalbert, 2000).
Grapes contain a large amount of different phenolic compounds in skins, pulp and seeds, that are
only partially extracted during wine making (Revilla and Rayn, 2000). So the pomace of apples
and grapes has also a high concentration of these polyphenols (Boyer and Liu., 2004, Schieber et
al., 2001). The world’s apple production was about 61 million tons in 2004 (FAOSTAT), about
25% of the weight remained in pomace. Eighty-percent of the total polyphenols of apples remain
in the pomace. As can be seen from the annual world production of 66 million tons in 2004,
grapes are the world’s largest fruit crop apart from oranges, with Italy, France, Spain, and the
United States being among the most important producers (FAOSTAT). About 80% is used in
winemaking (Mazza and Miniati, 1993). Because about 20% of the weight of grapes processed
remains in pomace, some 10 million tons of byproducts annually results from wineries (Schieber
et al., 2001). There is a great potential of feed additives in agriculture.
The byword “an apple a day keeps the doctor away” is commonly known, why shouldn’t use this
in agriculture?
EU laws against prophylactic use of antibiotics in animal feed have come into effect since
January, 1st 2006 (Regulation 1831/2003/EC). It is generally accepted that all use of antibiotics
may potentially result in antibiotic residues in the tissue of treated animals, but in recent years,
the greatest concern has been of the use of antibiotics as growth promoters. Long-term use of
antibiotics in animal diets may cause of resistant bacteria and strains, which then may be
transferred to other bacteria, thus making them resistant (Aarestrup, 1999; Bach Knudsen, 2001).
Four mechanisms have been suggested to underlie the effects of antibiotics on animal growth:
inhibition of subclinical infections, reduction of growth-depressing microbial metabolites,
reduction of microbial use of nutrients, and enhanced uptake of nutrients through a thinner
intestinal wall (Francois, 1962; Visek, 1978; Anderson et al., 1999).
98
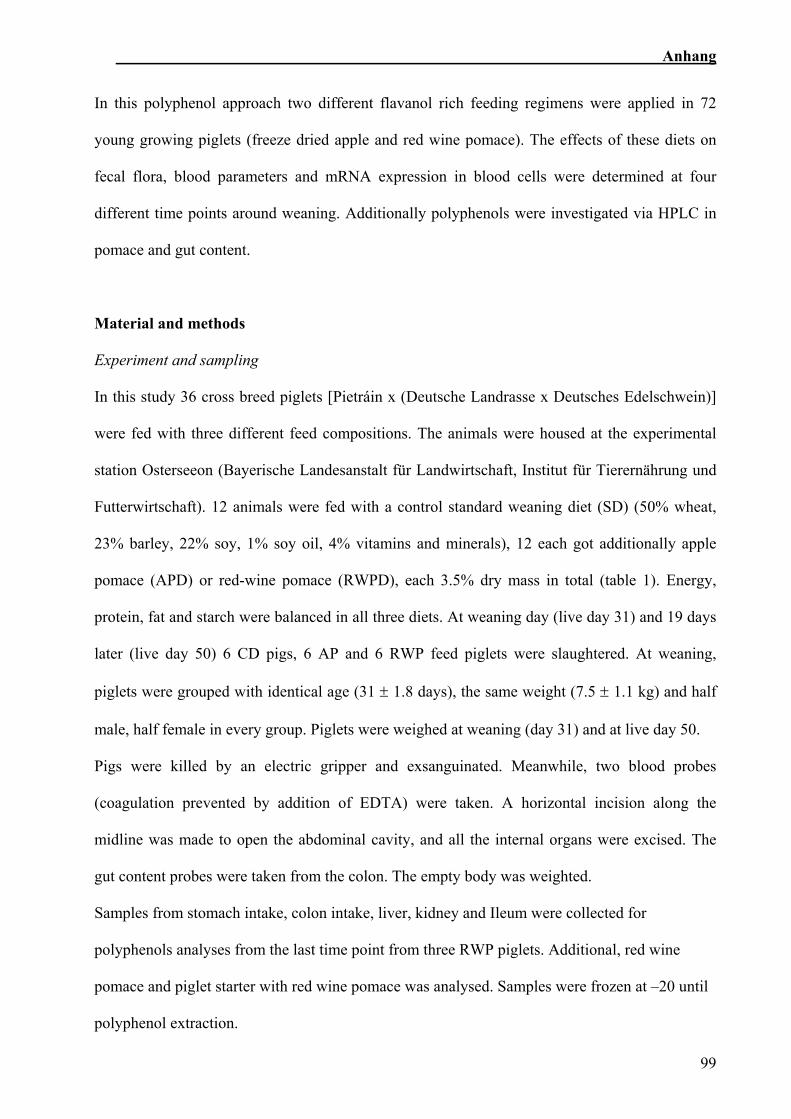
Anhang
In this polyphenol approach two different flavanol rich feeding regimens were applied in 72
young growing piglets (freeze dried apple and red wine pomace). The effects of these diets on
fecal flora, blood parameters and mRNA expression in blood cells were determined at four
different time points around weaning. Additionally polyphenols were investigated via HPLC in
pomace and gut content.
Material and methods
Experiment and sampling
In this study 36 cross breed piglets [Pietráin x (Deutsche Landrasse x Deutsches Edelschwein)]
were fed with three different feed compositions. The animals were housed at the experimental
station Osterseeon (Bayerische Landesanstalt für Landwirtschaft, Institut für Tierernährung und
Futterwirtschaft). 12 animals were fed with a control standard weaning diet (SD) (50% wheat,
23% barley, 22% soy, 1% soy oil, 4% vitamins and minerals), 12 each got additionally apple
pomace (APD) or red-wine pomace (RWPD), each 3.5% dry mass in total (table 1). Energy,
protein, fat and starch were balanced in all three diets. At weaning day (live day 31) and 19 days
later (live day 50) 6 CD pigs, 6 AP and 6 RWP feed piglets were slaughtered. At weaning,
piglets were grouped with identical age (31 ± 1.8 days), the same weight (7.5 ± 1.1 kg) and half
male, half female in every group. Piglets were weighed at weaning (day 31) and at live day 50.
Pigs were killed by an electric gripper and exsanguinated. Meanwhile, two blood probes
(coagulation prevented by addition of EDTA) were taken. A horizontal incision along the
midline was made to open the abdominal cavity, and all the internal organs were excised. The
gut content probes were taken from the colon. The empty body was weighted.
Samples from stomach intake, colon intake, liver, kidney and Ileum were collected for
polyphenols analyses from the last time point from three RWP piglets. Additional, red wine
pomace and piglet starter with red wine pomace was analysed. Samples were frozen at –20 until
polyphenol extraction.
99
Anhang
Polyphenol samples were lyophilized for four days. One gram dry sample was mixed with 10ml
100 % MeOH and crushed with Ultra Turrax (Jahnke and Kunkel, IKA, Labortechnik,
Germany). Additionally the piglet starter with red wine pomace was extracted with water and
with HCl (pH 2). Then the mixture was treated 30 min in a 4 degrees cold ultrasonic bath and
centrifuged 10 minutes at 4 degrees. The upper liquid was dropped into another cup and freezed
at –20 until HPLC analyses. The polyphenol were analysed with HPLC in triplets.
HPLC analyses:
The HPLC equipment used consists of an autosampler (Gilson-Abimed Modell 231), of two
pumps (Kontron Modell 422), and a diode array detector (Bio Tek Kontron 540). For post
column derivatisation a further analytical HPLC pump (Gynkotek Modell 300 C) and a VIS-
detector (640 nm, Kontron Detektor 432) were used. The column (250 x 4 mm I.D.) was
prepacked with Shandon Hypersil ODS 3 µm. The solvents were 5% acetic acid (A) and
methanol (B). Gradient range: 0-5 min, isocratic, 5% B in A; 5-10min, 5-10% B in A; 10-15min,
isocratic, 10% B in A; 15-35 min, 10-15% B in A; 35-55min, isocratic, 15% B in A; 55-70 min,
15-20% B in A; 70-80 min, isocratic, 20% B in A; 80-95 min, 20-25% B in A; 95-125 min, 25-
30% B in A; 125-145 min, 30-40% B in A; 145-160 min, 40-50% B in A; 160-175 min, 50-90%
B in A, 175-195, isocratic, 90% B in A, 195-210, 90-5% B in A; 210-235 min, isocratic, 5% B in
A (Treutter et al., 1994). Phenolic acids and flavonols were detected at 280nm whereas the
flavan 3-ols were estimated at 640nm (Treutter, 1989) after post column derivatisation with p-
dimethyl-aminocinnamic aldehyde (DMACA). 6-methoxyflavone was used as internal standard
for quantitative analyses.
The single compounds were identified by retention times and their UV-absorbance spectra via
diode array detection and by comparison with standards. These standards were either
commercially available from Roth and Sigma (catechin, epicatechin, chlorogenic acid,
phloridzin, rutin) or previously isolated from apple and service tree: procyanidins B1, B2, B5, E-
100
Anhang
B5, C1, phloretin derivatives, hydroxycinnamic acids, quercetin glycosides (Mayr et al. 1995,
Treutter et al. 1994, Ölschläger et al. 2004).
mRNA extraction
Blood probes were taken with EDTA (0.2 ml EDTA per 10 ml total blood) for blood cell
extraction. For white blood cell separation, 10 ml-sampled blood was mixed with 10 ml lyses
puffer (0.83 g NH4Cl, 3.7 mg Na-EDTA, 1 g KCl in 100 ml, pH 7.4) and centrifuged for 10
minutes at 220 g. The cell pellet was suspended in 10 ml lyses puffer and centrifuged again. The
white blood cell pellet of the 10ml blood was then suspended in 100µl TriFast. Total RNA of
these white blood cells was isolated using TriFast (Peqlab, Erlangen, Germany) according to the
manufacturer’s instructions. To quantify the extracted RNA concentration, the optical density
was determined in triplicates at three different dilutions of the final total RNA preparations at
260 nm. RNA integrity was verified by optical density OD 260nm/OD 280nm absorption ratio >1.80.
Real-time one-step qRT-PCR
Relative-quantification of mRNA concentration was carried out using a one-step quantitative
RT-PCR (qRT-PCR) in the ep realplex Cycler (Eppendorf, Hamburg, Germany). To minimize
pipetting errors an eight-channel pipetting robot epMotion 5075 (Eppendorf) was used. 25 ng
mRNA in 1 µl volume was inserted as RT-PCR template. Further the master-mix components
for the qPCR reactions [0.3 µl iScript (Bio-Rad, Munich, Germany), 0.225 µL (20 pmol) of
forward and reverse primer (table 2) synthesized by MWG Biotech (Ebersberg, Germany), 7.5 µl
2x SYBR Green (Bio-Rad) and up to 14 µl water] was assembled by the robot. One–step qRT-
PCR was performed with 40 cycles and product-specific annealing temperature, according to the
manufactures cycle settings (Bio-Rad). The crossing points (CP) were acquired with the CT-
method present in the Eppendorf analysis software. Amplification PCR products underwent a
melting curve analysis after the last cycle to specify the integrity of amplification. Finally a
101
Anhang
cooling step was performed. A relative-quantification was applied, using Histon H3 as reference
gene and a panel of physiological marker genes (table 2). Single target genes mRNA expression
were normalized by the constant Histon H3 gene expression, according to the ∆∆CP method
(Schmittgen, 2001, Livak and Schmittgen, 2001), described in the following equation:
∆CP (Histon - marker gene) = CP (Histon) – CP (marker gene)
In a second step, each ∆CP value within one marker gene was compared with the mean
expression CP of the control group at the first slaughter date:
∆∆CP = CP (control)day 31 – ∆CP (Histon - marker gene)
Positive ∆∆CP values represent an up-regulation and negative ∆∆CP values represent a down-
regulation of the described mRNA gene expression, compared to the control group at day 31.
Hemogramm
The second EDTA-blood sample (0.2 ml EDTA per 10 ml total blood) and one smear was send
to a veterinary laboratory (vetmed labor, Ludwigsburg, Germany) and a blood screening was
made. Erythrocyte, hematocrit, hemoglobin concentration, thrombocyte and differential white
cell count were determined using the CELL-DYN 3700SL System (Abbott Diagnostika GmbH,
Wiesbaden, Germany). Differential leukocyte populations were performed on blood smears
stained with May Grünwald-Giemsa. HbE was also performed. The percentage of basophilic
granulocytes, eosinophilic granulocytes, segmented and nonsegmented neutrophilic
granulocytes, lymphocytes and monocytes were determined as well.
Bacterial examination of faces
Additionally, chymus samples were taken from the colon immediately after slaughtering and
stored on ice from the 18 piglets from the first and the last slaughtering group. A test for total
102
Anhang
anaerobe and aerobe bacteria’s was performed at the Tiergesundheitdienst Bayern e.V..
Streptococcus, Lactobacillus, E. coli and C. perfingens were tested, too. One gram chymus was
mixed with 9 ml PBS-solution. This mixture was diluted from 101 to 1010. Out of every dilution
0.1 ml was pipette at an agar. Agar plates with 3 to 300 bacteria were counted and the mean was
calculated (Bollmann, 2002).
Statistical Evaluations
Statistics was taken with Sigma Stat 2.03 (SPSS Science, Chicago, USA). Means were compared
with two way ANOVA (diet group and different days). P values less than 0.05 were considered
significant.
Results
Daily gain and body weight
All animals remained healthy during the feeding experiment and no animal losses were
registered. Some of the piglets excreted pasty faeces, but none of the pigs got ill and was treated
for any disease. Energy and feed intake and average daily gain did not differ between dietary
treatments. At the different slaughter dates the piglets weighed 7.5 ± 1.1 kg and 13.15 ± 1.6 kg.
The three feeding groups showed no differences in live weight and daily gain. Therefore the
empty body weight was not affected by the applied diets.
Polyphenol analysis
Figure 1 shows the results from the polyphenol analyses. Only the five main flavanols are
shown, the monomers catechin and epicatechin and the procyanidins B1, B2 and C1 . All five
compounds were recovered in the stomach and colon content. In the tissues only traces of
catechin, B1 and B2 could be detected.
103
Anhang
The observed polyphenols are higher concentrated in gut content than in the mixed pomace diet.
The extraction with water and with HCl (pH 2), respectively, yielded comparable proportions of
the flavonoids, but even lower concentrations.
mRNA expression and total RNA
Extracted total RNA contents showed no significant variations in RNA integrity and quantity
between analysed feeding groups. All tested genes were abundant in all tissues, showed single
peaks in melting curve analysis (ep realplex software) and a single band in high-resolution 4%
agarose gel electrophoresis (gels not shown). The housekeeping gene Histon H3 mRNA
expression remained constant during the entire study and was affected neither by the time
(p=0.770) nor by the diet treatments (p=0.615).
Five different marker genes were determinate in one step qRT-qPCR:
1 pro-inflammatory markers, apoptosis inducing markers: TNFα
2 transcription factor: NFκB
3 anti-inflammatory marker: IL10
4 apoptotic marker: Caspase 3
5 cell cycle markers: Cyclin D1
6 reference gene: Histon H3
Within one time point there were no significant differences between the different diet groups.
Between the different time points there were significant differences within the APD (table 3).
TNFα (p=0.033), NFκB (p= 0.024) and Caspase 3 (p=0.019) mRNA expression increased
significantly during treatment.
Blood parameters
104
Anhang
Results from the investigation of blood parameters are summarized in table 4. The sex of the
piglets had no significant influence on the different blood parameters. Only less nonsegmented
neutrophilic granulocytes (0±0), basophilic (0.32±0.78) and eosinophilic granulocytes
(0.48±1.05) were counted, so no statistic calculation was made with these parameters. The
number of Erythrocytes was higher in the SD than in the APD at the end of the observed period
(p=0,049). The hemoglobin concentration decreased significantly over time in SD (p=0,015),
APD (p<0,001) and RWPD group (p=0,005), as well as hematocrit (SD p=0,001, APD p<0.001,
RWPD p<0,001). At the first time point we found more thrombocytes in RWPD than in SD
(p=0,019), at the second time point more thrombocytes in APD (p=0,042) and RWPD (p=0,029)
than in SD. The number of thrombocytes decreased over time in SD (p=0,031) and RWPD
(p<0,001), in APD it was only a trend.
Bacterial examination of faces
Table 5 summarized results of the bacterial examination of faces. Steptococci / Enterococci
increased in the SD (p=0.002) and in the RWPD (p=0.024), whereas the APD (p=0.292) showed
no significant change. C. perfingens were not detectable at the second time point. The number of
lactobacillus increased in APD (p<0,001) and RWPD (p=0,033). Within day 50, the numbers of
lactobacillus in the APD and RWPD were higher (p<0.001) than in SD.
Discussion
Weaning involves multiple changes in the physiology of piglets. In addition to the change from a
liquid to solid diet, weaning is a time of stress for the weanling. First, as it is taken from the
mother, second, as it is moved to a new building, and third, as it exposed to numerous piglets
other than its siblings and to their potentially aggressive behavior (Funderburke and Seerley,
1990). The adverse stressful effects of weaning may be due to psychological, environmental or
nutritional factors (Funderburke and Seerley, 1990), and it is difficult to unravel the contributions
105
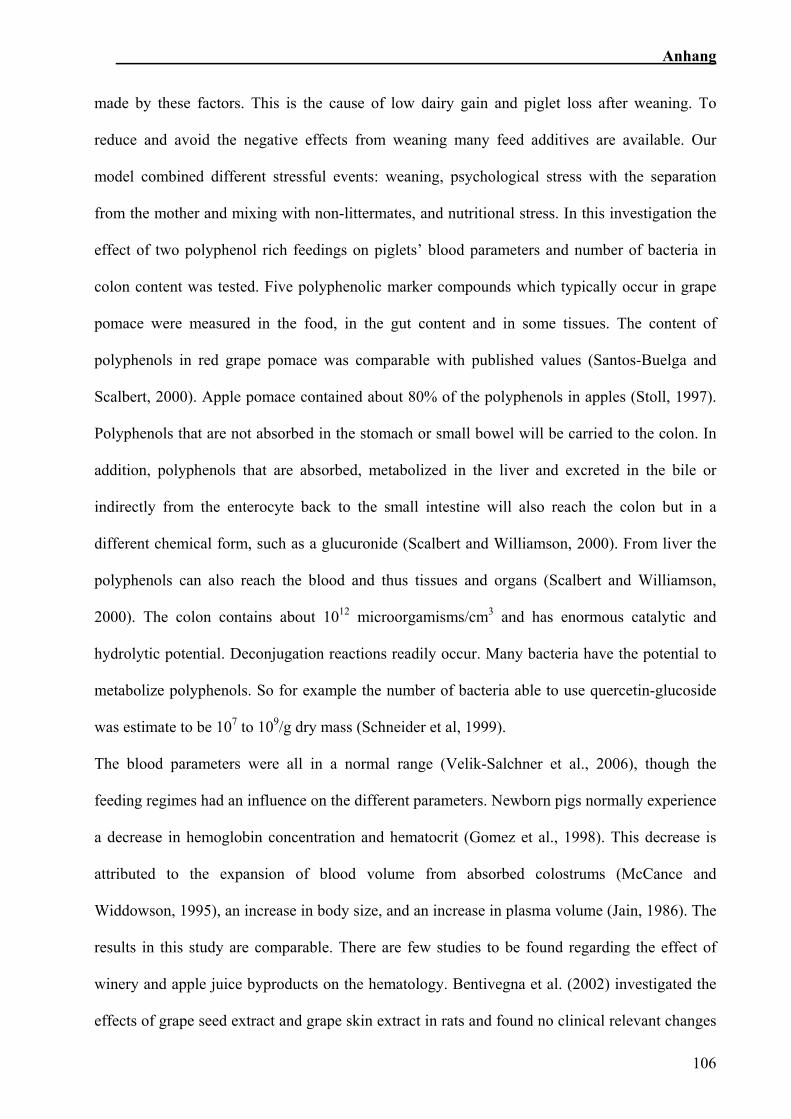
Anhang
made by these factors. This is the cause of low dairy gain and piglet loss after weaning. To
reduce and avoid the negative effects from weaning many feed additives are available. Our
model combined different stressful events: weaning, psychological stress with the separation
from the mother and mixing with non-littermates, and nutritional stress. In this investigation the
effect of two polyphenol rich feedings on piglets’ blood parameters and number of bacteria in
colon content was tested. Five polyphenolic marker compounds which typically occur in grape
pomace were measured in the food, in the gut content and in some tissues. The content of
polyphenols in red grape pomace was comparable with published values (Santos-Buelga and
Scalbert, 2000). Apple pomace contained about 80% of the polyphenols in apples (Stoll, 1997).
Polyphenols that are not absorbed in the stomach or small bowel will be carried to the colon. In
addition, polyphenols that are absorbed, metabolized in the liver and excreted in the bile or
indirectly from the enterocyte back to the small intestine will also reach the colon but in a
different chemical form, such as a glucuronide (Scalbert and Williamson, 2000). From liver the
polyphenols can also reach the blood and thus tissues and organs (Scalbert and Williamson,
2000). The colon contains about 1012 microorgamisms/cm3 and has enormous catalytic and
hydrolytic potential. Deconjugation reactions readily occur. Many bacteria have the potential to
metabolize polyphenols. So for example the number of bacteria able to use quercetin-glucoside
was estimate to be 107 to 109/g dry mass (Schneider et al, 1999).
The blood parameters were all in a normal range (Velik-Salchner et al., 2006), though the
feeding regimes had an influence on the different parameters. Newborn pigs normally experience
a decrease in hemoglobin concentration and hematocrit (Gomez et al., 1998). This decrease is
attributed to the expansion of blood volume from absorbed colostrums (McCance and
Widdowson, 1995), an increase in body size, and an increase in plasma volume (Jain, 1986). The
results in this study are comparable. There are few studies to be found regarding the effect of
winery and apple juice byproducts on the hematology. Bentivegna et al. (2002) investigated the
effects of grape seed extract and grape skin extract in rats and found no clinical relevant changes
106
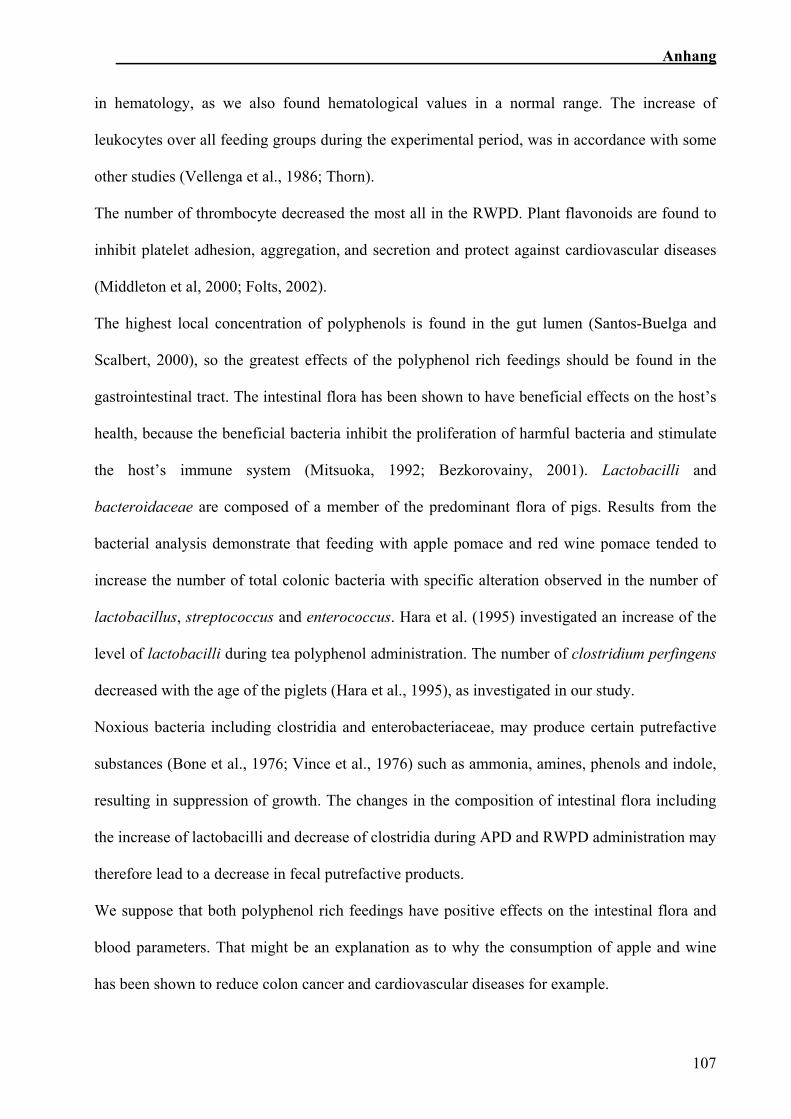
Anhang
in hematology, as we also found hematological values in a normal range. The increase of
leukocytes over all feeding groups during the experimental period, was in accordance with some
other studies (Vellenga et al., 1986; Thorn).
The number of thrombocyte decreased the most all in the RWPD. Plant flavonoids are found to
inhibit platelet adhesion, aggregation, and secretion and protect against cardiovascular diseases
(Middleton et al, 2000; Folts, 2002).
The highest local concentration of polyphenols is found in the gut lumen (Santos-Buelga and
Scalbert, 2000), so the greatest effects of the polyphenol rich feedings should be found in the
gastrointestinal tract. The intestinal flora has been shown to have beneficial effects on the host’s
health, because the beneficial bacteria inhibit the proliferation of harmful bacteria and stimulate
the host’s immune system (Mitsuoka, 1992; Bezkorovainy, 2001). Lactobacilli and
bacteroidaceae are composed of a member of the predominant flora of pigs. Results from the
bacterial analysis demonstrate that feeding with apple pomace and red wine pomace tended to
increase the number of total colonic bacteria with specific alteration observed in the number of
lactobacillus, streptococcus and enterococcus. Hara et al. (1995) investigated an increase of the
level of lactobacilli during tea polyphenol administration. The number of clostridium perfingens
decreased with the age of the piglets (Hara et al., 1995), as investigated in our study.
Noxious bacteria including clostridia and enterobacteriaceae, may produce certain putrefactive
substances (Bone et al., 1976; Vince et al., 1976) such as ammonia, amines, phenols and indole,
resulting in suppression of growth. The changes in the composition of intestinal flora including
the increase of lactobacilli and decrease of clostridia during APD and RWPD administration may
therefore lead to a decrease in fecal putrefactive products.
We suppose that both polyphenol rich feedings have positive effects on the intestinal flora and
blood parameters. That might be an explanation as to why the consumption of apple and wine
has been shown to reduce colon cancer and cardiovascular diseases for example.
107
Anhang
Acknowledgements
This study was supported by the Bayerisches Staatsministerium für Landwirtschaft und Forsten, L/a-7606.2-494.
References:
Aarestrup, F.M., 1999. Association between the consumption of antimicrobial agents in animal husbandry and the
occurrence of resistant bacteria among food animals. Int J Antimicrob Agents. 12,279-85.
Anderson, D.B., McCracken, V.J., Aminov, R.I., Simpson, J.M., Mackie, R.I., Verstegen, M.W.A., Gaskins H.R.,
1999. Gut microbiology and growth-promoting antibiotics in swine. Nutr. Abstr. Rev., Series B. 70,101-108.
Bach Knudsen, K.E., 2001. Development of antibiotic resistance and options to replace antimocrobials in animals
diets. Proc. Nutr. Soc. 60,291-299.
Bentivegna, S.S., Whitney, K.M., 2002. Subchronic 3-month oral toxicity study of grape seed and grape skin
extracts. Food Chem. Toxicol. 40,1731-43.
Bezkorovainy, A., 2001. Probiotics: determinants of survival and growth in the gut. Am. J. Clin. Nutr. 73,399-405.
Bollmann S., 2002. Untersuchungen zur Wirkung nichtantibiotischer Futterzusätze auf die Darmflora sowie den
Verlauf einer experimentellen Escheria coli-bzw. Salmonella Derby-Infektion bei Schweinen. Dissertation.,
Tierärztliche Hochschule Hannover, in Germany with English abstract
Bone, E., Tamm, A., Hill, M., 1976. The production of urinary phenols by gut bacteria and their possible role in
causation of large bowel cancer. Am. J. Clin. Nutr. 29,1448-1454.
Boyer, J., Liu, R.H., 2004. Apple phytochemicals and their health benefits. Nutr J. 12,3:5.
McCance, R.A., Widdowson, E.M., 1995. The effect of colostrums on the composition and volume of the plasma of
newborn piglets, J. Physiol. 145,547-550.
FAOSTAT-FAO Statistical Database, http://faostat.fao.org/
Folts, J.D., 2002. Potential health benefits from the flavonoids in grape products on vascular disease. Adv. Exp.
Med. Biol. 505,95-111.
Francois, A.C., 1962. Mode of action of antibiotics on growth. World Rev. Nutr. Diet. 3, 21.
Funderburke, D.W., Seerley R.W., 1990. The effects of postweaning stressors on pig weight change, blood, liver
and digestive tract characteristics. J. Anim. Sci. 68,155-162.
Gomez, G.G., Phillips, O., Goforth, R.A., 1998. Effect of immunoglobulin source on survival, growth, and
hematological and immunological variables in pigs. J. Anim. Sci. 76,1-7.
Hara, H., Orita, N., Hatano, S., Ichikawa, H., Hara, Y., Matsumoto, N., Kimura, Y., Terada , A., Mitsuoka, T., 1995.
Effect of tea polyphenols on fecal flora and fecal metabolic products of pigs. J. Vet. Med. Sci. 57,45-9.
108
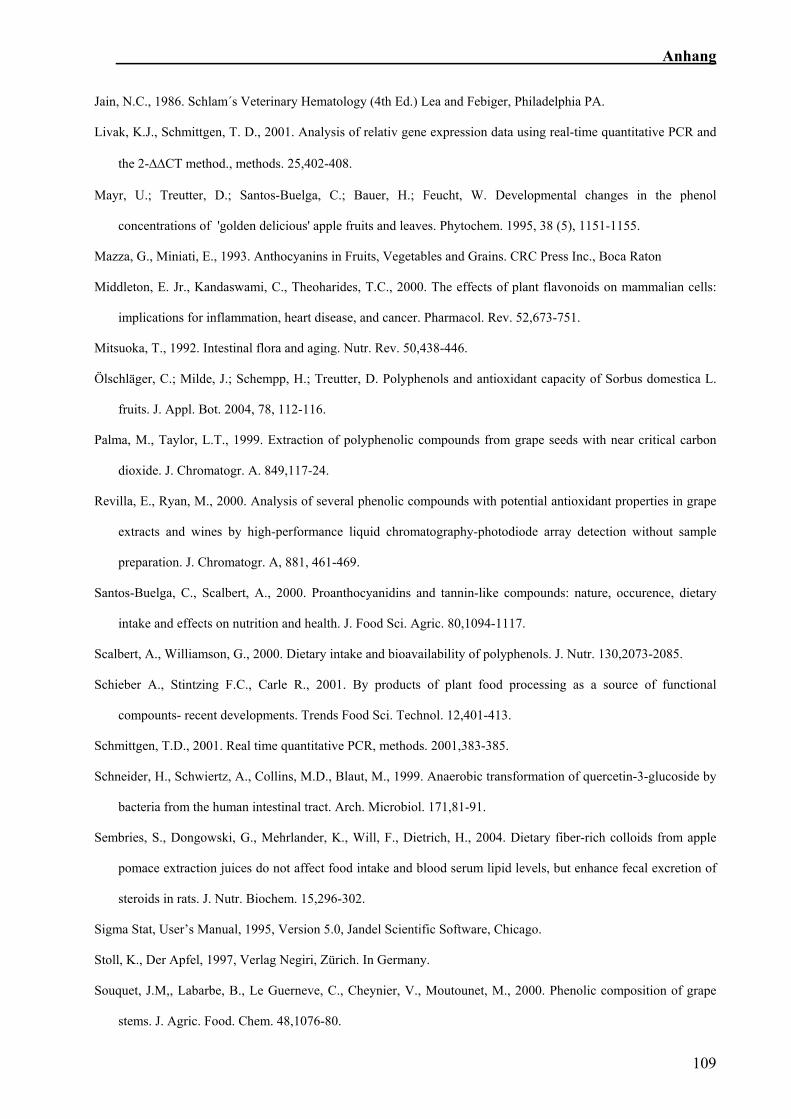
Anhang
Jain, N.C., 1986. Schlam´s Veterinary Hematology (4th Ed.) Lea and Febiger, Philadelphia PA.
Livak, K.J., Schmittgen, T. D., 2001. Analysis of relativ gene expression data using real-time quantitative PCR and
the 2-∆∆CT method., methods. 25,402-408.
Mayr, U.; Treutter, D.; Santos-Buelga, C.; Bauer, H.; Feucht, W. Developmental changes in the phenol
concentrations of 'golden delicious' apple fruits and leaves. Phytochem. 1995, 38 (5), 1151-1155.
Mazza, G., Miniati, E., 1993. Anthocyanins in Fruits, Vegetables and Grains. CRC Press Inc., Boca Raton
Middleton, E. Jr., Kandaswami, C., Theoharides, T.C., 2000. The effects of plant flavonoids on mammalian cells:
implications for inflammation, heart disease, and cancer. Pharmacol. Rev. 52,673-751.
Mitsuoka, T., 1992. Intestinal flora and aging. Nutr. Rev. 50,438-446.
Ölschläger, C.; Milde, J.; Schempp, H.; Treutter, D. Polyphenols and antioxidant capacity of Sorbus domestica L.
fruits. J. Appl. Bot. 2004, 78, 112-116.
Palma, M., Taylor, L.T., 1999. Extraction of polyphenolic compounds from grape seeds with near critical carbon
dioxide. J. Chromatogr. A. 849,117-24.
Revilla, E., Ryan, M., 2000. Analysis of several phenolic compounds with potential antioxidant properties in grape
extracts and wines by high-performance liquid chromatography-photodiode array detection without sample
preparation. J. Chromatogr. A, 881, 461-469.
Santos-Buelga, C., Scalbert, A., 2000. Proanthocyanidins and tannin-like compounds: nature, occurence, dietary
intake and effects on nutrition and health. J. Food Sci. Agric. 80,1094-1117.
Scalbert, A., Williamson, G., 2000. Dietary intake and bioavailability of polyphenols. J. Nutr. 130,2073-2085.
Schieber A., Stintzing F.C., Carle R., 2001. By products of plant food processing as a source of functional
compounts- recent developments. Trends Food Sci. Technol. 12,401-413.
Schmittgen, T.D., 2001. Real time quantitative PCR, methods. 2001,383-385.
Schneider, H., Schwiertz, A., Collins, M.D., Blaut, M., 1999. Anaerobic transformation of quercetin-3-glucoside by
bacteria from the human intestinal tract. Arch. Microbiol. 171,81-91.
Sembries, S., Dongowski, G., Mehrlander, K., Will, F., Dietrich, H., 2004. Dietary fiber-rich colloids from apple
pomace extraction juices do not affect food intake and blood serum lipid levels, but enhance fecal excretion of
steroids in rats. J. Nutr. Biochem. 15,296-302.
Sigma Stat, User’s Manual, 1995, Version 5.0, Jandel Scientific Software, Chicago.
Stoll, K., Der Apfel, 1997, Verlag Negiri, Zürich. In Germany.
Souquet, J.M,, Labarbe, B., Le Guerneve, C., Cheynier, V., Moutounet, M., 2000. Phenolic composition of grape
stems. J. Agric. Food. Chem. 48,1076-80.
109
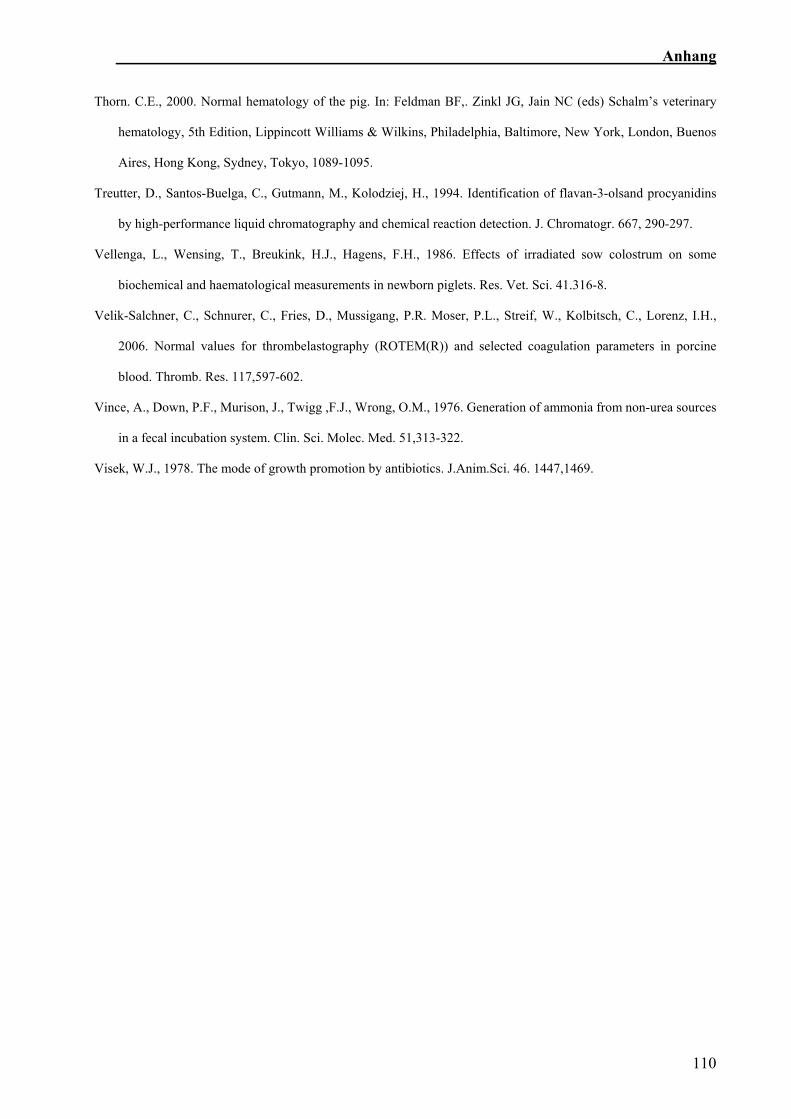
Anhang
Thorn. C.E., 2000. Normal hematology of the pig. In: Feldman BF,. Zinkl JG, Jain NC (eds) Schalm’s veterinary
hematology, 5th Edition, Lippincott Williams & Wilkins, Philadelphia, Baltimore, New York, London, Buenos
Aires, Hong Kong, Sydney, Tokyo, 1089-1095.
Treutter, D., Santos-Buelga, C., Gutmann, M., Kolodziej, H., 1994. Identification of flavan-3-olsand procyanidins
by high-performance liquid chromatography and chemical reaction detection. J. Chromatogr. 667, 290-297.
Vellenga, L., Wensing, T., Breukink, H.J., Hagens, F.H., 1986. Effects of irradiated sow colostrum on some
biochemical and haematological measurements in newborn piglets. Res. Vet. Sci. 41.316-8.
Velik-Salchner, C., Schnurer, C., Fries, D., Mussigang, P.R. Moser, P.L., Streif, W., Kolbitsch, C., Lorenz, I.H.,
2006. Normal values for thrombelastography (ROTEM(R)) and selected coagulation parameters in porcine
blood. Thromb. Res. 117,597-602.
Vince, A., Down, P.F., Murison, J., Twigg ,F.J., Wrong, O.M., 1976. Generation of ammonia from non-urea sources
in a fecal incubation system. Clin. Sci. Molec. Med. 51,313-322.
Visek, W.J., 1978. The mode of growth promotion by antibiotics. J.Anim.Sci. 46. 1447,1469.
110
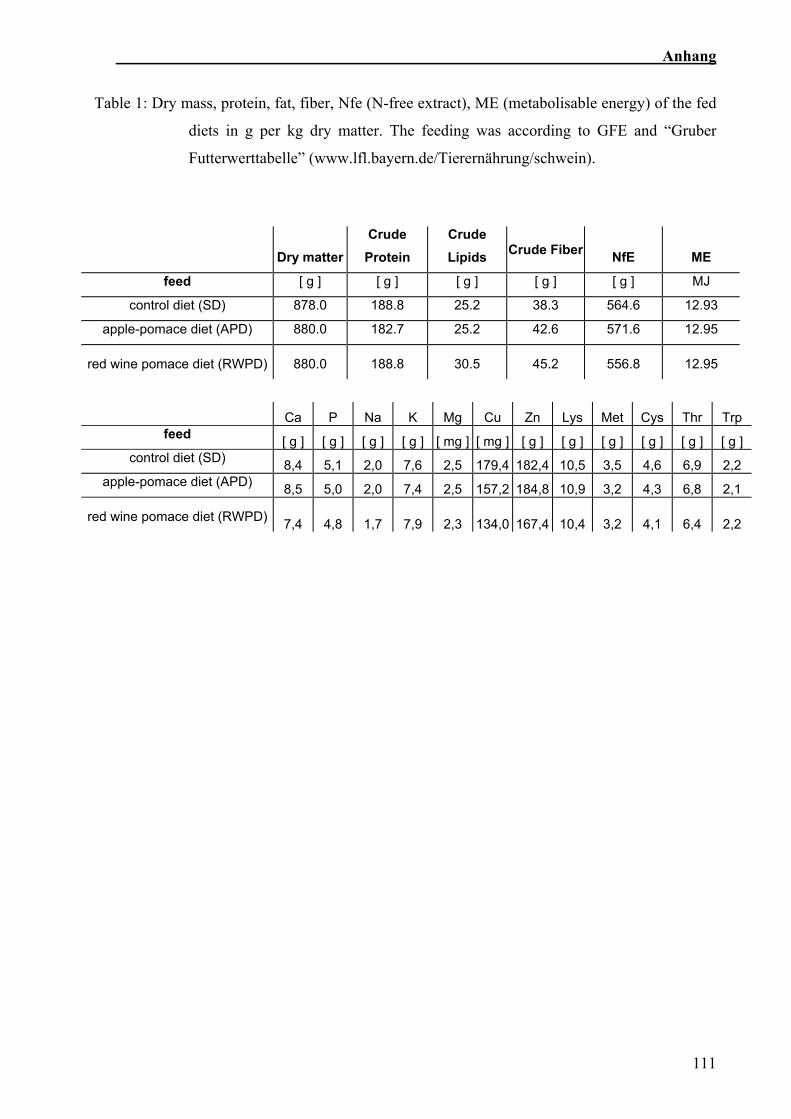
Anhang
Table 1: Dry mass, protein, fat, fiber, Nfe (N-free extract), ME (metabolisable energy) of the fed
diets in g per kg dry matter. The feeding was according to GFE and “Gruber
Futterwerttabelle” (www.lfl.bayern.de/Tierernährung/schwein).
Dry matterCrude Protein
Crude Lipids Crude Fiber NfE ME
feed [ g ] [ g ] [ g ] [ g ] [ g ] MJ
control diet (SD) 878.0 188.8 25.2 38.3 564.6 12.93
apple-pomace diet (APD) 880.0 182.7 25.2 42.6 571.6 12.95
red wine pomace diet (RWPD) 880.0 188.8 30.5 45.2 556.8 12.95
Ca P Na K Mg Cu Zn Lys Met Cys Thr Trp feed [ g ] [ g ] [ g ] [ g ] [ mg ] [ mg ] [ g ] [ g ] [ g ] [ g ] [ g ] [ g ]
control diet (SD) 8,4 5,1 2,0 7,6 2,5 179,4 182,4 10,5 3,5 4,6 6,9 2,2 apple-pomace diet (APD) 8,5 5,0 2,0 7,4 2,5 157,2 184,8 10,9 3,2 4,3 6,8 2,1
red wine pomace diet (RWPD) 7,4 4,8 1,7 7,9 2,3 134,0 167,4 10,4 3,2 4,1 6,4 2,2
111
Anhang
Table 2: Sequence of the used forward and reverse primers for one-step qRT-PCR.
gene forward primer reverse primer
Histon H3 act ggc tac aaa agc cgc tc act tgc ctc ctg caa agc ac
TNF alpha ccc cca gaa gga aga gtt tc ttg gcc cct gaa gag gac
IL 10 act tta agg gtt acc tgg gtt g gta gac acc cct ctc ttg ga
NFκB ggt gga gaa ctt tga gcc tc cca gag acc tca tag ttg tcc
Caspase3 tgt gtg ctt cta agc cat gg agt tct gtg cct cgg cag
CyclinD1 tcc tgt gct gcg aag tgg a ggt cca ggt agt tca tgg c
112
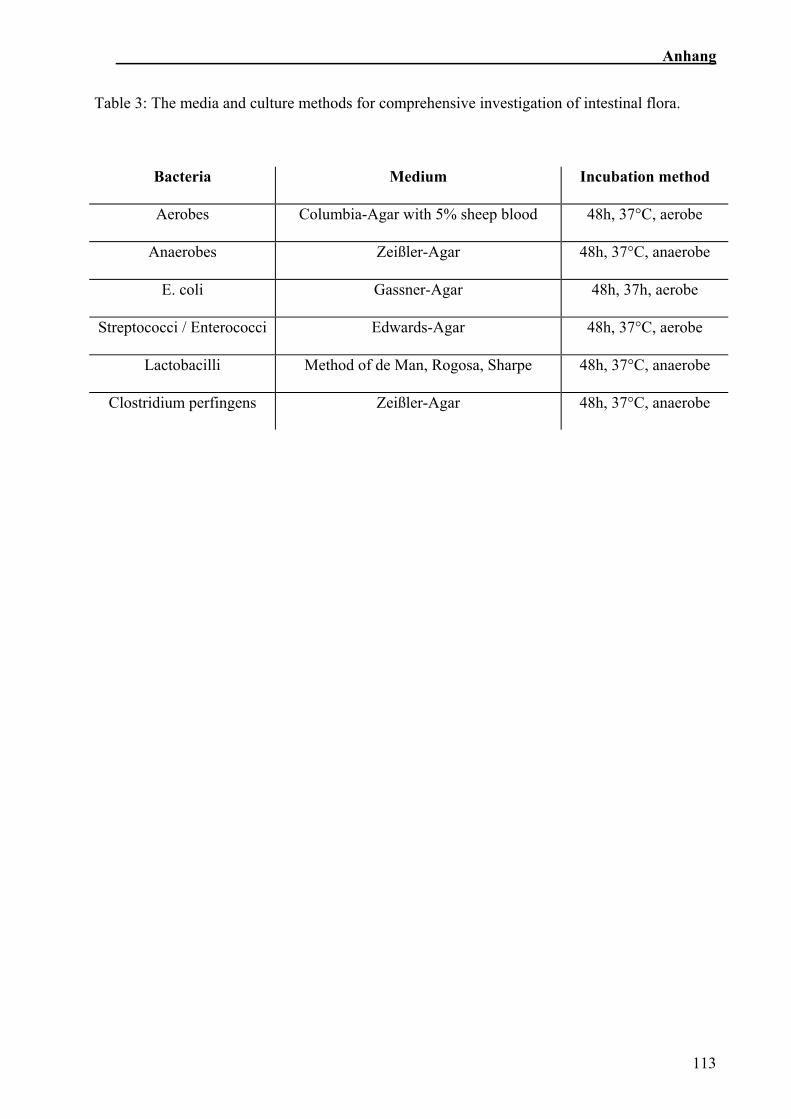
Anhang
Table 3: The media and culture methods for comprehensive investigation of intestinal flora.
Bacteria Medium Incubation method
Aerobes Columbia-Agar with 5% sheep blood 48h, 37°C, aerobe
Anaerobes Zeißler-Agar 48h, 37°C, anaerobe
E. coli Gassner-Agar 48h, 37h, aerobe
Streptococci / Enterococci Edwards-Agar 48h, 37°C, aerobe
Lactobacilli Method of de Man, Rogosa, Sharpe 48h, 37°C, anaerobe
Clostridium perfingens Zeißler-Agar 48h, 37°C, anaerobe
113
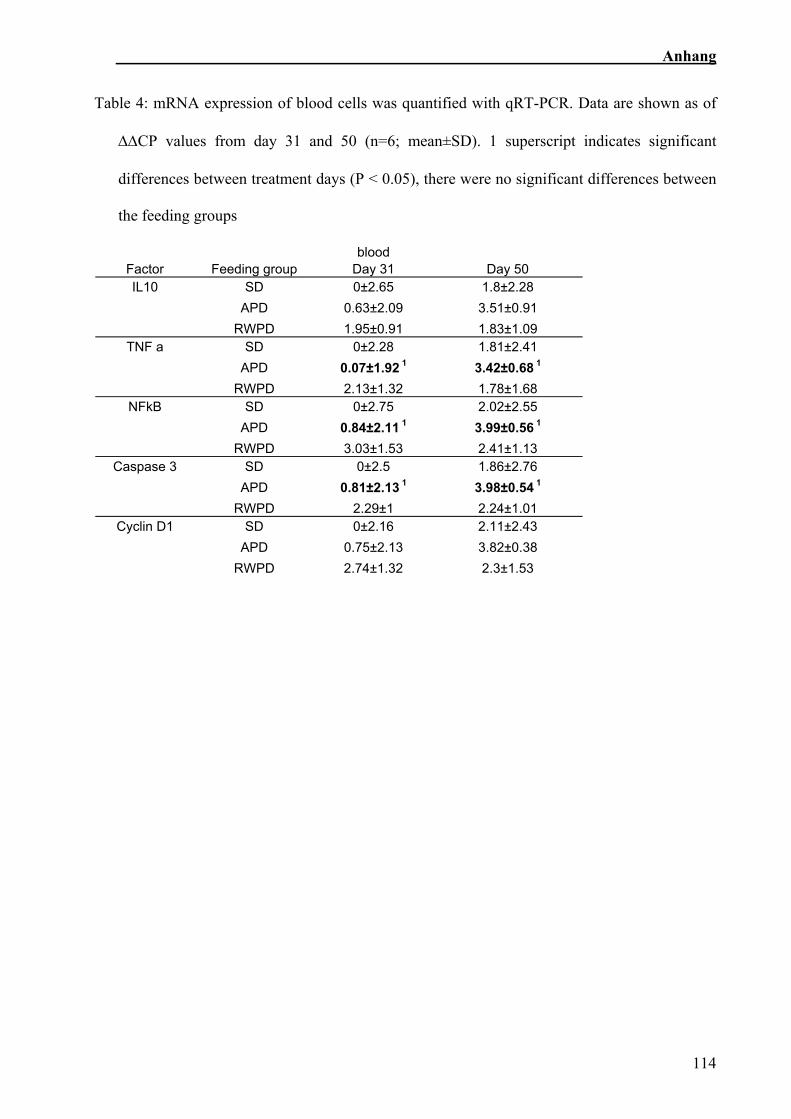
Anhang
Table 4: mRNA expression of blood cells was quantified with qRT-PCR. Data are shown as of
∆∆CP values from day 31 and 50 (n=6; mean±SD). 1 superscript indicates significant
differences between treatment days (P < 0.05), there were no significant differences between
the feeding groups
blood Factor Feeding group Day 31 Day 50 IL10 SD 0±2.65 1.8±2.28
APD 0.63±2.09 3.51±0.91 RWPD 1.95±0.91 1.83±1.09
TNF a SD 0±2.28 1.81±2.41 APD 0.07±1.92 1 3.42±0.68 1 RWPD 2.13±1.32 1.78±1.68
NFkB SD 0±2.75 2.02±2.55 APD 0.84±2.11 1 3.99±0.56 1 RWPD 3.03±1.53 2.41±1.13
Caspase 3 SD 0±2.5 1.86±2.76 APD 0.81±2.13 1 3.98±0.54 1 RWPD 2.29±1 2.24±1.01
Cyclin D1 SD 0±2.16 2.11±2.43 APD 0.75±2.13 3.82±0.38 RWPD 2.74±1.32 2.3±1.53
114
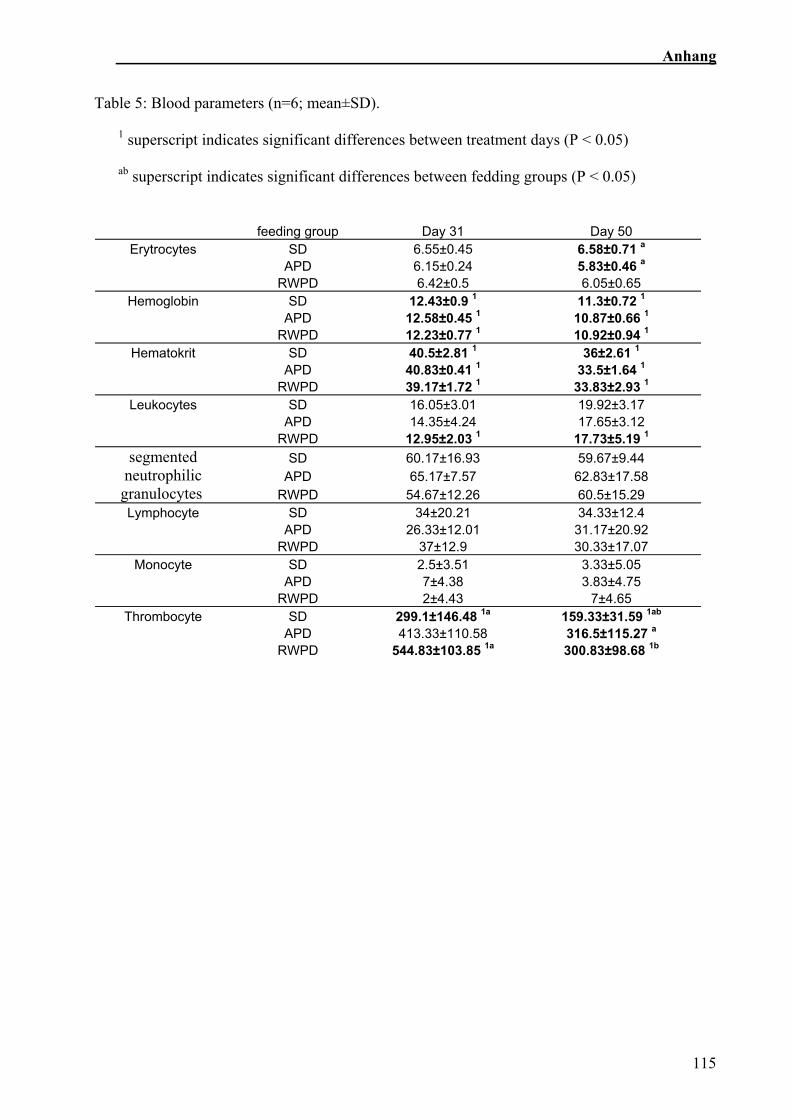
Anhang
Table 5: Blood parameters (n=6; mean±SD).
1 superscript indicates significant differences between treatment days (P < 0.05)
ab superscript indicates significant differences between fedding groups (P < 0.05)
feeding group Day 31 Day 50
Erytrocytes SD 6.55±0.45 6.58±0.71 a APD 6.15±0.24 5.83±0.46 a RWPD 6.42±0.5 6.05±0.65
Hemoglobin SD 12.43±0.9 1 11.3±0.72 1 APD 12.58±0.45 1 10.87±0.66 1 RWPD 12.23±0.77 1 10.92±0.94 1
Hematokrit SD 40.5±2.81 1 36±2.61 1 APD 40.83±0.41 1 33.5±1.64 1 RWPD 39.17±1.72 1 33.83±2.93 1
Leukocytes SD 16.05±3.01 19.92±3.17 APD 14.35±4.24 17.65±3.12 RWPD 12.95±2.03 1 17.73±5.19 1
segmented SD 60.17±16.93 59.67±9.44 neutrophilic APD 65.17±7.57 62.83±17.58 granulocytes RWPD 54.67±12.26 60.5±15.29 Lymphocyte SD 34±20.21 34.33±12.4
APD 26.33±12.01 31.17±20.92 RWPD 37±12.9 30.33±17.07
Monocyte SD 2.5±3.51 3.33±5.05 APD 7±4.38 3.83±4.75 RWPD 2±4.43 7±4.65
Thrombocyte SD 299.1±146.48 1a 159.33±31.59 1ab APD 413.33±110.58 316.5±115.27 a RWPD 544.83±103.85 1a 300.83±98.68 1b
115
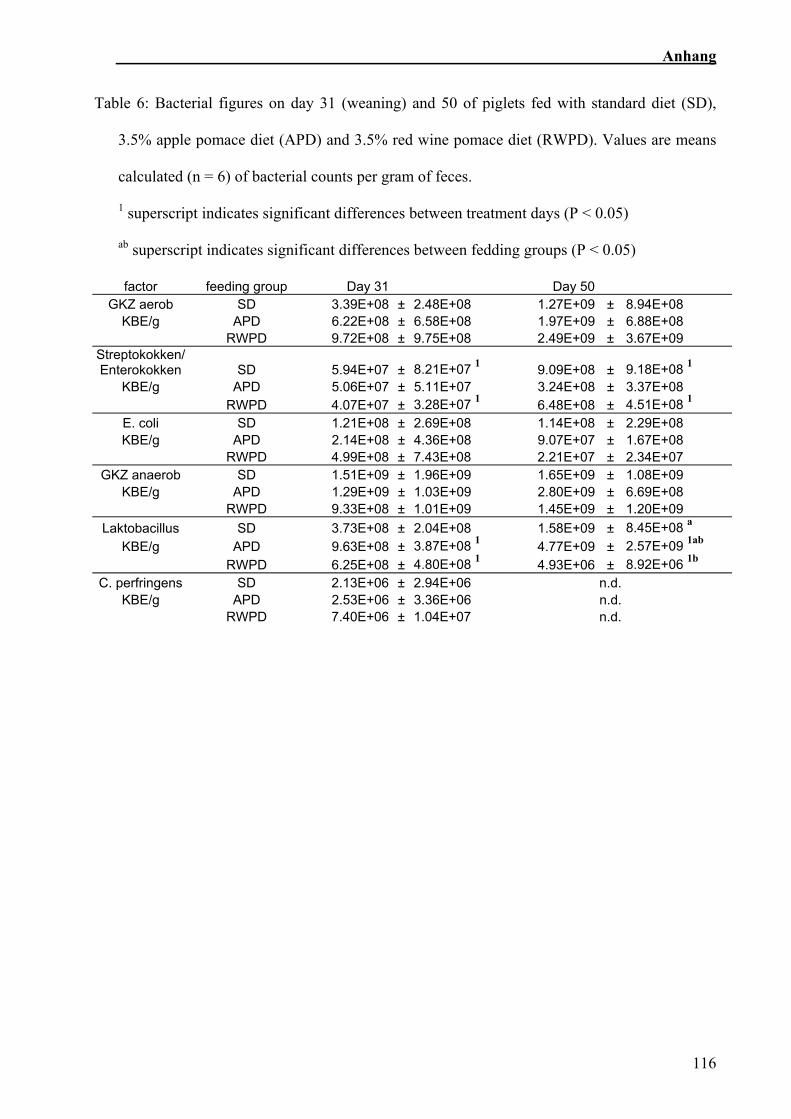
Anhang
Table 6: Bacterial figures on day 31 (weaning) and 50 of piglets fed with standard diet (SD),
3.5% apple pomace diet (APD) and 3.5% red wine pomace diet (RWPD). Values are means
calculated (n = 6) of bacterial counts per gram of feces.
1 superscript indicates significant differences between treatment days (P < 0.05)
ab superscript indicates significant differences between fedding groups (P < 0.05)
factor feeding group Day 31 Day 50 GKZ aerob SD 3.39E+08 ± 2.48E+08 1.27E+09 ± 8.94E+08
KBE/g APD 6.22E+08 ± 6.58E+08 1.97E+09 ± 6.88E+08 RWPD 9.72E+08 ± 9.75E+08 2.49E+09 ± 3.67E+09
Streptokokken/ Enterokokken SD 5.94E+07 ± 8.21E+07 1 9.09E+08 ± 9.18E+08 1
KBE/g APD 5.06E+07 ± 5.11E+07 3.24E+08 ± 3.37E+08 RWPD 4.07E+07 ± 3.28E+07 1 6.48E+08 ± 4.51E+08 1
E. coli SD 1.21E+08 ± 2.69E+08 1.14E+08 ± 2.29E+08 KBE/g APD 2.14E+08 ± 4.36E+08 9.07E+07 ± 1.67E+08
RWPD 4.99E+08 ± 7.43E+08 2.21E+07 ± 2.34E+07 GKZ anaerob SD 1.51E+09 ± 1.96E+09 1.65E+09 ± 1.08E+09
KBE/g APD 1.29E+09 ± 1.03E+09 2.80E+09 ± 6.69E+08 RWPD 9.33E+08 ± 1.01E+09 1.45E+09 ± 1.20E+09
Laktobacillus SD 3.73E+08 ± 2.04E+08 1.58E+09 ± 8.45E+08 a KBE/g APD 9.63E+08 ± 3.87E+08 1 4.77E+09 ± 2.57E+09 1ab
RWPD 6.25E+08 ± 4.80E+08 1 4.93E+06 ± 8.92E+06 1b C. perfringens SD 2.13E+06 ± 2.94E+06 n.d.
KBE/g APD 2.53E+06 ± 3.36E+06 n.d. RWPD 7.40E+06 ± 1.04E+07 n.d.
116
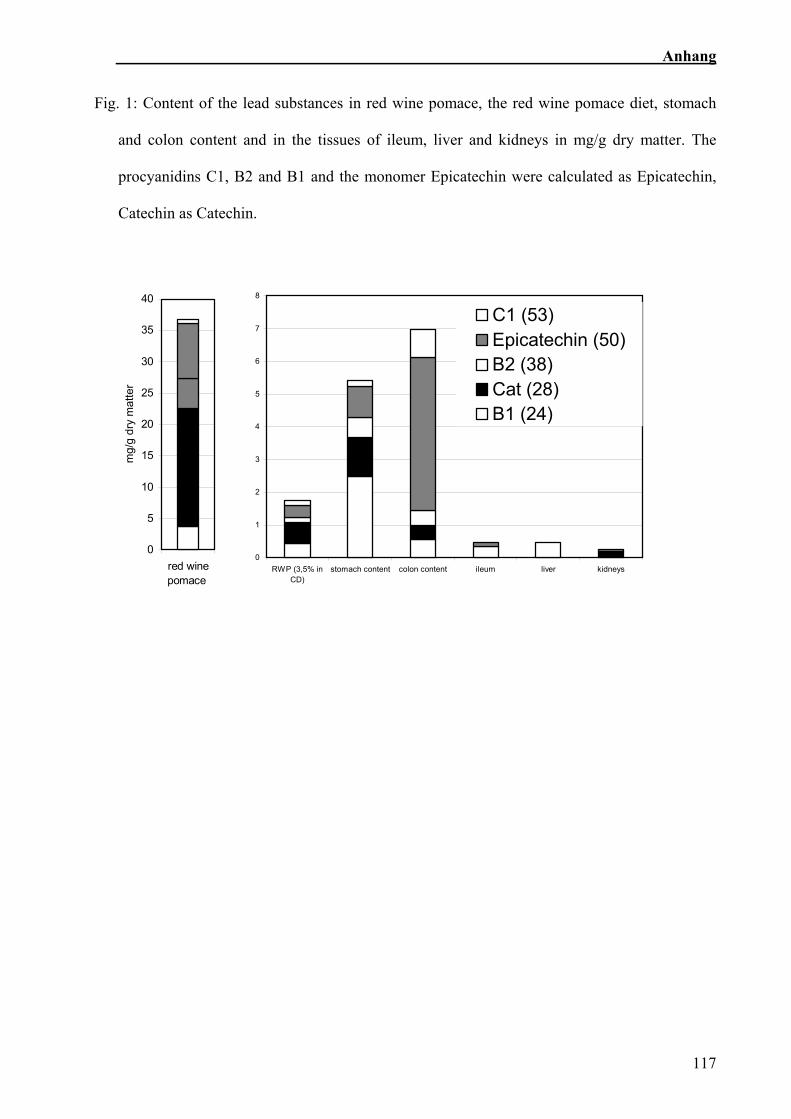
Anhang
Fig. 1: Content of the lead substances in red wine pomace, the red wine pomace diet, stomach
and colon content and in the tissues of ileum, liver and kidneys in mg/g dry matter. The
procyanidins C1, B2 and B1 and the monomer Epicatechin were calculated as Epicatechin,
Catechin as Catechin.
0
5
10
15
20
25
30
35
40
red winepomace
mg/
g dr
y m
atte
r
0
1
2
3
4
5
6
7
8
RWP (3,5% inCD)
stomach content colon content ileum liver kidneys
C1 (53)Epicatechin (50)B2 (38)Cat (28)B1 (24)
117
Top Related