


Languages
Pages
Legal


Effect of Surface Wettability on the
Defrost Process
A Dissertation
SUBMITTED TO THE FACULTY OF
UNIVERSITY OF MINNESOTA
BY
Yang Liu
IN PARTIAL FULFILLMENT OF THE REQUIREMENTS
FOR THE DEGREE OF
DOCTOR OF PHILOSOPHY
Francis A. Kulacki, Adviser
January 2017

© Yang Liu 2017
ALL RIGHTS RESERVED

i
Acknowledgements
I would like to express my sincere gratitude to Professor Francis A. Kulacki for providing
me opportunity to pursue the graduate education, for motivating me to generate new ideas
and apply the ideas to application, for discussing with me my research ideas and thesis
development, for encouraging me and showing patience when I have difficulties in my
research progress.
I want to thank my colleagues William Francis Mohs and Danimae Janssen for
sharing their experience on the frost and defrost research. I also want to express my
appreciation to Thermo King\Ingersoll Rand for providing partial funding to the research.
I would like to thank Professor Terry Simon and Professor Cari Dutcher from the
Mechanical Engineering department and Professor Vaughan Voller from the Civil
Engineering department for taking their time to serve on my committee and critically
evaluating this work.
Finally, I want to thank my family for their understanding and encouragement.
Without the support from my family, I could not have dedicated myself to the long and
hard journey exploring the nature of the problem.

ii
Abstract
Frost formation and anti-icing methods are studied in a variety of areas for
decades. In refrigeration systems, a number of studies are focused on the influence of
surface treatment on delaying the time of frost formation. There are far fewer studies on
the effect of surface wettability on the defrost process. Some of the literature show
experimental results on defrost time for different surfaces, but the results could be
different based on individual experimental conditions.
In this study, the influences of surface wettability on the defrost process are
investigated analytically. The melting process is divided into three stages based on the
behaviors of the meltwater. The water saturation and meltwater draining velocity are
formulated for absorption and drainage stages separately. The comparison among the
melting rate, the permeation rate, and the draining velocity determines the meltwater
behavior, which influences the defrost process and defrost mechanisms. The slumping
condition is a special phenomenon in the melting process and can be a potential method
for frost removal. Water accumulation at the surface decreases the adherence strength of
the frost column to the surface. A slumping criterion is formulated based on the analysis
of interfacial forces and the body force on the frost column. The slumping condition of
the model depends on the contact angle on hydrophilic surfaces and on the contact angle
hysteresis on hydrophobic surfaces.
Experiments of frost and defrost process on vertical surfaces with different
wetting conditions are conducted on a lab-build setup. The experimental results show
that defrost time and efficiency are determined by the system design, the heating methods,
the heat flux applied at the surface and the surface wettability. Defrost mechanisms vary
with surface wettability. During the defrost process, a frost column detaches from a
superhydrophobic surface and falls off as a whole piece. While on the superhydrophilic
and plain surfaces, frost melts, and water film or retention evaporates. Defrost time and
efficiency are not significantly different on the tested surfaces at the point that frost melts
and water film/retention droplets remain on the surfaces. However, defrost time and

iii
efficiency are improved noticeably on the superhyrophobic surface for a complete defrost
process in which the water evaporation time is included.
This research serves as a supplement to current studies on the effect of surface
wettability in refrigeration systems. In application, the preference to the different surface
wettability depends on the practical operation requirements and the actual system design.

iv
Table of Contents
List of Tables .................................................................................................................. vii
List of Figures ................................................................................................................ viii
Nomenclature ................................................................................................................. xii
1 Introduction ....................................................................................................................1
2 Literature Review ...........................................................................................................3
2.1 Frost formation.........................................................................................................3
2.1.1 Frost nucleation .................................................................................................3
2.1.2 Experiments and correlations ............................................................................4
2.1.3 Analytical models .............................................................................................6
2.2 Frost growth on wetted surface ................................................................................7
2.2.1 Frost properties on wetted surface ....................................................................8
2.2.2 Effect of surface wettability on frost formation ................................................8
2.2.3 Analytical studies ............................................................................................11
2.3 Defrost process.......................................................................................................12
2.3.1 Effect of surface wettability on defrost process ..............................................12
2.3.2 Frost release and condensation retention ........................................................16
2.3.3 Defrost models ................................................................................................19
2.3.4 Ice adhesion .....................................................................................................23
2.4 Summary ................................................................................................................25
3 Model Development and Mathematical Formulation ...................................................27
3.1 Melting model ........................................................................................................27
3.2 Mathematical formulation of the melting stages ...................................................28
3.2.1 Absorption .......................................................................................................28
3.2.2 Accumulation ..................................................................................................34
3.2.3 Drainage stage .................................................................................................35
3.3 Slumping criterion .................................................................................................40
3.3.1 Force balance during absorption .....................................................................42
3.3.2 Force balance during accumulation ................................................................43
3.3.3 Force balance during draining .........................................................................45

v
4 Solution Methods ..........................................................................................................46
4.1 Melting stages ........................................................................................................46
4.1.1 Absorption .......................................................................................................46
4.1.2 Accumulation ..................................................................................................50
4.1.3 Drainage stage .................................................................................................50
4.2 Slumping criterion .................................................................................................54
4.2.1 Scale analysis during absorption .....................................................................54
4.2.2 Scale analysis during accumulation ................................................................54
4.2.3 Scale analysis during drainage ........................................................................55
5 Experimental Design ....................................................................................................57
5.1 Experimental objectives and apparatus ..................................................................57
5.2 Design analysis ......................................................................................................59
5.2.1 Test plate dimensions ......................................................................................59
5.2.2 Film heater ......................................................................................................60
5.2.3 Chamber energy balance .................................................................................60
5.2.4 Heat transfer coefficient ..................................................................................62
5.2.5 Heat flux at the test surface .............................................................................63
5.2.6 Heat sink .........................................................................................................66
5.2.7 Thermoelectric module ...................................................................................68
5.2.8 Insulation .........................................................................................................69
5.3 Data acquisition and uncertainty analysis ..............................................................70
5.3.1 Data acquisition set .........................................................................................70
5.3.2 Measurement methods ....................................................................................71
5.3.3 Experimental uncertainty ................................................................................72
5.4 Surface preparation ................................................................................................74
6 Results ..........................................................................................................................76
6.1 Analytical and numerical results ............................................................................76
6.2 Slumping criterion .................................................................................................90
6.3 Experimental results...............................................................................................95
6.4 Comparison between physical model and experiments .......................................118

vi
7 Conclusions and Future Work ....................................................................................119
7.1 Conclusions ..........................................................................................................119
7.2 Future work ..........................................................................................................121
References .....................................................................................................................124
Appendix A Test apparatus ...........................................................................................131
Appendix B Design drawings ........................................................................................133
Appendix C Measurement instruments .........................................................................140
Appendix D Experimental procedure ............................................................................141
D.1 Large chamber operations ...................................................................................141
D.2 Small chamber operations ...................................................................................142
Appendix E Slumping images .......................................................................................144

vii
List of Tables
Table 2.1. Wettability effect on the frost/defrost process. ............................................. 15
Table 3.1. Mass composition during melting process. ................................................... 28
Table 3.2. Failure modes of frost layer. .......................................................................... 41
Table 5.1. Relation of frost properties with the test conditions. ..................................... 60
Table 5.2. Instrument accuracies. ................................................................................... 72
Table 5.3. Uncertainty of dependent variables. .............................................................. 73
Table 5.4. Characterization of the sample surfaces. ....................................................... 74
Table 6.1. Comparison of drainage velocity and average drainage rate. ....................... 81
Table 6.2. Test samples numbering. ............................................................................... 96
Table 6.3. Frost formation conditions. ........................................................................... 97
Table 6.4. Frost properties. ........................................................................................... 102
Table 6.5. Defrost properties for test surfaces 38 mm x 38 mm. ................................. 107
Table 6.6. Defrost properties for test surfaces 50 mm x 50 mm. ................................. 115
Table A.1.Test apparatus for test surface 50 x 50 mm….….…………………………131
Table A.2.Test apparatus for test surface 38 x 38 mm…………………………………132
Table C.1. Measurement instruments………………………………………………….140

viii
List of Figures
Figure 2.1. Comparison of frost deposition on the coated and uncoated surfaces [29]. .. 9
Figure 2.2. Effect of surface contact angle: (a) frosting and (b) defrosting behavior [41].
........................................................................................................................................ 13
Figure 3.1. A general illustration of the initial frost column. ......................................... 29
Figure 3.2. CV in the permeation layer during absorption. ............................................ 30
Figure 3.3. CV in frost layer during the absorption. ...................................................... 33
Figure 3.4. Heat and mass transfer during accumulation. .............................................. 35
Figure 3.5. Drainage model. ........................................................................................... 36
Figure 3.6. Heat and mass transfer during drainage for a vertical frost surface. ............ 37
Figure 3.7. Definition of the slip length for a simple shear flow [98]. ........................... 39
Figure 3.8. The scheme and mechanisms of frost slumping. ......................................... 41
Figure 3.9. Force balance during absorption. ................................................................. 42
Figure 3.10. Force balance during accumulation. .......................................................... 43
Figure 3.11. Surface tension on hydrophobic surfaces. .................................................. 44
Figure 3.12. Force balance during drainage. .................................................................. 45
Figure 5.1. Experimental set-up. .................................................................................... 58
Figure 5.2. Chamber volume versus chamber temperature ............................................ 61
Figure 5.3. Local Nusselt number at constant heat flux ................................................. 64
Figure 5.4. Local heat transfer coefficient at constant heat flux .................................... 64
Figure 5.5. Heat transfer coefficient versus temperature difference between the test plate
and surrounding under free convection where Pr = 0.7, L = 5.5 cm. ............................. 65
Figure 5.6. Heat flux at test surface. ............................................................................... 67
Figure 5.7. Static contact angles. .................................................................................... 75
Figure 5.8. Dynamic contact angles. .............................................................................. 75
Figure 6.1. The rate of melting versus porosity qs” = 3000 W/m2. ................................ 77
Figure 6.2. The rate of melting versus heat flux applied at the test surface ε = 0.4. ...... 77
Figure 6.3. Water saturation versus time qs” = 3000 W/m2, ε = 0.6, δf = 5 mm, p = 3, q =
1, K = 3x10-12 m2, C = 43 Pa. ......................................................................................... 78

ix
Figure 6.4. Water saturation versus location qs” = 3000 W/m2, ε = 0.6, δf = 5 mm, p = 3,
q = 1, K = 3x10-12 m2, C = 43 Pa. ................................................................................... 78
Figure 6.5. Dimensionless temperature of frost layer versus time qs” = 3000 W/m2, ε =
0.7, δf = 5 mm, ha = 5 W/m2-K.. ..................................................................................... 79
Figure 6.6. Dimensionless temperature distribution in frost layer qs” = 3000 W/m2, ε =
0.7, δf = 5 mm, ha = 5 W/m2-K. ...................................................................................... 79
Figure 6.7. Comparison of draining velocities with different boundary conditions α = 1.2,
K = 10-9 m2, b = 20 µm. .................................................................................................. 80
Figure 6.8. The effect of slip length on the draining velocity. ....................................... 82
Figure 6.9. Melting time versus the initial frost thickness qs” = 3000 W/m2, Ta = -5C.. 83
Figure 6.10. Melting time versus ambient temperature qs” = 3000 W/m2, δf0 = 3 mm. . 83
Figure 6.11. The relation of draining time with porosity H = 38 mm. ........................... 84
Figure 6.12. The relation of draining time with the initial frost thickness H = 38 mm .. 84
Figure 6.13. The relation of draining time with the height of test plate δf0 = 3 mm. ..... 85
Figure 6.14. The relation of draining time with the water film thickness H = 38 mm ... 85
Figure 6.15. The relation of defrost time with the porosity qs” = 8000 W/m2. H = 380 mm.
δw = 0.3 mm. ................................................................................................................... 87
Figure 6.16. The relation of defrost time with the porosity qs” = 8000 W/m2. H = 380 mm.
δw = 0.6 mm. ................................................................................................................... 87
Figure 6.17. The relation of defrost time with the porosity qs” = 3000 W/m2. H = 38 mm.
δw = 0.3 mm. ................................................................................................................... 88
Figure 6.18. The relation of defrost time with the porosity qs” = 3000 W/m2. H = 380 mm.
δw = 0.3 mm. ................................................................................................................... 88
Figure 6.19. Comparison of the draining time with different boundary conditions H = 380
mm. δw = 0.3 mm. ........................................................................................................... 89
Figure 6.20. Comparison of defrost time with different boundary conditions qs” = 3000
W/m2. H = 380 mm. δw = 0.3 mm. ................................................................................. 89
Figure 6.21. Force ratio versus porosity W = 38 mm. δf0 = 3 mm. r = 1. CA=20°......... 91
Figure 6.22. Force ratio versus aspect ratio of the test plate W = 38 mm. δf0 = 3 mm. ε =
0.6. CA=20°. ................................................................................................................... 91

x
Figure 6.23. Force ratio versus temperature at the surface W = 38 mm. δf0 = 3 mm. r =
1.2, ε = 0.6. CA = 20°.. ................................................................................................... 92
Figure 6.24. Force ratio versus contact angle on hydrophilic surfaces W = 38 mm. δf0 = 3
mm. r = 1.2, ε = 0.7 ........................................................................................................ 93
Figure 6.25. Force ratio versus receding contact angle on hydrophobic surfaces W = 38
mm. δf0 = 3 mm. r = 1.5, ε = 0.7. .................................................................................... 93
Figure 6.26. Force ratio versus porosity and contact angle W = 38 mm. δf0 = 3 mm. r =
1.2. .................................................................................................................................. 94
Figure 6.27. Force ratio versus aspect ratio and contact angle W = 38 mm. δf0 = 3 mm., ε
= 0.7. ............................................................................................................................... 94
Figure 6.28. Front view of the frost formation at test surface (TestID-1) ...................... 96
Figure 6.29. Side view of the frost formation at test surface (TestID-1) ....................... 97
Figure 6.30. Front view of the frost formation at test surface (TestID-2) ...................... 98
Figure 6.31. Side view of the frost formation at test surface (TestID-2) ....................... 99
Figure 6.32. Front view of the frost formation at test surface (TestID-3) .................... 100
Figure 6.33. Side view of the frost formation at test surface (TestID-3) ..................... 101
Figure 6.34. Frost mass versus frost growth period. .................................................... 102
Figure 6.35. Defrost process after frost grows for 4 h (TestID-1). .............................. 104
Figure 6.36. Defrost process after frost grows for 4 h (TestID-2). .............................. 105
Figure 6.37. Frost slumping process after frost grows for 6 h (TestID-3). .................. 106
Figure 6.38. Heat flux applied at the test plate (TestID-3) where direct current (DC) sets
at 12V/5A. .................................................................................................................... 107
Figure 6.39. Temperature difference between the heat flux sensor and the test plate
(TestID-3) where DC sets at 12V/5A. .......................................................................... 108
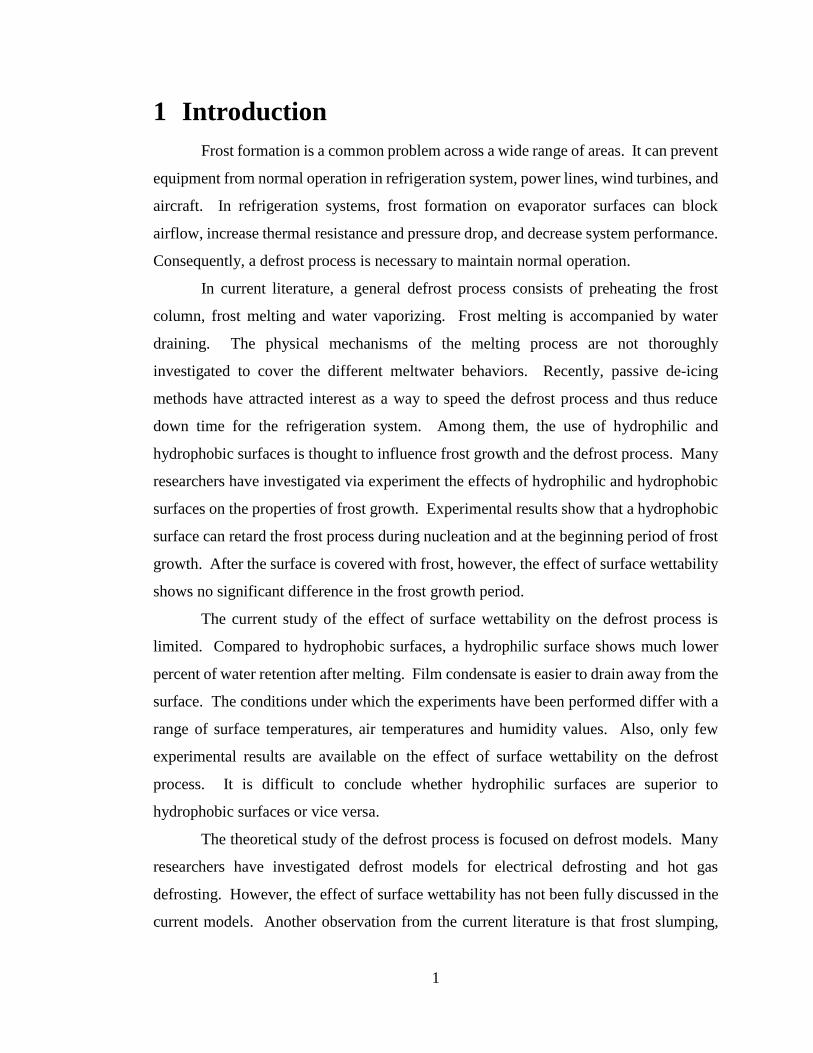
Figure 6.40. Temperature at the test plate (TestID-2) during the defrost period where DC
sets at 12V/5A. ............................................................................................................. 108
Figure 6.41. Temperature at the test plate (TestID-3) during the defrost period where DC
sets at 12V/5A. ............................................................................................................. 109
Figure 6.42. Temperature inside the chamber during the defrost period where DC sets at
12V/5A. ........................................................................................................................ 110

xi
Figure 6.43. Defrost time versus average heat flux at TestID-3 where frost grows for 4 h.
...................................................................................................................................... 111
Figure 6.44. Defrost efficiency versus average heat flux at TestID-3 where frost grows
for 4 h. .......................................................................................................................... 111
Figure 6.45. Defrost time versus mass on wet surface where heating power sets at 60 W.
...................................................................................................................................... 112
Figure 6.46. Defrost time versus mass on dry surface where heating power sets at 60 W.
...................................................................................................................................... 112
Figure 6.47. Defrost efficiency versus mass on wet surface where heating power sets at
60 W. ............................................................................................................................ 114
Figure 6.48. Defrost efficiency versus mass on dry surface where heating power sets at
60 W. ............................................................................................................................ 114
Figure 6.49. Defrost time versus mass on wet surface where actual heating power is 7.7
W. ................................................................................................................................. 116
Figure 6.50. Defrost time versus mass on dry surface where actual heating power is 7.7
W. ................................................................................................................................. 116
Figure 6.51. Defrost efficiency versus mass on wet surface where actual heating power is
7.7 W. ........................................................................................................................... 117
Figure 6.52. Defrost efficiency versus mass on dry surface where actual heating power is
7.7 W. ........................................................................................................................... 117
Figure E.1. Frost slumping process after frost grows for 4 h (TestID-3) ………………140

xii
Nomenclature
b slip length [m]
bl gap between fins [m]
cp specific heat at constant pressure [J kg-1 K-1]
g gravitational acceleration [m s-2]
h heat transfer coefficient [W m-2 K-1]
k thermal conductivity [W m-1 K-1]
m mass [kg]
m” mass flux [kg s-1 m-2]
p permeability power law constant
q capillary pressure power law constant
q” heat flux [W m-2]
r aspect ratio of the width to the length
t time [s]
t+ dimensionless time
u velocity in x-direction [m s-1]
u+ dimensionless velocity
us slip velocity [m s-1]
uB velocity at the water/permeation interface [m s-1]
v velocity in y-direction [m s-1]
x direction parallel to gravity [m]
x+ dimensionless location
y direction normal to the test surface [m]
vb bulk flow rate [m s-1]
vs slip velocity [m s-1]
A area [m2]
Bi Biot number, hLc/k
C entry capillary pressure [N m-2]
CAH contact angle hysteresis [°]

xiii
CFM cubic feet per minute
D diameter [m]
F force [N]
FR force ratio of gravity to surface tension
Fr Froude number, u/(gl)1/2
G gravity [N]
Gr Grashof number
H height [m]
K permeability or intrinsic permeability [m2]
L length [m]
Lf latent heat of fusion [kJ kg-1]
Nu Nusselt number
P pressure [Pa]
P+ dimensionless pressure
Pca capillary pressure
Pr Prandtl number
Pwr power [W]
Q heat transfer [J]
T temperature [K]
U Characteristic velocity [m s-1]
V volume [m3]
W width [m]
Re Reynolds number
Rth thermal resistance [W K-1]
S water saturation, the volume fraction of water to the pore volume
Greek symbols
α thermal diffusivity [m2s-1]
β dimensionless parameter depending on the material
δ thickness [m]

xiv
ε porosity
η efficiency
θ contact angle [degree]
Θ Dimensionless temperature
ϕ slope angle (degree)
Φ relative humidity
μ dynamic viscosity [N s m-2]
μs average viscosity of the near-to-wall layer [N s m-2]
ρ density [kg m-3]
γ surface tension [J m-2 or N m-1]
τ shear stress [N m-2]
ω filtering velocity of water in the permeation layer [m s-1]
Ω volumetric flow rate [m3 s-1]
Subscripts
0 initial
a air
adv advancing
Al aluminum
avg average
b bulk
c cold
ca capillary
ch chamber
cond conduction
conv convection
d drain
df defrost
eff effective
f frost

xv
g gas
h hot
i ice
in input
kp key point
lat latent
m melt
p permeation
rec receding
s test surface
sat saturation
sen sensible
s-p solid/permeation interface
s-w solid/water interface
tot total
tp test plate
v vapor
w water
w-p interface at water film and permeation layer
1
1 Introduction
Frost formation is a common problem across a wide range of areas. It can prevent
equipment from normal operation in refrigeration system, power lines, wind turbines, and
aircraft. In refrigeration systems, frost formation on evaporator surfaces can block
airflow, increase thermal resistance and pressure drop, and decrease system performance.
Consequently, a defrost process is necessary to maintain normal operation.
In current literature, a general defrost process consists of preheating the frost
column, frost melting and water vaporizing. Frost melting is accompanied by water
draining. The physical mechanisms of the melting process are not thoroughly
investigated to cover the different meltwater behaviors. Recently, passive de-icing
methods have attracted interest as a way to speed the defrost process and thus reduce
down time for the refrigeration system. Among them, the use of hydrophilic and
hydrophobic surfaces is thought to influence frost growth and the defrost process. Many
researchers have investigated via experiment the effects of hydrophilic and hydrophobic
surfaces on the properties of frost growth. Experimental results show that a hydrophobic
surface can retard the frost process during nucleation and at the beginning period of frost
growth. After the surface is covered with frost, however, the effect of surface wettability
shows no significant difference in the frost growth period.
The current study of the effect of surface wettability on the defrost process is
limited. Compared to hydrophobic surfaces, a hydrophilic surface shows much lower
percent of water retention after melting. Film condensate is easier to drain away from the
surface. The conditions under which the experiments have been performed differ with a
range of surface temperatures, air temperatures and humidity values. Also, only few
experimental results are available on the effect of surface wettability on the defrost
process. It is difficult to conclude whether hydrophilic surfaces are superior to
hydrophobic surfaces or vice versa.
The theoretical study of the defrost process is focused on defrost models. Many
researchers have investigated defrost models for electrical defrosting and hot gas
defrosting. However, the effect of surface wettability has not been fully discussed in the
current models. Another observation from the current literature is that frost slumping,

2
which is the behavior of bulk mass peeling off the surface, is not analyzed theoretically
and experimentally. Slumping is a favorable phenomenon during the melting process. If
bulk mass peels off the surface during the defrost period, defrost time can be reduced
significantly, and the defrost efficiency would be improved greatly with less energy
consumption.
Motivated by these observations, the goal of this thesis is to develop an analytical
model of the defrost process with an emphasis on the effect of surface wettability. The
effect of surface wettability is expected to be significant during the melting period and to
have an effect on the initiation of slumping. The defrost model is governed by heat and
mass transfer within the frost layer, and the slumping model is dominated by the balance
of surface tension, adhesion and gravity. However, the two models are connected in
nature. Surface tension and ice adhesion are functions of temperature which can be
obtained from the defrost model.
The objectives of this research are to (a) formulate the analytical model to describe
the melting process with a good understanding of the physical mechanisms, (b) study the
effect of surface wettability on the defrost process, (c) investigate the criterion when
slumping might happen, and (d) test the defrost process on the different surface
wettability.
The effect of surface wettability on the defrost model is a new feature of this
research and has theoretical and practical importance. This study provides a
mathematical model with different meltwater behavior discussed and relates defrost time
and efficiency with the surface wettability. The slumping model is expected to provide a
new prospect on frost removal methods and might be applied to design and optimization
of refrigeration systems.

3
2 Literature Review
The defrost process initiates with a frost layer of a certain thickness and porosity.
A comprehensive review [1-26] of frost formation aids in formulating the physical and
thermal properties in the frost layer.
2.1 Frost formation
Frost formation involves nucleation, crystal growth and frost layer growth. The
present investigation of frost formation is focused on nucleation, empirical models and
correlations, and analytical models to predict frost growth.
2.1.1 Frost nucleation
Frost may form by either condensation of water vapor or by the freezing of liquid
water. The initiation of frost formation involves a nucleation process, which is divided
into two types, homogeneous nucleation and heterogeneous nucleation. Homogeneous
nucleation is also called spontaneous nucleation with water molecules combining
together to form a frost embryo. Heterogeneous nucleation occurs on foreign particles
and is more common in nature. The discussion herein refers to heterogeneous nucleation.
Frost nucleation may be affected by water vapor pressure, surface temperature
and surface energy. Na and Webb [1] analyze the thermodynamic process of nucleation
and conclude that super-saturation of water vapor is a requirement for frost nucleation.
They also point out that the degree of super-saturation1 depends on the surface energy2.
Lower energy surfaces require higher super-saturation for nucleation than higher energy
surfaces do. This analysis agrees with the experimental results. They test five kinds of
surfaces with different surface energy, or contact angle: hot water treated aluminum
surface, bare aluminum surface, transparent polymer packaging tape on the aluminum
surface, silicone wax coated aluminum surface, and Teflon coated aluminum surface.
Experiments show that frost formation starts at discrete points, and some regions are not
covered by frost at a certain temperature drop. This inhomogeneity results from different
local surface energy. They observe that surface roughness reduces the required super-
saturation for nucleation as the contact area between the nucleation embryo and the
1 Degree of super-saturation is the humidity ratio difference of the air stream and the surface. 2 Surface energy is the sum of all the excess energies of atoms at the surface.

4
substrate increases. The results imply the possibility to develop surfaces that may delay
frost formation.
The influence of contact angle on super-cooling degree3 is also reported by Piucco
et al. [2]. They put forward a nucleation model based on classical nucleation theory, in
which the minimum energy barrier of nucleation is expressed as a function of super-
saturation degree and contact angle. The model applies to smooth surfaces4. They also
show that nucleation limits are a function of the super-cooling and contact angle and are
independent of surface temperature. Their experimental work was carried out in an open
loop tunnel. Five plates, each with a different surface treatment, were tested under a fixed
environmental condition. Results show that greater surface roughness favors the
occurrence of nucleation. The experimental results show agreement with the theoretical
prediction.
2.1.2 Experiments and correlations
A number of experimental studies [3-10] have been done to investigate
thermophysical properties and empirical correlations during frost growth. Quantities of
interest include density, thermal conductivity, thickness and mass, growth rate, and heat
and mass transfer coefficients. Both environmental and surface conditions affect the
properties. Environmental conditions include air temperature, velocity and humidity.
Surface conditions include surface temperature and treatment.
Brian et al. [3] investigate frost densities, thermal conductivities and heat and
mass fluxes as a function of time under the conditions of gas temperature from 1.1 to
33.9 °C, dew point from -10 to 14.4 °C and Reynolds number from 3770 to 15,800. The
data agree with the theoretical predictions of a simple analytical model emphasizing the
internal diffusion process within the frost. The experimental results show no significant
density gradients in the frost, which is not thoroughly explained. It is postulated that very
small ice particles are nucleated in the frost and the nuclei are transported by thermal
diffusion forces.
3 Super-cooling degree is defined as the temperature difference when subtracting plate temperature from
the air saturation temperature. 4 Smooth surfaces are surfaces that the deviations in the direction of the normal vector of a real surface
from its ideal form are small.

5
Hayashi et al. [5] relate frost properties with frost formation types. The
experiments are set under forced convection with ambient temperature from 15 to 30 °C.
The frost formation process is divided into three periods: crystal growth, frost layer
growth and frost layer full growth. The crystal growth period is characterized by crystal
growth in vertical direction at about the same rate, and the frost shape is like a forest of
trees. During the frost layer growth period, frost grows into a meshed and uniform frost
layer. The frost layer full growth period is characterized by melting, freezing and
deposition, and the frost shape does not change. The frost layer becomes denser in this
period. Frost formation types are classified into four groups based on structure which is
determined by humidity and the cold surface temperature. Experiments show that frost
density increases rapidly at the early stage. A higher ambient velocity produces a denser
frost, but frost formation types are almost not affected by the ambient velocity. Thermal
conductivity is shown to be not only a function of density, but also a function of the other
factors. The structure of the frost layer, internal diffusion of water vapor and surface
roughness may also affect thermal conductivity.
An experimental study of frost properties under free convection is described by
Fossa and Tanda [7]. Frost thickness, frost surface temperature, deposited mass and heat
flux are investigated on a vertical plate. The plate is placed in a vertical channel with air
temperature from 26 to 28 °C and ambient humidity controlled from 31 to 58%. The test
surface temperature varies from -13 to -4 °C. Data show that frost thickness increases
with time. The frost layer is not uniform during the early time period, and thickest frost
occurs on the coldest plate and at the highest relative humidity. Frost surface temperature
is close to the triple-point value at relative high humidity. The deposited mass increases
linearly with time and is more affected by the relative humidity than by the surface
temperature. Heat flux at the plate/frost interface is measured and is shown to be a
function of relative humidity and plate temperature. Local heat flux decreases markedly
on the coldest plate. The total heat flux is higher at the higher relative humidity, which
is explained by the increased rate of latent heat transfer.
Janssen et al. [10] present a new correlation and model based on digital reduction
of in-plane observations of frost thickness. Visual and digital methods are employed to
determine frost thickness, porosity and droplet statistics. Experiments show frost

6
thickness increases with time exponentially, and a fast and slow growth period are
identified. Frost thickness is expressed as a function of system state and growth resistance.
The key physical and correlating parameter within this model is the ratio of sensible heat
transfer to total heat transfer, and the growth rate varies inversely with this ratio. The
resulting correlation faithfully captures measured growth rates and gives better predictive
capability than that of existing correlations across a wide spectrum of frosting conditions.
Experimental uncertainty on frost thickness is reduced of 0.1 mm, and the need is
eliminated for measurement of the frost-air interface temperature. Janssen et al. also
present a comprehensive review of experimental studies of frost growth illustrating the
wide variety of techniques and frosting conditions employed over the past 30 years.
2.1.3 Analytical models
Analytical study of frost formation is focused on models to predict frost
densification and thickness, thermal conductivity, and growth rate [11-24].
Tao et al. [14] present a one-dimensional theoretical model to predict temperature
distribution, frost density and thickness. The model involves two stages: ice column
growth and fully developed frost layer growth. The frost layer is treated as a porous
medium during the frost growth period. Both temporal and spatial variations of frost
properties are analyzed using the local volume averaging technique. Calculations show
that ice column diameter at the frost surface is smaller than that at the cold plate surface
during the ice column growth period. During the frost layer growth period, temperature
and vapor density show non-linear distribution within the frost layer. The rate of
densification has a maximum absolute value near the frost-air interface, the warm side of
the frost layer. The experimental study shows good agreement with the theoretical
calculations. A two-dimensional model is analyzed by Tao and Besant [15]. The initial
stage is modeled with convective heat and mass transfer over the ice columns rather than
diffusion within the frost. After a transition time, a homogeneous porous medium model
applies to the frost layer. Vapor diffusion is considered to be the mechanism for water
vapor transport within the frost layer, and phase change is due to sublimation.
Calculations show good agreement with the reported experimental data.
Lee et al. [19] present a model to predict the thickness, density and surface
temperature within an error band of 10% during the frost growth period. Assumptions
7
include that all the processes are quasi-steady state and the variation of frost density in
the normal direction is negligible. Governing equations on the air side and in the frost
layer are solved numerically. Experiments are set up to validate the analytical predictions.
Results show that the frost layer thickness grows rapidly at the early stage and then slows
down. Frost density increases rapidly at the beginning then slows down. The model
predicts the results accurately within an error of 10% except the early stage of the frost
formation, which may be attributed to the uncertainties of the weight measurement. The
surface temperature increases rapidly at beginning but the increase rate slows down with
the decrease of the growth rate. Heat and mass transfer are also estimated by the present
model. The heat transfer rate decreases rapidly at the early stage but the rate of decrement
is then reduced with time. The trend of mass transfer rate is similar to that of the heat
transfer rate.
Compared to research on frost growth, theoretical studies of the crystal growth
periods are limited. Sahin [25,26] investigates frost properties and presents an analytical
study of the crystal growth period. The frost layer is assumed to consist of several frost
columns. The crystal structure varies with temperature. The temperature distribution
shows that more sublimation of water vapor occurs in the upper half of the frost layer.
The temperature distribution in the frost layer is mostly affected by the ambient humidity,
ambient temperature, and surface temperature. The Reynolds number has less effect on
the temperature distribution. The effective thermal conductivity is found to be not only
a function of density, but also depends on the vapor diffusion and sublimation. The
effective thermal conductivity increases rapidly with time as densification occurs and
levels off as the frost layer thickens. Higher surface temperature and higher air
temperature yield larger effective thermal conductivity. Low humidity results in nearly
constant thermal conductivity, which is explained by the negligible vapor diffusion in the
frost layer. Reynolds numbers have less effect on the frost thermal conductivity.
2.2 Frost growth on wetted surfaces
The effect of surface wettability on frost formation has attracted many researchers
in the last decade. The studies are mainly focused on the experimental observations of
frost properties corresponding to surface wettability and frost formation with respect to

8
surface wettability. Some analytical models are proposed with the effect of surface
wettability included during frost formation.
2.2.1 Frost properties on wetted surfaces
Shin et al. [27] investigate the effects of surface energy on frost formation and
provide correlations for frost layer properties as a function of time and surface energy.
The tests are performed on three different surfaces with dynamic contact angle5 (DCA)
of 23°, 55°, and 88°. Experimental conditions are maintained at a Reynolds number of
9000, relative humidity 48.1%, air temperature 12 °C and cold plate temperature -22 °C.
The experimental results show frost thickness increases rapidly with time at the beginning
of frost growth and then approaches a constant rate of growth. Frost thickness on the
surface of 23° DCA is 76% of that with 88° DCA after 30 min, but the difference is not
significant after 120 min. Filmwise condensation and dense droplets form on lower
dynamic contact angle surfaces. Dropwise and less dense condensate are generated on
higher DCA surfaces. Frost mass increases linearly with time, and the differences on
tested surfaces are minor. Frost density is larger on lower DCA surfaces at the initial
stage, and the difference becomes less significant after 120 min. Thermal conductivity
on surfaces with different DCAs shows smaller variation than density. Local thermal
conductivity varies significantly along the frost layer. Conductivity close to the surface
and frost-air interface is two to three times larger than that inside the frost layer.
2.2.2 Effect of surface wettability on frost formation
The effects of surface wettability on frost formation have been investigated
extensively. A number of investigations [28-38] address anti-icing performance of the
superhydrophobic surfaces.
Zhong et al. [28] present a method of producing superhydrophobic surfaces with
micro-posts and micro-grooves. Water droplets form on the surface with static contact
angle (SCA)6 of 148°. Experiments demonstrate that condensate appears everywhere
when droplets are smaller than the dimension of micro-structures. As condensate
5 Dynamic contact angle is measured when the three phase boundary is moving. Dynamic contact angle is
referred as advancing angle and receding angle. 6 Static contact angles are measured when droplet is standing on the surface and the three phase boundary
is not moving. Contact angle in this thesis is referred as static contact angle.

9
Figure 2.1. Comparison of frost deposition on the coated and uncoated surfaces [29].
accumulates, droplets either group around the posts or condense and form a thin film
depending on the micro-structure. This phenomenon influences condensate drainage and
frost formation. The density and thermal conductivity of the frost layer varies
significantly for the frost growing from dropwise condensate and for the frost growing
from film wise condensate.
A long delay time of frost formation up to 3 h is reported by Liu et al. [29]. An
anti-frosting paint is coated on the surface of the cold plate. Liu and his colleague show
cold plate temperature and ambient humidity have a strong influence on the performance
of the anti-frosting paint. Experimental results show that the cold plate surface maintains
no frost condition for up to 3 h (Fig. 2.1.) under the condition of relative humidity less
than 60% and a cold plate temperature greater than -10 °C. The influence of
hydrophobicity on frost formation on a vertical plate under natural convection conditions
is also studied by Liu et al. [30]. A hydrophobic surface with an SCA of 133° and plain
copper surface with an SCA of 63° are tested, and experiments suggest that smaller
droplets are formed on hydrophobic surfaces. The explanation is that the contact area on
a hydrophobic surface is smaller than that on a hydrophilic surface if the volumes are
equal. It is also observed that frost crystal growth on a hydrophobic surface has a stronger
dendrite pattern resulting into looser and weaker frost layer at the initial stage. Frost
thickness on the hydrophobic surface is smaller than that for a hydrophilic surface at the
beginning of frost growth but approaches that for the hydrophilic surface when frost fully

10
covers the surface. The potential barrier7 equation shows that increasing contact angle
increases the potential barrier and thus retards the frost crystal nucleation in early stage
frost formation. After the surface is covered by frost, frost thickness growth on
hydrophobic and hydrophilic surfaces is almost the same. Liu et al. [31] further examine
frost formation on a super hydrophobic surface under natural convection. Their
experiments are performed on a horizontal surface with droplet SCA of 162°, relative
humidity of 40%, surface temperature of -10.1 °C, and ambient temperature of 18.4 °C.
Results show that frost formation delays for 55 min compared to the plain copper surface,
and the frost layer structure on the superhydrophobic surface is looser and easily removed.
A frost layer pattern similar to a cluster of chrysanthemum petals is firstly reported in this
article. Water droplets on the superhydrophobic surface grow in a similar way as on the
normal copper surface, but frost crystals grow in a different way. Frost crystals grow in
horizontal direction compared to the vertical direction on normal copper surface.
More studies show the retarding effect of the superhydrophobic surface on the
frost formation at the early stage. Wang et al. [33] generate superhydrophobic surfaces
with contact angles of 120° and 150°. Samples with different hydrophobicity are tested
under the relative humidity of 55% and surface temperature of -7.2 °C. Experiments show
that condensed water droplets are larger with bigger contact angles. No frost appears
after 600 s on vertical plate and 140 s on horizontal surface compared with 50 s on normal
copper surfaces. Stability is tested, and the surface maintains the superhydrophobicity
after 10 frosting and defrosting cycles.
One of the advantages of the superhydrophobic surface is that water droplets are
easily removed. Wang et al. [34] show that the water droplets fall down easily with
contact angle greater than 150°. They propose a technique to construct an aluminum
superhydrophobic surface using chemical etching and test the wettability effect on frost
formation when spraying on vertical plates. Less surface area is covered by frost on the
superhydrophobic aluminum surface. Frost begins to form at some points and increases
at these sites, and no new area shows ice formation. The contact angle is measured and
shows no significant variation with climatic temperature.
7 The potential barrier is the Gibbs free energy difference when supersaturated vapor changes from its
metastable phase into the stable phase (frost crystal).

11
He et al. [37] find that superhydrophobic surfaces retard frost formation at
temperatures below the freezing point. Nano-rod arrays of ZnO are fabricated on the test
surface. Experiments show that average water SCAs are 170.9°, 166.1° and 165.8° on the
surface with the growth time (tZnO) of ZnO nano-rod of 1 h, 2 h and 3 h at room
temperature. Wettability of the modified surface to condensed micro-droplets is
investigated at surface temperatures of -5 °C and -10 °C. With tZnO equals 1, 2 and 3 h,
water SCAs are 167.9°, 160.3°, and 154.6° at surface temperature of -5 °C and 163.4°,
158.2° and 155.4° at -10 °C. Solidification time of condensed droplets is longer on
superhydrophobic ZnO nano-rod array surfaces than that on the hydrophobic surface and
increases with tZnO = 3, 2 and 1 h. The time is shorter at -10 °C than that at -5 °C, which
is explained by the decrease of nucleation free energy barrier8. These results provide the
possibility of fabrication of anti-frost materials at low surface temperature conditions.
The durability of a superhydrophobic surface is a challenge to the anti-icing
properties of the surface. Farhadi et al. [38] study the anti-icing capability with different
superhydrophobic surfaces. Experiments are performed in a wind tunnel by spraying
super cooled water micro-droplets at -10 °C. Results show that ice adherence increases,
and the anti-icing performance of the tested surfaces decreases during icing/deicing
cycles. The contact angle decreases and contact angle hysteresis9 increases on the wet
surface caused by water condensation from air.
2.2.3 Analytical studies
The theoretical study of the effect of surface wettability on frost formation is
limited. Bahadur et al. [39] present a model to predict ice formation on superhydrophobic
surfaces resulting from super cooled water droplets. The model is composed of three sub-
models: droplet impact dynamics, heat transfer, and heterogeneous ice nucleation. The
droplet impact dynamics sub-model predicts the spreading and retraction dynamics of a
droplet impacting a superhydrophobic surface. The heat transfer sub-model predicts the
transient temperature distribution inside the droplet during spreading and retraction. The
heterogeneous ice nucleation sub-model predicts the kinetics of nucleation of ice clusters.
8 Nucleation free energy barrier is the change in free energy per unit volume and is balanced by the energy
gain of creating a new volume and the energy cost due to creation of a new interface. 9 Contact angle hysteresis is the difference between the advancing and receding contact angles.

12
The integrated model estimates the droplet radius and retraction force10 with regard to the
retraction time11. The model includes the effect of interface temperature on the droplet
dynamics and the freezing process. It is validated by experiments with relative humidity
of < 5%, and the results are in good agreement with the model.
2.3 Defrost process
Industrial defrost processes are initiated at intervals to remove the frost layer from
working equipment so as to maintain normal operating conditions. Some studies show
that surface wettability has an influence on defrosting, and a number of models have been
developed to simulate the defrost process. The goal of past investigations of the defrost
process has been to improve overall defrost efficiency and thus reduce defrost time and
energy cost.
2.3.1 Effect of surface wettability on the defrost process
Studies of the effect of surface wettability on the defrost process are limited [40-
42]. Jhee and Lee [41] report the effect of the surface treatment on the performance of
the heat exchanger during the frosting and defrosting process. The contact angles of the
surfaces tested in the experiments are 12°, 72°, and 124°. During the defrosting stage, the
average water drain rates increase 3.7% for hydrophilic heat exchanger and 11.1% for
hydrophobic heat exchanger (Fig. 2.2). On the hydrophilic heat exchanger, frost density
is higher, and the meltwater absorbed into frost layer is small. The water drain rate
increases accordingly. The water drain rate on the hydrophobic surface has a larger value
because frost that is not fully saturated with meltwater drains by gravity. The draining
water ratio during the frost melting period is 20.9% for the hydrophilic heat exchanger,
21.5% for the bare one, and 36.2% for the hydrophobic one. The draining rate on the
hydrophobic surface is higher as frost drains with meltwater. The average heater
temperature on the hydrophilic surface is 4.8 °C lower than the bare one because heat is
conducted to melt the frost. The average heater temperature on the hydrophobic surface
is higher as only parts of the surface are covered by frost. An interesting observation is
that frost accumulation increases by 4.9% for a hydrophilic surface and by 0.4% for a
hydrophobic surface. On the hydrophilic surface, the water film increases the coverage
10 Retraction force is the difference in the surface tension forces on the two sides of the droplet. 11 Retraction time is the time of retraction stage of droplet impact.

13
(a)
(b)
Figure 2.2. Effect of surface contact angle: (a) frosting and (b) defrosting behavior [41].
area, which promotes frost formation. On the hydrophobic surface, a large blocking
ratio12 increases local air velocity and promotes frost formation. The defrost efficiency
is defined as the ratio of the latent heat to the total heat consumption. The defrost
12 Blocking ratio is a parameter indicating the extent of the blockage of the flow passage between the fins
of a heat exchanger by frost layer.

14
efficiency increases by 3.5% for the hydrophilic heat exchanger and by 10.8% for the
hydrophobic surface. The enhancement of the efficiency is due to the increment of the
water draining rate. It is concluded that the hydrophobic surface has the most significant
effect on the defrost process.
Kim and Lee [42] investigate the effect of surface conditions on frosting and
defrosting characteristics on an extended surface. Test conditions are set with the ambient
air temperature of 2-6 °C, air velocity 1-2 m/s, surface temperature -10 °C to -18 °C,
absolute humidity of 0.00254-0.00418 kg/kga, and surfaces with a static contact angle of
2.5°, 75° and 142° for hydrophilic, bare, and hydrophobic surfaces. Experiments show
that a thin frost film forms on a hydrophilic surface; water droplets and frost crystals
appear on the bare surface; and only water droplets form on the hydrophobic surface after
10 min. After 20 min, the three samples have frost on the surface. Frost structures are in
different patterns. Pillar like structures form on the hydrophilic surface, and a hexagonal
structure is on hydrophobic surface. Frost thickness is different on the surfaces only
during the early stages of frosting. The lowest thickness is on the hydrophilic surface,
and the other two are similar. Frost density is highest on the hydrophilic surface, and
lowest on hydrophobic surface. Frost surface temperature on the hydrophilic surface is
lower than those on the others, but the temperature difference is insignificant. On the
hydrophilic surface, the average density is the highest, thus, the thermal resistance is the
lowest. As the frost mass is higher, the heat capacity for defrosting is larger on the
hydrophilic surface. On the other hand, the frost density is the lowest on hydrophobic
surface, and frost mass is the smallest. The difference in defrosting time is not significant
because of the combined influence of frost thermal conductivity and mass of frost layer
on the fin. The ratio of residual water on hydrophilic surface has significant difference,
which is only 1/6 to 1/10 of that on other fin surfaces. The water on a hydrophilic surface
forms a thin film and flows away easily, while water on a hydrophobic surface falls only
after forming larger water droplets. Residual water on a hydrophobic surface speeds up
frost growth, the frost layer grows faster around the residual water, and frost mass is about
5% greater. Overall the hydrophilic surface exhibits the best thermal performance during
testing. A summary of the effects of the surface wettability on the frost formation and
the defrost process is listed in Table 2.1.

15
Table 2.1. Wettability effect on the frost/defrost process.
Test sample
(L×W×T)
Environmental
conditions
Frost/condensate
pattern
Frost layer
properties
Shin et
al. [27]
100x300x20 mm
Al
Advancing
DCA:
23°, 55°, 88°
Air:
+5 °C to +20 °C
RH: 40% to 80%
Surface: -25 °C to
-5 °C
Limitation:
Fixed test conditions
Higher DCA:
Irregular, dropwise
condensate
Lower DCA:
Uniform, filmwise
droplets
Higher DCA:
Less dense, larger
thickness
Lower DCA:
Denser, smaller
thickness
Liu et
al. [30]
150x52x6 mm
Copper
Vertical
CA: 133°, 63°
Air : +24 °C
RH : 62%
Surface : -8 °C
Hydrophobic surface:
Smaller and fewer water
droplets
Looser and weaker
Plain/Hydrophilic surface:
Freezing quicker
The thickness on
hydrophobic surface
is smaller at the initial
stage and is almost
the same with that on
plain surface after
long test.
Liu et
al. [31]
Copper
Horizontal
CA: 162°, 72°
Air : 18.4 °C
RH : 40%
Surface : -10.1 °C
Hydrophobic surface
delays frost formation
for 55 min and
reduces the thickness
by 52% at the end.
Wang
et al.
[33]
Copper
Horizontal &
Vertical
CA: 120°, 150°
Temperature:
-7.2 °C
Humidity:
55%
Hydrophobic surface:
Condensed droplets
become larger when
contact angle changes
from 120° to 155°. Bare surface:
Irregular small droplets
Wang
et al.
[34]
20x15x3 mm
Al
Vertical
CA: 150°
Climatic temperature:
-6 °C
Water temperature:
0 °C (Spraying)
Hydrophobic surface:
Icing at partial area
Smooth surface:
Ice covering the surface
Ice layer thickness
increases with
spraying time.
Kim &
Lee
[42]
60x52.5x0.8 mm
Al
Fin
CA: 2.5°, 75°, 142°
Air:
+2 °C to +6 °C
Absolute humidity
(kg/kga):
0.00254 – 0.00418 Air velocity (m/s):
1.0 – 2.0
Fin base temperature:
-10 °C to -18 °C
Hydrophobic & Bare
surface:
Water droplets
Hydrophilic Surface:
A thin water film
Thickness at early
stage:
Bare >
Hydrophobic >
Hydrophilic
Frost density:
Hydrophilic > Bare >
Hydrophobic
Defrosting time
differs insignificantly.
Wu &
Webb
[43]
40x40x0.25 mm
Al
Vertical
Advancing/Rece-
ding CA:
98°/73° (hydrophobic)
12°/0° (hydrophilic)
Inlet air temperature:
24 °C
RH : 55%
Surface temperature:
-18 °C to -6 °C
Hydrophobic surface:
Non-uniform frost
Larger structure
Water droplets stay on
surface
Hydrophilic surface:
Uniform frost
Fully melted surface
during melting

16
2.3.2 Frost release and condensate retention
Surface wettability influences frost release [43-48]. A possibility to release frost
from the cold surface is investigated by Wu and Webb [43] with mechanical vibration.
They study the effect of surface wettability on frost pattern and melted water and the
possibility of frost release on hydrophobic and hydrophilic surfaces. Experiments are set
up on a vertical plate with the air temperature of 24 °C, relative humidity of 55%, and
surface temperature of -18 °C and -6 °C. A thermoelectric cooler is used to cool the frost
surface. Frost formed on a hydrophilic surface is uniform in thickness, but that on a
hydrophobic surface is not uniform. Condensate droplets are larger on hydrophobic
surfaces. Further, frost on hydrophobic surfaces cannot be released by surface vibration.
During melting, the hydrophilic surface is fully wetted, while the droplets on the
hydrophobic surface do not run away, i.e., they tend to stand up on the surface. Surface
tension retains some of the condensate and is balanced by gravity and air shear. Melted
condensate retention is influenced by the contact angle of water. It suggests that retained
water on the surface should be dried out, otherwise it will refreeze quickly. However, it
is very difficult to dry the moisture absorbed into a hydrophilic surface.
Recent literature shows that fabricated superhydrophobic surfaces favors the frost
release and the defrost process. Jing et al. [46] present an experimental result showing
that frost layer detaches from a rigid super hydrophobic surface during the melting. After
defrosting, the rigid super hydrophobic surface recovers its super hydrophobic property.
Boreyko et al. [47] report a nanostructured superhydrophobic surfaces that promote frost
growth in Cassie state13. The frost layer is removed by dynamic defrosting which is
driven by a low contact angle hysteresis of the meltwater. Chen et al. report on a
hierarchical surface that shows influential effect on the frost formation and the defrost
stage [48]. The influence rests on suppressing freezing wave propagation during the frost
formation and increasing lubrication and mobility of frost during the defrost stage. Frost
formation is carried out under ambient temperature of 22 °C and relative humidity of 60%.
The sample plate is placed horizontally onto a cooling state with present temperature of -
10 °C. The study of the condensation evolution shows that droplets freeze beginning
13 Cassie state is the wetting state that air trapped in the grooves between surface features forms a composite
(solid/air) hydrophobic surface.

17
from the outer edge corners of the substrate owing to its geometric singularity and low
free energy barrier for heterogeneous nucleation. Droplet freezing and the inter-droplet
freezing wave vary on hierarchical surface and nano-grassed14 super hydrophobic surface.
On the hierarchical surface with contact angle of ~160º and contact angle hysteresis of 1º,
consistent droplets departure causes rare direct freezing of droplets during the
condensation stage. The condensate droplets maintain the liquid state until a freezing
wave invades from the edge corners at 1410 s. The frozen droplet then sprouts dendritic
ice crystal, which is the freezing front, towards the surrounding unfrozen liquid droplets.
The newly freezing droplet triggers new ice crystals as well as an inter-droplet freezing
wave which eventually propagates over the entire surface. The freezing duration is 395
s. The average propagation velocity of the freezing wave is ~0.9 µm/s. On a nano-
grassed superhydrophobic surface with contact angle of ~160º and contact angle
hysteresis of 1~2º, the condensate droplets maintain the liquid state for 1090 s. The inter-
droplet freezing wave propagates at ~1.4 µm/s, which is ~1.5 times that on the
hierarchical surface. On the hierarchical superhydrophobic surface, liquid droplets
gradually decrease their size by evaporation during the freezing processes. The
evaporation of the liquid separates the freezing front from the droplets. All the liquid
droplets evaporate without the connection to the freezing front. The success of ice
bridging is associated with a length competition between the liquid droplet diameter and
frozen ice-to-liquid droplet separation. The ratio of the separation length to the droplet
diameter is defined as the bridging parameter. Smaller separation length relative to
droplet diameter might cause successful ice bridging. About 85% of liquid droplets on
the hierarchical superhydrophobic surface correspond to ice bridging greater than one as
opposed to ~67% on the nano-grassed surface. During the defrost stage, bulk frost
fracture is observed on a hydrophobic surface. The frost fractures avalanche and create
a crack. On the nano-grassed surface, the density of the fracture is low. The frost melts
away and leaves a spherical water droplet on the sample surface. In contrast, no visible
fracture is found on the hierarchical surface. The frost is detached as a whole from the
14 The hierarchical surface with nano-grassed micro-truncated cone architecture was fabricated using a
combined anisotropic wet-etching and deep reactive ion etching process.

18
sample plate during the defrost stage. The properties of frost on hierarchical surfaces
show repeatability during many frost and defrost cycles.
Condensate water is retained on the plate surface under defrost conditions. The
number of drops and their distribution varies with surface wettability [49-55]. Min and
Webb [50] investigate the condensate formation and drainage on the vertical surfaces
with different wettability. Substrates are aluminum fin stock, copper fin stock, a coated
hydrophilic surface on aluminum, and a coated organic polymer surface on aluminum.
Aluminum and copper substrates are treated by acetone cleaning, grinding, and oil
contamination separately. The experiments are performed under the air relative humidity
of 80% to 90% and ambient air velocity of 3 m/s. Surface grinding increases the
advancing angle and decreases the receding contact angle. The hysteresis is caused by
surface heterogeneity, surface roughness and impurities on surface. On the aluminum
surface, condensate droplets nucleate at the pits and other imperfections and grow rapidly
by vapor condensation and coalescence. After 20 min, an aluminum surface treated by
grinding shows no condensate droplets because condensate forms a sheet film. Droplets
stand up on a large area of both the aluminum surface and the surface with acetone
cleaning. Condensate retention is related to the receding contact angle. Results show
that condensate retention increases with the increase of the receding contact angle within
40° because the droplets stand up more. However, as the receding contact angle ranges
from 40° to 90°, condensate retention decreases with the increase of the receding contact
angle because the surface tension retaining force in vertical direction decreases sharply
and size of the droplets decreases. Filmwise condensate forms on the surface with low
receding contact angle while dropwise condensate forms on the surface with high
receding contact angle regardless of the advancing contact angle. The height-to-base
diameter ratio of the droplets increases with the increasing receding contact angle. When
the receding contact angle is very small, condensate fully wets the surface.
EI Sherbini and Jacobi [52] propose a model to predict the amount of condensate
retained on plain-fin heat exchangers. The maximum diameter of a retained drop is
obtained from the balance between gravitational force and surface tension. The total
volume of the drops is obtained by integrating all drop diameters. The prediction of the
model agrees well with the measurements by other researchers of the mass of the

19
condensate retained on heat exchangers. Application of the model is restricted to
advancing contact angles from 45° to 120°. Microgrooves and surface roughness are
found to affect the meltwater retention. Rahman and Jacobi [55] reveal that micro-
grooved surfaces drain up to 70% more condensate than a flat surface. During the defrost
process, the shape and distribution of the water droplets appear to be random on the plain
surface and form parallel streams on the micro-grooved surfaces. Effects of defrost
heating rate on the frost surface temperature are investigated. Mass concentration is lower
on the micro-grooved surfaces than on the plain surface.
2.3.3 Defrost models
Defrost can be accomplished using electric resistance heating, hot gas or warm
water. Many researchers have investigated defrost models to predict performance during
the defrost process [56-66]. Defrost on plain surfaces is modeled in the current literature.
None of the defrost models includes the effect of surface wettability on the defrost process.
Sanders [56] presents two models of defrosting process. The first model simulates
the hot gas defrosting with constant heat flux, while the second model uses constant
defrosting medium temperature to model an electrical defrosting process. Experimental
results show that defrosting time for the model with constant heat flux is larger than that
with constant defrosting medium temperature, so the defrosting efficiency is lower. The
model suggests that thick frost layers have enhanced the possibility of occurrence of air
gaps. A longer period of defrosting time would be expected while the defrost efficiency
might be improved.
Krakow et al. [57,58] build an idealized model of reversed-cycle hot gas
defrosting. The transient defrost cycle in reality is simplified using a quasi-steady-state
cycle. When operating at defrost mode, a cold side heat exchanger works as a condenser,
and a hot side heat exchanger works as an evaporator. In the defrost model, superheated
refrigerant passes through the coil. Experiments show that the surface is not at a uniform
condition at a given time. They divide the defrost process into four stages: preheating,
melting, vaporizing, and dry heating. The observations show that the frost begins to melt
at the refrigerant inlet. The surface conditions are not uniform and might be frosted,
slushy, wet or dry at a given time. Part of the resulting water is drained from the surface
while the remaining stays as surface water. A glycol-cooled, electrically defrosted coil

20
is used to obtain a uniform condition. In the model, the frost layer is assumed to be a
porous medium composed of ice crystals and air. A film of water and entrapped air will
form between coil surface and frost layer, and the thickness will increase as defrosting
process proceeds. Part of the water will remain due to viscosity, and part will drain due
to gravity. During the defrost process, some factors could be indeterminable, such as the
initial distribution of the frost, the effect on heat transfer of drained water, and the free-
convection heat transfer. This complexity requires an idealized model. The defrost
process is modeled by a number of continuous steady state where the time variation is
modeled by a large number of successive time intervals. The defrost process is
considered as a time-independent steady flow for each time interval. Heat and mass
transfer are analyzed for the air-side and refrigerant-side. The refrigerant film
conductance is evaluated from correlations. Other heat and mass transfer parameters,
including maximum surface water, free-convection air film conductance, air/water film
conductance, and surface water vaporization are obtained experimentally.
Sherif et al. [59] present a defrost model for a cylindrical coil cooler using electric
defrosting method. In the model, total energy released from the electrical heat equals the
heat conducted into the melted frost layer and the heat entering into refrigerant vapor.
The melt is assumed to continuously drain away from the coil surface. A lumped system
analysis for the refrigerant is adopted. Frost-air interface temperature and frost thickness
are computed as function of time. The point marking the end of defrosting process is 0 °C
corresponding closely to zero-frost thickness. The model has limited application due to
the restrictions by the assumptions. It assumes that thermal energy transferred into frost
is an arbitrary value. Thermal resistance of refrigerant-coil surface boundary layer and
coil thermal resistance are negligible.
Parasitic energy loads are generated during the defrost process. Hoffenbecker et
al. [62] develop a transient model to predict defrost time and efficiency. A unique
contribution of the model is to estimate the parasitic energy associated with thermal
convection, moisture re-evaporation, and extraction of the stored energy in the coil. Heat
and mass transfer mechanisms during the defrost process include condensation of high-
pressure high temperature gaseous refrigerant inside tubes, heat conduction through coil
tubes and fins, sensible heating of accumulated frost, latent melting of accumulated frost,

21
and re-evaporation of moisture from coil surface to surrounding. A finite difference
approach is implemented, and an implicit time integration scheme is applied. One
difficulty is the effect of phase change on the continuity of the computational domain.
Instead of solving a moving boundary domain, the model approximates the effects of frost
melting by assuming mass and volume at each node are constant. When ice melts, water
drains, and the volume formally occupied by water is replaced by air. The model
overestimates the mass-specific heat product, but the simulation is supported by
comparisons with experimental results and the results of other studies. Experimental
information is obtained from a fruit product storage freezer. The defrost time agrees with
the predicted value. Only 43.7% of total energy input is used for melting the frost.
Results show that the initial rate of energy input is high and decreases with time. The
model predicts that the mass of moisture re-evaporated back to the refrigerated space
increases with decreasing hot gas temperature due to prolonged defrost dwell time.
Parasitic energy impacts could be minimized by limiting defrost dwell time. The model
suggests that an optimum hot gas temperature is a function of both accumulated mass and
density of frost.
Dopazo et al. [63] model the defrost process with six stages: preheating, tube frost
melting start, fin frost melting start, air presence, tube-fin water film and dry-heating.
Assumptions include: refrigerant liquid and vapor phase are in thermodynamic
equilibrium, constant thermal properties of the refrigerant and the tube wall, and
insignificant heat transfer in axial direction. Heat and mass transfer and energy equation
were analyzed. Convective heat transfer coefficients, condensation heat transfer
coefficient, free convection coefficient, convective mass transfer coefficient are obtained
from current correlations. A finite difference method is used to find the defrost time and
energy distribution during defrost process as well as temperature distribution on tube, fin
and frost. The simulation results agree with the experimental results regarding to the
defrost time and the energy used to melt the frost. The influence of mass flow rate and
inlet temperature on defrost time, and energy delivered by the refrigerant is also studied
in the model. Experiments show that defrost time and energy supplied by the refrigerant
increases with the decreasing mass flow rate.

22
An experimental study of the reverse cycle defrosting performance of a multi-
circuit outdoor coil15 on a 6.5 kW air source heat pump is reported by Qu et al. [64]. The
outdoor coil includes four refrigerant circuits on a single tube. An environmental
chamber with separate air conditioning system is provided to control the temperature and
humidity. The experimental temperature of outdoor ambient is 0.5 °C, and the relative
humidity is 90%. After 2 h of frosting, reverse cycle defrosting starts. Results show that
no solid frost left after 7.5 min into defrosting. Frost melting on the upper level coil is
quicker than that on the lower surface of outdoor coil. Surface temperature on the upper
level circuit is larger than that on the lower level. A noticeable phenomenon is that melted
frost flows downwards by gravity from high level along coil surface of lower circuit. The
moving frost column causes a negative effect on the defrosting efficiency. As melted
frost temperature is significantly lower than coil surface temperature, part of the heat is
taken away by the moving frost column, which results in the increase of water
temperature in the collecting pan. The moving frost column also brings greater thermal
load to the lower level circuits. Total heat input increases with the delayed termination
time, which is determined by the surface temperature of the lowest level circuit. Thus
defrosting efficiency is reduced due to the effect of the melted frost flowing. Qu et al.
[65] also propose an analytical model to compare with the experimental results. The
defrosting process is divided into three stages: frost melting without water flow, frost
melting with water flow and water layer vaporization. The melted frost is held to the
surface at first due to surface tension until the mass of the melted frost held reaches the
maximum point and then flows downwards due to gravity. The four-circuit outdoor coil
surface is divided into four control volumes, and the lumped parameter modeling is
applied. The mass flow rate of refrigerant is assumed to be evenly distributed into the
four refrigerant circuits. The water layer is considered to be in the laminar regime due to
the very small velocity observed from the experiments. The contact area between the
melted frost and the frost layer increases with flowing water. The flow resistance
increases downwards, and the velocity of water layer decreases from the top circuit to the
bottom one. Prediction of the defrost duration and temperature variation of the collected
15 Coil refers to low temperature heat exchanger surfaces.

23
melted frost agrees well with the experimental results. Mass flow of the melted frost
increases while the frost melting rate decreases from the top circuit to the bottom circuit.
Mohs [66] proposes a defrosting model including vapor diffusion. The defrost
process is divided into the vapor diffusion sub-model, permeation sub-model and dry out
sub-model. The initial frost is composed of ice crystals and air pockets. The porosity
could be constant or variable. The water vapor pressure within air pockets is assumed to
be at the saturation pressure of the local frost temperature. During first stage, water
molecules diffuse from the ice surface, through the frost layer, and escape into the
surrounding air due to the increasing vapor pressure. Thus, latent heat and sensible heat
is lost to the surrounding air. In the second stage, permeation, the composite of a layer
of meltwater and ice is formed. Meltwater is absorbed into frost layer by capillary forces.
Within the permeation layer, the water content varies from completely water near the
surface to no water further into the frost layer. Two fronts may be expected. The
permeation layer is moving from the surface, while the air/frost front is moving toward
the surface. After the second stage, a small portion of liquid will adhere to the surface
through surface tension. Defrost efficiency during the evaporation process is very low
because most of the supplied heat are lost into the ambient air. The amount of retained
liquid mass on the surface will be a function of inclination angle and surface wettability.
The model includes a vaporization phase at the beginning of the defrost process and can
be used to estimate defrost rate and efficiency.
2.3.4 Ice adhesion
Ice adhesion attaches the frost column to the solid surface, varying with
temperature and surface wettability. However, bulk movement of the frost column is
possible during the defrost process. Movement is determined by a force balance analysis.
Raraty and Tabor [67] investigated the adhesion of ice to various solids. The
interfacial strength of ice to metals is higher than the strength of ice. Adhesion
experiments show that the primary factor causing failure is the rate of strain at the
interface instead of the amount of strain. When tensile stress is high, the failure is brittle,
and the breaking stress is temperature independent. If the tensile stress is below a critical
limit, the failure is ductile, and the breaking stress increases linearly as the temperature is
reduced below 0 °C. Ductile failure appears to be determined by the onset of a critical

24
creep rate. Ice adhesion is reduced by a large factor with surface contaminants on metals.
This is caused by the reduction of contact area over which strong metal/ice adhesion
occurs. The interfacial strength of ice on polymeric materials is lower than the strength
of ice, thus failure occurs at the interface. Shear strength of the solid/ice interface is
studied with polymers sliding on ice. The study shows that ice layers may be removed
more easily if brittle fracture can be achieved. Constraints of ice inhibit brittle fracture.
Hydrophobic materials show a very low adhesion.
Jellinek [68] studies the adhesive strength of ice by shear experiments.
Experiments show that snow-ice/stainless steel yields adhesive breaks to a temperature
of about -13 °C, where a sharp transition to cohesive breaks take place. Ice on polystyrene
yields pure adhesive breaks on shear. The adhesive strength is found to be a function of
temperature. Marked difference is found in the behavior of the ice disks in tension and
in shear. The experimental results are explained by a liquid-like layer assumption
between ice and the solid surface. The thickness and consistency of the liquid-like layer
are functions of temperature and the nature of the solid surface.
Ryzhkin and Petrenko [69] present an electrostatic model of ice adhesion. When
distances are greater than one intermolecular distance, the model gives an order of
magnitude for the adhesive energy, which is significantly greater than both chemical
bonding energy and van der Waals forces.
Makkonen [70] presents concepts and models to estimate ice adhesion. The
material deformations affect adhesion strength, which is explained by an indirect effect
arising from the brittle-ductile nature of ice. The ice interface behaves as a ductile
material with little tendency to fracture even at high strain rates when the substrate
material is either highly elastic or the ice is close to its melting temperature. On a rigid
substrate or cold surface, however, mechanical removal of ice occurs in a brittle manner.
Interface morphology and crystal structure of ice have effects on adhesion strength.
When the interface includes micropores that are filled with water, the true interface area
is large. In such case, a pure adhesion-failure might not be possible, and fracture occurs
partly due to cohesion-failure within the ice. The effects of temperature and substrate
materials on ice adhesion are discussed. A liquid film at the solid-ice interface is expected
to reduce adhesive strength. The thicker the liquid film, the lower the adhesion is

25
expected. Qualitatively, the adhesion strength of ice increases with decreasing
temperature down to the temperature at which the liquid film disappears.
Chen et al. [71] present a study on ice adhesion on surfaces with different
wettability. Experimental results show that a superhydrophobic surface cannot reduce
the ice adhesion, and ice adhesion strength on the superhydrophilic surface is almost the
same as that on the superhydrophobic surface. This phenomenon is explained by the
mechanical interlocking between ice and the surface texture. Meuler et al. [72] present a
relationship between water wettability and ice adhesion. Twenty-two surfaces with
different advancing/receding contact angles are tested. The strengths of ice adhesion are
measured on bare steel discs. A liquid-like interface between ice and a substrate could
facilitate lateral sliding prior to detachment of the ice column. The interactions of the
substrate with liquid water are scaled with respect to liquid drop roll-off angle,
equilibrium work of adhesion and practical work of adhesion. A strong correlation is
found between the ice adhesion and the practical work of adhesion.
The instability of an ultra-thin water film on a hydrophilic surface is investigated
by Majumdar and Mezic, who propose a new theory of droplet formation during
condensation [73]. The theory uses hydration, electrostatic force and van der Waals force
between a hydrophilic solid surface and a water film. Hydration force dominates for films
thinner than ~3 nm. At 300 K, the equilibrium film thickness is found to be almost
constant at 0.5 nm for a wide range of relative humidity and increases sharply when the
relative humidity approaches to unity. The theory shows that the competition of strain
energy with hydration, van der Waals force, and liquid-vapor surface tension induces the
instability for films thicker than a critical value.
2.4 Summary
A wide range of studies have been conducted on frost formation and the defrost
process. The effect of surface wettability has attracted a lot of interests for decades. The
study on the effect of surface wettability has been focused mainly on frost formation. For
the defrost process, the study is focused on the relationship between retention droplets
and water contact angles of substrates. There are a few papers in the literature that present
the influence of contact angle on defrost time and efficiency. The study on frost removal
attracts the interests of researchers with the findings of surface characteristics. The rigid

26
superhydrophobic surface might be able to facilitate the defrost process by reducing the
evaporation time of water retention, and defrost efficiency could improve accordingly.

27
3 Model Development and Mathematical
Formulation
3.1 Melting model
The defrost process includes the preheating of the test surface, the melting of the
frost layer, and the vaporization of the retention water. The melting behavior has been
widely studied in cold region science and water resources research. The complexity lies
in that the permeation process of the meltwater is not easy to define. The permeation rate
depends on the structure of the porous medium (i.e., frost), surface tension, capillary
pressure, and water saturation16.
When the frost column is heated, the meltwater is either absorbed into the frost
layer or drains. To fully investigate the process, a melting model is developed to
formulate the physical behaviors of the meltwater. The melting model includes three
stages: absorption, accumulation, and drainage. Melting begins with the absorption
where meltwater is absorbed into the frost layer by capillary pressure. Mass transfer of
the meltwater into the frost layer depends on surface tension, fluid viscosity, grain size,
porosity and capillary pressure. When the frost layer becomes saturated with meltwater,
accumulation occurs wherein a thin water film accumulates between the solid surface and
the permeation layer. The water film is balanced by gravity, surface tension and shear
force. With the growth of water film, meltwater drains by gravity.
The composition of the frost layer varies with the stages of the melting process.
When the permeation rate of meltwater is greater than the melting rate, all the meltwater
is absorbed into the frost layer during the absorption stage. The mass composition
consists of a permeation and frost layer. The meltwater accumulates between the surface
and the permeation layer when the frost layer is saturated. The mass composition includes
a thin water film and the permeation layer. A summary of the mass composition is listed
in Table 3.1.
The melting process is closely related to surface wettability. In the absorption
stage, the permeation rate is determined by the structure of the porous medium, which is
16 Water saturation is the volume fraction of water to the pore volume.

28
Table 3.1. Mass composition during melting process.
Melting process
Water film
without
draining
Water film
with
draining
Permeation
layer
Frost layer
I Absorption
II Accumulation III Drainage
a function of surface wettability in the frost formation period. The effect of surface
wettability in the accumulation stage lies in that the maximum thickness of the thin water
film depends on the surface tension acting on the perimeter of the frost column, and the
surface tension is related to surface wettability. When the meltwater drains by gravity,
the average volumetric flow rate depends on the velocity boundary conditions at the
solid/water interface and the water/permeation interface. A slip boundary condition for
velocity applies at the solid/water interface for hydrophobic surface.
3.2 Mathematical formulation of the melting stages
The melting process is formulated to find the key variables in each stage. In the
absorption stage, the permeation layer is a mixture of ice crystals, water and air. The rate
of meltwater permeation is expressed in the mass continuity of the water saturation. In
the accumulation stage, the maximum water thickness is expressed by a static force
analysis on the water film. The growth of the water film depends on the energy
transferred into the permeation layer. In the drainage stage, the draining velocity is
expressed by the momentum equation of the draining water.
The initial mass of the frost layer comprises ice crystals and air. At the beginning
of the melting process, the temperature across the frost layer is assumed to be uniform.
Heat transfer is assumed to be one-dimensional and normal to the test surface. A general
diagram of the frost layer structure is shown in Fig. 3.1. The initial frost thickness is δf.
The direction along the surface is x, and the direction normal to the surface is y. A special
condition considered here is where the slope angle ϕ is 90°, and the surface is placed
vertically.
3.2.1 Absorption
Absorption of meltwater occurs at the beginning of the melting process. The
assumptions for the absorption process include: (1) The permeation rate is greater than
the melting rate of the frost layer, and all meltwater is absorbed into the frost layer. (2)

29
Figure 3.1. A general illustration of the initial frost column.
The frost layer is treated as rigid porous medium. (3) Temperature in the permeation
layer maintains the melting temperature. (4) Capillary pressure varies with the water
saturation. (5) The water saturation equals unity at the solid/permeation interface and
zero at the permeation/frost interface.
In the absorption stage, the bulk mass consists of the permeation layer and the
frost layer. A control volume (CV) analysis is applied to formulate the mass and heat
transfer equations in the permeation and frost layers. A CV is selected in the permeation
layer for the mass balance analysis as shown in Fig. 3.2.
The mass of water in the CV is written as a function of the water saturation S,
mw = ερwSAtsdy . (3.1)
The mass balance of water in the permeation layer is,
ερw
∂S
∂t= −
∂mw,p"
∂y− ερwvf
∂S
∂y , (3.2)
where the l.h.s. represents the rate of change of water mass in the CV, the first term on
the r.h.s. represents the net mass transfer into the CV by water permeation, and the second
term represents mass transport due to the motion of the bulk mass.

30
Figure 3.2. CV in the permeation layer during absorption.
The melting velocity depends on the heat flux applied at the test surface, the
density of the frost layer and the latent heat of fusion Lf,
vf = −qs
"
Lfρf , (3.3)
where
ρf ≈ (1 − ε)ρi . (3.4)
The minus sign indicates that the direction of the movement is toward the test surface.
The permeation layer is a mixture of air, water and ice crystals. At the test plate surface,
the permeation layer is composed of meltwater and ice crystals and is maintained at the
melting temperature, thus only the latent heat is considered.
The water permeation flux, m”w,p, equals ρwvw, where vw is the volume flux of
water. Eqn. (3.2) becomes,
ε∂S
∂t= −
∂vw
∂y− εvf
∂S
∂y . (3.5)

31
The volume flux of water is given by Darcy’s law,
vw =Kw
μw
∂Pca
∂y . (3.6)
The water flow is driven by the gradient of the capillary pressure. Literature [74-89] is
reviewed to understand the water permeation in a porous medium. The review covers the
capillary pressure of water transport, water percolation in snowpack and flow in porous
media in the areas of water resource and cold region science. In a porous medium, the
water volume flux depends on the capillary pressure, fluid viscosity, surface tension, and
structure of the medium. Capillary pressure is a function of the water saturation. The
structural description of the porous medium includes grain size, tortuosity and the
porosity. The rate of liquid penetration in a porous body may be modeled as a number of
cylindrical capillary tubes with varying radii. The rate of liquid penetration is
proportional to the square root of time and to the square root of the ratio of the surface
tension to gravity. Aoki et al. [74] present a model describing the melting process of a
snow layer when heat is supplied at the bottom. The study shows that the melt time and
the melting efficiency are affected by water permeation. The calculated melting
efficiency is higher when neglecting water permeation. An empirical correlation is
applied to represent the water permeation rate, which relates to the capillary suction
pressure and the porous structure. An empirical correlation for the dimensionless
capillary pressure is given as,
P+(S) =P
γ
ε
(1 − ε)
D
6= 1.6e−0.46S − e20(S−1) . (3.7)
In water resources research, the theory of water transport in melting snow attracts
many interests. Colbeck [75-78] presents the capillary effects on water percolation and
investigates the relation of capillary pressure to the water saturation. In Colbeck’s model,
gravity is the driving force for water flow. Capillarity accounts for less than 10% of the
total forces when the water volume flux is 10-8 m/s. The relationship between capillary

32
pressure and water saturation depends on a number of parameters including contact angle,
interfacial tension, particle shape and pore-size distribution.
A typical expression relating effective permeability and the capillary pressure is
by a power law, where the permeability Kw and capillary pressure Pca are assumed to be
functions of the water saturation, S, and are given as [81],
Kw = Kw(S) = KSp, Pca = Pca(S) = CS−q, (3.8)
where K, C, p, q are constants, S is water saturation, K is the intrinsic permeability (a
function of the geometry of the porous medium), and C is the entry capillary pressure.
The exponent q is related to the pore-size distribution.
The volume flux of water thus becomes,
vw = −KCq
μwSp−q−1
∂S
∂y . (3.9)
Substituting Eqn. (3.9) into Eqn. (3.5), the mass balance of water becomes,
ε∂S
∂t=
KCq
μw[(p − q − 1)Sp−q−2 (
∂S
∂y)
2
+ Sp−q−1∂2S
∂y2] − εvf
∂S
∂y . (3.10)
Within the permeation layer, water saturation decreases from the solid/water
interface to the permeation front. Water content at the solid/permeation interface and at
the permeation/frost interface are assumed as,
y = 0, S = 1 . (3.11a)
y = δp, S = 0 . (3.11b)
The initial condition is,

33
Figure 3.3. CV in frost layer during the absorption.
t = 0, S = 0 . (3.11c)
The temperature of the permeation layer is assumed to be constant at the melting
temperature. A CV is selected in the frost layer for the energy analysis, as shown in Fig.
3.3. The energy balance for the frost layer is assumed to be one-dimensional,
(ρcp)f
∂Tf
∂t=
∂
∂y(kf
∂Tf
∂y) − (ρcp)
fvf
∂Tf
∂y . (3.12)
The l.h.s. represents the time rate of change of energy in the CV. The first term on the
r.h.s. represents heat transfer by conduction, and the second term on the r.h.s. represents
the energy transport due to bulk motion. The boundary conditions at the solid-permeation
interface, permeation-frost interface, and frost-air interface are,
y = 0, q" = qs " , (3.13a)
y = δp, Tf = Tm, (3.13b)

34
y = δp+f , − kf
∂Tf
∂y= ha(Tf − Ta), (3.13c)
t = 0, Tf = Tm . (3.13d)
3.2.2 Accumulation
When the frost layer is saturated with meltwater, a water film accumulates
between the solid surface and the permeation layer. The frost column then comprises a
water film and permeation layer, as shown in Fig. 3.4. The growth of the water film is
formulated from the energy balance analysis at the water/permeation interface.
−kw
∂Tw
∂y|
δw
= (1 − ε)ρiLfvy , (3.14)
where vy is the velocity of the interface. The interface velocity of the permeation layer
is,
vy =dδw
dt . (3.15)
Substituting Eqn. (3.15) into Eqn. (3.14), the energy equation at the water/permeation
interface becomes,
−kw
∂Tw
∂y|
δw
= (1 − ε)ρiLf
dδw
dt . (3.16)
The energy balance in the water film is,
(ρcp)w
∂Tw
∂t=
∂
∂y(kw
∂Tw
∂y) . (3.17)

35
Figure 3.4. Heat and mass transfer during accumulation.
The boundary and initial conditions at the solid-water interface and the water-permeation
interface are,
y = 0, q" = qs" , (3.18a)
y = δw, Tw = Tp = Tm , (3.18b)
t = 0, Tw = Tm . (3.18c)
3.2.3 Drainage
Meltwater drains away when the frost layer is saturated and when the gravity
outweighs the adhesive force at the solid/water interface. A drainage model is shown in
Fig. 3.5. Assuming that the meltwater drains between the test plate and frost column, the
draining velocity is determined by the boundary conditions at the interfaces.
The momentum balance in the x-direction is,
ρw (∂uw
∂t+ uw
∂uw
∂x+ vw
∂uw
∂y) = ρwgx + μw (
∂2uw
∂x2+
∂2uw
∂y2) −
∂P
∂x . (3.19)

36
Figure 3.5. Drainage model.
The momentum balance in y-direction is,
ρw (∂vw
∂t+ uw
∂vw
∂x+ vw
∂vw
∂y) = ρwgy + μw (
∂2vw
∂x2+
∂2vw
∂y2) −
∂P
∂y . (3.20)
gx = gsinφ, gy = −gcosφ . (3.21)
Meltwater is assumed to drain along the x-direction and is only a function of y.
Eqns. (3.19), (3.20) are simplified as,
∂uw
∂t+ vw
∂uw
∂y= μw
∂2uw
∂y2+ gsinφ . (3.22)
∂P
∂y= −ρwgcosφ . (3.23)
When φ = 90o, the frost surface is vertical, and the drainage model is shown in
Fig. 3.6. The energy equation is similar to that in the accumulation stage. The draining
velocity varies in the y-direction and is perpendicular to the solid plate.

37
Figure 3.6. Heat and mass transfer during drainage for a vertical frost surface.
At the water/permeation interface, a slip boundary condition is applied owning to
the effects of viscous shear [90-93]. Beavers and Joseph [90] present a slip velocity
proportional to the shear rate at the permeable boundary for free fluid over a porous
medium,
y = δw , duw
dy=
β
√K(uB − ω) , (3.24)
where K is the permeability of the permeation layer, β is a dimensionless parameter
depending on the material which characterizes the structure of permeable material within
the boundary region, ω is the filtering velocity of water in the permeation layer with a
unit of m/s, and uB is the velocity at the water/permeation interface.
For viscous liquids at low Reynolds number, flow in permeable material is
governed by Darcy’s law. When gravity dominates the flow, ω is,
ω =K
μwρwg . (3.25)

38
At the solid/water interface, boundary conditions depend on the surface
wettability. For the hydrophilic surface, a no-slip boundary condition is assumed at the
solid/water interface,
y = 0, uw = 0 . (3.26)
For a thin liquid film, velocity slip is present for liquid flowing over hydrophobic
surfaces [94-100]. A slip velocity condition is applied to the hydrophobic surface. The
slip velocity us, on the wall can be expressed as [98],
us = b∂uw
∂y, (3.27)
where b is the slip length and can be estimated as,
b = δ (μb
μs− 1), (3.28)
where δ is the thickness of the thin layer at the boundary, µb is the bulk viscosity, and µs
is the average viscosity of the near-to-wall layer. Slip length is defined as an extrapolated
distance relative to the wall where the tangential velocity vanishes as shown in Fig. 3.7.
The average draining velocity across the water film thickness is,
uavg =∫ uwdy
δw
0
δw . (3.29)
The average volumetric flow rate across the water film thickness is,
Ω = uavgWδw , (3.30)
where W is the width of the test plate.

39
Figure 3.7. Definition of the slip length for a simple shear flow [98].
During the defrost process, defrost time and efficiency are properties used to
evaluate the system effectiveness. Defrost time and efficiency depend on the system
design, ambient temperature and heating methods. Defrost time includes the preheating
time of the plate, the melting time of the frost column, the draining time of the meltwater
and the evaporation time of the retention water. Defrost time for a lumped frost layer can
be defined as,
tdf =(1 − ε)ρiδfLf
qs" − ha(Tm − Ta)
+(1 − ε)ρiδfH
ρwuavgδw , (3.31)
where H is the height of the test plate. Defrost time in the definition consists of melting
time of the frost column and the draining time of the meltwater.
In theoretical study, defrost efficiency can be defined as the ratio of the energy
required to melt the frost to the total heat applied at the surface,
ηdf =(1 − ε)ρiδf[Lf + cp,i∆Tf]
qs" tdf
. (3.32)
From the definition, defrost efficiency is a function of the frost mass, the initial
temperature of the frost layer, the heat flux applied at the test surface, and the defrost time.
Defrost efficiency also varies with different melting stages.

40
3.3 Slumping criterion
Frost slumping is a method of frost removal and is different from the traditional
defrost process. During the melting period, frost might be able to peel away from the
surface in a bulk movement or slump. In this case, frost falls off as a whole rigid piece.
Time for water draining and evaporation could be saved, thus defrost efficiency improves.
The possible criteria of frost failure are attributed to the categories as shown in Table 3.2.
Unbalanced forces might cause the frost to break up into pieces or fall off from the surface
during the defrost process. When subject to axial compression, the frost column on the
coils might buckle and fail. At low temperature, thermal contraction or expansion might
cause failure of the solid-frost interface, which is due to the different thermal expansion
coefficients of the solid and the ice crystals. The frost column and the solid material may
also cool at different rates when their heat capacities and thermal conductivities differ.
Additional stress at the interface results from this. The significance of the added stress
depends on the cooling rate. When a thin liquid film exists, the interface might be ductile,
and it adjusts to the thermal expansion without fracturing.
Static force balance is applied to formulate the slumping criterion and is discussed
for each of the melting stages. Frost slumping is likely to occur when the adhesive force
and surface tension get weak. Water accumulation between the test surface and the frost
column is a favorable condition that weakens the adhesive force. When gravity outweighs
adhesive force or surface tension, the frost layer peels off from the solid surface during
the melting process. The different failure mechanisms are illustrated in Fig. 3.8. with
respect to hydrophilic and hydrophobic surfaces. At the beginning of melting, the force
balance is determined by the competition between the gravity and adhesion force. When
the frost layer is saturated with the meltwater, a thin water film develops and is subjected
to gravity and shear at the interfaces. On hydrophilic surfaces, meltwater is assumed in
the form of thin water film. When the water film becomes unstable, it breaks up and
causes fracture in the frost column. On hydrophobic surfaces, meltwater is assumed in
the form of water droplets. During melting, the adhesive force at the solid/frost interface
and the cohesive force inside the frost layer might become unbalanced, which causes
fracture and crack of the frost column.

41
Table 3.2. Failure modes of frost layer. Possible Failure
modes
Melting periods
Static force
balance
Instability of
water film
Buckling due
to axial
compression
Thermal expansion/
contraction
Pre-melting Water thickness is
less than 100 nm.
Frost column
might break up
into pieces.
Absorption Frost column falls
off from the solid
surface.
Accumulation Frost column falls
off from the solid
surface.
Drainage Frost column falls
off from the solid
surface.
On site coils with
complex geometry
Frost column
buckles when
subjected to
compression
Sudden cooling Failure at the
interface due to
different thermal
expansion coefficients
of solid and ice
Figure 3.8. The scheme and mechanisms of frost slumping.

42
Figure 3.9. Force balance during absorption.
3.3.1 Force balance during absorption
During absorption, when the permeation rate of the meltwater is greater than the
melting rate of the frost layer, all the meltwater is absorbed into the frost layer. A
permeation layer is formed between the solid surface and the frost layer as shown in Fig.
3.9. The bulk column is subjected to gravity and adhesion force at the solid/permeation
interface. When gravity exceeds adhesion in shear, the frost column might pull away
from the solid surface. The body force on the frost column varies with the porosity and
thickness of the frost layer. The adhesion force in shear is determined by surface
wettability and is also associated with the surface temperature.
The force balance on the bulk column is described as,
mf0g − τiAs = 0, (3.33)
where m is the mass of the bulk column and,
mf0 ≈ As(1 − ε)δf0ρi . (3.34)
Adhesion under shear is much smaller than that under tension because a liquid-
like layer is assumed to exist between ice crystals and the solid surface. The shear

43
Figure 3.10. Force balance during accumulation.
strength of ice adhesion is related to the advancing/receding contact angle. The
correlation between ice adhesion, i, and the contact angle is described as [72],
τi = (340 ± 40)(1 + cosθrec) [kPa], Residual = 0.92, (3.35)
where the ice adhesion is measured at -10 °C.
The adhesion force also decreases with the increase of the temperature. When the
surface temperature increases, the adhesion force might get weaker. The gravity then
dominates and leads to frost slumping. The strength of solid/liquid interaction is greater
on hydrophilic surfaces than on hydrophobic surfaces. It might be easier for frost column
to slump on hydrophobic surfaces.
3.3.2 Force balance during accumulation
During the accumulation stage, when the frost layer is either saturated with
meltwater or under the condition that the melting rate is greater than the permeation rate,
meltwater can accumulate at the solid surface. A thin water film stands between the solid
surface and the frost layer, as shown in Fig. 3.10. The maximum thickness of the water
film is determined by a force balance acting on it. The water film is subject to gravity,
shear force at the solid/water interface, and at the water/frost interface. The frost column
is subject to gravity and shear forces at the water/frost interface. The bulk mass is

44
Figure 3.11. Surface tension on hydrophobic surfaces.
attached to the solid surface by surface tension. The shear force at the solid surface is
associated with the surface wettability and surface temperature. The force balance for
water film is,
Gw − Fs−w − Fw−p = 0. (3.36)
The force balance for frost column is,
Gf + Fw−p = 0. (3.37)
On hydrophilic surfaces, force balance on the bulk mass becomes,
mf0g = γ ∙ 2(L + W) ∙ cosθ , (3.38)
where is surface tension of water, L is the length, W is the width of the test surface, and
θ is the water contact angle at the solid surface.
On hydrophobic surfaces, surface tension is related to the advancing contact angle
θadv and the receding contact angle θrec17
as shown in Fig. 3.11. The force balance on the
hydrophobic surface is,
17 The contact angles formed by expanding and contracting the liquids are referred to as the advancing
contact angle and the receding contact angle respectively.

45
Figure 3.12. Force balance during drainage.
mf0g = γ ∙ 2(L + W) ∙ (cosθrec − cosθadv). (3.39)
The difference between the advancing contact angle and the receding contact
angle is called contact angle hysteresis. Hysteresis is caused by surface roughness,
heterogeneity and impurities on surface. Surface tension is a function of contact angle
hysteresis.
3.3.3 Force balance during drainage
During drainage, meltwater drains by gravity, as shown in Fig. 3.12. A force
balance is similar to that used in the accumulation stage. Forces compete between gravity
and shear force at the solid/water interface. Gravity decreases with draining of the water,
and shear force also decreases with the rising surface temperature. Slumping would be
possible, where the decrease of the shear stress is much larger than the decrease of the
gravity. At a point, the bulk mass falls off with the draining water.

46
4 Solution Methods
4.1 Melting stages
Melting stages cover the behavior of the meltwater at different time period during
the defrost process. Water permeation rate describes the rate of meltwater transporting
into the frost layer in absorption. Water accumulation reduces the strength of ice adhesion
and promotes the slumping possibility in accumulation. Water drainage rate depends on
the boundary conditions at the interfaces in drainage. Large drainage rate helps reduce
defrost time and improve defrost efficiency.
4.1.1 Absorption
During the absorption stage, the permeation rate of the meltwater depends on the
water saturation distribution through the permeation layer. The water saturation in the
permeation layer is governed by Eqn. (3.10). Front fixing methods are applied to track
the phase front as the phase boundary moves [101].
When letting y+ =y
δp(t), the dimensionless equation of the water saturation
becomes,
∂S(t, y)
∂y=
∂S
∂y+
∂y+
∂y=
1
δp(t)
∂S(t, y+)
∂y+ . (4.1)
∂2S(t, y)
∂y2=
∂S
∂y(
∂S
∂y) =
1
δp(t)2
∂2S(t, y+)
∂y+2 . (4.2)
∂S(t, y)
∂t=
∂S(t, y+)
∂t−
y+
δp(t)
dδp(t)
dt
∂S(t, y+)
∂y+ . (4.3)
The non-dimensional mass continuity of water Eqn. (3.10) becomes,

47
∂S(t, y+)
∂t=
KCq
εμw
1
δp2 [(p − q − 1)Sp−q−2 (
∂S(t, y+)
∂y+)
2
+ Sp−q−1∂2S(t, y+)
∂y+2 ]
− vf(1 − y+)1
δp
∂S(t, y+)
∂y+ . (4.4)
When letting t+ =t∗|vf|
δf0, the dimensionless equation of the water saturation becomes,
∂S(t+, y+)
∂t+=
δf0
|vf|
KCq
εμw
1
δp2 [(p − q − 1)Sp−q−2 (
∂S(t+, y+)
∂y+)
2
+ Sp−q−1∂2S(t+, y+)
∂y+2 ]
−δf0
|vf|vf(1 − y+)
1
δp
∂S(t+, y+)
∂y+ . (4.5)
The boundary conditions are,
y+ = 0, S = 1 , (4.6a)
y+ = 1, S = 0 . (4.6b)
The initial condition is,
t+ = 0, S = 0 . (4.6c)
The governing equation of water saturation is thus a second order, nonlinear
partial differential equation that can be solved by finite difference methods. Finite
difference schemes are used to solve the governing equations [102-106]. Forward-time
central-space discretization scheme applies to the nodes.
∂S
∂t=
Sij+1
− Sij
∆t . (4.7)

48
∂S
∂y=
Si+1j
− Si−1j
2 ∆y . (4.8)
∂2S
∂y2=
Si+1j
− 2Sij
+ Si−1j
∆y2 . (4.9)
When p − q − 1 = 1, the discretization of the water permeation equation becomes,
Sij+1
− Sij
∆t=
KCq
εμw[(
Si+1j
− Si−1j
2 ∆y)
2
+ Sij Si+1
j− 2Si
j+ Si−1
j
∆y2] − vf
Si+1j
− Si−1j
2 ∆y (4.10)
The discretization of the non-dimensional water permeation equation becomes,
Sij+1
− Sij
∆t=
KCq
εμw
1
δp2 [(
Si+1j
− Si−1j
2 ∆y)
2
+ Sij Si+1
j− 2Si
j+ Si−1
j
∆y2]
− vf
1
δp
[1 − (i − 1)∆y]Si+1
j− Si−1
j
2 ∆y . (4.11)
Heat diffusion in the frost layer is governed by Eqn. (3.14). Let Θ =Tf−Ta
Ti−Ta, y+ =
y−δp
δf, U =
δf
αfvf, and t+ =
αft
δf2 . The thickness of frost layer and permeation layer varies
with time. At a specified time, the energy equation can be simplified as,
∂Θ
∂t+=
∂2Θ
∂y+2 − U∂Θ
∂y+ . (4.12)
The boundary and initial conditions become,
y+ = 0, Θ = 1, (4.13a)

49
y+ = 1, − ∂Θ
∂y+= BiΘ, Bi =
haδf
kf, (4.13b)
t+ = 0, Θ = 1. (4.13c)
The dimensionless heat diffusion equation is homogeneous with one
nonhomogeneous boundary condition at the permeation-frost interface and one
homogeneous boundary condition at the frost-air interface. Thus, the problem comprises
two sub-problems: a steady state problem with nonhomogeneous boundary conditions,
and a transient problem with homogeneous boundary conditions. Forward-time central-
space discretization scheme applies to the internal nodes.
∂Θ
∂t+=
Θij+1
− Θij
∆t+ . (4.14)
∂Θ
∂y+=
Θi+1j
− Θi−1j
2∆y+ . (4.15)
∂2Θ
∂y+2 =Θi+1
j− 2Θi
j+ Θi−1
j
∆y+2 . (4.16)
The discretization of the non-dimensional energy equation becomes,
Θij+1
= Θij
+∆t+
∆y+2 (Θi+1j
− 2Θij
+ Θi−1j
) −U∆t+
2∆y+(Θi+1
j− Θi−1
j) . (4.17)
The backward difference applies to the node at the upper bound.
∂Θ
∂y+=
Θij
− Θi−1j
∆y+ . (4.18)
The discretization of the boundary condition is,

50
Θij
=Θi−1
j
(1 + Bi∆y+) . (4.19)
4.1.2 Accumulation
The water film expands when the permeation layer melts. The temperature in the
permeation layer maintains the melting temperature. The water film is expected to be
very thin where the Biot number is less than 0.1. A uniform temperature is assumed as,
Tw = Ts . (4.20)
The thickness of the water film approximates as,
δw(t) =qs
"
ρpLft . (4.21)
4.1.3 Drainage
Conservation of momentum in the water film is described by Eqn. (3.22). When
the slope angle is 90°, the equation becomes,
∂uw
∂t+ vw
∂uw
∂y=
μw
ρw
∂2uw
∂y2+ g . (4.22)
Let uw∗ =
uw
U , vw
∗ =vw
U, t∗ = t
U
δw , y∗ =
y
δw , the dimensionless form of the momentum
equation becomes,
∂uw∗
∂t∗+ vw
∗∂uw
∗
∂y∗=
1
Re
∂2uw∗
∂(y∗)2+
1
Fr2 , (4.23)

51
where the characteristic velocity U = |vf| =qs
"
(1−ε)ρiLf , the Reynolds number Re =
ρwUδw
μw , the Froude number Fr =
U
√gδw . The Reynolds number is relatively small
because the scales of melting velocity and thickness of water film are small. Thus the
inertia force is neglected. The momentum equation becomes,
1
Re
d2uw∗
d(y∗)2+
1
Fr2= 0 . (4.24)
A parabolic draining velocity profile is assumed.
duw∗
dy∗= −
Re
Fr2y∗ + C1 , (4.25)
uw∗ = −
Re
2Fr2(y∗)2 + C1y∗ + C2 , (4.26)
where C1 and C2 are constants that can be obtained from the boundary conditions.
Boundary conditions are formulated with regard to surface wettability. For
hydrophilic surfaces, the no slip boundary condition is assumed at the solid/water
interface. Due to the effect of the boundary layer in the porous medium, a slip velocity
is expected at the water/permeation interface.
y∗ = 0, uw∗ = 0. (4.27a)
y∗ = 1, duw
∗
dy∗=
β
√K∗(uB
∗ − ω∗) , (4.27b)
where K∗ =K
δw2 , and ω∗ =
ω
U . Solving C1 and C2 where,
C1 =Re
Fr2+
β
√K∗(uB
∗ − ω∗) , (4.28a)

52
C2 = 0 . (4.28b)
The momentum equation for hydrophilic surface is solved with,
uw∗ = −
Re
2Fr2(y∗)2 + [
Re
Fr2+
β
√K∗(uB
∗ − ω∗)] y∗. (4.29)
The velocity at water/permeation interface is obtained where y*=1,
uB∗ =
Re2Fr2 −
β
√K∗ω∗
(1 −β
√K∗)
. (4.30)
For the hydrophobic surface, a slip boundary condition is assumed at solid/water interface
by Eqn. (3.27). Letting us∗ =
us
U , b∗ =
b
δw , a dimensionless slip boundary condition is,
y∗ = 0, us∗ = b∗
duw∗
dy∗ . (4.31a)
The boundary condition at water/permeation interface is described as,
y∗ = 1, duw
∗
dy∗=
β
√K∗(uB
∗ − ω∗) . (4.31b)
Solving for the constants C1 and C2,
C1 =Re
Fr2+
β
√K∗(uB
∗ − ω∗) , (4.32a)
C2 = b∗C1 = b∗[Re
Fr2+
β
√K∗(uB
∗ − ω∗)] . (4.32b)

53
Momentum equation for hydrophobic surface is solved with,
uw∗ = −
Re
2Fr2(y∗)2 + [
Re
Fr2+
β
√K∗(uB
∗ − ω∗)] y∗ + b∗[Re
Fr2+
β
√K∗(uB
∗ − ω∗)]. (4.33)
uB∗ =
(1 + 2b∗
2 )ReFr2 −
β
√K∗(1 + b∗)ω∗
1 −β
√K∗(1 + b∗)
. (4.34)
The average draining velocity and the average draining rate across the water film is,
uavg∗ = ∫ uw
∗ dy∗1
0
, (4.35)
and the average draining rate is,
Ω∗ = uavg∗
W
δw , (4.36)
where W is the width of the test plate.
The average draining velocity for the hydrophilic surface is,
uavg∗ =
Re
3Fr2+
β
2√K∗(uB
∗ − ω∗) . (4.37)
The average draining velocity for hydrophobic surface is,
uavg∗ = (
1
3+ b∗)
Re
Fr2+ (
1
2+ b∗)
β
√K∗(uB
∗ − ω∗) . (4.38)

54
4.2 Slumping criterion
4.2.1 Scale analysis during absorption
The bulk frost is balanced by adhesion force in shear and gravity as described by
Eqn. (3.33). A ratio is defined corresponding to the competition between these two forces.
FR1 =Gf0
Asτi=
ρfgδf0
τi , (4.39)
where density is approximated as ρf = (1 − ε)ρi.
The tension force in shear of ice decreases with the increase of the surface
temperature during the defrost process. To quantify the FR1, the tension force in shear is
assumed to be 100 kPa [67]. Substituting ε = 0.5, ρi =900 kg
m3 , δf = 3 mm, FR1 is,
FR1 =450
kgm3 × 0.003 m × 9.81
ms2
100 kNm2
= 1.35 × 10⁻⁴ . (4.40)
The body force is much less than the adhesion force in shear. The slumping of the frost
layer is unlikely to occur when adhesion is much larger than the body force.
4.2.2 Scale analysis during accumulation
During accumulation, water film on hydrophilic surfaces is subjected to gravity,
surface tension at the solid/water interface and shear at the water/permeation interface.
A ratio is defined as,
FR2 =Gf0
Fs−w=
ρfgAsδf0
γ ∙ 2(L + W) ∙ cosθ . (4.41)
On hydrophobic surfaces, the force ratio is,
FR2 =ρfgAsδf0
γ ∙ 2(L + W) ∙ (cosθrec − cosθadv) . (4.42)

55
Surface tension is defined as the force per unit length. The surface tension of water is 73
mN/m. Substituting ε = 0.7, ρi =900 kg
m3, δf = 3 mm, L = W = 30 mm, FR2 is,
FR2 =(1 − 0.7)x900
kgm3 × (302 × 10−6 × 3 × 10−3)m3 × 9.81
ms2
73 mNm × (4 × 30 × 10−3) m × cosθ
=0.8
cosθ . (4.43)
The force ratio for hydrophobic surfaces is,
FR2 =0.8
cosθrec − cosθadv . (4.44)
Frost slumping is more likely to occur during the accumulation stage. Surface tension
decreases with the surface temperature, and the force ratio increases with time. When the
force ratio is greater than 1, the gravity outweighs the surface tension, and slumping is
likely to occur where a thin water film accumulates on hydrophilic surfaces or where
water droplets stick on hydrophobic surfaces.
4.2.3 Scale analysis during drainage
A part of the meltwater drains at this stage, and the force ratio on the surfaces is
time dependent. On hydrophilic surfaces, the force ratio becomes,
FR3 =ρfgAsδf0 − ρwguwWδw∆t
γ ∙ 2(L + W) ∙ cosθ . (4.45)
The force ratio on hydrophobic surfaces is,
FR3 =ρfgAsδf0 − ρwguwWδw∆t
γ ∙ 2(L + W) ∙ (cosθrec − cosθadv) . (4.46)
The slumping condition in the drainage stage depends on the force competition between
the gravity and the surface tension. The bulk mass gets smaller due to the meltwater
drainage, while the surface tension decreases with the increase of the surface temperature.

56
The force ratio might be greater than 1 when the decrease due to surface tension is faster
than that due to gravity.
A general scaling analysis is applied to define the criterion for the occurrence of
slumping during the accumulation stage. As surface tension decreases with increasing
temperature, a linear relation is assumed,
γ = −γ0
TkpT + γ0 , (4.47)
where γ0 is the surface tension of water at 0 °C. The force ratio on hydrophilic surfaces
becomes,
FR =gρi(1 − ε)Asδf0
(−γ0
TkpT + γ0) ∙ 2(L + W) ∙ cosθ
. (4.48)
The force ratio on hydrophobic surfaces becomes,
FR =gρi(1 − ε)Asδf0
(−γ0
TkpT + γ0) ∙ 2(L + W) ∙ (cosθrec − cosθadv)
. (4.49)
When the aspect ratio is defined as the ratio of plate width to length, r = W/L, the force
ratio on hydrophilic surfaces becomes,
FR =gρi(1 − ε)Wδf0
(−γ0
TkpT + γ0) ∙ 2(1 + r) ∙ cosθ
, (4.50)
and the force ratio on hydrophobic surfaces becomes,
FR =gρi(1 − ε)Wδf0
(−γ0
TkpT + γ0) ∙ 2(1 + r) ∙ (cosθrec − cosθadv)
. (4.51)

57
5 Experimental Design
5.1 Experimental objectives and apparatus
The objective of the experiments is to build frost column and investigate defrost
mechanisms on the surfaces with different contact angles. The main goals include
building a frost column with certain thickness and density, melting the frost column,
prepare surfaces with different contact angles, comparing defrost time and efficiency with
respect to the heating powers and the surface wettability, and finding the slumping
conditions on different surfaces.
Experimental set-up is shown in Fig. 5.1. The test equipment consists of a plastic
chamber, cooling and heating system for the test plates, cooling and humidifying system
for the chamber. The test chamber provides an enclosed space for frost growth and for
ambient control. The chamber is made of transparent acrylic glass for observation. The
top of the chamber is open with a heat sink sitting on it. An opening at the side is to place
the test plate. The test plate is aluminum and is placed vertically inside the chamber. A
thermoelectric module is used to cool the test surface down up to -20 °C during the frost
growth period. The hot side of the thermoelectric module is cooled by a cooling water
block through which chilled water passes. The thermoelectric module is powered by BK
DC power supply. A film heater is placed between the test plate and the thermoelectric
module to heat up the test surface during the defrost process.
The chamber temperature is controlled by the four thermoelectric modules
connected in parallel. A heat sink attached to the thermoelectric module is used to absorb
heat from the chamber air. Two cooling fans circulate the air inside the chamber. Two
types of fans are applied with the specified volumetric flow rate of 311 L/min (11 CFM)
and 934 L/min (33 CFM). An air pump is used to extract air from the chamber and pipe
the air back into the chamber after humidifying. A water flask works as a saturator filled
with distilled water. Humidity inside the chamber is controlled by a flowmeter connected
downstream of the air pump. Data sets are collected by Agilent data acquisition unit with
multiplexer of 22 channels. Two high resolution cameras are set up at the front and side
of the test chamber separately to capture the pictures during the frost growth period and

58
(a)
(b)
Figure 5.1. Experimental set-up.
(a) Apparatus layout; (b) Test chamber and humidity generator.

59
the defrost process. The experimental apparatus is listed in Appendix A, and design
drawings can be found in Appendix B.
5.2 Design analysis
The experiments are designed for frost and defrost cycles. The test plate
temperature can decrease from the melting temperature up to -20 °C. Chamber
temperature can vary from the ambient temperature to -10 °C, and chamber humidity can
be controlled through a wide range. The temperature variation across the test surface is
limited to ~1 °C. During the frost growth period, the surface temperature and the heat
flux across the test plate reach to a steady state. During the defrost process, the surface
temperature increases with time, and the heat flux across the test plate is variant with time.
Thick frost layers grow with low plate temperature, high ambient temperature,
and high humidity. A relation of frost properties with the test condition is shown in Table
5.1. From the table, a dense frost layer is obtained with high plate temperature, high
ambient temperature, high air velocity and low humidity. In the experiments, the chamber
temperature is set to the ambient temperature, and the chamber humidity is set ~50%.
The plate temperature is set to ~-20˚C.
5.2.1 Test plate dimensions
The dimensions of the test plate are designed to promote the slumping conditions.
When the melting starts, the motion of the frost column is determined by the forces acting
on it. Gravity and surface tension are functions of the surface dimensions of the test plate.
A static force analysis is described in Chapters 3 and 4. The ratio of the gravity to the
surface tension is,
FR =gρi(1 − ε)Wδf0
(−γ0
TkpT + γ0) ∙ 2(1 + r) ∙ cosθ
. (4.50)
Substituting with cosθ = 1, γ0 = 76mN
m, ε = 0.6, δf = 1 mm, r = 1, FR = 1, the width
of the test plate is 40 mm to achieve the slumping condition.

60
Table 5.1. Relation of frost properties with the test conditions.
Time
Humidity
Plate
surface
temp.
Ambient
temp.
Air
velocity
(Re)
Wettability
(CA)
Frost density + - + + + - Frost growth
rate - + - + +
Frost
thickness + + - + +
Frost mass + + - + +
“+” means dependent variables increase with the increase of the independent variables;
“-” means dependent variables decrease with the increase of the independent variables.
5.2.2 Film heater
A film heater is located between the thermoelectric module and the test plate to
heat up the test plate during the defrost process. The film heater is the same size as the
test plate. The voltage of the heater is 28 V, and the watt density is 10 W/in2.
5.2.3 Chamber energy balance
The chamber is a space with controllable temperature and humidity. The
temperature can be cooled down by the thermal electric modules on the top of the
chamber. During the defrost process, heat transfer from the test plate into the chamber
causes the temperature inside to change. The dimensions of the chamber are designed to
maintain a steady temperature condition. Heat transfer into the chamber depends on the
heat transfer coefficient on the test plate, the temperature difference between the frost
surface and the ambient air inside the chamber,
Qch = haAs∆t(Tfs − Tch). (5.1)
The temperature change inside the chamber is,
∆Tch =Qch
(ρcp)aVch
. (5.2)
Heat transfer into the frost layer includes sensible heat and latent heat,

61
Figure 5.2. Chamber volume versus chamber temperature
for a change of 1 K in the chamber.
Qsen = qs" As∆tsen = (mcp)f∆Tf , (5.3)
Qlat = qs" As∆tlat = mfLf . (5.4)
The temperature change inside the chamber becomes,
∆Tch =haAs∆tsen(Tfs − Tch) + hAs∆tlat(Tm − Tch)
(ρcp)aVch
. (5.5)
To maintain a constant temperature, chamber volume increases with the heat
transfer coefficient, the test surface area, frost thickness, chamber temperature, and
decreases with the applied heat flux and the porosity. Substituting values with As =502
mm2, Tfs =- 20 °C, h = 5 W/m2-K, = 0.04, qs” = 3000 W/m2, f = 5 mm, and mf =6.9 g,
the volume of chamber is a function of the chamber temperature as shown in Fig. 5.2.

62
During the defrost process, the circulation fan stops, and the heat transfer coefficient
becomes small. The internal chamber volume is about 0.003 m3.
5.2.4 Heat transfer coefficient
Heat transfer coefficients differ for the frost growth and defrost processes. When
frost grows, the cooling fan inside the chamber is on to circulate the air. The heat transfer
coefficient is calculated with an empirical correlation under the forced convection
condition. During the defrost process, the cooling fan is off, and the free convection
determines the heat transfer coefficient. When forced convection over the vertical plate
dominates, the velocity of circulating air is,
ua =Volumetric flow rate
Area=
66 CFM
5" ∗ 4"= 2.4
m
s . (5.6)
Reynolds number is,
Re =ρuaL
μa= 9000 (Laminar flow) . (5.7)
The film temperature is,
Tf =Tfs + Tch
2 , (5.8)
and the average Nusselt number with constant temperature at the test surface is [107],
Nu =hL
k= 0.664Re1/2Pr1/3 = 53.2 . (5.9)
The average heat transfer coefficient is,
h =Nu k
L= 25.5 . (5.10)

63
With constant heat flux at the test surface, local Nusselt number is,
Nux =hxx
k= 0.453Rex
1/2Pr1/3 . (5.11)
Local heat transfer coefficient is,
hx =Nuxk
x=
0.453 (ρuax
μa)
1/2
Pr1/3
x . (5.12)
The relation of local Nusselt number and local heat transfer coefficient on the test plate
are shown in Figs. 5.3 and 5.4.
When circulation fans are off, the heat transfer coefficient for free convection is,
Nu =hL
k= (
4
3) (
GrL
4)
14
m(Pr) , (5.13)
where
m(Pr) = (0.75Pr1/2)(0.609 + 1.221Pr1/2 + 1.238Pr)−1/4
, (5.14)
and
Gr =gβ(Tfs − Tch)L3
υ2 . (5.15)
The heat transfer coefficient is a function of the temperature difference between the frost
surface and the chamber as shown in Fig. 5.5.
5.2.5 Heat flux at the test surface
During the defrost process, heat flux at the test surface depends on the electric
power into the test plate, the melting rate of the frost layer and the heat transfer into the

64
Figure 5.3. Local Nusselt number at constant heat flux
where chamber air velocity is 2.4 m/s.
Figure 5.4. Local heat transfer coefficient at constant heat flux
where chamber air velocity is 2.4 m/s.

65
Figure 5.5. Heat transfer coefficient versus temperature difference between the test plate
and surrounding under free convection where Pr = 0.7, L = 5.5 cm.
chamber. When assuming a uniform temperature across the test plate, the energy
equation before melting can be described as,
(ρcp)Al
VdTtp
dt+ (ρcp)
fδfAs
dTf
dt= As[qs
" − ha(Tfs − Tch)] . (5.16)
When melting starts, air in the frost layer is replaced by meltwater, which forms a
permeation layer, and the energy equation becomes,
(ρcp)Al
VdTtp
dt+ ρpLfAs
dδp
dt= As[qs
" − ha(Tfs − Tch)] . (5.17)
To investigate the temperature response at the test surface, a simplified equation
based on the lumped analysis is applied when Biot number,

66
Bi =haδ
k=
50W
m2K 5 mm
200W
mK
< 0.1 . (5.18)
The energy equation for the test plate is,
(ρcp)Al
VdTtp
dt= As[qs
" − ha(Ts − Tch)] . (5.19a)
(ρcp)Al
δd(Ttp−Tch)
dt= qs
" − ha(Ts − Tch) . (5.19b)
The initial temperature at the test surface is,
t = 0, Ts = Tch . (5.19c)
Heat flux at the test surface is,
ha(Ttp − Tch) = qs" − [qs
" − ha(Ts − Tch)]e−
ha
(ρcp)Al
δt
. (5.20)
A relation of heat flux with time is shown for free convection and forced
convection in Fig. 5.6.
During the defrost process, heat flux at the surface changes with time and is
expected to reach a steady value with a large enough heat transfer coefficient.
5.2.6 Heat sink
The chamber is cooled by thermoelectric modules, and the heat is removed by a
heat sink on top of the chamber. The heat load from the chamber is,
Q = (ρcp)aVch∆Tch . (5.21)
Thermal resistance includes the fin resistance and the base resistance.

67
Figure 5.6. Heat flux at test surface.
Rth,tot = Rth,conv + Rth,cond , (5.22)
Rth,conv =1
h[(Nfin − 1)(bl)L + Nfinηfin2HfinL] , (5.23)
Rth,cond =Htot − Hfin
kAlWL . (5.24)
where Nfin is the number of fins, ηfin is the fin efficiency, bl is the gap between fins, L is
the base length, W is the base width, Htot is the total height of the heat sink, and Hfin is
the height of the fin. The gap between fins, bl, is given by,
bl =W − Nfinδfin
Nfin − 1 , (5.25)
where δfin is the thickness of fins.
The fin efficiency is given by,

68
ηfin =tanh (mHfin)
mHfin , (5.26)
where m =2h
kAlδfin .
5.2.7 Thermoelectric module
To achieve the temperature of -20˚C, the test plate is cooled using a thermoelectric
module during the frost growth period. The capacity of the thermoelectric module is
verified by using heat balance method. During the frost process, steady state is achieved
when the heat flux from the cold side of the thermoelectric module equals the convection
heat transfer to the chamber.
qc" = hc(Tch − Ts) . (5.27)
The heat transfer coefficient in the chamber is approximated to be 25.5 W/m2/K.
The chamber temperature ranges from -10 °C to 25 °C, and test surface temperature is
from -20 °C to 0 °C. In order to achieve a large load, the maximum temperature difference
and a scale factor of 2 are applied.
qc" = 2 × 25.5
W
m2K(25 − (−20))K = 2295
W
m2 . (5.28)
The cold side temperature of the thermoelectric module is,
Tc = −qc
" t
kAl+ Ts . (5.29)
As the thermal resistance is relatively small, the cold side temperature of the
thermoelectric module is approximated to be the test surface temperature. when assuming
the hot side temperature of the thermoelectric module to be 35˚C, the maximum
temperature difference becomes 55˚C. Heat transfer on cold side is,

69
qc = qc" A = 2295
W
m2× 0.0382m2 = 3.3 W . (5.30)
Referring to the thermoelectric module performance, current is approximated to
be 5 A, and voltage is 10 V. The thermoelectric module, the input power is,
Pwrin = I ∙ U = 5A × 10V = 50 W . (5.31)
Heat transfer on hot side is,
qh = Pwrin + qc = 53.3 W . (5.32)
The hot side temperature of the thermoelectric module is,
Th = Ta + Rth,finqh . (5.33)
The thermal resistance of the heat sink is approximated with 0.1 °C/W. The hot side
temperature is,
Th = 25 ˚C + 0.1˚C
W× 53.3W = 30 ˚C . (5.34)
As the calculated hot side temperature is smaller than the assumed hot side
temperature of 35˚C, the thermoelectric module is verified to be able to cool the test
surface down to -20˚C.
5.2.8 Insulation
The test chamber is wrapped with one-inch-thick lightweight polystyrene foam
insulation. The heat flow rate (k-factor)18 of the insulation is 0.26 at 75 ˚F.
18 k-factor is the time rate of steady heat flow through a unit area of homogeneous material induced by a
unit temperature gradient in a direction perpendicular to that unit area.

70
5.3 Data acquisition and uncertainty analysis
During the frost and defrost cycle, the frost properties include frost thickness, frost
mass and frost density. The defrost properties include defrost time and efficiency.
5.3.1 Data acquisition set
Two important variables in the experiments are defrost time and defrost efficiency.
A set of experiments carry out on different test surfaces with varying wettability. In
Chapter 3, a theoretical efficiency is defined as the ratio of the energy required to melt
the frost to the total heat applied at the surface.
ηdf =(1 − ε)ρiδf[Lf + (cp)i∆Tf]
qs" tdf
. (3.32)
In the experiments, a practical definition of defrost efficiency is,
ηdf =energy required to melt the frost layer
total actual energy consumption . (5.35)
ηdf =mf(Lf + cp,f∆Tf)
Pwr ∗ tdf . (5.36)
Total energy required includes the sensible heat and latent heat to melt the frost layer.
The energy consumption is the actual power output multiplied by the total defrost time.
Defrost time includes the time for surface preheating, frost melting and the retention water
drying-out.
The experimental data sets include a number of measurement variables and
dependent variables. During the frost formation period, measurement variables are the
temperature and humidity of the chamber, saturated air flow, temperature of the test
surface, heat flux across the test plate, frost growing hours and actual power output. For
the frost properties, when measuring frost thickness and mass directly, frost density is a
dependent variable. During the defrost process, measurement variables are the
temperature and humidity of the chamber, temperature at the test surface, heat flux across
the test plate, defrost time and actual power output. Defrost efficiency is a dependent

71
variable. Two sets of experimental data are acquired for the large test surface (50 x 50
mm) and small test surface (38 x 38 mm). Frost grows for different period on the prepared
surfaces. Defrost process runs with high heating power and low heating power.
5.3.2 Measurement methods
Measurements include the air temperature and humidity inside the chamber, the
temperature at the test surface, heat flux across the test surface, air flow, defrost time,
frost thickness and frost mass.
The temperature inside the chamber is measured by a shielded type T
thermocouples installed at the chamber wall and a thin-film 100 Ω platinum RTD
included in the relative humidity temperature transmitter. The humidity transmitter with
a current output 4 to 20 mA is used to monitor the relative humidity inside the chamber.
Saturated air flow is adjusted by a glass tube flowmeter to control the chamber humidity.
The temperature of the test surface is measured with five type T thermocouples.
Four of them are placed into the holes at the four corners of the test plate, and one is in
the groove at the center. Thermocouples are sealed with high thermal conductive epoxy.
Heat flux across the test surface is measured by a heat flux sensor that functions as a self-
generating thermopile transducer. The readout is obtained by connecting to a DC micro-
voltmeter. A built-in Type-K thermocouple is used to measure the heat flux sensor
temperature. When the test plate is dry, heat transfer coefficient is calculated by
measuring the heat flux across the test surface, the temperature at the test surface, and the
air temperature inside the chamber at steady state.
Frost thickness is measured via imaging technique. A camera is seated at the side
of the test chamber to capture images of the frost thickness. The images are processed in
ImageJ. The thickness measured by imaging might be larger than the actual thickness of
the frost layer due to the edge effect. A correlation derived by Janssen [10] is used in the
frost thickness measurement.
δf = 0.0045Θ(Θ−4.721)tΘ , (5.37)
where the dimensionless temperature is,

72
Table 5.2. Instrument accuracies.
Measurement Instrument Accuracy
Temperature Type-T thermocouple ±0.5 °C
Humidity/Temperature Omega HX94C ±2%/±0.6 °C
Heat flux Omega HFS-4 ±0.5%
Flow Omega FL2012 ±5%
Time Agilent BenchLink Data Logger 3 0.01 s
Mass Electrical scale ±3 mg
Θ =Ta − Tdp
Ta − Tw . (5.38)
Total mass of the frost column is calculated by weighing the saturator before and
after the frost growth. The mass of the meltwater is also measured. Frost mass can be
determined by obtaining the weight reduction of the water in the saturator and the change
of vapor pressure in the chamber, or by weighing the meltwater.
∆mf = ∆msat − ∆mv , (5.39)
∆mv =∆PvVMv
RTch
, (5.40)
∆Pv = ∆ΦPg , (5.41)
where Φ is the relative humidity of air inside the chamber, and Pg is the saturated pressure
at the chamber temperature.
A tabulated list of measurements and instruments is in Appendix C.
5.3.3 Experimental uncertainty
The uncertainty of the direct measurement variables refers to the manufacturer’s
specification as listed in Table 5.2.

73
Table 5.3. Uncertainty of dependent variables.
Measurement Accuracy
Frost thickness ±0.01 mm
Frost mass ±5%
Defrost efficiency ±10%
The uncertainty of dependent variables is determined by the root sum of squares
method. Uncertainty of frost thickness depends on the pixel calibration by using the
visual imaging technique. An uncertainty of ±0.01 mm can be obtained with good
calibration.
The uncertainty of frost mass can be calculated by,
Umf= √(
∂mf
∂msatUmsat
)2
+ (∂mf
∂mvapUmvap
)
2
= √(Umsat)
2+ (Umvap
)2
. (5.42)
The uncertainty of vapor mass can be given by,
Umvap= √(
∂mvap
∂ΦUΦ)
2
+ (∂mvap
∂TchUTch
)
2
, (5.43a)
Umvap= √(
PgVMvap
RTch
UΦ)
2
+ (∆ΦPgVMvap
RTch2 UTch
)
2
. (5.43b)
Defrost efficiency is given by,
Uηdf= √(
∂ηdf
∂mfUmf
)2
+ (∂ηdf
∂TfUTf
)2
+ (∂ηdf
∂qsUqs
)2
+ (∂ηdf
∂tdfUtdf
)2
. (5.44)
The uncertainty of the dependent variables is listed in Table 5.3.

74
Table 5.4. Characterization of the sample surfaces.
Surface
structure Sample 1 Sample 2 Sample 3 Sample 4 Sample 5
Surface material Al 6061 Al 6061 Al 6061 Al 6061 Al 6061
Surface
machining
32 μin. or 0.8 μm
32 μin. or 0.8 μm
32 μin. or 0.8 μm
32 μin. or 0.8 μm
32 μin. or 0.8 μm
Surface finish
with 320 grit
sandpaper
8 μin. or 0.2 μm
8 μin. or 0.2 μm
8 μin. or 0.2 μm
8 μin. or 0.2 μm
8 μin. or 0.2 μm
Surface coating Hydrochloric
acid
Commercial
hydrophilic
coating
Plain
Solution of
stearic acid
and acetone
Commercial
hydrophobic
coating
Static contact
angle (˚) <5 51 71 119 146
5.4 Surface preparation
The test surfaces are treated for five different contact angles. Surface wettability
can be modified in two ways. One way is to change the micro structure of the surface,
and another way is to alter the surface energy with chemical treatment. The treatment
methods are characterized in Table 5.4. The superhydrophilic surface is obtained by
soaking the test plate in 17% hydrochloric acid solution for about 10 min and rinsing with
distilled water. A hydrophilic coating applies to the test plate for the hydrophilic surface
with contact angle of 51°. The hydrophobic surface is obtained by soaking the test plate
in the solution of stearic acid and acetone (0.284 g/100 ml). A commercial hydrophobic
coating, NeverWet superhydrophobic coating, applies on the plate to get a
superhydrophobic surface with contact angle of about 146°.
The static contact angles are measured using the sessile drop method. A 1 ml
needle pump is used to apply droplet on the test surface with one droplet volume is about
3 μl. The geometries of the droplets are taken with Bigcatch DCM510C and Navitar
zoom 7000 as shown in Fig. 5.7. The contact angles are measured using the open program
ImageJ. The advancing and receding contact angles are measured on a tilted plate with
adjustable sliding angles. The pictures are taken where the droplet grows large enough
to roll down the tilted plate as shown in Fig. 5.8.

75
(a) (b)
(c) (d)
Figure 5.7. Static contact angles.
(a) CA=51°; (b) CA=71°; (c) CA=119°; (d) CA=146°.
Figure 5.8. Dynamic contact angles.
θrec=107°, θadv=149° (sliding angle ~28°).

76
6 Results
6.1 Analytical and numerical results
In the absorption stage, the frost layer at the test surface melts, and the melting
rate depends on the heat flux applied at the test surface, latent heat of fusion, and the
density of the permeation layer at the test surface. The relation of the rate of melting with
the heat flux and the porosity of the frost layer is described in Eqn. (3.3) and shown in
Figs. 6.1. and 6.2.
The rate of melting increases with the porosity smoothly. When the frost layer is
less dense, the melting process goes faster. The rate of melting increases from 0.01 mm/s
to 0.1 mm/s when the porosity increases from 0.1 to 0.9. When the porosity is 0.4, the
rate of melting is 0.016 mm/s. For a frost layer with 3 mm, the melting time is 187 s.
The dependence of the rate of melting on the heat flux is linear. The rate of
melting is directly proportional to the heat flux applied and increases from 5.5x10⁻⁴ mm/s
to 0.03 mm/s when the heat flux increases from 300 W/m2 to 6000 W/m2 where the
porosity is 0.4.
In the absorption stage, water saturation S is a function of time and location as
described in Eqns. (3.10), (4.4). The distribution of water saturation depends on the
permeability of the porous medium and capillary pressure, which are assumed to be
functions of the water saturation. The relation of the water saturation with time and
location are show in Figs. 6.3. and 6.4. The permeability power index and the capillary
pressure are not available for the frost column in the current literatures. The values used
herein are for snow in the references [76-78]. It is shown that water saturation increases
with time and decreases with location due to the meltwater transportation. At the location
that is close to the surface, the water saturation increases rapidly in a second as the
boundary condition at the surface is assumed to be one. The energy balance in frost layer
are described in Eqns. (3.12), (4.12). Dimensionless temperature distribution and
evolution are shown in Figs. 6.5. and 6.6. Dimensionless temperature decreases with time
and location. Dimensionless temperature at the frost/air interfaces is close to 0.14 at 10
s. The dimensionless temperature profile becomes flat at about the half of the thickness.

77
Figure 6.1. The rate of melting versus porosity. qs” = 3000 W/m2.
Figure 6.2. The rate of melting versus heat flux applied at the test surface. ε = 0.4.

78
Figure 6.3. Water saturation versus time.
qs” = 3000 W/m2, ε = 0.6, δf = 5 mm, p = 3, q = 1, K = 3x10-12 m2, C = 43 Pa.
Figure 6.4. Water saturation versus location.
qs” = 3000 W/m2, ε = 0.6, δf = 5 mm, p = 3, q = 1, K = 3x10-12 m2, C = 43 Pa.

79
Figure 6.5. Dimensionless temperature of frost layer versus time.
qs” = 3000 W/m2, ε = 0.7, δf = 5 mm, ha = 5 W/m2-K.
Figure 6.6. Dimensionless temperature distribution in frost layer.
qs” = 3000 W/m2, ε = 0.7, δf = 5 mm, ha = 5 W/m2-K.

80
Figure 6.7. Comparison of draining velocities with different boundary conditions.
α = 1.2, K = 10-9 m2, b = 20 µm.
Draining velocities are described in Eqns. (4.37), (4.38). The velocity profiles are
determined by the boundary conditions at the solid/water interface and at the
water/permeation interface. The curves in Fig. 6.7 are the dimensionless drainage
velocities with respect to the variant boundary conditions. Three boundary conditions are
presented, and they are no slip boundary conditions at the solid/water interface and at the
water/permeation interface, no slip boundary condition at the solid/water interface, and
slip boundary condition at the water/permeation interface, slip condition for hydrophobic
surface at the solid/water interface and slip condition at the water/permeation interface.
The maximum draining velocity occurs when slip conditions are applied to the boundaries
at the two interfaces. To better show the improvement of drainage process on the
hydrophobic surface, the maximum and the average drainage velocity and the average
drainage rate are quantified and listed in Table 6.1.
The drainage velocity depends on fluid properties, the slip length at the
solid/water interface, the water film thickness, the slip coefficient at the water/permeation
interface, and the permeability of the porous medium. Slip condition results from an

81
Table 6.1. Comparison of drainage velocity and average drainage rate. Maximum
velocity
(m/s)
Average
velocity
(m/s)
Average drainage
rate
(m3/s)
Improvement
of draining
rate (%) No slip condition at the
solid/water interface and at
the water/permeation
interface
0.437
0.288
8.9 × 10⁻⁶
No slip condition at the
solid/water interface and
slip condition at the
water/permeation interface
0.468
0.318
9.83 × 10⁻⁶
10
Slip condition at the
solid/water interface and at
the water/permeation
interface
0.49
0.341
1.05 × 10⁻⁵
7.1
*Note: Melting rate is 0.016 mm/s where the heat flux applied is 3000 W/m2 and the porosity is 0.4. The
thickness of water film is 0.8 mm and the width of the plate is 38 mm.
interplay of many physical and chemical parameters. The influencing factors include the
surface wettability, surface roughness, and impurities and shear rate. On a macroscopic
level, a large scale of the slip length can be explained as a formation of gas film or phase
separated lubricant with lower viscosity between the fluid and the solid wall. An
engineered nanostructured superhydrophobic surface can minimize the liquid-solid
contact area so that the liquid flows over a layer of air. The surface demonstrates dramatic
slip effects with a slip length of ~20 µm in water flow. The effect of slip length on the
drainage velocity is shown in Fig. 6.8.
The slip coefficient is experimentally determined and depends on the structure of
the material at the surface. The experiments show that the slip coefficient of a metal
material depends directly on the “average pore diameter” at the interface. The study on
the slip coefficient applies to the experimental condition where the gap between the
permeable wall and the impermeable wall is much larger than the pore size of the porous
material. Taylor and Richardson [91,92] propose a mathematical model and compare the
results between the theory and the experiments. The study demonstrates that the slip
coefficient is not independent of the external means that producing the external tangential
stress. Sahraoui and Kaviany [93] investigate the two-dimensional flow field near the
porous medium made of cylinders. The simulation shows that the slip coefficient depends
on structure, porosity, flow direction, Reynolds number, the extent of the plain medium

82
Figure 6.8. The effect of slip length on the draining velocity.
and the non-uniformities in the arrangement of surface particles.
During the drainage stage, defrost time and efficiency are given in Eqns. (3.31),
(3.32). Defrost time and efficiency are determined by the heat flux applied at the test
surface, the thickness of the water film, the porosity and thickness of the frost layer.
Defrost time consists of melting time and draining time. Porosity and applied heat flux
are the two factors that can influence the melting time significantly. The relation of
melting time with frost thickness and ambient temperature are shown in Figs. 6.9. and
6.10.
Draining time depends on the porosity, the frost thickness, the height of the plate
and the water film thickness, as shown in Figs. 6.11.- 6.14. It is shown that the water film
thickness significantly influences the drainage time. Draining time decreases with
increase of the porosity and increases with the frost thickness. Draining time decreases
from 137 s to 0.14 s when the water film thickness increases from 0.1 mm to 1mm, and
it decreases sharply with the water film thickness from 0.1 mm to 0.2 mm and goes flat
around 0.4 mm.

83
Figure 6.9. Melting time versus the initial frost thickness.
qs” = 3000 W/m2, Ta = -5 °C.
Figure 6.10. Melting time versus ambient temperature.
qs” = 3000 W/m2, δf0 = 3 mm.

84
Figure 6.11. The relation of draining time with porosity. H = 38 mm.
Figure 6.12. The relation of draining time with the initial frost thickness.
H = 38 mm.

85
Figure 6.13. The relation of draining time with the height of test plate. δf0 = 3 mm.
Figure 6.14. The relation of draining time with the water film thickness.
H = 38 mm.

86
For relatively large thicknesses of the water film, the draining time is small
compared to the melting time. The relation of defrost time with the porosity, the water
film thickness, the heat flux and the height of the test plate are shown in Figs. 6.15.- 6.18.
Defrost time is sensitive to the water film thickness and the height of the test plate. The
influence of water film thickness on the defrost time is illustrated in Figs. 6.15. and 6.16.
The variation between the melting time and the draining time is relatively small where
the water film thickness equals 0.3 mm. Defrost time is thus determined by the melting
time and the draining time. When the water film thickness equals 0.6 mm, defrost time
is mainly determined by the melting time, and the draining time is relatively small. The
influence of the height of test plate on defrost time is shown in Fig. 6.17. When the height
of test plate equals 38 mm, draining time is relatively small, and the defrost time is mainly
determined by the melting time. Defrost time increases with the decrease of the heat flux
as shown in Fig. 6.18.
The relation of drainage time and defrost time to surface wettability are shown in
Figs. 6.19. and 6.20. When the height of the test plate is relatively small and the water
film thickness is relatively large, the melting time is much larger than the draining time.
Defrost time is mainly determined by the melting time. In this scenario, the effect of
surface wettability on the defrost time is insignificant. The smallest drainage time occurs
when slip boundary conditions apply at both the solid/water interface and the
water/permeation interface. When the water film gets thinner, the effect of the slip
boundary conditions gets larger on the average velocity and the draining time. Defrost
time is smallest with slip conditions at both interfaces. The effect of the slip conditions
is less significant on defrost time compared to that on the draining time.
Defrost efficiency depends on applied heat flux at the solid surface, the water film
thickness, the height of the test plate, heat transfer coefficient at the permeation/air
interface, the ambient temperature and the slip conditions at the solid/water interface and
at the water/permeation interface. For the given conditions, defrost efficiency with slip
condition is improved about 5.5% compared to that with no slip boundary condition at
the solid/water interface.

87
Figure 6.15. The relation of defrost time with the porosity.
qs” = 8000 W/m2. H = 380 mm. δw = 0.3 mm.
Figure 6.16. The relation of defrost time with the porosity.
qs” = 8000 W/m2. H = 380 mm. δw = 0.6 mm.

88
Figure 6.17. The relation of defrost time with the porosity.
qs” = 3000 W/m2. H = 38 mm. δw = 0.3 mm.
Figure 6.18. The relation of defrost time with the porosity.
qs” = 3000 W/m2. H = 380 mm. δw = 0.3 mm.

89
Figure 6.19. Comparison of the draining time with different boundary conditions.
H = 380 mm. δw = 0.3 mm.
Figure 6.20. Comparison of defrost time with different boundary conditions.
qs” = 3000 W/m2. H = 380 mm. δw = 0.3 mm.

90
6.2 Slumping criterion
Slumping conditions have been discussed in each stage of the melting process. A
general formula is defined based on the static force analysis as described in Eqns. (4.50),
(4.51). The ratio of gravity to the retaining force is defined as a measure of the slumping
possibilities. Retaining forces vary with the different stages in the melting process. In
the absorption stage, the retaining force is the adhesion due to shear force. In the
accumulation and the drainage stages, the retaining forces are surface tension around the
perimeters of the frost column. The ratio of gravity to surface tension is bigger in the
accumulation stage. The possibility of frost slumping is thus higher during the
accumulation stage. The force ratio is related to the porosity and thickness of the frost
layer, the geometry of the test plate, the temperature at the test surface and the surface
characteristics of the test surfaces.
The force ratio with respect to the porosity is shown in Fig. 6.21. The slumping
ratio decreases from 2.5 to 0.36 when the porosity ranges from 0.3 to 0.9. When the
porosity is larger than 0.7, the frost layer is very loose, and the slumping is unlikely to
occur, based on estimates using the given parameters. Dense frost falls off falls off more
easily compared to the loose frost layer. The force ratio with respect to the aspect ratio
is shown in Fig. 6.22. At the given width of the test plate, the slumping force ratio
decreases from 2.6 to 0.7 when the aspect ratio increases from 0.1 to 3. When the aspect
ratio is greater than 1.8, the slumping force ratio is less than 1. A larger force ratio favors
slumping at a given width of the test plate. Temperature has influence on the surface
tension. The higher the temperature, the smaller the surface tension is. The force ratio
thus is related to temperature as shown in Fig. 6.23. The force ratio increases from 0.97
to 1.07 when the temperature increases from -5 °C to 30 °C. In the absorption stage, the
temperature at the test plate surface maintains the melting temperature as the mixture of
the ice crystals and the meltwater is attached to the test plate.
The effect of surface wettability on the force ratio depends on the physical models
of the slumping condition. A thin water film is assumed to form on hydrophilic surfaces
during the melting process, and the surface tension depends on the contact angle of water.
For hydrophobic surfaces, water droplets are assumed to distribute on the test plate, and
the surface tension depends on the receding and advancing contact angles.

91
Figure 6.21. Force ratio versus porosity.
W = 38 mm. δf0 = 3 mm. r = 1. CA=20°.
Figure 6.22. Force ratio versus aspect ratio of the test plate.
W = 38 mm. δf0 = 3 mm. ε = 0.6. CA=20°.

92
Figure 6.23. Force ratio versus temperature at the surface.
W = 38 mm. δf0 = 3 mm. r = 1.2, ε = 0.6. CA = 20°.
The force ratio with respect to the contact angle on hydrophilic surfaces is shown
in Fig. 6.24. When the contact angle is less than 50°, the force ratio increases smoothly
with the contact angle. The force ratio with respect to the receding contact angle and the
contact angle hysteresis for hydrophobic surfaces is shown in Fig. 6.25. Three contact
angle hysteresis values are applied, and they are 5°, 15° and 30°. The force ratio increases
with the receding contact angle and decreases with the contact angle hysteresis. When
the contact angle hysteresis is 5°, the force ratio is about five times of that when the
contact angle hysteresis is 30°. The slumping condition is favorable with a large force
ratio where the surface energy is low and the contact angle hysteresis is small.
Based on the assumptions on the physical mechanism of slumping condition, the
force ratio is the smallest where the surface is fully wetted. The force ratio is much greater
than unity on hydrophobic surfaces where the contact angle hysteresis is 5°. With the
increase of the contact angle hysteresis, the difference of the force ratio on hydrophobic
and hydrophilic surfaces decreases. The slumping would be likely to occur on
hydrophobic surfaces with small contact angle hysteresis.

93
Figure 6.24. Force ratio versus contact angle on hydrophilic surfaces.
W = 38 mm. δf0 = 3 mm. r = 1.2, ε = 0.7.
Figure 6.25. Force ratio versus receding contact angle on hydrophobic surfaces.
W = 38 mm. δf0 = 3 mm. r = 1.5, ε = 0.7.

94
Figure 6.26. Force ratio versus porosity and contact angle.
W = 38 mm. δf0 = 3 mm. r = 1.2.
Figure 6.27. Force ratio versus aspect ratio and contact angle.
W = 38 mm. δf0 = 3 mm., ε = 0.7.
With the specified surface temperature, the relation of slumping ratio with respect
to porosity, aspect ratio and surface contact angle are shown in Figs. 6.26. and 6.27.

95
6.3 Experimental results
Experiments are tested on two sizes of test surfaces: 50 mm x 50 mm surface and
38 mm x 38 mm surface. A large surface area is tested to reduce the effect at the edges.
Two sets of apparatus are sized for the test surfaces. Six test samples are tested and
numbered, as shown in Table 6.2. The test conditions for frost growth are shown in Table
6.3. The test surface is cooled down up to -19 °C by the thermal electric module.
Chamber temperature is the ambient temperature that is maintained at 19 °C to achieve
high supercooling. The relative humidity is as high as 51% to increase the supersaturation
for frost growth.
The front and side views of the frost formation process for the superhydrophilc,
plain and superhydrophobic surfaces are shown in Figs. 6.28. - 6.33. Superhydrophilic
and surperhydrophobic surfaces are relatively rough compared to the plain surface. At
the first 10 min, the photos record the vapor nucleation process and the frost formation
process. Condensation is observed over 5 min on all the different surfaces. Observations
show that the superhydrophobic surface does not significantly retard nucleation and frost
formation. It can be seen that condensation spreads over the test surface in 5 min from
Fig. 6.32(b). The reason might be that high supercooling degree and high relative
humidity speed up the vapor nucleation process in the experiments. Crystal growth starts
at ~10 min, followed by the frost growth at all the different surfaces. Frost gets denser
where part of the vapor diffuses into it and gets thicker with the deposition of the vapor
on the frost surface. The densification and thickening process are recorded in the photos
taken in the middle and at the end of the frost growth process where t =1 h, 3 h and 6 h.
Frost properties on the six surfaces are listed in Table 6.4. The frost mass increase
with time, as shown in Fig. 6.34. The density increases with time, but the variation of the
density on the different surfaces is not significant. The reason could be that the
temperature at the test surface and the temperature and humidity inside the chamber
change slightly, which would influence the thickness accordingly. The uncertainties of
the thermocouples and the humidity transmitters also change the dew point temperature
and, thus, the thickness to some extent. Also, due to edge effects, the frost on the edges
are thicker and denser compared to frost on the center of the surface.

96
Table 6.2. Test samples numbering. Test plate identifier Test plate dimensions (mm) Test surface CA (°)
TestID-1 38 x 38 x 3.8 < 5
TestID-2 38 x 38 x 3.8 ~ 71
TestID-3 38 x 38 x 3.8 ~ 146
TestID-4 50 x 50 x 5 < 5
TestID-5 50 x 50 x 5 ~ 71
TestID-6 50 x 50 x 5 ~ 146
(a) (b)
(c) (d)
(e) (f)
Figure 6.28. Front view of the frost formation at test surface (TestID-1).
(a) t = 0; (b) t = 5 min; (c) t = 10 min; (d) t = 1 h; (e) t = 3 h; (f) t = 6 h.

97
(a) (b) (c)
(d) (e) (f)
Figure 6.29. Side view of the frost formation at test surface (TestID-1).
(a) t = 10 min; (b) t = 20 min; (c) t = 30 min; (d) t = 1 h; (e) t = 3 h; (f) t = 6 h.
Table 6.3. Frost formation conditions.
Surface
temperature
(°C)
Chamber
temperature
(°C)
Chamber
relative
humidity
(%)
Dew
point
(°C)
Supercooling
(°C)
Test surface
38 x 38 mm -18±2 19±1 46±5 7 25
Test surface
50 x 50 mm -16±2 19±1 46±5 7 23

98
(a) (b)
(c) (d)
(e) (f)
Figure 6.30. Front view of the frost formation at test surface (TestID-2).
(a) t = 0; (b) t = 5 min; (c) t = 10 min; (d) t = 1 h; (e) t = 3 h; (f) t = 6 h.

99
(a) (b) (c)
(d) (e) (f)
Figure 6.31. Side view of the frost formation at test surface (TestID-2).
(a) t = 10 min; (b) t = 20 min; (c) t = 30 min; (d) t = 1 h; (e) t = 3 h; (f) t = 6 h.

100
(a) (b)
(c) (d)
(e) (f)
Figure 6.32. Front view of the frost formation at test surface (TestID-3).
(a) t = 0; (b) t = 5 min; (c) t = 10 min; (d) t = 1 h; (e) t = 3 h; (f) t = 6 h.

101
(a) (b) (c)
(d) (e) (f)
Figure 6.33. Side view of the frost formation at test surface (TestID-3).
(a) t = 10 min; (b) t = 20 min; (c) t = 30 min; (d) t = 1 h; (e) t = 3 h; (f) t = 6 h.

102
Table 6.4. Frost properties.
Frost growth
period
(h)
Frost
thickness
(mm)
Frost mass
(g)
Frost
porosity
TestID-1 4 4.34 1.608 0.72
TestID-1 4 4.26 1.488 0.74
TestID-1 6 5.20 2.267 0.67
TestID-2 4 4.3 1.473 0.74
TestID-2 4 4.38 1.462 0.75
TestID-2 6 5.35 2.236 0.69
TestID-3 4 4.88 1.772 0.73
TestID-3 4 4.8 1.561 0.76
TestID-3 6 5.48 2.55 0.65
TestID-4 4 3.4544 2.78 0.65
TestID-4 4 3.4798 2.744 0.66
TestID-4 4 3.6322 2.617 0.69
TestID-5 4 3.71 2.979 0.65
TestID-5 4 3.86 2.966 0.67
TestID-5 8 5.2324 4.52 0.62
TestID-6 4 3.5814 2.761 0.66
TestID-6 4 3.5814 2.679 0.67
TestID-6 6 4.4196 4.08 0.6
Figure 6.34. Frost mass versus frost growth period.

103
The defrost processes were run on the six test surfaces and recorded for
superhydrophilic, plain and superhydrophobic surfaces, as shown in Figs. 6.35-6.37. The
physical mechanisms of the melting process are very different on the surfaces with
different wettability. On the superhydrophilic surface and the plain surfaces, frost melts
first at the center where frost is less denser and thicker. A large portion of the meltwater
is absorbed into the frost layer at the sides where the frost is denser and thicker. The
remaining meltwater takes the form of water film on the superhydrophilic surface and
retention droplets on the plain surface. The frost at bottom then melts and drains on
superhydrophilic surface. With the water accumulation at the side surfaces, part of the
meltwater drains along the sides. The remaining frost falls off with the meltwater. When
all the frost on the front surface melts away, a water film band is observed at the bottom
part of the superhydrophilic surface, and non-uniform retention droplets are left on the
plain surface.
The melting process on the superhydrophobic surface varies greatly from that on
the superhydrophilic and plain surfaces. Frost slumping occurs on the test surfaces where
frost grows for 3 h, 4 h and 6 h with high heating power and lower heating power applied
separately. When heating applies on the superhydrophobic surface for a period of time,
the frost at the center seems to detach from the surface first, and then the frost falls off as
a whole piece with the heating continues. In the slumping process, the frost layer looks
like a rigid mass, and no water drainage is observed. After the frost slumping, no droplet
is left on the test surface. The different melting mechanisms might be explained by the
two defrost models by Sanders [56]. The absorption model applies to the
superhydrophilic and the plain surfaces. In the melting process, meltwater is absorbed
into the frost layer, and the frost layer maintains the contact with the test surface.
Different from the absorption model, an air gap model applies to the superhydrophobic
surface. During the melting process, meltwater is absorbed into the frost layer leaving an
air gap at the solid/frost interface. The air gap increases the thermal resistance and
reduces the heat transferred into the frost layer. The frost column drops off at the point
where the gravity outweighs the adhesion force.

104
(a) (b) (c)
(d) (e) (f) (g)
Figure 6.35. Defrost process after frost grows for 4 h (TestID-1).
(a) t = 10 s; (b) t = 30 s; (c) t = 40 s; (d) t = 60 s; (e) t = 80 s; (f) t = 120 s; (g) t = 160 s.

105
(a) (b) (c)
(d) (e) (f) (g)
Figure 6.36. Defrost process after frost grows for 4 h (TestID-2).
(a) t = 10 s; (b) t = 20 s; (c) t = 40 s; (d) t = 60 s; (e) t = 90 s; (f) t = 92 s; (g) t = 100 s.

106
(a) (b) (c)
(d) (e) (f) (g)
Figure 6.37. Frost slumping process after frost grows for 6 h (TestID-3).
(a) t = 10 s; (b) t = 80 s; (c) t = 100 s;
(d) t = 110 s; (e) t = 120 s; (f) t = 126 s; (g) t = 130 s.
The small test plates (38 mm x 38 mm) are heated by the thermoelectric module
with the DC power settings of 60 W, 15 W and 6 W. The defrost properties are listed in
Table 6.5. During the defrost process, the actual output of the DC power varies with time.
Heat flux at the test plate varies with time as shown in Fig. 6.38. Heat flux increases
rapidly at the first 20 s because the temperature at the heat flux sensor increases much
quicker than that at the test plate. When the temperature difference between the heat flux
sensor and the test plate becomes smaller, the heat flux decreases accordingly. The profile
of the heat flux is consistent with the profile of the temperature difference between the
heat flux sensor and the test plate as shown in Fig. 6.39. The temperature at the test

107
Table 6.5. Defrost properties for test surfaces 38 mm x 38 mm.
Frost
mass
(g)
Average
heat flux
applied
(W/m2)
Time to
melting
temperature
(s)
Defrost
time
(s)
Time to
dry out
(s)
Defrost
efficiency
(dry
surface)
Defrost
efficiency
(wet
surface)
TestID-1 1.608 3525 25 89 171 0.07 0.13
TestID-1 1.488 1219 42 109 325 0.16 0.41
TestID-1 1.468 3394 26 85 185 0.06 0.12
TestID-2 1.473 4120 23 97 > 240 0.11
TestID-2 1.422 1857 39 119 > 320 0.36
TestID-2 1.516 1404 48 135 > 400 0.88
TestID-3 1.800 3853 26 120 0.11
TestID-3 1.561 1642 46 165 0.30
TestID-3 1.772 1226 55 177 0.82
“Dry surface” means that test surfaces are dried without water droplets or water film after heating.
“Wet surface” means that test surfaces are still covered by water droplets on plain surface and by water
film on superhydrophilic surface.
Figure 6.38. Heat flux applied at the test plate (TestID-3) where direct current (DC) sets
at 12V/5A.

108
Figure 6.39. Temperature difference between the heat flux sensor and the test plate
(TestID-3) where DC sets at 12V/5A.
Figure 6.40. Temperature at the test plate (TestID-2) during the defrost period
where DC sets at 12V/5A.
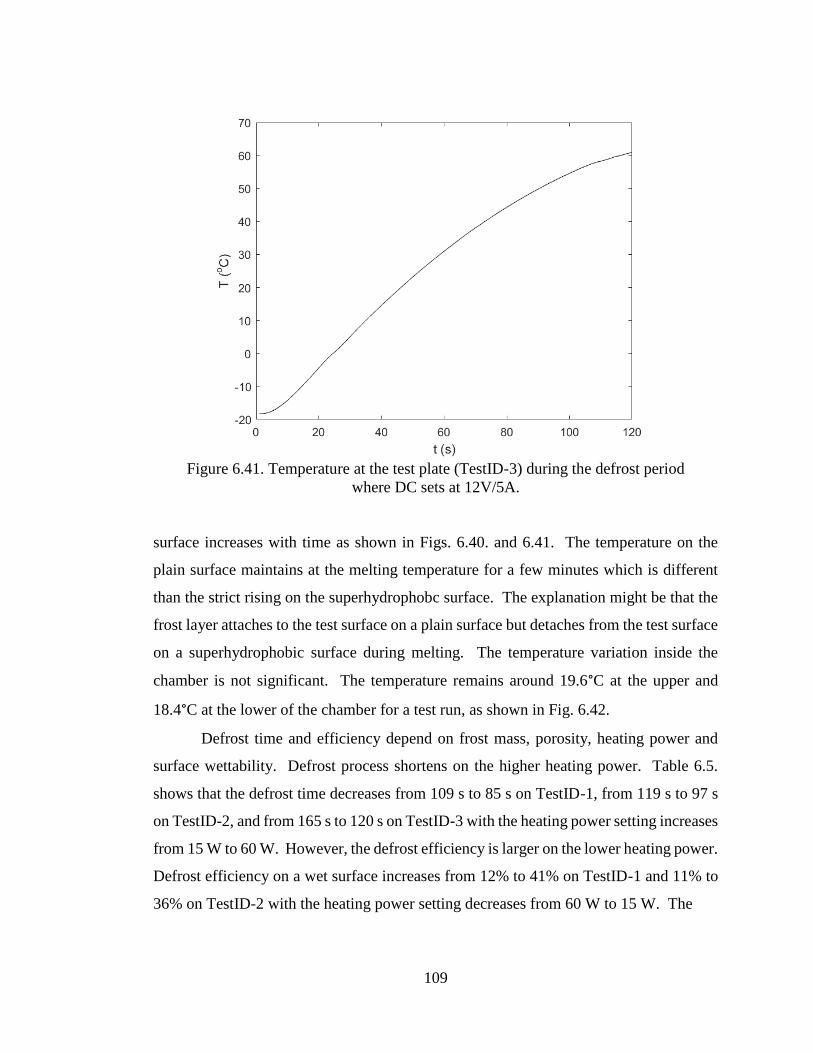
109
Figure 6.41. Temperature at the test plate (TestID-3) during the defrost period
where DC sets at 12V/5A.
surface increases with time as shown in Figs. 6.40. and 6.41. The temperature on the
plain surface maintains at the melting temperature for a few minutes which is different
than the strict rising on the superhydrophobc surface. The explanation might be that the
frost layer attaches to the test surface on a plain surface but detaches from the test surface
on a superhydrophobic surface during melting. The temperature variation inside the
chamber is not significant. The temperature remains around 19.6°C at the upper and
18.4°C at the lower of the chamber for a test run, as shown in Fig. 6.42.
Defrost time and efficiency depend on frost mass, porosity, heating power and
surface wettability. Defrost process shortens on the higher heating power. Table 6.5.
shows that the defrost time decreases from 109 s to 85 s on TestID-1, from 119 s to 97 s
on TestID-2, and from 165 s to 120 s on TestID-3 with the heating power setting increases
from 15 W to 60 W. However, the defrost efficiency is larger on the lower heating power.
Defrost efficiency on a wet surface increases from 12% to 41% on TestID-1 and 11% to
36% on TestID-2 with the heating power setting decreases from 60 W to 15 W. The

110
Figure 6.42. Temperature inside the chamber during the defrost period
where DC sets at 12V/5A.
defrost efficiency on dry surface increases from 11% to 82% on TestID-3 with the heating
power setting decreased from 60 W to 6 W. The dependences of defrost time and defrost
efficiency on heat flux are shown in Figs. 6.43. and 6.44. The defrost process was run on
the superhydrophobic surface after frost grows for 4 h. The frost mass is 1.772 g, 1.561
g and 1.8 g, corresponding to the average heat flux of 1,226 W/m2, 1,642 W/m2 and 3,853
W/m2. Among the three runs, the defrost time is the shortest with the highest average
heat flux, and the defrost efficiency is the highest with the lowest average heat flux.
The effect of surface wettability on defrost time is shown in Figs. 6.45. and 6.46.
for wet surface and dry surface. During the defrost period, a thin film is retained on the
superhydrophilic surface, and some non-uniform droplets stick on the plain surface. The
test surface is wet when the frost melts away but the water film or retention droplets are
still on it. The defrost time is shorter on the superhydrophilic surface than that on the
plain surface. The explanation is that the water film on the superhydrophilic surface
improves the partial slumping of the frost and the drainage of the meltwater. The
evaporation time is shorter on the superhydrophlic surface than on the plain surface. The

111
Figure 6.43. Defrost time versus average heat flux at TestID-3
where frost grows for 4 h.
Figure 6.44. Defrost efficiency versus average heat flux at TestID-3
where frost grows for 4 h.

112
Figure 6.45. Defrost time versus mass on wet surface
where heating power sets at 60 W.
Figure 6.46. Defrost time versus mass on dry surface
where heating power sets at 60 W.

113
reason is that thin water film spreads over the surface and increases the contact area
between the test surface and the water film. Heat transfer is thus larger on the
superhydrophilic surface. The evaporation time is much longer on the plain surface as
the contact area of water droplets to the test surface is much smaller. It is observed from
the experiments that thin water film over the surface dries away quickly, but a thicker
water film accumulates at the bottom of the test surface and takes quite some time to dry
away. The evaporation time is much longer with lower heating power, compared to that
with high heating power. The surface is dry when no water droplets or water film are on
it. The defrost time is shorter on the superhydrophobic surface than on the
superhydrophilic surface. When frost melts on the superhydrophobic surface, the frost
layer detaches from the test surface and falls off without retention of droplets. No
evaporation time is required, thus the defrost time is reduced significantly.
The influences of surface wettability on defrost efficiency are shown in Figs. 6.47.
and 6.48. When the test plates are wet, the defrost efficiency is larger on the
superhydrophilic surface than that on the plain surface due to the shorter defrost time.
When the test plates are dry, the defrost efficiency is larger on the superhydrophobic
surface compared to that on the superhydrophilic surface. The reason is that the defrost
time is shorter on the superhydrophobic surface. The improvement of defrost efficiency
is noticeable with lower heating power. Defrost efficiency increases from 11% to 30%
on the superhydrophobic surface compared to the increase from 7% to 16% on the
superhdyrophilic surface when the heating power setting decreases from 60 W to 15 W.
It can be explained by the increase of the evaporation time on the superhydrophilic surface
with lower heating power.

114
Figure 6.47. Defrost efficiency versus mass on wet surface
where heating power sets at 60 W.
Figure 6.48. Defrost efficiency versus mass on dry surface
where heating power sets at 60 W.

115
Table 6.6. Defrost properties for test surfaces 50 mm x 50 mm.
Frost
mass
(g)
Average
heat flux
applied
(W/m2)
Time to
melting
temperature
(s)
Defrost
time
(s)
Time to
dry out
(s)
Defrost
efficiency
(dry
surface)
Defrost
efficiency
(wet
surface)
TestID-4 2.78 417 62 165 > 600 < 0.22 0.8
TestID-4 2.744 339 62 158 > 600 < 0.22 0.83
TestID-4 2.86 301 61 153 > 600 < 0.23 0.9
TestID-5 2.577 407 64 167 > 600 0.73
TestID-5 2.828 355 69 205 > 600 0.66
TestID-5 2.966 336 65 178 > 600 0.8
TestID-6 2.679 247 68 177 0.71
TestID-6 2.711 230 74 161 0.79
TestID-6 2.992 190 72 184 0.76
A thin film heater is used to heat the large test plates (50 mm x 50 mm) with the
actual power output of 7.7 W. The defrost properties are listed in Table 6.6. Compared
to the heating by thermoelectric module, the average heat flux at the test plate is much
smaller. The evaporation time is much longer due to the low heat flux, and the defrost
efficiency is higher than that with the high heating power. The dependence of defrost
time and efficiency on surface wettability is shown in Figs. 6.49.-6.52. When the test
plates are wet, defrost time is shorter on the superhydrophilic surface compared to that
on the plain surface. Defrost efficiency improves as well on the wet superhydrophilic
surface. When the test plates are dry, defrost time is much shorter on the
superhydrophobic surface than that on the superhydrophilic surface. It is observed that
the evaporation time lasts over 600 s on the superhydrophilic surface and the plane surface.
Defrost efficiency improves greatly on the superhydrophobic surface as there is no
evaporation time for the defrost process. Frost and defrost experimental procedures are
in Appendix D.

116
Figure 6.49. Defrost time versus mass on wet surface
where actual heating power is 7.7 W.
Figure 6.50. Defrost time versus mass on dry surface
where actual heating power is 7.7 W.

117
Figure 6.51. Defrost efficiency versus mass on wet surface
where actual heating power is 7.7 W.
Figure 6.52. Defrost efficiency versus mass on dry surface
where actual heating power is 7.7 W.

118
6.4 Comparison between physical model and experiments
Defrost processes are complicated because many factors affect the defrost
mechanisms. Defrost time and efficiency are two key variables when controlling defrost
processes in applications. The relationship between defrost time and efficiency and
defrost mechanisms are discussed in the model and validated by the experiments. Surface
wetting properties could influence frost properties as well as defrost processes.
A defrost process is divided into three stages based on motions of meltwater. The
magnitude of volume flux of water, melting velocity and draining velocity determines the
motions of meltwater as well as defrost mechanisms. When the volume flux water is
greater than melting velocity, the meltwater is absorbed into the frost layer. The
absorption was validated at the early period during the defrost process. With water
saturation increasing, volume flux of water decreases, and meltwater starts to drain.
When the volumetric draining rate is less than the volumetric rate of melting water, part
of the meltwater accumulates between the surface and saturated frost layer. Frost could
fall off with the draining water. The drainage was observed in the middle of the defrost
process, and the remaining frost finally fell off.
The effects of surface wettability are discussed in the model and the slumping
criterion. Surface wetting properties could influence the volume flux of water and
melting velocity by affecting the frost properties. The average volumetric draining rate
is predicted to increase by 7.1% on hydrophobic surfaces due to the slip velocity at the
surface. The draining velocity is not measured in the experiments. However, the
prediction agrees with the literature [41] in which the draining velocity is shown to be
larger on hydrophobic surfaces than that on hydrophilic surfaces. The slumping force
ratio is greater on hydrophobic surfaces as predicted in the model. In experiments, frost
slumping occurred on superhydrophobic surfaces during the defrost processes.
Defrost time and efficiency depend on the defrost mechanisms. The defrost model
predicts the defrost time larger compared to the values measured in the experiments. The
reason is that frost slumping reduced the defrost time. The model could better predict
defrost time when coupling with the frost slumping criterion. In applications, the
geometry and other related factors have to be taken into consideration when formulating
frost slumping criteria.

119
7 Conclusions and Future Work
7.1 Conclusions
This research is motivated by the current problem in refrigeration system that how
would surface wettability influences the defrost process. Defrost process is analytically
formulated based on the physical mechanisms of the defrost process. In the literature,
meltwater is either assumed to be absorbed into the frost layer or drained in the current
defrost models. However, the factors affecting the meltwater behavior are not studied.
In this work, water permeation rate is inspected in absorption, and drainage rate is
investigated with respect to the different surface wettability. The slumping criterion is
studied as a potential method of frost removal. Slumping conditions vary on surfaces
with different surface wettability. Superhydrophilic and superhydrophobic surfaces are
prepared and examined in the experiments, and the results show that frost falls off as rigid
pieces on the superhydrophobic surface while it melts with partial slumping on the
superhydrophilic surface.
A general defrost process consists of surface preheating, frost melting and
retention water evaporation. This work is focused on frost melting and meltwater
behaviors. Three variables determine the melting scheme. They are melting rate, water
permeation rate and draining rate. Melting rate depends on the heat flux applied at the
surface and the porosity of the frost layer. Water permeation rate is a function of water
saturation and frost layer permeability. Draining rate is related to the velocity boundary
conditions at the interfaces. The competition among the three variables determines
whether meltwater is absorbed into the frost layer or drains along the test surface. Based
on these studies, the melting process is divided into three stages: absorption,
accumulation and drainage. In the absorption stage, meltwater is absorbed into the frost
layer by capillary force. Water saturation is formulated with mass continuity and is
shown as a function of time and location. A thin water film could form over the test
surface due to surface tension around the perimeters of the frost column in accumulation.
In the drainage stage, meltwater drains by gravity. The draining rate varies with the
velocity at the solid/water interface and at the water/permeation interface.

120
Frost slumping is a phenomenon in which frost columns fall off from the surface
as rigid pieces or as parts of the bulk mass. In comparison with the traditional defrost
methods, frost removal by slumping could reduce defrost time and energy consumption.
In this work, a slumping criterion is formulated based on the static force analysis. A
slumping force ratio is defined as the ratio of gravity to adhesive force at the surface.
Both gravity and adhesive force change with defrost time. In the absorption/accumulation
stage, ice adhesion/surface tension attaches the frost mass to the surface, and the strength
of ice adhesion/surface tension decreases with increases of the surface temperature. In
the drainage stage, both the gravity and surface tension decrease, and the force ratio
depends on the drainage rate of the meltwater and the surface temperature.
Surface wettability influences the defrost process and the slumping criterion. In
the absorption stage, water permeation rate is related to the structure of the frost layer,
which varies with surface wettability. The water flux increases with the permeability of
the frost layer, which increases with the frost porosity. The draining rate is a function of
the velocity at the solid/water interface. A no slip boundary condition is assumed on the
hydrophilic surface, and a slip boundary condition is applied to the hydrophobic surface.
The model shows that the draining rate increases about 7% on hydrophobic surfaces
compared to that on hydrophilic surfaces. Slumping criterion is formulated for
hydrophilic surface and hydrophobic surface separately in the accumulation and drainage
stages. The expressions of surface tension are different for hydrophilic surfaces and for
hydrophobic surfaces. A thin water film is assumed on hydrophilic surfaces, and the
surface tension is a function of the contact angle. Water droplets are assumed on
hydrophobic surfaces, and the surface tension is a function of advancing contact angle
and receding contact angle.
Experiments have been conducted on the superhydrophilic surface, plain surface
and superhydrophobic surface. The defrost process is observed to be different on the
three types of surface. On the superhydrophilic and plain surfaces, frost melts at the
center of the surface very quickly when the surface temperature reaches the melting
temperature. The meltwater divides into two parts. One part is absorbed into the thicker
frost layer at the edges, and the other part retains on the surface in the form of water
droplets on the plain surface and water film on the superhydrophilic surface. On the edges

121
of the test plate, the frost at the bottom melts and drains first. The frost at the top falls
with draining water after a period of time. On the superhydrophobic surface, the center
area of the frost column seems to detach from the surface when the surface temperature
reaches the melting temperature. The frost column still adheres to the surface when the
frost at the edges attaches to the surface and finally falls off as a rigid whole piece. After
the defrost process, no water retention is observed on the superhydrophobic surface, while
water droplets are retained on the plain surface and water film is retained on the
superhydrophilic surface. When the evaporation time of water droplets or water film is
not considered, defrost time and efficiency do not vary significantly on the three types of
surfaces. However, defrost time and efficiency are improved considerably when the
water droplets or water film are evaporated. Heating powers could influence the defrost
time and efficiency during the defrost process. With higher heating power, the defrost
time is shorter, but the defrost efficiency is lower. With lower heating power, the defrost
time is longer, but the defrost efficiency is longer. Defrost time and efficiency also
depend on the ambient temperature, the system design and the defrost methods.
7.2 Future work
Current work includes formulating the mathematical model of the melting process,
analyzing the influence of the surface wettability on the melting process quantitatively
and theoretically, and investigating the slumping criterion during the defrost process. The
research could be explored and extended in many aspects.
The formulation of the mass continuity in the permeation layer is one dimensional
based on the assumptions that the frost layer is uniform. A multi-dimensional formulation
could better describe the frost layer with non-uniform properties. The frost layer melts
with a moving boundary. The thickness of the frost layer decreases with time. The
analytical solution might be possible in the future study. The boundary conditions are
assumed to be fixed at the solid/permeation interface and at the permeation/frost interface.
In the application, the practical boundary conditions should be included, and surface
wettability might influence the frost structures and thus the permeation rate.
The formula of the permeation flux can be modified to accommodate the frost
column. In the formula, the intrinsic permeability, the entry capillary pressure and the
power law constants are not available in the current literatures. The values in the

122
references are used in this work. In the application, the values should be determined by
experiments. Visualization scheme might be applied to track the saturation ratio and the
permeation front with time.
Calibration of the convection heat transfer coefficient can be improved. The heat
transfer coefficient at the test surface/air interface is calculated by measuring the
temperature at the test surface and the temperature of air that is very close to the test
surface. A heat flux sensor is attached to the test surface to obtain the heat flux across
the surface. The calculated value is small compared to that from the correlations. The
error might result from the inaccuracy of the air temperature measurement.
The thermal boundary condition at the test surface is expected to be controllable.
In current design, a thermal electric module is applied for cooling cycle, and a film heater
is used for heating cycle. During the defrost cycle, the test plate experiences a transient
state when heat is applied at the plate. Heat flux across the test surface would not be
constant. In refrigeration industries, hot gas purge might be applied in the tube for the
defrost process, so the constant temperature boundary condition can be considered when
setting up the model. The temperature boundary condition can be realized by remodeling
the current design with a constant temperature controller and a bath. The coolant absorbs
the heat from the test plate quickly, and the temperature of the coolant increases
significantly in the current system.
The test plate is placed inside the chamber without fastening to avoid the
interference with the frost and defrost process. Thermal resistance between the test plate
and the cooling/heating apparatus thus increases. A mechanical fixture could help reduce
the thermal resistance if the design does not affect the frost and defrost process. The
measurement of frost properties could be improved. The frost growth period is
accompanied by the thickening of the frost density and the growing of the frost thickness.
Frost porosity varies with time and location. In current measurement, a uniform density
is assumed. Also, the frost layer is denser and thicker at the edges. In the future, a round
geometry of the test plate might be used to avoid the edge effects.
The range of the parameters is restricted by the cooling method of the chamber.
The chamber is cooled by thermal electric modules, and heat is removed by the heat sink
extended inside the chamber. The sink temperature becomes very low in order to achieve

123
low temperature inside the chamber. Frost might form on the heat sink when the relative
humidity in the chamber is high. In the future, the air could be cooled down from a
different system, and cooling air could be circulated through the test chamber.
The physical mechanism of slumping is more complicated with the involvement
of the physics of interfacial forces. Herein the slumping condition is based on the force
balance analysis. Further research can formulate the slumping criterion with respect to
the physical mechanism of fracture or crack of the frost column. In that case, the cohesive
forces of the frost and the adhesive forces at the interfaces should be considered.
The slumping criterion is expected to be verified on surfaces with different contact
angles and contact angle hysteresis. In the current experiments, surface treatment is
limited to a superhydrophilic surface and a superhydrophobic surface. The contact angle
hysteresis is not controllable for the hydrophobic surface. The slumping criterion on
hydrophobic surface depends on the advancing/receding contact angles. The rolling of
the droplet occurs with small contact angle hysteresis and proper droplet volume and
sliding angle. In the experiments, surface treatment methods also lead to different defrost
mechanisms. Frost might fall off as a rigid body or break up into fractures on the different
superhydrophobic surfaces. More samples with different surface properties are expected
in the experiments.
Tests on reliability and repeatability of the surface effects are expected. In the
current experiments, the surface shows good superhydrophobicity, and the results are
relatively consistent. Frost slumping occurs after different frost formation periods and
with different defrost heating methods. In rare cases, it is observed that few small droplets
stick to the superhydrophobic surface after the defrost process. The droplets do not roll
off after the frost and defrost cycle.
The experiments are expected to test with large scale equipment. In the
application, coils have different geometries. In the current study, frost and defrost cycles
are on a flat aluminum plate placed vertically. A complicated multi-dimensional model
can be formulated with consideration of fin arrays and interaction between fins.
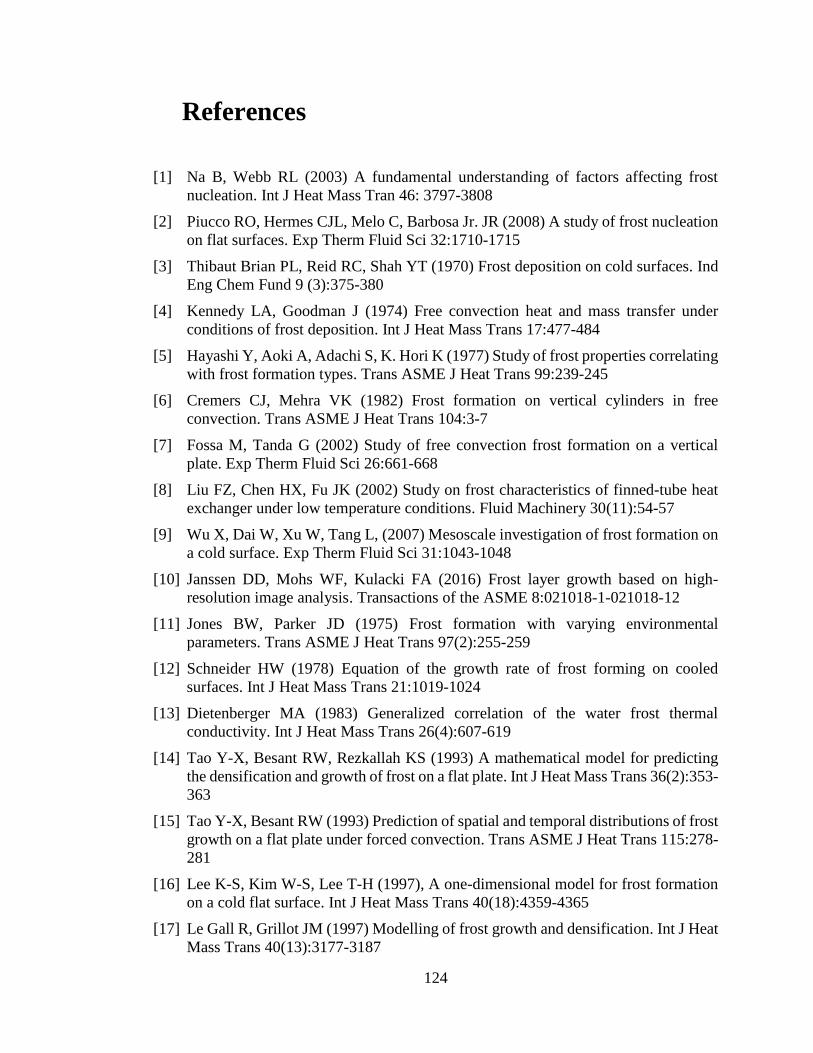
124
References
[1] Na B, Webb RL (2003) A fundamental understanding of factors affecting frost
nucleation. Int J Heat Mass Tran 46: 3797-3808
[2] Piucco RO, Hermes CJL, Melo C, Barbosa Jr. JR (2008) A study of frost nucleation
on flat surfaces. Exp Therm Fluid Sci 32:1710-1715
[3] Thibaut Brian PL, Reid RC, Shah YT (1970) Frost deposition on cold surfaces. Ind
Eng Chem Fund 9 (3):375-380
[4] Kennedy LA, Goodman J (1974) Free convection heat and mass transfer under
conditions of frost deposition. Int J Heat Mass Trans 17:477-484
[5] Hayashi Y, Aoki A, Adachi S, K. Hori K (1977) Study of frost properties correlating
with frost formation types. Trans ASME J Heat Trans 99:239-245
[6] Cremers CJ, Mehra VK (1982) Frost formation on vertical cylinders in free
convection. Trans ASME J Heat Trans 104:3-7
[7] Fossa M, Tanda G (2002) Study of free convection frost formation on a vertical
plate. Exp Therm Fluid Sci 26:661-668
[8] Liu FZ, Chen HX, Fu JK (2002) Study on frost characteristics of finned-tube heat
exchanger under low temperature conditions. Fluid Machinery 30(11):54-57
[9] Wu X, Dai W, Xu W, Tang L, (2007) Mesoscale investigation of frost formation on
a cold surface. Exp Therm Fluid Sci 31:1043-1048
[10] Janssen DD, Mohs WF, Kulacki FA (2016) Frost layer growth based on high-
resolution image analysis. Transactions of the ASME 8:021018-1-021018-12
[11] Jones BW, Parker JD (1975) Frost formation with varying environmental
parameters. Trans ASME J Heat Trans 97(2):255-259
[12] Schneider HW (1978) Equation of the growth rate of frost forming on cooled
surfaces. Int J Heat Mass Trans 21:1019-1024
[13] Dietenberger MA (1983) Generalized correlation of the water frost thermal
conductivity. Int J Heat Mass Trans 26(4):607-619
[14] Tao Y-X, Besant RW, Rezkallah KS (1993) A mathematical model for predicting
the densification and growth of frost on a flat plate. Int J Heat Mass Trans 36(2):353-
363
[15] Tao Y-X, Besant RW (1993) Prediction of spatial and temporal distributions of frost
growth on a flat plate under forced convection. Trans ASME J Heat Trans 115:278-
281
[16] Lee K-S, Kim W-S, Lee T-H (1997), A one-dimensional model for frost formation
on a cold flat surface. Int J Heat Mass Trans 40(18):4359-4365
[17] Le Gall R, Grillot JM (1997) Modelling of frost growth and densification. Int J Heat
Mass Trans 40(13):3177-3187

125
[18] Cheng C-H, Cheng Y-C (2001) Predictions of frost growth on a cold plate in
atmospheric air. Int Comm Heat Mass Trans 28(7):953-962
[19] Lee K-S, Jhee S, Yang D-K (2003) Prediction of the frost formation on a cold flat
surface. Int J Heat Mass Trans 46:3789-3796
[20] Na B, Webb RL (2004) Mass transfer on and within a frost layer. Int J Heat Mass
Trans 47:899-911
[21] Lee YB, Ro ST (2005) Analysis of the frost growth on a flat plate by simple models
of saturation and Supersaturation. Exp Therm Fluid Sci 29:685-696.
[22] Na B, Webb RL (2004) New model for frost growth rate. Int J Heat Mass Trans
47:925-936
[23] Hao YL, Iragorry J, Tao Y-X (2005) Frost-air interface characterization under
natural convection. Trans ASME J Heat Trans 127: 1174-1180
[24] Lenic K, Anica Trp, Bernard Frankovic (2006) Unsteady heat and mass transfer
during frost formation in a fin-and-tube heat exchanger. Energy and the
Environment 35-48
[25] Sahin AZ (1995) An analytical study of frost nucleation and growth during the
crystal growth period. Heat Mass Trans 30:321-330
[26] Sahin AZ (2000) Effective thermal conductivity of frost during the crystal growth
period. Int J Heat Mass Trans 43:539-553
[27] Shin J, Tikhonov AV, Kim C (2003) Experimental study on frost structure on
surfaces with different hydrophilicity: density and thermal conductivity. Trans
ASME J Heat Trans 125(1):84-94
[28] Zhong YF, Jacobi AM, Georgiadis JG (2006) Condensation and wetting behavior
on surfaces with micro-structures: super-hydrophobic and super-hydrophilic. Proc
Int Ref Air Cond, Paper 828
[29] Liu ZL, Wang HY, Zhang XH, Meng S, Ma CF (2006) An experimental study on
minimizing frost deposition on a cold surface under natural convection conditions
by use of a novel anti-frosting paint, Part I. International Journal of Refrigeration
29:229-236
[30] Liu ZL, Zhang XH, Wang HY, Meng S, Cheng S (2007) Influences of surface
hydrophilicity on frost formation on a vertical cold plate under natural convection
conditions. Exp Therm Fluid Sci 31(7):789-794
[31] Liu ZL, Gou YJ, Wang JT, Cheng S (2008) Frost formation on a super-hydrophobic
surface under natural convection conditions. Int J Heat Transfer 51(25-26):5975-
5982
[32] Chen C-H, Cai Q, Tsai C, Chen C-L, Xiong G, Yu Y, Ren Z (2007) Dropwise
condensation on superhydrophobic surfaces with two-tier roughness. Appl Phys Lett
90 Letters 90:173108.
[33] Wang H, Tang LM, Wu XM, Dai WT, Qiu YP (2007) Fabrication and anti-frosting
performance of superhydrophobic coating based on modified nano-sized calcium

126
carbonate and ordinary polyacrylate. Appl Surf Sci 253(22):8818-8824
[34] Wang FC, Li CR, Lv YZ, Du YF (2009) A facile superhydrophobic surface for
mitigating ice accretion. Proceedings of the 9th International Conference on
Properties and Applications of Dielectric Materials A-34:150-153
[35] Varanasi KP, Deng T, Smith JD, Hsu M, Nitin Bhate N (2010) Frost formation and
ice adhesion on superhydrophobic surfaces. Appl Phys Lett 97(23):234102
[36] He M, Wang JX, Li HL, Jin XL, Wang JJ, Liu BQ, Song YL (2010) Super-
hydrophobic film retards frost formation. Soft Matter 6:2396-2399
[37] He M, Wang JX, Li HL, Song YL (2011) Super-hydrophobic surfaces to condensed
micro-droplets at temperatures below the freezing point retard ice/frost formation.
Soft Matter 7:3993-4000
[38] Farhadi S, Farzaneh M, SKulinich SA (2011) Anti-icing performance of
superhydrophobic surfaces. Appl Surf Sci 257(14):6264-6269
[39] Bahadur V, Mishchenko L, Hatton B, Taylor JA, Aizenberg J, Krupenkin T (2011)
Predictive model for ice formation on superhydrophobic surfaces. Langmuir
27(23):14143-14150
[40] Min J, Webb RL, Bemisderfer CH (2000) Long-term hydraulic performance of
dehumidifying heat-exchangers with and without hydrophilic coatings. HVAC&R
Res 6(3):257-272
[41] Jhee S, Lee K-S, Kim W-S (2002) Effect of surface treatments on the
frosting/defrosting behavior of a fin-tube heat exchanger. Int J Ref 25:1047-1053
[42] Kim K, Lee KS (2011) Frosting and defrosting characteristics of a fin according to
surface contact angle. Int J Heat Mass Trans 54(13-14):2758-2764
[43] Wu XM, Webb RL (2001) Investigation of the possibility of frost release from a
cold surface. Exp Therm Fluid Sci 2 (3-4):151-156
[44] Huang LY, Liu ZL, Liu YM, Gou YJ, Wang JT (2009) Experimental study on frost
release on fin-and-tube heat exchangers by use of a novel anti-frosting paint. Exp
Therm Fluid Sci 33:1049-1054
[45] Antonini C, Innocenti M, Horn T, Marengo M, Amirfazli A (2011) Understanding
the effect of superhydrophobic coatings on energy reduction in anti-icing systems.
Cold Regions Sci Tech 67:58-67
[46] Jing T, Kim Y, Lee S, Kim D, Kim J, Hwang W (2013) Frosting and defrosting on
rigid superhydrophobic surface. Appl Surf Sci 276:37-42
[47] Boreyko JB, Srijanto BR, Nguyen TD, Carlos Vega C, Fuentes-Cabrera M, Collier
CP (2013) Dynamic defrosting on nanostructured superhydrophobic surfaces.
Langmuir 29:9516-9524
[48] Chen XM, Ma RY, Zhou HB, Zhou XF, Che LF, Yao SH, Wang ZK (2013)
Activating the microscale edge effect in a hierarchical surface for frosting
suppression and defrosting promotion. Scientific Rep 3:2515.

127
[49] Korte C, Jacobi AM (2001) Condensate retention effects on the performance of
plain-fin-and-tube heat exchangers: Retention data and modeling. Trans ASME J
Heat Trans 123(5):926-936
[50] Min J, Webb RL (2001) Condensate formation and drainage on typical fin materials.
Exp Therm Fluid Sci 25:101-111
[51] Zhong Y, Joardar A, Gu Z, Park Y-G, Jacobi AM (2005) Dynamic dip testing as a
method to assess the condensate drainage behavior from the air-side surface of
compact heat exchangers. Exp Therm Fluid Sci 29:957-970
[52] EI Sherbini AI, Jacobi AM (2006) A model for condensate retention on plain-fin
heat exchangers. Trans ASME J Heat Trans 128:427-433
[53] Sommers AD, Jacobi AM (2008) Wetting phenomena on micro-grooved aluminum
surfaces and modeling of the critical droplet size. J Colloid Interf Sci 328(2):402-
411
[54] Liu L, Jacobi AM (2009) Air-side surface wettability effects on the performance of
slit-fin-and-tube heat exchangers operating under wet-surface conditions. Trans
ASME J Heat Trans 13:051802-(1-9)
[55] Rahman AM, Jacobi AM (2012) Drainage of frost meltwater from vertical brass
surfaces with parallel microgrooves. Int J Heat Mass Trans 55:1596-1605
[56] Sanders CT (1974) The influence of frost formation and defrosting on the
performance of air coolers. Doctoral dissertation, Delft University of Technology
[57] Krakow KI, Yan L, S. Lin S (1992) A model of hot-gas defrosting of evaporators,
Part 1: Heat and mass transfer theory. ASHRAE Trans 98(1):451-461
[58] Krakow KI, Yan L, Lin S (1992) A model of hot-gas defrosting of evaporators-part
2: Experimental analysis. ASHRAE Trans 98(1):462-474
[59] Sherif SA, Hertz MG (1998) A semi-empirical model for electric defrosting of a
cylindrical coil cooler. Int J Energy Res 22(1):85-92
[60] Lamberg P, Siren K (2003) Analytical model for melting in a semi-infinite PCM
storage with an internal fin. Heat Mass Trans 39:167-176
[61] Liu Z, Tang G, Zhao F (2003) Dynamic simulation of air-source heat pump during
hot-gas defrost. Appl Therm Eng 23:675-685
[62] Hoffenbecker N, Klein SA, Reindl DT (2005) Hot gas defrost model development
and validation. Int J Refrigeration 28(4)605-615
[63] Dopazo JA, Fernandez-Seara J, Uhia FJ, Diz R (2010) Modelling and experimental
validation of the hot-gas defrost process of an air-cooled evaporator. Int J
Refrigeration 33(4):829-839
[64] Minglu Q, Liang X, Shiming D, Yiqiang J (2012) A study of the reverse cycle
defrosting performance on a multi-circuit outdoor coil unit in an air source heat
pump - Part I: Experiments. Appl Energy 91:122-129
128
[65] Qu M, Pan D, Xia L, Deng S, Jiang Y (2012) A study of the reverse cycle defrosting
performance on a multi-circuit outdoor coil unit in an air source heat pump - Part II:
Modeling analysis. Appl Energy 91:274-280
[66] Mohs WF (2012) Heat and mass transfer during the melting process of a porous
frost layer on a vertical surface. Doctoral dissertation, University of Minnesota
[67] Raraty LE, Tabor D (1958) The adhesion and strength properties of ice. Proc R. Soc.
Lond. A Mat 245:84-201
[68] Jellinek HHG (1959) Adhesive properties of ice. J Colloid Interf Sci 14:268-280
[69] Ryzhkin IA, Petrenko VF (1997) Physical mechanisms responsible for ice adhesion.
J Phys Chem B 101(32):6267-6270
[70] Makkonen L (2012) Ice adhesion - Theory, measurements and countermeasures. J
Adhes Sci Technol 26:413-445
[71] Chen J, Liu J, He M, Li K, Cui D, Zhang Q, Zeng X, Zhang Y, Wang J, Song Y
(2012) Superhydrophobic surfaces cannot reduce ice adhesion. Appl Phys Lett
101(11):111603-1-3
[72] Meuler AJ, Smith JD, Varanasi KK, Mabry JM, McKinley GH,Cohen RE (2010)
Relationships between water wettability and ice adhesion. Appl Mat Interfaces
2(11):3100-3110. doi: 10.1021/am1006035
[73] Majumdar A, Mezic I (1999) Instability of ultra-thin water films and the mechanism
of droplet formation on hydrophilic surfaces. Trans ASME J Heat Trans 121:964-
971
[74] Aoki K, Hattori M, Ujiie T (1988) Snow melting by heating from the bottom surface.
JSME Int J 31(2):269-275
[75] Colbeck SC, Davidson G, (1972) Water percolation through homogeneous snow.
IASH Publication 107:242-257
[76] Colbeck SC, (1974) The capillary effects on water percolation in homogeneous
snow. J Glaciology 13(67):85-97
[77] Colbeck SC (1976) An analysis of water flow in dry snow. Water Res Research
12(3) (1976) 523-527
[78] S.C. Colbeck (1982) The permeability of a melting snow cover. Water Resour Res
18(4):904-908
[79] Bengtsson L (1982) Percolation of meltwater through a snowpack. Cold Reg
SciTechnol 6:73-81
[80] Whitaker S (1986) Flow in porous media I: A theoretical derivation of Darcy's law.
Transport Porous Med 1:3-25
[81] Shaun Sellers S (2000) Theory of water transport in melting snow with moving
surface. Cold Reg Sci Technol 31:47-57.

129
[82] Manthey S, Hassanizadeh SM, Helmig R, Hilfer R (2008) Dimensional analysis of
two-phase flow including a rate-dependent capillary pressure-saturation
relationship. Adv Water Resour 31:1137-1150
[83] Daanen RP, Nieber JL (2009) Model for coupled liquid water flow and heat
transport with phase change in a snowpack. J Cold Reg Eng., 23(2): 43-68
[84] Hirashima H, Yamaguchi S, Sato A, Lehning M (2010) Numerical modeling of
liquid water movement through layered snow based on new measurements of the
water retention curve. Cold Reg Sci Tech 64:94-103
[85] Yamaguchi S, Katsushima T, Sato A, Kumakura T (2010) Water retention curve of
snow with different grain sizes. Cold Reg Sci Technol 64:87-93
[86] Szymkiewicz A (2013), Modeling Water Flow in Unsaturated Porous Media.
Springer-Verlag Berlin Heidelberg
[87] Katsushima T, Satoru Yamaguchi S, Kumakura T, Atsushi Sato A (2013)
Experimental analysis of preferential flow in dry snowpack. Cold Reg Sci Technol
85:206-216
[88] Washburn EW (1921) The dynamics of capillary flow. Phys Rev 18(3):273-283
[89] Tsypkin GG (2010) Effect of the capillary forces on the moisture saturation
distribution during the thawing of a frozen soil. Fluid Dyn 45(6):942-951
[90] Beavers GS, Joseph DD, (1967) Boundary conditions at a naturally permeable wall.
J Fluid Mech 30(1):197-207
[91] Taylor GI (1971) A model for the boundary condition of a porous material. Part 1
J. Fluid Mech. 49(2):319-326
[92] Richardson S (1971) A model for the boundary condition of a porous material, Part
2. J Fluid Mech 49(2):327-336
[93] Sahraoui M, Kaviany M (1992) Slip and no-slip velocity boundary conditions at
interface of porous, plain media. Int J Heat Mass Trans 35(4):927-943
[94] Vinogradova OI (1995) Drainage of a thin liquid film confined between
hydrophobic surfaces. Langmuir 11(6):2213-2220
[95] Barrat JL (1999) Large slip effect at a nonwetting fluid-solid interface. Physical
Review Letters 82(23):4671-4674
[96] Baidry J, Charlaix E (2001) Experimental evidence for a large slip effect at a
nonwetting fluid-solid interface. Langmuir 17(17):5232-5236
[97] de Gennes PG (2002) On fluid/wall slippage. Langmuir 18(9):3413-3414
[98] Andrienko D, Dünweg B (2003) Boundary slip as a result of a prewetting transition.
J Chem Phys 119(24):13106-13112
[99] Lauga E, Brenner MP, Stone HA, (2005) Microfluidics: The No-Slip Boundary
Condition. Handbook of Experimental Fluid Dynamics, Foss, J., Tropes, C, Yarin,
A, Eds, Springer, New-York, Ch. 15

130
[100] Choi C-H, Kim C-J (2006) Large slip of aqueous liquid flow over a nanoengineered
superhydrophobic surface. Phys Rev Lett 96: 066001
[101] Crank J (1984) Free and moving boundary problems. Oxford University Pres MJs,
New York
[102] Alexiades V, Solomon AD (1993). Mathematical modeling of melting and freezing.
Hemisphere, Washington
[103] Morton KW, Mayers DF (2005) Numerical solutions of partial differential
equations. Cambridge University Press, Cambridge, England
[104] Hamming RW (1973) Numerical methods for scientists and engineers. Dover
Publications, Inc., New York
[105] Kahraman R, Zughbi HD, Al-Nassar N (1998) A numerical simulation of melting
of ice heated from above. Mathematical & Computational Applications 3(3):127-
137
[106] Lee TE, Baines MJ, Langdon S (2015) A finite difference moving mesh method
based on conservation for moving boundary problems. Journal of Computational
and Applied Mathematics 288:1-17
[107] Holman JP (2002) Heat transfer, 9th ed. McGraw-Hill, New York

131
Appendices
Appendix A Test apparatus
Table A.1. Test apparatus for test surface 50 mm x 50 mm. Apparatus Model Specification Function
Test chamber Material: Acrylic glass
Thickness: 12.7 mm
Inside dimensions:
254 x 127 x 101.6 mm
Frost growth and
observation
Polyisocyanurate
foam
Thickness: 25 mm Insulation
Test plate Material: Al 6061
Dimensions: 50 x 50 x 5 mm
Thermoelectric
module
Tellurex
Corporation: C2-
50-1514
THot: 50˚C
Qmax(W): 148
DT max(°C): 76
Cooling for test plate
during frost growth.
Thermoelectric
module
Tellurex
Corporation: C2-
40-2511
THot: 50˚C
Qmax(W): 191.7
DT max(°C): 79
Cooling the chamber
air during frost growth.
Cooling water block Machined at
workshop
Material: Al 6061 Remove the heat
generated on the hot
side of the
thermoelectric module.
DC power supply BK Precision:
1696
1-20 V, 0-10 A Provide DC power to
thermoelectric module
Film heater Omega:
KHLV-202/10
Total wattage: 10 W Heating the test plate
during the defrost
process.
Heat sink Machined at
workshop
Material: Al 6061 Absorb heat from the
chamber air.
Circulation fans McMASTER-
CARR:
1939K113
934 LPM (33 CFM) Circulate chamber air
Circulation fans McMASTER-
CARR: 1939K46
311 LPM (11 CFM) Circulate chamber air
Sealed air pump TOP FIN: air
pump Air-4000
AC 120 V/60 Hz, 3.5 W Pumping air
Water flask 250 ml Humidifying the air
passing through it.
Glass tube flowmeter Omega
Engineering Inc.:
FL-5561ST
6600 cc/min; Control the chamber
humidity
Data acquisition unit Agilent: 34970A
with 34901A
multiplexer
20 channels,
scan rate 60 ch/s
Acquiring data set
High resolution
cameras
Acquiring real time
images of front and
side profiles of frost
layer.

132
Table A.2. Test apparatus for test surface 38 mm x 38 mm. Apparatus Model Specification Function
Test chamber Material: Acrylic glass
Thickness: 12 mm
Inside dimensions:
200 x 100 x 50 mm
Frost growth and
observation
Polyisocyanurate
foam
Thickness: 25 mm Insulation
Test plate Material: Al 5052, temper H32
Dimensions: 38 x 38 x 3.88 mm
Copper heat spreader
block
Material: 99.9% copper
Dimensions: 45 x 40 x 9.5 mm
Thermoelectric
module
Tellurex
Corporation: C1-
1.4-127-1.14
Thot: 50˚C
Qmax(W): 80.6
DT max(°C): 79
Cooling for test plate
and chamber air during
frost growth;
Heating for test plate
during defrost process.
Heat sink Alpha Novatech
Inc. : FS10040PU
Pin fin style with fins of
2 x 2 x 40 mm;
Rth: 0.15˚C/W
Reject heat generated
on the hot side of the
thermoelectric module.
Cooling fan ORIX DC
Brushless:
MD925A-12S
DC 12 V/0.24 A
Remove heat from the
heat sink.
DC power supply BK Precision:
1696
DC output:
1-20 V, 0-10 A
Provide DC power to
thermoelectric module
Shunt Deltec: MKA-20-
50
50 mV, 20 Amp Measure the current of
the thermoelectric
module
Circulation fans Velocity 0.9 m/s;
20 air exchange/min
Circulate chamber air
Sealed air pump TOP FIN: air
pump Air-4000
AC 120 V/60 Hz, 3.5 W Pumping air
Water flask 250 ml Humidifying the air
passing through it.
Variable flow
rotameter
Omega
Engineering:
RMA-26
0 to 2.5 L/min; Control the chamber
humidity
Data acquisition unit Agilent: 34970A
with 34901A
multiplexer
20 channels,
scan rate 60 ch/s
Acquiring data set
High resolution
cameras
Acquiring real time
images of front and
side profiles of frost
layer.

133
Appendix B Design drawings

134

135

136

137

138

139

140
Appendix C Measurement instruments
Table C.1. Measurement instruments. Measurement
variables
Instruments Model Range Accuracy
Chamber
temperature
Relative
humidity/temperature
transmitter
Omega
Engineering:
HX94CW
0-100 °C ±0.6 °C
Chamber
temperature
Quick disconnection
TCs
Omega
Engineering:
SCPSS-062G-6
Chamber humidity Relative
humidity/temperature
transmitter
Omega
Engineering:
HX94CW
3%-95% ±2%
Test plate
temperature
PFA insulated T/Cs Omega
Engineering: 5TC-
TT-T-30-72
-267 to 260 °C
OR
-450 to 500 F
±0.5 °C
Heat flux Thin-film heat flux
sensor
Omega
Engineering:
HFS-4
<30,000 Btu/Ft2-
Hr
Sensitivity of 6.5
μV/Btu/Ft2-Hr;
±0.5%
Heat flux
temperature
Thin-film heat flux
sensor with built-in
T/C Type K
Omega
Engineering:
HFS-4
-200 to 150 °C
OR
-330 to 300 F
Mass Digital scale Acculab: ALC-
320.3
0 to 320 g ±3 mg
Frost image High-intensity
illuminator
Edmund Fiber-
Lite Optics: MI-
150
Frost front/side
profile
5.1 megapixel CMOS
color camera
BigCatch:
DCMC510
Frost front profile Zoom imaging lens Edmund Optics:
VZM 450i, 4.5X
Frost side profile Zoom imaging lens Navitar Zoom
7000, 6.0X,
6.4 mm;
0.5” CCD
monochrome
sensor
25 frame/s

141
Appendix D Experimental procedure
D.1 Large chamber operations (Test surface 50 x 50 x 5 mm)
Frost procedure
Close the gap between the chamber and the test plate
Start the cooling water line at least 1 h before the test run
Prepare the record log
Weigh 3 cotton balls and attach at the bottom of the chamber
Set up the test equipment
Connect the camera before starting the computer
Start the computer, start Agilent, set the scanning time
Record the Vernier caliper readings (dye the Caliper as necessary)
Weigh the saturator before the frosting
Calibrate the camera, capture the baseline, record the reference scale
Reset the DC power as necessary:
Start the saturator, start TEM cooling
Record the time, record the air flow, record the power supply
Capture the front photos at t=0 (3x), 5 min (3x), 10 min (3x), 30 min, 1h, t_end
Capture the side photos at t=0, 10 mins, 30 mins, 1h, t_middle, t_end
Record the frost formation conditions: test surface temperature, heat flux across
the heat flux sensor, chamber temperature, chamber humidity
Re-check the power supply, re-check the air flow
Frost formation runs for 6 h OR 4 h, record the frost thickness, frost mass
Save the frost formation data file
Defrost procedure
Check the frost properties (test plate temperature, chamber temperature, chamber
humidity) before defrosting, get the screw driver ready
Record the Vernier caliper reading
Prepare camera to record the retention droplets distribution
Set the camera capturing period to 2 s
Re-set the scanning period to 1 s, start Agilent

142
Stop the saturator
Reset DC power as necessary
Stop TEM, start the film heating, start the timer recorder
Auto capturing photos, record the defrost time
Record the defrosting power
Stop timer recorder, record the defrost time
Stop film heating, stop camera capturing, stop Agilent, save defrost data file
Record the evaporation time of retaining droplets
Measure the weight of the saturator
Dry out the chamber
D.2 Small chamber operations (Test surface 38 x 38 x 3.8 mm)
Frost procedure
Prepare the record log
Weigh 3 cotton balls and attach at the bottom of the chamber
Set up the test equipment
Connect the camera before starting the computer
Start the computer, start Agilent, set the scanning time
Weigh the saturator before the frosting
Calibrate the camera, capture the baseline, record the reference scale
Reset the DC power as necessary:
Start the saturator, start TEM cooling fan, start TEM cooling
Record the time, record the air flow, record the power supply
Capture the front photos at t=0 (3x), 5 mins (3x), 10 min (3x), 30 min, 1h, t_end
Capture the side photos at t=0, 10 min, 30 min, 1h, t_middle, t_end
Record the frost formation conditions: test surface temperature, heat flux across
the heat flux sensor, chamber temperature, chamber humidity
Re-check the power supply, re-check the air flow
Frost formation runs for 6 h OR 4 h, record the frost thickness, frost mass
Save the frost formation data file

143
Defrost procedure
Check the frost properties (test plate temperature, chamber temperature, chamber
humidity) before defrosting, get the screw driver ready
Prepare the camera to record the defrost power if necessary
Re-set the scanning period to 1 s
Set the camera capturing period to 2 s
Stop the saturator
Start Agilent
Reset DC power as necessary
Start the heating, start the timer recorder
Auto capturing photos, record the defrost time
Record the defrosting power
Stop timer recorder, record the defrost time
Stop TEM
Stop Agilent, save defrost data file
Stop camera capturing
Stop cooling fan
Record the evaporation time of retaining droplets
Measure the weight of the saturator
Dry out the chamber

144
Appendix E Slumping images
Figure E.1. Frost slumping process after frost grows for 4 h (TestID-3)
Top Related