


Languages
Pages
Legal

Effect of Pressure and Heating Rates on Biomass
Pyrolysis and Gasification
Pradeep K. Agrawal
School of Chemical and Biomolecular Engineering
Georgia Institute of Technology
June 15, 2012
Auburn University
Workshop on Lignocellulosic Biofuels Using
Thermochemical Conversion

Strategies for production of fuels from lignocellulosic biomass
Cellulosic
Biomass
Gasification
Hydrolysis
Pyrolysis or Liq.
SynGas (CO + H2)
Fischer-Tropsch
Methanol, Water-Gas Shift
Aqueous
sugar
Fermentation, Dehydration
Aqueous-Phase Processing
Lignin Lignin Upgrading
Bio-oils Hydrodeoxygenation
Zeolite Upgrading
Alkanes, Methanol
Liquid Fuels
Hydrogen
Ethanol
Aromatic Hydrocarbons
Liquid Alkanes or Hydrogen
Liquid Fuels
Liquid Fuels
Huber et al., Catal. Today 2006, 111, 119. Characteristics of Gasification
Pyrolysis and Char gasification proceed sequentially
Pyrolysis pressure and temperature affect char reactivity
Char reactivity depends on temperature, gas composition,
porosity, ash contents, and transport effects
Langmuir-Hinshelwood kinetic models suggested in the
literature for biomass/char gasification
High pressure gasification has particular significance
Sutton et al., Fuel Processing Technology, 73
(2001) 155-73
Di Blasi,, Progress in Energy & Combustion
Science 35 (2009) 121-140
Cetin, Gupta, and Moghtaderi, Fuel, 84 (2005)
1328-1334

Impact of Pressure on Gasification
• Carbon gasification rate slow step in conversion of biomass to syngas (CO + H2) C + H2O CO + H2 C + CO2 2 CO • Rate catalyzed by alkali metals • Langmuir-Hinshelwood type kinetics • CO and H2 inhibit gasification
• Devolatilization impacts amount of carbon to be gasified and gas composition, including tar and hydrocarbon formation

4
Alkali Catalyzed Carbon Gasification
* + CO2 <-> *(CO2) *(CO2) <-> *(O) + CO * + H2O <-> *(O) + H2
*(O) + C * + C(O) C(O) CO
COHCO
COOH
Ccpbpap
pkpkr
22
22
121
CO
CO
CO bPaP
P
kr
2
1
OH
H
Pa
P
kr
2
2
'1
'
Need to Obtain Rate Data Including Impacts of All
Relevant Species

Biomass Gasification Background
• Biomass gasification is a combination of two series processes – pyrolysis (devolatilization) and char gasification. Char gasification activity is affected by the pyrolysis conditions (heating rate, temperature, and pressure), ash content and composition, and gasification conditions.
• The challenge is to develop experimental protocols that would allow collecting experimental data at conditions that most likely mimic the heating rate, temperature, pressure, residence time, and transport effects likely to be encountered in a commercial gasifier.

Goals/Objectives
• Quantitative understanding of the gasification and pyrolysis along with an improved understanding of the catalytic effect of inorganics present in biomass
• Role of particle morphology in mass transport effects as well as the char reactivity
• Identifying process conditions where synergistic effects of biomass-coal blending are observed. This will include effect of particle size, residence time and proximity of the two feed types
• Building mathematical models based on science and engineering principles that would predict the biomass gasification rate at a given pressure, temperature and feed composition.
• Quantify the effect of pressure and temperature on the formation of tars and light
hydrocarbons.

Innovation for Our Energy Future
Methods
• Experiments in two complementary reactors: • Pressurized entrained-flow reactor (PEFR) at Georgia Tech • Pressurized thermogravimetric apparatus (PTGA) at NREL
• Differences in heating rate, reaction time • Mass/heat transfer limitations
• Three biomass types:
– Loblolly pine – Switch grass – Corn stover

PEFR Vs. PTGA
REACTOR PEFR PTGA
Pressure Up to 80 bar Up to 100 bar
Temperature Up to 1500 C Up to 1200 C
Mode Co-current flow Semi-Batch
Sample size ~1 g/min 10-100 mg
Heating Rate ~10,000 C/s ~10 C/min
Residence time Up to 10 s Up to hours
Kinetic Control
Limit
>1000°C ~800°C
Gas analysis FTIR, GC MS, FTIR

Elemental Composition of Biomass Feed
Element Loblolly
Pine
Switchgrass Cornstover
C 52.4% 48.3% 43.7%
H 6.3% 6.1% 5.9%
N 0.07% 0.36% 0.59%
O 40.9% 44.7% 45.3%
Ash 0.3% 2.2% 6.1%
Volatile Matter 79.1% 77.6% 74.4%
Fixed Carbon 12.8% 12.4% 12.6%
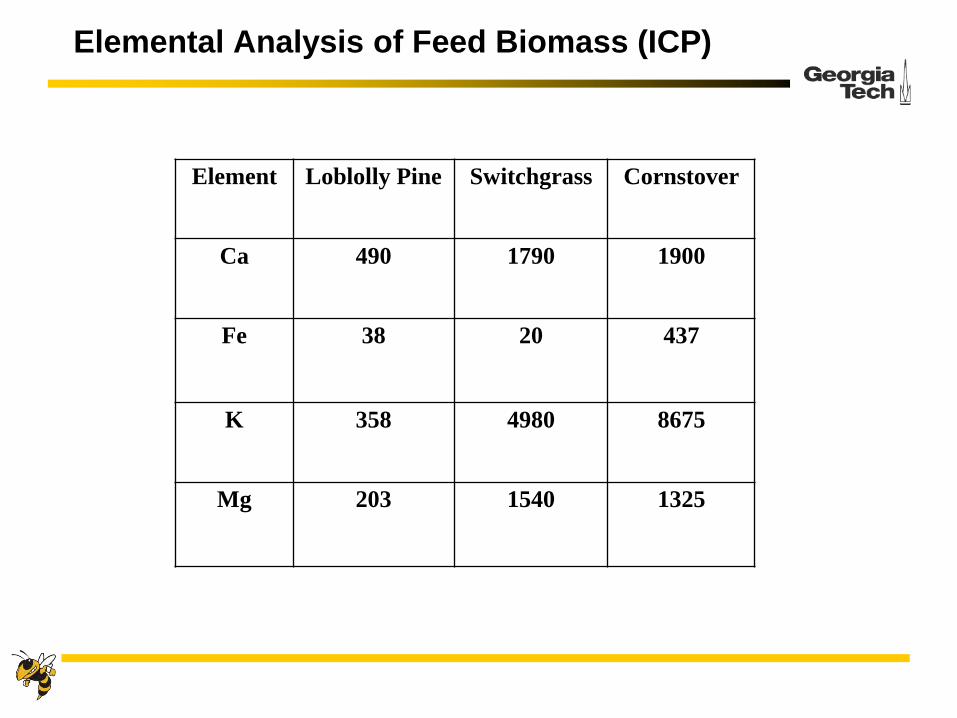
Elemental Analysis of Feed Biomass (ICP)
Element Loblolly Pine Switchgrass Cornstover
Ca 490 1790 1900
Fe 38 20 437
K 358 4980 8675
Mg 203 1540 1325

Approach
• Investigate high temperature pyrolysis of biomass - effect of pressure and temperature on char morphology and reactivity towards gasification
• Gasification kinetics of chars generated from pyrolysis (individual chars, blend pyrolysis chars, and blending of chars generated individually)
• Catalytic effect of inorganics (ash) on char gasification
• Transport effects and mathematical models

Pressurized Entrained Flow Reactor


Pressurized
Entrained
Flow
Reactor
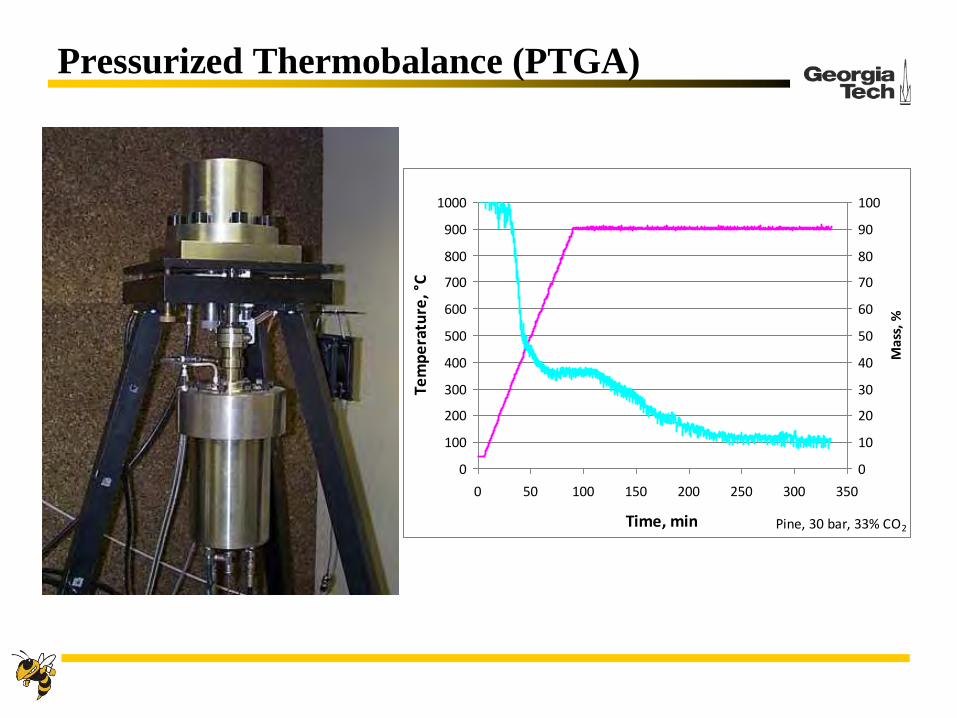
Pressurized Thermobalance (PTGA)
0
100
200
300
400
500
600
700
800
900
1000
0 50 100 150 200 250 300 350
Time, min
Tem
pe
ratu
re, °
C
0
10
20
30
40
50
60
70
80
90
100
Mas
s, %
Pine, 30 bar, 33% CO2

Effect of Pressure and Heating Rate on Loss of Mass
in PTGA Pyrolysis
-5
0
5
10
0 200 400 600 800
-dm
/dt,
mg
/min
Temperature, °C
Loblolly Pine, 5C/min
5 bar 30 bar
-10
0
10
20
30
40
50
0 200 400 600 800-dm
,dt,
g/m
in
Temperature, °C
Loblolly Pine, 25C/min
5 bar
30 bar

Effect of Pressure on Residual Char
0%
10%
20%
30%
0 10 20 30 40
Ch
ar
Yie
ld
Pressure, bar
Loblolly Pine, Final T 900C

FTIR vs. Mass Spectrometer in PTGA
0.E+00
2.E-10
4.E-10
6.E-10
8.E-10
0
0.05
0.1
0.15
0.2
0.25
0.3
0 50 100 150 200
peak h
eig
ht
ab
so
rba
nc
e
time (mins)
CO2 MS (44) vs. FTIR (2319 cm-1)
0.E+00
2.E-12
4.E-12
6.E-12
8.E-12
1.E-11
1 11 21 31 41 51 61 71 81 91

Effect of Pressure on Gas Species Evolution
0.0E+00
1.0E-09
2.0E-09
3.0E-09
4.0E-09
0 20 40
Pressure, bar
H2 (2)CH4 (16)CO (28)CO2 (44)
0.0E+00
1.0E-10
2.0E-10
0 10 20 30 40Pressure, bar
C2H2 (26)
C2H3 (27)
Benzene (78)
0.0E+00
1.0E-10
2.0E-10
3.0E-10
0 20 40Pressure, bar
C2H5 (29)
C2H6 (30)
0.0E+00
5.0E-12
1.0E-11
1.5E-11
2.0E-11
0 20 40
Pressure, bar
Acetic acid/Formaldehyde(60)

Effect of Pressure on Gas Species Evolution
-1.E-11
0.E+00
1.E-11
2.E-11
3.E-11
4.E-11
5.E-11
0 50 100 150
Time, min
Major Gas Species (5 bar)
CO2 (44)
CO (28)
CH4 (16)
H2 (2)
Pine, 10C/min
-1.E-11
0.E+00
1.E-11
2.E-11
3.E-11
4.E-11
5.E-11
6.E-11
7.E-11
0 50 100 150
Time, min
Major Gas Species (30 bar)
CO2 (44) CO (28)
CH4 (16)
H2 (2)
Pine, 10C/min
-1.E-12
0.E+00
1.E-12
2.E-12
3.E-12
4.E-12
5.E-12
6.E-12
0 50 100 150
Time, min
Light Hydrocarbons (5 bar)
C2H5 (29)
C2H2 (26)
C2H3 (27)
C2H3 (30)
-1.E-12
0.E+00
1.E-12
2.E-12
3.E-12
4.E-12
5.E-12
6.E-12
0 50 100 150
Time, min
Light Hydrocarbons (30 bar)
C2H5 (29)
C2H2 (26)
C2H3 (27) C2H3 (30)

Effect of Pressure on Minor Gaseous Products
-5.0E-13
0.0E+00
5.0E-13
1.0E-12
1.5E-12
2.0E-12
2.5E-12
0 50 100 150 200
Time, min
Benzene, Oxygenated Species at 30 bar
Benzene (78) Acetic acid/ Hydroxyacet- aldehyde(60) Furan (68)
-2.0E-13
-1.0E-15
2.0E-13
4.0E-13
6.0E-13
8.0E-13
1.0E-12
1.2E-12
0 50 100 150
Time, min
Benzene, Oxygenated Species at 5 bar
Benzene (78) Acetic acid/ Hydroxyacetaldehyde2(60)
Furan (68)
-5.00E-13
5.00E-13
1.50E-12
2.50E-12
3.50E-12
4.50E-12
0 50 100 150 200
Time, min
Benzene, Methanol at 5 bar
Benzene (78)
CH3O- (31)
-5.00E-13
5.00E-13
1.50E-12
2.50E-12
3.50E-12
0 50 100 150 200
Time, min
Benzene, Methanol at 30 bar
Benzene (78)
CH3O- (31)

Morphology Studies
Effect of Temperature at Constant pressure
Char generated in LEFR
1000 C 800 C 600 C

Effect on Pressure at constant temperature
600 C
5 bar 1 bar 10 bar

800 C
1 bar 10 bar 5 bar
Effect on Pressure at constant temperature

1000 C
1 bar 5 bar 10 bar 1 bar
Effect on Pressure at constant temperature

Gas-Filled Pockets Formed at High Pressures
Pine Char Formed at 15 bars and 1000 C

Gas Composition during Pyrolysis
Species
Gas Composition (mole%) at 5 bars
600 oC 800 oC 1000 oC
CO 45.2 41.2 61.0
CO2 16.7 16.9 12.1
H2 8.9 24.5 21.9
CH4 21.1 16.6 4.75
C2H6 1.42
C2H4 5.70 0.52 0.10
C2H2 0.09 0.22 0.15
C3H8 0.03
C3H6 0.66
C4H10
C4H8
C4H6 0.14

Gas Composition during Pyrolysis
Species Gas Composition (mole%) at 15 bars
600 oC 800 oC 1000 oC
CO 39.4 37.5 65.3
CO2 17.7 17.7 5.9
H2 17.4 29.0 26.0
CH4 21.7 15.6 2.84
C2H6 0.1
C2H4 3.40
C2H2 0.20 0.16
C3H8
C3H6
C4H10
C4H8
C4H6 0.03

BET Surface Area of Switchgrass Chars generated in PEFR Reference: Switchgrass feed BET area 0.8 m2/gm
600 oC
m2/gm
800 oC
m2/gm
1000 oC
m2/gm
1 bar 1.8 2.9 75
5 bars 3.0 187 321
10 bars 3.3 175 278
15 bars 5.2 108 198

Georgia Institute of Technology Innovation for Our Energy Future
Mass Transfer Limitations in Thermobalances
Mass transfer: - from bulk gas to surface of sample holder - from surface of sample to bottom of sample -from surface of particle to center of particle

Georgia Institute of Technology Innovation for Our Energy Future
Impact of Heating Rate
A PEFR 600C 5 bar
B PEFR 1000C 5 bar C PEFR 600C 15 bar D PTGA 900C 5 bar
Chars prepared in PEFR (high heating rate) and PTGA (low heating rate) gasified in PTGA
0%
20%
40%
60%
80%
100%
130 140 150 160 170 180 190 200
Mas
s
Time (min)
A B
D C
900C, 5 bar, CO2

Georgia Institute of Technology Innovation for Our Energy Future
Testing for Mass Transfer Limitations
0%
20%
40%
60%
80%
100%
125 130 135 140 145 150
Time (min)
Ma
ss
25 mg
51 mg
1000°C
0%
20%
40%
60%
80%
100%
200 220 240 260 280
Time (min)
Ma
ss
29 mg
54 mg
900°C
0%
20%
40%
60%
80%
100%
110 130 150 170 190 210
Time (min)
Ma
ss
25 mg
48 mg
850°C
0%
20%
40%
60%
80%
100%
100 150 200 250 300 350 400
Time (min)
Ma
ss
25 mg
50 mg
800°C

Georgia Institute of Technology
Loblolly Pine Gasification in PEFR
Gasification Conditions: 10% CO2, 2% H2O, 0.3% H2, 1.72% CO, 86% N2
900 oC particle size 180-250 µm
Residence Time Percent carbon remaining in the
char Residue Pressure 5 bars Pressure 15 bars
3 sec 50.4 % 52.9 %
6 sec 40.0 %
10 sec 24.5 % 32.0 %

Georgia Institute of Technology
Cornstover Gasification in PEFR
Gasification Conditions: 10% CO2, 2% H2O, 0.3% H2, 1.72% CO, 86% N2
900 oC particle size 106-180 µm
Residence Time Percent carbon remaining in the
char Residue Pressure 5 bars Pressure 15 bars
3 sec 21.5% 29.7%
6 sec 20.3% 24.0%
10 sec 13.2% 18.6%
Georgia Institute of Technology
Conclusions
Pyrolysis pressure and temperature greatly affect char yield and char morphology. High heating rates in PEFR produce char that mimick commercial gasifier operation. PEFR can provide useful kinetic information on biomass conversion, but it will have limitations due to the need to run integral operation. PTGA operation is similar to a semi-batch reactor, which makes it possible to build the kinetic model. Caution is needed to ensure that results are not masked by the transport effects. Both PTGA and PEFR have limitations if used alone. However, when combined together, the two are complementary and would provide a basis for building a reliable mathematical model.

Future Work
• Characterization of Chars – ICP EA, Nitrogen physisorption, SEM, NMR (?), FTIR , C,H,N,O Analysis – carbon balance
• Effect of pyrolysis conditions on the formation of tars and light hydrocarbons- tar characterization
• Kinetics of char gasification (L-H models)
• Catalytic role of recycled ash and inorganic species in char gasification
• Mathematical modeling (transport effects)

Acknowledgements
• Kristiina Iisa (NREL) • Carsten Sievers • Scott Sinquefield • Steve Lien • Pranjal Kalita • Gautami Newalkar • Paige Case • Taylor Donnell • Kathryn Black
• U.S. Department of Energy (Golden, Co; Morgantown, WVa)
Top Related