


Languages
Pages
Legal

Dynamism of the Thai Agriculture
Bhanupong Nidhiprabha
Faculty of Economics, Thammasat University
Working Paper Series Vol. 2004-36 December 2004
The views expressed in this publication are those of the author(s) and
do not necessarily reflect those of the Institute.
No part of this book may be used reproduced in any manner whatsoever
without written permission except in the case of brief quotations
embodied in articles and reviews. For information, please write to the
Centre.
The International Centre for the Study of East Asian Development, Kitakyushu
1
Dynamism of the Thai Agriculture*
Bhanupong Nidhiprabha**
Associate Professor, Faculty of Economics, Thammasat University
Abstract This paper traces the development of Thailand’s agricultural sector over the past four decades. Factors contributing to agricultural productivity changes are discussed. Productivity growth in agriculture lags behind manufacture, preventing a natural transfer of agricultural workers to the non-agricultural sector. The changing pattern of competitiveness of Thailand’s agricultural exports is analyzed by focusing on their growth and world market shares. The results indicate that the Thai agricultural sector can still maintain competitiveness in some commodities. While traditional commodities may lose their importance in the future, new agricultural products would emerge. Exports of agricultural products have been diversified over the years, while their ability to compete in the world markets has been enhanced. Processed food industry would be the key to the future of Thailand’s agriculture, but maintaining export competitiveness requires constant upgrading of food-safety standards. Agricultural growth alone cannot reduce rural poverty; it must be accompanied by growth in non-agriculture. Dynamism of the Thai agriculture and its survival depend primarily on continued productivity improvement.
*Financial support for the research from The International Centre for the Study of East Asian Development, Kitakyushu, is gratefully acknowledged. The author wishes to thank comments by Shigeyuki Abe, Masumi Hakogi, Susumu Hondai, and Eric Ramstetter. **Associate Professor, Faculty of Economics, Thammasat University Address: Prachan Road, Bangkok 10200, Thailand. Tel: 66-2-613-2004 Fax: 66-2-222-8872 Email: [email protected]
2
1. Introduction There has been a pessimistic view about the future of Thailand’s agricultural sector. The dismal view is understandable because the shares of agriculture in GDP and agricultural exports in total exports have been declining continuously over the past three decades1. Moreover, the terms of trade of between agriculture and manufacture have been generally unfavorable to farmers. From 1995 to 2001, export prices of agricultural products had declined more proportionately than those of manufacture. When the recovery came after 2002, they recovered more slowly than labor-intensive and high-tech maunfactured products. As early as in the mid 1990s, Siamwalla (1996) predicted that Thailand would lose comparative advantage in agriculture as manufacturing has increasingly become more important than agriculture. Due to shortages of labor and water during the dry season, with the disappearance of farm land in the 1980s, the future of Thai agriculture would look bleak. Coxhead and Plangpraphan (1999) further pursued the issue of the declining agriculture by linking the Dutch-disease to an irreversible decline of the Thai agriculture. The boom in the non-agricultural sector led to higher wage rates in urban areas. As a result of migration, the lack of labor intensified farm mechanization, which in turn diminished employment opportunities in agriculture. Wage pressure and declining agricultural prices squeezed farm profits, discouraging investment and further reducing agricultural growth. It is argued in this paper that the Thai agricultural sector is still full of dynamism. The agricultural sector is determined to improve productivity and increase its competitiveness in global markets. Thai farmers are receptive to price changes and adoption of new technology 2 . Although the Thai agriculture may lose its competitiveness in some commodities, it can still provide surplus large enough to maintain low cost of living and competitive wages for the industrial sector. Nevertheless, the major problem of the Thai agricultural sector remains in the area of productivity enhancement so that agricultural labor can be released fast enough to lessen the pressure on the wage rate in manufacturing and service sectors. The role of public investment in the sector is called for to enhance agricultural productivity. The relationship between urban and rural incomes is strengthened by labor migration. Seasonal unemployment in the rural area is reduced by migration of agricultural workers into construction in urban areas. There is also interconnectedness between the two sectors through income transfers by workers in urban to rural areas. GDP growth in the agricultural sector fluctuates much more than non-agricultural sector. Its standard deviation is seven times higher than the growth rate of non-agricultural output3. Because of the financial crisis in the late 1990s and the oil price shocks in the early 1970s, fluctuations of income growth in the non-agricultural sector income remain the same between the period 1979-1989 and the period 1990-2003, with the standard deviation around 3.9.
3
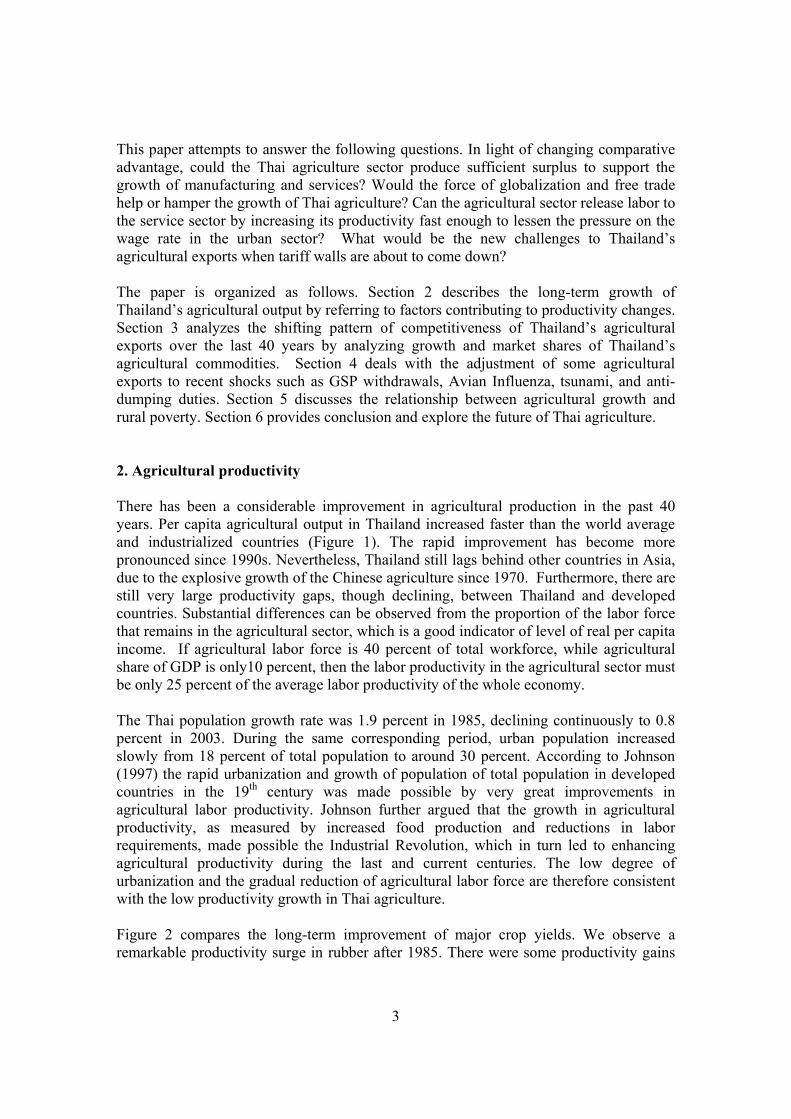
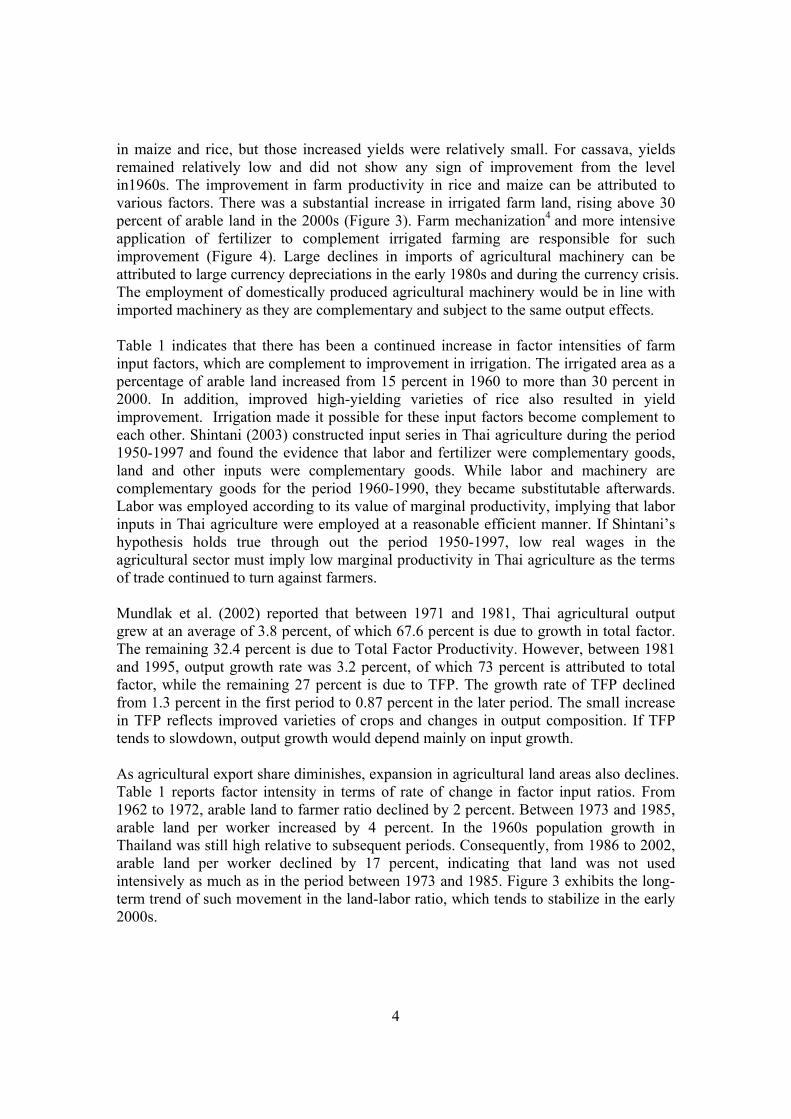
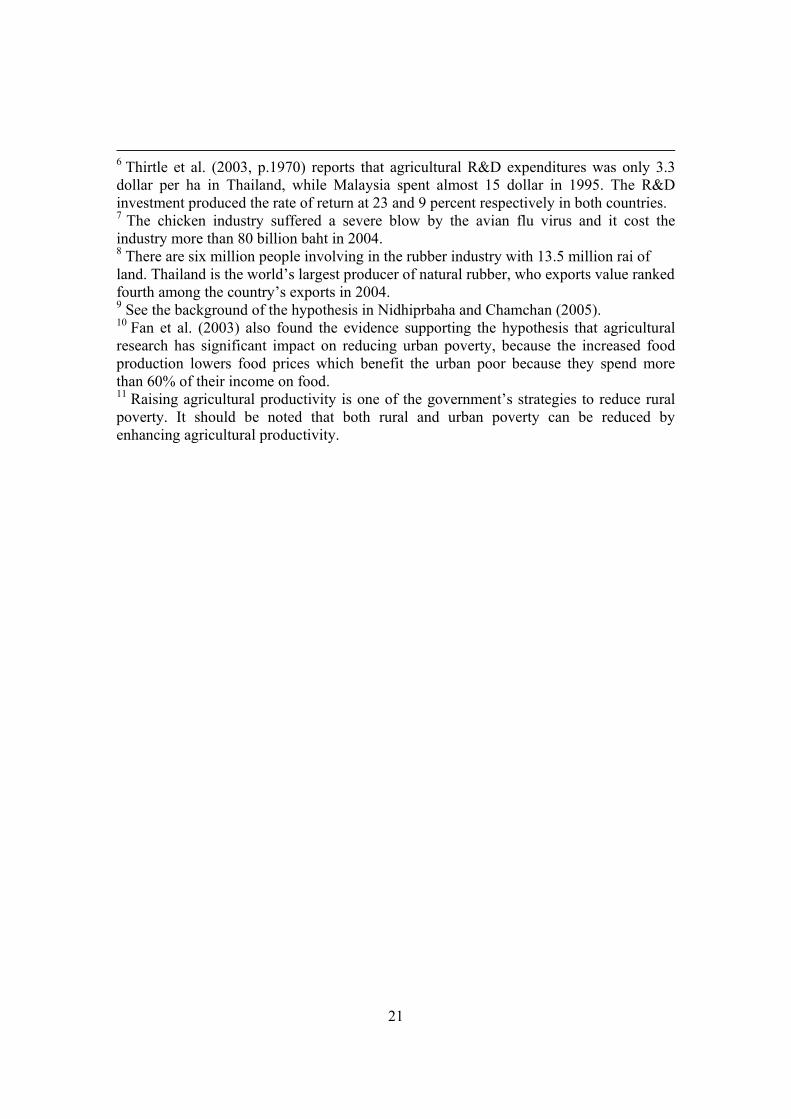
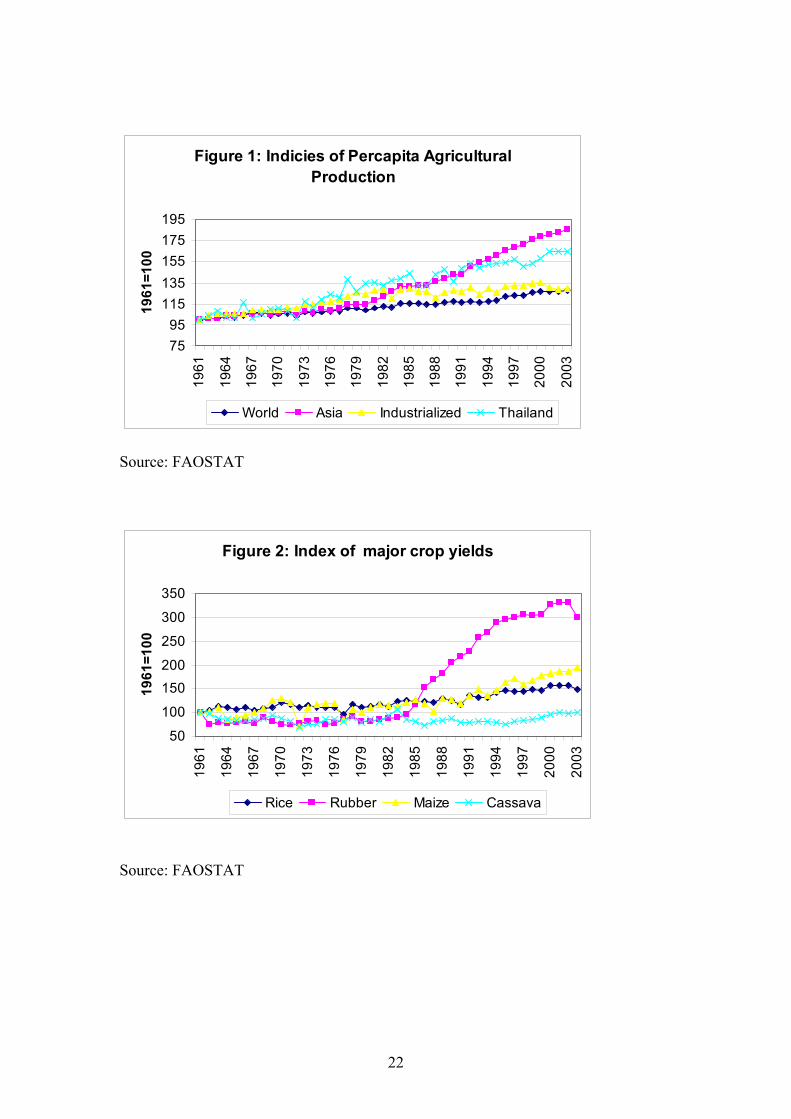
This paper attempts to answer the following questions. In light of changing comparative advantage, could the Thai agriculture sector produce sufficient surplus to support the growth of manufacturing and services? Would the force of globalization and free trade help or hamper the growth of Thai agriculture? Can the agricultural sector release labor to the service sector by increasing its productivity fast enough to lessen the pressure on the wage rate in the urban sector? What would be the new challenges to Thailand’s agricultural exports when tariff walls are about to come down? The paper is organized as follows. Section 2 describes the long-term growth of Thailand’s agricultural output by referring to factors contributing to productivity changes. Section 3 analyzes the shifting pattern of competitiveness of Thailand’s agricultural exports over the last 40 years by analyzing growth and market shares of Thailand’s agricultural commodities. Section 4 deals with the adjustment of some agricultural exports to recent shocks such as GSP withdrawals, Avian Influenza, tsunami, and anti-dumping duties. Section 5 discusses the relationship between agricultural growth and rural poverty. Section 6 provides conclusion and explore the future of Thai agriculture. 2. Agricultural productivity There has been a considerable improvement in agricultural production in the past 40 years. Per capita agricultural output in Thailand increased faster than the world average and industrialized countries (Figure 1). The rapid improvement has become more pronounced since 1990s. Nevertheless, Thailand still lags behind other countries in Asia, due to the explosive growth of the Chinese agriculture since 1970. Furthermore, there are still very large productivity gaps, though declining, between Thailand and developed countries. Substantial differences can be observed from the proportion of the labor force that remains in the agricultural sector, which is a good indicator of level of real per capita income. If agricultural labor force is 40 percent of total workforce, while agricultural share of GDP is only10 percent, then the labor productivity in the agricultural sector must be only 25 percent of the average labor productivity of the whole economy. The Thai population growth rate was 1.9 percent in 1985, declining continuously to 0.8 percent in 2003. During the same corresponding period, urban population increased slowly from 18 percent of total population to around 30 percent. According to Johnson (1997) the rapid urbanization and growth of population of total population in developed countries in the 19th century was made possible by very great improvements in agricultural labor productivity. Johnson further argued that the growth in agricultural productivity, as measured by increased food production and reductions in labor requirements, made possible the Industrial Revolution, which in turn led to enhancing agricultural productivity during the last and current centuries. The low degree of urbanization and the gradual reduction of agricultural labor force are therefore consistent with the low productivity growth in Thai agriculture. Figure 2 compares the long-term improvement of major crop yields. We observe a remarkable productivity surge in rubber after 1985. There were some productivity gains
4
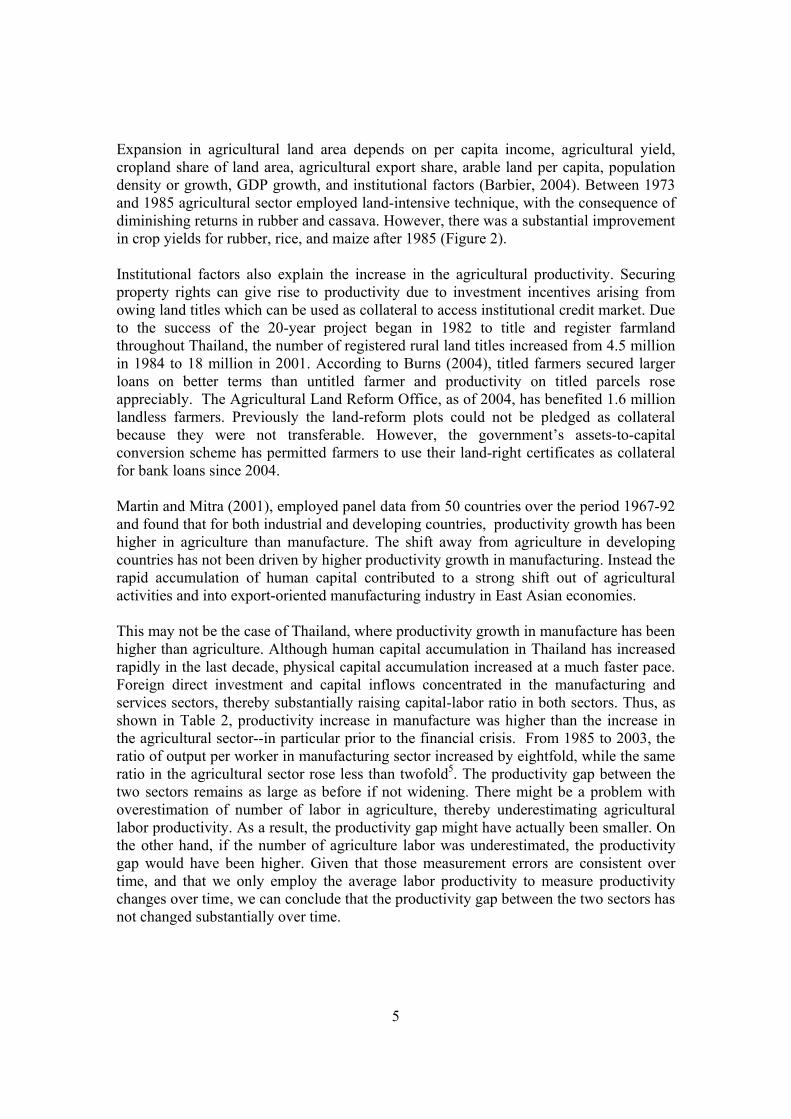
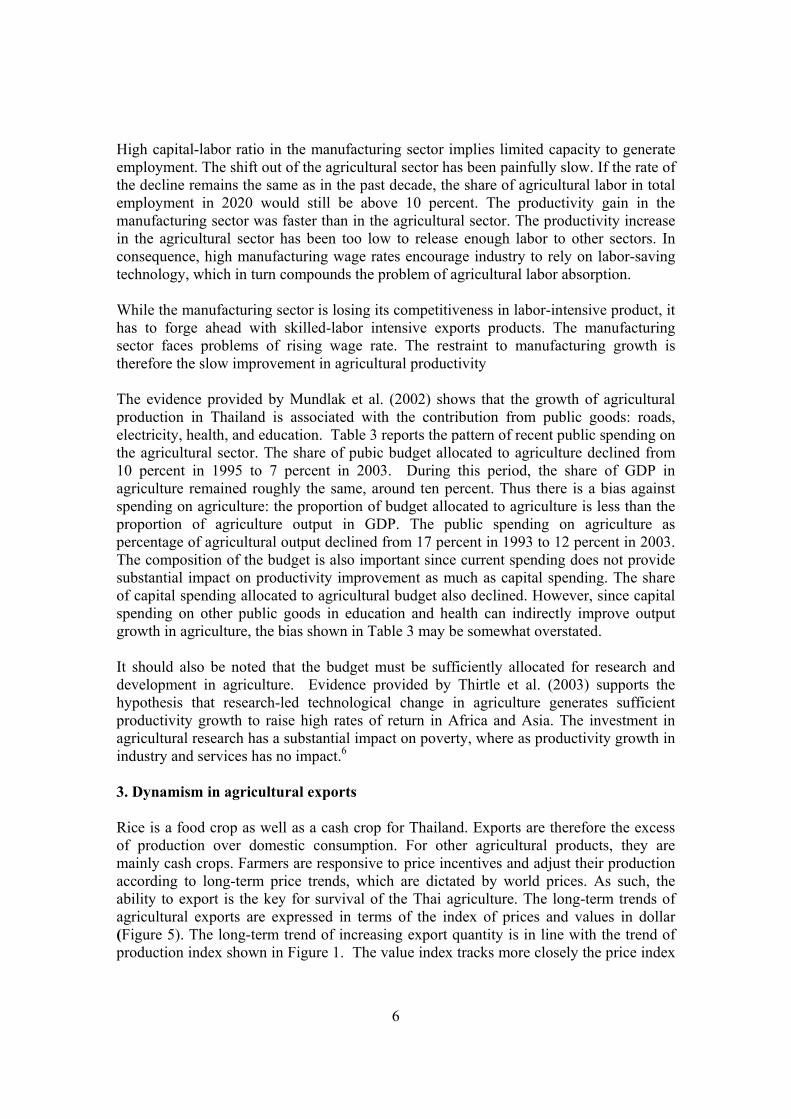
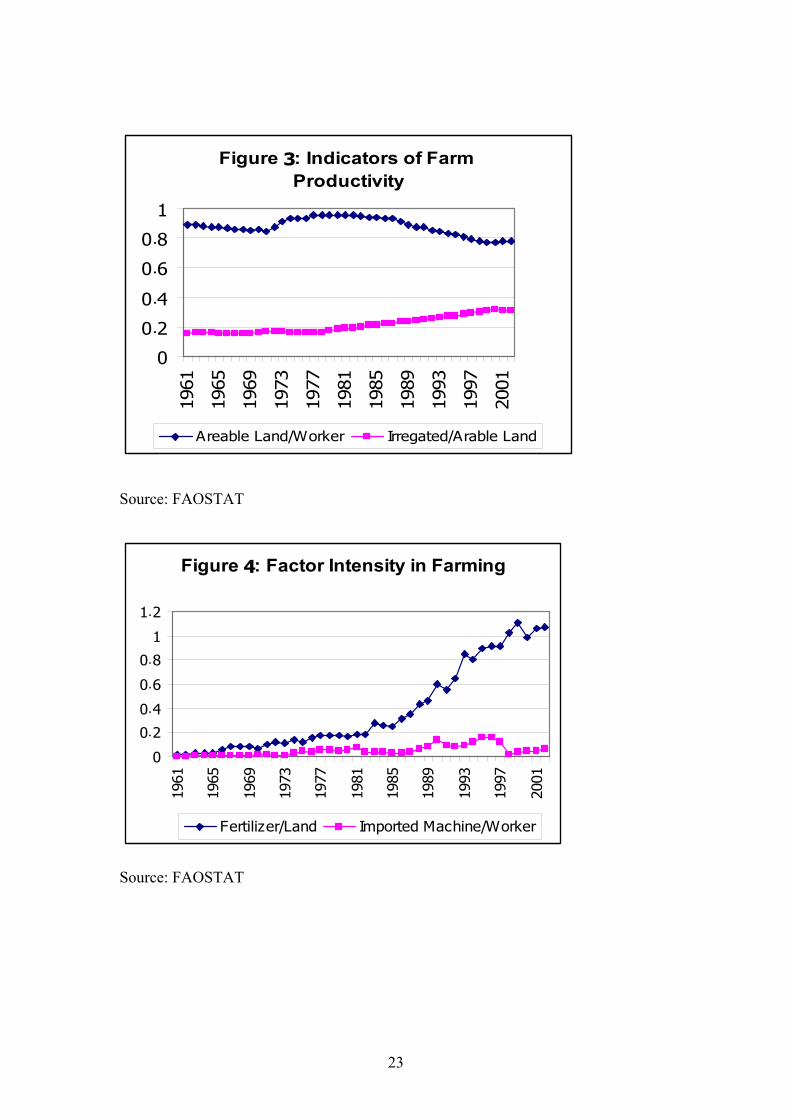
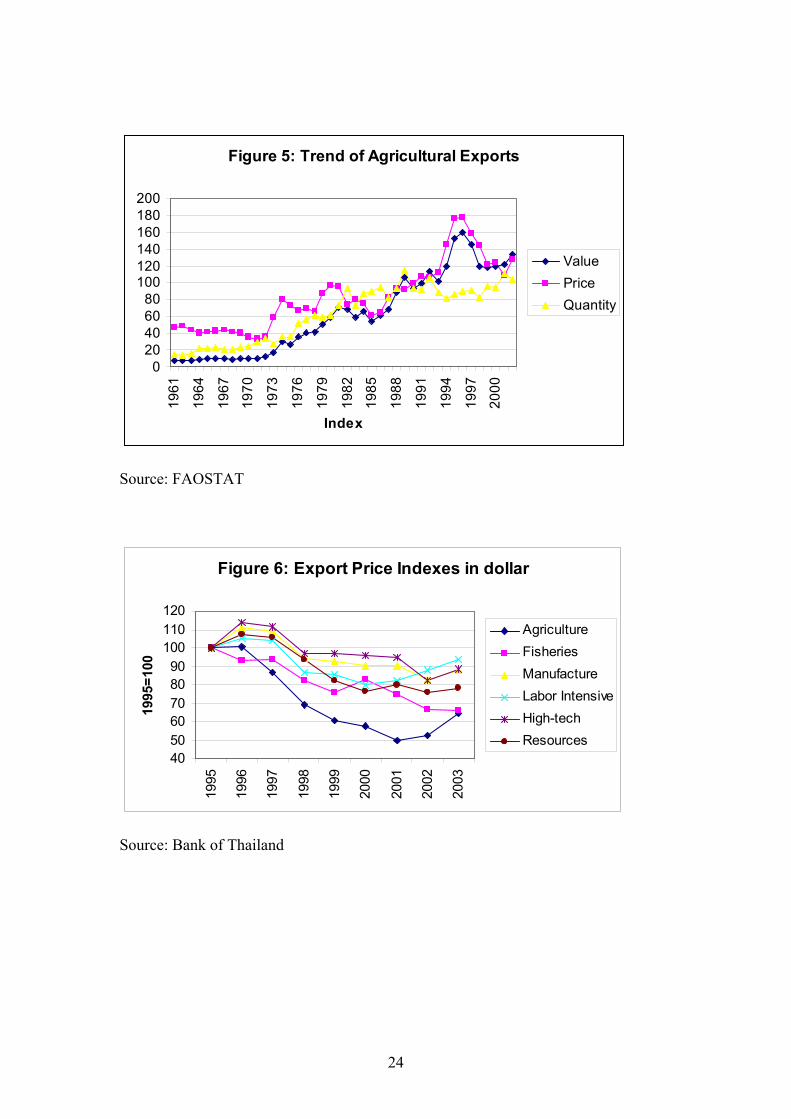
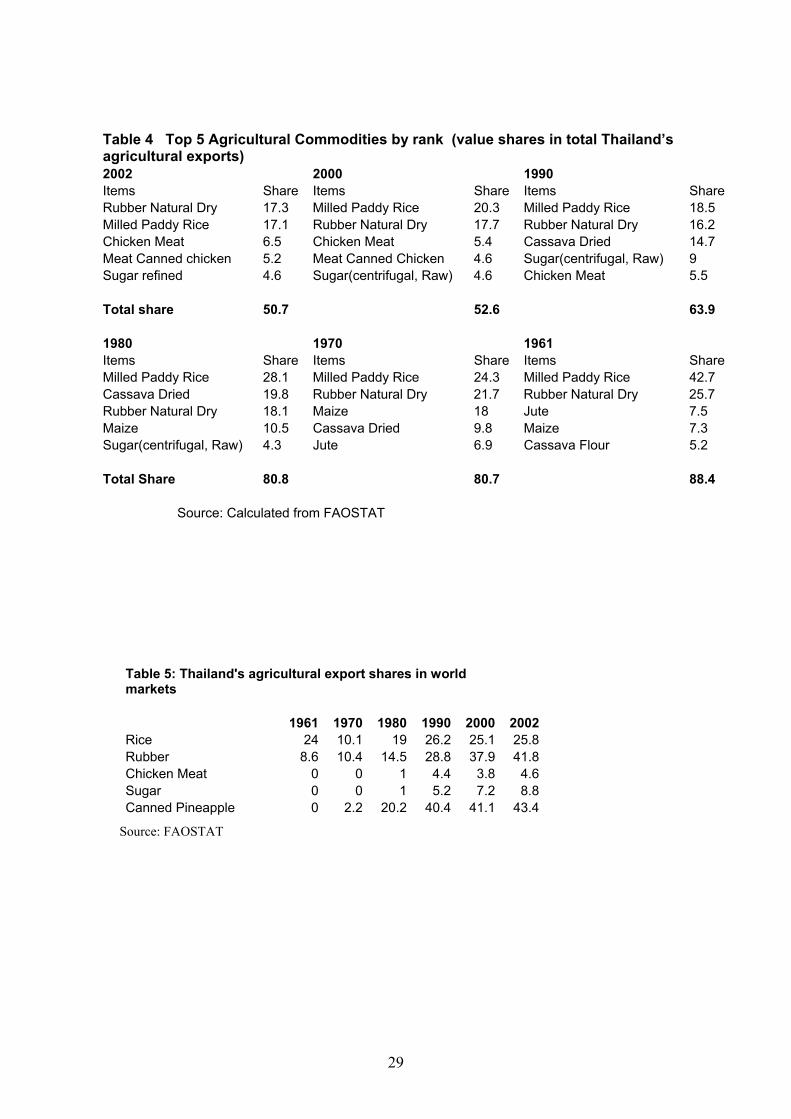
in maize and rice, but those increased yields were relatively small. For cassava, yields remained relatively low and did not show any sign of improvement from the level in1960s. The improvement in farm productivity in rice and maize can be attributed to various factors. There was a substantial increase in irrigated farm land, rising above 30 percent of arable land in the 2000s (Figure 3). Farm mechanization4 and more intensive application of fertilizer to complement irrigated farming are responsible for such improvement (Figure 4). Large declines in imports of agricultural machinery can be attributed to large currency depreciations in the early 1980s and during the currency crisis. The employment of domestically produced agricultural machinery would be in line with imported machinery as they are complementary and subject to the same output effects. Table 1 indicates that there has been a continued increase in factor intensities of farm input factors, which are complement to improvement in irrigation. The irrigated area as a percentage of arable land increased from 15 percent in 1960 to more than 30 percent in 2000. In addition, improved high-yielding varieties of rice also resulted in yield improvement. Irrigation made it possible for these input factors become complement to each other. Shintani (2003) constructed input series in Thai agriculture during the period 1950-1997 and found the evidence that labor and fertilizer were complementary goods, land and other inputs were complementary goods. While labor and machinery are complementary goods for the period 1960-1990, they became substitutable afterwards. Labor was employed according to its value of marginal productivity, implying that labor inputs in Thai agriculture were employed at a reasonable efficient manner. If Shintani’s hypothesis holds true through out the period 1950-1997, low real wages in the agricultural sector must imply low marginal productivity in Thai agriculture as the terms of trade continued to turn against farmers. Mundlak et al. (2002) reported that between 1971 and 1981, Thai agricultural output grew at an average of 3.8 percent, of which 67.6 percent is due to growth in total factor. The remaining 32.4 percent is due to Total Factor Productivity. However, between 1981 and 1995, output growth rate was 3.2 percent, of which 73 percent is attributed to total factor, while the remaining 27 percent is due to TFP. The growth rate of TFP declined from 1.3 percent in the first period to 0.87 percent in the later period. The small increase in TFP reflects improved varieties of crops and changes in output composition. If TFP tends to slowdown, output growth would depend mainly on input growth. As agricultural export share diminishes, expansion in agricultural land areas also declines. Table 1 reports factor intensity in terms of rate of change in factor input ratios. From 1962 to 1972, arable land to farmer ratio declined by 2 percent. Between 1973 and 1985, arable land per worker increased by 4 percent. In the 1960s population growth in Thailand was still high relative to subsequent periods. Consequently, from 1986 to 2002, arable land per worker declined by 17 percent, indicating that land was not used intensively as much as in the period between 1973 and 1985. Figure 3 exhibits the long-term trend of such movement in the land-labor ratio, which tends to stabilize in the early 2000s.
5
Expansion in agricultural land area depends on per capita income, agricultural yield, cropland share of land area, agricultural export share, arable land per capita, population density or growth, GDP growth, and institutional factors (Barbier, 2004). Between 1973 and 1985 agricultural sector employed land-intensive technique, with the consequence of diminishing returns in rubber and cassava. However, there was a substantial improvement in crop yields for rubber, rice, and maize after 1985 (Figure 2). Institutional factors also explain the increase in the agricultural productivity. Securing property rights can give rise to productivity due to investment incentives arising from owing land titles which can be used as collateral to access institutional credit market. Due to the success of the 20-year project began in 1982 to title and register farmland throughout Thailand, the number of registered rural land titles increased from 4.5 million in 1984 to 18 million in 2001. According to Burns (2004), titled farmers secured larger loans on better terms than untitled farmer and productivity on titled parcels rose appreciably. The Agricultural Land Reform Office, as of 2004, has benefited 1.6 million landless farmers. Previously the land-reform plots could not be pledged as collateral because they were not transferable. However, the government’s assets-to-capital conversion scheme has permitted farmers to use their land-right certificates as collateral for bank loans since 2004. Martin and Mitra (2001), employed panel data from 50 countries over the period 1967-92 and found that for both industrial and developing countries, productivity growth has been higher in agriculture than manufacture. The shift away from agriculture in developing countries has not been driven by higher productivity growth in manufacturing. Instead the rapid accumulation of human capital contributed to a strong shift out of agricultural activities and into export-oriented manufacturing industry in East Asian economies. This may not be the case of Thailand, where productivity growth in manufacture has been higher than agriculture. Although human capital accumulation in Thailand has increased rapidly in the last decade, physical capital accumulation increased at a much faster pace. Foreign direct investment and capital inflows concentrated in the manufacturing and services sectors, thereby substantially raising capital-labor ratio in both sectors. Thus, as shown in Table 2, productivity increase in manufacture was higher than the increase in the agricultural sector--in particular prior to the financial crisis. From 1985 to 2003, the ratio of output per worker in manufacturing sector increased by eightfold, while the same ratio in the agricultural sector rose less than twofold5. The productivity gap between the two sectors remains as large as before if not widening. There might be a problem with overestimation of number of labor in agriculture, thereby underestimating agricultural labor productivity. As a result, the productivity gap might have actually been smaller. On the other hand, if the number of agriculture labor was underestimated, the productivity gap would have been higher. Given that those measurement errors are consistent over time, and that we only employ the average labor productivity to measure productivity changes over time, we can conclude that the productivity gap between the two sectors has not changed substantially over time.
6
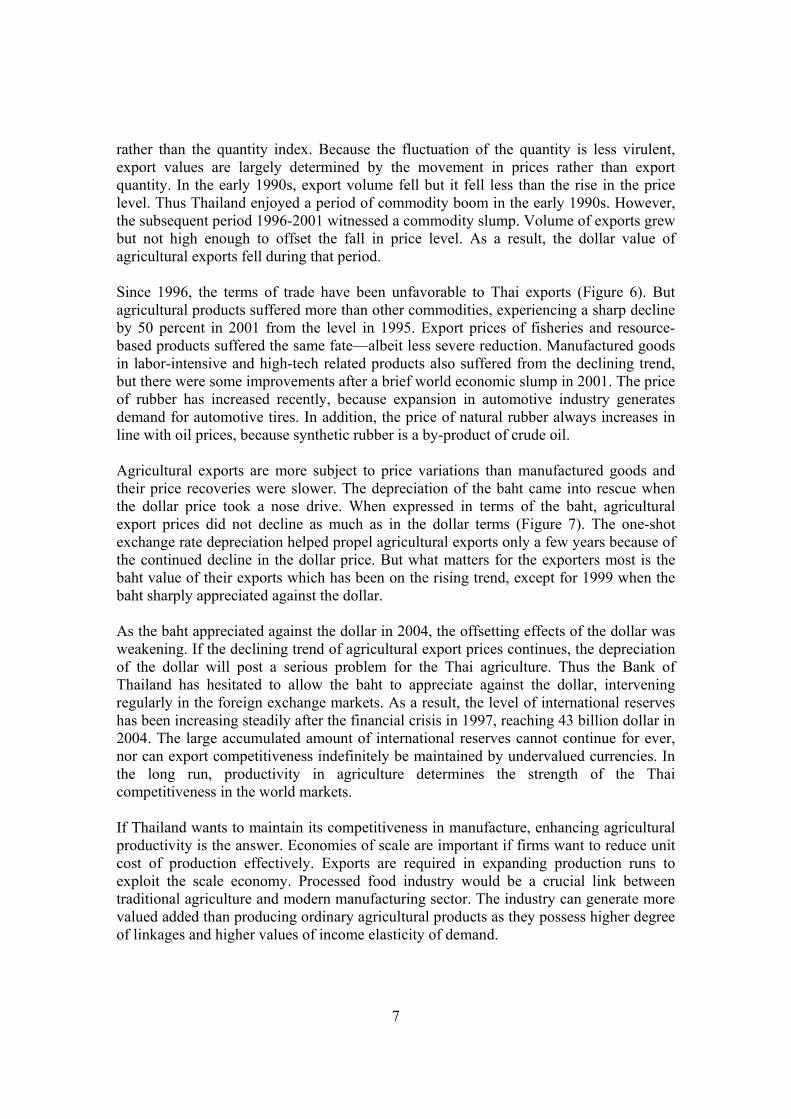
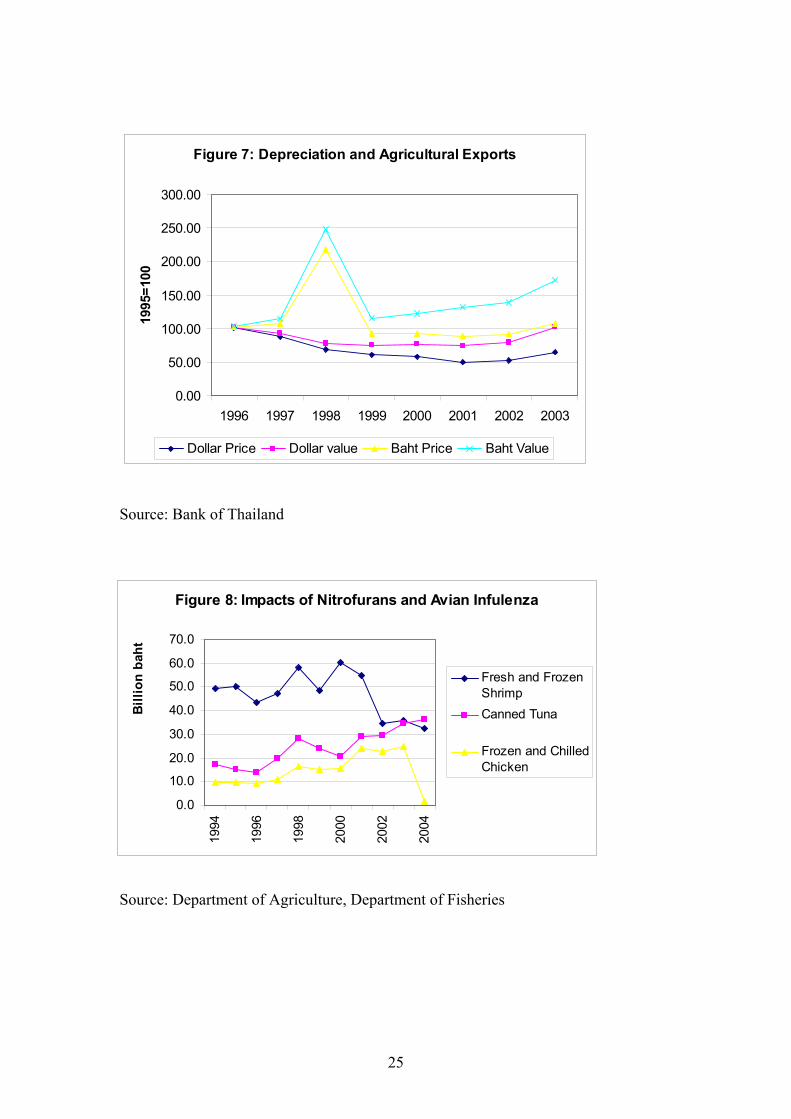
High capital-labor ratio in the manufacturing sector implies limited capacity to generate employment. The shift out of the agricultural sector has been painfully slow. If the rate of the decline remains the same as in the past decade, the share of agricultural labor in total employment in 2020 would still be above 10 percent. The productivity gain in the manufacturing sector was faster than in the agricultural sector. The productivity increase in the agricultural sector has been too low to release enough labor to other sectors. In consequence, high manufacturing wage rates encourage industry to rely on labor-saving technology, which in turn compounds the problem of agricultural labor absorption. While the manufacturing sector is losing its competitiveness in labor-intensive product, it has to forge ahead with skilled-labor intensive exports products. The manufacturing sector faces problems of rising wage rate. The restraint to manufacturing growth is therefore the slow improvement in agricultural productivity The evidence provided by Mundlak et al. (2002) shows that the growth of agricultural production in Thailand is associated with the contribution from public goods: roads, electricity, health, and education. Table 3 reports the pattern of recent public spending on the agricultural sector. The share of pubic budget allocated to agriculture declined from 10 percent in 1995 to 7 percent in 2003. During this period, the share of GDP in agriculture remained roughly the same, around ten percent. Thus there is a bias against spending on agriculture: the proportion of budget allocated to agriculture is less than the proportion of agriculture output in GDP. The public spending on agriculture as percentage of agricultural output declined from 17 percent in 1993 to 12 percent in 2003. The composition of the budget is also important since current spending does not provide substantial impact on productivity improvement as much as capital spending. The share of capital spending allocated to agricultural budget also declined. However, since capital spending on other public goods in education and health can indirectly improve output growth in agriculture, the bias shown in Table 3 may be somewhat overstated. It should also be noted that the budget must be sufficiently allocated for research and development in agriculture. Evidence provided by Thirtle et al. (2003) supports the hypothesis that research-led technological change in agriculture generates sufficient productivity growth to raise high rates of return in Africa and Asia. The investment in agricultural research has a substantial impact on poverty, where as productivity growth in industry and services has no impact.6 3. Dynamism in agricultural exports Rice is a food crop as well as a cash crop for Thailand. Exports are therefore the excess of production over domestic consumption. For other agricultural products, they are mainly cash crops. Farmers are responsive to price incentives and adjust their production according to long-term price trends, which are dictated by world prices. As such, the ability to export is the key for survival of the Thai agriculture. The long-term trends of agricultural exports are expressed in terms of the index of prices and values in dollar (Figure 5). The long-term trend of increasing export quantity is in line with the trend of production index shown in Figure 1. The value index tracks more closely the price index
7
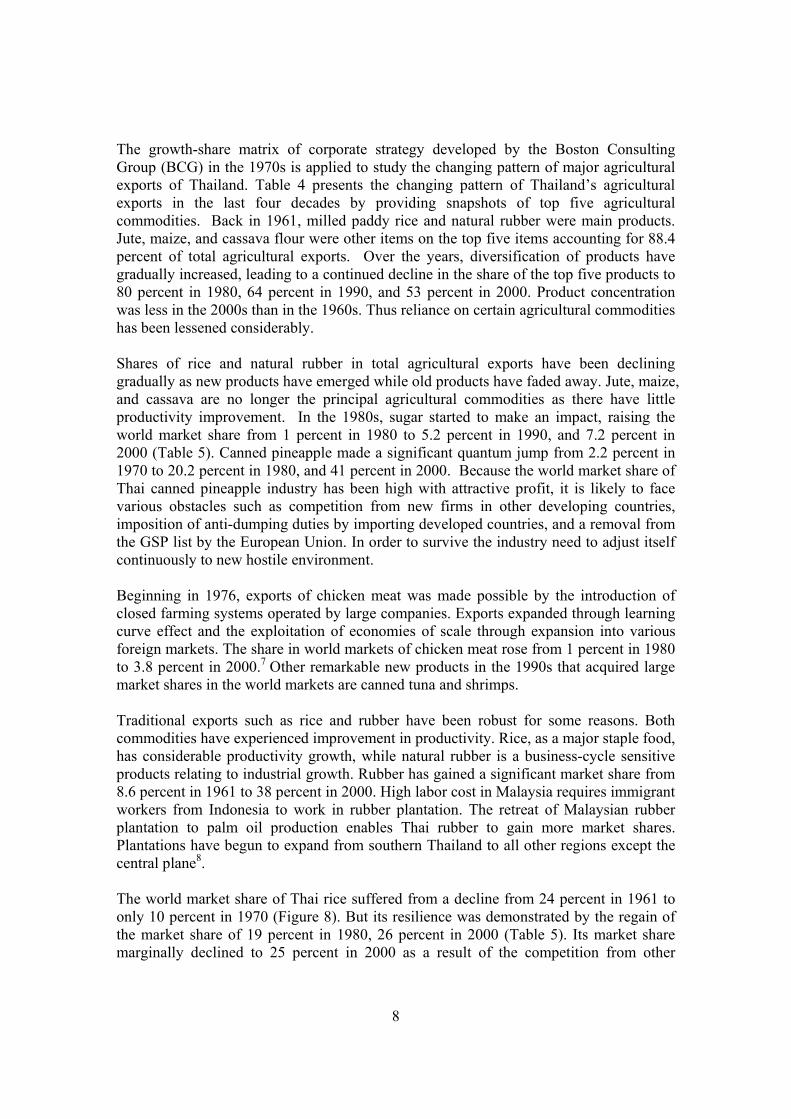
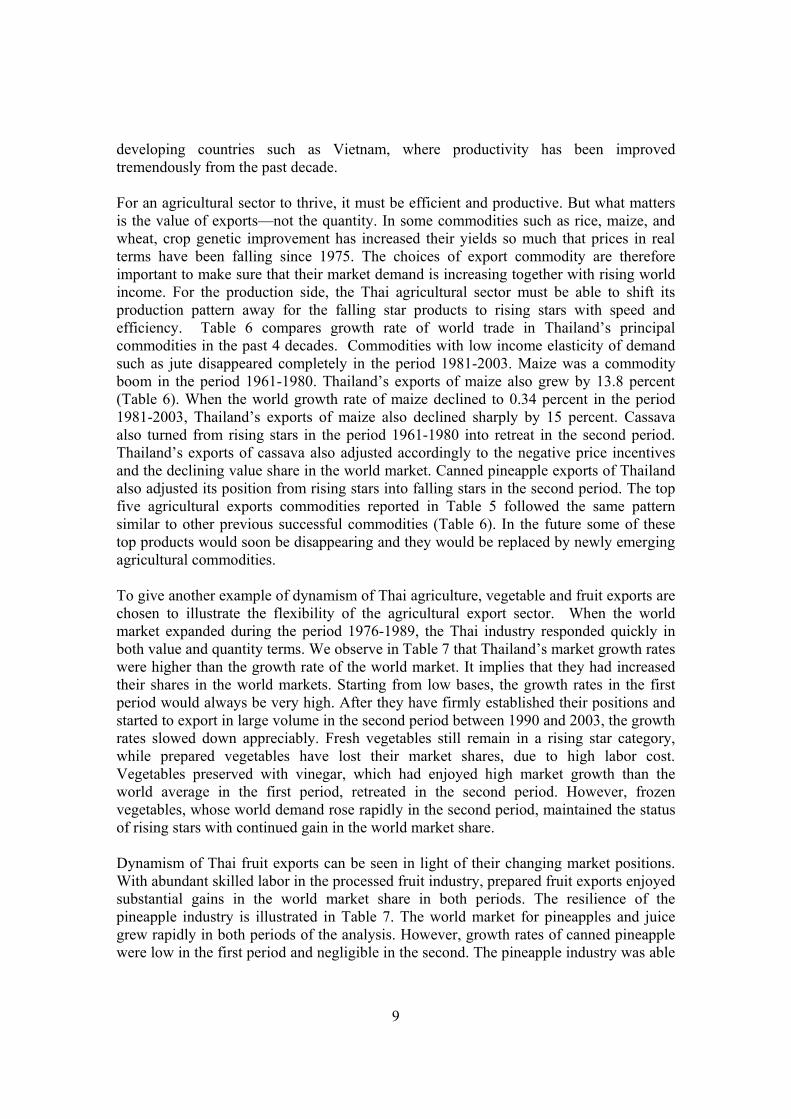
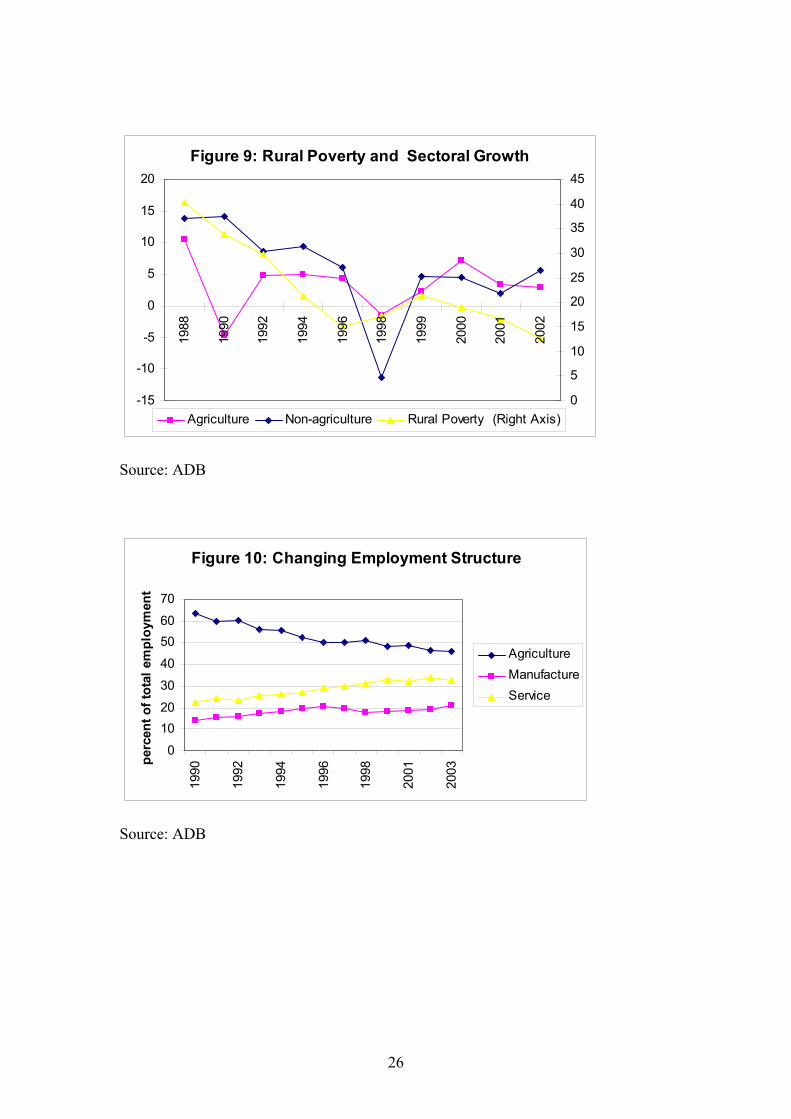
rather than the quantity index. Because the fluctuation of the quantity is less virulent, export values are largely determined by the movement in prices rather than export quantity. In the early 1990s, export volume fell but it fell less than the rise in the price level. Thus Thailand enjoyed a period of commodity boom in the early 1990s. However, the subsequent period 1996-2001 witnessed a commodity slump. Volume of exports grew but not high enough to offset the fall in price level. As a result, the dollar value of agricultural exports fell during that period. Since 1996, the terms of trade have been unfavorable to Thai exports (Figure 6). But agricultural products suffered more than other commodities, experiencing a sharp decline by 50 percent in 2001 from the level in 1995. Export prices of fisheries and resource-based products suffered the same fate—albeit less severe reduction. Manufactured goods in labor-intensive and high-tech related products also suffered from the declining trend, but there were some improvements after a brief world economic slump in 2001. The price of rubber has increased recently, because expansion in automotive industry generates demand for automotive tires. In addition, the price of natural rubber always increases in line with oil prices, because synthetic rubber is a by-product of crude oil. Agricultural exports are more subject to price variations than manufactured goods and their price recoveries were slower. The depreciation of the baht came into rescue when the dollar price took a nose drive. When expressed in terms of the baht, agricultural export prices did not decline as much as in the dollar terms (Figure 7). The one-shot exchange rate depreciation helped propel agricultural exports only a few years because of the continued decline in the dollar price. But what matters for the exporters most is the baht value of their exports which has been on the rising trend, except for 1999 when the baht sharply appreciated against the dollar. As the baht appreciated against the dollar in 2004, the offsetting effects of the dollar was weakening. If the declining trend of agricultural export prices continues, the depreciation of the dollar will post a serious problem for the Thai agriculture. Thus the Bank of Thailand has hesitated to allow the baht to appreciate against the dollar, intervening regularly in the foreign exchange markets. As a result, the level of international reserves has been increasing steadily after the financial crisis in 1997, reaching 43 billion dollar in 2004. The large accumulated amount of international reserves cannot continue for ever, nor can export competitiveness indefinitely be maintained by undervalued currencies. In the long run, productivity in agriculture determines the strength of the Thai competitiveness in the world markets. If Thailand wants to maintain its competitiveness in manufacture, enhancing agricultural productivity is the answer. Economies of scale are important if firms want to reduce unit cost of production effectively. Exports are required in expanding production runs to exploit the scale economy. Processed food industry would be a crucial link between traditional agriculture and modern manufacturing sector. The industry can generate more valued added than producing ordinary agricultural products as they possess higher degree of linkages and higher values of income elasticity of demand.
8
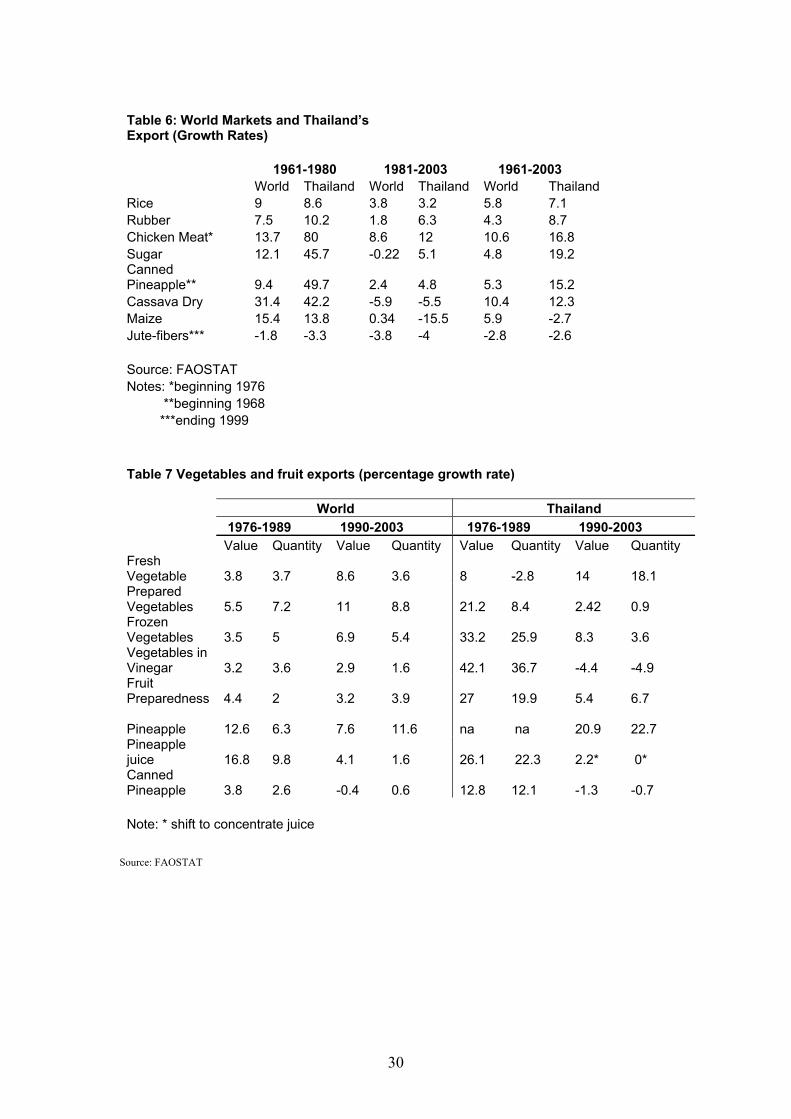
The growth-share matrix of corporate strategy developed by the Boston Consulting Group (BCG) in the 1970s is applied to study the changing pattern of major agricultural exports of Thailand. Table 4 presents the changing pattern of Thailand’s agricultural exports in the last four decades by providing snapshots of top five agricultural commodities. Back in 1961, milled paddy rice and natural rubber were main products. Jute, maize, and cassava flour were other items on the top five items accounting for 88.4 percent of total agricultural exports. Over the years, diversification of products have gradually increased, leading to a continued decline in the share of the top five products to 80 percent in 1980, 64 percent in 1990, and 53 percent in 2000. Product concentration was less in the 2000s than in the 1960s. Thus reliance on certain agricultural commodities has been lessened considerably. Shares of rice and natural rubber in total agricultural exports have been declining gradually as new products have emerged while old products have faded away. Jute, maize, and cassava are no longer the principal agricultural commodities as there have little productivity improvement. In the 1980s, sugar started to make an impact, raising the world market share from 1 percent in 1980 to 5.2 percent in 1990, and 7.2 percent in 2000 (Table 5). Canned pineapple made a significant quantum jump from 2.2 percent in 1970 to 20.2 percent in 1980, and 41 percent in 2000. Because the world market share of Thai canned pineapple industry has been high with attractive profit, it is likely to face various obstacles such as competition from new firms in other developing countries, imposition of anti-dumping duties by importing developed countries, and a removal from the GSP list by the European Union. In order to survive the industry need to adjust itself continuously to new hostile environment. Beginning in 1976, exports of chicken meat was made possible by the introduction of closed farming systems operated by large companies. Exports expanded through learning curve effect and the exploitation of economies of scale through expansion into various foreign markets. The share in world markets of chicken meat rose from 1 percent in 1980 to 3.8 percent in 2000.7 Other remarkable new products in the 1990s that acquired large market shares in the world markets are canned tuna and shrimps. Traditional exports such as rice and rubber have been robust for some reasons. Both commodities have experienced improvement in productivity. Rice, as a major staple food, has considerable productivity growth, while natural rubber is a business-cycle sensitive products relating to industrial growth. Rubber has gained a significant market share from 8.6 percent in 1961 to 38 percent in 2000. High labor cost in Malaysia requires immigrant workers from Indonesia to work in rubber plantation. The retreat of Malaysian rubber plantation to palm oil production enables Thai rubber to gain more market shares. Plantations have begun to expand from southern Thailand to all other regions except the central plane8. The world market share of Thai rice suffered from a decline from 24 percent in 1961 to only 10 percent in 1970 (Figure 8). But its resilience was demonstrated by the regain of the market share of 19 percent in 1980, 26 percent in 2000 (Table 5). Its market share marginally declined to 25 percent in 2000 as a result of the competition from other
9
developing countries such as Vietnam, where productivity has been improved tremendously from the past decade. For an agricultural sector to thrive, it must be efficient and productive. But what matters is the value of exports—not the quantity. In some commodities such as rice, maize, and wheat, crop genetic improvement has increased their yields so much that prices in real terms have been falling since 1975. The choices of export commodity are therefore important to make sure that their market demand is increasing together with rising world income. For the production side, the Thai agricultural sector must be able to shift its production pattern away for the falling star products to rising stars with speed and efficiency. Table 6 compares growth rate of world trade in Thailand’s principal commodities in the past 4 decades. Commodities with low income elasticity of demand such as jute disappeared completely in the period 1981-2003. Maize was a commodity boom in the period 1961-1980. Thailand’s exports of maize also grew by 13.8 percent (Table 6). When the world growth rate of maize declined to 0.34 percent in the period 1981-2003, Thailand’s exports of maize also declined sharply by 15 percent. Cassava also turned from rising stars in the period 1961-1980 into retreat in the second period. Thailand’s exports of cassava also adjusted accordingly to the negative price incentives and the declining value share in the world market. Canned pineapple exports of Thailand also adjusted its position from rising stars into falling stars in the second period. The top five agricultural exports commodities reported in Table 5 followed the same pattern similar to other previous successful commodities (Table 6). In the future some of these top products would soon be disappearing and they would be replaced by newly emerging agricultural commodities. To give another example of dynamism of Thai agriculture, vegetable and fruit exports are chosen to illustrate the flexibility of the agricultural export sector. When the world market expanded during the period 1976-1989, the Thai industry responded quickly in both value and quantity terms. We observe in Table 7 that Thailand’s market growth rates were higher than the growth rate of the world market. It implies that they had increased their shares in the world markets. Starting from low bases, the growth rates in the first period would always be very high. After they have firmly established their positions and started to export in large volume in the second period between 1990 and 2003, the growth rates slowed down appreciably. Fresh vegetables still remain in a rising star category, while prepared vegetables have lost their market shares, due to high labor cost. Vegetables preserved with vinegar, which had enjoyed high market growth than the world average in the first period, retreated in the second period. However, frozen vegetables, whose world demand rose rapidly in the second period, maintained the status of rising stars with continued gain in the world market share. Dynamism of Thai fruit exports can be seen in light of their changing market positions. With abundant skilled labor in the processed fruit industry, prepared fruit exports enjoyed substantial gains in the world market share in both periods. The resilience of the pineapple industry is illustrated in Table 7. The world market for pineapples and juice grew rapidly in both periods of the analysis. However, growth rates of canned pineapple were low in the first period and negligible in the second. The pineapple industry was able
10
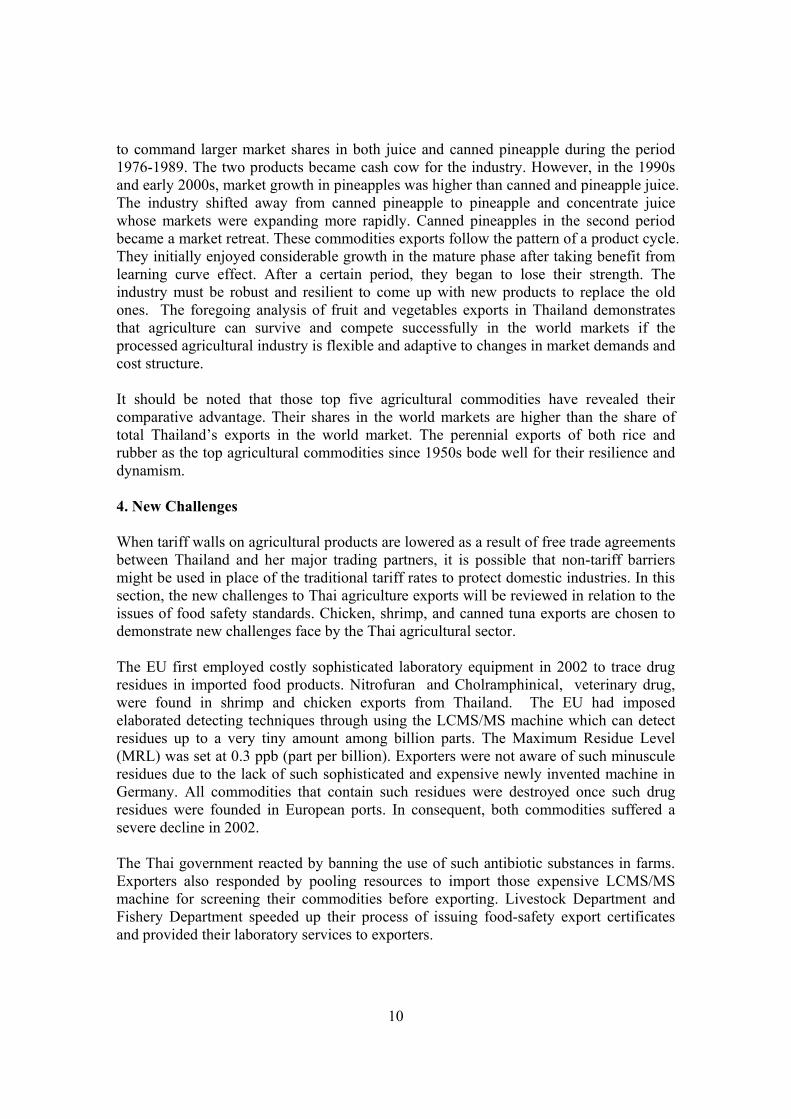
to command larger market shares in both juice and canned pineapple during the period 1976-1989. The two products became cash cow for the industry. However, in the 1990s and early 2000s, market growth in pineapples was higher than canned and pineapple juice. The industry shifted away from canned pineapple to pineapple and concentrate juice whose markets were expanding more rapidly. Canned pineapples in the second period became a market retreat. These commodities exports follow the pattern of a product cycle. They initially enjoyed considerable growth in the mature phase after taking benefit from learning curve effect. After a certain period, they began to lose their strength. The industry must be robust and resilient to come up with new products to replace the old ones. The foregoing analysis of fruit and vegetables exports in Thailand demonstrates that agriculture can survive and compete successfully in the world markets if the processed agricultural industry is flexible and adaptive to changes in market demands and cost structure. It should be noted that those top five agricultural commodities have revealed their comparative advantage. Their shares in the world markets are higher than the share of total Thailand’s exports in the world market. The perennial exports of both rice and rubber as the top agricultural commodities since 1950s bode well for their resilience and dynamism. 4. New Challenges When tariff walls on agricultural products are lowered as a result of free trade agreements between Thailand and her major trading partners, it is possible that non-tariff barriers might be used in place of the traditional tariff rates to protect domestic industries. In this section, the new challenges to Thai agriculture exports will be reviewed in relation to the issues of food safety standards. Chicken, shrimp, and canned tuna exports are chosen to demonstrate new challenges face by the Thai agricultural sector. The EU first employed costly sophisticated laboratory equipment in 2002 to trace drug residues in imported food products. Nitrofuran and Cholramphinical, veterinary drug, were found in shrimp and chicken exports from Thailand. The EU had imposed elaborated detecting techniques through using the LCMS/MS machine which can detect residues up to a very tiny amount among billion parts. The Maximum Residue Level (MRL) was set at 0.3 ppb (part per billion). Exporters were not aware of such minuscule residues due to the lack of such sophisticated and expensive newly invented machine in Germany. All commodities that contain such residues were destroyed once such drug residues were founded in European ports. In consequent, both commodities suffered a severe decline in 2002. The Thai government reacted by banning the use of such antibiotic substances in farms. Exporters also responded by pooling resources to import those expensive LCMS/MS machine for screening their commodities before exporting. Livestock Department and Fishery Department speeded up their process of issuing food-safety export certificates and provided their laboratory services to exporters.
11
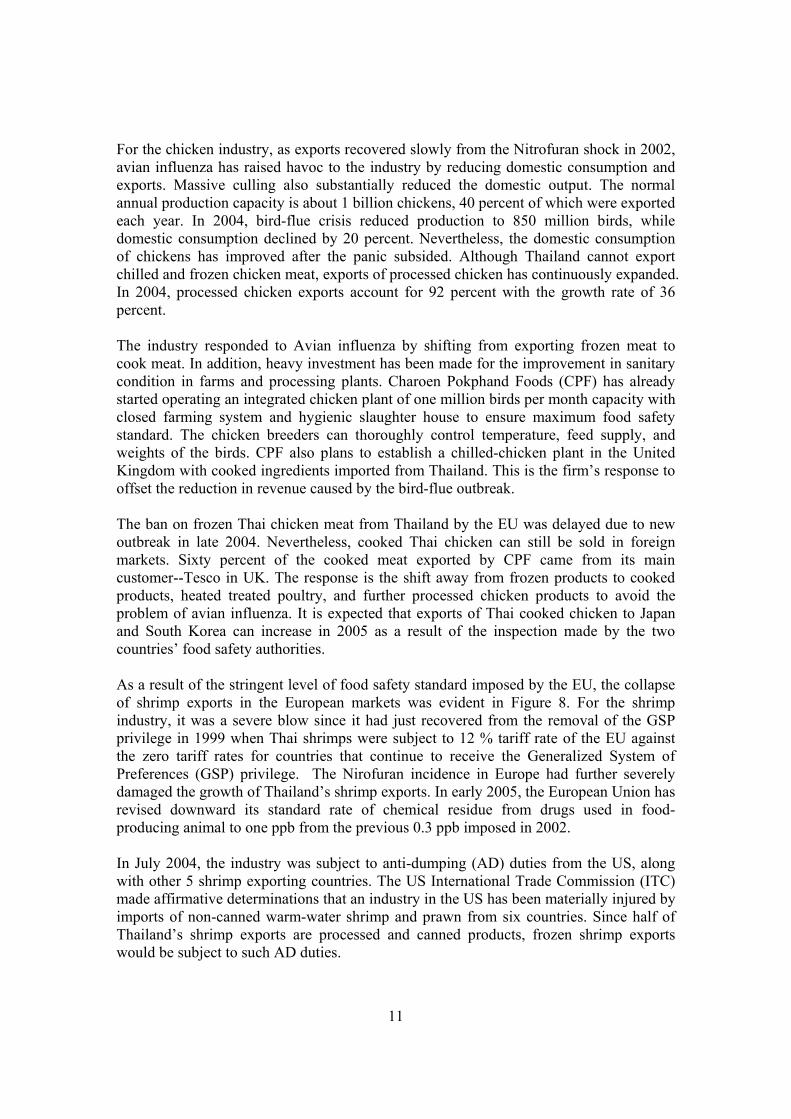
For the chicken industry, as exports recovered slowly from the Nitrofuran shock in 2002, avian influenza has raised havoc to the industry by reducing domestic consumption and exports. Massive culling also substantially reduced the domestic output. The normal annual production capacity is about 1 billion chickens, 40 percent of which were exported each year. In 2004, bird-flue crisis reduced production to 850 million birds, while domestic consumption declined by 20 percent. Nevertheless, the domestic consumption of chickens has improved after the panic subsided. Although Thailand cannot export chilled and frozen chicken meat, exports of processed chicken has continuously expanded. In 2004, processed chicken exports account for 92 percent with the growth rate of 36 percent. The industry responded to Avian influenza by shifting from exporting frozen meat to cook meat. In addition, heavy investment has been made for the improvement in sanitary condition in farms and processing plants. Charoen Pokphand Foods (CPF) has already started operating an integrated chicken plant of one million birds per month capacity with closed farming system and hygienic slaughter house to ensure maximum food safety standard. The chicken breeders can thoroughly control temperature, feed supply, and weights of the birds. CPF also plans to establish a chilled-chicken plant in the United Kingdom with cooked ingredients imported from Thailand. This is the firm’s response to offset the reduction in revenue caused by the bird-flue outbreak. The ban on frozen Thai chicken meat from Thailand by the EU was delayed due to new outbreak in late 2004. Nevertheless, cooked Thai chicken can still be sold in foreign markets. Sixty percent of the cooked meat exported by CPF came from its main customer--Tesco in UK. The response is the shift away from frozen products to cooked products, heated treated poultry, and further processed chicken products to avoid the problem of avian influenza. It is expected that exports of Thai cooked chicken to Japan and South Korea can increase in 2005 as a result of the inspection made by the two countries’ food safety authorities. As a result of the stringent level of food safety standard imposed by the EU, the collapse of shrimp exports in the European markets was evident in Figure 8. For the shrimp industry, it was a severe blow since it had just recovered from the removal of the GSP privilege in 1999 when Thai shrimps were subject to 12 % tariff rate of the EU against the zero tariff rates for countries that continue to receive the Generalized System of Preferences (GSP) privilege. The Nirofuran incidence in Europe had further severely damaged the growth of Thailand’s shrimp exports. In early 2005, the European Union has revised downward its standard rate of chemical residue from drugs used in food-producing animal to one ppb from the previous 0.3 ppb imposed in 2002. In July 2004, the industry was subject to anti-dumping (AD) duties from the US, along with other 5 shrimp exporting countries. The US International Trade Commission (ITC) made affirmative determinations that an industry in the US has been materially injured by imports of non-canned warm-water shrimp and prawn from six countries. Since half of Thailand’s shrimp exports are processed and canned products, frozen shrimp exports would be subject to such AD duties.
12
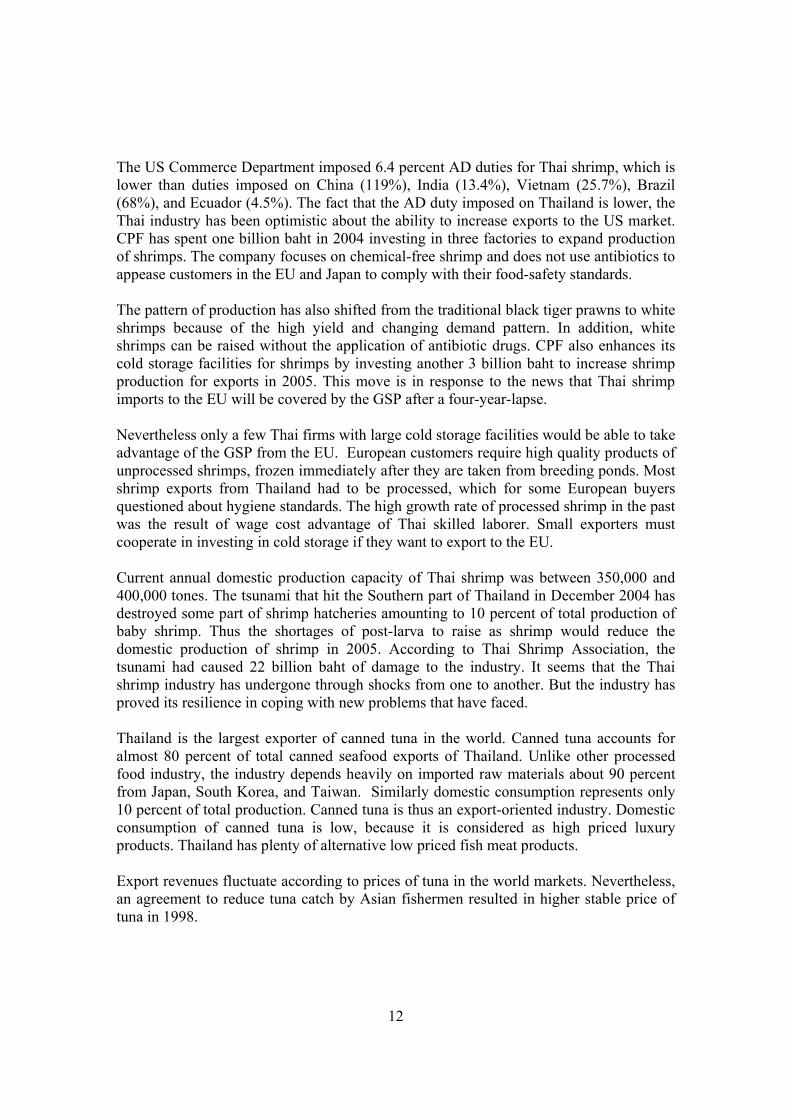
The US Commerce Department imposed 6.4 percent AD duties for Thai shrimp, which is lower than duties imposed on China (119%), India (13.4%), Vietnam (25.7%), Brazil (68%), and Ecuador (4.5%). The fact that the AD duty imposed on Thailand is lower, the Thai industry has been optimistic about the ability to increase exports to the US market. CPF has spent one billion baht in 2004 investing in three factories to expand production of shrimps. The company focuses on chemical-free shrimp and does not use antibiotics to appease customers in the EU and Japan to comply with their food-safety standards. The pattern of production has also shifted from the traditional black tiger prawns to white shrimps because of the high yield and changing demand pattern. In addition, white shrimps can be raised without the application of antibiotic drugs. CPF also enhances its cold storage facilities for shrimps by investing another 3 billion baht to increase shrimp production for exports in 2005. This move is in response to the news that Thai shrimp imports to the EU will be covered by the GSP after a four-year-lapse. Nevertheless only a few Thai firms with large cold storage facilities would be able to take advantage of the GSP from the EU. European customers require high quality products of unprocessed shrimps, frozen immediately after they are taken from breeding ponds. Most shrimp exports from Thailand had to be processed, which for some European buyers questioned about hygiene standards. The high growth rate of processed shrimp in the past was the result of wage cost advantage of Thai skilled laborer. Small exporters must cooperate in investing in cold storage if they want to export to the EU. Current annual domestic production capacity of Thai shrimp was between 350,000 and 400,000 tones. The tsunami that hit the Southern part of Thailand in December 2004 has destroyed some part of shrimp hatcheries amounting to 10 percent of total production of baby shrimp. Thus the shortages of post-larva to raise as shrimp would reduce the domestic production of shrimp in 2005. According to Thai Shrimp Association, the tsunami had caused 22 billion baht of damage to the industry. It seems that the Thai shrimp industry has undergone through shocks from one to another. But the industry has proved its resilience in coping with new problems that have faced. Thailand is the largest exporter of canned tuna in the world. Canned tuna accounts for almost 80 percent of total canned seafood exports of Thailand. Unlike other processed food industry, the industry depends heavily on imported raw materials about 90 percent from Japan, South Korea, and Taiwan. Similarly domestic consumption represents only 10 percent of total production. Canned tuna is thus an export-oriented industry. Domestic consumption of canned tuna is low, because it is considered as high priced luxury products. Thailand has plenty of alternative low priced fish meat products. Export revenues fluctuate according to prices of tuna in the world markets. Nevertheless, an agreement to reduce tuna catch by Asian fishermen resulted in higher stable price of tuna in 1998.
13
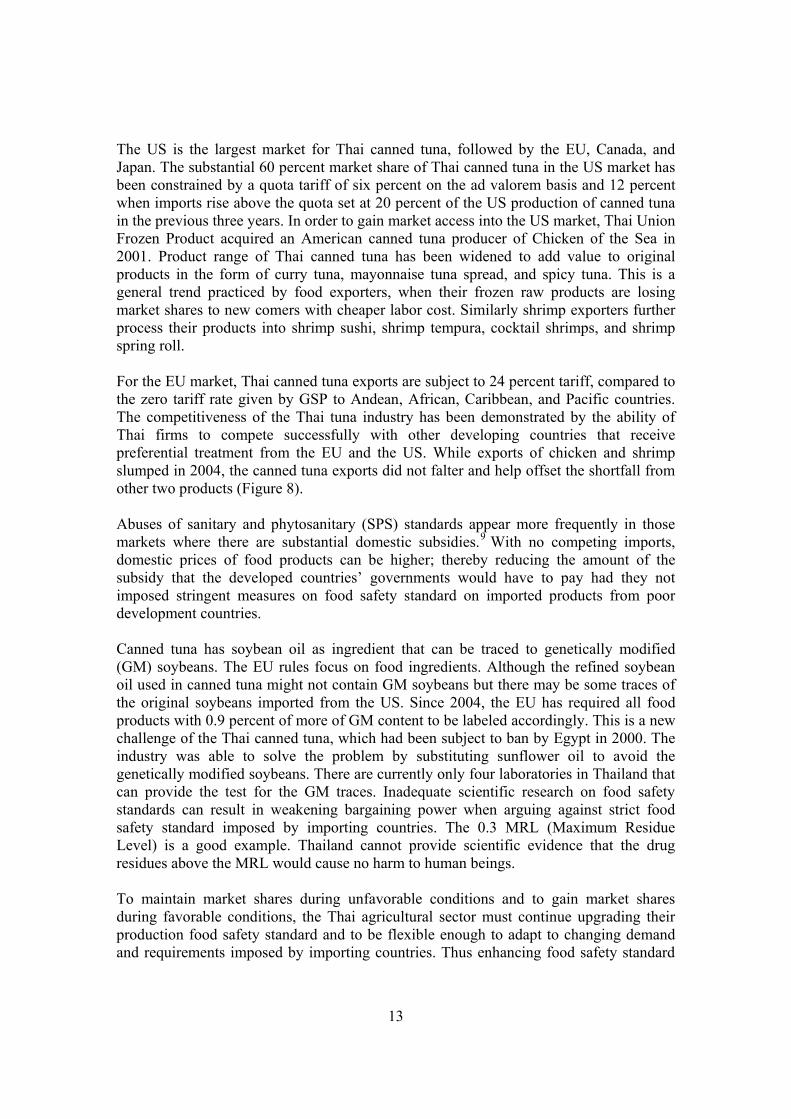
The US is the largest market for Thai canned tuna, followed by the EU, Canada, and Japan. The substantial 60 percent market share of Thai canned tuna in the US market has been constrained by a quota tariff of six percent on the ad valorem basis and 12 percent when imports rise above the quota set at 20 percent of the US production of canned tuna in the previous three years. In order to gain market access into the US market, Thai Union Frozen Product acquired an American canned tuna producer of Chicken of the Sea in 2001. Product range of Thai canned tuna has been widened to add value to original products in the form of curry tuna, mayonnaise tuna spread, and spicy tuna. This is a general trend practiced by food exporters, when their frozen raw products are losing market shares to new comers with cheaper labor cost. Similarly shrimp exporters further process their products into shrimp sushi, shrimp tempura, cocktail shrimps, and shrimp spring roll. For the EU market, Thai canned tuna exports are subject to 24 percent tariff, compared to the zero tariff rate given by GSP to Andean, African, Caribbean, and Pacific countries. The competitiveness of the Thai tuna industry has been demonstrated by the ability of Thai firms to compete successfully with other developing countries that receive preferential treatment from the EU and the US. While exports of chicken and shrimp slumped in 2004, the canned tuna exports did not falter and help offset the shortfall from other two products (Figure 8). Abuses of sanitary and phytosanitary (SPS) standards appear more frequently in those markets where there are substantial domestic subsidies.9 With no competing imports, domestic prices of food products can be higher; thereby reducing the amount of the subsidy that the developed countries’ governments would have to pay had they not imposed stringent measures on food safety standard on imported products from poor development countries. Canned tuna has soybean oil as ingredient that can be traced to genetically modified (GM) soybeans. The EU rules focus on food ingredients. Although the refined soybean oil used in canned tuna might not contain GM soybeans but there may be some traces of the original soybeans imported from the US. Since 2004, the EU has required all food products with 0.9 percent of more of GM content to be labeled accordingly. This is a new challenge of the Thai canned tuna, which had been subject to ban by Egypt in 2000. The industry was able to solve the problem by substituting sunflower oil to avoid the genetically modified soybeans. There are currently only four laboratories in Thailand that can provide the test for the GM traces. Inadequate scientific research on food safety standards can result in weakening bargaining power when arguing against strict food safety standard imposed by importing countries. The 0.3 MRL (Maximum Residue Level) is a good example. Thailand cannot provide scientific evidence that the drug residues above the MRL would cause no harm to human beings. To maintain market shares during unfavorable conditions and to gain market shares during favorable conditions, the Thai agricultural sector must continue upgrading their production food safety standard and to be flexible enough to adapt to changing demand and requirements imposed by importing countries. Thus enhancing food safety standard
14
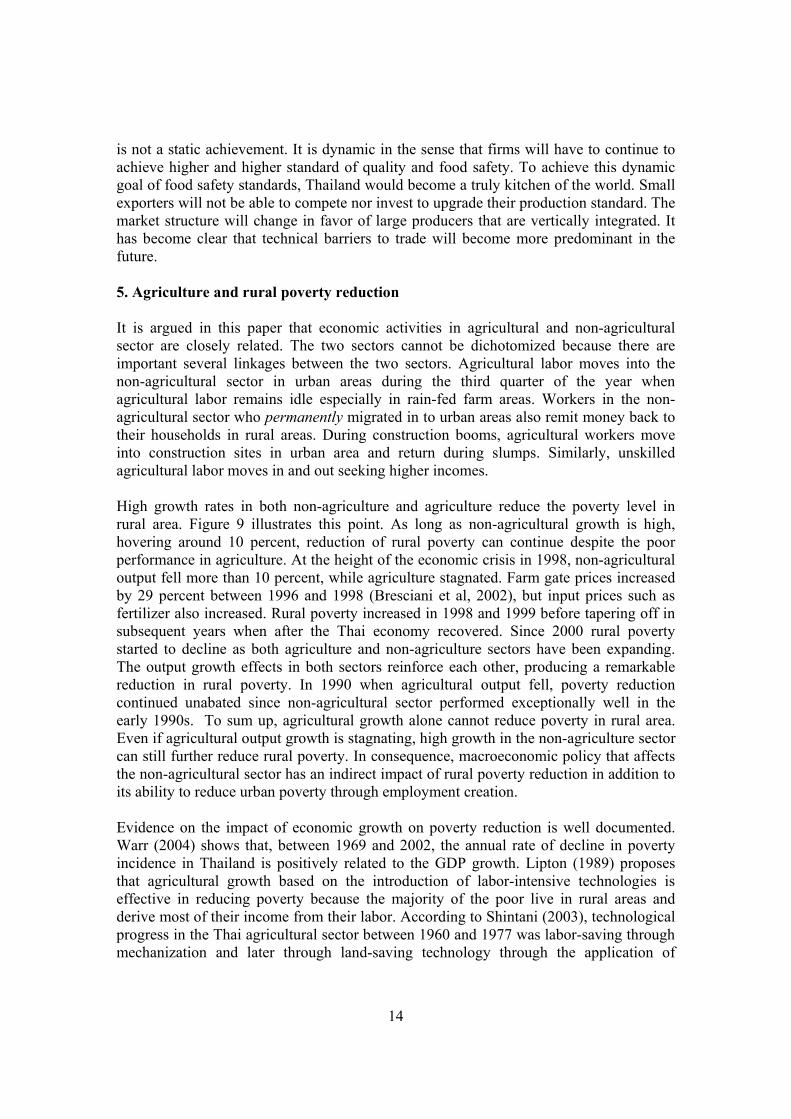
is not a static achievement. It is dynamic in the sense that firms will have to continue to achieve higher and higher standard of quality and food safety. To achieve this dynamic goal of food safety standards, Thailand would become a truly kitchen of the world. Small exporters will not be able to compete nor invest to upgrade their production standard. The market structure will change in favor of large producers that are vertically integrated. It has become clear that technical barriers to trade will become more predominant in the future. 5. Agriculture and rural poverty reduction It is argued in this paper that economic activities in agricultural and non-agricultural sector are closely related. The two sectors cannot be dichotomized because there are important several linkages between the two sectors. Agricultural labor moves into the non-agricultural sector in urban areas during the third quarter of the year when agricultural labor remains idle especially in rain-fed farm areas. Workers in the non-agricultural sector who permanently migrated in to urban areas also remit money back to their households in rural areas. During construction booms, agricultural workers move into construction sites in urban area and return during slumps. Similarly, unskilled agricultural labor moves in and out seeking higher incomes. High growth rates in both non-agriculture and agriculture reduce the poverty level in rural area. Figure 9 illustrates this point. As long as non-agricultural growth is high, hovering around 10 percent, reduction of rural poverty can continue despite the poor performance in agriculture. At the height of the economic crisis in 1998, non-agricultural output fell more than 10 percent, while agriculture stagnated. Farm gate prices increased by 29 percent between 1996 and 1998 (Bresciani et al, 2002), but input prices such as fertilizer also increased. Rural poverty increased in 1998 and 1999 before tapering off in subsequent years when after the Thai economy recovered. Since 2000 rural poverty started to decline as both agriculture and non-agriculture sectors have been expanding. The output growth effects in both sectors reinforce each other, producing a remarkable reduction in rural poverty. In 1990 when agricultural output fell, poverty reduction continued unabated since non-agricultural sector performed exceptionally well in the early 1990s. To sum up, agricultural growth alone cannot reduce poverty in rural area. Even if agricultural output growth is stagnating, high growth in the non-agriculture sector can still further reduce rural poverty. In consequence, macroeconomic policy that affects the non-agricultural sector has an indirect impact of rural poverty reduction in addition to its ability to reduce urban poverty through employment creation. Evidence on the impact of economic growth on poverty reduction is well documented. Warr (2004) shows that, between 1969 and 2002, the annual rate of decline in poverty incidence in Thailand is positively related to the GDP growth. Lipton (1989) proposes that agricultural growth based on the introduction of labor-intensive technologies is effective in reducing poverty because the majority of the poor live in rural areas and derive most of their income from their labor. According to Shintani (2003), technological progress in the Thai agricultural sector between 1960 and 1977 was labor-saving through mechanization and later through land-saving technology through the application of
15
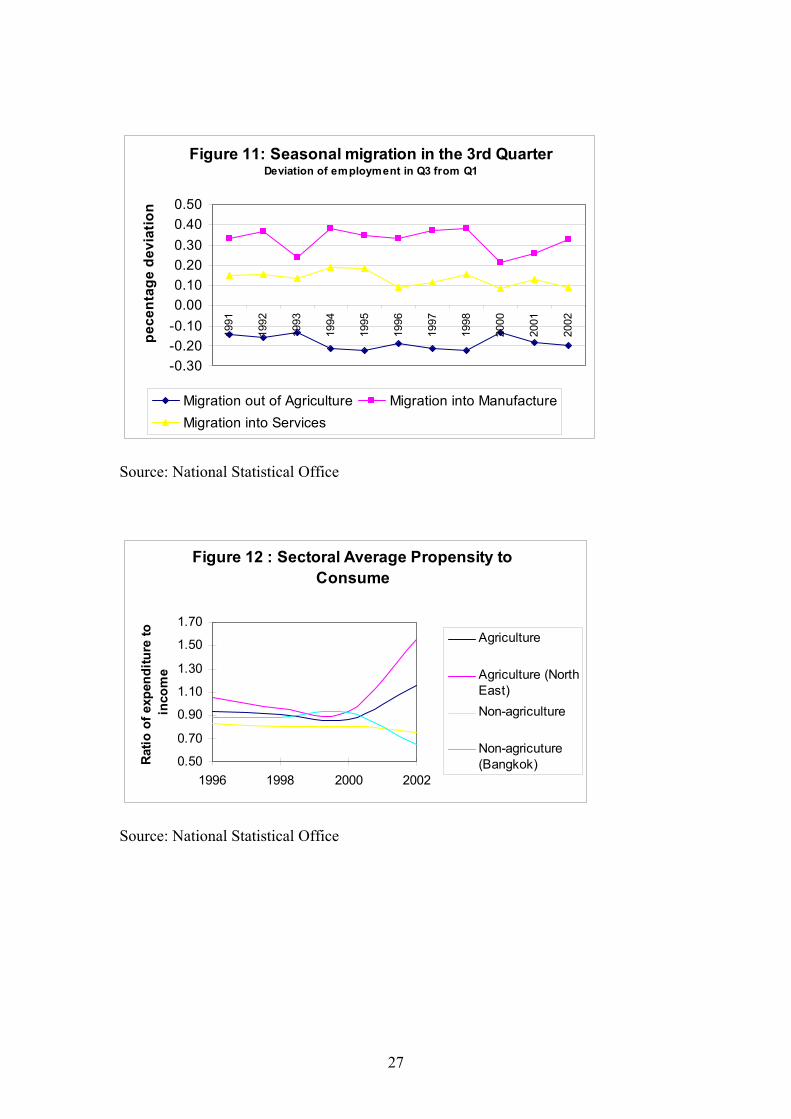
fertilizer. Yet the poverty in rural area still declined continuously despite the labor-saving technology applied, except during the crisis year of 1998 and its aftermath in 1999. The rural poverty rose from 14.9 percent in 1996 to 17.3 in 1998. It peaked in 1999 at 21.5 percent before petering out gradually as the economy slowly regained its solid recovery. In 2002, both urban and rural poverty declined to 4 and 12.6 percent respectively. Agricultural productivity can be measured by agricultural value added per agriculture worker. In 2003, Thailand’s relative size of the agricultural sector was at the same as the level in Chile, Ecuador, Malaysia, and Uruguay at 9 percent of GDP (World Development Report 2005). Thailand’s agricultural productivity managed to increase only 12.4 percent between the period 1988-90 and the period 2000-2002. Other countries mentioned above were able to achieve higher productivity growth than Thailand, except for Ecuador which suffered a 30 percent decline. Both Chile and Uruguay raised their agricultural productivity by 28 and 19 percent respectively during the same corresponding periods. Malaysia surpassed Thailand with a 21 percent agricultural productivity growth. At the other extreme cases: the Philippines, with 14 percent of agricultural output in GDP, raised agricultural productivity by only 7.6 percent. During the same period, Japan whose share of agriculture in GDP is only one percent managed to increase agricultural productivity by 30 percent. Problems remain with low productivity in Thai agriculture. After 1996 the share of labor in the agricultural sector did not decline as fast as in the previous decade (Figure 10). The manufacturing sector cannot absorb labor as much as it should have due to its high capital-labor ratio. The service sector was mainly responsible for taking in surplus labor from the agricultural sector. The decline in output in the manufacturing sector in 1997 and 1998 led to a rebound in employment share in agriculture, which is consistent with the contemporaneous rise in rural poverty (Figure 9). In other words, in order to accelerate the reduction of rural poverty, the agricultural sector must be able to raise its productivity as fast as possible in order to release its labor to the non-agricultural sector. With continued permanent inflows of labor into the non-agricultural sector, the wage pressure will not be high enough to create incentive to adopt capital-intensive technology. The migration rate in Thailand is low relative to other developing countries with the consequence of persistent intersectoral income differences (Butzer et al., 2003). Nevertheless the rate of migration is responsive to income gaps between sectors and the absorbing capacity of non agriculture. During harvesting seasons, there is a sudden temporary increase in the demand for labor otherwise ripe crops can be damaged because of the delay. As shown in Figure 11, a consistent pattern of seasonal migration can be observed. There is less demand for labor in the farm in the third quarter. Agricultural labor moves to manufacture and services sectors. During the first quarter, these workers temporary move back to farms. There might be as much as twenty percent of existing agricultural work force that move backward and forward during the peak of farm labor demand. Non-agricultural sector is very much connected to the agricultural sector through the intersectoral flows of labor. High wages in non-agricultural sector attract labor migration.
16
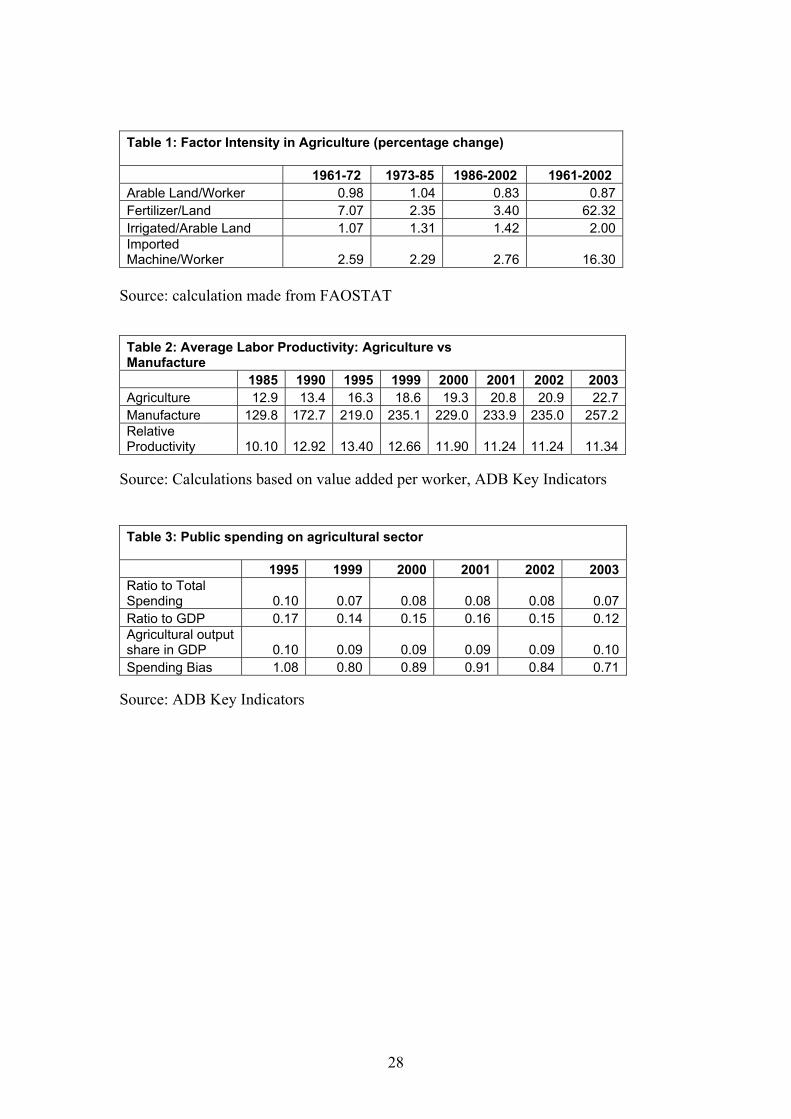
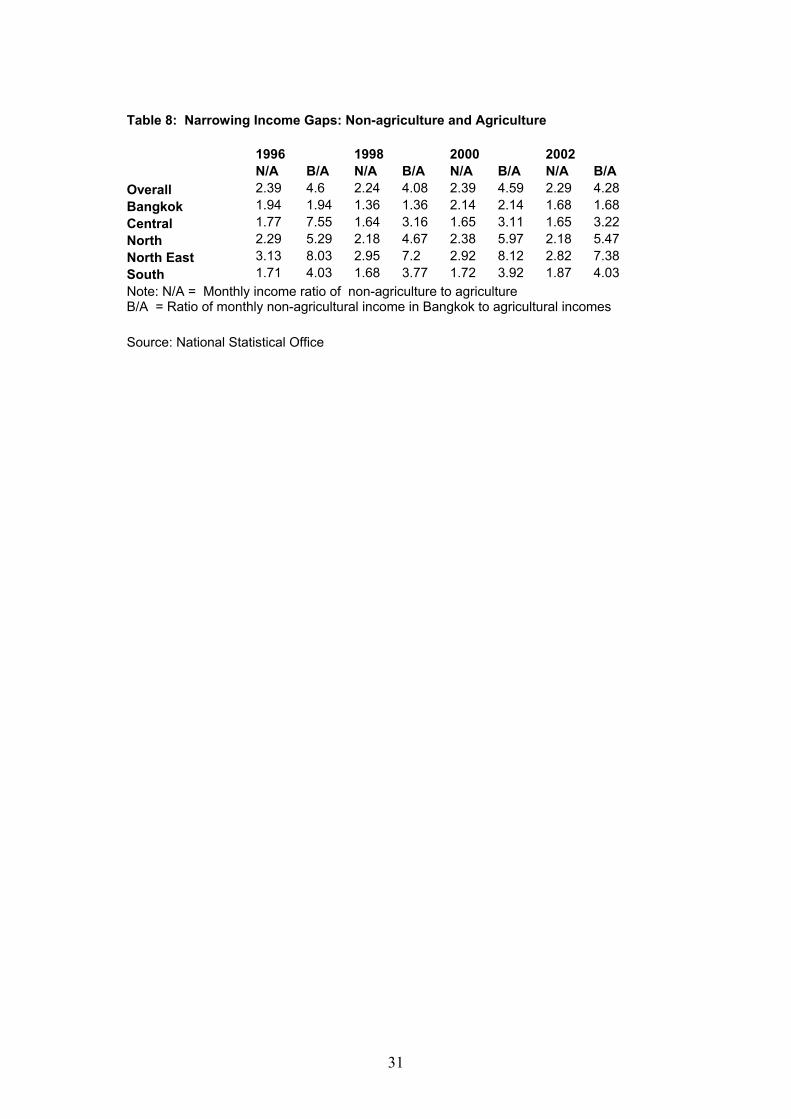
During the recession in 1998, many workers returned to their villages and engaged in farming and non-farm activities. Thus the agricultural sector help the modern sector by taking the strain off the capacity of the urban economy to absorb displaced workers, while putting additional pressure on the rural economy (Manning, 2002). Therefore, rural poverty surged during the economic crisis. There has been a considerable change in income-consumption pattern in rural areas. Figure 12 illustrates the impact on consumption of the relaxation of liquidity constraints of poor households in the agricultural sector. The phenomenon of excess sensitivity can be observed by the rise in the average propensity to consume in agricultural areas. Agricultural households’ expenditures exceeded income levels in 2000. When households’ liquidity constraints were relaxed, a slight increase in income level would lead to a greater percentage change in consumption. Liquidity-constrained households started spending excessively through borrowing. This was made possible by various government programs spent on grassroots economies: village funds, rural debt suspension, and one-village-one product programs. Farmers, especially those in the Northeast, responded to such programs by spending more than the earned by accumulating household debts. The sharp contrast in consumption-income relationship between non-agriculture and agriculture can be seen in Figure 12. Non-agriculture households in Bangkok tend to save more as their income rose above the pre-shock growth level, while non-agriculture households in other parts of the countries followed the same pattern but at a moderate degree. From 1996 to 2002, there has been a declining trend in income differentials between non-agriculture and agriculture (Table 8). The year 1998 witnessed a narrower gap due to the recession in urban sectors in various parts of the country. The ratio of monthly income of non-agriculture to agriculture declined from the 1996 level in all regions. But as the economy recovered, the ratios edged up in 2000 in all regions except the Northeast—the poorest region in the country. Nevertheless the declining trend continues, thanks to migration from agriculture. If Bangkok’s non-agricultural income is taken as a benchmark, income in the urban sector was 4.6 times the overall agricultural income. The excessive income gaps also declined. A remarkable reduction in the gap occurred between the central region and Bangkok, while Northeast’s agricultural sector remained a laggard in 2002. The foregoing analysis points out that with the current rate of agriculture productivity growth, income disparities between agriculture and non-agriculture are still large. Migration alone cannot be relied on very much to narrow the income gaps. Productivity in agriculture must take a quantum jump to boost rural income and release labor to non-agricultural sectors to speed up the convergence of income levels. The role of public spending in research and development is called for to improve agriculture productivity. Empirical evidence in India suggests that investment in agricultural research can reduce rural poverty (Fan et al., 2000).10 The Thai government has yet to put on emphasis on agricultural research that would indirectly reduce rural poverty.
17
6. Concluding remarks Although the Thai agricultural sector has performed well in the past, its productivity growth is moderate. As a result, there is a substantial income gap between manufacture and agriculture. Contrary to the general view on productivity in agriculture literature, Thailand’s productivity in the agriculture grows at a slower pace than the manufacture. Free trade agreements would enable Thai farmers to reap the benefit of cheaper imported fertilizers and machinery. Those are important factors in farm production when land expansion is currently limited. Unless there is a substantial improvement in the agricultural productivity, the majority of labor force would still remain in the rural sector11. The problems of labor shortages and high wage rates in the urban areas would hamper Thailand’s export competitiveness in agriculture. Exports of agricultural products are the key for the survival of the sector. Agricultural sector must be linked to processed food industry to add more value added and create linkages between rural and urban sectors. Large processed food exports firms have continued upgrading their quality and food-safety standards. Only firms that have dynamic schemes of quality improving can survive in the new round of competition in the world markets. The emerging new regionalism with proliferation of free trade agreements would involve agriculture. In the end, the protection wall of agriculture will slowly be dismantled. Negotiations of free trade agreements between Thailand and other developed countries must make sure that agricultural products are included. Johnson (1991) observed that agricultural products are usually overvalued in developed countries and undervalued in developing countries. If the free trade agreements between Thailand and other developed countries exclude agricultural commodities, we cannot deny what Johnson described in the early 1990s about disarray in world agriculture. In addition, the issues of non-tariff barriers such as food safety standard must be fully addressed so that the tariff reduction is not simply substituted by protective technicalities in the name of food safety standards. Although Thai farmers cannot compete with cheap imported onions and garlic from China, Thailand has tremendously increased exports of tropical fruits to China. If Thailand really wants to increase agricultural productivity, farmers must welcome new challenges and opportunities. Farmers have to be resilient to changing market conditions and adjust their cropping pattern accordingly. GMO technology can change traditional agricultural production system. In the end Thailand cannot delay the inevitable. Supply of agricultural products would increase tremendously and produce disequilibrium in agricultural markets in the future. Any restraints to the adoption of new biotechnology in agriculture would only make the future adjustment become painful and costly. The role of government is crucial in providing investment in infrastructure and agricultural research to make sure that farm productivity can be enhanced continuously. The government must make sure that farm inputs are available without price distortions. Agricultural credit, an important factor input, has been successfully provided by the Bank of Agriculture and Agricultural Cooperatives. The current support of the rural sector has
18
gone too far by injecting money to rural areas without considering the basic benefit-cost principle and the concern over alternative uses of limited financial resources. Intervention should not go beyond the point that the government has already done by guaranteeing prices of rice and rubber. As experiences in Japan and Taiwan indicate, the decline in agriculture’s terms of trade induced resources flows and encouraged industrial development (Hondai, 1985), but there must be continuous technological change in agriculture to offset the terms of trade that continuously move against agriculture. When productivity in agriculture increases, it would allow labor to shift to non-agriculture rapidly without having to distort the terms of trade in favor to agriculture. Policies generating growth in the agricultural sector may not be enough to reduce rural poverty. They must be accompanied by expansion of the non-agricultural sector. Both agricultural and non-agricultural sectors are interrelated through migration and financial resource flows via income transfer and deposit-lending activities of the banking sector. Strong growth in the non-agricultural sector can effectively reduce rural poverty despite stagnation in the agricultural sector. Although the income gaps between agriculture and non-agriculture tend to decline, the convergence process will take a long time. Enhancing agricultural productivity can indirectly reduce income inequality more effectively than relying on natural process of labor migration. Dynamism of the Thai agriculture and its survival depend primarily on continued productivity improvement.
19
REFERENCES Barbier, Edward B. (2004) Agricultural Expansion, Resource Booms and Growth in Latin America: Implications for long-run economic development, World Development, Vol. 32, no.1, 137-157. Bresciani, Fabrizio, Gershon Feder, Daniel O. Gilligan, Hanan G. Jacoby, Tonroj Onchan, Hamie Quizon (2002) “Weathering the storm: The impact of East Asian Crisis on Farm Households in Indonesia and Thailand” The World Bank Research Observer, Vol. 17. 1-20. Burns, Anthony (2004) “Thailand’s 20 years program to title rural land” Background paper for the World Development Report 2005. Butzer, Rita, Yair Mundlak and Donald F. Larson (2003) “Intersectoral Migration in Southeast Asia: Evidence from Indonesia, Thailand, and the Philippines” World Bank Policy Research Working Paper 2949, January. Coxhead, Ian and Jiraporn Plangprapha (1999) “Economic boom, financial burst, and the decline of Thai agriculture: Was growth in the 1990s too fast?” Chulalongkorn Journal of Economics, Vol. 11, January. Fan, S. Hazell P., Thorat S. (2000) “Government spending, agricultural growth and poverty in rural India” American Journal of Agricultural Economics, Vol. 82(4) Fan, Shenggen Fan, Chen Fang, and Xiaobo Zhang (2003) “Agricultural research and urban poverty: The case of China, World Development, Vol. 31, (4), 733-741. Hondai, Susumu (1985) “Changes in Intersectoral terms of trade and their effects on labor transfer” in Japan and the Developing Countries, Kzzushi Ohkawa and Gustav Ranis (eds.), Oxford: Basil Blackwell Johnson, F. Gale (1991) World Agriculture in Disarray, London: Macmillan. Johnson, F. Gale (1997) “Agriculture and the Wealth of Nations” American Economic Review, Vol. 87 (2), 1-12. Lipton, Michael (1989) Why poor people stay poor? Urban bias in world development, London: Temple Smith Manning, Chris (2002) “Lessons from Labor Adjustment to the East Asian Crisis: The case of South Korea, Thailand, and Indonesia” East Asian Economic Perspectives, Vol. 13, March, 62-96.
20
Martin, Will and Devashish Mitra (2001) “Productivity growth and convergence in agriculture versus manufacturing” Economic Development and Cultural Change, Vol. 49(2), 403-22. Nidhiprabha, Bhanupong and Chalermpol Chamchan (2005) “SPS and Thailand Exports of Processed Food” in Food Safety Regulation Concerns and Trade, Rajesh Metha and J. George (eds.), Delhi: Macmillan India. Siamwalla, Ammar (1996) “Thai Agriculture: From engine of growth to sunset status” TDRI Quarterly Review, Vol. 11, no. 4, December, 3-10. Shintani, Masahiko (2003) The Process of Agricultural Growth in Thailand, Fukuoka: Kyushu University Press Thirtle, Colin, Lin Lin, and Jenifer Piesse (2003) The Impact of Research-led agricultural productivity growth on poverty reduction in Africa, Asia, and Latin America, World Development, Vol. 31(12) 1959-1975. Warr, Peter G. (2004) “Globalization, growth, and poverty reduction in Thailand” ASEAN Economic Bulletin, Vol. 21 (1), April, 1-18, Yair Mundlak, Donald F. Larson and Rita Butzer (2002) Determinants of Agricultural Growth in Thailand, Indonesia, and the Philippines, The center for agricultural Research, Hebrew University of Jerusalem, Discussion paper no. 3.02.
Endnotes 1 Agricultural export share declined from the average of 54.3 percent during the period 1979-1981 to 24 percent during the period 1989-91. By 2002, agricultural exports declined further to 12.2 percent of total exports. 2 Siamwalla (1996) argued that agricultural technology in advance countries cannot be adopted by Thai farmers due to different physical and economic environment in Thailand. But technology in the Thai agriculture is neither backward nor static, because the government has spent adequate amount on agricultural research, while relying on the private sector to provide new technology. 3 Basically the variance of growth depends on the sum of variances from output and price fluctuations. 4 Values of imported machinery rather than number of machinery are employed due to the inaccurate statistics in recent years, although employment of agricultural machinery involves domestically produced machinery. 5 According to Johnson (1991), American agriculture has a capital-labor ratio that is six times the ratio in manufacturing. In other words, agriculture in developed countries are more capital intensive than developing countries.
21
6 Thirtle et al. (2003, p.1970) reports that agricultural R&D expenditures was only 3.3 dollar per ha in Thailand, while Malaysia spent almost 15 dollar in 1995. The R&D investment produced the rate of return at 23 and 9 percent respectively in both countries. 7 The chicken industry suffered a severe blow by the avian flu virus and it cost the industry more than 80 billion baht in 2004. 8 There are six million people involving in the rubber industry with 13.5 million rai of land. Thailand is the world’s largest producer of natural rubber, who exports value ranked fourth among the country’s exports in 2004. 9 See the background of the hypothesis in Nidhiprbaha and Chamchan (2005). 10 Fan et al. (2003) also found the evidence supporting the hypothesis that agricultural research has significant impact on reducing urban poverty, because the increased food production lowers food prices which benefit the urban poor because they spend more than 60% of their income on food. 11 Raising agricultural productivity is one of the government’s strategies to reduce rural poverty. It should be noted that both rural and urban poverty can be reduced by enhancing agricultural productivity.
22
Figure 1: Indicies of Percapita Agricultural Production
7595
115135155175195
1961
1964
1967
1970
1973
1976
1979
1982
1985
1988
1991
1994
1997
2000
2003
1961
=100
World Asia Industrialized Thailand
Source: FAOSTAT
Figure 2: Index of major crop yields
50
100
150200
250
300
350
1961
1964
1967
1970
1973
1976
1979
1982
1985
1988
1991
1994
1997
2000
2003
1961
=100
Rice Rubber Maize Cassava
Source: FAOSTAT
23
Figure 3: Indicators of Farm Productivity
0
0.2
0.4
0.6
0.8
119
61
1965
1969
1973
1977
1981
1985
1989
1993
1997
2001
Areable Land/Worker Irregated/Arable Land
Source: FAOSTAT
Figure 4: Factor Intensity in Farming
0
0.20.4
0.6
0.81
1.2
1961
1965
1969
1973
1977
1981
1985
1989
1993
1997
2001
Fertilizer/Land Imported Machine/Worker
Source: FAOSTAT
24
Figure 5: Trend of Agricultural Exports
020406080
100120140160180200
1961
1964
1967
1970
1973
1976
1979
1982
1985
1988
1991
1994
1997
2000
Index
ValuePriceQuantity
Source: FAOSTAT
Figure 6: Export Price Indexes in dollar
405060708090
100110120
1995
1996
1997
1998
1999
2000
2001
2002
2003
1995
=100
AgricultureFisheriesManufactureLabor IntensiveHigh-techResources
Source: Bank of Thailand
25
Figure 7: Depreciation and Agricultural Exports
0.00
50.00
100.00
150.00
200.00
250.00
300.00
1996 1997 1998 1999 2000 2001 2002 2003
1995
=100
Dollar Price Dollar value Baht Price Baht Value
Source: Bank of Thailand Source: Department of Agriculture, Department of Fisheries
Figure 8: Impacts of Nitrofurans and Avian Infulenza
0.0
10.0
20.0
30.0
40.0
50.0
60.0
70.0
1994
1996
1998
2000
2002
2004
Bill
ion
baht
Fresh and FrozenShrimp Canned Tuna
Frozen and ChilledChicken
26
Figure 9: Rural Poverty and Sectoral Growth
-15
-10
-5
0
5
10
15
2019
88
1990
1992
1994
1996
1998
1999
2000
2001
2002
0
5
10
15
20
25
30
35
40
45
Agriculture Non-agriculture Rural Poverty (Right Axis)
Source: ADB
Figure 10: Changing Employment Structure
0
1020
30
40
5060
70
1990
1992
1994
1996
1998
2001
2003
perc
ent o
f tot
al e
mpl
oym
ent
AgricultureManufactureService
Source: ADB
27
Figure 11: Seasonal migration in the 3rd QuarterDeviation of employment in Q3 from Q1
-0.30-0.20-0.100.000.100.200.300.400.50
1991
1992
1993
1994
1995
1996
1997
1998
2000
2001
2002
pece
ntag
e de
viat
ion
Migration out of Agriculture Migration into ManufactureMigration into Services
Source: National Statistical Office
Figure 12 : Sectoral Average Propensity to Consume
0.50
0.70
0.90
1.10
1.30
1.50
1.70
1996 1998 2000 2002
Rat
io o
f exp
endi
ture
to
inco
me
Agriculture
Agriculture (NorthEast)Non-agriculture
Non-agricuture(Bangkok)
Source: National Statistical Office
28
Table 1: Factor Intensity in Agriculture (percentage change) 1961-72 1973-85 1986-2002 1961-2002 Arable Land/Worker 0.98 1.04 0.83 0.87 Fertilizer/Land 7.07 2.35 3.40 62.32 Irrigated/Arable Land 1.07 1.31 1.42 2.00 Imported Machine/Worker 2.59 2.29 2.76 16.30
Source: calculation made from FAOSTAT
Source: Calculations based on value added per worker, ADB Key Indicators
Source: ADB Key Indicators
Table 2: Average Labor Productivity: Agriculture vs Manufacture 1985 1990 1995 1999 2000 2001 2002 2003 Agriculture 12.9 13.4 16.3 18.6 19.3 20.8 20.9 22.7 Manufacture 129.8 172.7 219.0 235.1 229.0 233.9 235.0 257.2 Relative Productivity 10.10 12.92 13.40 12.66 11.90 11.24 11.24 11.34
Table 3: Public spending on agricultural sector 1995 1999 2000 2001 2002 2003 Ratio to Total Spending 0.10 0.07 0.08 0.08 0.08 0.07 Ratio to GDP 0.17 0.14 0.15 0.16 0.15 0.12 Agricultural output share in GDP 0.10 0.09 0.09 0.09 0.09 0.10 Spending Bias 1.08 0.80 0.89 0.91 0.84 0.71
29
Table 4 Top 5 Agricultural Commodities by rank (value shares in total Thailand’s agricultural exports) 2002 2000 1990 Items Share Items Share Items ShareRubber Natural Dry 17.3 Milled Paddy Rice 20.3 Milled Paddy Rice 18.5 Milled Paddy Rice 17.1 Rubber Natural Dry 17.7 Rubber Natural Dry 16.2 Chicken Meat 6.5 Chicken Meat 5.4 Cassava Dried 14.7 Meat Canned chicken 5.2 Meat Canned Chicken 4.6 Sugar(centrifugal, Raw) 9 Sugar refined 4.6 Sugar(centrifugal, Raw) 4.6 Chicken Meat 5.5 Total share 50.7 52.6 63.9 1980 1970 1961 Items Share Items Share Items ShareMilled Paddy Rice 28.1 Milled Paddy Rice 24.3 Milled Paddy Rice 42.7 Cassava Dried 19.8 Rubber Natural Dry 21.7 Rubber Natural Dry 25.7 Rubber Natural Dry 18.1 Maize 18 Jute 7.5 Maize 10.5 Cassava Dried 9.8 Maize 7.3 Sugar(centrifugal, Raw) 4.3 Jute 6.9 Cassava Flour 5.2 Total Share 80.8 80.7 88.4
Source: Calculated from FAOSTAT
Source: FAOSTAT
Table 5: Thailand's agricultural export shares in world markets 1961 1970 1980 1990 2000 2002Rice 24 10.1 19 26.2 25.1 25.8Rubber 8.6 10.4 14.5 28.8 37.9 41.8Chicken Meat 0 0 1 4.4 3.8 4.6Sugar 0 0 1 5.2 7.2 8.8Canned Pineapple 0 2.2 20.2 40.4 41.1 43.4
30
Table 6: World Markets and Thailand’s Export (Growth Rates) 1961-1980 1981-2003 1961-2003 World Thailand World Thailand World Thailand Rice 9 8.6 3.8 3.2 5.8 7.1 Rubber 7.5 10.2 1.8 6.3 4.3 8.7 Chicken Meat* 13.7 80 8.6 12 10.6 16.8 Sugar 12.1 45.7 -0.22 5.1 4.8 19.2 Canned Pineapple** 9.4 49.7 2.4 4.8 5.3 15.2 Cassava Dry 31.4 42.2 -5.9 -5.5 10.4 12.3 Maize 15.4 13.8 0.34 -15.5 5.9 -2.7 Jute-fibers*** -1.8 -3.3 -3.8 -4 -2.8 -2.6 Source: FAOSTAT Notes: *beginning 1976 **beginning 1968 ***ending 1999
Table 7 Vegetables and fruit exports (percentage growth rate) World Thailand 1976-1989 1990-2003 1976-1989 1990-2003 Value Quantity Value Quantity Value Quantity Value Quantity Fresh Vegetable 3.8 3.7 8.6 3.6 8 -2.8 14 18.1 Prepared Vegetables 5.5 7.2 11 8.8 21.2 8.4 2.42 0.9 Frozen Vegetables 3.5 5 6.9 5.4 33.2 25.9 8.3 3.6 Vegetables in Vinegar 3.2 3.6 2.9 1.6 42.1 36.7 -4.4 -4.9 Fruit Preparedness 4.4 2 3.2 3.9 27 19.9 5.4 6.7
Pineapple 12.6 6.3 7.6 11.6 na na 20.9 22.7
Pineapple juice 16.8 9.8 4.1 1.6 26.1 22.3
2.2* 0*
Canned Pineapple 3.8 2.6 -0.4 0.6 12.8 12.1 -1.3 -0.7 Note: * shift to concentrate juice
Source: FAOSTAT
31
Table 8: Narrowing Income Gaps: Non-agriculture and Agriculture
1996 1998 2000 2002 N/A B/A N/A B/A N/A B/A N/A B/A Overall 2.39 4.6 2.24 4.08 2.39 4.59 2.29 4.28 Bangkok 1.94 1.94 1.36 1.36 2.14 2.14 1.68 1.68 Central 1.77 7.55 1.64 3.16 1.65 3.11 1.65 3.22 North 2.29 5.29 2.18 4.67 2.38 5.97 2.18 5.47 North East 3.13 8.03 2.95 7.2 2.92 8.12 2.82 7.38 South 1.71 4.03 1.68 3.77 1.72 3.92 1.87 4.03 Note: N/A = Monthly income ratio of non-agriculture to agriculture B/A = Ratio of monthly non-agricultural income in Bangkok to agricultural incomes
Source: National Statistical Office
Top Related