


Languages
Pages
Legal

1
Dynamic recrystallization during high-strain-rate tension of copper
N. Mortazavia*, N. Bonorab, A. Ruggierob and M. Hörnqvist Colliandera
aDepartment of Physics, Chalmers University of Technology, Gothenburg, Sweden
bCivil and Mechanical Engineering, University of Cassino and Southern Lazio, Cassino, Italy
*Corresponding author: [email protected]
Abstract: Discontinuous dynamic recrystallization can occur during dynamic tensile extrusion of
copper, which is subjected to uniaxial tensile strains of ~5 and strain rates up to 106 s–1 in the
extruded section. Through high-resolution transmission Kikuchi diffraction we show that
nucleation occurs through subgrain rotation and grain boundary bulging at boundaries between
á001ñ and á111ñ oriented grains. The observed nuclei consist of subgrains with a size of
approximately 200–400 nm.
Keywords:
The term recrystallization refers to a process where a deformed microstructure is replaced by new
defect-free grains in order to decrease the stored energy from plastic deformation. When
recrystallization occurs during ongoing deformation it is referred to as dynamic recrystallization
(DRX), which is an important phenomenon in many metal working processes, such as hot rolling,
extrusion and forging, as well as during creep deformation [1]. DRX can occur in a continuous or
discontinuous fashion, depending on the material and deformation mode. The continuous process
involves rotation of subgrains, which occurs simultaneously in the entire microstructure, whereas
discontinuous DRX involves an inhomogeneous nucleation step followed by growth of the
recrystallized grains by high angle grain boundary (HAGB) migration [1]. Moreover, continuous
DRX is favored by a low stacking fault energy (SFE) due to the easier cross-slip and recovery,
whereas a high SFE typically results in a discontinuous process.
DRX can also occur under high-strain-rate conditions, typically for combinations of shear strains
2
exceeding around 3, shear strain rates above 104 s−1 and homologous temperatures above
approximately 0.4–0.5Tm [2]. For practical reasons, dynamic testing is usually performed in shear
[3–6] or shear-compression [7]. Under such loading conditions DRX occurs locally through a
mechanism similar to the continuous process described above, involving the formation of
elongated subgrains or bands, which break up into an equiaxed structure by local rotation of
subgrain walls [3]. This takes place also in high SFE materials such as copper, due to the
localization of the plastic deformation into shear bands resulting from the adiabatic heating
and/or geometrical constraints [3]. Through the introduction of a new test method, called
dynamic tensile extrusion (DTE), very high strains and strain rates can be now achieved in
uniaxial tension [8]. Recently, it has been shown that DRX in oxygen-free high conductivity
(OFHC) copper could be obtained in the uniaxially extruded section of a DTE tested specimen
[9], where tensile strains in the order of 5 were reached in combination with strain rates of around
106 s−1 and quasi-adiabatic heating to temperatures exceeding 0.75Tm. Although grain growth
primarily occurred during post-test cooling of the specimen in the die, the nucleation was
suggested to occur during deformation since the kinetics of static recrystallization is too slow.
The occurrence of DRX could potentially suppress necking and thus be expected to increase the
achievable jet elongation [10]. On the other hand, Rittel et al. [7, 11, 12] have suggested that
DRX can lead to strain localization into shear bands, which in turn could initiate premature
failure. As localized shear bands has previously been observed in fragments of DTE tested copper
[8], although the relation to ductility was not further investigated, the occurrence of shear
localization under dynamic (nominally) tensile deformation cannot be neglected. Consequently,
there is great interest in understanding DRX under dynamic tensile loading in order to develop
accurate predictive models for its onset, and subsequent effect on the deformation.
In the present paper we investigate the possible DRX mechanism during DTE of OFHC copper
with random starting texture through electron backscatter diffraction (EBSD) and high-resolution
orientation mapping by means of transmission Kikuchi diffraction (TKD). TKD, implemented in
a field emission gun scanning electron microscope (FEG-SEM) is capable of improving the
spatial resolution of the EBSD technique to around 2–5 nm [13], allowing orientation mapping on
an extremely fine scale. The DTE test method and gas gun system used is described elsewhere [9,
14], and details of the EBSD, TKD and transmission electron microscopy (TEM) parameters, as
well as specimen preparation are provided in [9, 15].
3
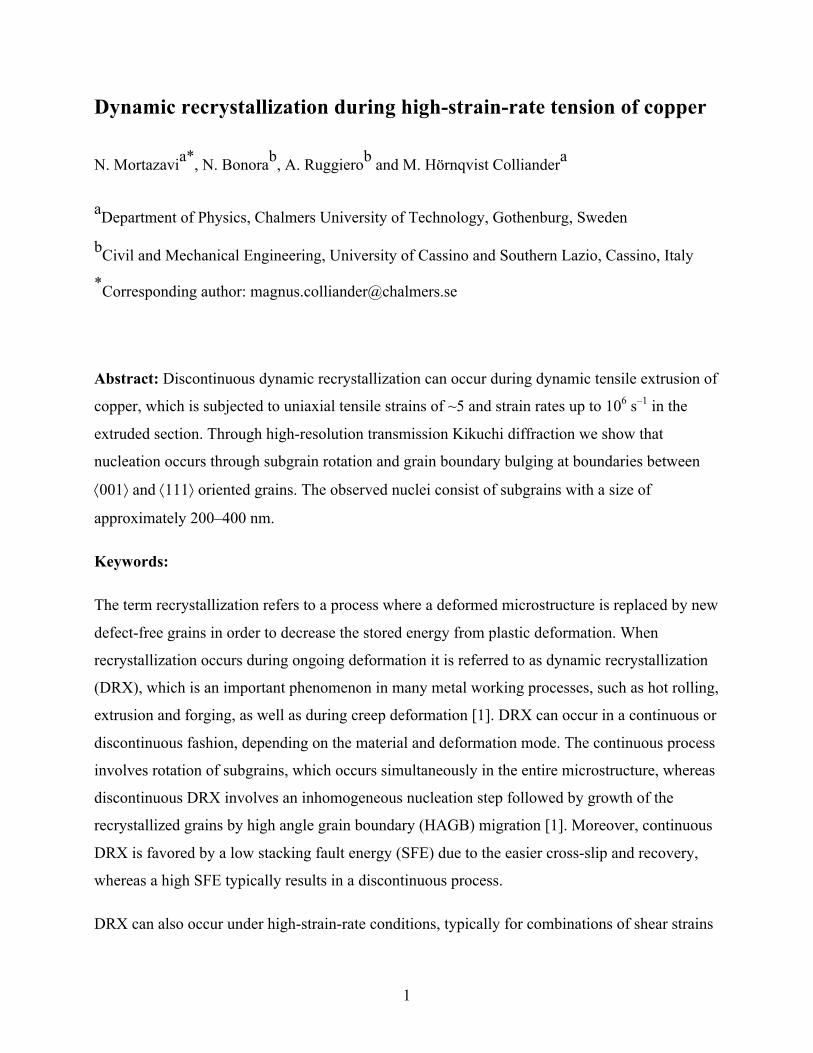
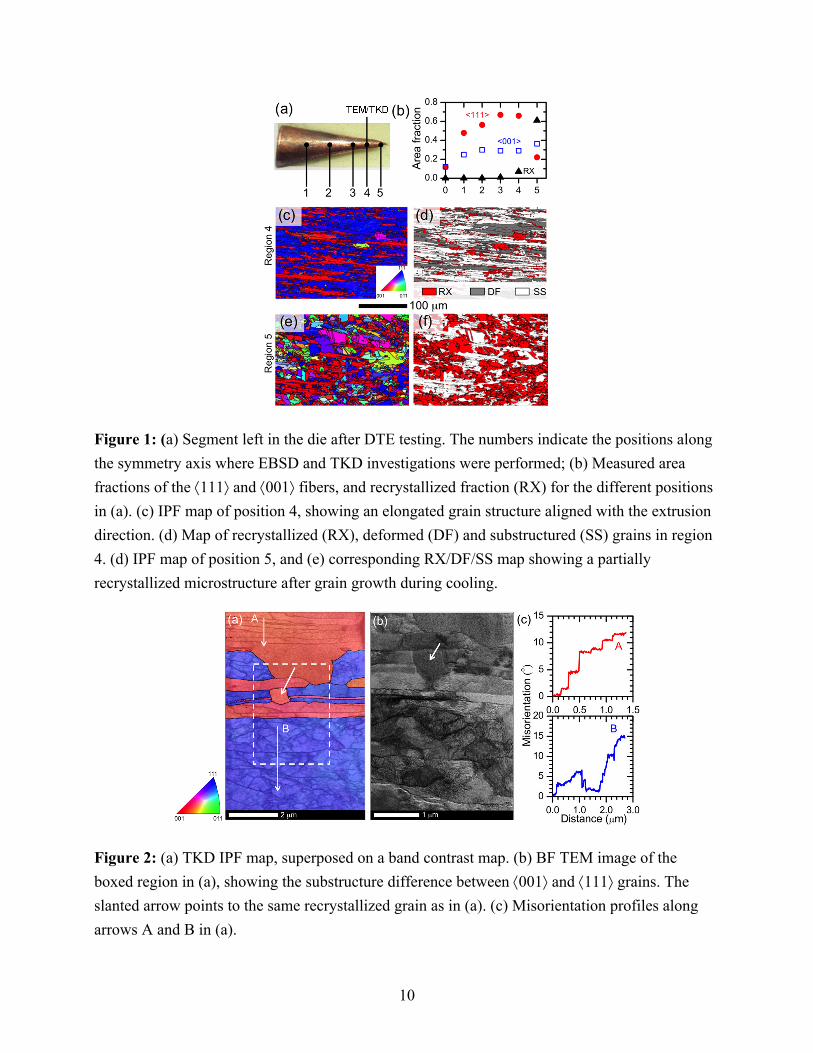
Figure 1(a) shows the segment left in the die after DTE testing at 400 m s−1. Material points along
the symmetry axis of the part of the specimen left in the die after testing are representative of
different instances along a common deformation history [9], and therefore the investigation was
focused on such points in order to follow the microstructure evolution with progressive degree
deformation, see Fig. 1(a).
The development of a dual á111ñ+á001ñ fiber texture with increasing strain is shown in Fig. 1(b),
which also includes the development of the measured recrystallized fraction (RX). From the
inverse pole figure (IPF) map in Fig. 1(c), corresponding to region 4, individual recrystallized
grains with different orientations can be seen among the elongated grains with fiber texture. The
RX fraction was measured to around 7 % in this region, see Fig. 1(d) where the recrystallized
(RX), deformed (DF) and substructured (SS) grains are identified. In region 5 the recrystallized
fraction, around 60 %, dominates the microstructure, and it is clear that the recrystallization
texture is very different from that developed during deformation, see Fig. 1(e) and (f)).
The EBSD maps in Fig. 1 indicate the operation of a discontinuous recrystallization process. In
order to further study the early stages of DRX, specimens for TEM/TKD were extracted from
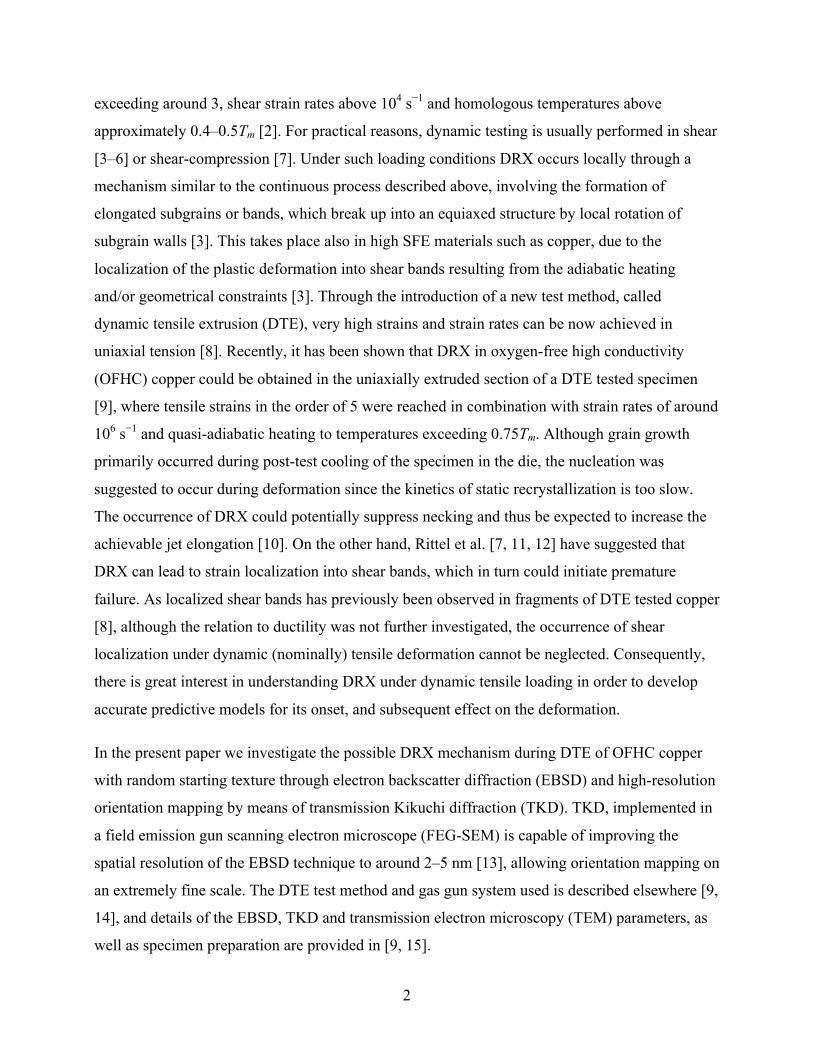
region 4. Figure 2(a) shows an example of such a TKD investigation, with the orientation map
superimposed on the band contrast. From the band contrast, the deformation substructures can be
clearly identified, and a distinct difference between the á001ñ (red) and á111ñ grains (blue) can be
seen. The á001ñ grains contain elongated microbands, around 200–300 nm wide and several µm
long, parallel to the tensile axis. In contrast, a more equiaxed cell substructure is observed in the
á111ñ oriented regions, with cell sizes up to around 1 µm. This was also verified by TEM, as
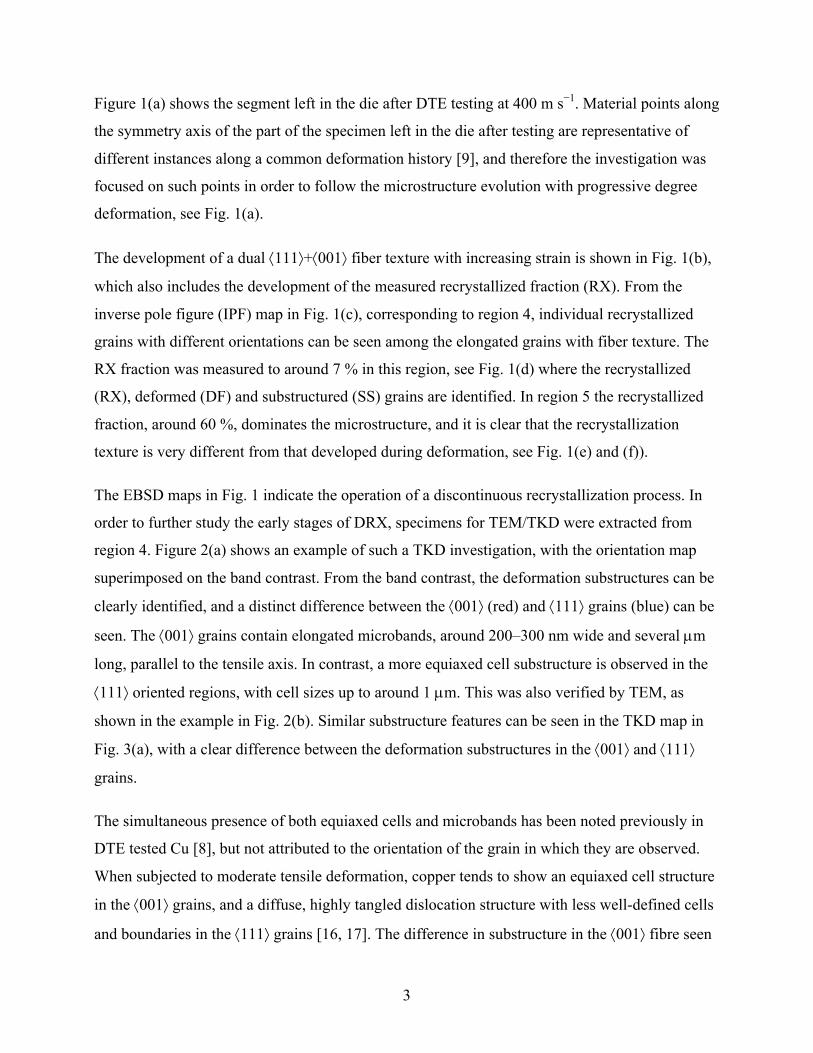
shown in the example in Fig. 2(b). Similar substructure features can be seen in the TKD map in
Fig. 3(a), with a clear difference between the deformation substructures in the á001ñ and á111ñ
grains.
The simultaneous presence of both equiaxed cells and microbands has been noted previously in
DTE tested Cu [8], but not attributed to the orientation of the grain in which they are observed.
When subjected to moderate tensile deformation, copper tends to show an equiaxed cell structure
in the á001ñ grains, and a diffuse, highly tangled dislocation structure with less well-defined cells
and boundaries in the á111ñ grains [16, 17]. The difference in substructure in the á001ñ fibre seen
4
here, compared to the literature, could be related to the degree of deformation of the material,
where a more severe deformation could convert the equiaxed structure of the á001ñ grains to
elongated cells or microbands. This is supported by the observation of elongated cells in the cube
oriented grains of pure copper after rolling to an equivalent von Mises strain of 0.78 [17], which
could be an intermediate stage in the conversion from cell structure to microbands.
Misorientation along the white arrows marked A and B in Fig. 2(a) are shown in Fig. 2(c). The
elongated subgrains in the á001ñ region have a low internal misorientation (low density of
dislocations), and sharp subgrain boundaries with a misorientation of around 1–3°. In contrast,
the equiaxed substructure in the á111ñ region is much more diffuse. Similar results are seen when
comparing the misorientations along arrows A and B in Fig. 3(a), see first panel in Fig. 3(b).
These results are consistent with previous results from TEM studies [16, 18], EBSD pattern
quality analysis [19] and neutron diffraction [16, 20], which have also shown a higher dislocation
density in á111ñ oriented grains in drawn copper and aluminum wires. Comparison of the pattern
quality for the fibers in the present case show similar results, with significantly higher quality for
the á001ñ fiber, consistent with a lower dislocation density. Calculations based on neutron
diffraction data typically show that the stored energy in the deformed á111ñ fiber is around twice
that of the á001ñ component in copper [16, 20].
Figure 3(c) is a close-up of the region in Fig. 3(a) indicated by a box, and shows the deviation
from the ideal á001ñ and á111ñ orientations (the scale is limited to a deviation of less than 20°
from ideal, in order to reveal the details). A number of distinct subgrains with larger deviation
can be seen in both á001ñ and á111ñ regions, primarily along the grain boundary. The occurrence
of more equiaxed subgrains in the grain boundary region of the á001ñ grains, which otherwise
consist of microbands, can be explained by the occurrence of multiple slip in order to maintain
strain compatibility with the adjacent grain. The misorientations along arrows C and D in the
á001ñ subgrains are shown in Fig. 3(b). The grain at arrow D has already (partially) formed a high
angle boundary with misorientation above 10° to the parent grain. Similarly, distinct subgrains
with large deviations can be seen in the á111ñ grains, see arrows E and F in Fig. 3(b) and (c). The
misorientation gradients inside the subgrains in the á111ñ grain are considerably smaller than
outside, indicating a low internal dislocation density, compared to the tangled cells in the
surrounding.

5
The observed distinctly misoriented subgrains in Fig. 3(b), both á001ñ and á111ñ oriented, show
signs of bulging into the adjacent grain. This suggests that they could act as nuclei for
recrystallization through the Bailey-Hirsch mechanism [21], consistent with our previous
suggestion [9]. According to this model, subgrains adjacent to a HAGB can rotate to a favorable
orientation and consume the adjacent deformed grain, driven by the difference in dislocation
density Dr. The critical diameter for a subgrain bulging, dc, can be calculated as dc = 8s/µrb2
[21], where s is the grain boundary energy, b is the magnitude of the Burgers vector and µ is the
shear modulus. The dislocation density in severely deformed copper have been measured to
1.5´1015–3´1016 m−2 at large strains [22, 23], and it could be assumed that similar levels would
be achieved during DTE. Assuming Dr=5´1015−1´1016 m−2, the critical diameter is estimated to
around 200–400 nm at homologous temperatures around 0.5. This is very close to the size of the
subgrains observed in Fig. 3(c). The subsequent growth of such nuclei during deformation and
post-test cooling can be estimated by integrating of the grain boundary migration velocity over
the temperature history, T(t), from finite element simulation of the DTE process [9] according to
d(t) = dc +βδΩmD0,GBΔρ
Rµ(T (t))T (t)
exp −QGB
RT (t)⎧⎨⎩
⎫⎬⎭dt
t=0
t
∫ (1)
where b is the effective fraction of the Turnbull estimate of the grain boundary mobility [24], d
is the grain boundary width, W m is the atomic volume and D0,GB and QGB are the pre-exponential
and activation energy, respectively, for grain boundary diffusivity, µ is the shear modulus and R
is the gas constant. By including both heat generation during deformation and post-test cooling in
the die (assuming perfect contact between specimen and die, and accounting for convection,
radiation and conduction), a conservative estimate of the final grain size in region 5 is in the
order of 10–25 µm, depending on the size of the nucleus, as shown in Fig. 4. Clearly, very
limited growth occurs during on-going deformation. Rather, the grain growth occurs during the
post-deformation cooling phase. Although it is not possible to resolve from the present analysis,
the hypothesis is that the nucleation process, in terms of the formation of the equiaxed subgrains
in the á001ñ grains, is a result of the increasing compatibility strains at the grain boundaries
during deformation. The nucleation (subgrain formation) can therefore be considered as a result
of dynamic recrystallization, even if the subsequent grain growth occurs during static conditions.
6
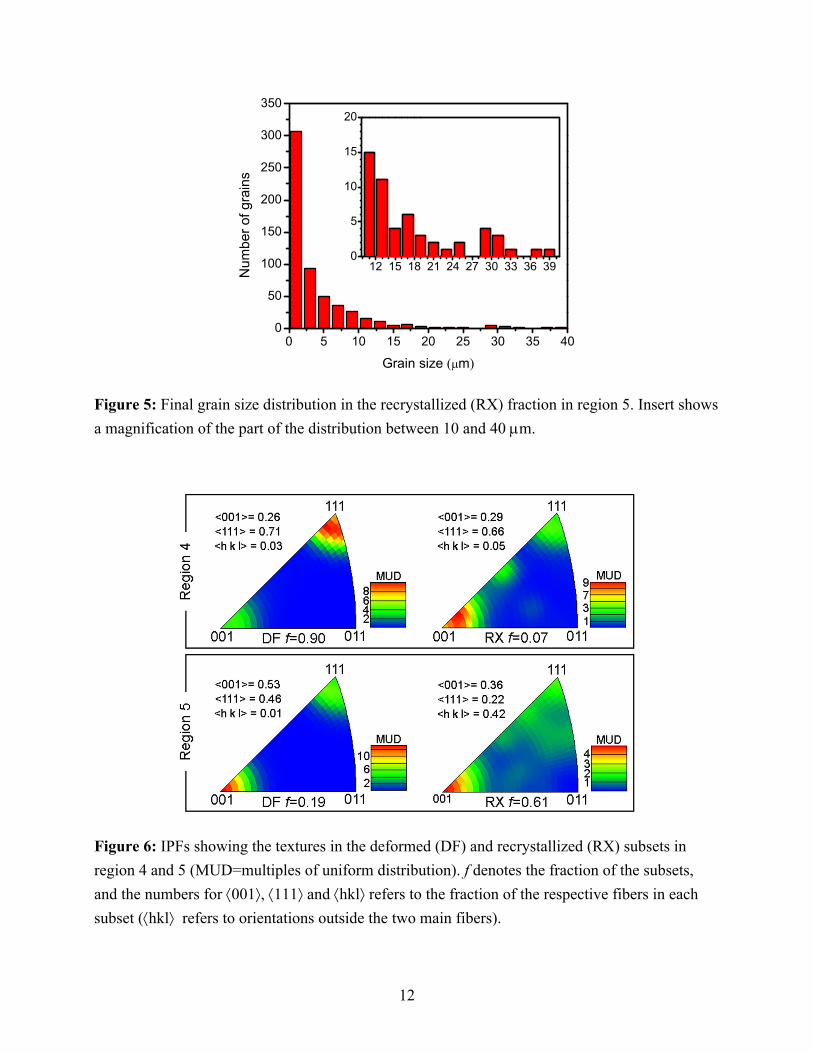
Experimental observations in region 5 show that the large recrystallized grains are in the order of
10–40 µm, see Fig. 5, which is in good agreement with the grain growth model given the
uncertainties in the model parameters and boundary conditions. Here the temperature dependence
of the shear modulus and grain boundary diffusivity were considered, whereas the effect of
temperature on the atomic volume was neglected. No pressure induced effects on the parameters
were considered. For more information on the finite element simulations and grain growth model,
including model parameters, see [9].
Although the distinct subgrains presumably acting as DRX nucleation sites are seen in both á001ñ
and á111ñ grains, the change in relative texture strength in Fig. 1(b) indicates that the á111ñ fiber
is preferentially replaced during subsequent grain growth. This is more clearly seen from the IPFs
for the different subsets (Fig. 6), which show that the deformed grains in region 4 are dominated
by the á111ñ fiber, whereas the RX subset mainly consists of á001ñ oriented grains. However, in
region 5 both DF and RX subsets have a clear á001ñ dominance, and diffuse weak components.
By calculating the fiber volumes (see Fig. 6), it can be shown that also the á001ñ grains in the DF
subsets are replaced during recrystallization. This is similar to the course of events suggested to
occur during static recrystallization of drawn copper wire [25, 26]. Contrary to observations in
aluminum [18], the subgrains in the á111ñ grain are of similar size as those in á001ñ, ruling out the
size advantage of the recrystallized nuclei as a reason for á001ñ predominance during DRX.
Another explanation for the á001ñ dominated recrystallization texture in copper is based on the
strain-energy release maximization model [27], where it is energetically favorable to replace
deformed grains, both with á001ñ and á111ñ orientation, with á001ñ grains as a results of the
anisotropic elasticity of copper crystals. Baudin et al. [19], on the other hand, explained the
recrystallization texture by the higher driving force for migration of á001ñ boundaries due to the
higher dislocation density in the á111ñ grains. However, the present study does not allow us to
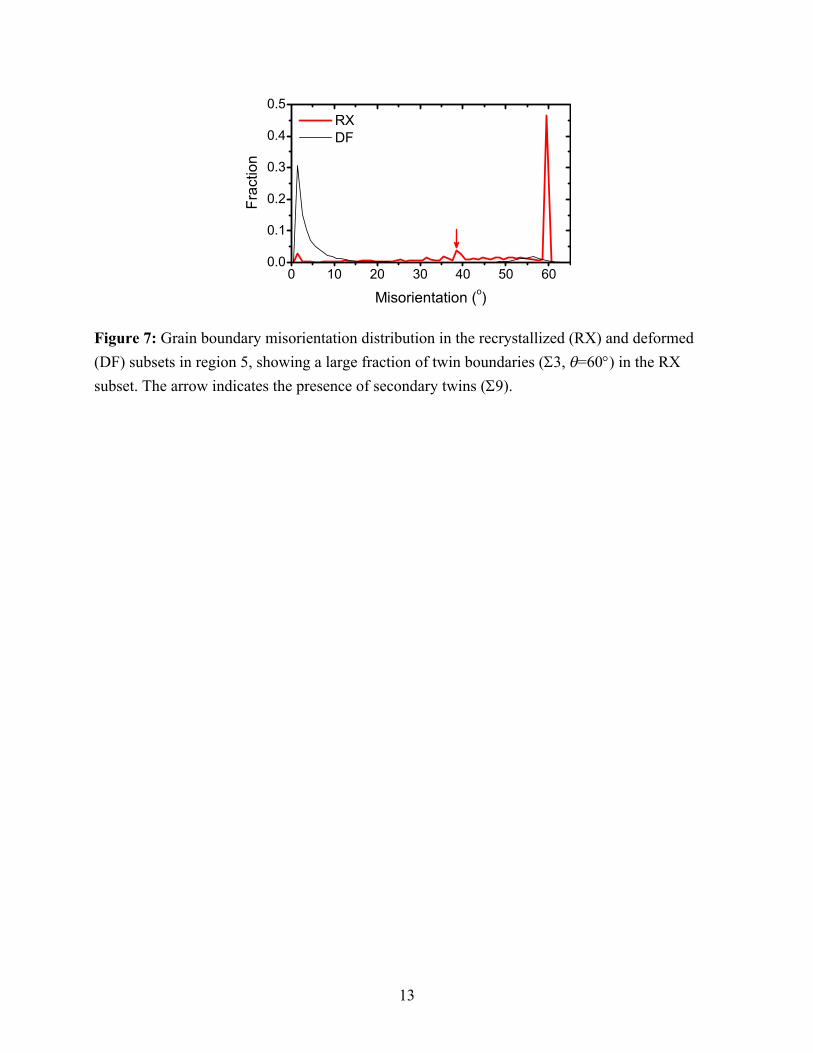
discriminate between these mechanisms. Additionally, the high fraction of Σ3 boundaries in the
recrystallized microstructure (≈ 50% in region 5 as can be seen in Fig. 7) indicates that growth
twinning plays a large role in the formation of the final texture. This can also be seen in the large
fraction of orientations outside the main fibers in region 5 (see Fig. 6), which to a large degree is
made up of twinned á001ñ grains.
7
In summary, the nucleation phase of dynamic recrystallization during high-strain-rate tensile
deformation of pure copper was investigated by high-resolution orientation mapping using TKD.
Individual subgrains with high misorientation were observed along the grain boundaries between
á001ñ and á111ñ grains. They presumably form due to compatibility strains at the boundaries
between adjacent grains during deformation. The size of these subgrains was consistent with the
estimated critical size for grain boundary bulging based on the Bailey-Hirsch mechanism.
Considering the predicted grain growth of such nuclei during adiabatic heating and post-
deformation cooling, the observed subgrains sizes are also consistent with the final recrystallized
microstructure. Based on this, it is proposed that nucleation of dynamic recrystallization during
high-strain-rate tensile deformation takes place by similar mechanisms as during quasi-static
conditions, in contrast to the rotational recrystallization observed during dynamic shear or shear-
compression testing with forced strain localization. Thus, it is possible that DRX models based
on quasi-static testing could be extended to include dynamic deformation in the case of tensile
loading.
8
References
[1] F. J. Humphreys and M. Hatherly: Recrystallization and Related Annealing Phenomena,
2nd ed., Elsevier Ltd., Kidlington, 2004.
[2] Y. Meshcheyakov, S. Atroshenko, A. Divakov and N Naumova: AIP Conf. Proc., 2012,
vol 1426, pp. 1367–1370.
[3] U. Andrade, M.A. Meyers, K.S. Vecchio and A.H. Chokshi: Acta Metall. Mater., 1994,
vol 42, pp. 3183–3195.
[4] J.A. Hines and K.S. Vecchio: Acta Mater., 1997, vol. 45, pp. 635–649.
[5] M. A. Meyers, Y. B. Xu, Q. Xue, M. T. Pérez-Prado and T. R. McNelley: Acta Mater.,
2003, vol. 51, pp. 1307–1325.
[6] L. Tang, Z. Chen, C. Zhan, X. Yang, C. Liu and H. Cai: Mater. Charact., 2012, vol 64,
pp. 21–26.
[7] D. Rittel, P. Landau and A. Venkert: Phys. Rev. Lett., 2008, vol 101, p. 165501.
[8] G.T. Gray III, E.K. Cerreta, C.A. Yablinsky, L.B. Addessio, B.L. Henrie, B.H. Sencer, M.
Burkett, P.J. Maudlin, S.A. Maloy, C.P. Trujillo and M.F. Lopez: AIP Conf. Proc., 2006,
vol 845, pp. 725–728.
[9] M. Hörnqvist, N. Mortazavi, M. Halvarsson, A. Ruggiero, G. Iannitti and N. Bonora: Acta
Mater., 2015, vol 89, pp. 163–180.
[10] A.H. Chokshi and M. Meyers: Scripta Metall. Mater., 1990, vol. 24, pp. 605–210.
[11] D. Rittel: J. Phys. D, 2009, vol 42, p. 214009.
[12] S. Osovski, D. Rittel and A. Venkert: Mech. Mater., 2013, vol. 56, pp. 11–22.
[13] P.W. Trimby: Ultramicr., 2012, vol.120, pp. 16–24.
[14] N. Bonora, G. Testa, A. Ruggiero, G. Iannitti, N. Mortazavi and M. Hörnqvist: J. Dyn.

9
Behav. Mater., 2015, vol. 1, pp. 136–152.
[15] N. Mortazavi, M. Esmaily and M. Halvarsson: Mater. Lett., 2015, vol. 147, pp. 42–45.
[16] S. Jakani, T. Baudin, C.H. de Novion and M.H. Mathon: Mater. Sci. Eng. A, 2007, vol.
456, pp. 261–269.
[17] X. Huang and G. Winther: Phil. Mag., 2007, vol. 87, pp. 5189–5214.
[18] H. Inoue, N. Inakazu and H. Yamamoto: Proc. 6th Int. Conf. Texture of Materials, pp.
591–600, The Iron and Steel Institute of Japan, 1981.
[19] T. Baudin, A.L. Etter and R. Penelle: Mater. Charact., 2007, vol. 58, pp. 947–952.
[20] S. Jakani, M.H. Mathon, P. Benyoucef, M.and Gerber, T. Baudin and C.H. de Novion:
J. Neutron Res., 2004, vol. 12, pp. 249–254.
[21] J.E. Bailey and P.B. Hirsch: Proc. Royal Soc. London A, 1962, vol. 267, pp. 11–30.
[22] J. Gubicza, L. Balogh, R.J. Hellmig, Y. Estrin and T. Ungár: Mater. Sci. Eng. A, 2005,
vol. 400-401, pp. 334–338.
[23] Yoshinori Murata, Ippei Nakaya and Masahiko Morinaga: Mater. Trans., 2008, vol. 49,
pp, 20–23.
[24] D. Turnbull: Trans. AIME, 1951, vol. 191, pp. 661– 665.
[25] P. Gerber, S. Jakani, T. Baudin, M.H. Mathon and R. Penelle: Mater. Sci. Forum, 2004,
vol. 467–470, pp. 135–140.
[26] H. Park and D.N. Lee: Metall. Mater. Trans. A, 2003, vol. 34A, pp. 531–541.
[27] D.N. Lee: Scripta Metall. Mater., 1995, vol. 32, pp. 1689–1694.
10
Figure 1: (a) Segment left in the die after DTE testing. The numbers indicate the positions along the symmetry axis where EBSD and TKD investigations were performed; (b) Measured area fractions of the á111ñ and á001ñ fibers, and recrystallized fraction (RX) for the different positions in (a). (c) IPF map of position 4, showing an elongated grain structure aligned with the extrusion direction. (d) Map of recrystallized (RX), deformed (DF) and substructured (SS) grains in region 4. (d) IPF map of position 5, and (e) corresponding RX/DF/SS map showing a partially recrystallized microstructure after grain growth during cooling.
Figure 2: (a) TKD IPF map, superposed on a band contrast map. (b) BF TEM image of the boxed region in (a), showing the substructure difference between á001ñ and á111ñ grains. The slanted arrow points to the same recrystallized grain as in (a). (c) Misorientation profiles along arrows A and B in (a).

11
Figure 3: TKD IPF map, superposed on a band contrast map. (b) Misorientation profiles along the lines indicated in (a) and (c). (c) Magnification of the boxed region in (a), with the deviation from the ideal á001ñ and á111ñ orientations is shown.
Figure 4: Temperature history in region 5 from finite element simulations and corresponding calculated growth of recrystallized nuclei during the DTE test and post-test cooling.
12
Figure 5: Final grain size distribution in the recrystallized (RX) fraction in region 5. Insert shows a magnification of the part of the distribution between 10 and 40 µm.
Figure 6: IPFs showing the textures in the deformed (DF) and recrystallized (RX) subsets in region 4 and 5 (MUD=multiples of uniform distribution). f denotes the fraction of the subsets, and the numbers for á001ñ, á111ñ and áhklñ refers to the fraction of the respective fibers in each subset (áhklñ refers to orientations outside the two main fibers).
13
Figure 7: Grain boundary misorientation distribution in the recrystallized (RX) and deformed (DF) subsets in region 5, showing a large fraction of twin boundaries (S3, q=60°) in the RX subset. The arrow indicates the presence of secondary twins (S9).
Top Related