


Languages
Pages
Legal

Louisiana State UniversityLSU Digital Commons
LSU Historical Dissertations and Theses Graduate School
1993
Dynamic Behavior of Headspace Gases inModified Atmosphere Packaging for Meat.Yanyun ZhaoLouisiana State University and Agricultural & Mechanical College
Follow this and additional works at: https://digitalcommons.lsu.edu/gradschool_disstheses
This Dissertation is brought to you for free and open access by the Graduate School at LSU Digital Commons. It has been accepted for inclusion inLSU Historical Dissertations and Theses by an authorized administrator of LSU Digital Commons. For more information, please [email protected].
Recommended CitationZhao, Yanyun, "Dynamic Behavior of Headspace Gases in Modified Atmosphere Packaging for Meat." (1993). LSU HistoricalDissertations and Theses. 5684.https://digitalcommons.lsu.edu/gradschool_disstheses/5684

INFORMATION TO USERS
This manuscript has been reproduced from the microfilm master. UMI films the text directly from the original or copy submitted. Thus, some thesis and dissertation copies are in typewriter face, while others may be from any type of computer printer.
The quality of this reproduction is dependent upon the quality of the copy submitted. Broken or indistinct print, colored or poor quality illustrations and photographs, print bleedthrough, substandard margins, and improper alignment can adversely affect reproduction.
In the unlikely event that the author did not send UMI a complete manuscript and there are missing pages, these will be noted. Also, if unauthorized copyright material had to be removed, a note will indicate the deletion.
Oversize materials (e.g., maps, drawings, charts) are reproduced by sectioning the original, beginning at the upper left-hand corner and continuing from left to right in equal sections with small overlaps. Each original is also photographed in one exposure and is included in reduced form at the back of the book.
Photographs included in the original manuscript have been reproduced xerographically in this copy. Higher quality 6" x 9" black and white photographic prints are available for any photographs or illustrations appearing in this copy for an additional charge. Contact UMI directly to order.
U niversity M icrofilm s International A Bell & H ow ell Information C o m p a n y
3 0 0 North Z e e b R o a d . Ann Arbor. Ml 4 8 1 0 6 -1 3 4 6 U SA 3 1 3 /7 6 1 -4 7 0 0 8 0 0 /5 2 1 -0 6 0 0


O rder N u m b er 9419938
Dynamic behavior of headspace gases in modified atmosphere packaging for meat
Zhao, Yanyun, Ph.D.
The Louisiana State University and Agricultural and Mechanical Col., 1993
U M I300 N. Zeeb Rd.Ann Arbor, Ml 48106


DYNAMIC BEHAVIOR OF HEADSPACE GASES IN MODIFIED ATMOSPHERE PACKAGING FOR MEAT
A D issertation
Submitted to the Graduate Faculty of the Louisiana State U niversity and
Agricultural and M echanical College in partial fulfillm ent of the
requirem ents for the degree of Doctor of Philosophy
in
The Interdepartmental Programs in Engineering
byYanyun Zhao
B.E., Shanghai Institute of M echanical Engineering, 1982 M.E., Shanghai Institute of M echanical Engineering, 1987
December 1993

ACKNOWLEDGEMENTS
I w ish to express a deep feeling of g ratitude to Dr. John H enry Wells,
M ajor Professor and C hairm an of my doctoral program committee, for the
opportunities, encouragem ent, support and patience th a t he provided during
the en tirety of my research process.
I wish to acknowledge the help of a num ber of individuals who
contributed to th is research effort. Sincere appreciation and thanks are given
to all my doctoral program committee: Dr. H arry J. B raud, Dr. K enneth W.
McMillin, Dr. F red E. S istler and Dr. Paul W. Wilson, for th e ir effort and
guidance throughout the graduate program . Special appreciation is given to
Dr. K enneth W. McMillin (Dept, of Anim al Science) for his help to clarify my
understand ing of MAP m eat and help to supply fresh beef sam ples; Dr.
Douglas L. M arshall (Dept, of Food Science) for his contribution of his
expertise in the area of Microbiology and providing d a ta for microbial
population growth modeling; Mr. Tom McClure for the fabrication of the gas
pressure m onitoring chamber; Mr. B rian Sm ith (M anager of Muscle Foods
Lab) and Mr. H enri Salm an (Dept, of Poultry Science) for the ir support
through all the experim ents. Additionally, I am grateful to D an and Sherif
who shared in the tria ls and trium phs of my work.
I would like to dedicate th is work to my husband, Ju n Xu, my paren ts,
and brother, w ithout whose constant sp iritual, and in tellectual support,
encouragem ent and love, its realization would not have been possible.

TABLE OF CONTENTS
ACKNOWLEDGEMENTS................................................................................ ii
LIST OF TABLES............................................................................................. vi
LIST OF FIGURES......................................................................................... viii
NOMENCLATURE............................................................................................ xi
ABSTRACT.........................................................................................................xiv
I. INTRODUCTION............................................................................................ 11.1 Investigation Objectives......................................................................... 4
II. REVIEW OF LITERATURE.......................................................................62.1 Applications of MAP to F resh M eat............................................................... 6
2.1.1 Inhibition of Microbial G row th............................................................72.1.2 T em perature C ontrol............................................................................112.1.3 Food Safety and MAP...........................................................................13
2.2 Physicochemical C hanges of MAP M eat...................................................... 152.2.1 C 0 2 Absorption in Packaged M eat.................................................... 162.2.2 Color Changes in MAP M eat.............................................................. 182.2.3 O ther Physicochemical Changes in MAP M eat.............................21
2.3 Predictive Models for MAP H eadspace Gas B ehavior.............................. 232.3.1 Effect of P roduct C haracteristics on
H eadspace G ases.................................................................................. 252.3.2 Effect of Packaging and Storage Conditions on
H eadspace G ases...................................................................................262.4 M athem atical S tructu re for Modeling Microbial Grow th R ate .............. 28
III. THEORETICAL CONSIDERATION...................................................... 313.1 Derivation of Model for M easuring CO, Absorption................................. 31
3.1.1 The Ideal Gas L aw ................................................................................. 313.1.2 E stim ation of C 0 2 Absorption.............................................................323.1.3 E stim ation of Final C 0 2 Concentration in H eadspace................ 37
3.2 Modeling Dynamic Behavior of H eadspace G ases.....................................383.3 Modeling Influence of MAP on Microbial G row th.....................................40
3.3.1 Microbial Population Growth in Log (Growth) P hase ................. 413.3.2 A rrhenius E quation ...............................................................................423.3.3 Microbial Population Growth Rate Coefficient
M odels...................................................................................................... 44

IV. MATERIALS AND METHODS................................................................494.1 M ethod for M easuring C 0 2 A bsorption........................................................49
4.1.1 D etailed Design of E xperim ental A ppara tu s.................................494.1.2 Experim ental V alidation of C 0 2 Absorption M ethod..................53
4.2 E xam ination of Packaging/Product C onfiguration.................................... 554.2.1 P reparation of F resh Beef Sam ples..................................................564.2.2 M ethod for Packaging/Product Configuration
Investigation .......................................................................................... 574.3 E xam ination of Storage Conditions.............................................................. 58
4.3.1 Experim ental Design for Storage ConditionsInvestigation ..........................................................................................58
4.4 Prediction of Microbial Population Grow th R ateCoefficients............................................................................................................ 60
4.4.1 M ethods for E stim ation of K inetic P a ram e te rs ............................60
V. RESULTS AND DISCUSSION.................................................................. 625.1 V alidation of Headspace CO; Change M easurem ent.................................625.2 Dynam ic Behavior of Headspace G ases........................................................65
5.2.1 P ressu re Drop Associated w ith C 0 2 A bsorption............................ 675.2.2 Applicability of P ressure Drop Model.............................................. 725.2.3 P ressure Drop Rate Coefficient..........................................................775.2.4 Effect of Packaging/Product P aram eters on
C 0 2 A bsorption.................................................................................... 825.2.5 Engineering Design C riterial for Packaging/Product
Configaration.........................................................................................875.3 Effects of Storage Conditions on Headspace C 0 2 C hanges.................... 91
5.3.1 Effect of Storage T em perature and In itia l C 0 2C oncentration.........................................................................................92
5.3.2 H eadspace Gas Composition and P ressure C hanges...................995.3.3 Factors of Selection of In itial MAP C onditions........................... 1045.3.4 Additional Com m ents, O bservations and
Study lim ita tions................................................................................ 1075.4 Verification of Microbial Population Growth M odels.............................. I l l
5.4.1. Model Predictions for Microbial Population G row th ................I l l5.4.2 Accuracy of Models Predicting Microbial Population
G row th................................................................................................... 1135.4.3 Prediction of Microbial Population G row th.................................. 128
VI. SUMMARY AND CONCLUSIONS........................................................1326.1 Investigation Sum m ary .........................................................................1326.2 Specific Investigation Conclusions......................................................1346.3 Topics for F u tu re Investigations......................................................... 135
REFERENCES..................................................................................................136
APPENDIX A. UNCERTAINTY ANALYSIS FOR PREDICTEDC 02 ABSORPTION............................................................. 147
APPENDIX B. VERFICATION OF TIME SELECTION ON C 02ABSORPTION CALCULATION.......................................150
APPENDIX C. ORGANISMS AND GROWTH CONDITIONSUSED FOR MODEL DEVELOPMENT.......................... 152
APPENDIX D. EXPERIMENTAL OBSERVATION FORPACKAGING/PRODUCT CONFIGURATIONAND STORAGE CONDITIONS.......................................154
VITA.....................................................................................................................165
v

LIST OF TABLES
Table 5.1: Calculated D ata for C 0 2 Absorption M easurem ent a tT em perature 13±0.5°C, In itia l Headspace Pressure 155±14 kPa, and Initial Gas Composition 99±1.0%CO2 for 12 h rs T est....................................................................................... 66
Table 5.2: Regression Lines for P ressure Drop w ith Time for12 h rs Storage a t T em perature 13°C, In itia l Gas Composition 100%CO2, and Various Different Packaging Configurations....................................................................................... 69
Table 5.3: Regression Lines of Pressure Drop w ith Time for12 h rs Storage a t Vr= 2.5, In itia l Gas Composition 100% C 0 2, and Different Storage T em peratu res....................... 73
Table 5.4: F Values for Significant V ariables for the HeadspaceP ressure Drop R ate Coefficient "b" Using Backward E lim ination M ethod.............................................................................. 79
Table 5.5: F Values for Significant V ariables for 12 h rs C 0 2Absorption Using Backward E lim ination M ethod...................... 83
Table 5.6: Calculated D ata on the Experim ent of StorageCondition Effect on 12 h rs A m ount of C 0 2 Changes on Packaged F resh Beef...................................................................... 93
Table 5.7: ANOVA of 12 h rs Am ount of C 0 2 Changes in StorageT em perature and Initial Gas Composition T rea tm en t.............. 94
Table 5.8: Volume Percentage of H eadspace Gas CompositionChanges D uring 12 h rs Storage for Fresh Beef.........................100
Table 5.9: Sum m arized Previous Works on Headspace GasComposition Changes for V arious Initial Gas Atm osphere of C 0 2 Plus N2 a t 3 to 7”C for About 2 to 3 Weeks S torage..........................................................................102
Table 5.10: Experim ental P lan for a 3 x 3 Factorial Experim entConfounded in Blocks of 3, w ith Replication Twice..................110

Table 5.11: Calculated G eneration Time (G) and Grow th RateCoefficient (k) of L. monocytogenes and P. fluorenscens under Various Modified Atmosphere Conditions.......................112
Table 5.12: Param eters D eterm ined for Microbial PopulationGrowth Rate Coefficient Model 1 (Eq. 3.23)................................114
Table 5.13: P aram eters D eterm ined for Microbial PopulationGrowth Rate Coefficient Model 2 (Eq. 3.25)................................115
Table D l: Recorded D ata for C 0 2 Absorption E xperim ent a tT em perature 13±0.5 " C, In itial H eadspace Pressure 155±14 kPa, and Initial Gas Composition 99±1.0 %C 0 2 for 12 hour te s t ...........................................................................155
Table D2: Recorded Absolute Pressure Values (kPa) of H eadspaceGases D uring 12 hrs Storage for Packaging/Product Configuration E xperim ent................................................................156
Table D3: M easured D ata on the E xperim ent of StorageCondition Effect on 12 hrs Am ount of C 0 2 Changes on Packaged Fresh Beef.................................................................... 158
Table D4: Recorded Absolute Pressure Values (kPa) of H eadspaceGases D uring 12 h rs Storage for Storage Conditions E xperim ent............................................................................................ 159
Table D5: Growth of Listeria monocytogenes a t 3, 7, and 11°C onChicken D ark M eat Nuggets Packaged in Air, Modified Atm osphere 1, or Modified A tm osphere 2................................... 161
Table D6: Growth of Pseudomonas fluorenscens a t 3, 7, and 11°Con Chicken D ark M eat Nuggets Packaged in Air,Modified Atm osphere 1, or Modified Atm osphere 2.................162
LIST OF FIG URES
Figure 3.1: An Im itative Therm ostatic, C onstant Volume, and Gas Im perm eable System Used for C 0 2 Absorption Calculation.............................................................................................. 33
F igure 3.2: A rrhenius Plot of In (k) vs Inverse Absolute T em perature 1/T for L. monocytogenes a t D ifferent ( l+ [0 2])/(l+ [C 02])(from Zhao et al. 1992).........................................................................46
F igure 4.1: T est A pparatus Used to Monitor Change in GasP ressu re ............................................................................. 50
F igure 4.2: Dead-W eight T ester M ethod Used for P ressureT ransducer C alib ration ....................................................................... 54
F igure 5.1: Comparison of Observed (M easured by Gas Analyzer) and Predicted (Calculated by Ideal Gas Law) Volume Percentages of Headspace C 0 2 and N 2............................................ 63
Figure 5.2: Typical Plot of P ressure Drops W ith Respect to TimeD uring C 0 2 Absorption in F resh Beef............................................. 68
Figure 5.3: Plot of H eadspace Pressure Changes w ith Time for D ifferent In itial Headspace Pressures (D ata from Table D4 Sam ples No. 8 and No.9)..........................................74
F igure 5.4: COa Absorption of Various Muscle Foods w ith Respectto Time a t T em perature 13 "C ...........................................................75
Figure 5.5: Plot of Pressure Changes with Time for D ifferent Beef Muscles (D ata from Table D2 Sam ple No. 4 and Table D4 Sam ple No. 16)..................................................................... 76
Figure 5.6: D ata Plot of the In itial P ressure Drop R ate Coefficient w ith Respect to Headspace-to-M eat Volume Ratio for F resh Beef. ..................................................................................... 80
F igure 5.7: 3-Dimensional G raph of 12 hrs C 0 2 Absorptionw ith Headspace-to-M eat Volume Ratio and Surface Area of Beef Sam ple........................................................................................84

Figure 5.8: 3-Dim ensional G raph of 12 h rs C 0 2 Absorption w ith H eadspace-to-M eat Volume Ratio and Volume of Beef Sam ple............................................................................................ 85
Figure 5.9: Ideal C 0 2 Absorption Curve w ith Respect to Time W hen H eadspace H as Enough C 0 2 to Reach C 0 2 Absorption E quilibrium ........................................................................90
Figure 5.10: H eadspace A m ount of C 0 2 Changes under VariousStorage T em perature for 12 h rs Storage of F resh Beef...............95
Figure 5.11: Headspace A m ount of C 0 2 Changes under Various In itia l C 0 2 Percentages for 12 h rs Storage of F resh Beef................................................................................................98
Figure 5.12: D ifferent P ressu re Changes in H eadspace under Various Storage T em peratures and In itia l C 0 2 Percentages for 12 hrs Storage of F resh Beef............................105
Figure 5.13: Com parison of Observed (Symbol) and Predicted (Line)G row th of L. monocytogenes Population a t 3, 7, and11°C Using a Modified and Additive A rrheniusE quation (Eq. 3.23)..............................................................................116
Figure 5.14: Com parison of Observed (Symbol) and Predicted (Line)Grow th of L. monocytogenes Population a t 3, 7, and11°C Using a Modified A rrhenius T em peratureC haracteristic E quation (Eq. 3.25)................................................ 117
Figure 5.15: Com parison of Observed (Symbol) and Predicted (Line)G row th of P. fluorenscens Population a t 3, 7, and11°C Using a Modified and Additive A rrheniusE quation (Eq. 3.23)..............................................................................118
Figure 5.16: Com parison of Observed (Symbol) and Predicted (Line)Grow th of P. fluorenscens Population a t 3, 7, and11°C Using a Modified A rrhenius T em peratureC haracteristic Equation (Eq. 3.25)................................................ 119
Figure 5.17: Plot of Residuals against Time for Log N um berGrow th of L. monocytogenes Population.......................................121
Figure 5.18: P lot of Residuals against Time for Log N um berGrowth of P. fluorenscens P o p u la tio n ........................................... 122
ix

Figure 5.19: Norm al Probability Plot of Residuals for Log N um berGrowth of L. monocytogenes P o p u la tio n .................................... 124
Figure 5.20: Norm al Probability Plot of Residuals for Log N um berGrowth of P. fluorenscens Population..........................................125
Figure 5.21: Plot of Residuals against Log Num berGrowth of L. monocytogenes P o p u la tio n .................................... 126
Figure 5.22: P lot of Residuals against Log N um berGrowth of P. fluorenscens P o p u la tio n .........................................127
x

NOMENCLATURE
a = regression coefficient in headspace gas pressure drop equation (Eq. 5.1)
a0 to a 7 = regression coefficients in equation of 12 h rs C 0 2 absorption w ith
packaging/product configuration
A = collision factor, frequency factor, or pre-exponential factor (1/day)
AC02 = C 0 2 absorption by packaged m eat (g(!02/kgmcul)
Acoatt) = C 0 2 absorption by packaged m eat a t tim e t (g<;o2/kgm(,.lt)
A cc^t^lS ) = 12 h rs C 0 2 absorption by packaged m eat (gc02/kgmi..lt)
b = p ressure drop ra te coefficient (kPa/hr)
b0 to b7 = regression coefficients in equation of the p ressure drop rate
coefficient w ith packaging/product configuration
B = relative growth ra te of m icroorganism s a t the tim e a t which the absolute
grow th ra te is a m axim um (1/hr)
c0 to cs = regression coefficients in microbial population growth ra te coefficient
models (Eq. 3.23 through Eq. 3.25)
C = asym ptotic am ount of microbial growth th a t occurs as tim e increases
indefinitely (log]0CFU/g)
[C 02] = volume percentage of C 0 2 w ithin a package (%)
[C 02]r = final volume percentage of C 0 2 a t the end of 12 h rs storage (%)
G = generation tim e of m icrobial population growth (day)
Hj = in itia l headspace gas composition (%)
H f = final headspace gas composition (%)

k = population growth ra te coefficient of m icroorganism s (1/day)
M = tim e a t which the absolute microbial growth ra te is a m axim um (day)
MC02 = 12 h rs am ount of headspace C 0 2 changes (gco'/kgmwu)
= m ass of m eat sam ple (kg)
n = absolute am ount of headspace gas (mole)
nco2 = absolute am ount of C 0 2 in headspace (mole)
nN2 = absolute am ount of N 2 in headspace (mole)
[N2] = volume percentage of nitrogen w ithin a package (%)
[N2]f = final volume percentage of nitrogen a t the end of 12 h rs storage (%)
N0 = in itia l num ber of m icroorganism s a t the beginning of log phase
(log10CFU/g)
N(t) = num ber of m icroorganism s a t tim e t (log10CFU/g)
[0 2] = volume percentage of oxygen within a package (%)
P = absolute pressure of headspace gas (N/m2 or Pa)
P 0 = in itial absolute pressure of headspace gas (N/m2 or Pa)
P r = final absolute pressure of headspace gas a t the end of 12 h rs storage
(N/m2 or Pa)
P(t) = absolute pressure of headspace gas a t tim e t (N/m2 or Pa)
aP = P () -Pr headspace gas p ressure changes during 12 h rs (N/m2 or Pa)
Rm = universal gas constant (1.987 cal/mol»K or 8.3144 J/kg*K)
Sm = surface area of m eat sam ple (cm2)
t = tim e (hr or day)
xn

T = tem pera tu re (K)
Y = volume of gases (m3 or liter)
VC 0 2 = volume of gasous C 0 2 in headspace (m:i)
VN2 = volume of gasous N2 in headspace (m;i)
VH = headspace volume of package (liter)
Vm = m easured volume of m eat sam ple (liter)
Vm’ = calculated volume of m eat sam ple based on density and m ass of m eat
sam ple (liter) (Eq. 5.3)
Vr = headspace-to-m eat volume ratio
x = VH/(RmTMmu.lt) in Eq. B2
Y = a constant in Eq. B3
P = frequency factor modified by the percentages of gases
Y = tem pera tu re characteristic term modified by the percentages of gases
p = activation energy or tem pera tu re characteristic term (cal/mole)
pm = calculated density of m eat sam ple (kg/m:i)
w aco2 - uncerta in ty of A X)2 caused by m easurem ent error (ga^/k&nusit)
= uncerta in ty of Mm caused by m easurem ent error (kg)
w aP = uncerta in ty of a P caused by m easurem ent error (N/m2 or Pa)
wT = uncerta in ty of T caused by m easurem ent erro r (K)
u>vH = uncerta in ty of VH caused by m easurem ent error (liter)

ABSTRACT
H eadspace gas composition in food packaging undergoes dynamic
changes as a resu lt of film perm eability, postm ortem m etabolic activity, C 0 2
absorption in w ater and lipid, and bacteria growth and respiration . A
methodology to study dynam ic behavior of headspace C 0 2 was developed and
used to identify the significant factors influencing C 0 2 behavior w ithin
modified atm osphere packaging (MAP) system s for beef. Additionally, a
m athem atical struc tu re suitable for modeling m icrobial growth in MAP
system s was presented.
A combined analytical and experim ental m ethod was developed to
investigate headspace C 0 2 changes during isotherm al storage. The ideal gas
law was used as a theoretical basis, and a gas im perm eable and constant
volume cham ber was constructed to evaluate the theoretical derivation.
Changes in headspace pressure caused by dynamic in teractions betw een beef
and MAP atm ospheres were m onitored to predict concentration changes of C 0 2
w ithin the cham ber. Two sets of independent experim ents were conducted to
evaluate the effects of in itia l packaging/product param eters and storage
conditions on headspace C 0 2 changes.
The proposed methodology for m easuring C 0 2 concentration changes was
confirmed by gas analysis and proved valid for prediction of headspace C 0 2
concentration changes in MAP atm osphere w ithin the range of in itial gas
composition 20% to 100% C 0 2 balanced w ith N2, tem pera tu re 3" to 13''C, and
xiv

in itia l headspace pressure 111 to 155 kPa. H eadspace-to-m eat volume ratio
was the m ost significant packaging p aram eter affecting headspace C 0 2
changes, and surface area and volume of m eat sam ple also influenced
headspace C 0 2 changes. Decreased storage tem pera tu re reduced C 0 2
concentration rem aining in headspace. H igher in itia l C 0 2 concentration
resu lted in more pronounced C 0 2 concentration changes. H igher headspace
gas p ressures caused increased ra tes of C 0 2 change. Biological factors of m eat
also affected headspace C 0 2 changes.
Two m athem atical descriptions based on 1) a modified and additive
A rrhenius equation and 2) a modified A rrhenius tem pera tu re characteristic
equation were developed to describe the combined effects of tem pera tu re and
in itia l gas composition of modified atm osphere storage on the population
grow th ra te coefficients of Listeria monocytogenes and Pseudomonas
fluorescens. The m athem atical descriptions were shown applicable for oxygen
concentration from 0% to 20.99% and carbon dioxide concentration from 0.03%
to 80%.
xv
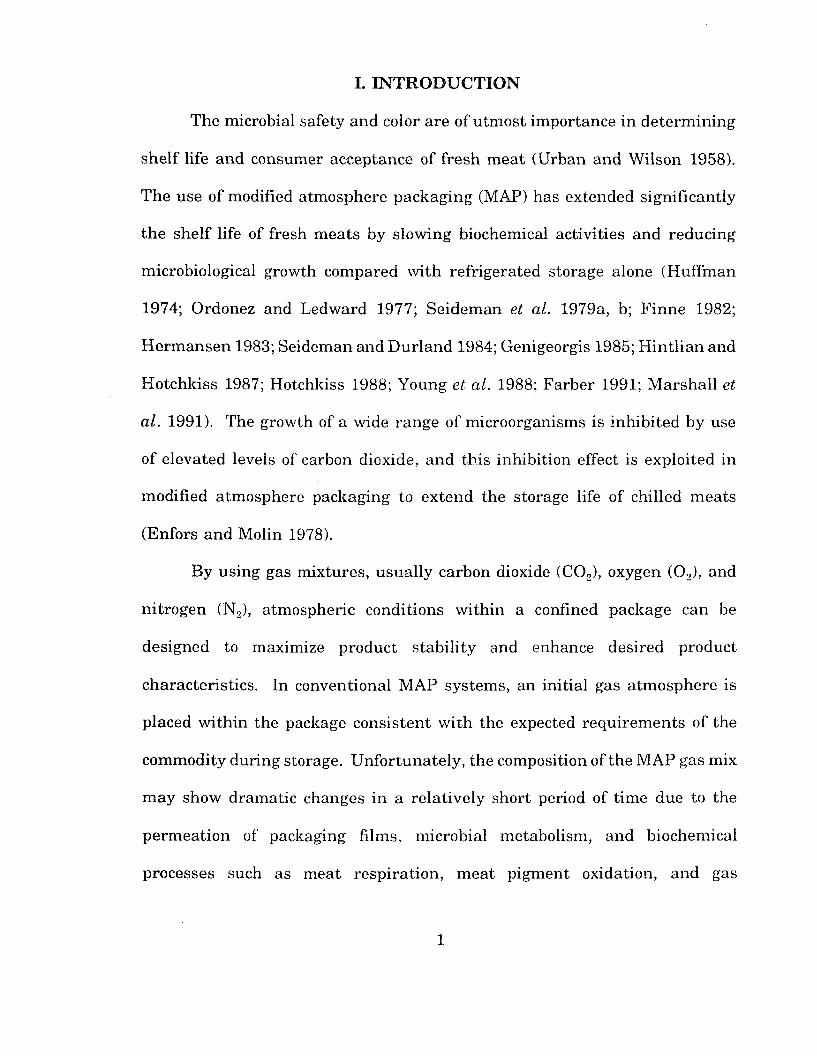
I. INTRODUCTION
The microbial safety and color are of u tm ost im portance in determ ining
shelf life and consumer acceptance of fresh m eat (U rban and W ilson 1958).
The use of modified atm osphere packaging (MAP) has extended significantly
th e shelf life of fresh m eats by slowing biochemical activities and reducing
microbiological growth compared w ith refrigerated storage alone (H uffm an
1974; Ordonez and Ledward 1977; Seidem an et al. 1979a, b; F inne 1982;
H erm ansen 1983; Seidem an and D urland 1984; Genigeorgis 1985; H in tlian and
H otchkiss 1987; Hotchkiss 1988; Young et al. 1988; F arber 1991; M arshall et
al. 1991). The growth of a wide range of m icroorganism s is inhib ited by use
of elevated levels of carbon dioxide, and th is inhibition effect is exploited in
modified atm osphere packaging to extend the storage life of chilled m eats
(Enfors and Molin 1978).
By using gas m ixtures, usually carbon dioxide (C 02), oxygen (0 2), and
nitrogen (N2), atm ospheric conditions w ithin a confined package can be
designed to maximize product stab ility and enhance desired product
characteristics. In conventional MAP system s, an in itial gas atm osphere is
placed w ith in the package consisten t w ith the expected requ irem ents of the
commodity during storage. U nfortunately , the composition of the MAP gas mix
m ay show dram atic changes in a relatively short period of tim e due to the
perm eation of packaging films, m icrobial m etabolism , and biochemical
processes such as m eat resp ira tion , m eat pigm ent oxidation, and gas
1
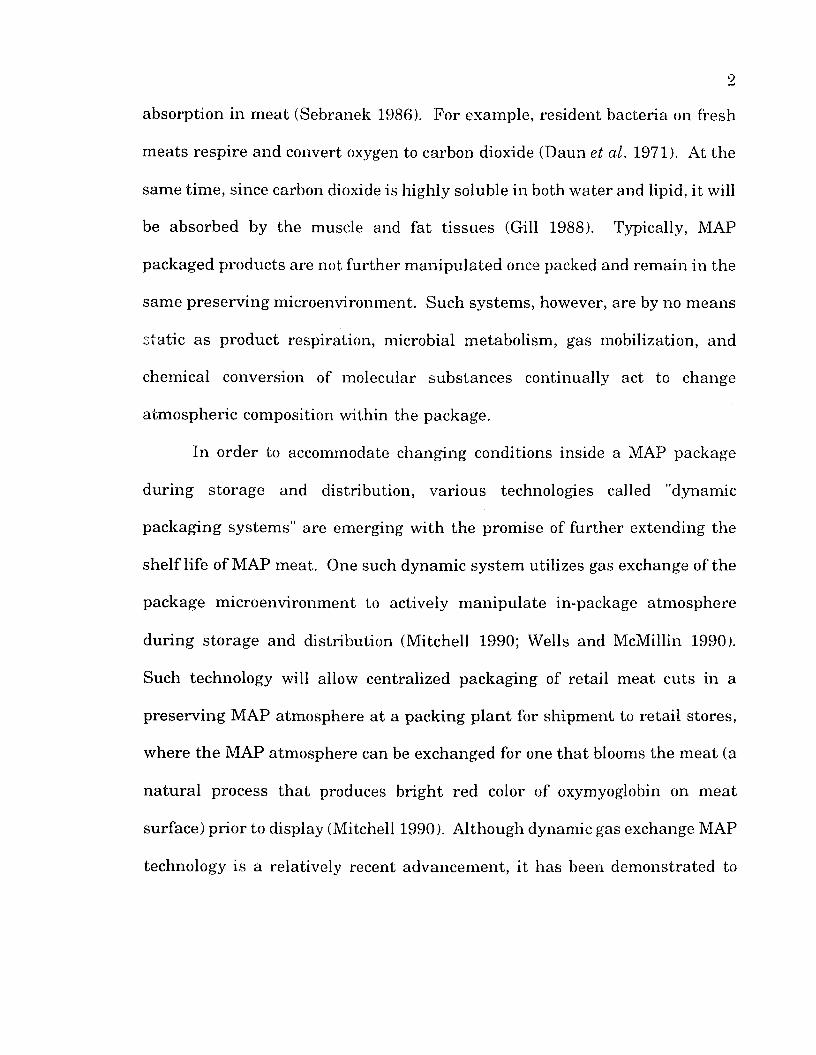
absorption in m eat (Sebranek 1986). For exam ple, resident bacteria on fresh
m eats resp ire and convert oxygen to carbon dioxide (Daun et al. 1971). At the
sam e tim e, since carbon dioxide is highly soluble in both w ater and lipid, it will
be absorbed by the muscle and fa t tissues (Gill 1988). Typically, MAP
packaged products are not fu rther m an ipu lated once packed and rem ain in the
sam e preserv ing m icroenvironm ent. Such system s, however, are by no m eans
sta tic as product respiration, m icrobial m etabolism , gas mobilization, and
chemical conversion of molecular substances continually act to change
atm ospheric composition w ithin the package.
In order to accommodate changing conditions inside a MAP package
during storage and distribution, various technologies called "dynamic
packaging system s" are emerging w ith the prom ise of fu rther extending the
shelf life of MAP m eat. One such dynam ic system utilizes gas exchange of the
package m icroenvironm ent to actively m an ipu late in-package atm osphere
during storage and distribution (M itchell 1990; Wells and McMillin 1990).
Such technology will allow centralized packaging of retail m eat cuts in a
p reserv ing MAP atm osphere a t a packing p la n t for shipm ent to re ta il stores,
where th e MAP atm osphere can be exchanged for one th a t blooms the m eat (a
n a tu ra l process th a t produces b righ t red color of oxymyoglobin on m eat
surface) p rio r to display (Mitchell 1990). A lthough dynamic gas exchange MAP
technology is a relatively recent advancem ent, it has been dem onstrated to

3
effectively extend reta il life of several red m eat (McMillin et al. 1990, 1991a,
b, 1992).
As dynam ic packaging techniques are developed, research is required on
the fundam ental aspects of headspace gas behavior. In order to achieve
improved product stab ility using MAP, it is im portan t to understand
modification in the in itial package m icroenvironm ent by product changes over
time (Sebranek 1986). The objective of dynam ic packaging system s should be
to m ain tain a m icroenvironm ent th a t will accom m odate expected MAP
atm osphere changes in such a way as to m ain tain or im prove product stability.
If reproducible effects a re to be achieved w ith m eat packaged in MAP
atm ospheres containing CO.,, the absorptive capacity of the m eat for C 0 2 m ust
be taken into account. S tudying the C 0 2 absorption in different packaged
m eats, and determ ining the total am ount of C 0 2 needed to achieve sa turation
given a specific gas m ixture m ust be integral in the developm ent of innovative
dynamic MAP system s.
M odeling the in teractions between m eat and package atm osphere in an
effort to p u t the design of MAP system s on an analy tical basis has not been
previously a ttem pted . Such an analytical design methodology would have wide
ranging im plications for industry . M athem atical models to predict microbial
population growth under varying conditions of tem pera tu re and gas
composition could be used in conjunction w ith known behavior of package gas
atm osphere to predict the probability of m icrobial grow th and/or toxin

production in m eat products. The ability to conduct a num ber of com puter
assisted sim ulations could ru le out packaging scenarios th a t have the potential
to compromise food safety. Such m odelling techniques would be invaluable in
saving tim e during tes ting and development. Finally, investigation on the
dynamic behavior of headspace gases m ay help to find w ays of controlling the
quality loss in MAP associated w ith microbial growth, lipid oxidation, and color
changes.
1.1 Investigation Objectives
The focus of th is research is to fu rther an understand ing of the dynamic
conditions th a t exist w ith in the MAP m icroenvironm ent used for m eats.
Dynamic relationships betw een m eat and the in-package m icroenvironm ent of
headspace volume, storage tem pera tu re , gas pressure, and package atm osphere
m u st be identified to design effective MAP systems. The dynam ic conditions
of the in-package m icroenvironm ent for applications of m odified atm osphere
packaging have not had the benefit of extensive system atic engineering
research.
The specific objectives to be addressed w ithin th is research d issertation
are:
1) Development of a combined analytical and experim ental m ethod to
investigate headspace CO., changes in MAP systems.
2) Investigation of the physical conditions (packaging/product
configuration) w ithin the package, such as headspace-to-m eat volume ratio of

5
a package, and surface a rea and volume of m eat sample, as well as the
influence of these physical conditions on C 0 2 absorption.
3) Investigation of the effect of storage conditions on changes in the
am oun t of C 0 2 w ithin MAP headspace. The storage conditions for a package,
i.e., storage tem perature and in itia l gas composition will be m easured w ith
respect to changes in the am ount of C 0 2 w ithin MAP headspace.
4) D erivation of m athem atical relationships based on m odifications of
the classic A rrhenius equation th a t can be used to predict the population
grow th ra te coefficient of selected m icroorganism s under vary ing gas
atm ospheres a t refrigeration tem pera tu res.

II. REVIEW OF LITERATURE
The previous research pertinen t to th is work is taken from the fields of
food science and engineering. The inform ation p resen ted in th is chapter covers
the lite ra tu re pertinen t to each research objective. However, little work has
been done on the dynamic behavior of headspace gases in MAP m eat. Thus,
th is review is designed to establish the m otivation and prem ise on which the
concepts for evaluation of product quality, packaging configuration and storage
conditions for m eat are based.
2.1 Applications of MAP to Fresh Meat
Modified atm osphere packaging (MAP), a lthough relatively new in N orth
America, is a well established technology da ting back to the 1930’s when fresh
beef w as shipped stored under C 0 2 from A ustra lia and New Zealand to
England (Empey ei al. 1934). The science and technology of gas preservation
of food evolved slowly in North Am erica, w here refrigeration and highly
developed tran spo rta tion and d istribution system s are available. Over the last
two decades, the increased costs of raw food products, labor and energy, and
the tigh ten ing controls on some preservatives and additives, has renew ed
in te res t in the use of gases for food preservation . Developm ents in packaging
m ateria ls and techniques have m ade MAP technology both practically and
economically feasible. Modified atm osphere packaging was defined by H in tlian
and H otchkiss (1986) as packaging "of a perishab le product in an atm osphere
which h as been modified so th a t its composition is o ther th an th a t of air."
6
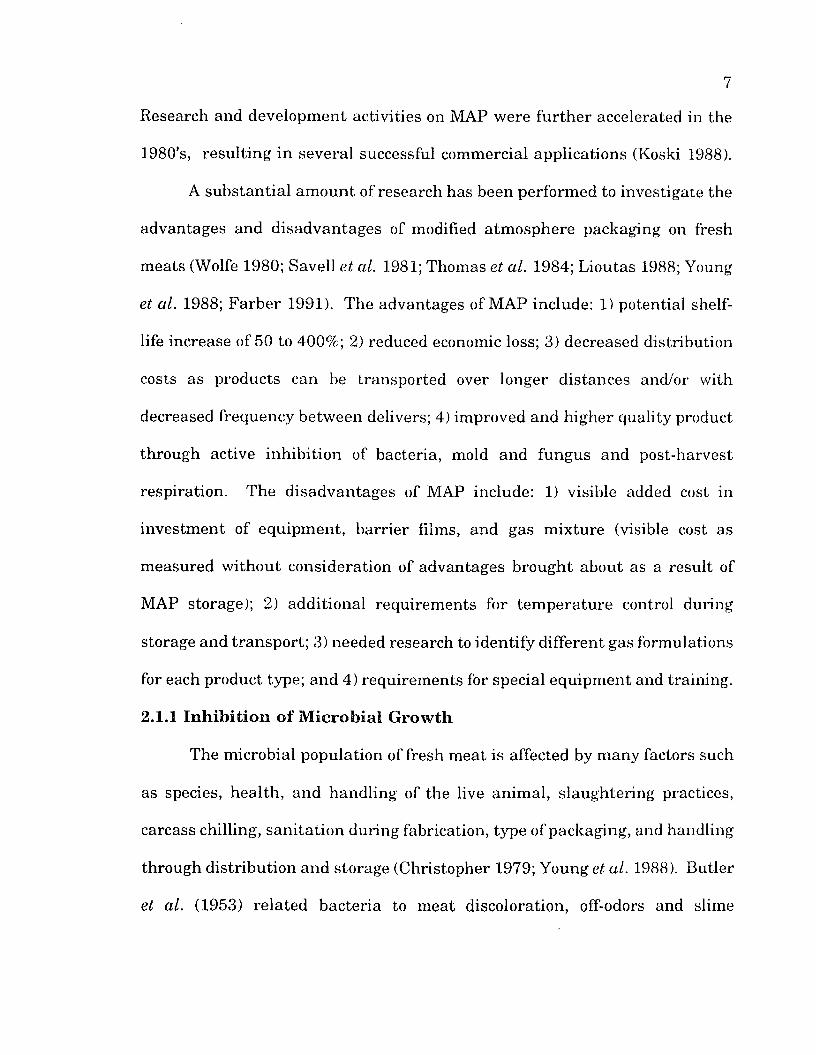
Research and developm ent activities on MAP were fu rth e r accelerated in the
1980’s, resu lting in several successful commercial applications (Koski 1988).
A substan tia l am ount of research has been perform ed to investigate the
advantages and d isadvantages of modified atm osphere packaging on fresh
m eats (Wolfe 1980; Saveli et al. 1981; Thomas et al. 1984; L ioutas 1988; Young
et al. 1988; F a rb er 1991). The advantages of MAP include: 1) potential shelf-
life increase of 50 to 400%; 2) reduced economic loss; 3) decreased distribution
costs as products can be transported over longer d istances and/or with
decreased frequency betw een delivers; 4) improved and higher quality product
through active inh ib ition of bacteria, mold and fungus and post-harvest
respiration. The d isadvantages of MAP include: 1) visible added cost in
investm ent of equipm ent, barrier films, and gas m ixture (visible cost as
m easured w ithout consideration of advantages brought about as a resu lt of
MAP storage); 2) additional requirem ents for tem pera tu re control during
storage and tran spo rt; 3) needed research to identify different gas form ulations
for each product type; and 4) requirem ents for special equipm ent and training.
2.1.1 I n h ib i t io n o f M ic ro b ia l G ro w th
The m icrobial population of fresh m eat is affected by m any factors such
as species, health , and handling of the live anim al, slaughtering practices,
carcass chilling, san ita tio n during fabrication, type of packaging, and handling
through d istribu tion and storage (Christopher 1979; Young et al. 1988). Butler
et al. (1953) re la ted bacteria to m eat discoloration, off-odors and slime

production. The brow ning of m eat surfaces was observed during the
logarithm ic growth phase of bacteria (Butler et al. 1953).
Carbon dioxide is known to inhibit growth of m eat spoilage organism s
and extend the shelf life of chilled m eat (Killeffer 1930; Scott 1938; C lark and
Lentz 1969; C lark et al. 1976). For example, Newton et al. (1977) found th a t
psychrotrophic aerobic counts (spoilage organisms) on lam b chops held in
different CO., atm ospheres a t -1°C related to storage tim e and gas composition.
The overall effect of carbon dioxide is to increase both the lag phase and the
generation tim e of spoilage m icroorganism s (Daniels et al. 1985; Phebus et al.
1991). Gill and T an (1980) indicated th a t the ra tes of resp ira tion of
Pseudomonas (fluorescent and nonfluorescent species), Acinetobacter,
ALteromonas putrefaciens, and Yersinia enterocolitica were reduced in the
presence of CO.,. King and Nagel (1967), Daniels et al. (1985), and Dixon and
Kell (1989) studied the possible m echanism s and factors responsible for the
inhibitory effect of carbon dioxide on bacteria. These investigators suggested
th a t: 1) the exclusion of 0 2 by replacem ent w ith CO., contributed to a slowing
of the growth ra te of aerobic bacteria; 2) C 0 2 absorbed by fa t and lean tissue
resu lted in a decrease in pH due to formation of carbonic acid, and 3) C 0 2
in terfered w ith enzym atic activity in some species.
M ost of the previous research indicated th a t a concentration of 20 to
30% C 0 2 is sufficient to p reven t bacterial growth. Taylor (1972) reported th a t
a concentration of 20% or more carbon dioxide inhib ited the growth of

putrefactive bacterial associated w ith m eat spoilage, provided the m ea t was
stored in the chilled condition. C lark and Lentz (1969) reported th a t the use
of 20% carbon dioxide contributed to a longer shelf life a t lower tem pera tu re
(0°C), b u t there was no detectable benefit a t 20°C prim arily due to the effect
of tem pera tu re itself on the growth rate . Gill and Tan (1980) concluded th a t
gram -negative organisms were more susceptible to inhibition by C 0 2 th an were
gram -positive organisms. The presence of C 0 2 resu lted in a reduction of the
aerobic growth of m eat spoilage flora by about 25 to 30%, yielding a sim ilar
percentage increase in the storage life. Gill and Tan (1980) indicated th a t
some differences in the reported effects of C 0 2 on inhibition of aerobic spoilage
probably resu lted from differences in the growth phase of the bacteria a t the
tim e of C 0 2 application.
Oxygen will generally stim u la te the growth of aerobic bacteria and can
inh ib it the growth of strict anaerobic bacteria, although there is a very wide
varia tion in the sensitivity of anaerobes to oxygen (Farber 1991). Greig and
Hoogerheide (1941) dem onstrated th a t the ra te of oxygen consum ption by
Pseudomonas fluorescens in cu ltu re was directly proportional to bacterial
population size. Daun et al. (1971) observed th a t in itial form ation of
m etm yoglobin (discoloration caused by low oxygen tension) was independent
of m icrobial growth, and th a t m icrobial grow th was sim ilar when fresh m eat
w as stored in a ir or in an oxygen-enriched atm osphere. Lopez-Lorenzo et al.
10
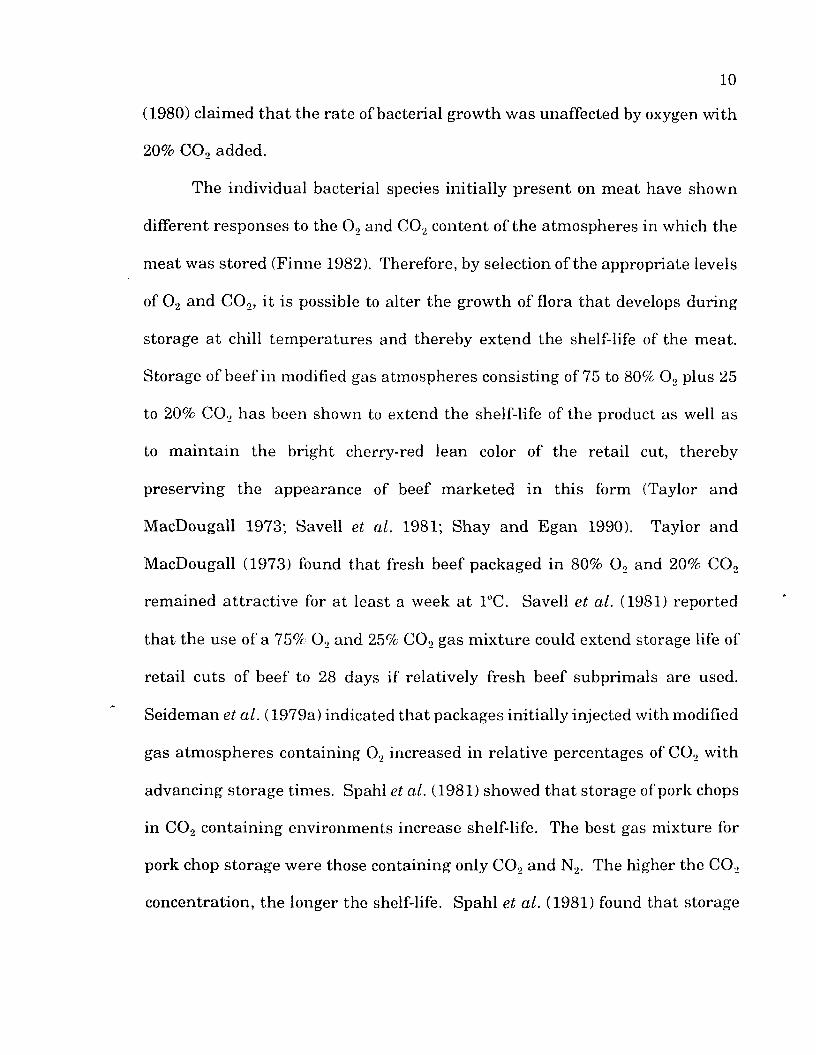
(1980) claim ed th a t the ra te of bacterial grow th was unaffected by oxygen w ith
20% C 0 2 added.
The individual bacterial species in itia lly p resen t on m eat have shown
different responses to the 0 2 and C 0 2 content of the atm ospheres in which the
m eat was stored (Finne 1982). Therefore, by selection of the appropriate levels
of 0 2 and C 0 2, i t is possible to a lter the grow th of flora th a t develops during
storage a t chill tem pera tu res and thereby extend the shelf-life of the m eat.
Storage of beef in modified gas atm ospheres consisting of 75 to 80% 0 2 plus 25
to 20% C 0 2 has been shown to extend the shelf-life of the product as well as
to m ain ta in the brigh t cherry-red lean color of the reta il cut, thereby
preserving the appearance of beef m arketed in th is form (Taylor and
M acDougall 1973; Saveli et al. 1981; Shay and E gan 1990). Taylor and
MacDougall (1973) found th a t fresh beef packaged in 80% 0 2 and 20% C 0 2
rem ained a ttrac tiv e for a t least a week a t 1HC. Saveli et al. (1981) reported
th a t the use of a 75% 0 2 and 25% C 0 2 gas m ix ture could extend storage life of
reta il cuts of beef to 28 days if relatively fresh beef subprim als are used.
Seidem an et al. (1979a) indicated th a t packages in itia lly injected w ith modified
gas atm ospheres containing 0 2 increased in relative percentages of CO., w ith
advancing storage tim es. Spahl et al. (1981) showed th a t storage of pork chops
in C 0 2 containing environm ents increase shelf-life. The best gas m ixture for
pork chop storage were those containing only C 0 2 and N2. The higher the CO.,
concentration, the longer the shelf-life. Spahl et al. (1981) found th a t storage

11
tem perature had an effect on shelf-life, bu t was less significant a t 2" and 5°C
for sam ples packaged in C 0 2 th an in the 0 2 containing sam ples.
2.1.2 Temperature Control
The effect of tem p era tu re on spoilage of fresh m eats stored in a ir is well
recognized. However, evidence suggests th a t tem p era tu re control becomes an
even more im p o rtan t factor in MAP products (Finne, 1982). Daniels et al.
(1985) and Gill (1988) found th a t low tem perature increases CO,, absorption by
m eat because C 0 2 absorption by w ater and oil increases w ith decreased
tem perature. Therefore, C 0 2 concentration in m eat is m uch higher a t low
tem perature. Gill and T an (1979), Baker et al. (1986), and McMullen and
Stiles (1989) reported th a t low tem perature had a synergistic influence to
fu rther reduce m icrobial growth when used in conjunction w ith MAP.
Although C 0 2 inh ib its aerobic organisms, it m ay not in h ib it anaerobic or
facultatively anaerobic organism s, however, low tem p era tu res can control the
growth of these organism s. Genigeorgis (1985) and H in tlian and Hotchkiss
(1986) suggested th a t low tem pera tu re storage is necessary to inh ib it growth
of Clostridium botulinum and insure MAP safety because high concentration
of CO., may allow some anaerobic pathogenic bacteria l growth.
N um erous stud ies have dem onstrated the effect of tem pera tu re on
storage life. C lark and Lentz (1969) reported th a t increasing the storage
tem perature from 5° to 10°C in an atm osphere of 20% CO., in a ir caused a
decrease in storage life from 11 to 6 days. McMullen and Stiles (1989) showed

12
th a t MAP of pork in oxygen-im perm eable foil lam inate and an atm osphere of
40% CO2:60% N2 yielded a storage life of 8, 5, and 2 weeks a t -1", 4.4", and
10°C, respectively.
The types of m icroorganism s in m eat microflora, as well as the ra te of
microbial growth, can vary a t different storage tem peratures. Gill and Newton
(1980) indicated th a t a t -1" and 4.4°C, lactic acid bacteria predom inated as long
as the level of 0 2 was m inim al. However, as 0,2 levels increased to above 2 to
3%, Brochothrix thermosphacta becam e an im portan t com ponent of the
microflora, while a t 10°C E nterobacteriaceae predom inated. S torage a t 10°C
supported an increasing varie ty of m icroorganism growth on m eat, including
potentially pathogenic bacteria. Salmonella spp. and Escherichia coli are two
pathogens of concern on fresh m eats stored a t abusive tem pera tu res. Both
grow equally well under aerobic and anaerobic conditions. M arshall et al.
(1991) concluded th a t proper control of tem perature is essen tia l for slowing the
growth of the pathogen L. monocytogenes, even under modified atm ospheres.
The am ount of purge or drip loss from MAP fresh m ea t also is related
to storage tem pera tu re (Ooraikul and Stiles 1991). Storage a t 0" or 4°C had
little effect on purge volume from vacuum -packaged beef (Z arate and Zaritzky
1985). Increasing the storage tem pera tu re of beef packaged in 100% N2 from
0° to 10°C (O’Keeffe and Hood 1980-1981) or from 0 to 7°C (Sim ard et al. 1985)
significantly increased the am ount of purge.

13
2.1.3 Food Safety and MAP
The g rea test vulnerability of MAP foods from a safety standpoin t is th a t
a pa rticu la r MAP gas composition m ay inh ib it organism s th a t m ight w arn
consum ers of spoilage, while e ither allowing or prom oting the growth of
pathogens w ith tem perature abuse or w ith occurrences of post process
contam ination (Farber 1991). Such a compromise in food safety is due to the
susceptibility of the growth and toxin production of some pathogenic
organism s, especially spore-forming anaerobes such as Clostridium botulinum
(O oraikul and Stiles 1991). The gases used in MAP, especially CCb, re ta rd the
spoilage microorganism s, thus m inim izing competition for clostridia, which are
not affected by C0.2. These conditions m ay allow pathogens to grow and
produce toxin while the food rem ains organoleptically acceptable. The w orst
fate th a t could happen to MAP technology would be an outbreak of botulism
from an apparen tly perfect MAP product (Ooraikul and Stiles 1991).
Modified atm osphere packaging can selectively inh ib it the growth of
aerobic, G ram -negative bacteria, such as Pseudomonas and o ther related
psychrotrophs th a t grow rapidly and produce off-odors and off-flavors in raw
m eat (Gill and T an 1980; Silliker and Wolfe 1980). H in tlian and Hotchkiss
(1987) pointed out th a t facultative anaerobic food pathogens, such as
Staphylococcus aureus and Salmonella spp., grow very slowly, if a t all, a t
proper refrigeration tem perature. S illiker and Wolfe (1980) have shown th a t
MAP and refrigeration tem peratu res do no t encourage the growth of these

14
organism s and th a t MAP may inhibit pathogenic growth entirely. H intlian
and Hotchkiss (1987) also indicated th a t a modified atm osphere containing
75% C 0 2, 15% N2, and 10% O., was the m ost effective in the sim ultaneous
inhibition of Pseudomonas fragi, Salmonella typh im urium , Staphylococcus
aureus, and Clostridium perfringens, com pared w ith atm ospheres having 0, 2,
and 25% 0 2 a t tem pera tu res of 12.8° or 26.7°C. The modified atm osphere
inhibited the growth of S. aureus during abusive tem pera tu re storage and
atm ospheres containing 5 or 10% Q2 inh ib ited the outgrow th of C. perfringens.
Modified atm ospheres were less effective in inhib iting the growth of S.
typhim urium .
Phebus et al. (1991) reported th a t increased C 0 2 concentration inside the
package from 0% to 100% C 0 2 resu lted in a lower ra te of inactivation of
Campylobacter je jun i on turkey roll stored a t 4°C for 18 days and a t 21°C for
48 hours. Increased C 0 2 concentrations provided g rea ter inhibition of aerobic
and psychrotrophic populations, as com pared w ith low C 0 2 levels. The
survival of C. je jun i and growth ra te of aerobic, psychrotrophic, and lactic acid
bacteria was more pronounced in C 0 2 a t 4°C th a n a t 21"C.
M arshall et al. (1991) showed th a t the growth of Pseudomonas
fluorescens was inhibited by MAP to a g rea te r ex ten t th an was the growth of
Listeria monocytogenes in chicken nuggets. Even though L. monocytogenes was
inhibited by MAP, the organism was still capable of growth a t 3°, 7°, and 11°C.
The effectiveness of MAP decreased w ith increasing tem perature .

15
Many concerns have been raised as to the potential growth of
Clostridium botulinum in MAP because C 0 2 does not appear to have a
significant inhibition on C. botulinum. Farber (1991) indicated th a t headspace
composition, pH, w ater activity, preservatives, tem p era tu re and substra te can
greatly influence the ability of nonproteolytic C. botulinum to produce toxin.
Sperber (1982) reported m ea t a t tem peratures of 5.6°, 4.4", and 3.3"C, the times
for C. botulinum (nonproteolytic B) to produce detectable toxin were 27, 33,
and 129 days, respectively. K au lter et al. (1981) found th a t C. botulinum type
E produced toxin in nitrogen-packaged ham burger sandw iches stored a t 12"C
bu t not in those stored a t 8"C.
These studies dem onstra ted th a t potentially dangerous situations can
occur in m eat stored in MAP. The safety of MAP m eat strongly depends on the
appropriate gas mix for a specific product and the m aintenance of properly
controlled tem pera tu res. Prediction of growth of pathogenic organism s under
diverse gas a tm ospheres would help in the design of MAP system s capable of
optimally m ain tain ing product safety and stability.
2.2 Physicochem ical Changes of MAP Meat
The m icroenvironm ent established w ithin conventional MAP m eat
products will change over tim e and, in doing so, will change system param eters
th a t fu rther influence change in the m icroenvironm ent. Thus, the
m icroenvironm ent estab lished w ithin an MAP package becomes a highly
dynamic system. The m ajor physicochemical changes w ith in the MAP fresh
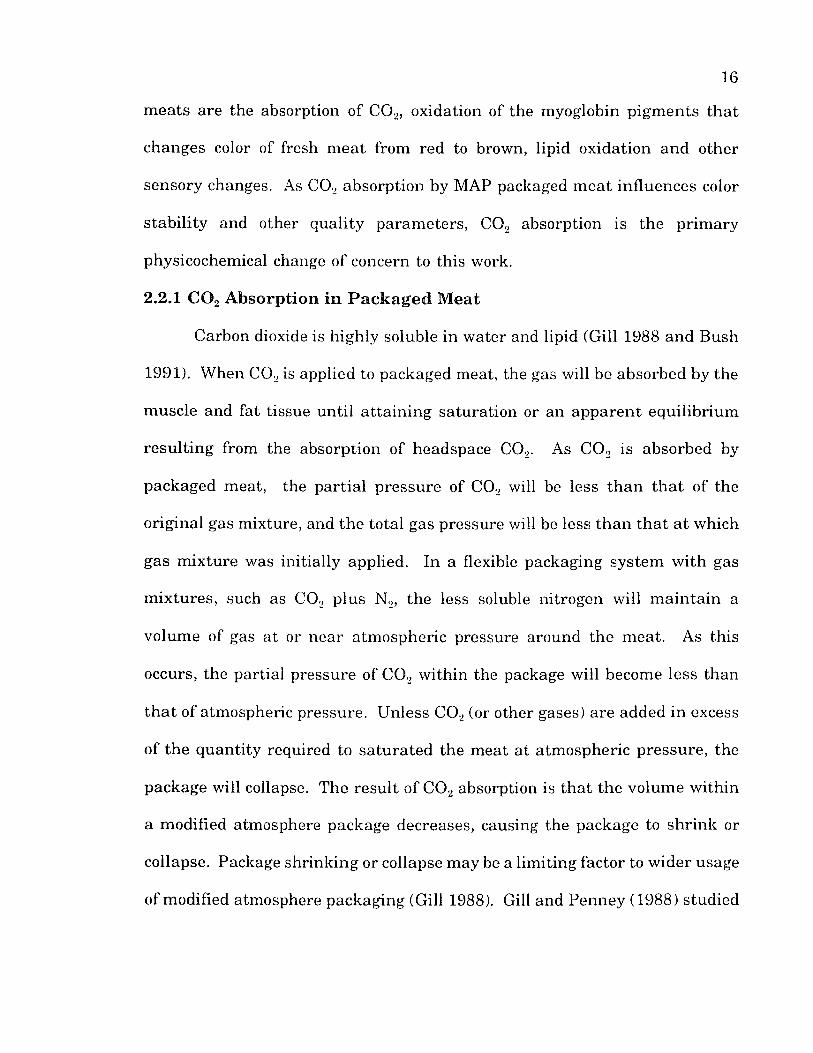
16
m eats are the absorption of C 0 2, oxidation of the myoglobin p igm ents th a t
changes color of fresh m eat from red to brown, lipid oxidation and other
sensory changes. As C 0 2 absorption by MAP packaged m eat influences color
stab ility and other quality param eters, C 0 2 absorption is the p rim ary
physicochemical change of concern to th is work.
2.2.1 C 0 2 Absorption in Packaged Meat
Carbon dioxide is highly soluble in w ater and lipid (Gill 1988 and Bush
1991). W hen C 0 2 is applied to packaged m eat, the gas will be absorbed by the
m uscle and fat tissue un til a tta in in g satu ration or an ap p a ren t equilibrium
resu lting from the absorption of headspace C 0 2. As C 0 2 is absorbed by
packaged m eat, the p a rtia l p ressure of C 0 2 will be less th a n th a t of the
original gas m ixture, and th e to tal gas p ressure will be less th a n th a t a t which
gas m ixture was initially applied. In a flexible packaging system w ith gas
m ix tures, such as C 0 2 plus N2, the less soluble nitrogen will m ain ta in a
volume of gas a t or near atm ospheric pressure around the m eat. As th is
occurs, the partia l pressure of C 0 2 w ithin the package will become less than
th a t of atm ospheric pressure. U nless C 0 2 (or other gases) are added in excess
of the quan tity required to sa tu ra ted the m eat a t atm ospheric p ressu re , the
package will collapse. The resu lt of C 0 2 absorption is th a t the volum e w ithin
a modified atm osphere package decreases, causing the package to sh rink or
collapse. Package shrink ing or collapse m ay be a lim iting factor to w ider usage
of modified atm osphere packaging (Gill 1988). Gill and Penney (1988) studied
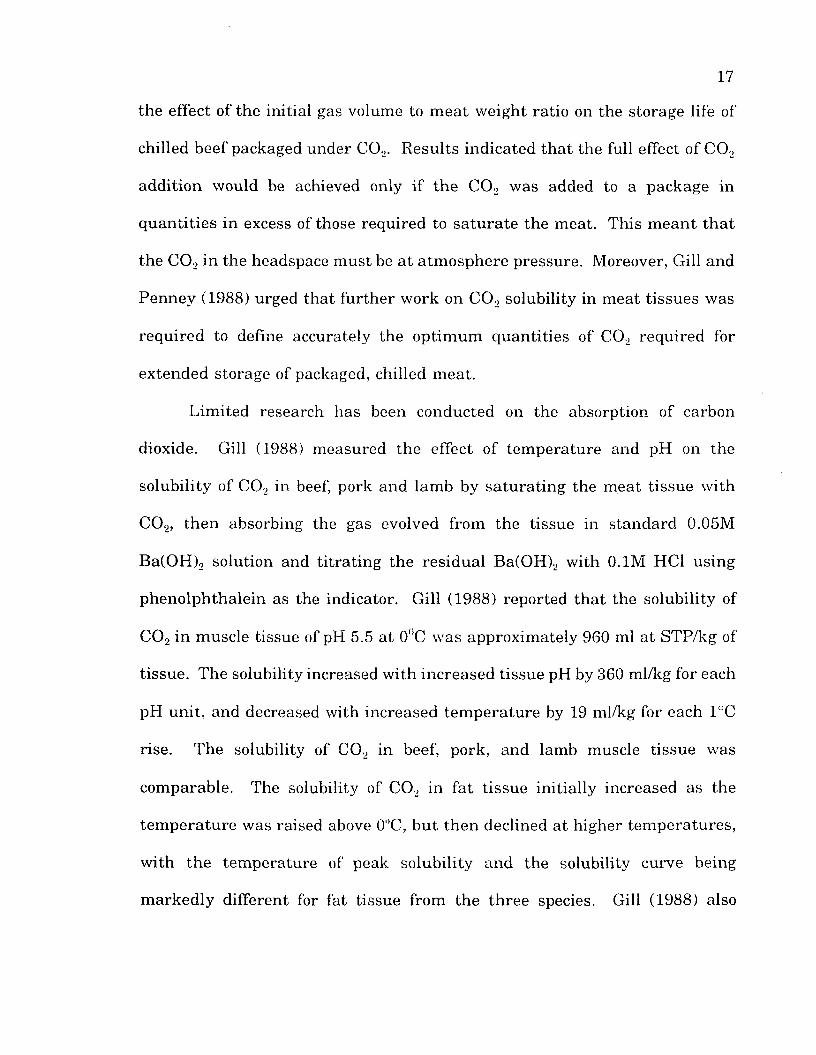
17
the effect of the in itial gas volume to m eat w eight ratio on the storage life of
chilled beef packaged under C 0 2. R esults indicated th a t the full effect of C 0 2
addition would be achieved only if th e C 0 2 was added to a package in
q uan titie s in excess of those required to sa tu ra te the m eat. This m ean t th a t
the CO., in the headspace m ust be a t a tm osphere pressure. Moreover, Gill and
Penney (1988) urged th a t fu rther work on C 0 2 solubility in m eat tissues was
required to define accurately the optim um quan tities of C 0 2 required for
extended storage of packaged, chilled m eat.
L im ited research has been conducted on the absorption of carbon
dioxide. Gill (1988) m easured the effect of tem pera tu re and pH on the
solubility of C 0 2 in beef, pork and lam b by sa tu ra tin g the m eat tissue w ith
C 0 2, th en absorbing the gas evolved from the tissue in standard 0.05M
Ba(OH)2 solution and titra tin g the residual Ba(OH)2 w ith 0.1M HC1 using
phenolph thale in as the indicator. Gill (1988) reported th a t the solubility of
C 0 2 in m uscle tissue of pH 5.5 a t 0°C was approxim ately 960 ml a t STP/kg of
tissue. The solubility increased w ith increased tissue pH by 360 ml/kg for each
pH un it, and decreased w ith increased tem pera tu re by 19 ml/kg for each 1°C
rise. The solubility of C 0 2 in beef, pork, and lam b muscle tissue was
com parable. The solubility of C 0 2 in fa t tissue in itially increased as the
tem p era tu re was raised above 0'’C, b u t th en declined a t higher tem pera tu res,
w ith the tem pera tu re of peak solubility and the solubility curve being
m arkedly different for fat tissue from the th ree species. Gill (1988) also

18
indicated th a t the ra te of CO., absorption was affected by the size and shape
of m eat pieces, the composition of exposed surfaces and the boundary
conditions (e.g., gas p ressure and CO., concentration) th a t existed a t those
surfaces.
The ra te of C 0 2 absorption by m eat will decline w ith decreased
difference in p a rtia l p ressure between the a tm osphere and the surface layers
of the m eat. B ush (1991) reported th a t the absorption diagram (i.e. a plot of
C 0 2 absorption w ith respect to time) of CO., for the m eat could be m easured
using a therm ostatic constant volume or constan t pressure chamber. Bush
(1991) indicated th a t every product has a unique solubility profile for C 0 2.
Bush (1991) reported th a t a whole chicken weighing 800 gram s would absorb
about 1.1 gram s of C 0 2 in eight hours a t equilibrium m ixture of 50% CO., and
50% N2, a 250-gram beef slice absorbed 0.4 gram s of C 0 2 in about six hours,
and th in ham slices required only about 30 m inutes under the sam e conditions
to absorb the sam e am ount of C 0 2.
2.2.2 Color Changes in MAP Meat
M eat color is usually considered the m ost critical appearance factor for
product acceptance, because consumers associate a b righ t red color w ith m eat
of high quality (Taylor 1982). The color of fresh m eats depends on the relative
am ount of th ree forms of myoglobin: deoxymyoglobin, oxymyoglobin, and
metmyoglobin (Fox 1966; O’Keeffe and Hood 1982; F austm an and Cassens
1990). Deoxymyoglobin is the predom inant m uscle p igm ent in the absence of

19
oxygen and produces the characteristic purplish color th a t m ea t exhibits when
first cut. Oxymyoglobin is the oxygenated form of the m uscle p igm ent and is
responsible for the bright red color th a t consum ers expect in re ta il meat.
Metmyoglobin is an undesirable brown color formed in low oxygen tension or
o ther situations causing oxidation of the iron in the p igm ent (Seidem an and
D urland 1984; Young et al. 1988).
Robach and Costilow (1961) noted th a t the m eat surface changed from
red (oxymyoglobin) to brown (metmyoglobin) and then to purple (myoglobin)
w ith increasing aerobic bacterial counts. The aerobic bacteria such as
Pseudomonas geniculata, Pseudomonas aeroginosa, Pseudomonas fluorescens,
and Achromobacte faciens consumed oxygen thereby reducing the oxygen
tensions on the m eat surface, causing discoloration. The facultative anaerobe,
Lactobacillus planterum, however, did not cause th is discoloration. S tringer
et al.(1969) also noted th a t surface discoloration was a function of the num ber
of bacteria on the m eat surface.
One of the m ajor functions of 0 2 in MAP m eats is to m ain ta in myoglobin
in its oxygenated form, oxymyoglobin. At high concentrations of oxygen, very
little deoxygenation and subsequent metmyoglobin form ation will occur due to
the excess of oxygen recom bining w ith myoglobin. R ikert et al. (1958) reported
th a t fresh m eat stored under various partia l p ressu res of oxygen still lost
redness, but th a t high concentrations of oxygen tem porarily delayed
discoloration. No increased benefit was derived from the use of oxygen a t

partia l pressures higher th an th a t of a ir (R ikert et al. 1958). Taylor (1972)
claimed th a t although high concentrations of oxygen prolonged the b righ t red
color of m eat, long term stab ility was not feasible. Bartkow ski et al. (1982)
reported th a t high levels of oxygen (40-75% 0 2) produced and m ain tained a
desirable bright red color of beef cuts for 9 days. However, atm ospheres with
10% 0 2 did not promote or m ain ta in desirable color for the sam e storage
period. Moreover, using gas m ixtures th a t did not contain oxygen increased
surface discoloration of beef cuts as storage tim e increased. Asensio et al.
(1988) found th a t 80% oxygen significantly decreased the ra te of metmyoglobin
form ation and extended the appearance of fresh pork.
Studies on the effect of C 0 2 on m eat color have been contradictory.
Ledw ard (1970) reported th a t m ea t stored in high concentrations of C 0 2 often
developed a grayish-tinge believed to be due to the lowering of the pH and
subsequent precipitation of some of the sarcoplasm ic proteins. In con trast to
Ledward (1970), Taylor (1972) reported th a t 50-80% CO., was often found in
residual headspace in vacuum packages w ith no associated detrim ental effect
on m eat color. Ledward (1970) recom m ended th a t carbon dioxide not be used
in concentrations exceeding 20% because quantities of C 0 2 in excess of 20%
had negligible effect on the form ation of metmyoglobin. Furtherm ore , Ledward
(1970) found th a t no metmyoglobin form ation would occur in atm ospheres
containing high concentration C 0 2 provided th a t oxygen partia l p ressu re was
above a lim iting concentration of 5%. Ordonez and Ledward (1977) indicated
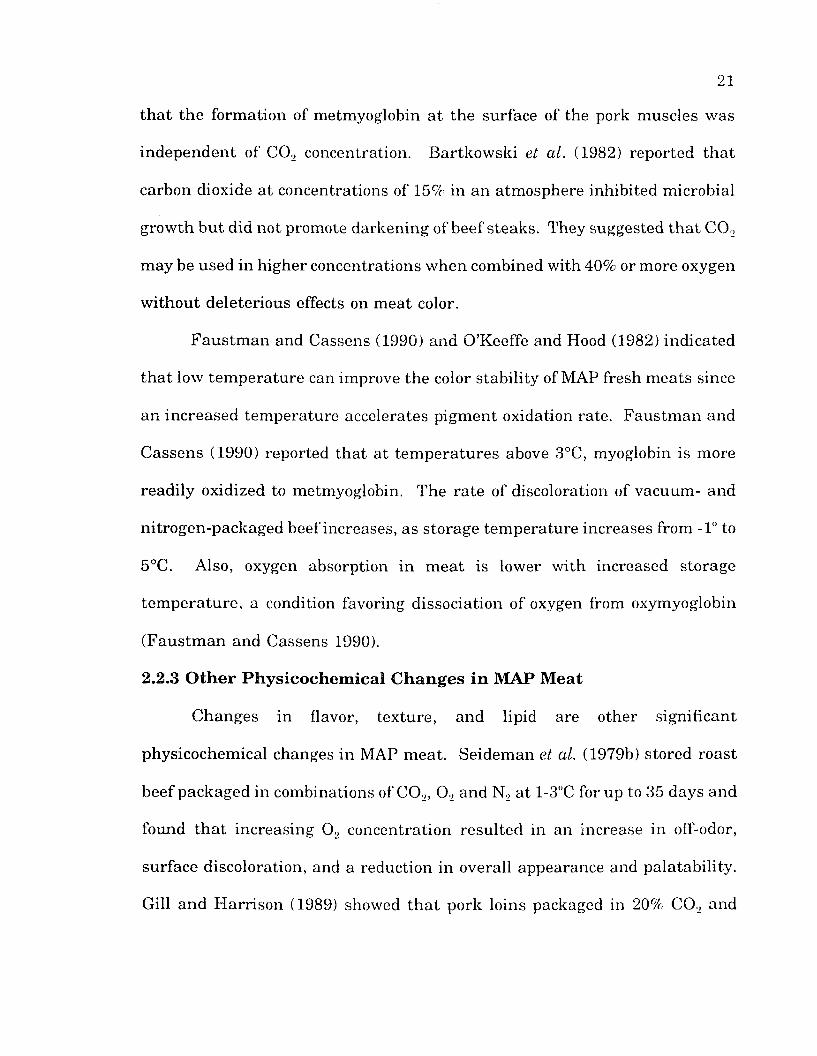
21
th a t the form ation of metmyoglobin a t the surface of the pork m uscles was
independen t of C 0 2 concentration. B artkow ski et al. (1982) reported th a t
carbon dioxide a t concentrations of 15% in an atm osphere inhibited m icrobial
grow th b u t did not promote darkening of beef steaks. They suggested th a t C 0 2
m ay be used in higher concentrations w hen combined w ith 40% or more oxygen
w ithout deleterious effects on m eat color.
F au stm an and Cassens (1990) and O’Keeffe and Hood (1982) indicated
th a t low tem pera tu re can improve the color stab ility of MAP fresh m eats since
an increased tem pera tu re accelerates pigm ent oxidation rate. F austm an and
C assens (1990) reported th a t a t tem p era tu res above 3°C, myoglobin is more
readily oxidized to metmyoglobin. The ra te of discoloration of vacuum - and
nitrogen-packaged beef increases, as storage tem perature increases from -1" to
5°C. Also, oxygen absorption in m eat is lower w ith increased storage
tem pera tu re , a condition favoring dissociation of oxygen from oxymyoglobin
(F austm an and Cassens 1990).
2.2.3 Other Physicochem ical Changes in MAP Meat
C hanges in flavor, texture, and lipid are other significant
physicochemical changes in MAP m eat. Seidem an et al. (1979b) stored roast
beef packaged in combinations of C 0 2, 0 2 and N._, a t 1-3"C for up to 35 days and
found th a t increasing 0 2 concentration resu lted in an increase in off-odor,
surface discoloration, and a reduction in overall appearance and palatability .
Gill and H arrison (1989) showed th a t pork loins packaged in 20% C 0 2 and

2 2
stored a t -1.5°C was little affected in eating qua lity for about 18 weeks, but
prolonged storage resu lted in loss of color due to loss of myoglobin in the
exudate. S im ard et al. (1985) obtained an im proved shelf life of beef by
packaging in an N2 atm osphere while also re ta rd in g discoloration and
m inim izing exudate losses. McMullen and S tiles (1989) reported th a t
commercially produced processed m eat and ro ast beef sandw iches packaged in
50% C 0 2 and 50% a ir and stored a t 4"C were judged acceptable up to 35 days.
They found th a t cooked ham burgers, sim ilarly packaged and stored, were
acceptable up to 14 days, and up to 35 days if packaged w ithout 0 2. Hwang
et al. (1990) reported th a t modified atm osphere of frozen stored cooked beef
m arkedly im proved flavor and aroma. Exclusion of oxygen by vacuum and
N2/C 0 2 packaging prevented formation of u n p leasan t off-flavors and had little
adverse effect on color and tex tural properties of cooked beef slices. Sensory
evaluation, TBA test, and aldehyde m easurem ent by gas chrom atography were
all effective in detecting the warmed-over flavor of stored, packaged, precooked
beef. Fu et al. (1992) also indicated th a t modified atm ospheres were more
effective th a n a ir in prolonging shelf-life of beef steaks a t 2-4°C. Purge loss
was reduced by packaging beef steaks in gas m ix tu res 10% 0 2, 20-40% C 0 2
instead of vacuum , cooking yield was higher th a n in vacuum -packaged steaks.
A lthough it m ight be though th a t oxygen enrichm ent m ight increase the
ra te of lipid oxidation in MAP m eat, Ordonez and Ledw ard (1977) found th a t
oxidative changes progress a t sim ilar ra tes in fresh pork slices stored a t 1"C

in e ither a ir or gas m ixtures containing 80-100% 0 2. Ordonez and Ledward
(1977) suggested th a t storage in suitable O./CO, m ixtures could m ake lipid
oxidation the factor lim iting shelf life. Ordonez and Ledw ard (1977) fu rther
reported th a t on pork slices, storage in 20% C 0 2 greatly depresses the ra te of
lipid oxidation, extending th e storage tim e required to reach a TBA value of 5
from 5 to about 12 days. Also, Asensio et al. (1988) indicated th a t lipid
oxidation was not the lim iting factor of shelf life in oxygen-enriched
atm osphere. However, Lopez-Lorenzo et al. (1980) indicated th a t there was no
obvious explanation for the protection by C 0 2 against lipid oxidation and th a t
the phenomenon deserved fu rth e r investigation.
2.3 Predictive Models for MAP Headspace Gas Behavior
Headspace gas composition of MAP m eat changes continually during
storage because of packaging film perm eability, gas absorption by meat,
m icroorganism growth, m eat pigm ent oxidation, lipid oxidation and m eat
respiration. As a resu lt of these processes, the oxygen and carbon dioxide
concentration w ithin a MAP m icroenvironm ent are continually changing.
M aintaining proper balances of C 0 2 and 0 2 levels in the headspace of MAP
m eat is essential to extend shelf life. M athem atical models to describe and
predict dynamic behavior of headspace gases for various MAP fruits and
vegetables have been developed, based on the knowledge of the interaction
between headspace gases and package perm eability (O oraikul and Stiles 1991).
Such models are able to pred ict the equilibrium conditions inside the package

24
and th e length of time to achieve equilibrium , based on tem pera tu re , in itial
gas composition, and package geometry.
Models for prediction of headspace gas concentrations in MAP system s
for fru its and vegetables have been developed using Fick’s Law of Diffusion to
predict the rates a t which the gases diffuse through the commodities or
perm eate through packaging films. Zagory and K ader (1988) suggested th a t
in order to predict equilibrium conditions in headspace, a model should take
into account a t least: 1) the effects of changing 0 2 and C 0 2 concentrations; 2)
the perm eability of the film to 0 2 and C 0 2; 3) the effect of tem pera tu re on film
perm eability; 4) the surface a rea and headspace of the package; 5) the
resistance of the commodity to diffusion of gases through it; and 6) the optim al
atm osphere for the commodity of in te rest. In addition, in order to be of
m axim um utility , a model should recognize when certain concentrations are
deleterious to the commodity and if they are likely to be reached before or
during equilibrium . Henig and G ilbert (1975) utilized a com puter model to
pred ict steady sta te gas concentrations in packaged tom atoes where oxygen
was consum ed and carbon dioxide produced. Deily and Rizvi (1981) developed
a model for peaches and found the film perm eability necessary to achieve a
p redeterm ined headspace atm osphere based on peach resp ira tion values.
O ther work in this area has been conducted by H ayakaw a et al. (1975), Henig
(1975), K ader et al. (1989), and A ndrich et al. (1989).

U nfortunately , models analogous to those for fru its and vegetables are
still lacking for MAP m eat. Furtherm ore, there is little research reported in
the lite ra tu re on the interactions am ong m eat, gas atm osphere, and packaging
film. Prediction of the dynamic behavior of headspace gases in MAP m eat
m ight be linked w ith m easurable aspects of the m eat product characteristics,
packaging configuration, and storage conditions.
2.3.1 Effect o f Product Characteristics on Headspace Gases
Several biological factors influence the dynam ic behavior of headspace
gases. These factors include m eat composition, pH, and m eat respiration. Gill
(1988) and Enfors and Molin (1984) reported th a t m oisture content, fat content
and pH of m eat greatly affected C 0 2 and 0 2 absorption in m eat, as well as C 0 2
evolution from m eat. Gill (1988) found fa t tissue of beef, pork and lam b had
different C 0 2 absorption characteristics from muscle tissue, and C 0 2
absorption in muscle tissue increased w ith increased pH value.
F resh m eat has significant m etabolic activity as active m itochondrial
consum ption of oxygen continues in postm ortem muscle (Sebranek 1986).
M easurem ent of 0 2 consum ption and re su lta n t C 0 2 evolution has
dem onstrated a rapid in itial up take of oxygen after packaging followed by a
relatively steady s ta te for about six days storage of fresh beef muscle (D aun et
al. 1971). After six to seven days, 0 2 up take again increased and C 0 2
evolution also began to increase after e ight to nine days. The in itial increase
after packaging appeared to be due to tissue u tilization of oxygen while the

26
second increase corresponded to microbial growth. Oxygen uptake by muscle
includes absorption into tissue fluids beside reactions w ith heme protein and
m itochondria consum ption (Sebranek 1986). The 0 2 up take and C 0 2 evolution
caused by m eat resp ira tion also resulted in headspace 0 2 and C 0 2 composition
changes during storage.
2.3.2 Effect of Packaging and Storage Conditions on Headspace Gases
Perm eability of package film, headspace volum e of a package, storage
tem perature, and in itia l gas composition are significant packaging and storage
factors th a t contribute to dynamic behavior of headspace gases. Once a gas
atm osphere has been applied to a MAP package, the level and proportion of the
headspace gases can be controlled by judicious selection of packaging m aterial
with specified perm eability characteristics (O oraikul and Stiles 1991).
Sebranek (1986) indicated th a t perm eability of packaging m ateria l is often the
predom inant factor d ictating atm ospheric conditions in the headspace during
storage and u ltim ately influencing the shelf life of a product. Gas perm eation
and diffusion across packaging films can determ ine the ra te s of change in
proportion of MAP gases. Newton and Rigg (1979) and Newton et al. (1977)
suggested th a t for re ta il cuts of fresh meat, w here reten tion of bright red color
was desired, packages w ith high oxygen transm ission ra te s should be used.
However, for cuts of m eat where extended storage life is the prim ary concern,
packages w ith low gas transm ission ra tes should be used. Ooraikul and Stiles
(1991) indicated th a t w hen assessing inform ation on the efficacy of MAP for

27
m eat, developments in gas-im perm eable packages m ust be tak en into account.
Foil lam inates can exclude v irtually all perm eation of gases, bu t the product
is not visible to the consum er. T ransparen t plastic film s w ith very low gas
transm ission rates have been developed (Ooraikul and Stiles 1991).
Storage tem pera tu re and in itia l gas composition de te rm ine the types of
microorganism s predom inating m eat microflora and the ra te of microbial
growth (Farber 1991). M oreover, extensive research has been conducted on the
effect of tem perature and in itia l gas composition on headspace gas composition
changes during storage (Seidem an et al. 1979; Spahl et al. 1981; Laleye et al.
1984; Lam bert et al. 1991; Jackson et al. 1992). Seidem an et al. (1979)
reported th a t w ith a in itia l 100% 0 2 packaged fresh beef, C 0 2 concentration
increased to 73% and O., decreased to 3.6% in 35 days of storage a t 1-3"C.
McMullen et al. (1991) and Jackson et al. (1992) showed th a t packages initially
containing 50-60% C 0 2 and 50-40% N., exhibited decrease in C 0 2 concentration
and increase in 0., and N._, during 2 to 3 weeks storage a t 3 to 7"C. Seidem an
et al. (1979), Laleye et al. (1984), Lam bert et al. (1991), and Jackson et al.
(1992) indicated th a t the headspace of a package in itia lly contain ing 0-20%
C 0 2 and 100-80% N2 showed a significant increase in C 0 2 concentration during
sam e storage conditions. Furtherm ore, Lam bert et al. (1991) and F u et al.
(1992) reported th a t a high tem perature accelerated the headspace gas
composition changes du ring storage. Sebranek (1986) concluded th a t

28
tem pera tu re and initial gas composition played a significant role in headspace
C 0 2 and O., concentration changes du ring storage.
Developm ent of m athem atical rela tionsh ips to describe C 0 2 headspace
behavior in relation to product characteristics, packaging/product and storage
conditions would be of value in estab lish ing analytical design criteria for MAP
packaged m eat products.
2.4 M athematical Structure for M odeling Microbial Growth Rate
M athem atical models for m icrobial growth have been used to describe
the population behavior of m icroorganism s w ith respect to different physical
and chemical conditions, such as tem pera tu re , pH, and w ater activity
(Broughall et al. 1983; Broughall and Brown 1984; B uchanan and Phillips
1990; Buchanan 1991; C handler and McMeekin 1989a, b; Davey 1989;
M cM eekin et al. 1987; Ratkowsky et al. 1982, 1983; Roberts 1989; T hayer et al.
1987). M athem atical models can be used to predict microbial safety or shelf
life of products, to find critical points in the process, and to optim ize a
production/distribution chain (B aird -P arker and Kilsby 1987). Most
researchers have focused on developing m athem atical descriptions to predict
the effects of tem perature and o ther environm ental variables, such as w ater
activity and pH, on the tim e-dependent grow th of bacterial populations (Zhao
et al. 1992). Roberts (1989) and T hayer et al. (1987) proposed polynomial
models to describe microbial population growth rate coefficients w ith
tem pera tu re , w ater activity, pH, and level of added preservatives. Polynomial

29
models have a lim ited basis, but m ight be viewed as a Taylor’s series
approxim ation to a true underlying theoretical function (Roberts 1989). The
results of polynomial models rem ain unique to the product/storage condition
com binations for which the regression coefficients were determ ined and are
useful to only the range of the experim ental param eters. Ratkowsky et al.
(1982) proposed a linear relationship betw een the square root of the population
growth ra te coefficient and the absolute tem perature . McMeekin et al. (1987)
fu rther modified th is model to describe the combined effect of tem perature and
w ater activ ity on the population growth ra te coefficient.
M athem atical relationships based on linear combinations, non-linear
expressions and variations of the A rrhenius relationship have been proposed
(Broughall et al. 1983; Chandler and M cM eekin 1989a, b; Davey 1989).
Schoolfield et al. (1981) proposed a nonlinear A rrhenius type of model,
describing the specific growth rate as a function of tem perature over the whole
biokinetic tem p era tu re range. Broughall et al. (1983) adapted this non-linear
A rrhenius equation as the basis for a two- and three-dim ensional model
combining tem pera tu re , w ater activity and pH to predict the bacterial growth
param eters of the both the lag and log phases. A model for combined
tem p era tu re and w ater activity based on a modified and additive A rrhenius
equation was investigated by Davey (1989). This model presented a simple,
yet significant relationship, th a t perm itted prediction of microorganism
population growth ra te coefficient, given the tem pera tu re and w ater activity
30
of a particu la r substra te . U nfortunately, all the models m entioned above
involved products packaged in air. No attem pts have been m ade to include
modified atm osphere conditions in the param eters associating w ith these
models.
After considering significant lite ra tu re in the field of modified
atm osphere packaging for m eat, it is evident th a t fu tu re research is required
in the following areas: 1) establishm ent of a methodology to study behavior of
headspace gases, particu larly CO., behavior; 2) identification of the significant
factors influencing C0.2 behavior; and 3) developm ent of a m athem atical
struc tu re suitable for modeling microbial growth ra te in MAP system s.

III. THEORETICAL CONSIDERATION
The objective of th is chap ter is to derive a generalized m ethod to study
dynamic behavior of headspace gases, and to fu rther u n ders tand how the
in itial MAP m icroenvironm ent is modified over time. Additionally, the basis
for a microbial growth ra te model th a t includes MAP conditions is presented.
3.1 Derivation of Model for M easuring C 02 Absorption
A combined analytical and experim ental method is developed to estim ate
C 0 2 absorption in MAP packaged m eats. The ideal gas law is used to calculate
CO., absorption by m onitoring p ressure changes in a therm ostatic and constant
volume chamber. The m ethod allows CO., absorption to be calculated under
various MAP conditions.
3.1.1 The Ideal Gas Law
The ideal gas law can be sta ted as:
P V = n R mT <3-D
where P is absolute gas p ressure (N /n r or Pa), V is the gas volume (m'!), n is
the mole num ber of gases (mole), T is absolute tem pera tu re of gas (K), and Rm
is universal gas constant (8.3144 J/mol-K).
U nder norm al tem p era tu re and pressure conditions, the ideal gas law
can be used to describe the behavior of 0.,, CO,, and N2 (Toledo 1991). For a
gas m ixture, Dalton’s law of partia l p ressure and A m agat’s law of partial
volume describe the re la tionsh ip betw een total pressure and volume of gas
31

m ixture. The partia l pressure and p a rtia l volume of each individual gas can
be expressed respectively as:
P = E P , a n d V=EV, <3.2)
w here P and V are total pressure and volume of gas m ixture, respectively, and
Pj and Vj are partia l pressure and volume of component i, respectively.
Therefore, the ideal gas law can be used on the partial p ressure of each
com ponent to determ ine the num ber of moles of th a t component in the
m ixture. The partial pressure of a com ponent gas is related to the com ponent
am ount in a gas m ixture by:
P iV =niR T (3.3)
w here n.j is the mole num ber of com ponent i.
3.1.2 Estim ation of C 02 Absorption
Using the ideal gas law as a theoretical basis, an analytical derivation
for the m easurem ent of C 0 2 absorption follows. Furtherm ore, conditions
imposed by use of the ideal gas law define the experim ental constra in ts for
utilizing the method for CO., absorption m easurem ent. Thus a combined
analy tical and experim ental m ethod is suggested to investigate the CO.,
absorption in packaged m eat.
Consider a sealed (gas-im perm eable), therm ostatic (isotherm al), and
constan t volume chamber, as shown in Fig. 3.1. Into the cham ber, introduce
the product under exam ination and various mixes of CO., and N,,, m ain tain ing

33
TV
Figure 3.1
i -
c o n s t .c o n s t .f ( t )
Gas = C02+N2
CO 2<:
Gas , mois ture
c h a n g e = 0
An im itative therm ostatic, constan t volume, and gas im perm eable system used for CO., absorption calculation.

34
the product tem pera tu re constant. The partia l p ressure of the gas m ixture
w ithin the constant volume cham ber can be described based on Eq. (3.3) such
that:
Pc02TPN2~—J!h-(nC02*nN2)
or
_(Pco2*Pn2>I/ „ a mn C0 2 D rn NZ
K m1
where P(:()2 and P N2 are the pa rtia l pressure of C 0 2 and N.,, respectively (N/m2
or Pa), and n (;()2 and n N2 are the am ounts of gaseous C 0 2 and N2 within
cham ber, respectively (mole). Because the sum of individual pa rtia l pressures
of a gas mix equals the total p ressure (Dalton’s law of p a rtia l pressure), Eq.
(3.5) can be rew ritten as:
VP (o C\n C0 2 ~ D „ n N2 ( o . o )
Km1
such th a t changes of C 0 2 (nl ()2) are functionally re la ted to changes in total
pressure (P) and the am oun t of nitrogen (nN2) for a constan t volume and
constant tem pera tu re system .
Since nitrogen is an in e rt gas and less soluble in m ea t compared with
C 0 2, the num ber of moles of nitrogen will rem ain constan t w ith in the package
(Taylor 1972; Seidem an 1978; F arber 1991). Given the assum ption th a t

35
dnN2/d t= 0I, the time dependent variables are absolute p ressu re of gas m ixture
w ith in cham ber and moles of gaseous C 0 2 (n(;02). D ifferentiating Eq.(3.6) w ith
respect to tim e t, the ra te of C 0 2 change w ithin package can be calculated from
the p ressure change:
dJlco2 V dP ( 3 7 )
d t RmT dt
T h at is the pressure loss w ith in a constant volume, constan t tem pera tu re
cham ber resu lts from C 0 2 being absorbed into the m eat. Given th a t total gas
volume occupied in the cham ber is constant, and assum ing the tem pera tu re
w ith in the cham ber rem ains uniform and no gas perm eates th rough the
cham ber wall, the am ount of C 0 2 absorption can be calculated by solving Eq.
(3.7). Solving this differential equation, the am ount of C 0 2 rem ain ing w ithin
cham ber (package) a t tim e t is:
n cosfc0~n co2fo~®) z ~ r , ( £ o ~ . P ( 0 ) ( 3 . 8 )K m 1
w here nCO2(t=0) and nC02(t) a re am ounts of gaseous C 0 2 w ith in cham ber a t the
in itia l tim e and tim e t, respectively (mole), and P0 and P(t) a re absolute
p ressu re of cham ber headspace a t the in itial tim e and tim e t, respectively
(N/m2 or Pa).
Therefore, the am ount of C 0 2 in various isotherm al and constan t volume
conditions can be calculated from m easured values of absolute p ressure using
‘This assum ption will be la te r confirmed in th is work.

36
Eq. (3.8). The present study is concerned w ith the absolute am ount of C 0 2
absorbed by packaged m eat during a specified period of time. Therefore, the
term "C 02 absorption" will be used as a gross m easure of C 0 2 absorbed per
u n it m ass of meat. O ther researchers have chosen the terminology "CO.,
solubility" to express a sim ilar concept (Gill 1988). The C 0 2 absorption in
packaged m eats can be calculated as:
A c02(t)= /W , t=Q)~ ' W t) (3.9)
w here Aro.,(t) is CO., absorption in packaged m eats a t time t (molr()2/kgniullt), and
Mm is am ount of m eat product in the package (kg).
A lternately, the units of C 0 2 absorption can be expressed as goo^gmeut
by m ultiplying by the molecular weight of CO., (44 g/mola ,2).
(3.10)A co2(t)feco/^m «ai) =44 *ACO2(0(/noZco/Agmsat)
Combining Eqs. (3.8), (3.9), and (3.10), Af.().,(t) is finally expressed as:
A A 4c XT’A c o 2 ® ( S c o ^ ^ t> 1 — ^ l P o - m } <3.11)
H ml M. m
Therefore, by m easuring headspace gas pressure change during a known
duration , the headspace CO., changes caused by absorption or evolution by
packaged m eat can be calculated from Eq. (3.11). An uncertain ty analysis of
Eq. (3.11) is given in Appendix A. The tim e selected for CO., absorption

37
estim ation in present study is 12 hrs. The concept of A<;02(t=12) is presented
in Appendix B.
3.1.3 Estim ation of Final COa Concentration in Headspace
Since the volume percentage of C 0 2 and N2 is equal to mole percentage
of C 0 2 and N2, the volume percentage of C 0 2 can be calculated as:
where [N 2]r is the calculated final volume percentage of N 2, and the in itial N 2
pressure P N2j can be calculated by m easured in itial N 2 volume percentage and
in itial total headspace gas pressure P0. Sim ilarly, final calculated volume
percentage for C 0 2, [C 0 2]f can be calculated from
where P C02i is initial pa rtia l pressure of C 0 2 (N/m2 or Pa) th a t calculated by
m easured initial C 0 2 volume percentage and in itial total headspace gas
pressure P0, AP=P0-Pf, is headspace gas pressure change (N/m2 or Pa) w ith P0
(3.12)
Since nN2(=nN2j, and from D alton’s law:
(3.13)
Combining Eq. (3.12) and (3.13) will yield:
(3.14)
(3.15)

38
and P f indicated as the m easured in itial and final total headspace absolute gas
pressure, respectively (N/m2 or Pa), and n N2r and nC02f are final am ounts of N 2
and C 0 2 in headspace, respectively (mole). Eqs. (14) and (15) are used to
calculate the volume percentages of N2 and C 0 2, respectively, for comparison
of resu lts predicted by the pressure m easurem ent m ethod and those observed
using a gas analyzer.
3.2 M odeling Dynamic Behavior of Headspace Gases
For the purpose of th is dissertation, the term "packaging configuration"
refers to the collection of packaging/product param eters, including package
headspace-to-m eat volume ratio, and surface a rea and volume of m eat sample.
The term "storage conditions" refer to the storage tem pera tu re , in itia l gas
composition, and in itial gas pressure. Identification of significant effects of the
packaging configuration and storage condition on C 0 2 absorption was a
p rim ary objective of th is work.
The m ajor physical param eters of the packaging configuration for MAP
products include m eat volume (as related to sam ple m ass by the product
density), surface area of m eat sample, and headspace gas volume. The storage
conditions for MAP products include storage tem pera tu re , headspace gas
composition, and in itial gas pressure. Therefore, a general description for C 0 2
absorption can be related to packaging configuration and storage conditions as:

39
A co^ K V H,V m,S m,T ,H ilP ) (3.16)
where VH and Vm are the volume of headspace and m eat sam ple, respectively
(liter), Sm is surface area of m eat sample (cm2), Hj is in itial headspace gas
composition (%), T is tem perature (K), and P is absolute pressure of headspace
gases (N/m2).
The ratio of headspace-to-m eat volume is a more im portan t param eter
than e ither VH or Vin by itse lf in a package because th is ratio determ ines the
extent of the headspace atm osphere modification occurring relative to the
am ount of m eat (Taylor and MacDougall 1973). Since the C 0 2 absorption is
a surface phenomenon, after which C 0 2 is consumed and/or transported inside
of m eat tissue, the m eat surface area is assum ed to be an im portan t factor for
C 0 2 absorption. As discussed in the previous lite ra tu re (section 2.1.2),
tem pera tu re directly affects C 0 2 absorption, bu t the individual or in teractive
role of in itia l gas composition and tem pera tu re on C 0 2 absorption is unknown.
To investigate the influence of packaging/product configuration on C 0 2
absorption, a series of experim ents can be conducted to m onitor te s t cham ber
conditions (packages) with different packaging/product configurations, while
storage conditions including tem perature, in itial gas composition and in itial
headspace gas pressure are m aintained the same. Therefore, P, T, and Hj are
constant in Eq. (3.16), and Eq. (3.16) can be rew ritten as:

40
A c02(.thfiV H,V m,S m) (3.17)
Using experim ental data, a statistical regression procedure can be used
to te s t w hether headspace volume (VH), m eat volume (Vm), and surface a rea of
m eat sam ple (Sm) is significantly related to C 0 2 absorption and/or w hether
there is any interaction am ong these packaging/product param eters.
Furtherm ore, in order to investigate the effect of storage conditions on
C 0 2 absorption, a series of expei'iments can be conducted considering different
storage tem perature and in itial gas compositions while m ain tain ing the same
packaging/product configuration. Thus, Eq. (3.16) becomes:
A c02( th H T ,H i) (3.18)
A sim ilar regression procedure as used for Eq. (3.17) can be used for Eq. (3.18)
to establish the significance of storage tem pera tu re and in itial gas composition
on C 0 2 absorption in packaged m eat. The knowledge gained rela ting C 0 2
absorption with packaging/product configuration and storage conditions would
provide a fundam ental basis for la ter development of predictive models for the
optim al design of MAP m eat systems.
3.3 Modeling' Influence of MAP on Microbial Growth
Although previous research has developed various m athem atical models
th a t describe the effect of environm ental param eters such as tem pera tu re , pH,
and w ater activity on the growth of microorganism s, none has rela ted gas
composition and microbial population growth rate . This work a ttem pts to

41
include gas composition as an independent variable in a model for the growth
of microorganisms. The m athem atical descriptions of m icrobial growth under
different in itia l gas atm osphere and storage tem pera tu re are postulated.
3.3.1 Microbial Population Growth in Log (Growth) Phase
The growth curves of microbial populations can be described in four
phases: 1) an in itial period where no growth occurs (lag phase), 2) followed by
a period of accelerating growth (log phase), 3) a period of decelerating growth,
and 4) a sta tionary period. The log (growth) phase of m any m icroorganism can
be estim ated by an exponential equation2 (Davey 1989):
N (t) =N0*axp(kt) (3.19)
where t is tim e (day), k is the population growth ra te coefficient for a given set
of constant conditions (e.g., tem perature , hum idity, pH, w ater activity, and gas
composition) (1/day), N0 is in itia l num ber of m icroorganism s a t the beginning
of log phase growth (log]0CFU/g), and N(t) is num ber of m icroorganism s a t
tim e t (log10CFU/g).
The population growth ra te coefficient k is usually determ ined by
observing the generation tim e G during log phase growth using the
relationship:
2An alternative microbial population growth model for all phases of microbial growth is given by the Gompertz model. The Gompertz equation has been used to describe the growth curve of foodbrone m icroorganism s (Gibson et al. 1988; B uchanan and Phillips 1990; Buchanan 1991; Palum bo et al. 1991).
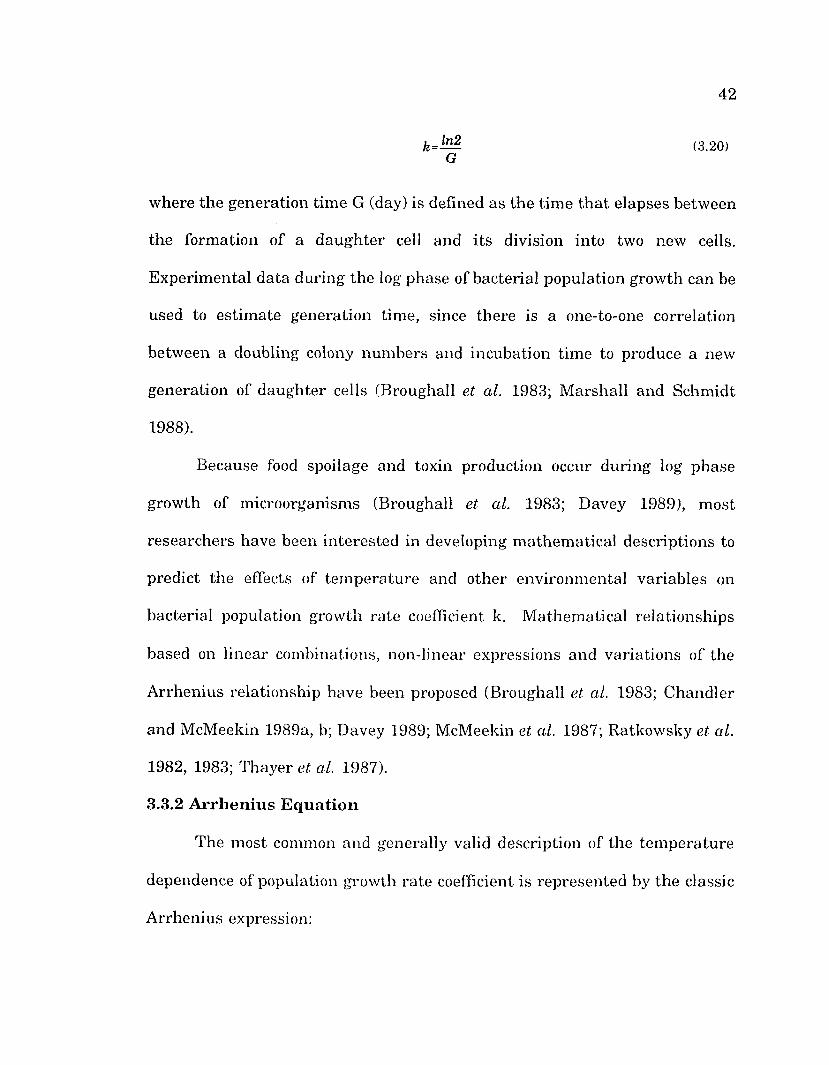
42
Aj= M ( 3 . 2 0 )G
where the generation tim e G (day) is defined as the tim e th a t elapses between
the form ation of a daugh ter cell and its division into two new cells.
Experim ental data during the log phase of bacterial population growth can be
used to estim ate generation time, since there is a one-to-one correlation
between a doubling colony num bers and incubation tim e to produce a new
generation of daughter cells (Broughall et al. 1983; M arshall and Schm idt
1988).
Because food spoilage and toxin production occur during log phase
growth of m icroorganism s (Broughall et al. 1983; Davey 1989), m ost
researchers have been in terested in developing m athem atical descriptions to
predict the effects of tem pera tu re and other environm ental variables on
bacterial population growth ra te coefficient k. M athem atical relationships
based on linear combinations, non-linear expressions and variations of the
A rrhenius relationship have been proposed (Broughall et al. 1983; C handler
and McMeekin 1989a, b; Davey 1989; McMeekin et al. 1987; Ratkowsky et al.
1982, 1983; Thayer et al. 1987).
3.3.2 Arrhenius Equation
The most common and generally valid description of the tem perature
dependence of population growth rate coefficient is represented by the classic
A rrhenius expression:
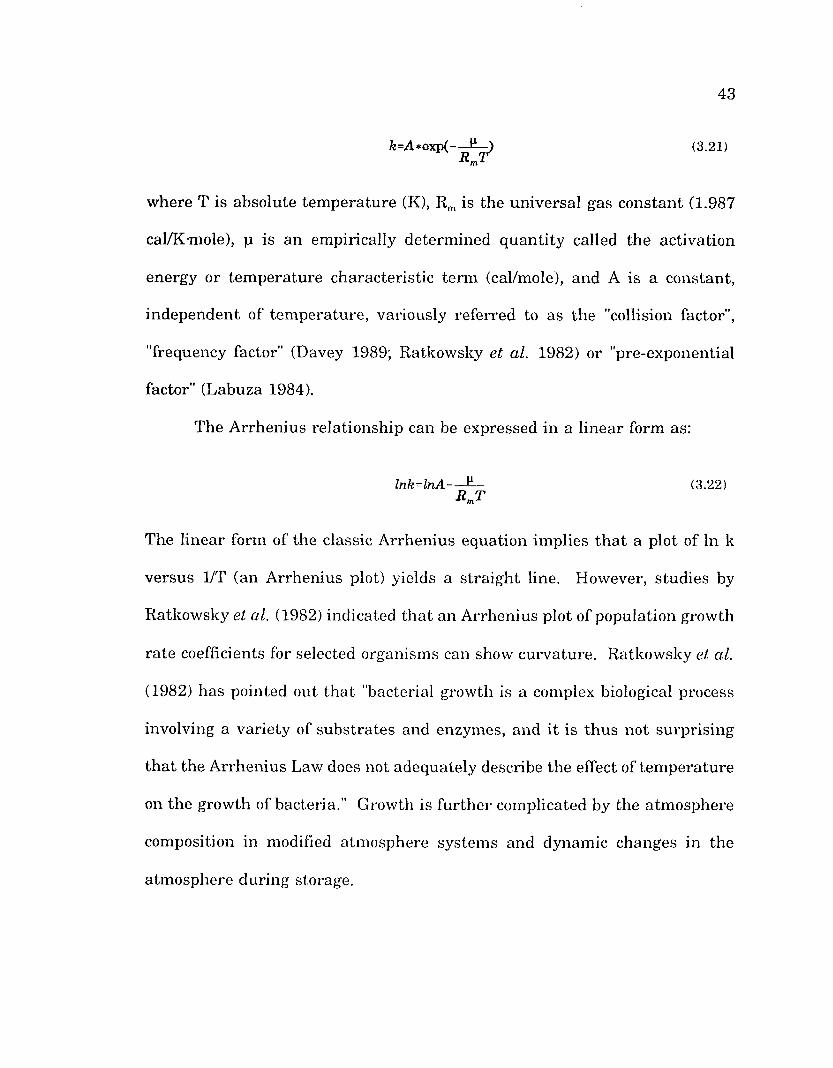
43
fe=A*exp( £ —) (3.21)RmT
w here T is absolute tem pera tu re (K), Rm is the universal gas constant (1.987
cal/Kmole), p is an empirically determ ined quan tity called the activation
energy or tem perature characteristic term (cal/mole), and A is a constant,
independent of tem perature , variously referred to as the "collision factor",
"frequency factor" (Davey 1989; Ratkowsky et al. 1982) or "pre-exponential
factor" (Labuza 1984).
The A rrhenius relationship can be expressed in a linear form as:
In k - ln A — (3.22)RmT
The linear form of the classic A rrhenius equation im plies th a t a plot of In k
versus 1/T (an A rrhenius plot) yields a stra igh t line. However, studies by
Ratkowsky et al. (1982) indicated th a t an A rrhenius plot of population growth
ra te coefficients for selected organism s can show curvature. Ratkow sky et al.
(1982) has pointed out th a t "bacterial growth is a complex biological process
involving a variety of substra tes and enzymes, and it is thus not surprising
th a t the A rrhenius Law does not adequately describe the effect of tem pera tu re
on the growth of bacteria .” Growth is fu rth er complicated by the atm osphere
composition in modified atm osphere system s and dynamic changes in the
atm osphere during storage.

44
3.3.3 Microbial Population Growth Rate Coefficient Models
Modifications of the classic A rrhenius equation can be proposed for
e ither the collision factor term or the tem pera tu re characteristic term , or both
depending on the specific situation. In the curren t research, two m athem atical
models were suggested to describe the combined effects of tem pera tu re and
in itial gas composition of modified atm osphere packaging on the population
growth ra te coefficient of selected organisms. The first model was based on the
modification of collision factor term , and the second one was based on the
modification of the tem pera tu re characteristic term in the classic A rrhenius
equation.
S tatistical analysis (F-test) of the experim ental d a ta from M arshall et
al. (1991) (Appendix C) indicated th a t percent concentration of oxygen [0 2] and
carbon dioxide [C 02] could not be separated as independent variables for the
description of bacterial population growth ra te coefficients. Considering the
m athem atical viability of the proposed descriptions when 0 2 and CO., is absent,
(1+[02J) and (1+[C02J) term s were used instead of [ 0 2] and [C 0 2] term s,
respectively. Therefore, the percent concentration ratio of oxygen to carbon
dioxide ( l+ [0 2])/(l+ [C 02]) was used as the prim ary independent variable ra th e r
than oxygen and carbon dioxide concentration alone. Furtherm ore, the effect
of n itrogen concentration was not included in equation development, as it is
usually considered to have no significant effect on the growth of
m icroorganism s (Farber 1991).

45
The first model was based on a modified and additive A rrhenius
equation of a form used previously by Davey (1989) to describe the effect of
tem pera tu re and w ater activity on bacterial proliferation. Inspection of the
experim ental d a ta by Zhao et al. (1992) in an A rrhenius plot (In k us. 1/T, Fig.
3.2) indicated th a t the general shape of the curve did not change for different
( l+ [0 2])/(l+ [C 02]) percent concentration ratios. This suggested th a t there was
only slight in teraction betw een ( l+ [0 2])/(l+ [C 02]) and tem pera tu re . However,
curvature was observed for individual In k us. 1/T curves a t each atm osphere
condition. The curvature can be taken into account w ithin a proposed
description w ith a quadratic expression of tem perature . Furtherm ore, the
m agnitude of In k appears to be dependent on the gas composition. The
dependence may also carries over to the frequency factor term such th a t i t is
exponentially rela ted to ( l+ [0 2]/(l+ [C 02]) ratio. A description of population
growth ra te coefficient tak ing into account these observations was suggested
as:
Ink-ft + — + —A ( 3 . 2 3 )T rp2
where T is absolute tem perature (K), c0 through c;! are regression coefficients
determ ined by sta tistical procedure, [0 2] is volume percentage of oxygen (%),
[C 02] is volume percentage of carbon dioxide (%), and [I is modified frequency
factor in the classic A rrhenius equation expressed as an exponential function
of the ( l+ [0 2]/(l+ [C 02j) ratio with c, and c2 as regression coefficients:
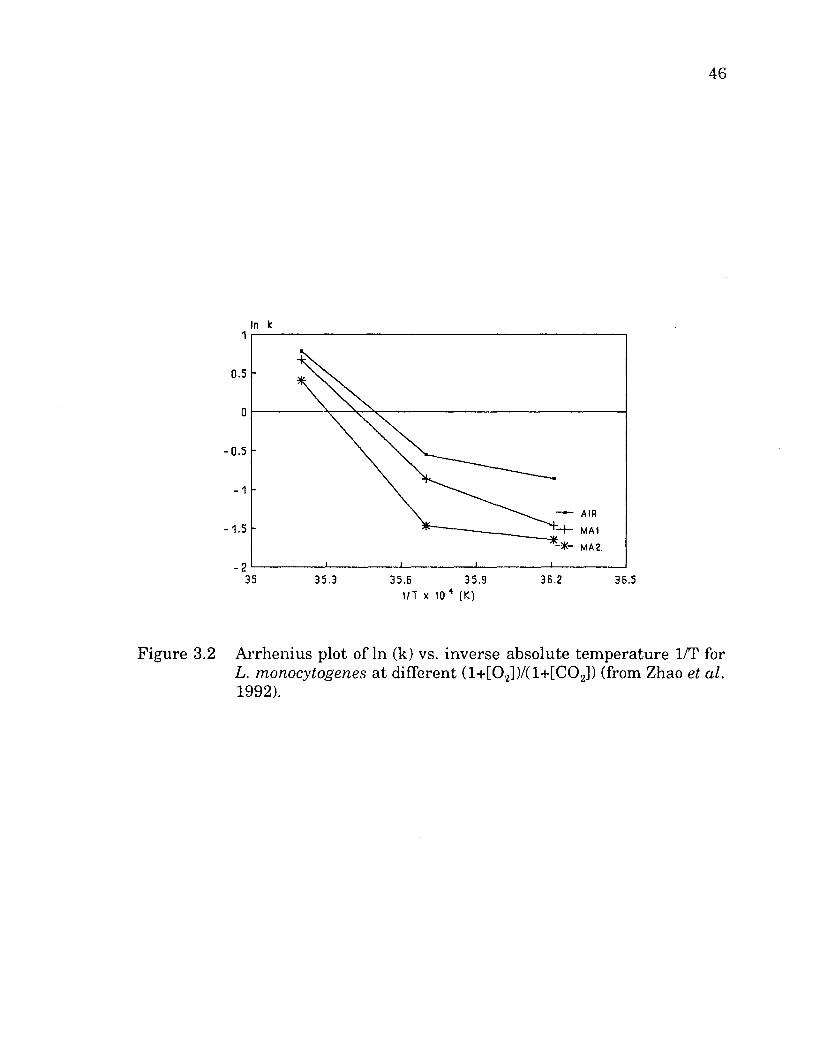
46
I n k1
0.5
0
0.5
1
— A I R
M - M A 1
M A Z .
1.5
235 3 5 .3 35 . 6 3 5 . 9 36 . 2 36.5
1/T x 10* (K)
Figure 3.2 A rrhenius plot of In (k) vs. inverse absolute tem perature 1/T for L. monocytogenes a t different ( l+ [0 2])/(l+ [C 02]) (from Zhao et al. 1992).

As consistent with the notation by Davey (1989), the tem pera tu re
characteristic and universal gas constant term s of the A rrhenius equation has
been replaced w ith two coefficients of inverse tem pera tu re in the proposed
equation.
The second model was based on the classic A rrhenius equation, with
modification of the tem pera tu re characteristic term (modified A rrhenius
tem perature characteristic equation). Previous research (Saguy and Karel
1980; Davey 1989) has suggested th a t the tem perature characteristic term (p)
in the classic A rrhenius equation is not constant over the en tire growth
tem perature range. The empirical tem perature characteristic term (p) can be
rela ted to w ater activity, m oisture content, solids concentration, pH, and other
composition factors (Saguy and Karel 1980; Davey 1989). Upon exam ination
of the experim ental data , it was found th a t tem pera tu re characteristic term
changed with the ratio of percent concentration of oxygen and carbon dioxide.
A quadratic function curve was observed for individual tem pera tu re
characteristic term s us. ( l+ [0 2])/(l+ [C 02]) a t each tem pera tu re condition. A
proposed description for population growth ra te using a modification of the
tem perature characteristic term was suggested as:

where Y is the modified tem perature characteristic term in the classic
A rrhenius equation expressed as a quadratic function of ( l+ [0 2])/(l+ [C 02])
ratio:
, l +[02]. l+[02] 2Y = c 0 + c , ( - - - - - - - - - - - - - —) + c 2( ----------—Y ( 3 . 2 6 )
0 1 1 +[C 0 2 2 1 +[C 0 2
w here A and c„ through c2 are coefficients determ ined by statistical analysis of
experim ental data.
The m ethod to evaluate proposed models rela ting atm osphere
composition and tem pera tu re to microbial population growth ra te coefficient
will be discussed in section 5.4.

IV. MATERIALS AND METHODS
The objectives outlined in th is study were accomplished by constructing
an experim ental appara tus for estim ating C 0 2 absorption in m eat, exam ining
the influencing of packaging/product configuration and storage conditions on
C 0 2 absorption, and developing m athem atical struc tu re which included in itial
MAP condition in predicted microbial population growth ra te coefficient. The
sem i-theoretical analysis of atm osphere components w ithin MAP were
validated by statistical analysis of experim ental results. The specific
methodologies for fulfilling the objectives are described below.
4.1 Method for M easuring C 02 Absorption
4.1.1 Detailed Design of Experimental Apparatus
An experim ental appara tu s used for estim ation of C 0 2 absorption was
constructed as shown schem atically in Fig. 4.1. The ap p ara tu s was
constructed to fulfill the requirem ents necessary for use w ith m easurem ent
m ethod proposed in section 3.1 (i.e., constant volume and gas impermeable).
A sealed alum inum pressure vessel (255 mm diam eter by 110 mm high and 10
mm thick) was built to be used as a constant volume cham ber. The cham ber
lid was fastened w ith the body of the cham ber by using n u t and bolts. A
rubber gasket was used to achieve cham ber sealing. A p ressure transducer
(Omega Engineering Inc., PX 304-100AV) attached to a cross fitting on the lip
of the cham ber was connected to a strip chart recorder (ABB GOERZ
Aktiengeschaft, A ustria, Model SE120) to m onitor changes of absolute pressure
49

8
I-----
8
Figure 4.1 T est apparatus used to m onitor change in gas pressure.
1. strip chart recorder 2. p ressure gage 3. therm ocouple probe 4. p ressure transducer 5. vacuum pum p 6. prem ixed gas tank 7. gas flush valves 8. sam pling syringe 9. pressure release valve 10. m eat sam ple 11. te s t cham ber
51
of gases w ithin the chamber. Additionally, tem pera tu re inside the cham ber
was m easured w ith a copper-constantan therm ocouple probe (Omega
E ngineering Inc., Model CPSS-18G-8-RP) connected to the second channel of
the strip chart recorder. The lid of the cham ber was equipped w ith two brass
branch tees and one brass cross fitting. One branch tee was a ttached to two
m etering valves (Swagelok Co., Model SS-31RF2) connected to a prem ixed gas
bottle and vacuum pum p (Thomas Industries Inc., Model 607CA32),
respectively. The cham ber connections allowed for evacuation and gas back
flushing to replace the in ternal cham ber atm ospheres. Another branch tee was
connected w ith a sam pling port for w ithdraw al of gas sam ples and a pressure
release valve to insure the safety of the system . The cross fitting was
respectively connected w ith a pressure gage, p ressure transducer, and a
thermocouple probe.
The composition of headspace gases in the cham ber was m onitored by
removing 30 ml gas a t the headspace pressure via a 30 ml gas-tight syringe
(Becton Dickinson and Company, Model B-D) through a shim adzu septum
(Chemical Research Supplies, Model 77) attached to the sam pling port. The
volume percentage of the individual gases p resen t was m easured using a
C 0 2/0 2 gas analyzer (Servomex Co., Model 1450). The gas analyzer was
calibrated as per the m anufacturer’s instructions using N2, known certified gas
m ixtures of N2 and C 0 2, and a ir as calibration gases. The m easurem ents of

52
gas composition were used to confirm the in itial and final gas composition
w ith in the cham ber during C 0 2 absorption experim ents.
The cham ber volume was determ ined by calibration w ith water. The
to ta l volume of w ater injected into the cham ber was considered the volume of
the chamber. The average of th ree volume m easurem ent indicated a cham ber
volume of 5.63 liters, slightly larger than calculated volume of 5.61 liters. In
order to achieve various headspace-to-m eat volume ratios in packaging/product
configuration experim ents, rubber disks (250 mm diam eter by 10 or 25 mm
thickness) were inserted into the cham ber to replace portions of the cham ber
volume. The cham ber volume after inserting rubber disks were also calibrated
by water. The volume could be adjusted to 1.21, 1.50, 1.84, 2.22, 3.13, and 5.36
liters w ith the addition of the respective rubber disks.
The seal in tegrity of the cham ber was determ ined by m onitoring
pressure changes in nitrogen (initial gas pressure of 207 kPa). The seal
in tegrity was verified periodically throughout the study by holding a desired
gas or gas mix within an empty cham ber and m onitoring gaseous pressure
changes over time. In order to achieve isotherm al conditions, the tes t
appara tus was located inside a tem perature controlled cooler (M aster-Bilt,
S tandex Company, Model D34LCD82) th a t was adjusted to the desired
tem perature 12 hrs before the s ta r t of each experiment.

53
4.1.2 Experimental Validation of C 02 Absorption Method
The pressure transducer was calibrated by using a Dead W eight T ester
m ethod (Perry and Chilton 1973). The basic form of a Dead W eight T ester is
illu stra ted in Fig. 4.2. M asses of known weights (10, 20, 100 lbs) were added
on top of the piston and the resulting voltage changes produced by the
pressure transducer were recorded. Step changes in pressure increase and
decrease were recorded as the weights were respectively added to, and taken
away from, the piston one by one. Voltage changes were recorded using the
strip chart recorder. D ifferent voltage m easuring ranges of the strip chart
recorder were also tested. The calibration procedure was replicated twice. The
relationship betw een transducer voltage output and dead weight p ressu re was
determ ined by the linear regression procedure SAS REG (SAS In stitu te Inc.).
Voltage output from the pressure transducer was linearly related with
pressure.
Vacuum/back-flush trea tm en t was applied to charge the cham ber with
prem ixed and known composition gases of C 0 2 and N2. The am ount of gas
injected into the cham ber was adjusted through repeated vacuum /back-flush.
The cham ber was evacuated by a vacuum pum p to approxim ately 8.0 kPa
absolute pressure for 40 mins, the desired gases was then adm itted into the
chamber, then vacuum evacuated and gas back-flushed again. The repeated
vacuum /back-flush procedure assured residual 0 2 of less than 0.5% which was
determ ined by m easuring headspace gas composition with gas analyzer.

54
Figure 4.2
weig hts
pis tonChar t r eco rde r
oi l reservo i r
IPressureT ransduce r X ,
cy l i nde r
Dead-weight tester method used for pressure transducer calibration.

55
An investigation of N2 solubility in m eat was conducted to verify
assum ed conditions w ithin the tes t cham ber (i.e., dnN2/dt=0). The properties
of N2 absorption in m eat were verified by m ain tain ing 100% N2 atm osphere in
the te s t cham ber and recording absolute pressure changes of N2 over tim e. A
beef sam ple was placed into the cham ber and held a t 8°C, and the atm osphere
in the cham ber was adjusted to 100% N2 using the previously described
vacuum /gas-flushing trea tm ent. The absolute pressure of N2 and headspace
gas composition change were monitored to determ ine N 2 absorption in m eat.
P ressure reduction would indicate th a t N2 is absorbed by m eat, otherwise, N2
absorption in beef could be ignored.
To validate the C 0 2 absorption procedure, pressure changes m onitored
over the course of the packaging and storage condition experim ents were used
to calculate final gas composition w ithin the te s t cham ber headspace.
Predicted headspace gas composition was compared to th a t observed as
m easured with the gas analyzer. Correlation and bias analyses were
conducted for observed and predicted percentage concentrations of C 0 2 and N 2.
4.2 E x a m in a tio n o f P a c k a g in g /P ro d u c t C o n f ig u ra tio n
A series of experim ents were conducted using the above appara tu s to
examine how initial packaging/product param eters (i.e., headspace-to-m eat
volume ratio and surface a rea and volume of m eat sam ple) contributed to CO.,
absorption in packaged fresh beef.
56
4.2.1 Preparation of Fresh Beef Samples
Inside round semimem branosus muscle of beef carcasses 72 h rs after
slaugh ter and free of fat cover were obtained from the LSU A gricultural
Center, D epartm ent of Animal Science. The large beef muscle (approxim ately
25 lbs) was cut into small pieces (samples) according to sam ple size and shape
requirem ents of individual experim ents. All sam ples were vacuum packaged
in high b arrie r vacuum bags using a cham ber-type, heat-seal vacuum
packaging m achine (W estglen Corp., Model VM 200H). Sam ple bags were
num bered and orderly stored a t 4°C (±0.5°C) until the beginning of each
experim ent. Care was taken to ensure m inim um variability in biological
factors of beef samples. For each experim ent, one beef sam ple was selected
according to a previously assigned random order (Beyer 1976).
Proxim ate compositions of all sam ples were determ ined after testing
using a rapid microwave procedure (CEM AVP80 & Autom atic Extraction
System). Approximately 10 gram s of beef sam ple was ground and mixed well,
and then dried for 4.5 min a t 80% power in the microwave oven to m easure the
percent content of m oisture. Total lipid fraction was extracted using
dichlorom ethane (CH2C1,2) after which the sam ple was dried in the microwave
oven a t 100% power for 1.5 min to determ ine the fat content. The pH of each
beef sam ple was m easured by use of a glass body combination pH surface
electrode a ttach to an digital pH m eter (Oyster Economy pH M eter, Model
301013-03-B).

57
4.2.2 Method for Packaging/Product Configuration Investigation
Headspace-to-m eat volume ratio along with in itial gas composition
determ ines the absolute am ount of active gases available in package. The
headspace-to-m eat volume ratio was considered a critical param eter affecting
the ra te of C 0 2 absorption by meat. Twenty beef sam ples were tested to
estim ate the effect of headspace-to-m eat volume ratio on C 0 2 absorption.
Different headspace-to-m eat volume ratios from 1.8 to 5.9 were produced by
considering different cham ber volumes and different m eat volume. Since
geometry and surface area of m eat sam ples were also believed to influence the
ability of m eat to absorb C 0 2, the surface area of beef sam ples was selected
from 200 to 800 cm2. Rectangle surface of beef sam ples was chosen because
the size of rectangle surface was easily m easured and controlled. The volume
of beef sam ples varied because of the constraints of headspace-to-m eat volume
ratio and surface area of beef sam ples requirem ents. Sam ples size, m ass, and
composition are given in Table D l.
The general procedure for C 0 2 absorption determ ination was as follows.
A previously vacuum packaged beef sample stored a t 4°C, was removed from
packaging m aterials and placed into the cham ber and m aintained a t 13±0.5°C.
A tem pera tu re of 13°C was chosen as an abusive storage condition for MAP
m eat. T em perature conditions were m aintained by housing the test cham ber
inside a therm ostatic cooler. The cham ber was connected to the vacuum pump
for about 30 mins, and then back-flushed using 100% C 0 2. The vacuum/back-

58
flush cycle was repeated 3 to 4 tim es until 99.0±1.0% C 0 2 had been reached.
The in itial headspace absolute gas pressure w as adjusted to 155 ±14 kPa.
Gas sam ples were analyzed a t the end of back-flush to m easure C 0 2
concentration.
Each beef sample rem ained inside the cham ber for a 12 hour m onitoring
period. The in itial am ount of C 0 2 (moles) was calculated using the ideal gas
law, along w ith the C 0 2 absorption in m eat calculated from the recorded
absolute pressure recorded over 12 hrs. The C 0 2 absorption was calculated
using Eq. (3.10) and Eq. (3.11) w ith known cham ber volume, in itial C 0 2 moles
and in itial absolute gas pressure changes. E xperim ental observations of
changes in absolute pressure during 12 h rs storage is given in Table D2.
E xperim ental data were analyzed by sta tistical procedures to identify
the significant (PcO.Ol) packaging/product param eters affecting C 0 2
absorption.
4.3 Exam ination of Storage Conditions
Storage tem perature and gas composition greatly influence C 0 2
absorption (Gill 1988). The objective of th is p a rt of the research was to
determ ine the influence of tem pera tu re and in itial gas composition on C 0 2
absorption.
4.3.1 Experim ental Design for Storage Conditions Investigation
A 3x3 factorial, complete randomized design with 2 replication (total 18
beef sam ples) was conducted to study the effect of tem pera tu re and in itial gas

59
composition on tim e dependent headspace C 0 2 changes (absorption/evolution).
Three different tem pera tu res (3°, 8°, and 13°C) and th ree in itial gas
compositions (100% C02:0%N2, 50% C02:50%N2, and 20% C02:80%N2) were
tested3. The level of each gas composition in all experim ents was selected
based on the principle function of each gas in MAP and gas compositions
recom mended in previous research (Farber, 1991). The actual gas blend used
w as constrained by the availability of prem ixed gases. At each specified
trea tm en t combination, one beef sam ple was used to calculate am ount of C 0 2
headspace changes by m onitoring the tim e dependent p ressure changes w ithin
the experim ental apparatus. The am ount of C 0 2 changes was determ ined for
each sam ple and expressed as gram C 0 2 absorption (or evolution) per kilogram
m eat (gc0-Ag
Fresh beef sam ples for this experim ent were obtained from Hyde’s
S laugh ter House (Robert, LA), and were prepared using the m ethods described
in section 4.2.1. Each beef sam ple was random ly selected from previously
prepared vacuum packaged sam ples stored a t 4°C. Beef sam ple was placed
into the cham ber and m aintained a t the desired tem perature . The atm osphere
in the cham ber was adjusted to th a t of the prem ixed gases using the
vacuum /back-flush procedure. The in itial gas concentration was m easured to
check cham ber atm osphere. Final gas sam ples were taken and analyzed for
3Four additional tests were considered in the storage condition investigations. Additional param eters were used to consider the effect of different in itia l pressures and 100% N2 atm osphere on am ount of C 0 2 changes.
60
C 0 2 and 0 2 concentrations. Each beef sam ple rem ained inside the cham ber for
12 h rs duration. Along w ith the C 0 2 absorption (or evolution) in beef, the
changes of absolute gas p ressure over tim e were recorded to calculate C 0 2
absorption by m eat during 12 hrs. Headspace C 0 2 changes for all trea tm en ts
were correlated to tem peratu re and in itial gas composition by using statistical
regression. E xperim ental observations are given in Appendix D, Tables D3
and D4.
4.4 P r e d ic t io n o f M ic ro b ia l P o p u la t io n G ro w th R a te C o e ffic ie n ts
The bacterial growth d a ta used for model developm ent is given in
Appendix D, Tables D5 and D6 and was adopted from M arshall et at. (1991).
Analysis of the com parative growth of L. monocytogenes and P. fluorescens on
precooked dark-m eat nuggets has been discussed by M arshall et al. (1991).
4.4.1 M e th o d s fo r E s t im a tio n o f K in e tic P a r a m e te r s
Kinetic param eters for microbial population growth models were
estim ated using the sta tistical software SAS (SAS In stitu te Inc. 1988) on a
SUN Microsystems SPARC 1 workstation. The population growth rate
coefficient (k) was calculated for each tem perature and atm osphere composition
from the observed generation tim e of the m icroorganism s under study.
G eneration tim e was determ ined by using selected pairs of d a ta judged to be
in the log phase of growth (M arshall and Schm idt 1988).
Nine sets of experim ental data were used to determ ine the regression
coefficients in the fitting of Eqs. (3.23) through (3.26). Combined Eqs. (3.23)

61
and (3.24) was a linear regression model th a t could be fitted by a least squares
regression using SAS REG procedure. For the REG procedure the coefficient
of determ ination, R2, was used as a param eter describing the model accuracy.
P aram eters for the non-linear regression model, resu lting by combining Eqs.
(3.25) and (3.26), were determ ined using the SAS NLIN procedure and a
standard M arquard t method. Initial estim ates for the NLIN procedure were
provided by the user as required for this model. Since the SAS NLIN
procedure did not provide values for the regression coefficient, R2 was
computed to equal (1-Residual sum of square/Corrected total sum of square).

V. RESULTS AND DISCUSSION
The m ethod for m easuring C 0 2 headspace changes as previously
proposed was validated. The resu lts from headspace C 0 2 changes of MAP
fresh beef were used to evaluate the headspace gas behavior of MAP m eat
during storage. The packaging/product configuration and storage conditions
of MAP m eat were correlated w ith C 0 2 headspace changes as proposed in
C hapter 3. Additionally, the resu lts from microbial growth on MAP chicken
nuggets were used to verify the proposed microbial population growth model.
5.1 Validation of Headspace C 02 Change M easurement
The gas absorption tes t cham ber was constructed to act as a physical
model of a MAP package. The cham ber was used to estim ate the headspace
C 0 2 changes in m eat by m onitoring pressure changes w ith tim e. The
estim ation of headspace C 0 2 change by th is m ethod was verified by comparison
of observed and predicted final C 0 2 and N2 concentrations in headspace.
The comparisons of the predicted final volume percentage of N 2 and C 0 2
from Eq. (3.14) and (3.15) w ith the observed values as m easured w ith the gas
analyzer are shown in F igure 5.1. The data in Fig. 5.1 are from the 3 x 3
factorial CRD design experim ent discussed in section 4.3.1. The deviation of
gas composition calculated using Eq. (3.14) and (3.15) from th a t observed
using the gas analyzer is in the range of ±2.0%. The R2 for regression lines of
predicted data and observed d a ta is 0.998. This observation confirmed th a t the
62

Pred
icte
d pe
rcen
tage
of
C02
and
N
63
100
CM
60
40
10 20 30 40 50 60 70 80 90 1000
Observed percentage of C02 and N2
Figure 5.1 Com parison of observed (m easured by gas analyzer) and predicted (calculated by ideal gas law) volume percentages of headspace C 0 2 and N 2.

64
m ethod proposed in th is work to estim ate headspace C 0 2 changes during
storage is valid.
The assum ption ignoring the am ount of N2 changes in headspace on
modeling headspace C 0 2 changes as described in section 3.1.2 was also proved
by th is comparison. N itrogen is considered an in e rt gas in MAP system s and
is less soluble in w ater th an C 0 2 (Perry and Chilton 1973). Seidem an et al.
(1979a) m easured the volume and weight percentage changes of N2 and C 0 2
during storage for 100% 0 2, 100% N2, and 100% C 0 2 packaged beef. Findings
indicated th a t a significant change in the volume of N2 did not occur until 14
days of storage. Enfors and Molin (1984) also reported th a t C 0 2 evolution
played an im portan t role in headspace gas exchange for a 100% N2 packaged
beef, and clarified th a t C 0 2 evolution is oxygen-non-dependent. In this study
headspace gas pressure changes for a 100% N2 packaged beef was m easured
(Table D4). Results indicated th a t headspace gas pressure increased during
12 h rs storage because of an increased C 0 2 concentration w ithin the
headspace. This observation fu rther confirmed th a t N2 is an in e rt gas and less
soluble compared with C 0 2. Thus the assum ption to ignore N2 changes in
headspace would appear to be reasonable.
The combined analytical and experim ental m ethod used in th is work
allowed C 0 2 absorption in m eat to be estim ated directly from observed changes
of headspace gas pressure. Compared with the chemical m ethod used by Gill
(1988), th is m ethod is very simple since gas pressure and tem pera tu re can

65
easily and precisely to be m easured. Moreover, the cham ber headspace can
be changed to consider the influence of different packaging configurations on
C 0 2 absorption. Such configurations can conveniently be achieved by adding
inserts to change cham ber volume, by varying gas composition, and by
controlling tem perature. The changes in gas composition, headspace gas
volume, and other param eters can be precisely controlled based on required
testing conditions. Assum ing cham ber in tegrity can be m aintained , the
accuracy of C 0 2 absorption estim ation depends only on the m easurem ents of
gas pressure, tem perature , and volume of the cham ber. Based on the stated
precision of the test cham ber m easurem ents, the m axim um estim ated error for
C 0 2 absorption m easurem ent is approxim ately 5.06% (Appendix A).
5.2 Dynamic Behavior of Headspace Gases
A series of experim ents using various headspace volumes, surface areas
and volumes of fresh beef sam ples were conducted to investigate the effect of
packaging/product configuration on 12 h rs C 0 2 absorption by m eat (Tables D l
and D2). D uring these experim ents, the sam e storage tem pera tu re (13°C),
sam e in itial gas composition (100% C 0 2), and same in itia l headspace gas
pressure (155 kPa) were used. A total of 20 separate experim ental tria ls were
conducted. A sum m ary of recorded data including m easured 12 h rs C 0 2
absorption is listed in Table 5.1.

66
Table 5.1. Calculated d a ta for C 0 2 absorption m easurem ent a t tem pera tu re 13±0.5°C, in itial headspace pressure 155±14 kPa, and in itial gas composition 99±1.0% CO., for 12 hours test.
SampleNo.
Mmigram
s m ,
cm2y »u
’ mliter
VHliter
v H / v n ; Aco2(t=12)Segment
1 6 4 3 . 6 5 5 0 . 6 0 . 5 3 6 3 0 . 9 6 3 7 1 . 7 9 7 0 . 8 4 0 4
2 6 3 8 . 2 5 7 2 . 2 0 . 5 3 1 8 0 . 9 6 8 2 1 . 8 2 0 0 . 9 5 4 0
3 6 4 2 . 8 6 3 0 . 9 0 . 5 3 5 7 1 . 3 0 4 3 2 . 4 3 5 0 . 9 2 4 1
4 5 2 0 . 6 4 8 4 . 5 0 . 4 3 3 8 1 . 0 6 6 7 2 . 4 5 8 0 . 9 1 9 5
5 6 6 0 . 4 5 9 3 . 0 0 . 5 7 3 0 1 . 6 4 3 0 2 . 8 6 7 0 . 8 4 5 8
6 6 5 5 . 0 5 8 2 . 5 0 . 5 6 8 3 1 . 6 4 7 7 2 . 8 9 9 0 . 8 4 7 1
7 8 6 8 . 4 7 8 0 . 0 0 . 7 5 0 3 2 . 3 7 4 7 3 . 1 6 5 0 . 7 0 1 6
8 8 4 9 . 8 5 9 5 . 2 0 . 7 3 4 2 2 . 3 9 0 8 3 . 2 5 6 0 . 6 6 7 7
9 8 4 8 . 0 7 8 0 . 0 0 . 7 3 2 7 2 . 3 9 2 3 3 . 2 6 5 0 . 7 2 3 8
10 8 4 1 . 0 5 8 4 . 0 0 . 7 2 6 9 2 . 3 9 8 1 3 . 2 9 9 0 . 7 4 2 6
11 8 1 3 . 6 5 6 6 . 0 0 . 7 0 5 9 2 . 4 1 9 1 3 . 4 2 7 0 . 6 2 9 4
12 4 3 7 . 0 4 1 4 . 0 0 . 3 6 4 2 1 . 4 7 5 8 4 . 0 5 2 0 . 9 9 6 4
1 3 7 1 7 . 0 5 7 0 . 0 0 . 5 9 7 6 2 . 5 2 7 4 4 . 2 2 9 1 . 1 5 3 1
1 4 4 1 0 . 4 4 0 8 . 7 0 . 3 4 2 1 1 . 4 9 7 9 4 . 3 7 9 1 . 1 2 3 7
15 6 1 3 . 8 5 3 0 . 2 0 . 5 1 1 6 2 . 6 1 3 4 5 . 1 0 8 1 . 1 7 4 3
1 6 3 6 0 . 4 4 6 0 . 0 0 . 3 0 0 1 1 . 5 3 9 9 5 . 1 3 0 1 . 3 9 7 7
1 7 2 8 4 . 6 211.0 0 . 2 3 7 2 1 . 2 6 2 8 5 . 3 2 4 1 . 6 2 2 2
1 8 2 6 4 . 2 2 9 6 . 6 0.2202 1 . 2 7 9 8 5 . 8 1 2 1 . 9 8 8 0
1 9 3 2 3 . 8 3 9 3 . 0 0 . 2 6 9 9 1 . 5 7 0 1 5 . 8 1 7 1 . 5 9 8 6
20 _ 4 9 L 4 _ . . _ 4 5 6 . 1 0 . 4 0 9 5 _ 24155 - . 5.899 .....1J 035..........
N o te :" V’m=Mmi/p ni is calcu latedbased on average density of beef sam ples from sam e beef muscle (pn,=JLpm/n). For four pieces of beef m uscles used in th is experim ent, pm was 1.200, 1.154, 1.153, and 1.222 kg/liter, respectively.

67
5.2.1 Pressure Drop Associated w ith C 02 Absorption
As described in Eq. (3.8), C 0 2 absorption by packaged m eat can be
determ ined by m onitoring headspace gas p ressure changes. As C 0 2 is
absorbed into m eat tissue, the absolute pressure of headspace gas in a constant
volume cham ber will drop. A function describing the tim e dependent pressure
drop for various packaging configurations was established by trial-and-error
using the linear regression procedure SAS REG. A logarithm ic function was
found to describe tim e dependent pressure changes. Time dependent p ressure
changes were described as:
P=a-6*ln(t+1.0) (5.1)
w here P is absolute pressure of headspace gas (kPa), t is tim e (hrs), a is in itia l
absolute p ressure of headspace gas, and b is the in itia l pressure drop ra te
coefficient. Figure 5.2 shows a typical tim e dependent p ressu re drop fitted
w ith Eq. (5.1). In Eq. (5.1), the in itial p ressure (a) is constant for all
packaging/product configurations in th is experim ent, however, b changes with
different packaging/product param eters. The specific regression coefficients for
Eq. (5.1) w ith respect to the various packaging/product configurations
investigated are presented in Table 5.2. For the twenty experim ental tria ls
considered, the resu lts of the regression analysis fit the in itia l p ressure (a)
w ithin a range from 151 to 157 kPa. The range of coefficients of determ ination
for the fitted data was from 0.958<R2<0.996.

Abs
olut
e pr
essu
re
(kPa
)
160■ Observed — Predicted
155
150
145
140
135
130
1250 1 2 8 9 10 11 123 4 5 6 7
Time (hr)
Figure 5.2 Typical plot of pressure drops w ith respect to tim e during absorption in fresh beef.

69
Table 5.2. Regression lines for p ressure drop w ith tim e for 12 h rs storage tem perature 130C, in itial gas composition 100%CO2 and different package configurations.
S a m p l e
N o .
vr smc m 2
V ’T ml i t e r
P = a - b :,:l n ( t + 1 . 0 ) ( k P a )
R 2 x l 0 0
O/na b
1 1 . 8 0 5 5 0 . 6 0 . 5 3 6 3 1 5 1 . 1 7 0 7 3 1 0 . 8 8 4 4 8 1 9 7 . 4 0
2 1 . 8 2 5 7 2 . 0 0 . 5 3 1 8 1 5 1 . 3 8 8 1 8 1 1 . 3 2 4 7 3 4 9 7 . 9 0
3 2 . 4 3 6 3 0 . 9 0 . 5 3 5 7 1 5 3 . 0 8 7 6 7 8 . 9 8 7 1 6 4 9 8 . 4 4
4 2 . 4 6 4 8 4 . 5 0 . 4 3 3 8 1 5 3 . 9 1 5 2 3 9 . 0 0 2 5 4 6 9 9 . 4 2
5 2.88 5 9 3 . 0 0 . 5 7 3 0 1 5 4 . 7 7 4 4 2 6 . 8 5 6 2 5 7 9 9 . 3 7
6 2 . 9 0 5 8 2 . 5 0 . 5 6 8 3 1 5 5 . 1 2 4 6 5 8 . 4 4 9 2 3 6 9 9 . 2 2
7 3 . 1 7 7 8 0 . 0 0 . 7 5 0 3 1 5 5 . 8 6 0 4 4 5 . 2 2 9 0 1 6 9 9 . 0 1
8 3 . 2 6 5 9 5 . 2 0 . 7 3 4 2 1 5 5 . 1 5 1 4 5 4 . 6 8 2 7 3 9 9 9 . 5 1
9 3 . 2 7 7 8 0 . 0 0 . 7 3 2 7 1 5 5 . 1 5 0 2 1 5 . 0 7 9 4 8 4 9 9 . 1 4
10 3 . 3 0 5 8 4 . 0 0 . 7 2 6 9 1 5 3 . 8 7 7 5 1 5 . 1 9 5 8 0 3 9 8 . 1 5
11 3 . 4 3 5 6 6 . 0 0 . 7 0 5 9 1 5 5 . 1 6 4 9 1 4 . 2 3 4 9 5 7 9 9 . 3 1
12 4 . 0 5 4 1 4 . 0 0 . 3 6 4 2 1 5 6 . 6 5 3 9 4 5 . 9 2 6 3 2 2 9 9 . 0 5
1 3 4 . 2 3 5 7 0 . 0 0 . 5 9 7 6 1 5 8 . 0 3 8 6 3 8 . 1 7 8 3 8 7 9 8 . 6 3
1 4 4 . 3 8 4 0 8 . 7 0 . 3 4 2 1 1 5 5 . 1 5 7 4 7 6 . 1 3 1 7 6 5 9 8 . 7 4
1 5 5 . 1 1 5 3 0 . 0 0 . 5 1 1 6 1 6 0 . 1 6 5 3 8 5 . 6 8 8 7 2 7 9 5 . 7 9
1 6 5 . 1 3 4 6 0 . 0 0 . 3 0 0 1 1 5 6 . 3 2 9 6 3 6 . 7 4 9 9 2 9 9 9 . 1 8
1 7 5 . 3 2 211.0 0 . 2 3 7 2 1 5 3 . 9 8 9 5 9 7 . 1 2 8 4 4 4 9 9 . 1 2
1 8 5 . 8 1 2 9 6 . 9 0.2202 1 5 4 . 0 3 5 4 8 8 . 4 2 3 6 9 7 9 9 . 3 7
1 9 5 . 8 2 3 9 3 . 0 0 . 2 6 9 9 1 5 5 . 8 5 1 9 6 6 . 5 9 0 1 2 4 9 9 . 3 3
20 5 . 9 0 4 5 6 . 1 0 . 4 0 9 5 1 5 1 . 7 8 1 1 9 4 , 7 4 2 5 5 3 9 9 . 5 7
Note: "a" and "b" are regression coefficients for p ressure drop curve;"a" is dependent on the in itial headspace gas pressure P0;
"b” is pressure drop ra te coefficient and shows a relationship with packaging/product configurations.

70
Combining Eq. (5.1) w ith Eq. (3.11), the 12 h rs C 0 2 absorption can be
described as:44 * Vrr
A c02(t=12)=— —— [P0-a+b*ln(t+l)] (5.2)■Km* M m e a t
w here ^ 0 2 (1 = 1 2 ) is 12 h rs C 0 2 absorption by m eat (gco^lTmeui)-
In Eq. (5.2), the m ass of sample (Mmeat) is re la ted to the volume of
sam ple V’m by:
M ,=V ' * 0 (5.3)x meat r m t 'm
w here pmis density of the beef sam ple (kg/m 1), and V’m is the volume of beef
sam ple (m !). Few references present density data for specific beef muscle. In
th is work, the density of each beef sample was calculated from m easured
weight and volume of each beef sample and the average density from same
beef muscle was used to determ ine the calculated volume of each sam ple V’m
based on the sam ple m ass from Eq. (5.3). A lternatively, the density of a
product could be calculated from the density and weight percentage of each
components comprising the product. Only fat and m oisture contents of beef
sam ples were m easured during th is experim ent, thus i t was impossible to use
th is m ethod in the p resen t study.
Combining Eq. (5.3) with Eq. (5.2) evaluated a t t=12 h rs gives
44V„ 4 4VA cm (t=12)*- - ■ " [P0-a*bbilS}= — — ^ [ P 0-a*blnl31 (5.4)
K mTpm V 'm R mT pm
where Vr = VH/V’m is headspace-to-m eat volume ratio.

71
Eq.(5.4) indicates th a t the am ount of C 0 2 absorbed in 12 h rs is related
logarithm ically w ith time by the pressure drop ra te coefficient (b). The larger
the observed pressure drop, the more C 0 2 th a t is absorbed by m eat tissue.
Note th a t the C 0 2 absorption does not continue unbounded, however, as the
drop in C 0 2 partia l p ressure likely will reach some lim iting threshold such
th a t C 0 2 can not be transported across tissue m em brane. Confirming this,
F igure 5.2 shows th a t the ra te of headspace gas pressure drop decreases w ith
storage time. T hat is, the in itial pressure drop ra te coefficient is larger during
the first a few hours, then decreases w ith increased storage tim e. Initially,
there is a large difference in C 0 2 partia l p ressure betw een the headspace gas
and the surface layers of beef. High pressure differential is the prim ary
driving force for C 0 2 absorption in beef tissue (Gill 1989). As C 0 2 is absorbed,
th is concentration (partial pressure) difference decreases, and the ra te of
headspace pressure drop also decreases4. Longer periods of observation would
likely reveal pressure changes associated w ith chemical conversions and
microbial metabolic processes.
Eq. (5.2) and Eq. (5.4) indicate th a t changes in headspace gas pi'essure
directly reflects the am ount of CCL absorbed by m eat for a 100% CO2 package.
The headspace pressure change caused by C 0 2 absorption is rela ted directly
to the package/product configuration by the headspace volume (VH) and m ass
4 The predicted pressure drop ra te is given by:dP/dt=-b/(t+l)
thus the predicted pressure drop ra te dim inishes to dP/dt =0 as t increases.

72
of m eat sam ple (Mm) and to package storage conditions by storage tem perature .
O ther factors influencing C 0 2 absorption can be indirectly re la ted through
functional correlation w ith the pressure drop ra te coefficient (b).
5.2.2 Applicability of Pressure Drop Model
Selected da ta from the storage conditions investigation was used to
exam ine the tem pera tu re effect on pressuredrop rate coefficient. Individual
pressure drop ra te coefficients (b values) for different storage tem pera tu res
w ith 100% C 0 2 packaged fresh beef are listed in Table 5.3. The R2 values for
each regression line of p ressure change w ith time existed in Table 5.3 indicate
th a t the headspace pressure drop model, Eq. (5.1), can be widely used to
describe headspace pressure changes caused by C 0 2 absorption under various
storage tem peratures. The pressure drop ra te coefficient is influenced by
tem pera tu re (Table 5.3), and by the in itial headspace gas p ressure P0 (Fig. 5.3).
A higher initial headspace pressure yields a large pressure drop rate
coefficient, thereby increasing the ra te (and possibly the am ount) of C 0 2
absorption in m eat tissues.
The influence of biological factors on headspace C 0 2 absorption can be
seen from a comparison between muscles of different species (Fig. 5.4) and
am ong muscle sam ples of the sam e species (Fig. 5.5). The p ressure drop
curves for whole chicken, ground beef, and chopped pork are shown in Fig. 5.4.
Predicted pressure values by using Eq. (5.1) m atched observed d a ta very well
for the th ree different types of muscle. This indicated th a t pressure drop

73
Table 5.3. Regression lines of pressure drop w ith tim e for 12 h rs storage a t Vr=2.5, in itial gas composition 100% C 0 2 and different storage tem peratures.
Temp.°C
P=a-b*ln(t+1.0) (kPa) P.kPa
R2x100%a b
3 153.28268 13.437962 155.69 99.1
153.88457 14.561482 155.48 99.6
8 153.55091 11.752045 155.48 99.2
153.37566 13.723918 155.14 99.3
13 151.30507 11.646765 154.10 97.8
152.52506 13.108243 155.14 98.0
Note: D ata presented in th is table is from 3 x 3 factorial CRD experim ent as listed in Tables D3 and D4.

Abs
olut
e pr
essu
re
(kPa
)
74
Pn=155 o Pn=111160
150
140
130
120
100
90
80
Time (hr)
Figure 5.3 Plot of headspace p ressure changes w ith tim e for different in itia l headspace p ressures (da ta from Table D4 sam ples No.8 and No.9).

Abs
olut
e pr
essu
re
(kPa
)
75
235T=13°C
230
225
kgchicken 50%C02/50%N2220
ka chopped pork 100%CO.215
/\210 1.5 kg ground bee
205
2000 3 4 5 6 7 8 9 10 11 121 2
Time (hr)
Figure 5.4 C 0 2 absorption of various muscle foods w ith respect to tim e a ttem pera tu re 13°C.

Abs
olut
e pr
essu
re
(kPa
)
76
160■ Muscle 1 (No.4) * Muscle 2 (No.16) T=13°C
H,=100%CO150
145
140
135
130
125
1 2 0
0 1 2 3 4 5 6 7 8 9 10 11 12
Time (hr)
Figure 5.5 Plot of pressure changes w ith tim e for different beef m uscles (data from Table D2 sam ple No.4 and Table D4 sam ple No.16).

77
model, Eq. (5.1), can be widely used to describe C 0 2 absorption for different
types of muscle. Moreover, the resu lts showed th a t C 0 2 absorption is rela ted
to the type of muscle. For example, a 1.5-kg whole chicken absorbed about 1.8
gram of C 0 2 in about 12 h r in an in itia l gas m ixture of 50% C 0 2 and 50% N2.
A 1.5-kg ground beef (m oisture content of 50%, fa t content of 21%) and
chopped pork (m oisture content of 50%, fa t content of 30%) absorb about 4.5
gram and 5.3 gram of C 0 2, respectively, a t an in itial gas m ixture of 100% C 0 2.
These C 0 2 absorption d a ta are very close to the d a ta p resented by Gill (1988)
and B ush (1991).
Figure 5.5 shows two pressure drop curves for different sources of beef
m uscles, evaluated under the sam e packaging/product configuration and
storage condition. The resu lts indicate th a t the p ressure drop model is
applicable even when there are apparen t differences betw een beef muscles
arising from source or processed differences. The difference m ay reflect the
influence of biological factors such as aging, finishing, genetic difference, and
differences a ttribu ted to processing, on headspace CO., changes.
5.2.3 Pressure Drop Rate Coefficient
The headspace-to-m eat volume ratio, surface area and volume of beef
sam ples were assum ed to be rela ted to the pressure drop ra te coefficient (b).
P aram eters th a t were significant to the "b" value were identified using
statistical modeling techniques (e.g., Forw ard Selection, Backward Elim ination,
and M aximum Improvem ent). The F-values observed w ith these

78
packaging/product param eters obtained by elim ination m ethod are presented
in Table 5.4. The F values presented in Table 5.4 indicate th a t the ra te of
headspace gas p ressure changes caused by C 0 2 absorption in fresh beef related
to headspace-to-m eat volume ratio, surface area and volume of beef sam ple, as
well as the in teractions of these param eters.
Assum ing Sm and Vm are constant, b can be described approxim ately by
the inverse of V,.:
6*6 + h i (5.5)Vr
Eq. (5.5) indicates th a t the in itial pressure drop ra te coefficient decreased w ith
headspace-to-m eat volume ratio V,. when V,. is relatively sm all, b u t the effect
of Vr on b became sm all along with increasing Vr. This also can be seen from
the d a ta plot of b w ith V,. as shown in Fig. 5.6. The pressure drop ra te
coefficient decreases w ith increasing headspace-to-m eat volume ratio when the
ratio is w ithin the range of about 1.8 to 3.3. The strong dependence of
pressure drop on V,. is seen in Fig. 5.6. However, the pressure drop ra te
coefficient increases slightly with increasing V,. when the headspace-to-m eat
volume ratio is larger than about 3.3. This indicated th a t there m ay be a
critical point of headspace-to-m eat volume ratio such th a t a package would
contain the m inim um am ount of CO., in the headspace for m eat to reach C 0 2
absorption equilibrium . This can be fu rther explained since the sm aller the
headspace-to-m eat volume ratio, the sm aller the absolute am ount of CO.,

79
Table 5.4. F Values for significant variables for the headspace pressure drop ra te coefficient "b" using backw ard elim ination method.
Variable Regression coefficientsb F value
In tercep t 9.886 19.70 (0.0008)“1/Vr -37.440 14.67 (0.0024)s m -186.753 17.00 (0.0014)Vm -23.975 13.09 (0.0035)Sm/Vr 838.784 17.92 (0.0012)Vni/Vr 86.394 12.97 (0.0036)s *vT m 467.332 14.67 (0.0024)V *S /V -1803.865 15.91 (0.0018)
a F-value (probability of a large num ber of F)b Regression coefficients are given for the m athem atical model used for th is
sta tistical analysis:
b=b0+^+b2Sm+bsVm*b4 *b6 +beVJ)m*b7Sm vr vr v r r
Coefficient of determ ination for th is model R2 = 0.91

Pres
sure
dr
op
rate
coef
ficie
nt (
b)
80
12
10
8
6
4
2
O'-----------1.8 2.3 4.8 5.3 5.82.8 3.3 3.8 4.3
Figure 5.6 D ata plot of th e in itia l p ressure drop ra te coefficient w ith respect to headspace-to-m eat volume ratio for fresh beef.

81
existing in the headspace. W hen the am ount of C 0 2 in the headspace was less
th an the m inim um am ount of C 0 2 required for beef to reach C 0 2 absorption
equilibrium (i.e. when headspace-to-m eat volume ratio is relatively small),
headspace gas pressure will decrease rapidly as m eat tissue absorbs C 0 2. This
pressure drop will be less pronounced w ith relatively high headspace-to-m eat
volume ratios. Therefore, C 0 2 absorption in beef would cause a faster
headspace gas pressure drop a t a sm aller headspace-to-m eat volume ratio.
W hen headspace-to-m eat volume ratios increase to a relatively high
value (higher th an 3.3), the am ount of C 0 2 available in the headspace is in
excesses of the am ount of C 0 2 needed to reach equilibrium . Only a slight
increase in the in itial p ressure drop ra te coefficient is observed by fu rther
increasing headspace-to-m eat volume ratio. The fu rther increases in V,. caused
an increase in the absolute am ount of C 0 2, th a t may cause a slight increase
in C 0 2 p a rtia l pressure difference between headspace gas and surface layer of
m eat. This increased C 0 2 partia l pressure difference m ay account for the
small increase in the in itial pressure drop ra te coefficient w ith increasing Vr.
The critical headspace-to-m eat volume value reflects the m inim um requirem ent
on headspace-to-m eat volume ratio needed in package design to achieve C 0 2
absorption equilibrium . The implication is th a t package collapse caused by
C 0 2 absorption in 100% C 0 2 packaged m eat can be avoided by increasing
headspace-to-m eat volume ratio to approxim ately 3.3.

82
5.2.4 Effects of Packaging/Product Param eters on C 02 Absorption
From Eq. (5.4), At;o;,(t=12) is seen to depend on the headspace-to-m eat
volume ratio Vr as well as the in itial p ressu re drop ra te coefficient b. As
discussed in the previous sections, the in itial pressure drop ra te coefficient b
is also rela ted to tem pera tu re , in itial gas pressure, biological factor and
packaging/product param eters, such as V,., Sm, and Vni. Therefore, the 12 h rs
C 0 2 absorption ACC)2(t=12) is related to all these factors.
The F-values observed w ith packaging/product param eters obtained by
elim ination m ethod are shown in Table 5.5. The F-values in Table 5.5
indicate th a t in addition to headspace-to-m eat volume ratio, 12 h rs C 0 2
absorption is related to surface area, volume of beef sam ple, as well as the
in teractions of these param eters. Three dim ensional plots of Ac02(t=12) w ith
respect to Vr and Sm, as well as V,. and Vm have been presented in Fig. 5.7 and
Fig. 5.8, These figures show how each package/product p a ram eter individually
and interactively influence A(:()2(t=12). F igure 5.7 shows th a t the surface area
of beef sample Sm affects 12 hrs C 0 2 absorption, bu t th is influence becomes
apparen t only when V,. is larger th an the critical value. This m eans th a t the
influence of Sm on A(.02(t=12) is dependent on Vr.
An in teraction betw een V,. and S,n on AC02(t=12) is confirmed by the
significant F-value of Sm and V,.:!:Sn, as reported in Table 5.5. Such an
observation indicates th a t the larger the surface area, the higher the 12 hrs
C 0 2 absorption. T hat is a sam ple with large surface area would allow more
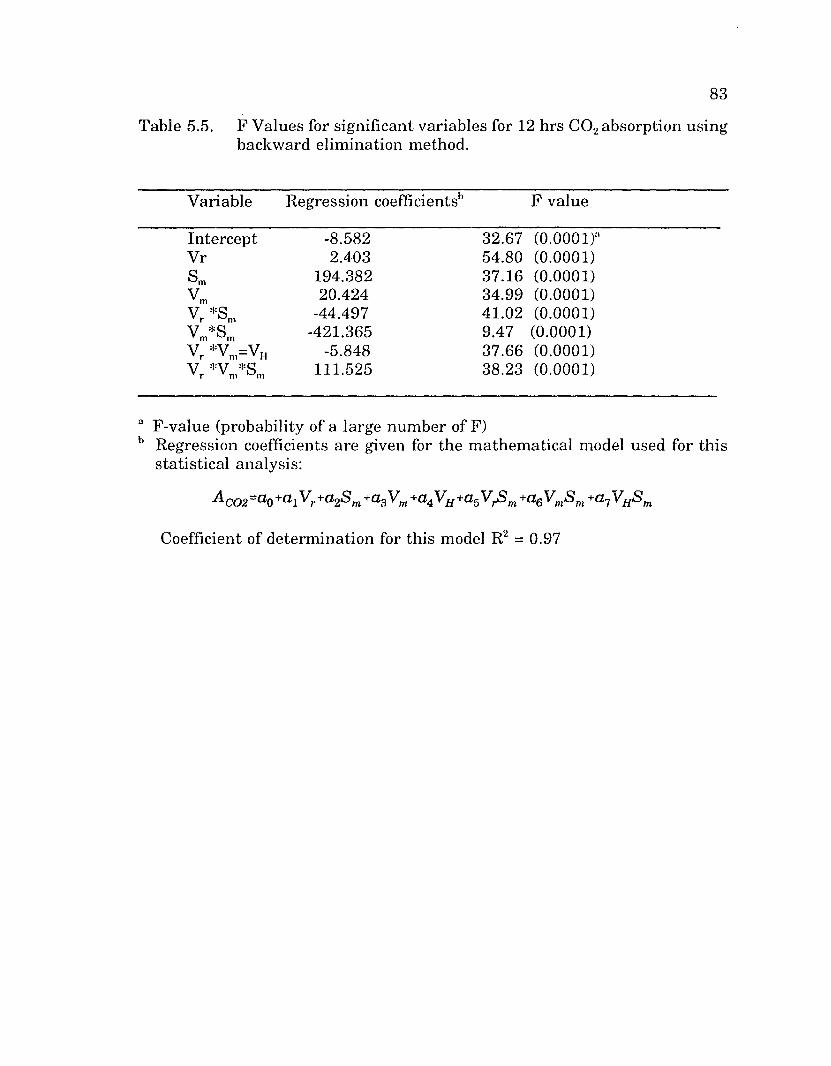
83
Table 5.5. F Values for significant variables for 12 hrs C 0 2 absorption using backw ard elim ination method.
Variable Regression coefficients'1 F value
In tercept -8.582 32.67 (0.0001)"Vr 2.403 54.80 (0.0001)s m 194.382 37.16 (0.0001)v m 20.424 34.99 (0.0001)V *s -44.497 41.02 (0.0001)V *s* ni -421.365 9.47 (0.0001)v *v =VH* r * m T H -5.848 37.66 (0.0001)V *v *sT r ' m 111.525 38.23 (0.0001)
a F-value (probability of a large num ber of F)b Regression coefficients are given for the m athem atical model used for th is
statistical analysis:
A co2 =a0+a1Vr+a2S m +a3Vm +a4VH+a5VlS m +a6VmS m +a7VHS m
Coefficient of determ ination for this model R2 = 0.97

84
■C02
80 1 6
m
Figure 5.7 3-dim ensional graph of 12 h rs C 0 2 absorption w ith headspace-to- m eat volume ratio and surface a rea of beef sam ple.

85
99
54
0 8
. 63 5 . 9
1 6
Figure 5.8 3-dim ensional g raph of 12 h rs C 0 2 absorption w ith headspace-to- m eat volume ratio and volume of beef sam ple.

86
C 0 2 to en ter m eat tissue even though other m eat sam ples have the same
volume. Since surface area Sm can vary for the sam e volume or m ass of m eat
sample depending on the geometry (shape and size of m eat sample), the
suitable selection in the geometry of m eat sam ple in design of MAP m eat can
control the C 0 2 absorption in packaged m eat. For example, in order to achieve
C 0 2 absorption equilibrium quickly, a th in and long m eat sam ple should be
used instead of a relative thick m eat sample a t same volume. However,
surface a rea effect on 12 hrs C 0 2 absorption is relatively sm all compared w ith
the effect of headspace-to-m eat volume ratio.
The beef sample volume as a product param eter influences Ac02(t=12),
b u t th is influence is re la ted to surface area Sm of m eat sam ple and headspace-
to-m eat volume ratio Vr as indicated on F-value of Vm:|:Vr:|:Sm in Table 5.5.
Sample volume represents the total m ass of beef th a t can absorb C 0 2. The
higher the m ass of beef, the more absolute am ount of C 0 2 will be absorbed
given the sam e surface area. This m eans th a t C 0 2 absorption in packaged
m eat is not only a surface phenom ena, bu t also diffuses and penetra tes inside
the meat. U nfortunately, the volume of beef sam ples were not well controlled
in th is experim ent, therefore, it is not clear how the volume of beef sam ple
quantitatively affects A<.02. F u rth e r investigation with controlled m eat sam ple
volume is needed to find how A<;o2 is affected by Vm.

87
5.2.5 Engineering Design Criteria for Packaging/Product Configuration
Few studies on packaging/product configurations of MAP muscle foods
have been conducted because of a lack of a m ethod for m easuring gas
absorption, difficulties in uniform ity of m eat sam ples, consistency of storage
conditions, variability in biological sam ples in term s of age, weight, muscle
fiber types, pH, postm ortem age, and chilling rates. This work a ttem pted to
estim ate packaging/product configurations of MAP m eat using engineering
principles. The effect of packaging/product configuration on CO,, absorption
for 100% C 0 2 packaged m eat was of highest im portance.
E xam ination of the effects of packaging/product configuration on C 0 2
absorption would require a comprehensive study to elucidate the m any factors
th a t are involved. This work has shown th a t headspace-to-m eat volume ratio
is the m ost significant packaging param eter on 12 hrs CO., absorption.
H eadspace-to-m eat volume ratio, Vr, represents the am ount of C 0 2 existing in
the headspace for m eat to absorb. Surface area and volume of beef sam ple as
product param eters also influence A(.()2(t=12). The function of surface a rea on
Aco, depends on V,., only when V,. is larger than the critical value. Above
critical levels of V,., A(;o.2(t=12) increases with increased Sm. Also, the absolute
am ount of C 0 2 absorbed by beef is x’elated to the volume of beef sam ple. Since
the volume of beef sam ple was not controlled in th is work, the specific
influence of beef sample volume on this conclusion is unclear. The effect of
beef sam ple volume on CO., absorption may in fact cause the error in C 0 2

88
absorption calculation, because the calculation 0 1 1 C 0 2 absorption based on per
kilogram of beef sample, i.e. based on the same volume of beef sample. The
m ass of beef sample m ust be controlled in fu ture research to tes t how the
volume (mass) of beef sam ple affects C 0 2 absorption under the same
headspace-to-m eat volume ratio.
The ratio of surface area to volume of beef sam ple m ay be a more
im portan t product p aram eter to describe headspace gas change of MAP m eat
than e ither surface area or volume of beef sam ple alone because the ratio
reflects the extent of surface exposure to C 0 2 relative to the sam ple volume.
F u rth e r study is needed to select a wide range of surface a rea to m eat volume
ratios and to te s t th is assum ption.
Bush (1991) suggested th a t C 0 2 absorption reaches equilibrium in 4 to
8 hours depending on the type of m eat, and Gill (1988) considered th a t 12
hours was long enough for m eat (beef, pork, and lamb) to become sa tu ra ted
with C 0 2. However, ne ither Gill (1988) nor Bush (1991) m entioned the
packaging/product configuration effect on C 0 2 absorption equilibrium in the ir
research. In th is work, it was observed th a t headspace gas pressure
continuously and logarithm ically dropped during 12 h rs storage period, bu t the
initial pressure drop rate coefficient decreased w ith tim e, causing the pressure
to rem ain nearly constant during the last few hours. The C 0 2 absorption
equilibrium in m eat may be in te rperted as an am ount of C 0 2 w ithin headspace
in excess of the m inim um am ount of C 0 2 required to sa tu ra te m eat. U nder

89
such conditions, headspace pressure will no longer decrease w ith increased
storage tim e or increased in itial am ount of headspace C 0 2.
An ideal plot of C 0 2 absorption w ith tim e is shown in Fig. 5.9. When
the am ount of headspace C 0 2 is less th an the am ount required to achieve
equilibrium , the stable headspace gas p ressure after a few hours storage would
indicate an "apparent (or tem porary) C 0 2 absorption equilibrium". This
equilibrium is apparen t or tem porary because it is caused by an insufficient
am ount of CO., rem aining in the headspace to allow C 0 2 absorption to continue
to sa tu ration . If more C 0 2 is added after th is apparen t equilibrium was
reached, C 0 2 would continue to be absorbed. In th is work, 12 h rs C 0 2
absorption da ta was collected for analysis of packaging/product configuration
effect. It is not clear if 12 h rs was long enough for m eat to reach C 0 2
absorption equilibrium or apparen t equilibrium . This could be confirmed in
fu ture work by adding more C 0 2 and m onitoring sam ples longer after reaching
apparen t equilibrium . The equilibrium conditions are affected by am ount of
C 0 2 added inside package, i.e. in itial headspace gas pressure, headspace-to-
m eat volume ratio, and gas composition, all factors th a t influence the partia l
pressure of C 0 2 within the package.
Gill and Penney (1988) indicated th a t the full effects of C 0 2 addition in
MAP m eat would be achieved only if the gas was added to a package in
quantities in excess of those required sa tu ra te the m eat. Therefore, the data
presented in th is work should allow useful calculation on the am ount of C 0 2

90
0 0 2 )
T,e q u i l i b r i u m
Time
Figure 5.9 Ideal C02 absorption curve with respect to time when headspace has enough C 02 to reach C02 absorption equilibrium.

91
needed for practical purpose where m eats are packaged under atm ospheres
containing C 0 2.
5.3 Effects of Storage Conditions on Headspace C 02 Changes
The objective of th is p a rt of work was to determ ine the role of storage
tem perature and in itial C 0 2 concentration in headspace on the am ount of C 0 2
changes for a C 0 2 plus N2 atm ospheric package on fresh beef. The suitable
selection of tem perature and in itial C 0 2 concentration can improve quality and
extended shelf life of MAP m eat. A 3 x 3 factorial CRD (Complete Randomized
Design) w ith 2 sam pling design was used to investigate the effect of three
different storage tem peratures (3°, 8°, 13°C) and th ree different in itia l gas
atm ospheres (C 02 plus N2) on headspace gas behavior. D uring this
experiment, the packaging/product configuration was controlled, i.e., same
headspace-to-m eat volume ratio (2.5) and sim ilar size of fresh beef sam ples
(~160x90x24mm) were used.
The terminology "am ount of C 0 2 changes" instead of "C 02 absorption"
has been used in th is section because C 0 2 evolution from beef tissues became
apparent when gas mixes of C 0 2 and N2 were used. The net action of
absorption and evolution was calculated as the final am ount of C 0 2 changes
in headspace. The 12 h rs am ount of C 0 2 change was calculated from Eq. (3.11)
assum ing th a t the change of absolute am ount of N2 in headspace during 12 hrs
storage could be ignored compared w ith the change of C 0 2 during storage.
Therefore, it was assum ed th a t the headspace gas pressure change was caused

92
only by the change in C 0 2 partia l pressure, and N 2 partia l p ressure was
constant during 12 hrs storage.
The 12 h rs am ount of C 0 2 changes could be estim ated by:
Mc02((=12)=J2^L. (5.6)
E q . ( 5 . 6 ) is a modification of previously sta ted E q . (3.11), where a P is
headspace gas pressure change (Pn-P(t=12)) (N/m2), and MC02(t=12) is 12 hrs
am ount of C 0 2 changes in headspace (g(’,o2/kgmual). A sum m ary of recorded da ta
on the effect of storage conditions on 12 h rs am ount of C 0 2 change are listed
in Table 5.6. The analysis of variance of storage tem pera tu re and in itial C 0 2
concentration trea tm en t on 12 hrs am ount of C 0 2 changes is p resented in
Table 5 . 7 . Results indicate th a t tem perature and in itial C 0 2 concentration
significantly affect 12 hrs am ount of C 0 2 changes in headspace, bu t there is no
in teraction between tem perature and in itial C 0 2 concentration.
5.3.1 E ffe c t o f S to ra g e T e m p e ra tu re a n d In i t ia l 0 O 2 C o n c e n tr a t io n
A plot of the 12 h rs C 0 2 changes against tem perature for each in itial
C 0 2 concentrations is shown in Fig. 5.10. For an in itial 100% C 0 2 package,
headspace C 0 2 was absorbed by packaged beef and C 0 2 absorption increased
w ith decreased tem perature. For an approxim ate calculation, the relationship
can be assum ed to be linear w ithin the narrow tem perature range used in th is
study. W ithin the tem pera tu re range of 3 to 13''C, the am ount of C 0 2 change
decreases by approxim ately 0.02 g/kgMK,.lt (about 10.2 ml/kgnu,.u a t standard

93
Table 5.6. C alculated d a ta on the experim ent of storage condition effect on 12hrs am ount of C 0 2 changes on packaged fresh beef.
SampleNo.
a M
g
M■L’J,un
g
q I)
cm2V ’ ■'T in
literv„
literVHA^m MC()2
g / k g monl
M ’ b1V1 C02
g / k g m e n t
1 3 .0 395 .8 401.4 0.347 0 .858 2 .473 1.5071 1.5235
2 1.6 396 .6 414.3 0.338 0 .867 2.561 1.6266 1.5873
3 1.6 402 .8 411.1 0.343 0 .861 2 .507 0 .3710 0.3700
4 2.8 389 .0 412 .0 0.343 0 .862 2 .511 0 .6994 0.6963
5 2 .0 395 .6 407 .0 0.337 0 .868 2 .571 -0 .1166c -0.1134
6 2 .2 398 .2 395.8 0.351 0 .854 2 .4 3 0 -0 .0214 -0.0220
7 1.6 351 .4 391.0 0.308 0 .897 2 .912 1.4839 1.3310
8 2 .0 390 .6 391.3 0.333 0 .872 2 .616 1.5152 1.4756
9 1.8 4 01 .0 420 .4 0.351 0 .854 2 .428 0.2918 0.3004
10 1.8 392 .6 403 .8 0.334 0 .870 2 .598 0.4195 0.5429
11 2.6 393 .2 428.1 0.335 0 .870 2 .592 -0 .1484 -0.1454
12 2.2 394 .4 432 .8 0.347 0 .857 2.463 -0 .1277 -0.1296
13 1.4 399 .0 425 .6 0.349 0 .855 2 .450 1.2405 1.2656
14 1.6 386 .6 429 .7 0.341 0 .864 2 .530 1.5335 1.4147
15 1.6 329 .6 371.3 0.288 0 .916 3.171 0 .3744 0.2953
16 1.0 389 .2 411.7 0.343 0 .862 2 .509 0 .4117 0.4102
17 1.8 383 .8 396.6 0.336 0.869 2 .582 -0 .4936 -0.4779
18 1.6 385 .8 421 .8 0.340 0.865 2.539 -0 .3234 -0.3183
A ld 1.2 348 .2 356.8 0.297 0 .908 3 .057 0.9873 0.8074
A2 1.0 398 .8 402.3 0.351 0 .853 2 .425 0 .9777 1.008
A3 1.2 349 .4 398 .0 0 .306 0 .899 2 .931 -0.6428 -0.5482
A4 1.2 338 .4 376.3 0 .296 0 .908 3 .062 -0.4133 -0.3377
Note: a V’m is calculated based on average density of beef sam ples from sam e beef muscle;
b M’co(t=12) is calibrated based on sam e VH/V’H=2.5; c Sign represen ts the net am ount of C 0 2 changes is C 0 2 evolution; d F our additional experim ents were conducted to investigate the effect
of d ifferent in itia l headspace gas p ressu re and 100% N2 atm osphere on C 0 2 changes in headspace.

94
Table 5.7. ANOVA of 12 h rs am ount of C 0 2 changes in storage tem pera tu re and in itia l gas composition trea tm ent.
Source df SS MS F
Total sam ple 17In itia l gas 2 8.1401 4.0700 245.8**T em perature 2 0.1762 0.0881 5.32*Gas*Temp. 2 0.0087 0.0022 1.33nsE rror 9 0.149 0.0166
** Significant a t the 1% level;Significant a t the 5% level;
NS Not significant.

Net
amou
nt o
f C
02 ch
ange
s (g
C02/k
g
95
100% C02 x 50% C02 X 20% C02(0®E
0.80.6 -
0.40.2
- 0.2-0.4
0 1 2 3 4 5 6 7 8 9 10 11 12 13 14 15
Temperature (°C)
Figure 5.10 Headspace am ount of C 0 2 changes under various storage tem pera tu res for 12 h rs storage of fresh beef.

96
condition) for each 1"C rise (Fig. 5.10). For an in itia l atm osphere of 50% C 0 2
plus 50% N 2, 12 h rs am ount of C 0 2 change was approxim ately parallel w ith
the 100% C 0 2 line, and tem perature effect on C 0 2 absorption was alm ost the
sam e as the 100% C 0 2 atm osphere. W hen an in itial atm osphere of 20% C 0 2
plus 80% N2 was used, the am ount of 12 h rs C 0 2 change appeared negative in
Fig. 5.10. This is because additional C 0 2 was evolved from beef tissues for
20% C 0 2 levels. The am ount of evolved C 0 2 was in excess of the am ount
absorbed. Figure 5.10 shows th a t tem perature also affected am ount of C 0 2
evolution. The higher the storage tem perature, the larger the am ount of C 0 2
evolved from beef.
The in itial C 0 2 concentration in headspace greatly affected the dynamic
changes inside the package microenvironment. Carbon dioxide will not only
influence the growth of various microorganisms, bu t also the respiration and
other biochemical reactions w ithin m eat tissues, thereby controlling the
am ount of C 0 2 w ithin the headspace. Since storage tim e was lim ited to 12 h rs
in th is work, the contribution of microbial growth on am ount of C 0 2 changes
can be considered very small.
The m ajor factors th a t influence the am ount of C 0 2 changes include C 0 2
absorption in packaged m eat, diffusion of C 0 2 from a pre-formed C 0 2 pool in
the m eat, aerobic energy metabolism within the m eat cells, and other
biochemical reactions w ithin m eat (Enfors and Molin 1984; Gill 1988). For an
in itial 100% C 0 2 package, respiration and other aerobic energy m etabolism are

97
considered to be inhibited by high concentration of C 0 2 in headspace.
M eanwhile, since C 0 2 is highly soluble in both w ater and oil, it will be
absorbed by the muscle and fat tissues until apparen t equilibrium is a tta ined
(Fig. 5.11). W hen a gas m ixture of 50%CO2 plus 50%N2 was used, the
respiration and other biochemical reactions th a t evolve C 0 2 into the headspace
were still inhibited by the in itial am ount of C 0 2 in headspace, and C 0 2
absorption still played a m ajor role in headspace gas changes. However, the
am ount of C 0 2 absorbed by beef was m uch sm aller th an 100%CO2 package
(Fig. 5.11). W hen the in itial C 0 2 concentration was decreased to 20%, the
am ount of C 0 2 evolved was in excess of the am ount of C 0 2 absorbed by m eat.
Therefore, the final am ount of C 0 2 in the headspace increased, appearing as
a negative am ount of C 0 2 absorbed by the m eat in Fig. 5.11.
A statistical model describing the relationship of the 12 h rs am ount of
C 0 2 change w ith storage tem pera tu re and in itia l volume percentage of C 0 2
was developed by using SAS REG procedure:
2 1 ^ = 6 .2 0 3 1 5 8 - 0.024193*7’+ 0.020377*[C02] (5.7)
The model relates M(;02 (g(;o2/kgnK,.lt)(t=12) as a linear function of tem pera tu re
(K) and in itial C 0 2 concentration (%). The coefficient of determ ination for Eq.
(5.7) is 0.97.

Net
amou
nt o
f C
02 ch
ange
s (g
C02/k
g
98
3°Cre®E
0.80.60.40.2
- 0.2-0.4
0 10 20 30 40 50 60 70 80 90 100
Initial concentration of C02 (%)
Figure 5.11 Headspace amount of C 02 changes under various initial C02 percentages for 12 hrs storage of fresh beef.

99
5.3.2 Headspace Gas Composition and Pressure Changes
In the experim ent of storage conditions effect on headspace am ount of
C 0 2 changes, gas compositions were m easured by using gas analyzer on each
beef sam ple a t the end of vacuum /back-flush and the end of each experim ent
to assure cham ber in tegrity and observe any changes th a t m ay have occurred
in gas composition during 12 h rs storage. The headspace gas composition
changes during 12 h rs storage are shown in Table 5.8. Analyzed values were
generally lower for C 0 2 th an label composition in gas tan k and higher for N2
and 0 2. This may be explained by the lack of complete elim ination of
headspace a ir during the vacuum /back-flush procedure used to introduce the
desired prem ixed gas in the headspace. The headspace of packages initially
containing 100% C 0 2 revealed few changes in the percentages of C 0 2 and N2
during 12 h rs storage, w hereas, packages initially containing 50%CO2 showed
a decrease in the percentages of C 0 2 and increase in percentages of N2. This
fu rth er confirmed th a t C 0 2 was absorbed by packaged beef for an in itial 100%
or 50% C 0 2 atm osphere.
The headspace of fresh beef packaged in an in itial 20% C 0 2 atm osphere
showed an increase in the C 0 2 concentration after storage for 12 hrs. The
increase in C 0 2 concentration m ay have resulted in C 0 2 evolution from m eat
tissues caused by reduced inhibition of biological activity a t lower C 0 2 in itial
concentration levels. The headspace gas composition changes were also
affected by storage tem perature , especially for the package in itially containing

Table 5.8. Volume percentages of headspace gas composition changes during12 hrs storage for fresh beef.
Temp Specified in itial In itial composition Final compositioncomposition via gas analysis via gas analysis
°C C 0 2 N2 Q2 C 0 2 N2° 0 2 C 0 2 N2a 0 2
3 100 0 0 98.3 1.4 0.3 98.0 0.8 1.298.5 1.5 0.0 98.2 1.5 0.3
50 50 0 48.3 51.5 0.2 45.2 54.6 0.248.1 51.4 0.5 42.7 56.6 0.7
20 80 0 18.4 81.6 0.0 21.4 78.4 0.219.1 80.8 0.1 19.8 79.7 0.5
8 100 0 0 97.0 2.6 0.4 95.9 3.5 0.697.3 2.3 0.4 94.1 4.8 1.1
50 50 0 47.5 52.0 0.5 42.2 57.0 1.846.8 52.8 0.4 40.8 58.8 0.4
20 80 0 18.1 81.6 0.3 19.0 79.4 1.618.6 81.3 0.1 20.0 79.7 0.3
13 100 0 0 98.5 1.0 0.5 97.3 2.1 0.696.8 2.9 0.3 95.4 4.2 0.4
50 50 0 47.4 52.2 0.4 42.8 56.3 0.947.3 52.3 0.4 42.5 57.2 0.3
20 80 0 19.7 80.0 0.3 27.4 72.2 0.419.1 80.5 0.4 25.1 74.4 0.5
u N2 volume percentage estim ated by difference.
101
20% C 0 2, a h igher tem perature caused an increase in headspace C 0 2
concentration after 12 h rs storage. This is evidence th a t h igher tem peratures
accelerate reactions th a t evolve C 0 2.
Previous research data on headspace gas composition changes for
various C 0 2 plus N2 atm ospheric packages is sum m arized in Table 5.9.
Exam ination of sum m ary results revealed sim ilar findings to th is work.
Differences in the values of gas composition changes resulted from the
differences in storage tem peratures, packaging m aterials and specific m eat
products. The reason headspace C 0 2 and N2 composition change during
storage can be explained considering m eat itse lf to have dynamic properties
(Sebranek 1986). These dynamic properties w ithin m eat caused headspace gas
composition changes during storage, fu rther in teracting w ith headspace gases
in response to new conditions inside package to produce new changes w ithin
headspace gas conditions.
The dynamic properties within MAP m eat are confounded with microbial
m etabolism (Enfors and Molin 1984), C 0 2 absorption by packaged m eat (Gill
1988; Taylor and MacDougall 1973; Seidem an et al. 1979a), m eat tissue
respiration ( Seidem an et al 1979a; Enfors and Molin 1984; Jackson et al. 1992),
packaging film perm eability (Lam bert et al. 1991), and the interactions of
tem pera tu re and headspace volume w ith these reactions (Daun et al. 1977).
From Table 5.9, when initial 100% C 0 2 was used, the microbial growth and
respiration m etabolism of m eat tissues is considered to be inhibited. Moreover,

Table 5.9. Summarized previous works on headspace gas composition changes for various initial gas atmospheres of C02 plus N2 at 3 to 7°C for about 2 to 3 weeks storage.
Initial Atms. Changes of Gas Composition
Reasons References
100% C02
50%CO,+50%N240%C02+60%N2
C02%l“ A * = l %
N2% Tb A = l %
C02%i A =3% N2% T a =3%
C02 absorption in meat and gas diffusion by packaging films
C02 absorption by meat plus gas diffusionby packaging filmsMicrobial growth may cause oppositeeffect on C02 and N2 concentration changefor a longer storageDepend on temperature
Seideman et al. 1979a Spahl et al. 1981 Jackson et al. 1992 Jackson et al. 1992 McMullen et al. 1991
20%C02+80%N2 C02%T A* 15% N2% i A* 15%
Meat respiration and microbial metabolism Gas diffusion by packaging film Depend on temperature
Seideman et al. 1979 Lambert et al. 1991 Jackson et al. 1992
100% n 2 C02%t a = 4~10 N2% i a = 4~ 16%
Meat respiration and microbial growth Gas diffusion by packaging films Depend on temperature
Lambert et al. 1991 Laleye et al. 1984 Enfors and Molin 1984
a Decrease of concentration b Increase of concentration

103
because C 0 2 is highly soluble in m eat tissue and fat, C 0 2 is absorbed
continuously by m eat until reaching sa tu ra tion or apparen t equilibrium . For
C 0 2 plus N 2 package atm ospheres w ith in itial C 0 2 concentration higher th an
40%, absorption played a m ajor role in headspace gas dynam ics during the first
two or th ree weeks storage. However, C 0 2 concentration increased w ith longer
storage tim e, owing to significant microbial growth, respired 0 2, and evolved
C 0 2 after longer storage tim es (McMullen et al. 1991 and Jackson et al. 1992).
W hen in itial C 0 2 concentrations are less th an 20%, the level usually
considered as the m inim um concentration to inhib it microbial growth,
microbial m etabolism , m eat tissue respiration, and the diffusion of C 0 2
possibly from preformed C 0 2 pool in m eat cells become im portan t (Enfors and
Molin 1984). U nder these conditions, am ounts of C 0 2 evolution and headspace
C 0 2 concentration increase.
In th is work, only the effect of storage condition on headspace gas
composition changes was exam ined. Since only 100% C 0 2 was used in
packaging/product configuration experim ent, and gas composition was alm ost
constant for a 100% C 0 2 package, it is unclear how packaging/product
configuration affected headspace gas composition changes during storage from
th is work. I t is well recognized th a t changes in headspace gas composition
directly affected the quality and shelf life of m eat. Furtherm ore, the use of a
packaging atm osphere containing only C 0 2 and N2 has proven the most
effective in creating a long-term storage environm ent for fresh beef th a t

104
m aintains quality and m inim izes weight loss during storage (Seidem an et al.
1979; Spahl et al. 1981; Fu et al. 1992).
5.3.3 Factors of Selection of Initial MAP Conditions
The headspace gas pressure determ ines the external appearance of a
package. For example, a headspace pressure less th an atm ospheric pressure
causes collapse of a package, whereas pressure higher th an atm ospheric
resu lts in swollen and possibly broken packages. E ither of these conditions
m ight cause consum ers to m istake package appearance with the quality of
packaged m eat. The headspace gas pressure is determ ined by the partial
pressure of each individual gas inside the package, in itially influenced by
packaging/product configuration, storage conditions, and the dynamic
interactions of m eat w ith each of the headspace gases. In th is work, the
headspace gas pressure changes under various storage conditions and
packaging/product configurations during 12 h rs storage have been observed.
Figure 5.12 shows th a t for each storage tem pera tu re there exists a
in itial gas composition range th a t can control headspace gas pressure alm ost
constant during storage. For example, an in itial concentration of 28% to 45%
C 0 2 balanced with N2 w ithin a package can achieve stable headspace gas
pressures w ithin ±5.0 kPa a t 13°C (Fig. 5.12). The in itial concentration of C 0 2
required to achieve headspace pressure stable is related to tem perature . The
lower the storage tem perature , the lower the in itial C 0 2 concentration is

Gas
pres
sure
ch
ange
s (P
0-P)
(kPa
)
105
40
35302520
-10
-15-20
0 10 20 30 40 50 60 70 80 90 100
Initial concentration of C 02 (%)
Figure 5.12 Different pressure changes in headspace under various storage temperatures and initial C02 percentages for 12 hrs storage of fresh beef.

106
needed to achieve constant headspace gas pressure. Furtherm ore, packaging
param eters , such as headspace-to-m eat volume ratio and surface area and
volume of m eat sam ple are significant factors in determ ining headspace gas
pressure changes. As discussed in section 5.2, a higher headspace-to-m eat
volume ratio provides opportunity for a larger am ount of headspace gas to
in te rac t w ith the m eat. In tu rn th is causes less change in headspace gas
pressure changes. However, a higher headspace-to-m eat volume ratio may
increase the cost of a package.
The in itial headspace gas pressure influences headspace pressure
changes during storage. D ifferent in itial gas p ressures (155 kPa and 111 kPa)
were exam ined on headspace gas pressure changes a t 8°C (Table D3). Results
indicate th a t a lower in itial gas pressure caused sm aller headspace gas
pressure changes compared with a relatively high in itial gas pressure during
storage (Fig. 5.3). This is because the small pressure difference between
headspace and surface layer of m eat sam ple resu lts in a sm aller am ount of
C 0 2 absorption by m eat. It is apparen t th a t the selection of suitable in itial
headspace gas composition is a complex problem, and is a very im portan t step
in design of MAP system s for fresh m eat. Selection depends on the effects of
microbial growth, desired m eat quality and shelf life, as well as the appearance
of a package. The optim al in itia l gas composition can not be achieved w ithout
considering all in terre la ted factors.

107
5.3.4 Additional Comments, Observations and Study Limitations
As discussed above, both storage tem pera tu re and in itia l C 0 2
concentration are significant factors on C 0 2 headspace behavior during storage
of C 0 2 plus N2 MAP beef. A high tem pera tu re accelerates C 0 2 headspace
changes, and headspace am ount of C 0 2 m ay decrease or increase during
storage depending on the in itial concentration of C 0 2.
Drip loss in packaged m eat has been widely used as a param eters to
judge effectiveness of packaging m ethod during storage. A high drop loss will
resu lt in economic loss, loss of nu trien ts contained in the liquid purge,
unsightly appearance, and lower consum er acceptance. In itial gas composition
has been shown to influence the am ount of drip loss from packaged m eats
(Seideman et al. 1979a). Seidem an et al. (1979a) reported th a t an atm osphere
initially containing 100% N2 significantly lower drip loss compared to m eat
th a t was vacuum packaged or packaged in 100% C 0 2. Seidem an et al. (1979a)
suggested th a t C 0 2 may bind to protein in a m anner th a t alters th e ir ability
to hold m oisture, w hereas N2 packaged m eat had a g rea ter water-holding
capacity. The drip loss also has been m easured in th is work for fresh beef
packaged under various packaging/product configurations and storage
conditions (Table 5.6). However, no significant differences were found on drip
loss in th is work. The reason m ay be th a t the storage time, 12 hrs, was not
long enough to reflect an effect on the factors influencing drip loss. F u tu re in
package experim ents considering various storage periods would be useful to
108
exam ine the influence of various packaging/product configurations and storage
conditions on the drip loss of MAP beef.
M eat compositions (e.g., m oisture content and fat content), pH and other
biological factors can greatly affect C 0 2 absorption in packaged m eat (Gill
1988). The various biological factors th a t could influence C 0 2 absorption were
assum ed constant for experim ental tria ls conducted in th is study. All beef
sam ples w ithin an experim ent were obtained from the inside round muscles
(,sem im em branosus) from cattle having the same age and finishing. Moreover,
uniform processing procedure in slaughtering and chilling were applied to all
beef m uscles before they were examined in th is work. M oisture content, fat
content, and pH value for all m eat sam ples were m easured as 72.00±2.0%,
2.5±2.0, and 5.5±0.2, respectively, to ensure there are no significant difference
among these param eters.
Since only one tes t cham ber was used in th is work, the post packaging
age of vacuum packed beef sam ples before testing ranged from one to six days.
M eat is dynamic, and some biological reactions m ay have occurred during post
m ortem vacuum storage. This may cause different in itial s ta tu s of beef
sam ple, thereby resulting in experim ental error in C 0 2 absorption estim ation.
This problem could be solved by using m ultiple cham ber system to avoid the
differences in in itial s ta tu s of beef samples.
In th is work, a 3 x 3 factorial CRD (Completed Randomly Design) w ith
2 sam pling was used to examine the effect of different tem perature and in itial

109
C 0 2 concentration on headspace am ount of C 0 2 changes during 12 h rs storage.
This experim ental design has an assum ption th a t all beef sam ples have sam e
biological characteristics. If the influence of biological factors on am ount of
headspace C 0 2 changes were to be considered, a 3 x 3 factorial design
confounded in blocks of beef muscles m ust be used to consider the differences
among different beef muscles (Petersen 1985). In order to achieve confounded
design, a t least 6 pieces of beef m uscles have to be used for the sam e 3 x 3
factorial design. The final layout for such an experim ent is shown in Table
5.10.
The effect of packaging/product configuration and storage condition on
12 hrs am ount of headspace C 0 2 changes (both absorption and evolution) have
been studied separately in th is work. As discussed in section 3.3, the
knowledge obtained from these studies can be used to fu rther develop a
m athem atical relationship rela ting am ount of headspace C 0 2 changes with
both packaging/product param eters and storage param eters. This can be
achieved by combining individual equations rela ting am ount of C 0 2 changes
w ith packaging/product configurations, Eq. (5.5) and with individual storage
conditions, Eq. (5.7) because the constants in Eq. (5.7) are in fact functions of
packaging/product param eters. Therefore, a new equation th a t has combined
all packaging/product param eters and storage param eters together can be
developed. The new coefficients in the developed equation can be solved by
using experim ental data sets and SAS procedures. Since the data collected

110
Table 5.10. E xperim ental p lan for a 3 x 3 factorial experim ent confounded in blocks of 3, w ith replicated twice.
G2T2 50% CO., 8°C
G3T2 100% CO., 8°C
G3T1 100% CO., 3°C
G3T3 100% CO., 13°C
G1T3 20% CO., 13°C
G2T3 50% CO., 13°C
G2T3 50% CO., 13°C
G2T1 50% CO., 3°C
G1T2 20% CO., 8°C
G2T2 50% CO., 8°C
G3T2 100% CO., 8°C
G3T1 100% CO., 3°C
G3T3 100% CO., 13°C
G1T3 20% CO., 13°C
G2T3 50% CO., 13°C
G2T3 50% CO., 13°C
G2T1 50% CO., 3°C
G1T2 20% CO., 8°C

I l l
during th is study was lim ited in the num ber of packaging/product
configurations considered, the quan tita tive relationship betw een headspace
C 0 2 changes w ith packaging/product configuration and storage conditions can
not be determ ined.
5.4 Verification of Microbial Population Growth Models
A prediction model is valuable only if it can be shown to successfully
im itate the actual physical situation to which it was designed to correspond.
Verification can be obtained by comparing the resu lts of predicted w ith a model
w ith observed experim ental data. W ithin th is section, the predictive ability of
microbial population growth ra te models incorporating MAP critical conditions
will be illustra ted . Also, the accuracy of two models on the prediction of L.
monocytogenes and P. fluorescens growth will be evaluated by using statistical
analyses on the residuals between predicted and observed data .
5.4.1 Model Predictions for Microbial Population Growth
The purpose in constructing m athem atical descriptions of population
growth ra te coefficients was to predict the total population of bacteria during
log phase growth for various atm ospheric compositions and storage
tem pera tu res used in MAP. The growth ra te coefficient was statistically
related to [0 2], [C 02], and tem pera tu re using Eq. (3.23) and Eq. (3.25) for both
L. monocytogenes and P. fluorescens. The calculated generation tim e using the
m ethod descirbed in section 3.3.1 forL. monocytogenes and P. fluorescens under
various tem peratures and in itial gas compositions are listed in Table 5.11.

112
Table 5.11 Calculated generation tim e (G) and growth ra te coefficient (k) of L. monocytogenes and P. fluorenscens under various modified atm osphere conditions.
T reatm entL. monocytogenes P. fluorenscens
G (day) k (1/day) G (day) k (1/day)
3°CAira 1.6418 0.4222 1.003 0.6908M A lh 3.6120 0.1919 3.010 0.2303MA2C 3.0100 0.2303 3.010 0.2303
7°CAir 1.2040 0.5757 0.5190 1.3356M AI 1.6420 0.4222 0.9030 0.7676MA2 3.0100 0.2303 0.9030 0.7676
i r eAir 0.3168 2.1877 0.2150 3.2239MAI 0.3541 1.9574 0.3010 2.3028MA2 0.4631 1.4968 0.3225 2.1493
Note: a packaged in air;b packaged in modified atm osphere 1; c packaged in modified atm osphere 2.

113
Table 5.12 presen ts values of the coefficients determ ined for Eq. (3.23) and
(3.24), and p aram eter estim ates found for Eq. (3.25) and (3.26) are listed in
Table 5.13. Since the SAS NLIN procedure did not provide values for the
regression coefficient R2 from Eq. (3.25), R2 was computed to equal (1- Residual
sum of square/Corrected total sum of square). H igh R2 coefficients indicated
th a t Eq. (3.23) and Eq. (3.25) were an appropriate m athem atical form ulation
for describing the relationship of population growth ra te coefficient w ith
tem perature and atm ospheric composition. B acterial population growth ra te
coefficients during log phase were predicted using the regression constan ts in
Eq. (3.23) and Eq.(3.25). In tu rn the growth ra te coefficient was used to
predict the estim ated population from Eq. (3.19) under constant conditions of
tem pera tu re and in itial atm ospheric composition by assum ing an in itial log
phase count from Tables D5 and D6. Figures 5.13, 5.14, 5.15, and 5.16
illu stra te the population estim ated by Eq. (3.19) compared w ith the actual
experim ental data . From Tables 5.12 and 5.13, as well as Fig. 5.13 to 5.16, it
is apparen t th a t Eq. (3.23) and Eq. (3.25) can be used to predict the growth of
L. monocytogenes and P. fluorenscens during log phase accounting for combined
effects of tem pera tu re and atm ospheric composition.
5.4.2 Accuracy of Models Predicting Microbial Population Growth
The models were evaluated for accuracy based on the sum of squares
of residuals, coefficient of determ ination (R2), visual exam ination of distribution
of residuals, and comparison of predicted and observed data.

Table 5.12. Parameters determined for microbial population growth rate coefficient model 1 (Eq. 3.23).
Organisms c0 Ci c2xl0'6 c, xlO'8 R2 %Va
L. monocytogenes 3114.587064 -2.192376 -1.725622 2.38993535 96.77 94.88
P. fluorescens 72.119609 -2.713081 -0.019867 0 96.33 94.12
n Percent variance accounted for (%V) was determined by both the number of observations (n) and the number of terms (N) in the model (N=3 for Eq. (3.4)). Percent variance is more appropriate for relatively few data as a high value for the multiple regression coefficient R2 might give the impression of too good a fit (Davey, 1989). The percent variance was calculated as:
% v=i -
( n - N - 1 )
For all predictions, temperature range 3-ll°C; oxygen concentration range 0%-20.99%; carbon dioxide concentration range 0.03%-80%.

Table 5.13. Parameters determined for microbial population growth rate coefficient model 2 (Eq. 3.25).
Organism s A c0 c, c2 F 2J . V
L. monocytogenes 1.85759e29 39687.01119 -4254.79487 2129.08612 86.2
P. fluorescens 5.82307e30 39416.81621 800.02247 -820.45209 97.5
For all predictions, tem perature range 3-11°C; oxygen concentration range Q%-20.99%; carbon dioxide concentration range 0.03%-80%.

116
L o g C F U / g8
Air
7— MAI 0 MAZ
MAZ6
5
4 0 2 S 8 10 12 H 16 18T i m e ( d a y s )
L o g C F U / g8
Air
7 MAI0 MAZ MA26
5
420 6 8 10 12 16 IBH
T i m e ( d a y s )
L o g C F U / g1
11 c Air
X MAI MAI
0 MAZ MAZ
D 2 8 8 10 12 16 18HT i m e ( d a y s )
Figure 5.13 Comparison of observed (symbol) and predicted (line) growth ofL.m onocytogenes population at 3, 7, and 11°C using a modified andadditive Arrhenius equation (Eq. 3.23).

117
Log CFU/g3 C
Mr
— UAI 0 MAC
MAS
a 12e 1020 ATims (days)
Log CFU/g10
7 C
— Air
X MAI
— MAI
S 14 W «10 12S0 2 4Tims (days)
1011 C
Figure 5.14 Comparison of observed (symbol) and predicted (line) growth ofL.monocytogenes population at 3, 7, and 11°C using a modifiedArrhenius temperature characteristic equation (Eq. 3.25).

118Log CFU/g
11____i____ i____ i____ i____ i____i____i____i____0 2 4 8 8 10 12 H 16 18
Time (dsys)
Log CFU/g10
7 C
0 1 2 8 4 8 8 7 8 0 10 1 1 1 2 1 8 1 4Tims (days)
Lag CFU/g10
■n c Air
X UA1
18 188 128 1040 2Tbne (days)
Figure 5.15 Comparison of observed (symbol) and predicted (line) growth of P.fluorenscens population at 3, 7, and 11°C using a modified andadditive Arrhenius equation (Eq. 3.23).

119
Loo CFU/g
3 C Mr
X UA1
MAI
■x'
19706 ■a 14ao 42Tim# (day#)
Lop CFU/g10 7 C— Air
x MAI
— MAI
Tim# (day#)
Log CFU/g
11 C— Air
X MAI
Time (day#)
Figure 5.16 Comparison of observed (symbol) and predicted (line) growth of P.fluorenscens population at 3, 7, and 11°C using a modifiedArrhenius temperature characteristic equation (Eq. 3.25).

120
The residuals, which are differences betw een observed values and values
predicted by the regression equation, can be thought of as the observed error
if the model is correct. Therefore, the residuals should be random ly d istributed
w ith a m ean of zero when a proposed model is correct. Also, the residuals
should not show indications of tim e dependence or other system atic pa tterns.
Figures 5.17 and 5.18 show the distribution of residuals w ith tim e for two
models onL. monocytogenes and P. fluorescens population growth, respectively.
The residuals of two models for L. monocytogenes appear random ly d istributed
about zero, w ith no tim e dependence observed. However, a curvature is found
for the d istribution of residuals for model 1 and 2 on P. fluorescens. The
p a tte rn of residuals w ith respect to the horizontal line (zero residual) shows
system atic departu res from the overall fit.
The line of fit (zero residual) represents exponential growth of microbial
population a t the average ra te observed in the entire period. A rise in the
p a tte rn of residuals shows a period of microbial population growth a t a faster
ra te th an th a t predicted by the model, while a declining p a tte rn shows a
comparatively slower rate of microbial population growth. A curvature p a tte rn
like those in Fig. 5.18 shows a nonlinear dependence of m icrobial population
growth on time. Residual analysis reveals the dependence of growth on some
variables th a t change over time. For example, the headspace C 0 2 and 0 2 in
fact are not constant during storage because of the dynamic headspace
behavior as described in section 5.3.2. However, the influence of gas composition

Res
idua
ls
- 2 J L J L I I I I L J L-
0 1 2 3 4 5 6 7 8 9 10 11 12 13 14 15 16 17 18
Time (days)
(a). U sing model 1 (Eq. (3.23)).
0 1 2 3 4 5 6 7 8 9 10 11 12 13 14 15 16 17 18
Time (days)
(b). U sing model 2 (Eq. (3.25)).
Figure 5.17 Plot of residuals against time for log number growth of L.m onocytogenes population.

Res
idua
ls
122
2
1.5
1
0. 5
0
-0.5
-1
-1.50 1 2 3 4 5 6 7 8 9 10 11 1213 14 15 16 17 18
Time (days)
(a). U sing model 1 (Eq. (3.23)).
2
1.5
1
ra 3 2 0 <n 0)%.5
-1
-1.5
-20 1 2 3 4 5 6 7 8 9 10 11 12 13 14 15 16 17 18
Time (days)
(b). U sing model 2 (Eq. (3.25)).
Figure 5.18 Plot of residuals against time for log number growth of P.fluorenscens population.

123
change w ith time has not been included in Eq. (3.23) and Eq. (3.25). These
findings suggest fu rther modification of Eq. (3.23) and Eq. (3.25) m ay be
required to express [CO.J and [O J as functions of time.
Moreover, the residuals should be norm ally d istribu ted when the model
is correct. A norm al probability plot can indicate w hether the residuals are
approxim ately norm ally distributed. Since form al sta tistica l m ethod for
predicting microbial population growth using a regression condition depends
on the shape of the d istribution of residuals, questions of norm ality are
eventually useful. Figures 5.19 and 5.20 show the norm al probability plot of
the two models used with L. monocytogenes and P. fluorenscens. The SAS
UNIVARIATE procedure was used to analyze the norm ality of the residuals.
The norm al probability and correlation coefficient for each model are also listed
a t the bottom of the figures. From the norm al probability plot and the value
of norm al probability, it can be concluded th a t the residuals for all models are
well norm ally distributed.
Finally, the plot of residuals against experim ental d a ta (Figs. 5.21 and
5.22) show how the residuals change w ith increased values of the experim ental
data. This plot tells if the accuracy of the models depends on the experim ental
data. For the two models used with L. monocytogenes, the residuals are alm ost
random ly distributed w ith increased experim ental data , and no apparen t
evidence on the residuals increasing as experim ental da ta increase. However,
the residuals increase with increased experim ental data for the two models

124
Norm al probability1.3+ * +
* + + + +I ’ ++++
+ * + ++ + + * *
I +:!- 0 . 1+ * ** ***
I '"•'• +I ++++ Normal probability=0.9807I ++++ Corr. c o e ffic ien ts .0995I ++++I +++ *
-1.5+ *
-2 -1 0 +1 +2 Residual
(a). Using model 1 (Eq. (3.23)).
Normal probability1.3+ * ++
I * + + + +I *+++I ++*+I
0 . 1+*+
I .........+| *:|:*+ :|:+ Normal p robab ilityS .9538I +++++ Coe. c o e ffic ien ts .0005I + + + * *
- 1 . 1+ + + + '* '
-2 -1 0 +1 +2 Residual
(b). Using model 2 (Eq. (3.25)).
Figure 5.19 Normal probability plot of residuals for log number growth of L.monocytogenes population.

125
Norm al Probability
1.5+ +*+I * *,"++
* + + +****+
*+ ++ * *
| + **=l0 . 1+ + + * *
| **+| * * * * * *
I *+++ Normal probability=0.9466I +*+ Corr. co effic ien ts .0042I *+*
-1.3+ :|:+++------- 1------- 1------- 1------1--------- (------- 1------- 1------- j------- 1------- 1_
-2 -1 0 +1 +2 Residual
(a). Using model 1 (Eq. (3.23)).
Norm al probability
1.75+ * +*+++* * * + * + + + +
++-"■"-+++ + * * * * + * *
* :|:*+:|:+++ Normal probability=0.9660 +++*+++ Corr. coefndent=0.0191
-1.75++++:|:+ - — + . — +
-2 -1 0 +1 +2 Residual
(b). Using model 2 Eq. (3.25)).
Figure 5.20 Normal probability plot of residuals for log number growth of P.fluorescense population.

126
2-0.5
Experimental Data (Log,0CFU/g)
(a). Using model 1 (Eq. (3.23)).1.5
Experimental Data (Log10CFU/g)
(b). Using model 2 (Eq. (3.25)).
Figure 5.21 Plot of residuals against log number growth of L. monocytogenespopulation.

127
3.5 4.0 4.5 5.0 5.5 6.0 6.5 7.0 7.5 8.0
Experimental Data (Log10CFU/g)
(a). Using model 1 (Eq. (3.23)).
1.5
to 0.5313«0) n
DC u
-0.5
-1
. 1 _51 i ,i i i i i -L- i - i j t i i i i i i i i i i i i i i i i i i i i i i i i i i i i i i i i i
3.5 4.0 4.5 5.0 5.5 6.0 6.5 7.0 7.5 8.0
Experimental Data (Log10CFU/g)
(b). Using model 2 (Eq. (3.25)).
Figure 5.22 Plot of residuals against log number growth of P. fluorenscenspopulation.

128
predicting growth of P. fluorenscens. This m eans th a t the prediction of
population growth on P. fluorenscens is more precise in predicting microbial
populations ranging up to 6 log]()CFU/g, where the residuals show less spread
about the zero residual line.
In sum m ary, all sta tistical analysis of the accuracy of the models
dem onstrated th a t e ither of the two models proposed m ay be used w ith
confidence to predict the population growth of L. monocytogenes and P.
fluorescens on chicken under various gas atm ospheres and refrigeration
tem peratures. The two models used for predicting growth of P. fluorenscens
population have relatively lower accuracy compared w ith the models for L.
monocytogenes.
5.4.3 Prediction of Microbial Population Growth
The use of Eq. (3.23) and (3.25) to predict bacterial population growth
are lim ited to determ ine log phase growth based on the choice of the in itia l
population a t the beginning of log phase. The accuracy of growth ra te
coefficient k rela tes to selection of experim ental observations w ithin the log
phase. The difficulty in selecting the range of log phase growth increases w ith
the non-linearity of experim ental observations. The accuracy of the calculation
of the growth ra te coefficient will sim ultaneously affect the accuracy of the
models. Modified atm osphere storage significantly lengthens the lag phase of
P. fluorenscens. Furtherm ore, the length of the lag phase is dependent on
atm osphere composition and tem perature. Therefore, different tim es m ust be

129
chosen as the in itial growth tim e for log phase predictions. From the
experim ental da ta listed in Tables D5 and D6, it can be seen th a t i t is difficult
to estim ate where log phase sta rts . For example, the in itia l lag time for L.
monocytogenes a t 3°C in a ir is th ree days, bu t extends to six days for modified
atm osphere 1. F u rth e r discussion of lag phase extension for the data was
presented by M arshall et al. (1991).
Eq. (3.23) expressed tem perature and ( l+ [0 2])/(l+ [C 02]) in term s of an
additive equation, i.e., there was no interaction. The good agreem ent between
predications of th is equation and the experim ental d a ta suggested th a t both
tem pera tu re and gas composition act on microbial growth in the log phase.
Carbon dioxide is more inhibitory on the growth of microbial population a t 3"C
th a n a t 7" and 11°C as shown in Fig. 3.1. Findings indicate th a t MAP is
tem pera tu re sensitive and the m ost effective way to inhib it microbial growth
is by using high concentrations of C 0 2 and low tem perature. Because Eq.
(3.23) was quadratic in term s of 1/T and ( l+ [0 2])/(l+ [C 02]), the m inim um data
th a t can reasonably be fitted m ust be a t least three levels for each of
tem pera tu re and gas composition. Additional levels of both tem pera tu re and
gas composition would be desirable for model development.
The resu lts of the p resen t investigation are lim ited to Eq. (3.23) and
(3.25), and do not necessarily represent the best fit equations for the
experim ental data . The lim ited am ount of experim ental d a ta appropriate to
model developm ent currently constrains derivation of more complex predictive

130
equations for MAP applications. F u rther studies explicitly designed for model
development are required. The nonlinear A rrhenius equation (Schoolfield et
al. 1981) m ay be very efficient for predicting bacterial population growth for
combined gas atm osphere and tem perature. However, it is alm ost impossible
to realize population growth prediction in th is case because a t least eight
param eters need to be determ ined in nonlinear A rrhenius equation. In the
p resen t study, nine groups of experim ental d a ta were used, thereby lim iting
the param eters of nonlinear A rrhenius equation th a t could be estim ated.
It m ust be noted th a t Eq. (3.23) and (3.25) are empirical. From a
practical standpoint, therefore, use of these descriptions will be predicated on
how successfully they fit da ta over a wide range tem peratures and gas
compositions. Also, the ease of model usage m ust be considered. W ith respect
to these criteria, the equations presented have the advantage th a t they can be
fit to da ta using statistical software th a t is available on m ost computer's. I t
should also be noted th a t the values determ ined for model coefficients reflect
other factors, such as substra te , therm al history, and laboratory techniques.
For given stra ins of bacteria, or different bacteria with differences in these
factors, there m ight, therefore, be significantly different values obtained for the
model coefficients. A comparison of model coefficients could be m ade all the
more useful if laboratory techniques were standardized.
Eq. (3.23) and (3.25) have been constructed based on experim ental data
for L. monocytogenes and P. fluorescens. Since L. monocytogenes is

131
facultatively anaerobic, and P. fluorescens is aerobic, i t is not clear if the form
of these equations are applicable to stric t anaerobic organism s. Furtherm ore,
o ther species of bacteria are likely to be have different m agnitudes of
regression param eters for sim ilar growth conditions. The m athem atical
form ulation of the equations do not preclude application in a wide varie ty of
conditions, bu t have only been dem onstrated for ranges of [0 2] from 0% to
20.99% and [CO.,] from 0.03% to 80% under refrigeration tem pera tu res.
Therefore, when using the models care m ust be taken not to extrapolate
beyond the range lim ited given in Tables 5.12 and 5.13. Additional
experim ental da ta are needed to confirm the potential of using Eq. (3.23) and
Eq. (3.25) for organism s and conditions extrapolated beyond the lim its given
in Table 5.12 and 5.13.
VI. SUMMARY AND CONCLUSIONS
6.1 Investigation Summary
W ith increasing dem ands on enhancem ent of safety, quality and shelf
life of m eats, MAP has a secure role in industria l applications. The quality
and shelf life of MAP m eats are affected by in teractions w ith the in-package
m icroenvironm ent th a t, in tu rn , are reflected in the dynam ic behavior of
headspace gases. Therefore, the goal of th is research was to investigate the
fundam ental aspects of headspace gas behavior w ith respect to packaging
configuration and storage conditions w ithin the in-package environm ent. The
theoretical considerations presented in th is research could serve as the basis
for developing a MAP design methodology th a t would predict the am ount of
headspace C 0 2 changes based on packaging/product configuration and storage
conditions. Microbial population growth predictions given specific MAP
conditions could also be considered. This work is the first step in
understand ing the influence of packaging param eters, storage tem perature ,
and gas m ixture combinations on MAP headspace behavior. The aim is to
provide baseline data by which production and processing standards necessary
for safe, wholesome and a ttractive fresh beef product will readily available
industry wide. The research inform ation generated could tran sfe r into a
scientific basis for im provem ent of packaging m ethods and provide valuable
inform ation necessary for fu ture decisions and m arke t research on case-ready
packaging system s for meat.
132

133
A headspace gas m onitoring system was fabricated to im ita te headspace
conditions used in MAP for beef. The ideal gas law was suggested as the
scientific basis to estim ate headspace am ount of C 0 2 changes during storage.
W ith th is method, packaging/product configurations and storage conditions
were exam ined for influence on changes in the am ount of C 0 2 in C 0 2 plus N 2
MAP atm ospheres. Packaged fresh beef was studied to find significant MAP
design param eters and how these param eters affect dynamic headspace gas
behavior. This research represents the first work to p u t the detail design of
MAP m eat on the theoretical basis by considering the dynam ic behavior of
headspace gases during storage. The resu lts obtained have provided
inform ation to estim ate design criteria for packaging system th a t improve the
keeping quality and shelf life of MAP meat.
Microbial growth behavior for MAP conditions was investigated by
deriving two prediction models for microbial population growth ra te coefficient
based on the modifications of the classic A rrhenius equation. The models were
verified for chicken a t various storage tem pera tu res and in itia l gas
compositions. The prediction model represents the first work to combine in itial
gas composition as an independent param eter in microbial population growth
models. The accuracy of the models has been evaluated by using sta tistical
analysis on residuals.

134
6.2 Specific Investigation Conclusions
Specific conclusions resu lting from th is investigation are as follows:
1) A gas m onitor system im itating modified atm osphere packaging was
designed and build based on ideal gas law to estim ate headspace am ount of
C 0 2 changes during 12 h rs storage. The system was dem onstrated w ith fresh
beef and shows advantages in simplicity, convenience and a high degree of
accuracy.
2) The resu lts of packaging/product configuration investigation indicated
th a t headspace-to-m eat volume ratio was the m ost significant factor
influencing C 0 2 headspace behavior. Surface area and volume of m eat sam ple
as product param eters also affected changes in am ounts of headspace C 0 2.
3) The investigation of storage conditions revealed th a t tem pera tu re and
in itial gas composition greatly affect the C 0 2 headspace behavior. W hen in itial
C 0 2 percentage was larger th an about 35% balanced w ith N 2, the ne t
absorption of headspace C 0 2 was observed in packaged m eat, otherwise, net
C 0 2 evolution was observed. Both C 0 2 absorption and evolution were
influenced by storage tem pera tu re . A higher storage tem pera tu re reduced C 0 2
absorption, while increasing CO., evolution.
4) Two m athem atical equations based on modifications of the classic
A rrhenius equation were shown to predict the effect of tem pera tu re and
percentage ratio of oxygen to carbon dioxide on the population growth rate
coefficient for L. monocytogenes and P. fluorescens in chicken nuggets. The

135
equations are sensitive to in itial cell concentration a t the beginning of log
phase growth.
6.3 Topics for Future Investigations
R elevant topics for related future research include:
1) Development of an autom ated gas m onitoring system to m easure gas
composition changes of muscle foods stored under modified atm osphere
conditions. A data acquisition system should be in teg rated into such a
m onitoring system to autom atically record changing gas pressure, tem perature,
and concentrations of C 0 2 and 0.,.
2) Investigation of the gas dynamic in teractions w ith modified
atm ospheres in itially containing C 0 2, N.2, and 0 2.
3) Derivation of a m athem atical model to predict C 0 2 headspace
behavior by combining both packaging/product configurations and storage
conditions.
4) Im plem entation of da ta collection in microbial growth under modified
atm ospheric conditions in a m anner th a t lends itse lf to modelling. Use of a
m odeling approach for microbial storage studies would produce enough data
to develop models th a t would consider four phases of microbial growth.
F u rth e r studies are needed to verify the modeling struc tu re proposed.

REFERENCES
Andrich, G., Fiorentini, R., Tuci, A., and Galoppini, C. 1989. Skin perm eability to oxygen in apples stored in controlled atm osphere. J . Amer. Soc. Hort. Sci. 114(5): 770-775.
Asensio, M.A., Ordonez, J.A. and Sanz, B. 1988. Effect of carbon dioxide and oxygen enriched atm osphere on the shelf- life of refrigerated pork packed in p lastic bags. J. Food Prot. 51(5): 356-364.
B aird-Parker, A.C. and Kilsby, D.C. 1987. Principles of predictive food microbiology. J . Appl. Bacteriol. 63(6): 43S-49S.
Baker, R.C., Q ureshi, R.A. and Hotchkiss, J.H . 1986. Effect of an elevated level of carbon dioxide containing atm osphere on the growth of spoilage and pathogenic bacteria a t 2, 7, and 13°C. Poultry Sci. 65(4): 729-737.
Bartkow ski, L., Dryden, F.D. and Marchello, J.A. 1982. Q uality changes of beef steaks stored in controlled gas atm osphere containing high or low levels of oxygens. J. Food Prot. 45(1): 41-45.
Beyer, W.H. 1976. Table of random units, 499-502. In S tandard m athem atical tables. 24th ed. CRC Press Public., Cleveland, Ohio.
Broughall, J.M ., Anslow, P.A. and Kilsby, D.C. 1983. H azard analysis applied to microbial growth in foods: developm ent of m athem atical models describing the effect of w ater activity. J . Appl. Bacteriol. 55(1): 101-110.
Broughall, J.M . and Brown, C. 1984. H azard analysis applied to microbial growth in foods: developm ent and application of three-dim ensional models to predict bacterial growth. Food Microbiology. 1: 13-22.
Buchanan, R.L. and Phillips. 1990. Response surface model for predicting the effects of tem pera tu re pH, sodium chloride content, sodium n itrite concentration and atm osphere on the growth of Listeria monocytogenes. J . Food Prot. 53(5): 370-381.
B uchanan, R.L. 1991. U sing spreadsheet software for predictive microbiology applications. J. Food Safety. 11: 123-134.
Bush, P. 1991. Packaging for fresh perceptions. P repared Foods. 160(4): 104- 106.
136

137
Butler, O.D., B ratzler, L .J. and M ailm an, W.L. 1953. The effect of bacteria on the color of prepackaged retail beef cuts. Food Technol. 7(10):397-400.
C handler, R.E. and McMeekin, T.A. 1989a. Modelling the growth response of Staphylococcus xylosus to change in tem pera tu re and glycerol concentration/w ater activity. J. Appl. Bacteriol. 66(6): 543-548.
C handler, R.E. and McMeekin, T.A. 1989b. Combined effect of tem pera tu re and sa lt concentration/w ater activity on the growth ra te of Halobacterium spp. J . Appl. Bacteriol. 67(1): 71-76.
C hristopher, F.M. 1979. Microbiology of beef packaged in various gas atm osphere. J . Food Prot. 42(3): 240-244.
C lark, D.S. and Lentz, C.P. 1969. The effect of carbon dioxide on the growth of slime producing bacteria on fresh beef. Can. Inst. Food Sci. Technol. J . 2(2): 72-75.
Clark, D.S., Lentz, C. and Roth, L.A. 1976. Use of carbon monoxide for extending shelf-life of prepackaged fresh beef. Can. Inst. Food Sci. Technol. J. 9: 114-117.
Daniels, J.A., Krishnamux'thi, R. and Rizvi, S.S.H. 1985. A review of effect of carbon dioxide on microbial growth and food quality. J . Food Prot. 48(6): 532-537.
D aun, H., Solberg, M., Farnke, W. and Gilbert, S. 1971. Effect of oxygen- em iched atm ospheres on storage quality of packaged fresh m eat. J. Food Sci. 36(6): 1011-1014.
Davey, K.R. 1989. A predictive model for combined tem pera tu re and w ater activity on microbial growth during the growth phase. J . Appl. Bacteriol. 67(5): 483-488.
Deily, K.R. and Rizvi, S.S. 1981. O ptim ization of param eters for packaging of fresh peaches in polymeric films. J . Food Proc. Eng. 5: 23-41.
Dixon, N.M. and Kell, D.B. 1989. The inhibition by CO., of the growth and m etabolism. J. Appl. Bactei’ial. 67(2):109-136.
Empey, W.A., Scott, W.J. and Vickex-y, J.R. 1934. The export of chilled beef -The preparation of the "Idomeneus" shipment at the Brisbane abattoir.Aust. J. Council of Scientific and Industrial Research. 7: 73-77.

138
Enfors, S.-O. and Molin, G. 1978. The influence of high concentrations of carbon dioxide on the germ ination of bacterial spores. J . Appl. Bacteriol. 45(2): 279-285.
Enfors, S.-O. and Molin, G. 1984. Carbon dioxide evolution of refrigerated m eat. M eat Sci. 10(3): 197-206.
Eklund, T. and Jarm und , T. 1983. M icroculture model studies on the effect of various gas atm ospheres on microbial growth a t different tem peratures. J . Appl. Bacteriol. 55(1): 119-125.
F arber, J.M . 1991. Microbiological aspects of m odified-atmosphere packaging technology —a review. J. Food Prot. 54(1): 58-70.
F austm an , C. and Cassens, R.G. 1990. The biochemical basis for discoloration in fresh meat: a review. J . Muscle Foods. 1: 217-243.
Finne, G. 1982. Modified- and controlled- atm osphere storage of muscle foods. Food Technol. 36(2): 128-133.
Fox, J.B . J r . 1966. The chem istry of m eat pigm ents. Agr. Food Chem. 14: 207.
Fu, A.-F., Molins, R.A. and Sebranek, J.G . 1992. Storage quality characteristics of beef rib eye steaks packaged in modified atm ospheres. J . Food Sci. 57(2): 283-287, 301.
G ardner, G.A. 1967. Bacteriology of prepackage pork w ith reference to the gas composition within the pork. J. Appl. Bacteriol. 30(2): 321-333.
Genigeorgis, C.A. 1985. Review microbial and safety im plications of the use of modified atm ospheres to extend the storage life of fresh m eat and fish. Ind. J . Food Microbiol. 1: 237-251.
Gibson, A.M., Bratchell, N. and Roberts, T.A. 1988. Predicting microbial growth : growth responses of Salmonellae in a laboratory m edium as affected by pH, sodium chloride, and storage tem perature . Inc. J . Food Microbiol. 6: 155-178.
Gill, C.C. and Newton, K.G. 1980. Growth of bacteria on m eat a t room tem peratures. J. Appl. Bacteriol. 49(2): 315-323.
Gill, C.O. and Tan, K.H. 1980. Effect of carbon dioxide on growth of m eat spoilage bacteria. Appl. and Enviro. Microbiol. 39(2): 317-319.

139
Gill, C.O. 1988. The solubili ty of carbon dioxide in m eat. M eat Sci. 22(1): 65-71.
Gill, C.O. and Penny, N. 1988. The effect of the in itial volume to m eat weight ratio on the storage life of chilled beef packaged under carbon dioxide. M eat Sci. 22(1): 53-63.
Gill, C.O. and H arrison, J.C.L. 1989. The storage life of chilled pork packaged under carbon dioxide. M eat Sci. 26(4): 313-324.
Greig, M.E. and Hoogerheide, J.C. 1941. The correlation of bacterial growth w ith oxygen consumption. J . Bacteriol. 41(5): 549-556.
H ayakaw a, K-I, Henig, Y.S., and Gilbert, S.G. 1975. Form ulae for predicting gas exchange of fresh produce in polymeric film package. J. Food Sci. 40(1): 186-191.
Henig, Y.S. and Gilbert, S.G. 1975. Com puter analysis of the variables affecting respiration and quality of produce packaged in polymeric films. J . Food Sci. 40(1): 1033-1035.
H erm ansen, P. 1983. Comparison of modified atm osphere versus vacuum packaging to extend the shelf life of reta il fresh m eat cuts. Reciprocal M eat Conference Proceedings 35: 60-64.
H intlian , C.B. and Hotchkiss, J.H . 1986. The safety of modified atm osphere package: a review. Food Technol. 40(12): 70-76.
H intlian , C.B. and Hotchkiss, J.H . 1987. Com parative growth of spoilage and pathogenic organism s on modified atm osphere- packaged cooked beef. J. Food Prot. 50(3): 218-223.
Hotchkiss, J.H ., Baker, R.C. and Q ureshi, R.A. 1985. E levated carbon dioxide atm ospheres for packaging poultry. II. Effects of chicken quarte rs and bulk package. Poultry Sci. 64(2): 333-340.
Hotchkiss, J.H . 1988. Experim ental approaches to determ ining the safety of food packaged in modified atm ospheres. Food Technol. 42(9): 55-64.
Huffm an, D.L. 1974. Effect of gas atm ospheres on microbial quality of pork. J. Food Sci. 39(4): 723-725.
Hwang, S-Y., Bowers, J.A. and Kropf, D.H. 1990. Flavor, texture, color, and hexanal and TBA values of frozen cooked beef packaged in modified atm osphere. J. Food Sci. 55(1): 26-29.

140
Jackson, T.C., Acuff, G.R., V anderzant, C., Sharp, T.R., and Saveli, J.W . 1992. Identification and evaluation of volatile compounds of vacuum and modified atm osphere packaged beef strip loins. M eat Sci. 31(2): 175-190.
Kader, A.A., Zagory, D, and Kerbel, E.L. 1989. Modified atm osphere packaging of fru it and vegetables. CRC Crit. Rev. Food Sci. N utr. 28:1-10.
K autter, D.A., Lynt, R.K., Lilly, T., and Solomon, H.M. 1981. E valuation of the botulism hazard from nitrogen-packed sandwiches. J . Food Proc. 44(1): 59-63.
King, A.D., JR and Nagel, C.W. 1967. Growth inhibition of a Pseudomonas by carbon dioxide. J. Food Sci. 32(5): 575-579
Killeffer, D.H. 1930. Carbon dioxide preservation of m eat and fish. Ind. Eng. Chem. 22: 140-143.
Kline, S.J. and McClintock, F.A. 1953. Describing uncertain ties in singlesam ple experim ents. Mechanical Engineering. 75(1): 3-8.
Koski, D.V. 1988. Is curren t modified/controlled atm osphere packaging technology application to the U.S. food m arket? Food Technol. 42(9): 54.
K raft, A.A. 1986. M eat microbiology, pp.239-278. In Muscle as Food. Bechtel, R .J. (ed.). Academic Press Inc., London.
Labuza, T.P. 1984. Application of chemical kinetics to deterioration of foods. J . Chemical Education. 61(4): 348-353.
Laleye, L.C., Lee, B.H., Sim ard, R.E., Carm ichael, L., and Holley, R.A. 1984. Shelf life of vacuum- and nitrogen-packed pastram i: Effects ofpacaging atm ospheres, tem perature and duration of storage on microflora changes. J. Food Sci. 49(1): 827-831.
Lam bert, A.D., Sm ith, J.P ., and Dodds, K.L. 1991. Effect of headspace C 0 2 concentration on toxin production by Clostridium botulinum in MAP, irrad iated fresh pork. J. Food Proc. 54(8): 588-592.
Ledward, D.A. 1970. Metmyoglobin formation in beef stored in carbon dioxide enriched and oxygen depleted atm ospheres. J . Food Sci. 35(1): 33-37.
Lioutas, T.S. 1988. Challenges of controlled and modified atm osphere packaging: A food company perspective. Food Technol. 43(9): 78-86.

141
Lopez-Lorenzo, P., H ernandez, P., Sanz-Perez, B. and Ordonez, J.A. 1980. Effect of oxygen- and carbon dioxide- enriched atm ospheres on shelf-life extension of refrigerated ground pork. M eat Sci. 4(2): 89-94.
Madden, R.H. and Moss, B. 1987. Extension of shelf life of minced beef by storage in vacuum packages w ith carbon dioxide. J . Food Prot. 50(3): 229-233.
M arshall, D.L. and Schm ist, R.H. 1988. Growth of L isteria monocytogenes a t 10°C in milk preincubated w ith selected Pseudomonas. J . Food Prot. 51(4): 277-282.
M arshall, D.L., W iese-Lehigh, P.L., Wells, J.H . and Farr, A.J. 1991. Com parative growth of Listeria monocytogenes and Pseudomonas fluorescence on precooked chicken nuggets stored under modified atm ospheres. J . Food Prot. 54(9): 841-843, 851.
McMeekin, T.A., C handler, R.E., Doe, P.E., G arland, C.D., Olley, J. Putro, S. and Ratkowsky, D.A. 1987. Model for combined effect of tem pera tu re and salt concentration/w ater activity on the growth ra te of Staphylococcus xylosus. J . Appl. Bacteriol. 62(6): 543-550.
McMillin, K.W., Bidnr, T.D., Wells, J.H ., Koh, K.C. and Ingham , S.C. 1990. Increased shelf life of ground beef with modified atm osphere packaging. Louisiana Agri. 33(3): 3-4.
McMillin, K.W., Bidner, T.D., Felchle, S.E., Dugas, S.M. and Koh, K.C. 1991a. Flavor and oxidative stability of ground beef pa tties as affected by source and storage. J . Food Sci. 56(3): 899-902.
McMillin, K.W., Wells, J.H ., M arshall, D.L., Ingham , S.C., Farr, A.J., Salm an,H.K., Bidner, T.D. and Koh, K.C. 1991b. Retail shelf-life of ground beef pa tties in modified atm osphere packaging with dynamic gas exchange. Paper No. 89, Inst, of Food Technologists, Dallas, TX (Abstr.).
McMillin, K.W., Antie, D.J., H an, D., Salm an, H.K. 1992. Color of beef steaks in modified atm osphere retail packages w ith high oxygen gas. Paper No. 423, Inst, of Food Technologists, New O rleans, LA (Abstr.).
McMullen, L.M. and Stiles, M.E. 1989. Storage life of selected m eat sandwiches a t 4°C in modified gas atm ospheres. J. Food Prot. 52(9): 792-798.
Mitchell, J.L. 1990. Method for packaging perishable products. U.S. P a ten t No. 4,919,955. April 24.

142
Newton, K.G., H arrison, J.C.L., and Smith, K.M. 1977. The effect of storage in various gaseous atm ospheres on the microflora of lam b chops held a t - 1°C. J . Appl. Bacteriol. 43(1): 53-59.
Newton, K.G. and Rigg, W.J. 1979. The effect of film perm eability on the storage life and microbiology of vacuum -packed m eat. J . Appl. Bacteriol. 47(3): 433-441.
O’donnell, C. 1991. MAP m aps future. P repared Foods. 3: 58-59.
Okayam a, T. 1987. Effect of modified gas atm osphere packaging after dip trea tm en t on myoglobin and lipid oxidation of beef steaks. M eat Sci. 19(3): 179-185.
O’Keeffe, M. and Hood, D.E. 1980-1981. Anoxic storage of fresh beef. 2. Color stability and weight loss. M eat Sci. 5(4): 267-281.
O’Keeffe, M. and Hood, D.E. 1982. Biochemical factors influencing metmyoglobin form ation on beef from muscles of differing color stability. M eat Sci. 7(3): 209-228.
Ooraikul, B. and Stiles, M.E. 1991. Modified atm osphere packaging of meat, poultry and the ir product. In Modified atm osphere packaging of food. Ellis Horwood Limited, England.
Ordonez, J.A. and Ledward, D.A. 1977. Lipid and myoglobin oxidation in pork stored in oxygen- and carbon dioxide-enriched atm ospheres. M eat Sci. 1(1): 41-48.
Palumbo, S.A., W illiams, A.C., Buchanan, R.L. and Phillips, J.G . 1991. Model for the aerobic growth of Aeromonas hydrophila K144. J . Food Prot. 54(6): 429-435.
Perry, R.H. and Chilton, K.H. 1973. Pressure m easurem ents, 22-38. In Chemical E ngineer’s Handbook, 5th ed. McGraw-Hill Book Company, New York.
Petersen, R.G. 1985. Confounded block design. In Design and Analysis of Experim ents. Marcel dekker, Inc. New York and Basel.
Phebus, R.K., Draughon, F.A. and Mount, J.R. 1991. Survival of Campylobacter je jun i in modified atm osphere packaged turkey roll. J. Food Prot. 54(3): 194-199.

143
Ratkowsky, D.A., Olley, J ., McMeekin, T.A. and Bell, A. 1982. Relationship betw een tem pera tu re and growth rate of bacterial cultures. J . Bacteriol. 149: 1-5.
Ratkowsky, D.A., Lowry, R.K., McMeekin, T.A., Stokes, A.N. and Chandler, R.E. 1983. Model for bacterial culture growth ra te throughout the entire bioldnetic temper-ature range. J. Bacteriol. 154: 1222-1226.
R ikert, J.A., Ball, C.O. and Stiere, E.F. 1958. Factors affecting quality of prepackaged m eat. II. Color studies. D. Effects of n itrogen and carbon dioxide under different pressure upon color of product. Food Technol. 12(1): 17-23.
Robach, D.L. and Costilow, R.N. 1961. Role of bacteria in the oxidation of myoglobin. Appl. Microbiol. 9: 529.
Roberts, T.A. 1989. Com binations of antim icrobial and processing methods. Food Technol. 43(1): 156-163.
Roney, M.L. 1990. New m ethods of m ain tain ing product quality through package interaction. Pack A lim entaire’90. Conf. Proceedings. B-2.
Roy, S. 1991. Modified atm osphere packaging of fresh produce. FPE I News. 25(2): 3-4.
Saguy, I. and Karel, M. 1980. Modeling of quality deterioration during food processing and storage. Food Technol. 34(2): 78-85.
SAS Institu te Inc. 1988. SAS/STAT U ser’s Guide, Release 6.03 Edition. SAS Institu te Inc., cary, NC.
Saveli, J.W ., Sm ith, G.C., H anna, M.O. and V anderzant, C. 1981. Packaging of beef loin steaks in 75% 0 2 plus 25% C 0 2. I. Physical and sensory properties. J Food Prot. 44(12): 923-927.
Schoolfield, R.M., Sharpe, P.J.H . and M agnuson, C.E. 1981. N on-linear regression of biological tem perature-dependent ra te models based on absolute reaction-rate theory. J. Theor. Bio. 88: 719-731.
Scott, W.J. 1938. The growth of m icroorganism s on ox muscle. III. The influence of 10% carbon dioxide on ra te of growth a t 1°C. J . Aust. Council. Sci. in Res. 11: 266-277.

144
Sebranek, J.G . 1986. ’M eat is dynamic’-fac to rs in controlled atm osphere packs. The N ational Provisioner. 194(19): 10-16.
Seidem an, S.C., Sm ith, G.C., C arpenter, Z.L., Dutson, T.R. and Dill, C.W. 1979a. Modified gas atm ospheres and changes in beef during storage. J. Food Sci. 44(6): 1036-1040.
Seidem an, S.C., C arpenter, Z.L., Sm ith, G.C., Dill, C.W. and V anderzant, C. 1979b. Physical and sensory characteristics of beef packaged in modified gas atm ospheres. J . Food Prot. 42(3): 233-239.
Seidem an, S.C. and D urland, P.R. 1984. The utilization of modified gas atm osphere packaging for fresh m eat: a review. J . Food Quality. 6: 239- 252.
Shay, B.J. and Egan, A.F. 1990. Extending reta il storage life of beef and lamb by modified atm osphere packaging. Food A ustralia . 42(8): 399-400, 404.
Silliker, J.A. and Wolfe, S.K. 1980. Microbiological safety considerations in controlled- atm osphere storage of m eats. Food Technol. 34(3): 59-63.
Sim ard, R.E., Lee, B.H., Laleye, C.L. and Holley, R.A. 1985. Effects of tem pera tu re and storage time on the microflora, sensory and exudate changes of vacuum or nitrogen packed beef. Can. Inst. Food Sci. Technol. J . 18: 126-132.
Spahl, A., Reineccius, G., and T atin i, S. 1981. Storage life of pork chops in C 0 2-containing atm ospheres. J. Food Prot. 44(9): 670-673.
Sperber, W.H. 1982. Requirem ents of Clostridium botulinum for growth and toxin production. Food Technolo. 36: 89-94.
S tringer, W.C., Bilskie, M.E. and N aum ann, H.D. 1969. Microbial profile of fresh beef. Food Technol. 23(1): 97-102.
Taylor, A.A. 1972. Gases in fresh m eat packaging. M eat World. 5: 3-6.
Taylor, A.A. and MacDougall, D.B. 1973. F resh beef packed in m ixture of oxygen and carbon dioxide. J. Food Technol. 8(10): 453-461.
Taylor, A.A. 1982. Retail packaging system s for fresh m eat. M eat Sci. Tech. Int. Symp. Proc., N ational Livestock and M eat Board, Chicago, IL. p.353.
145
Taylor, A.A. 1985. Packaging fresh m eat. In Developments in M eat Science. Lawrie, R. (ed.). E lsevier Applied Science Publishers, London.
Thayer, D.W., M uller, W.S., Buchanan, R.L. and Phillips, J.C. 1987. Effect of NaCl, pH, tem perature , and atm osphere on growth of Salm onella typh im urium in glucose-mineral salts medium. Appl. and Environ. Microbiol. 53: 1311-1315.
Thomas. Y.O., K raft, A.A., Rust, R.E. and Hotchkiss, D.K. 1984. Effect of carbon dioxide flushing and packaging m ethods on the microbiology of packaged chicken. J . Food Sci. 49(6): 1367-1371.
Toledo, R.T. 1991. Gases and vapors. In F undam entals of Food Processing Engineering. 2nd ed. Van N ostrand Reinhold, New York.
U rbain, W.M. 1952. Oxygen is key to the color of m eat. The N at’l Provisioner. 127(16): 140.
U rban, M.C. and Wilson, G.D. 1958. F resh m eat characteristics which influence packaging requirem ents. Proc. of Res. Conf. 10, 13. American M eat In stitu te Foundation, Chicago.
Wells, J .H and McMillin, K.W. 1990. Dynamic packaging system s for fresh m eats. Food Proc. Eng. News. 24(2): 6-7.
W impfhimer, L., A ltm an, N.S. and Hotchkiss, J.H . 1990. Growth of Listeria monocytogenes Scott A, serotype 4 and competitive spoilage organism s in raw chicken packaged under modified atm ospheres and in air. Int. J. Food Microbiol. 11: 205-214.
Wolfe, S.K. 1980. Use of CO- and C 0 2- enriched atm osphere for m eats, fish, and produce. Food Technol. 34(3): 55-58, 63.
Young, W.E. 1968. Vacuum and gas packaging. M odern Packaging Encyclopedia. 41: 559.
Young, L.L., Reviere, R.D. and Cole, A.B. 1988. F resh red m eats: A place to apply modified atm osphere. Food Technol. 42(9): 65-69.
Yousef, A.E., Gajewski II, R .J. and M arth, E.H. 1991. Kinetics of growth and inhibition of Listeria monocytogenes in the presence of an tioxidant food additives. J . Food Sci. 56(1): 10-13.

146
Zagory, D and Kader, A.A. 1988. Modified atm osphere packaging of fresh produce. Food Technol. 42(9): 70-77.
Zamora, M.C. and Zaritzk, N.E. 1985. Modeling of microbial growth in refrigerated packaged beef. J. Food Sci. 50(4): 1003-1006, 1013.
Zarate, J.R. and Zaritzky, N.E. 1985. Production of weep in packaged refrigerated beef. J . Food Sci. 50(1): 155-159, 191.
Zhao, Y., Wells, J.H ., and McMillin, K.W. 1992. Description of log phase growth for selected microorganisms during modified atm osphere storage. J . Proc. Eng. 15: 299-317.

APPENDIX A
UNCERTAINTY ANALYSIS FOR PREDICTED C 02 ABSORPTION
The absorption of C 0 2 w ith MAP headspace was determ ined by using a
combined engineering analytical and experim ental method. From Eq. (3.11),
C 0 2 absorption was calculated by m easuring gas pressure, tem pera tu re , and
tes t cham ber volume, and m eat sam ple characteristics. Therefore, a source
of error th a t exists for the predicted C 0 2 absorption values are caused by the
m easurem ent error in the respective variables, propagated w ithin the
calculation. The m agnitude of the error can be estim ated by calculating
uncertain ty in terval for C 0 2 absorption. The uncerta in ty analysis for a single
sample experim ent can be calculated following the procedure by Kline and
McClintock (1953). U ncertainty, wl{ is indicated by
OLJj 0 ^ 2 n
where R is a function of n independent variables, uJ} v.2>..., v„, and w l} w2, ..., w„
are uncertain ty for each independent variables.
R=R(v1,vz, , v , ) (A2)
Since the C 0 2 absorption equation can be expressed as:
A C02 = — * [Pn - f t t)l ■* — ( A3) R mTM m R mT M m
E valuating the partial differential term s OR/dv,) for Eq. (A3) and substitu ting
into Eq. (A l) gives:
147
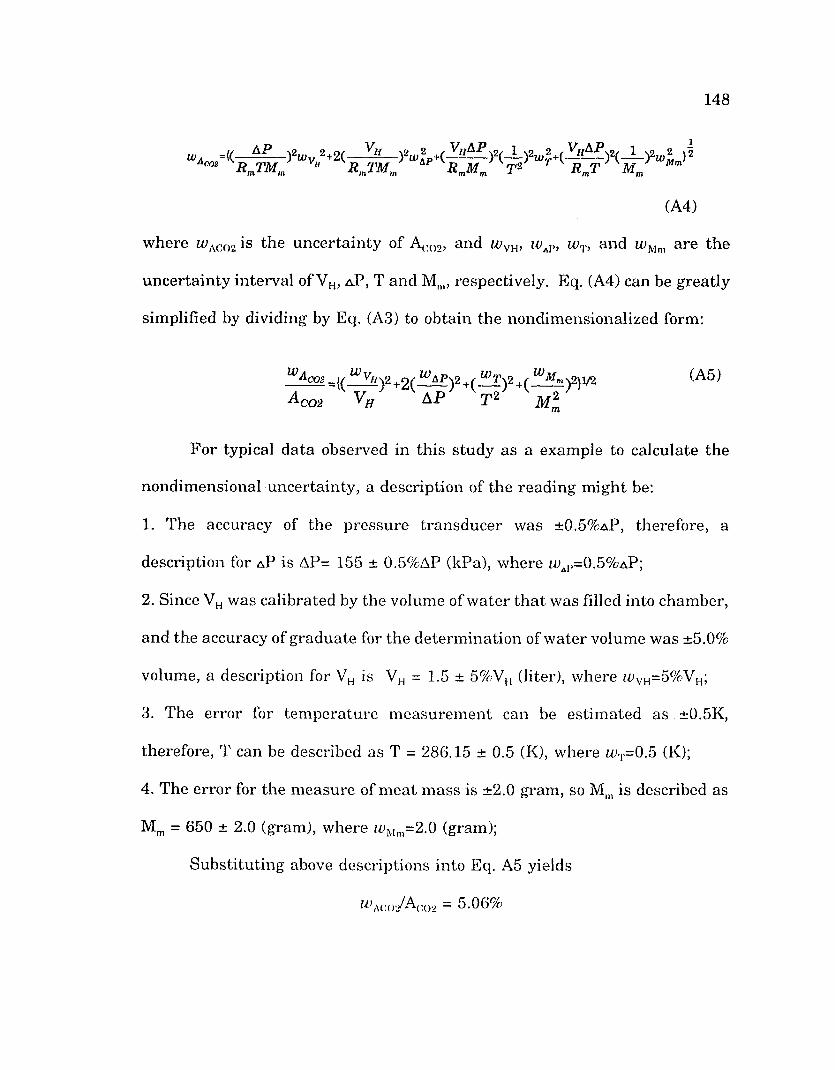
148
u / A = K - — - y iu i v 2+2( - V- H - ) 2( ~ ) 2 m /s T> nr'lS/f W I? rnfl/f D Jl/f /T*2 ■*V D ' P / V 7l/r/~ l \ --------------------------, / U / V -------------------------- J U / * p n ---------------------- J -I ---------- J O / r r - ^ l J I -----------
008 R mT M m v" i i m2W m T 2 T R mT M n
(A4)
where h>A C 0 2 is the uncertain ty of Ar02, and w VH, w aV, w t , and w Mm are the
uncertain ty in terval of VH, a P , T and Mm, respectively. Eq. (A4) can be greatly
simplified by dividing by Eq. (A3) to obtain the nondim ensionalized form:
W a CQ2 _ ^ W y f l \ 2 + 2 ( WaP)2+( Wy)2 i ( (A5)A c 0 2 Vh AP T 2 M l
For typical da ta observed in th is study as a example to calculate the
nondim ensional uncertain ty , a description of the reading m ight be:
1. The accuracy of the pressure transducer was ±0.5% aP, therefore, a
description for aP is AP= 155 ± 0.5%AP (kPa), where m>a1,=0.5% aP;
2. Since VH was calibrated by the volume of w ater th a t was filled into cham ber,
and the accuracy of graduate for the determ ination of w ater volume was ±5.0%
volume, a description for VH is VH = 1.5 ± 5%VH (liter), where wvh=5%Vh;
3. The error for tem perature m easurem ent can be estim ated a s . ±0.5K,
therefore, T can be described as T = 286.15 ± 0.5 (K), where wT=0.5 (K);
4. The error for the m easure of m eat m ass is ±2.0 gram , so Mm is described as
Mm = 650 ± 2.0 (gram), where wMm=2.0 (gram);
S ubstitu ting above descriptions into Eq. A5 yields
ma('oVA(x)2 ~ 5.06%

149
Therefore, the nondim ensional uncertain ty for estim ation in th is work is
about 5.06%, i.e., the m axim um error for Af.02 m easurem ent is approxim ately
5.06%.
/

APPEN D IX B
VERIFICATION OF TIME SELECTION ON C 02 ABSORPTION
CALCULATION
The tim e period selected for C 0 2 absorption calculations was 12 hours.
The validity of th is choice is exam ined using sta tistical analysis of the m ean
value of C 0 2 absorption.
There are two independent equations for C 0 2 absorption description.
From Eq. (3.11), C 0 2 absorption is described by:
A m / S f k g mM)= J [iV-PW] (Bl)K m± M meat
where, V, T, Rm, Mmual and P0 are constants for a specific package configuration.
E q.(B l) can be rew ritten as:
■ -co2~x *ip0- m i ® 2>
where, x=V/(RmTMmUill). A nother equation describing C 0 2 absorption is from
regression equation w ith package param eters, Eq.(4.2). Since all package
param eters are constant for a specific package configuration, Eq.(4.2) can be
rew ritten as:
Aco2=ao+Y (B3)
where, Y was assum ed as a constant and the range of Y for all
packaging/product configurations in th is work is 9.4<Y<10.6. Since AC02
depends on tim e, a„ should be related to tim e in Eq.(B3) or expressed as a0(t).
150

151
From statistical analysis, there is a confident in tervals for a0(t) such th a t the
tim e selected for the C 0 2 absorption test would ensure th a t th e m ean value of
a0(t) was w ithin the confident interval of a0(t). Eq.(B2) and (B3) m ust give
sam e results for Acog, therefore:
x*[P0-P(t)]=a0( t h Y (B4)
sta ted in Eq. (5.1), P(t)=a-b5|!ln(t+1.0). Combining the p ressure drop expression
w ith Eq.(B4), tim e t can be solved as
fsl.O +exp— [o^+ ^o -P ^+ Y ] (hr) (B5)xb
where aou is the upper range of a0(t), and th e range of b for all packaging/pro
duct configurations in th is work is 4.0<b<1.2. Solving Eq.(B5) for all
packaging/product configurations involved in th is work yields the m inim um
tim e is about 5 hours. Thus the 12 hours for C 0 2 absorption test should be
reasonable.

APPEN D IX C
ORGANISMS AND GROWTH CONDITIONS USED FOR MODEL
DEVELOPMENT
D ark-m eat chicken nuggets were prepared from hand deboned broiler
th igh m eat. The th igh m eat was ground through a 70 mm d iam eter p late w ith
3.2 m m holes. O ne-half percent NaCl by w eight was added and tum bled w ith
the ground product under vacuum for 15 m in in a ro ta ting 20 L drum (Globus
Inject S ta r MC m assager). M assaged m eat was tem pered to -1.7°C w ith dry
ice and formed into 20 g nugget portions using a portion Hollymatic Super
former. Nuggets were frozen in a carbon dioxide cabinet freezer and stored a t -
10°C un til inoculation.
Chicken nuggets were precooked in an autoclave a t 120°C for 15 min
and cooled to room tem peratu re prior to inoculation. Precooked chicken
nuggets were inoculated w ith e ither Listeria monocytogenes Scott A or
Pseudomonas fluorescens ATCC 13525 according to the procedures described
by M arshall et al. (1991). Each nugget was packaged in a 7" x 8” plastic
barrie r bag (Koch model 01 46 09, K ansas City, MO) evacuated and back
flushed w ith air or one of two commercial premixed gas blends. Experim ental
data was collected from a replicated 3x3 factorial design consisting of 3
tem peratures (3°, 7°, and 11°C), and 3 in itial gases (air containing
0 .03% C 02:78.03% N2:20.99% 02, m odified a tm osphere 1 con ta in ing
152

153
76% C02:13.3%N2:10.7% 02, and modified atm osphere 2 containing
80% C02:20%N2:0% 02).
Two nuggets were sam pled for each replication a t in tervals ranging from
1 to 3 days depending on anticipated population growth ra te for a particu lar
storage tem perature. M ean values of microbial populations were reported as
the averages of duplicate p latings of each of 4 nuggets per sam pling point.

A PPEN D IX D
EXPERIMENTAL OBSERVATIONS FOR PACKAGING/PRODUCT
CONFIGURATION AND STORAGE CONDITIONS
154

Table D l. Recorded data for C 0 2 absorption experim ent a t tem perature 13±0.5°C, in itial headspace pressure 155±14 kPa, and in itial gas composition 99±1.0% C 0 2 for 12 hour test.
Sample No. Sample size mm
PikPa
PrkPa C 02/0 2
HfC 02/0 2 gram gram
pHi h 2o%
Fat%
164x118x29 154.45 124.25 98.2/0.1 98.3/0.3 643.6 637.4 5.72 71.9 1.78
2 165x132x23 154.45 124.11 98.8/0.2 96.6/0.5 638.2 636.4 5.43 72.9 0.85
3 180x135x23 155.14 130.66 98.8/0.1 98.2/0.3 642.8 635.0 5.44 73.2 1.2
4 140x124x26 155.14 131.01 98.6/0.2 96.2/0.6 520.6 516.4 5.60 74.6 0.37
5 150x148x25 155.48 137.21 100/0.3 99.0/0.6 660.4 650.8 __ 72.6 2.8
6 150x145x25 155.69 137.56 98.8/0.2 98.7/0.6 655.0 651.8 _ 70.0 4.22
7 180x170x24 156.17 142.38 99.9/- .. 868.4 865.8 .. 73.4 1.76
8 180x100x42 155.34 142.59 __ 849.8 839.6 __ __ ..
9 180x170x24 155.48 141.69 99.9/- 99.7/0.3 848.0 841.0 __
10 180x100x40 154.79 140.80 97.1/0.6 841.0 837.6 __ __ _
11 170x90x50 155.34 143.97 99.2/0.5 99.0/0.6 813.6 806.0 5.55 71.7 4.17
12 150x90x30 156.17 140.31 __ 437.0 434.6 .. ..
13 180x110x30 155.83 138.24 .. 717.0 713.0 ..
14 140x115x17 156.17 139.62 _ .. 410.4 409.4 _ __ ..
15 160x110x33 158.59 143.76 .. 613.8 612.2 .. ..
16 160x110x20 156.03 138.45 _ __ 360.4 355.6 ..
17 125x90x20 155.14 135.48 100/0.4 __ 284.6 280.0 5.72 ..
18 128x83x20 155.14 133.07 99.5/0.5 98.8/0.7 264.2 262.2 5.67
19 144x110x15 156.17 138.45 __ __ 323.8 320.2 __
20 142x120x22 155.83 143.76 99.9/0.2 98.4/0.7 491.4 489.0 5.60 73.3 --

Table D2. Recorded absolute pressure values (kPa) of headspace gases during 12 hrs storage forpackaging/product configuration experiment.
Time(hr) 1 2 3
Sample No. 4 5 6 7 8 9 10
0 154.45 154.45 155.14 155.14 155.48 155.69 156.17 155.34 155.48 154.79
1 141.69 141.55 145.83 146.73 148.93 147.21 151.69 151.69 151.00 148.79
2 137.76 137.76 142.04 143.42 147.21 145.48 149.97 149.97 149.14 148.24
3 134.66 134.45 139.97 141.21 145.14 143.42 148.24 148.24 148.24 146.86
4 132.73 132.38 137.90 139.14 144.11 142.04 147.90 147.90 147.55 145.14
5 131.21 130.66 136.87 137.76 142.38 140.66 147.07 147.07 146.17 144.80
6 129.83 129.28 135.14 136.18 141.35 139.62 145.48 145.83 145.14 144.11
7 128.25 127.56 134.45 135.14 140.86 138.93 144.80 145.48 144.80 143.42
8 127.56 126.87 133.42 134.45 139.97 138.59 144.66 144.80 144.11 142.38
9 126.87 125.49 132.73 133.63 138.93 138.24 144.11 144.45 143.76 141.69
10 125.83 124.66 131.90 132.38 138.11 138.24 143.76 144.11 143.07 141.35
11 124.80 124.39 131.21 131.69 137.76 137.90 142.73 143.76 142.38 141.00
12 124.25 124.11 130.66 131.01 137.21 137.56 142.38 142.59 141.69 140.80
156

Continued from Appendix Table D2.
Time Sample No.(hr) 11 12 13 14 15 16 17 18 19 20
0 155.34 156.17 155.83 156.17 158.59 156.03 155.14 155.14 156.17 155.83
1 151.69 151.69 152.72 149.97 156.17 151.35 148.24 147.90 150.66 152.38
2 150.66 150.52 148.59 148.10 155.14 148.59 145.48 143.97 148.24 151.00
3 149.28 148.24 147.21 146.17 153.41 147.55 143.76 141.55 146.52 149.28
4 148.24 147.55 145.48 145.00 151.69 145.69 142.24 140.31 145.00 148.45
5 147.90 146.17 144.80 144.45 150.52 144.80 141.21 138.59 144.31 147.90
6 147.42 145.00 142.38 143.76 148.59 143.97 140.31 137.76 143.07 146.86
7 146.52 144.80 141.35 142.38 148.24 142.38 138.93 136.87 142.38 145.83
8 145.69 144.11 139.97 141.35 147.55 141.35 138.45 135.49 141.35 145.14
9 145.14 143.07 138.93 141.00 147.07 141.00 137.90 134.66 141.21 144.80
10 144.80 142.04 138.59 140.66 146.17 140.18 137.21 134.11 140.31 144.66
11 144.66 141.35 138.24 140.31 144.80 138.93 136.73 133.42 138.93 144.11
12 143.97 140.31 138.24 139.62 143.76 138.45 135.49 133.07 138.45 143.76
157

Table D3. M easured data on the experim ent of storage condition effect on 12 hrs am ount of C 0 2 changes on packaged fresh beef.
SampleNo.
Temp°C
InitialAtmsCO.,% N,%
PikPa
PfkPa
Migram
Mfgram
P H ; p H f h 2 o
%
Fat%
Beef size mm
1 100 0 155.69 119.63 395.8 392.8 5.73 5.66 73.72 0.95 166x86x23
2 155.48 116.87 396.6 395.0 5.69 5.64 74.77 a 165x90x23
3 3 50 50 155.44 146.17 402.8 401.2 5.64 5.57 75.02 160x95x27
4 155.34 138.73 389.0 386.2 5.77 5.59 70.39 157x93x24
5 20 80 154.79 157.55 395.6 393.6 5.68 5.66 73.54 164x90x22
6 154.79 155.34 398.2 396.0 5.61 5.59 72.63 146x93x26
7 155.48 123.42 351.4 349.8 5.71 5.36 70.30 4.94 153X90X22
8 100 0 155.14 118.59 390.6 388.6 5.67 5.70 72.45 158X84X26
9 50 50 155.14 147.90 401.0 399.2 5.56 5.45 73.65 1.47 170X90X22
10 154.45 141.00 392.6 390.8 5.78 5.45 73.87 156X90X25
118
20 80 155.14 157.90 393.2 390.6 5.74 5.67 74.27 0.47 170X92X22
12 155.14 158.24 394.4 392.2 5.69 5.74 72.89 170X96X21
13 100 0 154.10 123.08 399.0 397.6 5.65 5.57 73.86 1.22 165X93X23
14 155.14 120.66 386.6 385.0 5.55 5.61 74.90 1.52 168X95X21
15 13 50 50 155.14 147.90 329.6 328.0 5.56 5.63 72.80 0.99 155X87X21
16 154.79 144.80 389.2 388.2 5.69 5.83 74.55 160X91X24
17 20 80 155.14 166.86 383.8 382.0 5.68 5.62 73.54 1.10 155X90X24
18 155.14 162.93 385.8 384.2 5.63 5.50 71.92 165X92X23
A1 111.01 90.67 348.2 347.0 5.68 5.50 71.59 160X80X21
A2 8 100 0 110.66 86.53 398.8 397.8 5.67 5.65 158X87X26
A3 155.48 168.93 349.4 348.2 5.62 5.53 73.45 0.83 160X90X22
A4 13 0 100 155.14 163.41 338.4 338.4 5.33 5.45 145X95X21
a Missing data.
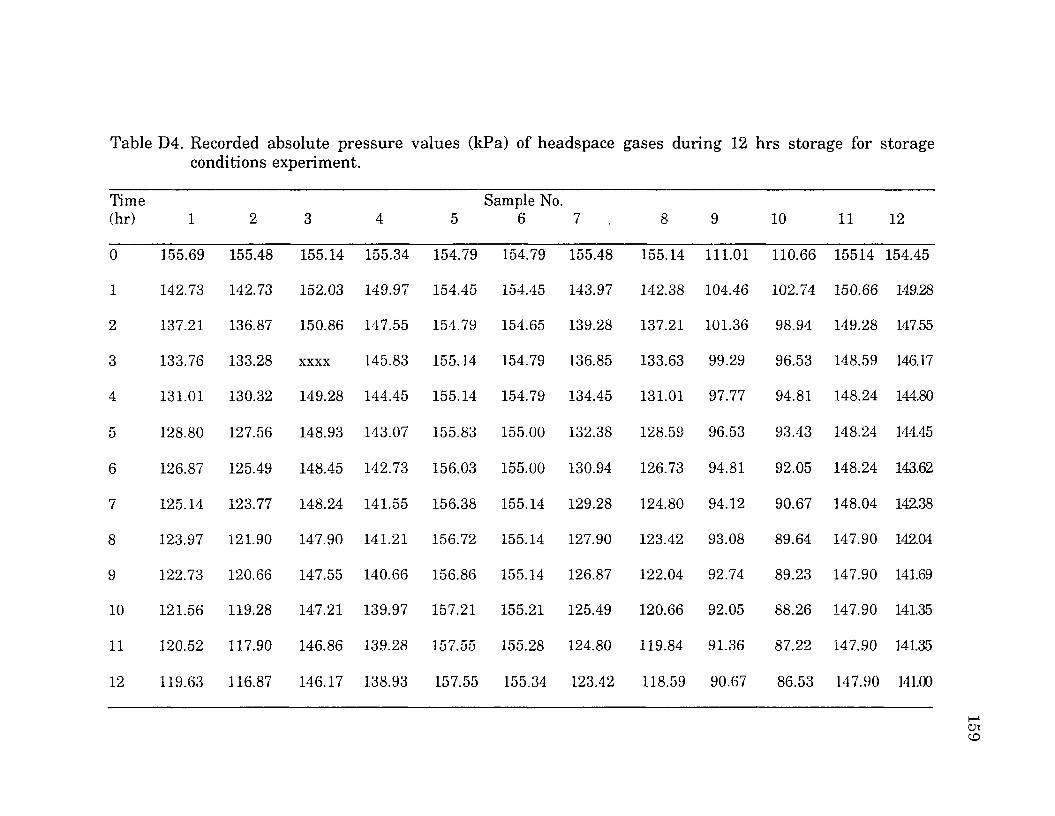
Table D4. Recorded absolute pressure values (kPa) of headspace gases during 12 hrs storage for storageconditions experiment.
Time(hr) 1 2 3 4 5
Sample No. 6 7 8 9 10 11 12
0 155.69 155.48 155.14 155.34 154.79 154.79 155.48 155.14 111.01 110.66 15514 154.45
1 142.73 142.73 152.03 149.97 154.45 154.45 143.97 142.38 104.46 102.74 150.66 149.28
2 137.21 136.87 150.86 147.55 154.79 154.65 139.28 137.21 101.36 98.94 149.28 147.55
3 133.76 133.28 xxxx 145.83 155.14 154.79 136.85 133.63 99.29 96.53 148.59 146.17
4 131.01 130.32 149.28 144.45 155.14 154.79 134.45 131.01 97.77 94.81 148.24 144.80
5 128.80 127.56 148.93 143.07 155.83 155.00 132.38 128.59 96.53 93.43 148.24 144.45
6 126.87 125.49 148.45 142.73 156.03 155.00 130.94 126.73 94.81 92.05 148.24 143.62
7 125.14 123.77 148.24 141.55 156.38 155.14 129.28 124.80 94.12 90.67 148.04 142.38
8 123.97 121.90 147.90 141.21 156.72 155.14 127.90 123.42 93.08 89.64 147.90 142.04
9 122.73 120.66 147.55 140.66 156.86 155.14 126.87 122.04 92.74 89.23 147.90 141.69
10 121.56 119.28 147.21 139.97 157.21 155.21 125.49 120.66 92.05 88.26 147.90 141.35
11 120.52 117.90 146.86 139.28 157.55 155.28 124.80 119.84 91.36 87.22 147.90 14135
12 119.63 116.87 146.17 138.93 157.55 155.34 123.42 118.59 90.67 86.53 147.90 14 LOO
159

Continued from Appendix Table D4.
Time(hr) 13 14 15 16
Sample No.17 18 19 20 21 22
0 155.14 155.14 154.10 155.14 155.14 154.79 155.14 155.14 155.48 155.14
1 155.00 155.00 142.73 142.38 151.69 149.97 156.86 156.17 157.90 156.17
2 155.14 155.14 137.21 137.21 150.31 148.24 158.59 157.55 159.62 157.55
3 155.14 155.48 133.76 133.07 149.28 147.55 160.31 158.45 161.34 157.90
4 155.14 155.83 131.01 130.32 148.93 146.52 161.34 158.93 162.38 155.48
5 155.14 156.17 128.80 127.90 148.24 146.17 162.03 159.62 163.76 159.62
6 155.14 156.72 128.25 125.83 148.24 145.48 163.07 160.31 164.79 160.65
7 155.83 157.07 126.87 124.11 148.24 145.14 164.10 161.00 165.48 161.00
8 156.17 157.55 125.83 123.77 148.24 144.80 164.45 161.69 165.82 161.69
9 156.52 157.55 125.14 123.08 147.90 144.80 165.14 162.03 166.86 162.03
10 156.86 157.55 124.11 122.04 147.90 144.802 165.48 162.03 167.55 162.38
11 157.21 157.90 123.42 121.35 147.902 144.80 166.17 162.38 168.58 162.38
12 157.90 158.24 123.08 120.66 147.90 144.80 166.86 162.93 168.93 163.41
160

Table D5. Growth of Listeria monocytogenes at 3, 7, 11 °C incubated on chicken dark meat nuggets packagedin air (Air), modified atmosphere 1 (MAI), or modified atmosphere 2 (MA2).
Time (days)Trt.
0 1 2 3 4 5 6 8 9 10 12 15 18
3°CAir 4.8U 4.7 4.8 5.3 5.9 6.2 6.3 7.2M A lb 4.6 4.9 4.7 4.7 5.0 5.2 6.1 6.9MA2C 4.7 4.7 4.7 5.0 5.0 5.8 6.0 7.1
7°CAir 4.8 4.9 5.0 5.5 6.0 6.0 7.4 7.7MAI 4.7 4.8 4.7 5.0 5.1 5.8 6.7 7.5MA2 4.8 4.8 4.7 5.2 5.1 5.3 5.3 6.3
11°CAir 4.5 5.3 6.4 7.2 7.8 8.9 9.1MAI 4.5 5.2 6.2 6.4 6.9 8.2 8.7MA2 4.7 5.2 6.0 6.3 7.0 8.1 7.9
a Values are m ean Log10 CFU/g from two experiments. Each experim ent consisted of duplicate p lating of two nuggets per trea tm en t per day;
b MAI contains 76% C 0 9:13.3% N 2:10.7% 0 2; c MA2 contains 80% C 0 2:20.0% N2:0% 0 2.

Table D6. Growth of Pseudom onas fluorescens at 3, 7 and 11°C incubated on chicken dark nuggets packagedin air (Air), modified atmosphere 1 (MAI), or modified atmosphere 2 (MA2).
Time (days)Trt.
0 1 2 3 4 5 6 8 9 10 12 15 18
3°CAir 4.0 3.8 3.8 4.7 4.8 7.3 7.5 8.0MAI 3.7 3.9 4.0 4.3 4.1 4.8 5.2 6.9MA2 4.1 3.8 3.9 4.2 4.3 5.0 6.0 6.7
7°CAir 3.3 4.1 4.8 5.6 7.0 7.1 7.4 8.4MAI 3.3 3.2 3.3 3.3 3.5 4.2 5.3 7.5MA2 3.1 3.3 3.3 3.1 3.6 4.1 5.1 6.8
11°CAir 3.2 5.0 7.5 9.2 9.7 9.6 9.6MAI 3.3 4.5 4.8 5.7 6.0 7.3 7.8MA2 3.2 4.1 5.1 6.0 5.9 6.0 6.5
a Values are m ean Log]0 CFU/g from two experiments. Each experim ent consisted of duplicated plantings of two nuggets per trea tm en t per day; b MAI contains 76% C 0 9:13.3% N.,:10.7% 0 2;L MA2 contains 80% C 0 2:20.0% N2:0% 0 2.

VITA
Yanyuii Zhao is a native of Jiangsu , China. She is the daughter of
Ronglin Zhao and Qilan Shen. She received her Bachelor of E ngineering in
Refrigeration Equipm ent and Cryogenic Engineering and M aster of
Engineering in Cryogenic Engineering from Shanghai In stitu te of M echanical
Engineering, China in 1982 and 1987, respectively.
She was employed by the Institu te of N anjiang Electrical Technology
as an A ssistan t Engineer from 1982 to 1984. After she received her M aster
degree, she worked in Dept, of Food Science and Technology, Shanghai
F isheries U niversity as an Instructor for th ree years. In Jan u ary , 1990, she
entered the D epartm ent of Biological and A gricultural E ngineering a t
Louisiana S ta te U niversity as a Research A ssistant.
Yanyun Zhao has been m arried to Ju n Xu since Ja n u a ry 3, 1991.
163

DOCTORAL EXAM INATION AND D IS S E R T A T IO N REPORT
Candidate: Yanyun Zhao
Major Field: Engineering Science
Title of Dissertation: Dynamic Behavior of Headspace Gases inModified Atmosphere Packaging for Meat
Approved:
U Q L//Major Professor and Chairman
Qz— Sc*Dean of the Graduate School
'7
E X A M IN IN G C O M M IT T E E :
Date of Examination:
June 14, 1993
Top Related