


Languages
Pages
Legal

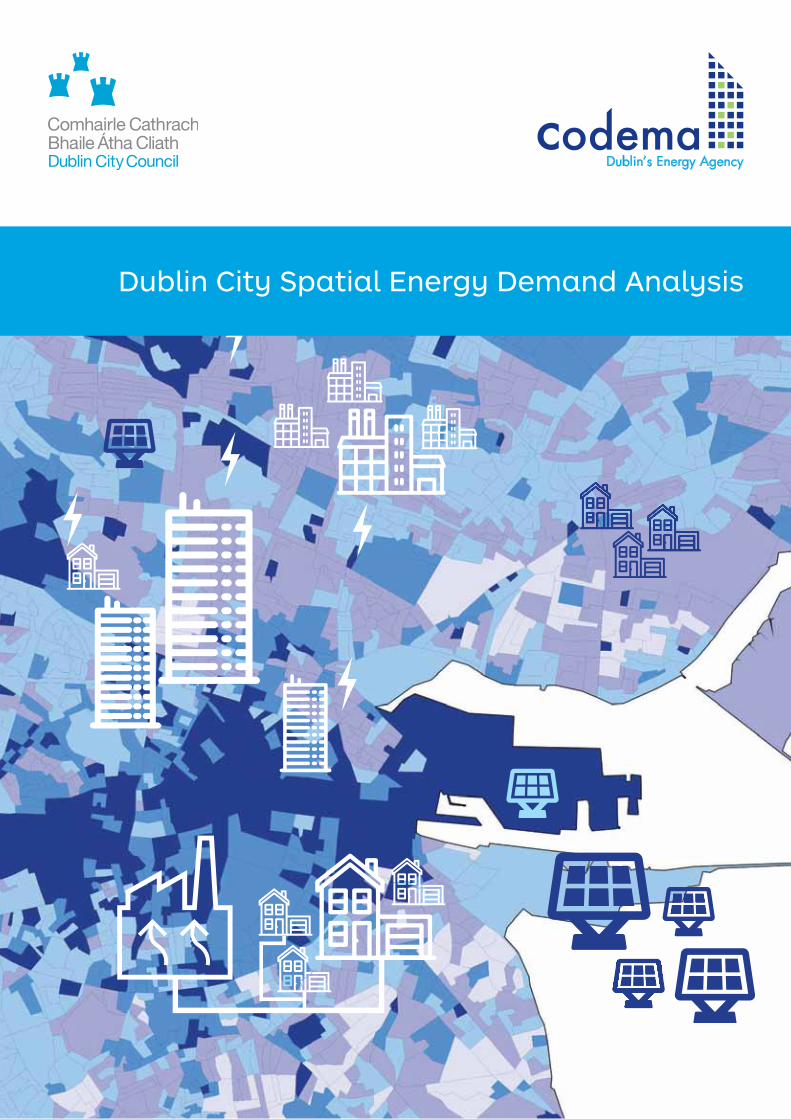
Dublin City Spatial Energy Demand Analysis

Dublin City Spatial Energy Demand Analysis
Report prepared by Codema in association with Dublin City Council.
Author: Donna Gartland, Strategic Sustainable Energy Planner June 2015
Dublin City Spatial Energy Demand Analysis
Report prepared by Codema in association with Dublin City Council.
Author: Donna Gartland, Strategic Sustainable Energy Planner June 2015
Copyright © 2015 Codema
All rights reserved
Report developed by Codema with support from the INTERREG IVB North West Europe programme through the Academy of Champions for Energy (ACE)
Reproduction of the contents is permissible provided the source is acknowledged.
Disclaimer
While Codema considers that the information given in this work is sound, all parties must rely upon their own skill and judgment when making use of it. Codema does not make any representation or warranty, expressed or implied, as to the accuracy or completeness of the information contained in this report and assumes no responsibility for the accuracy or completeness of such information. Codema will not assume any liability to anyone for any loss or damage arising out of the provision of this report.
Contents Executive Summary ................................................. 7
Introduction ........................................................... 9
Context ............................................................................................................. 9 Relating Policy ................................................................................................. 12
Spatial Energy Demand Analysis ............................ 15
Introduction ..................................................................................................... 15
Residential Sector Energy .................................................................................. 19 Methodology ................................................................................................ 19 Results ......................................................................................................... 20
Commercial Sector Energy ................................................................................ 33
Methodology ................................................................................................ 33 Results ......................................................................................................... 33
Municipal Sector Energy ................................................................................... 41 Total Energy in all Sectors ................................................................................. 45
Renewable Energy Potential ................................... 55 Conclusion .......................................................... 61
Dublin City Spatial Energy Demand Analysis
4
Table of Figures
Figure 1: Final Energy by Fuel Type Dublin City (2011) ......................................................................... 10 Figure 2: Heat Density Map of Skelleftea Municipality in Sweden (Source: Ranhagen & Ekelund (2004)) ..... 12 Figure 3: Maps Showing Examples of Small Area (SA) Breakdown in Dublin City ..................................... 15 Figure 4: Average C ratings (Green) in areas around the newly developed Dublin Docklands Area ............. 20 Figure 5: Average G ratings (Red) in areas in the older north inner city area ............................................ 20 Figure 6: Average BER of All Dwellings in Each Small Area ................................................................... 21 Figure 7: Average Annual Energy Use per Dwelling in Each Small Area .................................................. 23 Figure 8: Average Floor Area of Dwellings in Each Small Area .............................................................. 24 Figure 9: Average Annual Energy Costs per Dwelling in Each Small Area ................................................ 25 Figure 10: Areas Most at Risk of Energy Poverty ................................................................................... 28 Figure 11: Total Annual Residential Energy Demand (MWh) .................................................................. 29 Figure 12: Total Annual Residential Electricity Demand (MWh) ............................................................... 30 Figure 13: Total Annual Residential Fossil Fuel Demand (MWh) .............................................................. 31 Figure 14: Zoom-in Section of Map shown in Figure 15 ........................................................................ 34 Figure 15: High Energy Users within City Centre and Docklands ............................................................ 34 Figure 16: Annual Energy Use (MWh) and Location of Each Commercial Premises Analysed ...................... 35 Figure 17: Areas of Highest Annual Commercial Energy Use ................................................................. 36 Figure 18: North Dock Area with Highest Energy Demand in Commercial Sector ...................................... 37 Figure 19: Total Annual Commercial Energy Demand (MWh) ................................................................ 38 Figure 20: Commercial Sector Heat Demand Density (TJ/km2) ............................................................... 39 Figure 21: Total Annual Commercial Heat Demand (MWh) ................................................................... 39 Figure 22: Total Annual Commercial Energy Costs (1000s €) ................................................................. 40 Figure 23: Zoom-in Section Showing Large Energy Users ....................................................................... 41 Figure 24: Municipal Energy Use (MWh) and Locations of Each Account ................................................. 43 Figure 25: Total Annual Municipal Energy Demand (MWh) ................................................................... 44 Figure 26: Section of Dublin City Map with High Heat Demand Densities and Clustered Commercial Activity 45 Figure 27: The Greater Copenhagen DH System (Danish Energy Agency) ................................................ 46 Figure 28: Total Heat Demand Density of All Sectors (TJ/km2) ................................................................ 47 Figure 29: Potential Anchor Loads and Industrial Waste Heat Resources for DH ........................................ 48 Figure 30: Total Annual Energy Demand of All Sectors (GWh) ............................................................... 50 Figure 31: Total Annual Fossil Fuel Use (GWh) of All Sectors ................................................................. 51 Figure 32: Total Annual Electricity Use (GWh) of All Sectors .................................................................. 52 Figure 33: Electricity Share (%) of Total Energy Demand of All Sectors .................................................... 53 Figure 34: Total Annual Energy Costs (1000s €) of All Sectors ............................................................... 54 Figure 35: Suitability of Domestic Open-Loop Shallow Geothermal System (GSI , 2015) ............................ 55 Figure 36: Wind Speeds at 20m height in Dublin City (Source: SEAI Wind Mapping System) .................... 56 Figure 37: Locations of Waterways in Dublin City ................................................................................ 57 Figure 38: Roof Space Solar Atlas, Denmark (Source: energyroof.dk/solaratlas-for-denmark) ..................... 58 Figure 39: Biomass Production Suitability in Dublin City (Source: SEAI Bioenergy Mapping System) ............ 59
Table of Tables Table 1: Representation of BERs in Each Postcode Area ......................................................................... 20 Table 2: Top Ten Areas Most at Risk of Energy Poverty .......................................................................... 26
Dublin City Spatial Energy Demand Analysis
5
Glossary of Terms SEDA – Spatial Energy Demand Analysis SEAP – Sustainable Energy Action Plan BER – Building Energy Rating CSO – Central Statistics Office SEAP – Sustainable Energy Action Plan DC – Dublin City DCC –Dublin City Council DH – District Heating SEAI – Sustainable Energy Authority of Ireland kWh – Kilowatt-hour MWh – Megawatt-hour (1kWh *103) GWh – Gigawatt-hour (1kWh *106) TWh – Terawatt-hour (1kWh *109) TJ – Terajoule CHP – Combined Heat and Power km – Kilometre PV – Photovoltaic RE – Renewable Energy HH – Household
Dublin City Spatial Energy Demand Analysis
4
Table of Figures
Figure 1: Final Energy by Fuel Type Dublin City (2011) ......................................................................... 10 Figure 2: Heat Density Map of Skelleftea Municipality in Sweden (Source: Ranhagen & Ekelund (2004)) ..... 12 Figure 3: Maps Showing Examples of Small Area (SA) Breakdown in Dublin City ..................................... 15 Figure 4: Average C ratings (Green) in areas around the newly developed Dublin Docklands Area ............. 20 Figure 5: Average G ratings (Red) in areas in the older north inner city area ............................................ 20 Figure 6: Average BER of All Dwellings in Each Small Area ................................................................... 21 Figure 7: Average Annual Energy Use per Dwelling in Each Small Area .................................................. 23 Figure 8: Average Floor Area of Dwellings in Each Small Area .............................................................. 24 Figure 9: Average Annual Energy Costs per Dwelling in Each Small Area ................................................ 25 Figure 10: Areas Most at Risk of Energy Poverty ................................................................................... 28 Figure 11: Total Annual Residential Energy Demand (MWh) .................................................................. 29 Figure 12: Total Annual Residential Electricity Demand (MWh) ............................................................... 30 Figure 13: Total Annual Residential Fossil Fuel Demand (MWh) .............................................................. 31 Figure 14: Zoom-in Section of Map shown in Figure 15 ........................................................................ 34 Figure 15: High Energy Users within City Centre and Docklands ............................................................ 34 Figure 16: Annual Energy Use (MWh) and Location of Each Commercial Premises Analysed ...................... 35 Figure 17: Areas of Highest Annual Commercial Energy Use ................................................................. 36 Figure 18: North Dock Area with Highest Energy Demand in Commercial Sector ...................................... 37 Figure 19: Total Annual Commercial Energy Demand (MWh) ................................................................ 38 Figure 20: Commercial Sector Heat Demand Density (TJ/km2) ............................................................... 39 Figure 21: Total Annual Commercial Heat Demand (MWh) ................................................................... 39 Figure 22: Total Annual Commercial Energy Costs (1000s €) ................................................................. 40 Figure 23: Zoom-in Section Showing Large Energy Users ....................................................................... 41 Figure 24: Municipal Energy Use (MWh) and Locations of Each Account ................................................. 43 Figure 25: Total Annual Municipal Energy Demand (MWh) ................................................................... 44 Figure 26: Section of Dublin City Map with High Heat Demand Densities and Clustered Commercial Activity 45 Figure 27: The Greater Copenhagen DH System (Danish Energy Agency) ................................................ 46 Figure 28: Total Heat Demand Density of All Sectors (TJ/km2) ................................................................ 47 Figure 29: Potential Anchor Loads and Industrial Waste Heat Resources for DH ........................................ 48 Figure 30: Total Annual Energy Demand of All Sectors (GWh) ............................................................... 50 Figure 31: Total Annual Fossil Fuel Use (GWh) of All Sectors ................................................................. 51 Figure 32: Total Annual Electricity Use (GWh) of All Sectors .................................................................. 52 Figure 33: Electricity Share (%) of Total Energy Demand of All Sectors .................................................... 53 Figure 34: Total Annual Energy Costs (1000s €) of All Sectors ............................................................... 54 Figure 35: Suitability of Domestic Open-Loop Shallow Geothermal System (GSI , 2015) ............................ 55 Figure 36: Wind Speeds at 20m height in Dublin City (Source: SEAI Wind Mapping System) .................... 56 Figure 37: Locations of Waterways in Dublin City ................................................................................ 57 Figure 38: Roof Space Solar Atlas, Denmark (Source: energyroof.dk/solaratlas-for-denmark) ..................... 58 Figure 39: Biomass Production Suitability in Dublin City (Source: SEAI Bioenergy Mapping System) ............ 59
Table of Tables Table 1: Representation of BERs in Each Postcode Area ......................................................................... 20 Table 2: Top Ten Areas Most at Risk of Energy Poverty .......................................................................... 26
Dublin City Spatial Energy Demand Analysis
5
Glossary of Terms SEDA – Spatial Energy Demand Analysis SEAP – Sustainable Energy Action Plan BER – Building Energy Rating CSO – Central Statistics Office SEAP – Sustainable Energy Action Plan DC – Dublin City DCC –Dublin City Council DH – District Heating SEAI – Sustainable Energy Authority of Ireland kWh – Kilowatt-hour MWh – Megawatt-hour (1kWh *103) GWh – Gigawatt-hour (1kWh *106) TWh – Terawatt-hour (1kWh *109) TJ – Terajoule CHP – Combined Heat and Power km – Kilometre PV – Photovoltaic RE – Renewable Energy HH – Household

Dublin City Spatial Energy Demand Analysis
6
Dublin City Spatial Energy Demand Analysis
7
Executive Summary This is the first Spatial Energy Demand Analysis (SEDA) produced by Codema for Dublin City. It is only the second SEDA to be produced in Ireland, and the first at a city-scale. The analysis was carried out by Codema as part of the ACE project, which receives European Regional Development Funding through the INTERREG IVB NWE programme. A SEDA involves analysing the energy demand within a given area and creates a spatial visualisation of this information, resulting in evidence-based energy maps which can be used as a tool by town and city planners to create effective policies and actions to influence future energy use. The SEDA seeks to bridge the current gap between spatial and energy planning methodologies at a local level in Ireland and builds on the experience of other leading European countries. The mapping is particularly important for locating areas of high heat demand density which is a crucial element in planning for District Heating (DH) schemes. The sustainable use of energy and natural resources and the negative impacts of CO2 on our environment have led to energy and climate change becoming a major topic in both the public and private sector discourse. In preparation of the new Dublin City Development Plan 2016-2022, Dublin City Council has clearly identified the importance of climate change adaptation and mitigation and identifies the need to strengthen and develop strategic sustainable energy planning in the city through evidence-based spatial energy analysis. Currently there is a lack of interconnection between traditional planning practices and planning for sustainable energy use at local authority level. The Dublin City SEDA therefore allows for effective development of future scenarios for sustainable energy. Dublin City Council can now use this SEDA as a first step in integrating energy planning into traditional spatial planning practices and creating evidence-based energy-related planning policy and actions. The SEDA also creates increased awareness of energy demand and local resources among other stakeholders and informs future feasibility studies of sustainable energy options for the city. The results of the Dublin City SEDA show exactly where and what type of energy is being used, and the costs of this energy consumption throughout the city, in each of the residential, commercial and local authority sectors. Over 200,000 dwellings, 20,000 commercial properties and 1,000 local authority building-based energy accounts have been analysed in terms of annual energy use and the results have been mapped. The residential sector analysis allowed the identification of the areas most at risk of energy poverty, based on the three most influential factors affecting energy poverty; the energy efficiency of the home, affordability (in terms of unemployment), and the cost of energy per household. These areas have been highlighted (p.26) and can be prioritised in terms of strategies to combat energy poverty within the city. The results of mapping the average Building Energy Rating (BER) in each of the 2,202 small areas in Dublin City has shown that while better building regulations for new dwellings are effectively reducing the energy demand in new developments, the rest of the city’s dwellings are becoming older and less efficient, with many areas, particularly in the inner city, having E ratings or lower. A real concern is the number of rented dwellings which have very poor BERs. With escalating rents in the city, coupled with increasing energy costs, the affordability of energy in these poorly insulated rented dwellings will only increase the number of people suffering from energy poverty. In terms of DH analysis, over 75% of Dublin City areas have heat densities high enough to be considered feasible for connection to DH systems. Many of these areas have very high heat densities and would be ideal first-phase developments of a city-wide large scale DH system plan. The SEDA has also identified locations of potential anchor loads and waste heat resources which can be major contributors to a successful DH network. The North Docks area has the highest energy demand of any area in Dublin City, and consumes over 116 GWh per year in the commercial sector alone. Overall, Dublin City spends over €657 million a year on energy and a large percentage of this money leaves the Irish economy to pay for fossil fuel imports. Therefore increasing indigenous energy sources is crucial, and this report has identified solar energy resources as one of the most accessible renewable energy resources in the dense urban landscape of Dublin City.
Dublin City Spatial Energy Demand Analysis
6
Dublin City Spatial Energy Demand Analysis
7
Executive Summary This is the first Spatial Energy Demand Analysis (SEDA) produced by Codema for Dublin City. It is only the second SEDA to be produced in Ireland, and the first at a city-scale. The analysis was carried out by Codema as part of the ACE project, which receives European Regional Development Funding through the INTERREG IVB NWE programme. A SEDA involves analysing the energy demand within a given area and creates a spatial visualisation of this information, resulting in evidence-based energy maps which can be used as a tool by town and city planners to create effective policies and actions to influence future energy use. The SEDA seeks to bridge the current gap between spatial and energy planning methodologies at a local level in Ireland and builds on the experience of other leading European countries. The mapping is particularly important for locating areas of high heat demand density which is a crucial element in planning for District Heating (DH) schemes. The sustainable use of energy and natural resources and the negative impacts of CO2 on our environment have led to energy and climate change becoming a major topic in both the public and private sector discourse. In preparation of the new Dublin City Development Plan 2016-2022, Dublin City Council has clearly identified the importance of climate change adaptation and mitigation and identifies the need to strengthen and develop strategic sustainable energy planning in the city through evidence-based spatial energy analysis. Currently there is a lack of interconnection between traditional planning practices and planning for sustainable energy use at local authority level. The Dublin City SEDA therefore allows for effective development of future scenarios for sustainable energy. Dublin City Council can now use this SEDA as a first step in integrating energy planning into traditional spatial planning practices and creating evidence-based energy-related planning policy and actions. The SEDA also creates increased awareness of energy demand and local resources among other stakeholders and informs future feasibility studies of sustainable energy options for the city. The results of the Dublin City SEDA show exactly where and what type of energy is being used, and the costs of this energy consumption throughout the city, in each of the residential, commercial and local authority sectors. Over 200,000 dwellings, 20,000 commercial properties and 1,000 local authority building-based energy accounts have been analysed in terms of annual energy use and the results have been mapped. The residential sector analysis allowed the identification of the areas most at risk of energy poverty, based on the three most influential factors affecting energy poverty; the energy efficiency of the home, affordability (in terms of unemployment), and the cost of energy per household. These areas have been highlighted (p.26) and can be prioritised in terms of strategies to combat energy poverty within the city. The results of mapping the average Building Energy Rating (BER) in each of the 2,202 small areas in Dublin City has shown that while better building regulations for new dwellings are effectively reducing the energy demand in new developments, the rest of the city’s dwellings are becoming older and less efficient, with many areas, particularly in the inner city, having E ratings or lower. A real concern is the number of rented dwellings which have very poor BERs. With escalating rents in the city, coupled with increasing energy costs, the affordability of energy in these poorly insulated rented dwellings will only increase the number of people suffering from energy poverty. In terms of DH analysis, over 75% of Dublin City areas have heat densities high enough to be considered feasible for connection to DH systems. Many of these areas have very high heat densities and would be ideal first-phase developments of a city-wide large scale DH system plan. The SEDA has also identified locations of potential anchor loads and waste heat resources which can be major contributors to a successful DH network. The North Docks area has the highest energy demand of any area in Dublin City, and consumes over 116 GWh per year in the commercial sector alone. Overall, Dublin City spends over €657 million a year on energy and a large percentage of this money leaves the Irish economy to pay for fossil fuel imports. Therefore increasing indigenous energy sources is crucial, and this report has identified solar energy resources as one of the most accessible renewable energy resources in the dense urban landscape of Dublin City.

Dublin City Spatial Energy Demand Analysis
8
Dublin City Spatial Energy Demand Analysis
9
Introduction The following report has been produced by Codema on behalf of Dublin City Council (DCC) and outlines the process and results of the Spatial Energy Demand Analysis (SEDA). This analysis has been conducted by Codema as part of the ACE project, which is an EU funded initiative under the INTERREG IVB NWE programme. ACE is a renewable energy initiative which connects partners across several North West European countries. It promotes the importance of renewable energy in everyday life to citizens, businesses, universities and local authorities. A central philosophy of the ACE project is if the right information is provided, there will be an increased uptake of renewable energy. This SEDA aims to provide the information required for the local authority to increase the uptake of renewable energy through planning, policy and raising awareness. Up to now, the local authority has lacked any evidence-based tools for planning for sustainable energy solutions. This SEDA aims to bridge the gap between energy planning and traditional urban planning within the local authority, and enables planners to build meaningful energy policy and effectively shape the energy-future of the city. The analysis focuses on the current energy demand and the fuels used to provide such energy within the Dublin City Council area and places this data within a spatial context. Creating these maps helps to identify opportunities, synergies and constraints in different city districts. This detailed mapping process provides a visualisation of many aspects of energy use and its effects within each small area1 in Dublin City, such as:
Building Energy Ratings (BER) Energy use per dwelling Energy spends per dwelling Fuels used for heating dwellings Areas at risk of energy poverty Areas of high fossil fuel usage Areas with high electrical usage Heat demand density
1 A ‘Small Area’ is the smallest geographical breakdown used in Ireland for statistical purposes.
These maps provide the local authority with the information needed to target areas most in need of, and most suitable for, Renewable Energy (RE) solutions. In particular, and due to the work already carried out by DCC to develop District Heating (DH) in Dublin, the areas with high heat demand density which are deemed most suitable for large scale DH schemes are identified. DH schemes are a proven way to integrate high levels of RE into a dense urban landscape such as Dublin City. This SEDA is only the second of its kind to be developed in Ireland and is seen as the next coherent step to follow on from DCC’s Sustainable Energy Action Plan (SEAP). The SEDA enhances the SEAP in order that it can be more effectively integrated with other action plans and into the planning process. This will bring energy planning in Dublin City more in line with other European cities that are leading the way in effective local level sustainable energy planning.
Context
Climate Change Challenge
“The generations that came before us didn’t know that their actions were causing climate change. The generations who come after us risk inheriting an unsolvable problem. We are the generation that can make the difference.”- Mary Robinson, President of the Mary Robinson Foundation for Climate Justice Climate change is widely recognised as the greatest environmental challenge of our time and the evidence of such change is already being felt here in Ireland in terms of rising sea levels, extreme weather and changes in ecosystems. A recent publication co-authored by the UK’s Royal Society and the US National Academy of Sciences, ‘Climate Change: Evidence & Causes’, states that the speed of global warming is now 10 times faster than it was at the end of the last ice age, with the last 30 years being the warmest in 800 years (The Royal Society & The US National Academy of Sciences, 2014). The report also concludes that the latest changes in our climate are “almost certainly due to emissions of greenhouse gases caused by human activities” (The Royal Society & The US National Academy of Sciences, 2014, p. B9). This publication is just one of a
Dublin City Spatial Energy Demand Analysis
10
multitude of evidence and research-based papers which show irrefutable evidence that Greenhouse Gases (GHGs) are responsible for climate change and it is imperative to act now in order to curtail the irreversible damage caused by these emissions. Fossil fuel use is responsible for over half of all GHG emissions globally, and the majority of these emissions come from energy supply, transport, residential and commercial buildings and industry (IPCC, 2007). The Irish Government has already committed to reducing emissions at a national level, and the significance of Dublin City in the Irish economic landscape means it is imperative to plan and commit to energy saving and CO2 reduction at a local level in order to help meet national level targets from a bottom-up approach. It is particularly important for urban regions to look to integrate renewable electricity sources as close to the demand as possible, which leads to reduced losses during transport of renewable electricity. This also has the significant effect of decreasing the burden on rural areas to produce renewable electricity, particularly in the midlands and the west, where large wind farms can in some cases have negative impacts on these communities. There are many significant additional benefits to reducing CO2 levels and implementing more renewable energy in the city, including reduced health effects, decreased fossil fuel dependence, higher security of supply, lower energy costs, increased energy price stability, increased economic competitiveness and a sustainable economy.
Energy Use in Dublin City
The latest figures estimate that less than 1% of all energy use in Dublin City comes from locally produced renewable energy, as seen in Figure 1, and instead there is a large dependence on imported fossil fuel sources such as gas, oil, diesel and petrol (Gartland, 2013). There is easy access to the gas grid throughout Dublin City, and gas is therefore the main fuel source used for heating requirements. The national electricity supply is also based predominantly on gas-fuelled power plants. This means Dublin City is very susceptible to price increases and shortage of supply of gas in the European market. Ireland imports around 95% of its natural gas requirements, meaning billions of euro annually is exported to pay for these resources. If Dublin City could increase its ability to
meet even a small percentage of its energy demand with local sustainable resources, it could retain a substantial amount of money within the Irish economy and increase security of supply.
Figure 1: Final Energy by Fuel Type Dublin City (2011)
Electricity in Ireland has high CO2 emissions per kWh due to the supply mix on the national grid, which, in addition to gas (~50%), is supplied by peat (12%) and coal (25%) plants, and nearly 50% of the energy from these fuels is lost during transformation and transmission. The high cost of electricity, along with high carbon emissions and reliance on imported fuels are only more reasons for Dublin City to look to producing its own sustainable energy locally.
Local Level Energy Planning Conventionally, energy planning is implemented at a national level and not effectively addressed within local or regional level planning structures in Ireland. Experience from other countries has shown that national policies on energy which are specifically designed to address energy use from a national level perspective can make it hard for local authorities to fully address energy consumption due to the structure of the national policy framework, and the lack of autonomy and flexibility conferred upon them in the energy sector (Sperling, Hvelplund, & Mathiesen, 2011) (Chittum & Ostergaard, 2014). This leads to local authorities not having the knowledge or experience to make strategic decisions on how energy is or will be provided in their locality. In contrast, local level energy planning is routine in many other European countries, in particular Denmark, Sweden and recently re-municipalised areas in Germany. Laws were first introduced in
Dublin City Spatial Energy Demand Analysis
11
Denmark in 1979 requiring municipalities to carry out local level energy plans, and this regulatory framework has been credited with creating the base for the sustainable growth Denmark has seen in the years since. These planning laws required municipalities to conduct analyses of their local heating requirements and the available heat sources, and municipalities were also made responsible for assessing future heating needs and supplies and planning around these. In the 1980s the government introduced laws to ensure that all energy projects had to be assessed by taking account of the full socio-economic costs and benefits, and based on this, municipalities should only pursue projects which show a high level of socio-economic benefits (Chittum & Ostergaard, 2014). These laws resulted in high levels of locally produced heat and electricity in the form of Combined Heat and Power (CHP) and DH systems with integrated renewable energy sources. Today, around two thirds of Danish electricity is cogenerated with heat, and heat is supplied through DH systems to 60% of Danish households. Studies have shown that this increased use of CHP and DH has reduced overall nationwide emissions by 20%, and reduced CO2 emissions in the heating sector by 60%. There is currently 386,234 m2 of solar heating being used in municipal DH projects, along with other sustainable sources such as biomass and waste heat. The use of local energy planning in Denmark has reduced energy costs to consumers, enabled higher integration of renewable energy, reduced energy demand and reduced the overall impact on the environment.
The Need for Integrated Energy and Spatial Planning
The increasing need for society to change to more sustainable forms of energy supply to combat climate change and meet growing demands means that space is now a fundamental asset for energy production. This is due to the fact that renewable energy is an area-dependent resource, e.g. space and suitability of land for bio-fuel crops, for wind farms, for solar energy, or for hydro-power. (Stoeglehner, Niemetz, & Kettl, 2011). Energy production now enters the competition for space with many other products and services that are reliant on space, such as food production and property development.
Also, the feasibility of District Heating (DH) and Combined Heat and Power (CHP) is dependent on many spatial and urban planning related factors such as heat demand density and zoning of building uses, which reinforces the inseparable nature of spatial planning and energy planning. In order for planners to evaluate the feasibility of integrating a range of renewable energy resources, they will need to develop a SEDA type tool in order to ‘read the energy landscape’ (Pasqualetti, 2013). A SEDA allows planners to locate where the large energy demands are, what type of energy is required in these locations, i.e. heat, electricity, gas, etc., the areas susceptible to energy poverty due to high energy costs, and areas of high fossil fuel use. Economic development in Dublin has been, so far, driven mainly by resources that have no immediate geographic link to the area exposed to planning. The fossil fuels and electricity that will be used during the lifetime of a development have, in most cases, no influence on its location as it can be simply connected by pipe or cable to some far-off location. In this way, spatial planning is not currently linked to energy resource management. The planning system now faces the new challenge of taking account of, and creating balance between designing cities to reduce energy demand, retaining sufficient space for sustainable energy production, and providing energy from local resources, while also evaluating social and environmental considerations.
Spatial Energy Demand Analysis as a tool for Sustainable Spatial Planning Energy mapping resources are used by energy planners in local authorities throughout Europe and are often referred to as the first step in the energy planning process. It is the foundation for planning for current and future predicted energy consumption at a local level. It allows the planner to define ‘energy character areas’, based on the estimated energy demand and supply characteristics, and the RE potential of that area. The Province of Gelderland in The Netherlands has developed an online ‘Energy Atlas’, which is used as a tool for sustainable regional development. It outlines existing renewable energy projects such as
Dublin City Spatial Energy Demand Analysis
12
geothermal, solar, wind and hydro power plants, and also maps the potential to use a range of renewable energy types throughout the region. For example, areas are highlighted which have best solar potential, areas of old landfill sites, and areas where there is industrial waste heat available. This energy atlas can be accessed at the following link http://www.gelderland.nl/4/energieatlas/Kaartenwijzer.html The Swedish Energy Agency’s guide to sustainable spatial planning outlines how “integrating energy issues for heating and transport in comprehensive planning” is one of the four ‘leaps’ to effective sustainable energy planning, and documenting the current energy effects of heating, cooling, electricity and transport allows the development of future scenarios for energy and transport (Ranhagen, 2011). The energy map shown in
Figure 2 is an example from a Swedish municipality, and shows areas within the region which are colour coded according to heat demand density. This map is then used by the municipality’s energy planners to decide which areas are most suitable for DH or individual heating solutions such as heat pumps or solar thermal, and integrate the findings into future scenario development. This Dublin City SEDA uses similar methodologies for mapping energy demands as those that are typically used in Swedish and Danish energy planning. Once this initial step is complete, deeper techno-economic analysis and energy system modelling of an identified energy character area allows the planner to judge if the area is technically and economically feasible to implement the recommended sustainable energy solutions.
Figure 2: Heat Density Map of Skelleftea Municipality in Sweden (Source: Ranhagen & Ekelund (2004))
Relating Policy
EU Policy
The European Union (EU) put in place a framework for energy for all member states called the ‘2020 Climate and Energy Package’. This set binding legislation for all member states so that the EU as a whole will achieve 20% GHG emission reductions, 20% energy produced by renewable resources, and 20% increase in energy efficiency by 2020.
From this overarching EU climate and energy package, there are directives which set specific targets for renewable energy for each member state and outline the measures to be put in place for energy efficiency. The EU Energy Efficiency Directive 2012/27/EU, and Renewable Energy Directive 2009/28/EC have resulted in national level energy action plans in each area respectively. In terms of the Renewable Energy Directive, Ireland has been set a target of 16% of all non-Emission Trading Scheme (ETS) energy consumption to come from Renewable Energy Sources (RES) by 2020, the sectorial split being 40% electricity, 12% heat and
Dublin City Spatial Energy Demand Analysis
13
10% transport energy. Latest figures (2013 energy figures) show Ireland’s renewable energy in electricity is at 20.9% of gross electricity consumption, renewable heat is at 5.7%, and renewables in transport at 4.9%, therefore Ireland is approximately half-way toward 2020 targets with five years left to improve. This SEDA aims to increase the use of renewables at a local level in order to contribute towards overall national level targets. Although there are no binding targets for energy efficiency, there are binding obligations on each member state. Of particular relevance to this regional level SEDA, Article 14 of the Energy Efficiency Directive on the ‘Promotion of efficiency in heating and cooling’ states: “Member States shall adopt policies which encourage the due taking into account at local and regional levels of the potential of using efficient heating and cooling systems, in particular those using high-efficiency cogeneration. Account shall be taken of the potential for developing local and regional heat markets.” The SEDA will help to identify the most appropriate sustainable energy solutions for heating the current and future building stock in Dublin City. In October 2014, due to there being no clear framework post-2020 targets, the EU put in place a new ‘2030 Framework for Climate and Energy Policies’ which has set a 40% GHG reduction on 1990 GHG levels, and an EU-wide target of 27% for renewable energy and energy savings by 2030. There are no specific targets set for each member state under this new framework. This SEDA will also allow DCC to stay on top of energy issues in its region and help to future-proof the city for new energy legislation past 2020. The near future will see new policies and directives as a result of the EU’s ‘Energy Union’ proposals and the results of the UN Climate Conference in Paris in December 2015.
National and Regional Level Policy The National Renewable Energy Action Plan (NREAP) and National Energy Efficiency Action Plan (NEEAP) are a direct result of the overarching EU Directives previously discussed. These outline
how Ireland intends to implement the energy efficiency and renewable energy targets set by the European Commission. This SEDA aims to help fulfil the goals of the NREAP and NEEAP by developing renewable energy and energy efficiency at a local and regional level within Dublin City, and developing strategic energy action plans specifically tailored to the energy characteristics of the area. A Green Paper on Energy Policy in Ireland was published in May 2014 in preparation for the White Paper version to be finalised in 2015. The Green Paper addresses five priorities relating to Energy Policy:
Empowering Energy Citizens, Markets, Regulation and Prices, Planning and Implementing Essential
Energy Infrastructure, Ensuring a Balanced and Secure Energy
Mix, Putting the Energy System on a Sustainable
Pathway. The SEDA will help to address the priorities surrounding planning essential energy infrastructure and creating a more sustainable energy system within Dublin City. The SEDA allows DCC to take some control and have some influence over the energy used within the region, which can now be used as a bottom-up approach to meeting the new Energy Policy priorities. The Regional Planning Guidelines for the Greater Dublin Area (GDA) 2010-2022 provides planning guidance on economic, infrastructure and settlement policies for the GDA which includes Dublin City. These guidelines specifically support the implementation of local level energy action plans, and also suggest they “… should be presented in a spatially geographic manner where possible in order to provide an extended evidence base in the decision making process”. This SEDA will fulfil these suggestions under the Regional Planning Guidelines, and DCC will be the one of the first local authorities to do so, which will pave the way for other local authorities to follow suit.
Dublin City Spatial Energy Demand Analysis
12
geothermal, solar, wind and hydro power plants, and also maps the potential to use a range of renewable energy types throughout the region. For example, areas are highlighted which have best solar potential, areas of old landfill sites, and areas where there is industrial waste heat available. This energy atlas can be accessed at the following link http://www.gelderland.nl/4/energieatlas/Kaartenwijzer.html The Swedish Energy Agency’s guide to sustainable spatial planning outlines how “integrating energy issues for heating and transport in comprehensive planning” is one of the four ‘leaps’ to effective sustainable energy planning, and documenting the current energy effects of heating, cooling, electricity and transport allows the development of future scenarios for energy and transport (Ranhagen, 2011). The energy map shown in
Figure 2 is an example from a Swedish municipality, and shows areas within the region which are colour coded according to heat demand density. This map is then used by the municipality’s energy planners to decide which areas are most suitable for DH or individual heating solutions such as heat pumps or solar thermal, and integrate the findings into future scenario development. This Dublin City SEDA uses similar methodologies for mapping energy demands as those that are typically used in Swedish and Danish energy planning. Once this initial step is complete, deeper techno-economic analysis and energy system modelling of an identified energy character area allows the planner to judge if the area is technically and economically feasible to implement the recommended sustainable energy solutions.
Figure 2: Heat Density Map of Skelleftea Municipality in Sweden (Source: Ranhagen & Ekelund (2004))
Relating Policy
EU Policy
The European Union (EU) put in place a framework for energy for all member states called the ‘2020 Climate and Energy Package’. This set binding legislation for all member states so that the EU as a whole will achieve 20% GHG emission reductions, 20% energy produced by renewable resources, and 20% increase in energy efficiency by 2020.
From this overarching EU climate and energy package, there are directives which set specific targets for renewable energy for each member state and outline the measures to be put in place for energy efficiency. The EU Energy Efficiency Directive 2012/27/EU, and Renewable Energy Directive 2009/28/EC have resulted in national level energy action plans in each area respectively. In terms of the Renewable Energy Directive, Ireland has been set a target of 16% of all non-Emission Trading Scheme (ETS) energy consumption to come from Renewable Energy Sources (RES) by 2020, the sectorial split being 40% electricity, 12% heat and
Dublin City Spatial Energy Demand Analysis
13
10% transport energy. Latest figures (2013 energy figures) show Ireland’s renewable energy in electricity is at 20.9% of gross electricity consumption, renewable heat is at 5.7%, and renewables in transport at 4.9%, therefore Ireland is approximately half-way toward 2020 targets with five years left to improve. This SEDA aims to increase the use of renewables at a local level in order to contribute towards overall national level targets. Although there are no binding targets for energy efficiency, there are binding obligations on each member state. Of particular relevance to this regional level SEDA, Article 14 of the Energy Efficiency Directive on the ‘Promotion of efficiency in heating and cooling’ states: “Member States shall adopt policies which encourage the due taking into account at local and regional levels of the potential of using efficient heating and cooling systems, in particular those using high-efficiency cogeneration. Account shall be taken of the potential for developing local and regional heat markets.” The SEDA will help to identify the most appropriate sustainable energy solutions for heating the current and future building stock in Dublin City. In October 2014, due to there being no clear framework post-2020 targets, the EU put in place a new ‘2030 Framework for Climate and Energy Policies’ which has set a 40% GHG reduction on 1990 GHG levels, and an EU-wide target of 27% for renewable energy and energy savings by 2030. There are no specific targets set for each member state under this new framework. This SEDA will also allow DCC to stay on top of energy issues in its region and help to future-proof the city for new energy legislation past 2020. The near future will see new policies and directives as a result of the EU’s ‘Energy Union’ proposals and the results of the UN Climate Conference in Paris in December 2015.
National and Regional Level Policy The National Renewable Energy Action Plan (NREAP) and National Energy Efficiency Action Plan (NEEAP) are a direct result of the overarching EU Directives previously discussed. These outline
how Ireland intends to implement the energy efficiency and renewable energy targets set by the European Commission. This SEDA aims to help fulfil the goals of the NREAP and NEEAP by developing renewable energy and energy efficiency at a local and regional level within Dublin City, and developing strategic energy action plans specifically tailored to the energy characteristics of the area. A Green Paper on Energy Policy in Ireland was published in May 2014 in preparation for the White Paper version to be finalised in 2015. The Green Paper addresses five priorities relating to Energy Policy:
Empowering Energy Citizens, Markets, Regulation and Prices, Planning and Implementing Essential
Energy Infrastructure, Ensuring a Balanced and Secure Energy
Mix, Putting the Energy System on a Sustainable
Pathway. The SEDA will help to address the priorities surrounding planning essential energy infrastructure and creating a more sustainable energy system within Dublin City. The SEDA allows DCC to take some control and have some influence over the energy used within the region, which can now be used as a bottom-up approach to meeting the new Energy Policy priorities. The Regional Planning Guidelines for the Greater Dublin Area (GDA) 2010-2022 provides planning guidance on economic, infrastructure and settlement policies for the GDA which includes Dublin City. These guidelines specifically support the implementation of local level energy action plans, and also suggest they “… should be presented in a spatially geographic manner where possible in order to provide an extended evidence base in the decision making process”. This SEDA will fulfil these suggestions under the Regional Planning Guidelines, and DCC will be the one of the first local authorities to do so, which will pave the way for other local authorities to follow suit.

Dublin City Spatial Energy Demand Analysis
14
Dublin City Spatial Energy Demand Analysis
15
Spatial Energy Demand Analysis
Introduction This section outlines the methods and results of calculating and mapping current energy consumption in buildings within the Dublin City area. Currently there is no publicly available actual energy consumption data for every building in Dublin City, and therefore a methodology was devised in order to estimate energy use in every building based on best available evidence based data, and attach this information to a geographic location to visualise it spatially. The methodology was developed by Codema for South Dublin County Council’s SEDA, which was the first of its kind to be developed in Ireland, and this analysis follows the same methodological process. The data is accumulated and analysed through the use of MS Excel software and mapped using QGIS open-source mapping software. From analyses of spatial demand mapping practices in other countries, and the availability of matching data across all sectors, the main sets of energy data which will be created and mapped are:
Total Energy Demand Total Heat Demand Heat Demand Density Total Electricity Use Total Fossil Fuel Use Total Annual Energy Costs
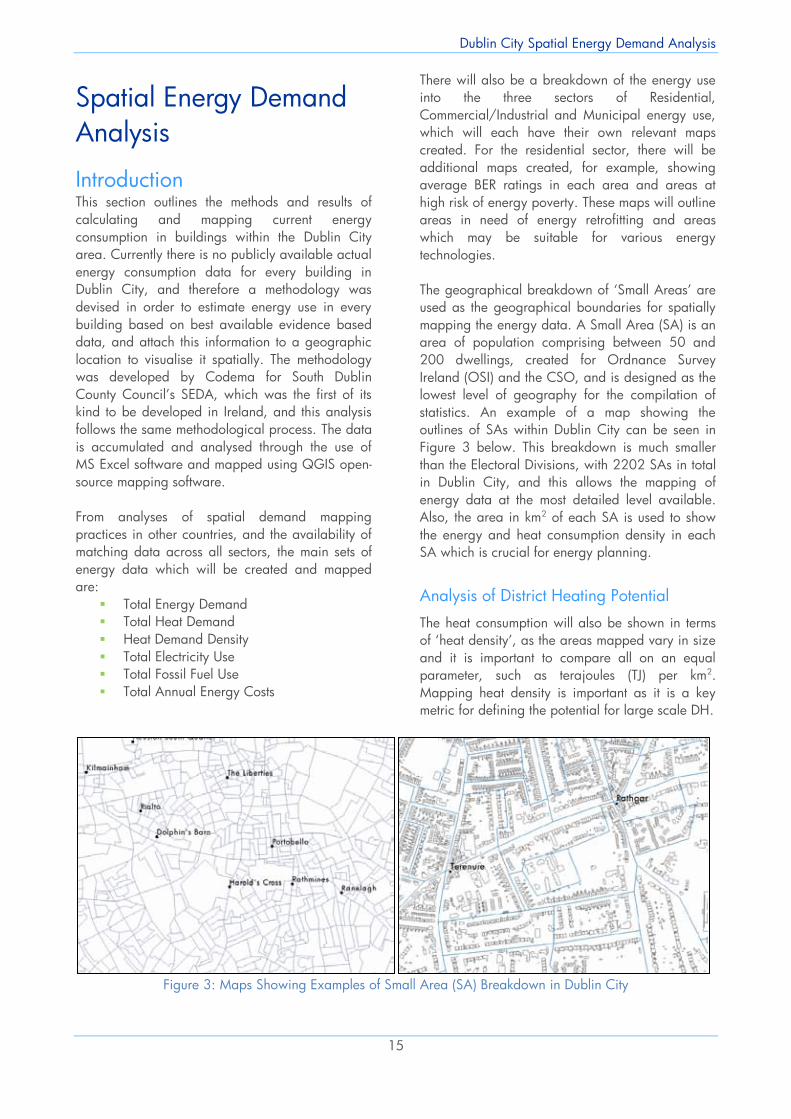
There will also be a breakdown of the energy use into the three sectors of Residential, Commercial/Industrial and Municipal energy use, which will each have their own relevant maps created. For the residential sector, there will be additional maps created, for example, showing average BER ratings in each area and areas at high risk of energy poverty. These maps will outline areas in need of energy retrofitting and areas which may be suitable for various energy technologies. The geographical breakdown of ‘Small Areas’ are used as the geographical boundaries for spatially mapping the energy data. A Small Area (SA) is an area of population comprising between 50 and 200 dwellings, created for Ordnance Survey Ireland (OSI) and the CSO, and is designed as the lowest level of geography for the compilation of statistics. An example of a map showing the outlines of SAs within Dublin City can be seen in Figure 3 below. This breakdown is much smaller than the Electoral Divisions, with 2202 SAs in total in Dublin City, and this allows the mapping of energy data at the most detailed level available. Also, the area in km2 of each SA is used to show the energy and heat consumption density in each SA which is crucial for energy planning.
Analysis of District Heating Potential
The heat consumption will also be shown in terms of ‘heat density’, as the areas mapped vary in size and it is important to compare all on an equal parameter, such as terajoules (TJ) per km2. Mapping heat density is important as it is a key metric for defining the potential for large scale DH.
Figure 3: Maps Showing Examples of Small Area (SA) Breakdown in Dublin City
Dublin City Spatial Energy Demand Analysis
14
Dublin City Spatial Energy Demand Analysis
15
Spatial Energy Demand Analysis
Introduction This section outlines the methods and results of calculating and mapping current energy consumption in buildings within the Dublin City area. Currently there is no publicly available actual energy consumption data for every building in Dublin City, and therefore a methodology was devised in order to estimate energy use in every building based on best available evidence based data, and attach this information to a geographic location to visualise it spatially. The methodology was developed by Codema for South Dublin County Council’s SEDA, which was the first of its kind to be developed in Ireland, and this analysis follows the same methodological process. The data is accumulated and analysed through the use of MS Excel software and mapped using QGIS open-source mapping software. From analyses of spatial demand mapping practices in other countries, and the availability of matching data across all sectors, the main sets of energy data which will be created and mapped are:
Total Energy Demand Total Heat Demand Heat Demand Density Total Electricity Use Total Fossil Fuel Use Total Annual Energy Costs
There will also be a breakdown of the energy use into the three sectors of Residential, Commercial/Industrial and Municipal energy use, which will each have their own relevant maps created. For the residential sector, there will be additional maps created, for example, showing average BER ratings in each area and areas at high risk of energy poverty. These maps will outline areas in need of energy retrofitting and areas which may be suitable for various energy technologies. The geographical breakdown of ‘Small Areas’ are used as the geographical boundaries for spatially mapping the energy data. A Small Area (SA) is an area of population comprising between 50 and 200 dwellings, created for Ordnance Survey Ireland (OSI) and the CSO, and is designed as the lowest level of geography for the compilation of statistics. An example of a map showing the outlines of SAs within Dublin City can be seen in Figure 3 below. This breakdown is much smaller than the Electoral Divisions, with 2202 SAs in total in Dublin City, and this allows the mapping of energy data at the most detailed level available. Also, the area in km2 of each SA is used to show the energy and heat consumption density in each SA which is crucial for energy planning.
Analysis of District Heating Potential
The heat consumption will also be shown in terms of ‘heat density’, as the areas mapped vary in size and it is important to compare all on an equal parameter, such as terajoules (TJ) per km2. Mapping heat density is important as it is a key metric for defining the potential for large scale DH.
Figure 3: Maps Showing Examples of Small Area (SA) Breakdown in Dublin City
Dublin City Spatial Energy Demand Analysis
16
DH is a particularly relevant technology to consider for Dublin City as it is a dense urban area with little unoccupied space, meaning the implementation of many RE technologies such as wind farms is limited. DH on the other hand is particularly suited to dense urban areas and is therefore an ideal urban solution to increase energy efficiency and enable higher levels of urban RE integration. Dublin City Council is currently involved in a project which will see a large Waste to Energy (WtE) plant built within the city boundaries in the coming years. This plant will create electricity from waste collected in Dublin, which would normally have been destined for landfill. The plant design allows operation in Combined Heat and Power (CHP) mode, meaning this could be a major heat source for Dublin City, with peak thermal output estimated at 110MW. It is also important to analyse DH potential as heating and cooling are fundamentally local and regional matters, and are often not dealt with effectively at a national level. Danish municipalities carry out heat planning studies and judge an area to be suitable for DH based on the measurement of heat density, usually given in TJ/km2, with any areas measuring above 150TJ/km2 deemed technically and economically suitable for developing conventional DH systems. The density is specifically important for DH economic viability as it becomes cheaper to implement when buildings are closer together due to shorter pipelines requiring less investment costs, and therefore the system becomes more cost-effective than individual solutions (Connolly, et al., 2014). Also, shorter pipelines result in fewer losses and less pumping requirements, which can reduce running costs significantly. There are currently no large scale DH systems in Ireland, and little or no financial or policy supports for DH systems. Due to this lack of experience, and difference in support mechanisms between Denmark and Ireland, it is better to look to first-phase development of large scale DH in areas with the highest heat demand densities available. The Danish 150 TJ/km2 threshold can then be used once a large scale DH scheme has been initiated and looking to expand. Increasing the minimum density threshold for viability will also allow for potential errors in energy estimations made in this study.
With a DH system there is opportunity to use heat from one or many sources, which may or may not rely on the location’s characteristics. Fuel can be imported in most cases to fuel boilers or CHP units, but will be better placed if close to major road networks for oil or biomass deliveries. Waste heat2, mainly sourced from industrial processes, is an ideal input into DH systems as it is a potentially low cost source and utilises energy that would otherwise be considered a loss, therefore increasing efficiencies. There are likely to be many industrial process waste heat resources in the city, such as waste heat from existing power plants, breweries and waste water treatment plants, and the potential to use such resources in Dublin City should be investigated further. Other low cost fuels for DH systems can come from geothermal sources, heat pumps or solar thermal farms which are now common-practice solutions in Danish low temperature DH systems. Smart grid enabled electric boilers and heat pumps incorporated in DH supply systems which are timed to switch on/off when electricity prices are low/high can take advantage of low electricity costs and also help to integrate more fluctuating renewable energy on the grid.
Local Electricity Production Potential The regulations in Ireland forbid the provision of what is termed a ‘private wire network’. This means that you may not supply electricity to other buildings which are not on the same property as the building which is producing the electricity. This means, if a building is producing electricity and there is a surplus to what they require to cover their own demand, they must release this surplus electricity through the national grid, or store in some way for their own future use. There are possibilities for large producers to establish contracts and sell this surplus to the grid, but there is currently no electricity supplier offering payments3 for surplus energy to micro-generation4 units.
2 Waste heat is heat which is lost to the atmosphere during industrial and manufacturing processes, rather than heat obtained from waste. 3 There was a payment available through application to the ESB for micro-generation, but this scheme ceased in December 2014. 4 Micro-generation is termed as generators rated up to 25 Amps on single-phase systems (most household systems are single-phase) or 16Amps on 3-phase systems (ESB, 2015).
Dublin City Spatial Energy Demand Analysis
17
This means, when analysing electricity demand of buildings and possible local sustainable solutions to meeting this demand, it will be in terms of individual systems per building rather than in terms of group electricity schemes. This limits the possibilities for technologies such as CHP units as they will be more suited to industrial or large commercial consumers who have large electrical and heating requirements, and who can apply for grid connections, or in large district heating systems where the sale of electricity to the grid can help to offset the costs of heat production. In terms of individual building renewable electricity solutions, the main technologies used which are at an advanced stage are wind turbines, solar photovoltaic (PV) panels and hydro-power turbines. The potential to use these technologies will depend on the buildings location in terms of space for wind turbines and wind speeds, south-facing roof space and over-shading, and proximity to a suitable hydro source, respectively. Biomass-fed CHP units are another alternative to producing renewable electricity, and are not dependent on locational characteristics, as biomass can be imported like any other fuel. Again, biomass CHP units are more suited to commercial or industrial circumstances than households due to high upfront costs and the size of demand needed to ensure economic viability.
Energy Character Areas
Energy demand mapping is used as a tool in energy planning to define energy character areas. The individual energy characteristics of an area are used by planners to define the appropriate energy solutions or planning policies to be considered for strategic development zones, local area plans or county-wide development plans. For example, an area with mature residential dwellings in low density suburbs can often have poor thermal performance and therefore high heat demands per building. In most cases, these areas have little variety of building use and many different building owners, which make it less favourable for communal energy solutions and more suited to individual micro-generation technologies such as solar thermal and heat pumps. In contrast, town centres or areas of regeneration which have a high building density made up of old
and new buildings with mixed use such as hotels, offices, retail and apartments, are more suited to development of large scale heating and cooling networks. Although there will be numerous building owners and facilities managers involved, these building types are likely to be accustomed to the processes involved in procuring energy services and therefore will be more likely to engage in projects offering energy savings. Once these areas have been defined as suitable for individual or group energy schemes, the energy character areas can be defined further by overlaying renewable energy potential mapping in order to see which areas are most suitable for development of RE supply. For example, areas suitable for group energy schemes which are located in peripheral semi-rural areas may be situated close to bio-fuel supplies produced within the region, and can therefore agree long term supply contracts with local suppliers and benefit from low transport costs. It is important to note that the resulting specific energy characteristics of each small area will have a different best-fit energy solution, which may incorporate energy savings and/or a mixture of technologies. There is no one definitive energy solution that is applicable to all areas, and once an area is identified for further investigation it is important that all available solutions are evaluated in terms of socio-economic cost-benefits. The main attributes to consider when assessing the economic feasibility of implementing various energy solutions will be the availability and suitability of low cost renewable sources in the area, the cost to retrofit current energy systems, and the current and predicted future costs of the fuel source being replaced. All energy data used in this SEDA is based on delivered energy and not primary energy consumption, and therefore losses involved in delivering the energy, i.e. electricity transmission grid losses, are not accounted for. Spatial energy demand in terms of agricultural land use has not been taken into account due to the lack of energy-related data available for the agricultural land, but the amount of agricultural land in the Dublin City area is negligible. The following sections in this chapter outline the results and methodologies of each area of energy use, namely residential, commercial and municipal
Dublin City Spatial Energy Demand Analysis
16
DH is a particularly relevant technology to consider for Dublin City as it is a dense urban area with little unoccupied space, meaning the implementation of many RE technologies such as wind farms is limited. DH on the other hand is particularly suited to dense urban areas and is therefore an ideal urban solution to increase energy efficiency and enable higher levels of urban RE integration. Dublin City Council is currently involved in a project which will see a large Waste to Energy (WtE) plant built within the city boundaries in the coming years. This plant will create electricity from waste collected in Dublin, which would normally have been destined for landfill. The plant design allows operation in Combined Heat and Power (CHP) mode, meaning this could be a major heat source for Dublin City, with peak thermal output estimated at 110MW. It is also important to analyse DH potential as heating and cooling are fundamentally local and regional matters, and are often not dealt with effectively at a national level. Danish municipalities carry out heat planning studies and judge an area to be suitable for DH based on the measurement of heat density, usually given in TJ/km2, with any areas measuring above 150TJ/km2 deemed technically and economically suitable for developing conventional DH systems. The density is specifically important for DH economic viability as it becomes cheaper to implement when buildings are closer together due to shorter pipelines requiring less investment costs, and therefore the system becomes more cost-effective than individual solutions (Connolly, et al., 2014). Also, shorter pipelines result in fewer losses and less pumping requirements, which can reduce running costs significantly. There are currently no large scale DH systems in Ireland, and little or no financial or policy supports for DH systems. Due to this lack of experience, and difference in support mechanisms between Denmark and Ireland, it is better to look to first-phase development of large scale DH in areas with the highest heat demand densities available. The Danish 150 TJ/km2 threshold can then be used once a large scale DH scheme has been initiated and looking to expand. Increasing the minimum density threshold for viability will also allow for potential errors in energy estimations made in this study.
With a DH system there is opportunity to use heat from one or many sources, which may or may not rely on the location’s characteristics. Fuel can be imported in most cases to fuel boilers or CHP units, but will be better placed if close to major road networks for oil or biomass deliveries. Waste heat2, mainly sourced from industrial processes, is an ideal input into DH systems as it is a potentially low cost source and utilises energy that would otherwise be considered a loss, therefore increasing efficiencies. There are likely to be many industrial process waste heat resources in the city, such as waste heat from existing power plants, breweries and waste water treatment plants, and the potential to use such resources in Dublin City should be investigated further. Other low cost fuels for DH systems can come from geothermal sources, heat pumps or solar thermal farms which are now common-practice solutions in Danish low temperature DH systems. Smart grid enabled electric boilers and heat pumps incorporated in DH supply systems which are timed to switch on/off when electricity prices are low/high can take advantage of low electricity costs and also help to integrate more fluctuating renewable energy on the grid.
Local Electricity Production Potential The regulations in Ireland forbid the provision of what is termed a ‘private wire network’. This means that you may not supply electricity to other buildings which are not on the same property as the building which is producing the electricity. This means, if a building is producing electricity and there is a surplus to what they require to cover their own demand, they must release this surplus electricity through the national grid, or store in some way for their own future use. There are possibilities for large producers to establish contracts and sell this surplus to the grid, but there is currently no electricity supplier offering payments3 for surplus energy to micro-generation4 units.
2 Waste heat is heat which is lost to the atmosphere during industrial and manufacturing processes, rather than heat obtained from waste. 3 There was a payment available through application to the ESB for micro-generation, but this scheme ceased in December 2014. 4 Micro-generation is termed as generators rated up to 25 Amps on single-phase systems (most household systems are single-phase) or 16Amps on 3-phase systems (ESB, 2015).
Dublin City Spatial Energy Demand Analysis
17
This means, when analysing electricity demand of buildings and possible local sustainable solutions to meeting this demand, it will be in terms of individual systems per building rather than in terms of group electricity schemes. This limits the possibilities for technologies such as CHP units as they will be more suited to industrial or large commercial consumers who have large electrical and heating requirements, and who can apply for grid connections, or in large district heating systems where the sale of electricity to the grid can help to offset the costs of heat production. In terms of individual building renewable electricity solutions, the main technologies used which are at an advanced stage are wind turbines, solar photovoltaic (PV) panels and hydro-power turbines. The potential to use these technologies will depend on the buildings location in terms of space for wind turbines and wind speeds, south-facing roof space and over-shading, and proximity to a suitable hydro source, respectively. Biomass-fed CHP units are another alternative to producing renewable electricity, and are not dependent on locational characteristics, as biomass can be imported like any other fuel. Again, biomass CHP units are more suited to commercial or industrial circumstances than households due to high upfront costs and the size of demand needed to ensure economic viability.
Energy Character Areas
Energy demand mapping is used as a tool in energy planning to define energy character areas. The individual energy characteristics of an area are used by planners to define the appropriate energy solutions or planning policies to be considered for strategic development zones, local area plans or county-wide development plans. For example, an area with mature residential dwellings in low density suburbs can often have poor thermal performance and therefore high heat demands per building. In most cases, these areas have little variety of building use and many different building owners, which make it less favourable for communal energy solutions and more suited to individual micro-generation technologies such as solar thermal and heat pumps. In contrast, town centres or areas of regeneration which have a high building density made up of old
and new buildings with mixed use such as hotels, offices, retail and apartments, are more suited to development of large scale heating and cooling networks. Although there will be numerous building owners and facilities managers involved, these building types are likely to be accustomed to the processes involved in procuring energy services and therefore will be more likely to engage in projects offering energy savings. Once these areas have been defined as suitable for individual or group energy schemes, the energy character areas can be defined further by overlaying renewable energy potential mapping in order to see which areas are most suitable for development of RE supply. For example, areas suitable for group energy schemes which are located in peripheral semi-rural areas may be situated close to bio-fuel supplies produced within the region, and can therefore agree long term supply contracts with local suppliers and benefit from low transport costs. It is important to note that the resulting specific energy characteristics of each small area will have a different best-fit energy solution, which may incorporate energy savings and/or a mixture of technologies. There is no one definitive energy solution that is applicable to all areas, and once an area is identified for further investigation it is important that all available solutions are evaluated in terms of socio-economic cost-benefits. The main attributes to consider when assessing the economic feasibility of implementing various energy solutions will be the availability and suitability of low cost renewable sources in the area, the cost to retrofit current energy systems, and the current and predicted future costs of the fuel source being replaced. All energy data used in this SEDA is based on delivered energy and not primary energy consumption, and therefore losses involved in delivering the energy, i.e. electricity transmission grid losses, are not accounted for. Spatial energy demand in terms of agricultural land use has not been taken into account due to the lack of energy-related data available for the agricultural land, but the amount of agricultural land in the Dublin City area is negligible. The following sections in this chapter outline the results and methodologies of each area of energy use, namely residential, commercial and municipal

Dublin City Spatial Energy Demand Analysis
18
building energy, and the overall total energy use in Dublin City.
Dublin City Spatial Energy Demand Analysis
19
Residential Sector Energy
Methodology
Two main datasets which provide high levels of accuracy and detail are used in order to estimate the energy use in each dwelling in Dublin City; they are the National Census from the Central Statistics Office (CSO) and the National BER Research Tool from the SEAI. At the time of the last Census in 2011, there were 207,847 permanent private households in Dublin City. Some of these dwellings are listed as vacant, but are assumed to now be occupied due to increased demand for housing, and as such have energy consumption attributed. There have been additional dwellings built in Dublin City since 2011, but so few that it does not affect the results5. The CSO provided special tabulations which gave the number of dwellings by period built and type of dwelling in each of the 2,202 small areas in Dublin City. These attributes have a significant impact on the theoretical energy use per dwelling due to floor area size and exposed external wall area which vary according to dwelling type, i.e. detached house or apartment, and the building regulations requirements in place and materials and technology available at the time of construction. In line with data protection, the CSO was required to ‘hide’ data where the breakdown could possibly allow identification of individual households. In these cases, the CSO gave a figure of ‘<3’ where the number of households in a breakdown category was either 1 or 2. In these cases, the ‘<3’ was replaced by ‘1’, and so the energy use will be underestimated rather than overestimated. It is better to underestimate the demand, as, for example, for a group heating scheme to be feasible, the area will need to have a high heat density, and so an underestimate of heat demand is better. Also, the number of instances of ‘<3’ were few, and replacing with ‘1’ means that only 5,379 dwellings are unaccounted for throughout the city, which is 2.6% of total. The total number of dwellings used for calculations is therefore 202,468. 5 Latest figures show there have been 1,566 houses built in Dublin City from 2011 to end of 2013 (Dept. Environment, Community & Local Government)
In order to attach energy data to the housing breakdown, the National BER Research Tool database6 from the SEAI was used to find an average energy profile of each housing type and housing age in each area within Dublin City. The BERs only assess the energy requirements of the building itself and do not take into account electricity used for various appliances, therefore additional electricity use associated with appliance use has been applied based on figures from the SEAI’s Energy in the Residential Sector 2013 report (SEAI, 2013 (b)). The BER dataset has been broken down into 16 Dublin City postcodes, four housing types (detached, semi-detached, terraced and apartments), and seven building periods, with periods chosen to match those grouped by the CSO. There were over 72,000 BERs analysed and 448 subsets of data created to establish 448 average energy profiles to represent the variety of housing types, ages and locations. These profiles where then applied to the CSO data breakdown. The representation of BERs in each postcode area is shown in Table 1. Overall there is a 35% representation of BERs to total dwellings in Dublin City. Some postcode areas overlap outside of the Dublin City area, particularly Dublin 13, 17, 20 and 6W, and so there is a higher representation of BERs in these areas as they include BERs within other county areas, which is unavoidable. This is not an issue in terms of accuracy in energy estimates as a household will not use more or less energy because it is on one side or another of a regional authority boundary. The Dublin 1 postcode area is entirely within Dublin City boundaries, and has a very high (60%) representation, likely due to high number of rented properties.
6 The BER database is constantly updated, and so it is important to state that for this project, the database was accessed on the 10th April 2015
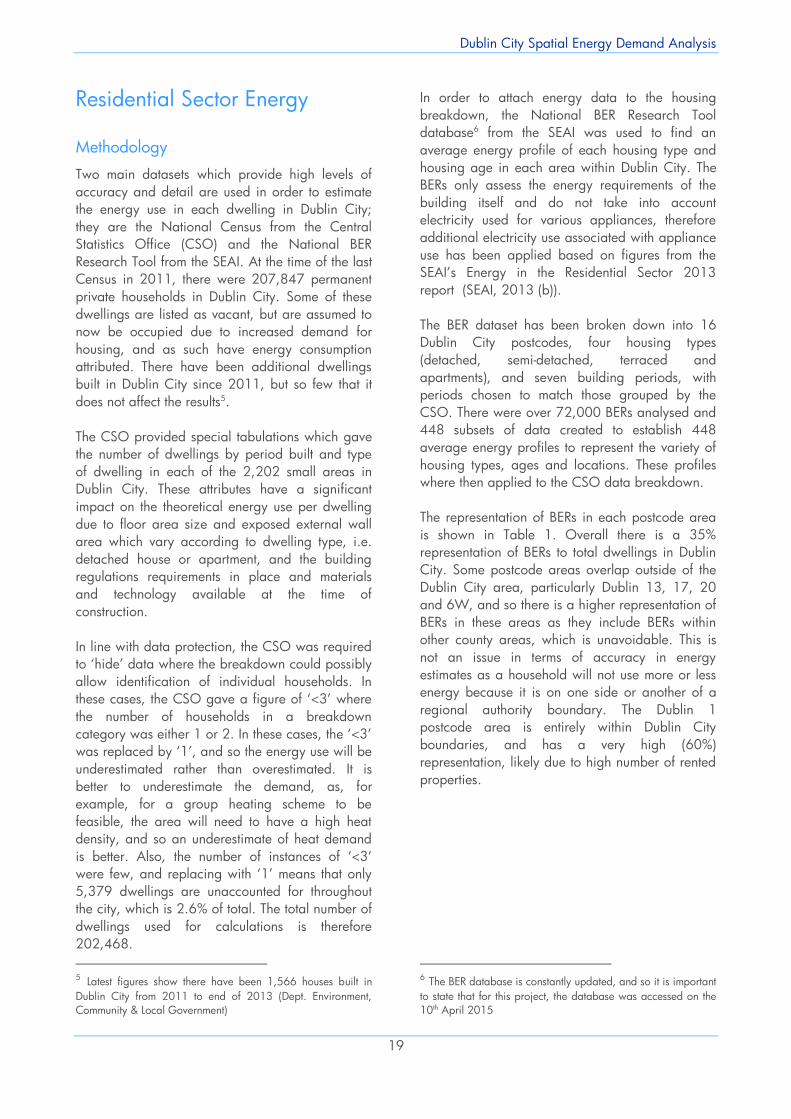
Dublin City Spatial Energy Demand Analysis
18
building energy, and the overall total energy use in Dublin City.
Dublin City Spatial Energy Demand Analysis
19
Residential Sector Energy
Methodology
Two main datasets which provide high levels of accuracy and detail are used in order to estimate the energy use in each dwelling in Dublin City; they are the National Census from the Central Statistics Office (CSO) and the National BER Research Tool from the SEAI. At the time of the last Census in 2011, there were 207,847 permanent private households in Dublin City. Some of these dwellings are listed as vacant, but are assumed to now be occupied due to increased demand for housing, and as such have energy consumption attributed. There have been additional dwellings built in Dublin City since 2011, but so few that it does not affect the results5. The CSO provided special tabulations which gave the number of dwellings by period built and type of dwelling in each of the 2,202 small areas in Dublin City. These attributes have a significant impact on the theoretical energy use per dwelling due to floor area size and exposed external wall area which vary according to dwelling type, i.e. detached house or apartment, and the building regulations requirements in place and materials and technology available at the time of construction. In line with data protection, the CSO was required to ‘hide’ data where the breakdown could possibly allow identification of individual households. In these cases, the CSO gave a figure of ‘<3’ where the number of households in a breakdown category was either 1 or 2. In these cases, the ‘<3’ was replaced by ‘1’, and so the energy use will be underestimated rather than overestimated. It is better to underestimate the demand, as, for example, for a group heating scheme to be feasible, the area will need to have a high heat density, and so an underestimate of heat demand is better. Also, the number of instances of ‘<3’ were few, and replacing with ‘1’ means that only 5,379 dwellings are unaccounted for throughout the city, which is 2.6% of total. The total number of dwellings used for calculations is therefore 202,468. 5 Latest figures show there have been 1,566 houses built in Dublin City from 2011 to end of 2013 (Dept. Environment, Community & Local Government)
In order to attach energy data to the housing breakdown, the National BER Research Tool database6 from the SEAI was used to find an average energy profile of each housing type and housing age in each area within Dublin City. The BERs only assess the energy requirements of the building itself and do not take into account electricity used for various appliances, therefore additional electricity use associated with appliance use has been applied based on figures from the SEAI’s Energy in the Residential Sector 2013 report (SEAI, 2013 (b)). The BER dataset has been broken down into 16 Dublin City postcodes, four housing types (detached, semi-detached, terraced and apartments), and seven building periods, with periods chosen to match those grouped by the CSO. There were over 72,000 BERs analysed and 448 subsets of data created to establish 448 average energy profiles to represent the variety of housing types, ages and locations. These profiles where then applied to the CSO data breakdown. The representation of BERs in each postcode area is shown in Table 1. Overall there is a 35% representation of BERs to total dwellings in Dublin City. Some postcode areas overlap outside of the Dublin City area, particularly Dublin 13, 17, 20 and 6W, and so there is a higher representation of BERs in these areas as they include BERs within other county areas, which is unavoidable. This is not an issue in terms of accuracy in energy estimates as a household will not use more or less energy because it is on one side or another of a regional authority boundary. The Dublin 1 postcode area is entirely within Dublin City boundaries, and has a very high (60%) representation, likely due to high number of rented properties.
6 The BER database is constantly updated, and so it is important to state that for this project, the database was accessed on the 10th April 2015
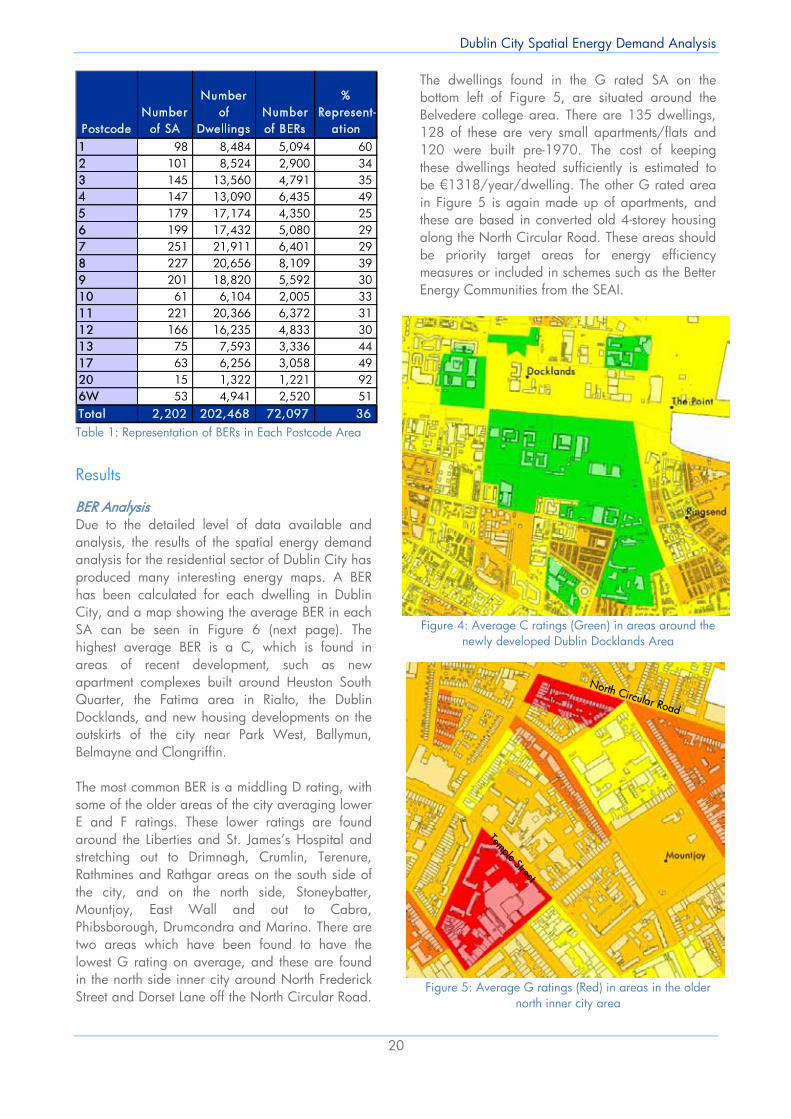
Dublin City Spatial Energy Demand Analysis
20
Table 1: Representation of BERs in Each Postcode Area
Results
BER Analysis Due to the detailed level of data available and analysis, the results of the spatial energy demand analysis for the residential sector of Dublin City has produced many interesting energy maps. A BER has been calculated for each dwelling in Dublin City, and a map showing the average BER in each SA can be seen in Figure 6 (next page). The highest average BER is a C, which is found in areas of recent development, such as new apartment complexes built around Heuston South Quarter, the Fatima area in Rialto, the Dublin Docklands, and new housing developments on the outskirts of the city near Park West, Ballymun, Belmayne and Clongriffin. The most common BER is a middling D rating, with some of the older areas of the city averaging lower E and F ratings. These lower ratings are found around the Liberties and St. James’s Hospital and stretching out to Drimnagh, Crumlin, Terenure, Rathmines and Rathgar areas on the south side of the city, and on the north side, Stoneybatter, Mountjoy, East Wall and out to Cabra, Phibsborough, Drumcondra and Marino. There are two areas which have been found to have the lowest G rating on average, and these are found in the north side inner city around North Frederick Street and Dorset Lane off the North Circular Road.
The dwellings found in the G rated SA on the bottom left of Figure 5, are situated around the Belvedere college area. There are 135 dwellings, 128 of these are very small apartments/flats and 120 were built pre-1970. The cost of keeping these dwellings heated sufficiently is estimated to be €1318/year/dwelling. The other G rated area in Figure 5 is again made up of apartments, and these are based in converted old 4-storey housing along the North Circular Road. These areas should be priority target areas for energy efficiency measures or included in schemes such as the Better Energy Communities from the SEAI.
Figure 4: Average C ratings (Green) in areas around the
newly developed Dublin Docklands Area
Figure 5: Average G ratings (Red) in areas in the older
north inner city area
PostcodeNumber
of SA
Number of
DwellingsNumber of BERs
% Represent -
at ion1 98 8,484 5,094 60 2 101 8,524 2,900 34 3 145 13,560 4,791 35 4 147 13,090 6,435 49 5 179 17,174 4,350 25 6 199 17,432 5,080 29 7 251 21,911 6,401 29 8 227 20,656 8,109 39 9 201 18,820 5,592 30 10 61 6,104 2,005 33 11 221 20,366 6,372 31 12 166 16,235 4,833 30 13 75 7,593 3,336 44 17 63 6,256 3,058 49 20 15 1,322 1,221 92 6W 53 4,941 2,520 51 Total 2,202 202,468 72,097 36
Dublin City Spatial Energy Demand Analysis
21
Figure 6: Average BER of All Dwellings in Each Small Area
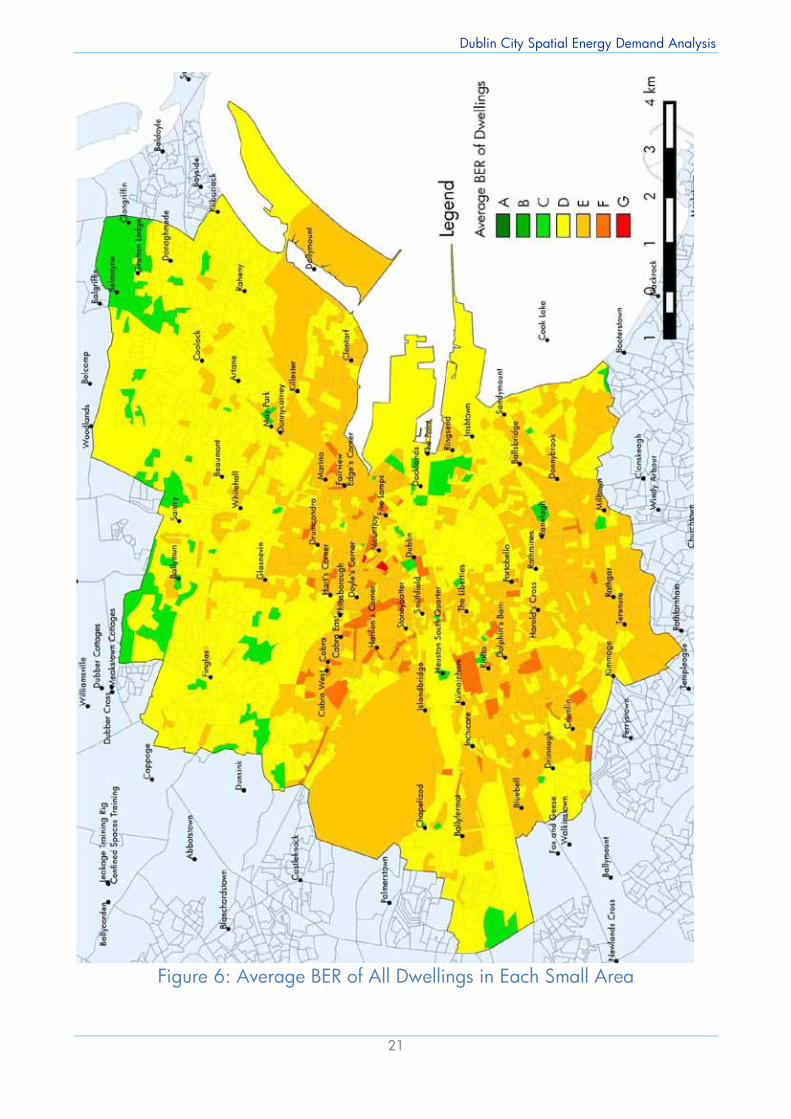
Dublin City Spatial Energy Demand Analysis
20
Table 1: Representation of BERs in Each Postcode Area
Results
BER Analysis Due to the detailed level of data available and analysis, the results of the spatial energy demand analysis for the residential sector of Dublin City has produced many interesting energy maps. A BER has been calculated for each dwelling in Dublin City, and a map showing the average BER in each SA can be seen in Figure 6 (next page). The highest average BER is a C, which is found in areas of recent development, such as new apartment complexes built around Heuston South Quarter, the Fatima area in Rialto, the Dublin Docklands, and new housing developments on the outskirts of the city near Park West, Ballymun, Belmayne and Clongriffin. The most common BER is a middling D rating, with some of the older areas of the city averaging lower E and F ratings. These lower ratings are found around the Liberties and St. James’s Hospital and stretching out to Drimnagh, Crumlin, Terenure, Rathmines and Rathgar areas on the south side of the city, and on the north side, Stoneybatter, Mountjoy, East Wall and out to Cabra, Phibsborough, Drumcondra and Marino. There are two areas which have been found to have the lowest G rating on average, and these are found in the north side inner city around North Frederick Street and Dorset Lane off the North Circular Road.
The dwellings found in the G rated SA on the bottom left of Figure 5, are situated around the Belvedere college area. There are 135 dwellings, 128 of these are very small apartments/flats and 120 were built pre-1970. The cost of keeping these dwellings heated sufficiently is estimated to be €1318/year/dwelling. The other G rated area in Figure 5 is again made up of apartments, and these are based in converted old 4-storey housing along the North Circular Road. These areas should be priority target areas for energy efficiency measures or included in schemes such as the Better Energy Communities from the SEAI.
Figure 4: Average C ratings (Green) in areas around the
newly developed Dublin Docklands Area
Figure 5: Average G ratings (Red) in areas in the older
north inner city area
PostcodeNumber
of SA
Number of
DwellingsNumber of BERs
% Represent -
at ion1 98 8,484 5,094 60 2 101 8,524 2,900 34 3 145 13,560 4,791 35 4 147 13,090 6,435 49 5 179 17,174 4,350 25 6 199 17,432 5,080 29 7 251 21,911 6,401 29 8 227 20,656 8,109 39 9 201 18,820 5,592 30 10 61 6,104 2,005 33 11 221 20,366 6,372 31 12 166 16,235 4,833 30 13 75 7,593 3,336 44 17 63 6,256 3,058 49 20 15 1,322 1,221 92 6W 53 4,941 2,520 51 Total 2,202 202,468 72,097 36
Dublin City Spatial Energy Demand Analysis
21
Figure 6: Average BER of All Dwellings in Each Small Area
Dublin City Spatial Energy Demand Analysis
22
The results of the BER analysis show that, while better building regulations for new builds is effectively reducing the energy demands in new developments, the rest of the city’s dwellings are becoming older and less efficient, and to really reduce energy use in the city, these households need to be retrofitted with sustainable solutions. A real concern is the number of rented dwellings which have very poor BERs. With escalating rents in the city, coupled with increasing energy costs, the affordability of energy in these poorly insulated rented dwellings will only increase the number of people suffering from energy poverty. There needs to be more incentives or deterrents introduced to enable landlords to make their properties more energy efficient and less costly to keep warm.
Energy Use per Household The next map, Figure 7, p. 23, shows the average energy use per dwelling in kilowatt-hours (kWh). The green and dark green areas have low energy use per dwelling, with the light yellow band representing the average energy use in Dublin City which is between approximately 20,000 and 25,000 kWh. In comparison, the national average energy use per household is around 20,000 kWh (SEAI, 2013 (b)), meaning Dublin City is slightly above the national average. The inner city area has quite low energy use per dwelling in comparison to the rest of the city, due to the fact the dwellings in this area are much smaller, comprising mainly of apartments or small terraced housing, and can accommodate fewer inhabitants. The newly developed areas which have good BERs are shown here again to have low energy use per dwelling, even though some of these areas have larger dwellings than those found in the inner city. The areas of orange and red have above average use per dwelling, and in some cases nearly double the average energy use of a Dublin City dwelling. These areas have some of the largest and oldest dwellings found in the city, and are mainly found in the south-side suburbs in areas such as Kimmage, Terenure, Rathgar, Clonskeagh, Donnybrook and Blackrock, with some areas in Marino and Clontarf on the north-side of the City also showing high energy use per dwelling. To compare with average floor areas, Figure 8, shows the average floor area of dwellings within each small area. It can be seen that there is an obvious overlap between the areas highlighted here and those with high energy use per household, but it
also highlights areas which may not have very large floor areas but still rank high in energy usage, and vice versa for areas with large floor areas and low energy usage.
Energy Costs per Household The estimated energy costs per household are mapped in Figure 9, p. 25. Many areas shown here with higher than average energy costs overlap with areas shown in Figure 7 with high energy use per household, but there are other areas which have high costs, not due to the size of the dwelling, but due to the fuel used for water and space heating, and efficiencies of heating systems. The main fuel used for household space heating in Dublin City is natural gas, but many apartments are electrically heated using storage heating units and some households have oil boilers due to distance from the gas grid. Many households also have electric showers or electric immersions for hot water. The fuel prices used in this analysis are based on SEAI’s Domestic Fuel Cost Comparisons (April 2015), and electricity and gas prices per kWh have been applied to each household according to the usage price bands. Domestic electricity rates in Ireland are the second highest in Europe, and fourth highest when all taxes and levies are included, just behind Denmark, Germany and Cyprus (S2 2014) (eurostat, 2015). Oil fuel costs used to be more expensive than natural gas, but the price has dropped recently and now oil is close to the same cost per kWh of gas. The areas in dark green have very high energy costs, but are mainly found in more affluent areas with large housing units and which can accommodate many occupants per dwelling to share these costs. The lighter green areas have lower costs, but are still relatively high per household, with many smaller households paying over €2,000 per year for energy. These costs can make up a large part of a households’ annual income, and can cause households to be without heat in the winter season. There are 81 small areas identified which have annual energy costs per dwelling above €2,000 per year and have floor areas smaller than 80m2. These areas all have low E and F BERs, and are found mainly in the inner city area around the Merchants Quay, Inns Quay, Arran Quay and Ushers Quay areas.
Dublin City Spatial Energy Demand Analysis
23
Figure 7: Average Annual Energy Use per Dwelling in Each Small Area
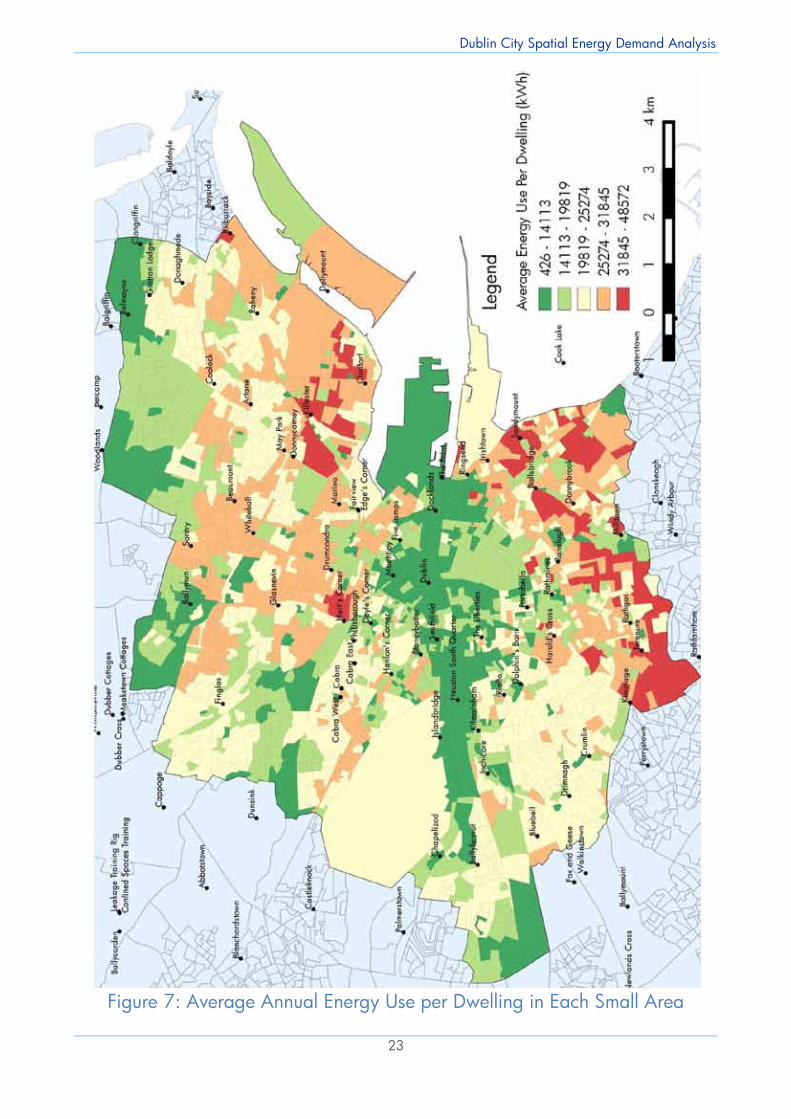
Dublin City Spatial Energy Demand Analysis
22
The results of the BER analysis show that, while better building regulations for new builds is effectively reducing the energy demands in new developments, the rest of the city’s dwellings are becoming older and less efficient, and to really reduce energy use in the city, these households need to be retrofitted with sustainable solutions. A real concern is the number of rented dwellings which have very poor BERs. With escalating rents in the city, coupled with increasing energy costs, the affordability of energy in these poorly insulated rented dwellings will only increase the number of people suffering from energy poverty. There needs to be more incentives or deterrents introduced to enable landlords to make their properties more energy efficient and less costly to keep warm.
Energy Use per Household The next map, Figure 7, p. 23, shows the average energy use per dwelling in kilowatt-hours (kWh). The green and dark green areas have low energy use per dwelling, with the light yellow band representing the average energy use in Dublin City which is between approximately 20,000 and 25,000 kWh. In comparison, the national average energy use per household is around 20,000 kWh (SEAI, 2013 (b)), meaning Dublin City is slightly above the national average. The inner city area has quite low energy use per dwelling in comparison to the rest of the city, due to the fact the dwellings in this area are much smaller, comprising mainly of apartments or small terraced housing, and can accommodate fewer inhabitants. The newly developed areas which have good BERs are shown here again to have low energy use per dwelling, even though some of these areas have larger dwellings than those found in the inner city. The areas of orange and red have above average use per dwelling, and in some cases nearly double the average energy use of a Dublin City dwelling. These areas have some of the largest and oldest dwellings found in the city, and are mainly found in the south-side suburbs in areas such as Kimmage, Terenure, Rathgar, Clonskeagh, Donnybrook and Blackrock, with some areas in Marino and Clontarf on the north-side of the City also showing high energy use per dwelling. To compare with average floor areas, Figure 8, shows the average floor area of dwellings within each small area. It can be seen that there is an obvious overlap between the areas highlighted here and those with high energy use per household, but it
also highlights areas which may not have very large floor areas but still rank high in energy usage, and vice versa for areas with large floor areas and low energy usage.
Energy Costs per Household The estimated energy costs per household are mapped in Figure 9, p. 25. Many areas shown here with higher than average energy costs overlap with areas shown in Figure 7 with high energy use per household, but there are other areas which have high costs, not due to the size of the dwelling, but due to the fuel used for water and space heating, and efficiencies of heating systems. The main fuel used for household space heating in Dublin City is natural gas, but many apartments are electrically heated using storage heating units and some households have oil boilers due to distance from the gas grid. Many households also have electric showers or electric immersions for hot water. The fuel prices used in this analysis are based on SEAI’s Domestic Fuel Cost Comparisons (April 2015), and electricity and gas prices per kWh have been applied to each household according to the usage price bands. Domestic electricity rates in Ireland are the second highest in Europe, and fourth highest when all taxes and levies are included, just behind Denmark, Germany and Cyprus (S2 2014) (eurostat, 2015). Oil fuel costs used to be more expensive than natural gas, but the price has dropped recently and now oil is close to the same cost per kWh of gas. The areas in dark green have very high energy costs, but are mainly found in more affluent areas with large housing units and which can accommodate many occupants per dwelling to share these costs. The lighter green areas have lower costs, but are still relatively high per household, with many smaller households paying over €2,000 per year for energy. These costs can make up a large part of a households’ annual income, and can cause households to be without heat in the winter season. There are 81 small areas identified which have annual energy costs per dwelling above €2,000 per year and have floor areas smaller than 80m2. These areas all have low E and F BERs, and are found mainly in the inner city area around the Merchants Quay, Inns Quay, Arran Quay and Ushers Quay areas.
Dublin City Spatial Energy Demand Analysis
23
Figure 7: Average Annual Energy Use per Dwelling in Each Small Area
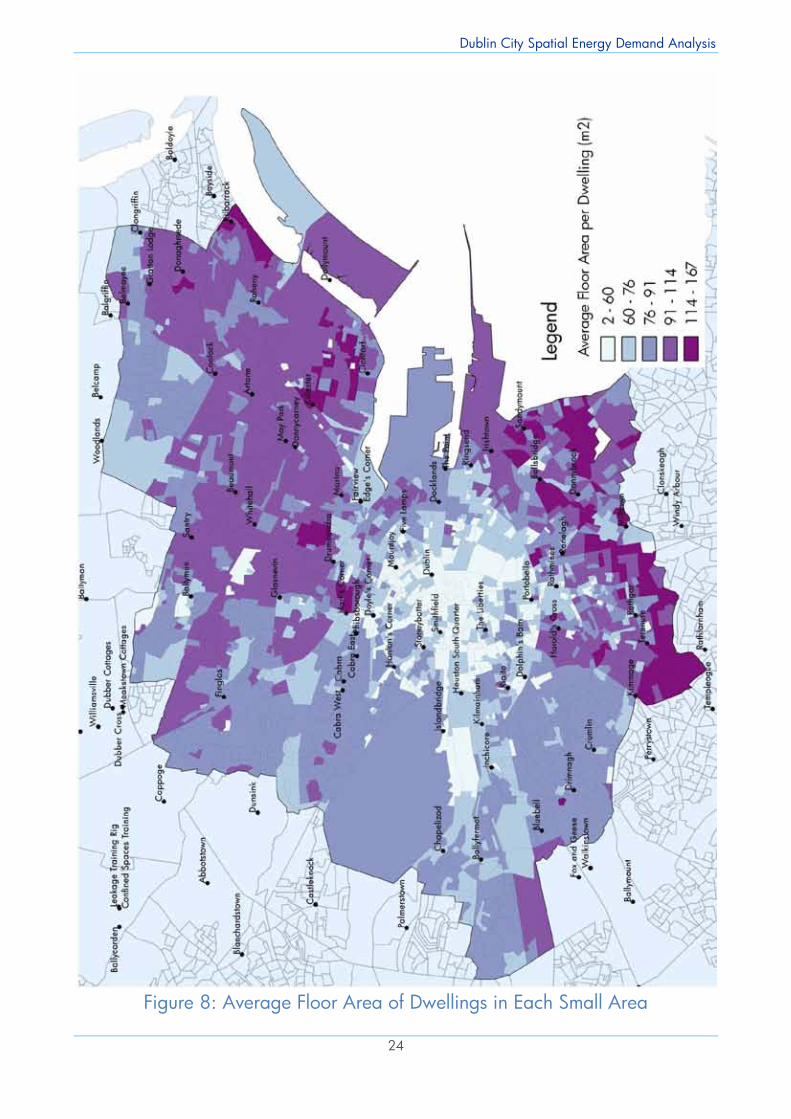
Dublin City Spatial Energy Demand Analysis
24
Figure 8: Average Floor Area of Dwellings in Each Small Area
Dublin City Spatial Energy Demand Analysis
25
Figure 9: Average Annual Energy Costs per Dwelling in Each Small Area
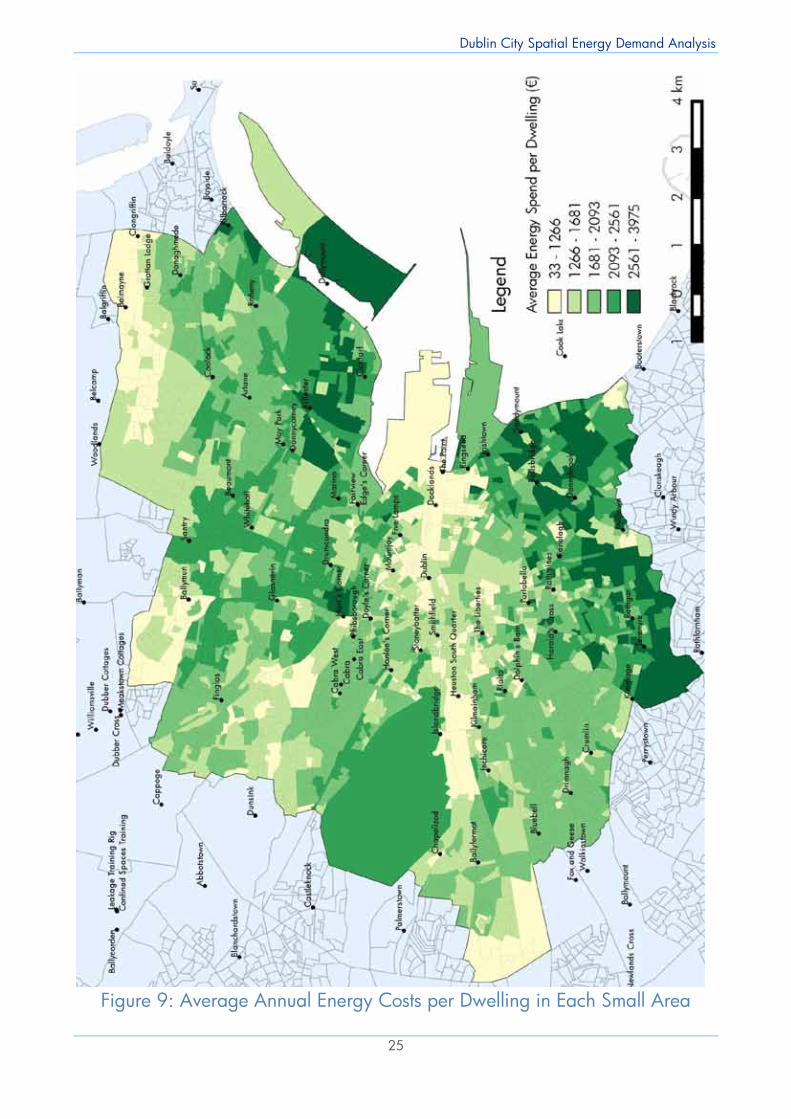
Dublin City Spatial Energy Demand Analysis
24
Figure 8: Average Floor Area of Dwellings in Each Small Area
Dublin City Spatial Energy Demand Analysis
25
Figure 9: Average Annual Energy Costs per Dwelling in Each Small Area
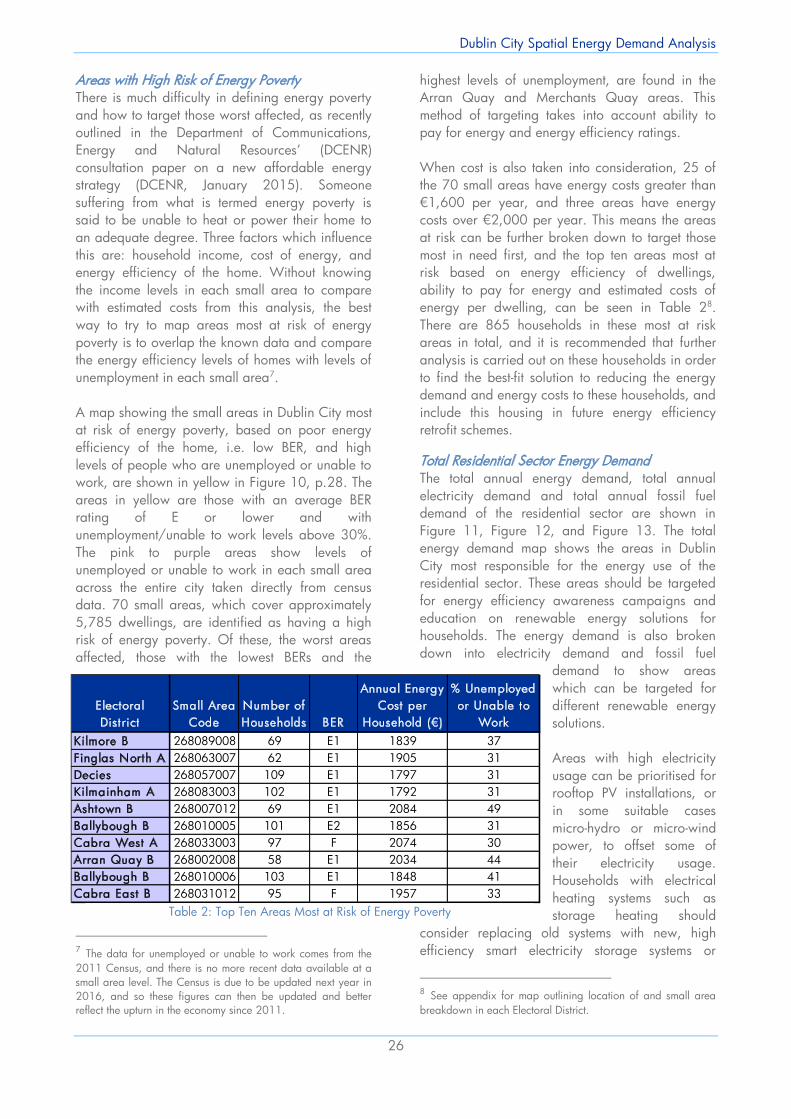
Dublin City Spatial Energy Demand Analysis
26
Areas with High Risk of Energy Poverty There is much difficulty in defining energy poverty and how to target those worst affected, as recently outlined in the Department of Communications, Energy and Natural Resources’ (DCENR) consultation paper on a new affordable energy strategy (DCENR, January 2015). Someone suffering from what is termed energy poverty is said to be unable to heat or power their home to an adequate degree. Three factors which influence this are: household income, cost of energy, and energy efficiency of the home. Without knowing the income levels in each small area to compare with estimated costs from this analysis, the best way to try to map areas most at risk of energy poverty is to overlap the known data and compare the energy efficiency levels of homes with levels of unemployment in each small area7. A map showing the small areas in Dublin City most at risk of energy poverty, based on poor energy efficiency of the home, i.e. low BER, and high levels of people who are unemployed or unable to work, are shown in yellow in Figure 10, p.28. The areas in yellow are those with an average BER rating of E or lower and with unemployment/unable to work levels above 30%. The pink to purple areas show levels of unemployed or unable to work in each small area across the entire city taken directly from census data. 70 small areas, which cover approximately 5,785 dwellings, are identified as having a high risk of energy poverty. Of these, the worst areas affected, those with the lowest BERs and the
7 The data for unemployed or unable to work comes from the 2011 Census, and there is no more recent data available at a small area level. The Census is due to be updated next year in 2016, and so these figures can then be updated and better reflect the upturn in the economy since 2011.
highest levels of unemployment, are found in the Arran Quay and Merchants Quay areas. This method of targeting takes into account ability to pay for energy and energy efficiency ratings. When cost is also taken into consideration, 25 of the 70 small areas have energy costs greater than €1,600 per year, and three areas have energy costs over €2,000 per year. This means the areas at risk can be further broken down to target those most in need first, and the top ten areas most at risk based on energy efficiency of dwellings, ability to pay for energy and estimated costs of energy per dwelling, can be seen in Table 28. There are 865 households in these most at risk areas in total, and it is recommended that further analysis is carried out on these households in order to find the best-fit solution to reducing the energy demand and energy costs to these households, and include this housing in future energy efficiency retrofit schemes.
Total Residential Sector Energy Demand The total annual energy demand, total annual electricity demand and total annual fossil fuel demand of the residential sector are shown in Figure 11, Figure 12, and Figure 13. The total energy demand map shows the areas in Dublin City most responsible for the energy use of the residential sector. These areas should be targeted for energy efficiency awareness campaigns and education on renewable energy solutions for households. The energy demand is also broken down into electricity demand and fossil fuel
demand to show areas which can be targeted for different renewable energy solutions. Areas with high electricity usage can be prioritised for rooftop PV installations, or in some suitable cases micro-hydro or micro-wind power, to offset some of their electricity usage. Households with electrical heating systems such as storage heating should
consider replacing old systems with new, high efficiency smart electricity storage systems or
8 See appendix for map outlining location of and small area breakdown in each Electoral District.
Electoral District
Small Area Code
Number of Households BER
Annual Energy Cost per
Household (€)
% Unemployed or Unable to
WorkKilmore B 268089008 69 E1 1839 37Finglas North A 268063007 62 E1 1905 31Decies 268057007 109 E1 1797 31Kilmainham A 268083003 102 E1 1792 31Ashtown B 268007012 69 E1 2084 49Ballybough B 268010005 101 E2 1856 31Cabra West A 268033003 97 F 2074 30Arran Quay B 268002008 58 E1 2034 44Ballybough B 268010006 103 E1 1848 41Cabra East B 268031012 95 F 1957 33
Table 2: Top Ten Areas Most at Risk of Energy Poverty
Dublin City Spatial Energy Demand Analysis
27
where practical, replacing with a wet system which can incorporate heat pumps, solar thermal and geothermal heat sources. Many apartment complexes were fitted with all-electric systems due to low cost and ease of installation. A group scheme with a central high efficiency CHP plant in such complexes can supply electricity and heat to the building and reduce overall fuel usage and costs. The biggest problem with many apartments, bed-sits and flats in the city is they are rented, and the tenants cannot make the big changes required to reduce their energy costs, and there are no incentives for landlords to upgrade the energy efficiency of their properties, especially in the current market where there is a lack of rental properties available. Areas with high fossil fuel usage cause the highest amount of local air pollution, particularly those which burn solid fuels such as coal and peat. From census data, the highest percentage share of coal or peat used as a main heating fuel in any small area is around 9%, which is relatively low in comparison to rural areas which do not have access to the gas grid. Open fires and stoves are often used in dwellings as secondary heat sources and so it is likely the number of dwellings which use solid fuels is underestimated when looking at main heating fuel only. With the local pollution and CO2 emissions caused by burning coal and peat, and the very low efficiencies of open fires (around 20%), it is important to ensure households switch to sustainable and cleaner forms of fuel such as wood, wood chips and wood pellets, and install highly efficient stoves in place of open fires. It is relatively cheap to install a wood fuel stove, and this not only reduces negative effects on the environment and health, but also saves money due to much higher efficiencies of up to 90%. The majority of the fossil fuel used in dwellings in Dublin City is natural gas and, in a smaller share, home heating oil. Areas which have high levels of
oil and gas used for hot water and space heating requirements should be encouraged to find renewable or sustainable alternatives. For individual building based systems, there are many proven and well established technologies which can greatly reduce a household’s reliance on fossil fuels; these include air, water and ground source heat pumps, solar thermal panels, heat recovery ventilation systems, and biomass-fuelled boilers or stoves. These solutions should be supported and included in home energy improvement grant schemes. For suitability of areas and households for each renewable energy solution, see section on renewable resources, p.55. District heating is a shared heating system with a central heating plant which feeds heat to each household on the system. As discussed in the introduction to this chapter, DH should be prioritised in areas of sufficiently high heat density. DH systems are likely to be more economically feasible if there are large commercial or industrial customers also on the system, due to high heat demand over long periods year round, but there are also many successful stand-alone residential schemes in operation. There are 91 small areas identified in this study with very high residential heat demand density of over 500TJ/km2, and many of these areas overlap with areas at risk of energy poverty. It may be more economically advantageous for groups of housing with heating systems which need to be replaced and in areas of high heat demand density to consider a cooperative DH scheme. DH can be expensive to retrofit due to ground works required for pipelines, and so DH is particularly suited to new housing developments or housing close to existing or planned DH schemes. DH feasibility will be further analysed later in this section when commercial and industrial energy use is combined with residential energy and the resulting total heat density is mapped.
Dublin City Spatial Energy Demand Analysis
26
Areas with High Risk of Energy Poverty There is much difficulty in defining energy poverty and how to target those worst affected, as recently outlined in the Department of Communications, Energy and Natural Resources’ (DCENR) consultation paper on a new affordable energy strategy (DCENR, January 2015). Someone suffering from what is termed energy poverty is said to be unable to heat or power their home to an adequate degree. Three factors which influence this are: household income, cost of energy, and energy efficiency of the home. Without knowing the income levels in each small area to compare with estimated costs from this analysis, the best way to try to map areas most at risk of energy poverty is to overlap the known data and compare the energy efficiency levels of homes with levels of unemployment in each small area7. A map showing the small areas in Dublin City most at risk of energy poverty, based on poor energy efficiency of the home, i.e. low BER, and high levels of people who are unemployed or unable to work, are shown in yellow in Figure 10, p.28. The areas in yellow are those with an average BER rating of E or lower and with unemployment/unable to work levels above 30%. The pink to purple areas show levels of unemployed or unable to work in each small area across the entire city taken directly from census data. 70 small areas, which cover approximately 5,785 dwellings, are identified as having a high risk of energy poverty. Of these, the worst areas affected, those with the lowest BERs and the
7 The data for unemployed or unable to work comes from the 2011 Census, and there is no more recent data available at a small area level. The Census is due to be updated next year in 2016, and so these figures can then be updated and better reflect the upturn in the economy since 2011.
highest levels of unemployment, are found in the Arran Quay and Merchants Quay areas. This method of targeting takes into account ability to pay for energy and energy efficiency ratings. When cost is also taken into consideration, 25 of the 70 small areas have energy costs greater than €1,600 per year, and three areas have energy costs over €2,000 per year. This means the areas at risk can be further broken down to target those most in need first, and the top ten areas most at risk based on energy efficiency of dwellings, ability to pay for energy and estimated costs of energy per dwelling, can be seen in Table 28. There are 865 households in these most at risk areas in total, and it is recommended that further analysis is carried out on these households in order to find the best-fit solution to reducing the energy demand and energy costs to these households, and include this housing in future energy efficiency retrofit schemes.
Total Residential Sector Energy Demand The total annual energy demand, total annual electricity demand and total annual fossil fuel demand of the residential sector are shown in Figure 11, Figure 12, and Figure 13. The total energy demand map shows the areas in Dublin City most responsible for the energy use of the residential sector. These areas should be targeted for energy efficiency awareness campaigns and education on renewable energy solutions for households. The energy demand is also broken down into electricity demand and fossil fuel
demand to show areas which can be targeted for different renewable energy solutions. Areas with high electricity usage can be prioritised for rooftop PV installations, or in some suitable cases micro-hydro or micro-wind power, to offset some of their electricity usage. Households with electrical heating systems such as storage heating should
consider replacing old systems with new, high efficiency smart electricity storage systems or
8 See appendix for map outlining location of and small area breakdown in each Electoral District.
Electoral District
Small Area Code
Number of Households BER
Annual Energy Cost per
Household (€)
% Unemployed or Unable to
WorkKilmore B 268089008 69 E1 1839 37Finglas North A 268063007 62 E1 1905 31Decies 268057007 109 E1 1797 31Kilmainham A 268083003 102 E1 1792 31Ashtown B 268007012 69 E1 2084 49Ballybough B 268010005 101 E2 1856 31Cabra West A 268033003 97 F 2074 30Arran Quay B 268002008 58 E1 2034 44Ballybough B 268010006 103 E1 1848 41Cabra East B 268031012 95 F 1957 33
Table 2: Top Ten Areas Most at Risk of Energy Poverty
Dublin City Spatial Energy Demand Analysis
27
where practical, replacing with a wet system which can incorporate heat pumps, solar thermal and geothermal heat sources. Many apartment complexes were fitted with all-electric systems due to low cost and ease of installation. A group scheme with a central high efficiency CHP plant in such complexes can supply electricity and heat to the building and reduce overall fuel usage and costs. The biggest problem with many apartments, bed-sits and flats in the city is they are rented, and the tenants cannot make the big changes required to reduce their energy costs, and there are no incentives for landlords to upgrade the energy efficiency of their properties, especially in the current market where there is a lack of rental properties available. Areas with high fossil fuel usage cause the highest amount of local air pollution, particularly those which burn solid fuels such as coal and peat. From census data, the highest percentage share of coal or peat used as a main heating fuel in any small area is around 9%, which is relatively low in comparison to rural areas which do not have access to the gas grid. Open fires and stoves are often used in dwellings as secondary heat sources and so it is likely the number of dwellings which use solid fuels is underestimated when looking at main heating fuel only. With the local pollution and CO2 emissions caused by burning coal and peat, and the very low efficiencies of open fires (around 20%), it is important to ensure households switch to sustainable and cleaner forms of fuel such as wood, wood chips and wood pellets, and install highly efficient stoves in place of open fires. It is relatively cheap to install a wood fuel stove, and this not only reduces negative effects on the environment and health, but also saves money due to much higher efficiencies of up to 90%. The majority of the fossil fuel used in dwellings in Dublin City is natural gas and, in a smaller share, home heating oil. Areas which have high levels of
oil and gas used for hot water and space heating requirements should be encouraged to find renewable or sustainable alternatives. For individual building based systems, there are many proven and well established technologies which can greatly reduce a household’s reliance on fossil fuels; these include air, water and ground source heat pumps, solar thermal panels, heat recovery ventilation systems, and biomass-fuelled boilers or stoves. These solutions should be supported and included in home energy improvement grant schemes. For suitability of areas and households for each renewable energy solution, see section on renewable resources, p.55. District heating is a shared heating system with a central heating plant which feeds heat to each household on the system. As discussed in the introduction to this chapter, DH should be prioritised in areas of sufficiently high heat density. DH systems are likely to be more economically feasible if there are large commercial or industrial customers also on the system, due to high heat demand over long periods year round, but there are also many successful stand-alone residential schemes in operation. There are 91 small areas identified in this study with very high residential heat demand density of over 500TJ/km2, and many of these areas overlap with areas at risk of energy poverty. It may be more economically advantageous for groups of housing with heating systems which need to be replaced and in areas of high heat demand density to consider a cooperative DH scheme. DH can be expensive to retrofit due to ground works required for pipelines, and so DH is particularly suited to new housing developments or housing close to existing or planned DH schemes. DH feasibility will be further analysed later in this section when commercial and industrial energy use is combined with residential energy and the resulting total heat density is mapped.
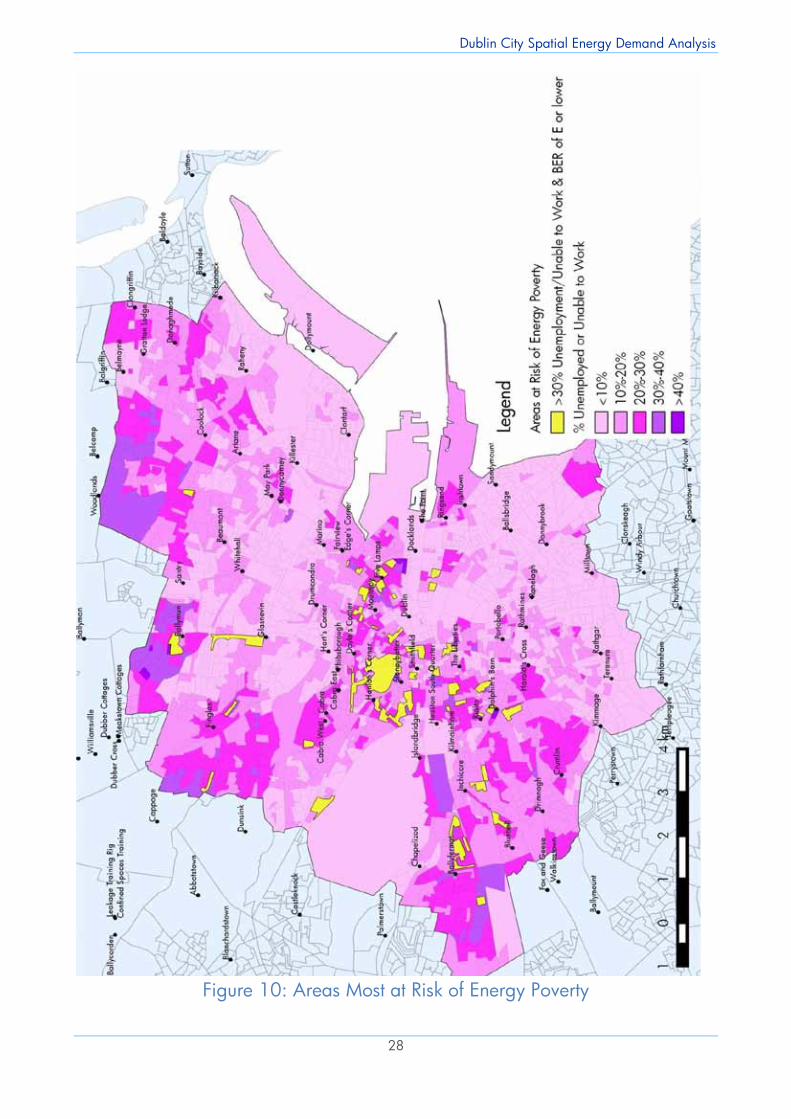
Dublin City Spatial Energy Demand Analysis
28
Figure 10: Areas Most at Risk of Energy Poverty
Dublin City Spatial Energy Demand Analysis
29
Figure 11: Total Annual Residential Energy Demand (MWh)
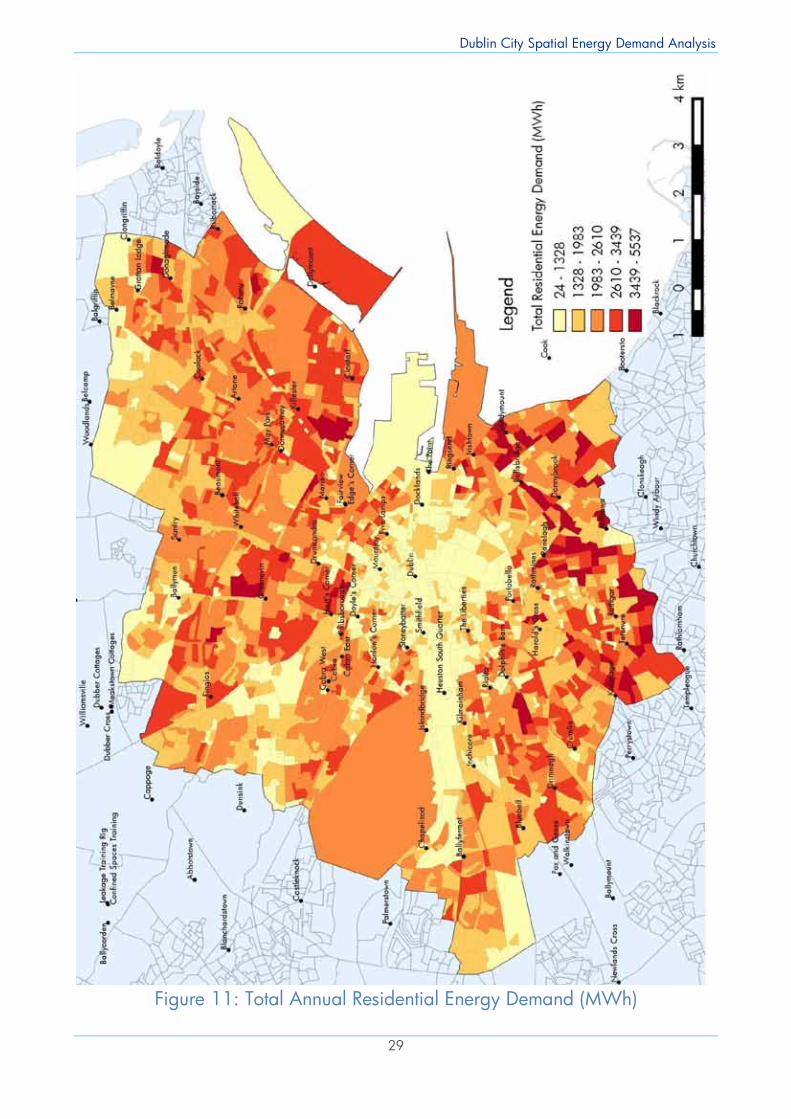
Dublin City Spatial Energy Demand Analysis
28
Figure 10: Areas Most at Risk of Energy Poverty
Dublin City Spatial Energy Demand Analysis
29
Figure 11: Total Annual Residential Energy Demand (MWh)
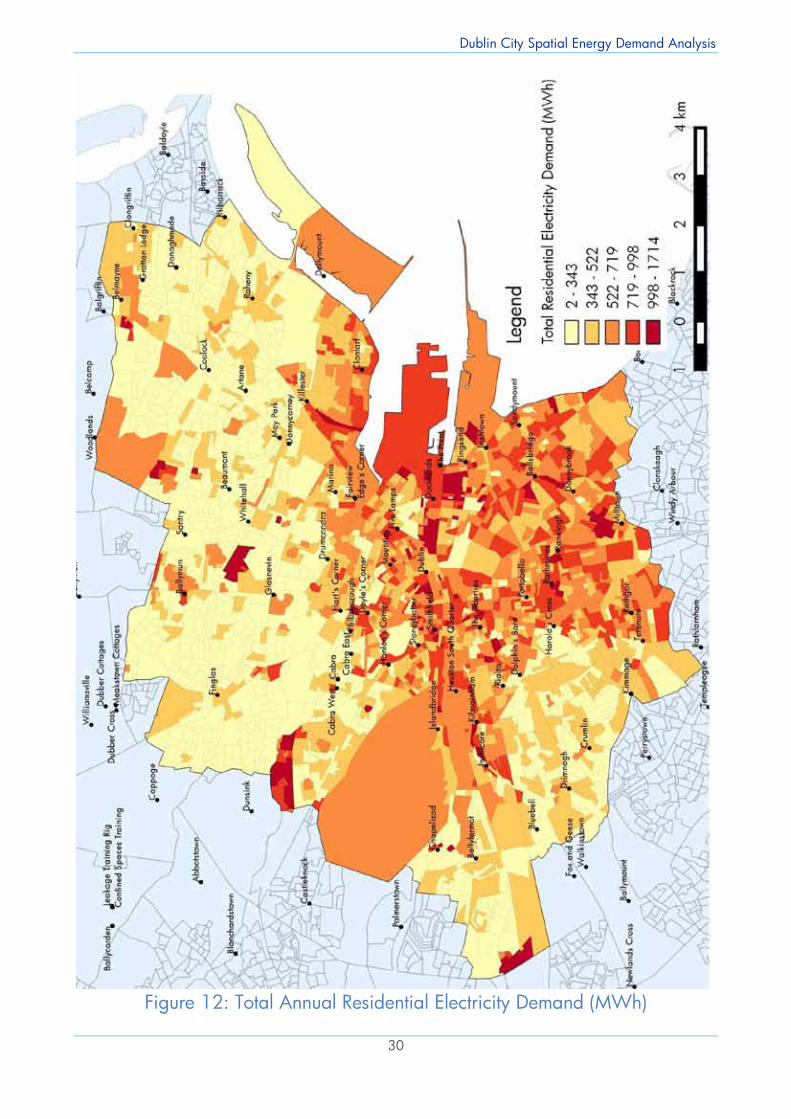
Dublin City Spatial Energy Demand Analysis
30
Figure 12: Total Annual Residential Electricity Demand (MWh)
Dublin City Spatial Energy Demand Analysis
31
Figure 13: Total Annual Residential Fossil Fuel Demand (MWh)
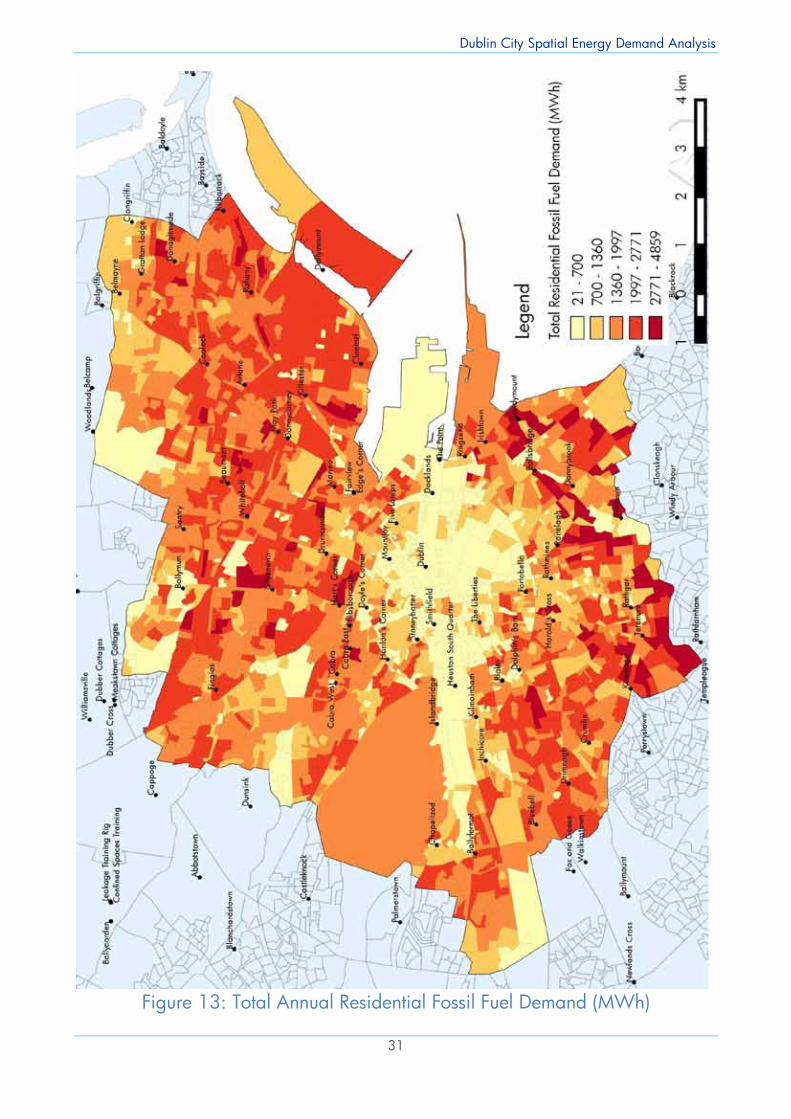
Dublin City Spatial Energy Demand Analysis
30
Figure 12: Total Annual Residential Electricity Demand (MWh)
Dublin City Spatial Energy Demand Analysis
31
Figure 13: Total Annual Residential Fossil Fuel Demand (MWh)

Dublin City Spatial Energy Demand Analysis
32
Dublin City Spatial Energy Demand Analysis
33
Commercial Sector Energy
Methodology
The commercial sector in Dublin City (which includes services, manufacturing and industrial activities) has very little real metered energy data publicly available for research, and it is therefore difficult to estimate the energy demand in every building in the city used for such activities. The most well established source of energy data for the commercial sector comes from the UK’s Chartered Institution of Building Services Engineers’ (CIBSE) technical documents. This data is widely used in Ireland for modelling commercial sector energy consumption, and is used for the comparison benchmarking in Display Energy Certificates (DEC) in Ireland. CIBSE provides energy benchmarks which are divided into annual electricity use per meter squared floor area and annual fossil fuel use per meter squared floor area for numerous service and industrial activity types. The benchmarks used in this study come from CIBSE Guide F: Energy Efficiency in Buildings 2012, and CIBSE Energy Benchmarks TM46: 2008 (CIBSE, 2012) (CIBSE, 2008). To match these benchmarks to each commercial activity in Dublin City, the Valuation Office (VO) provided a list of 21,3529 commercial properties within the city boundaries, which included the business activity type, i.e. pub, hairdresser, office, etc., the floor area, and the latitude and longitude coordinates of each listing. This allowed an estimate of energy use for each commercial building based on CIBSE benchmarks applied using floor area and business type, and each building can be mapped and linked to a small area polygon. Some properties listed by the VO contained errors in coordinates and were missing essential data, and after these had been filtered and discarded, the 19,627 properties remaining have been analysed and mapped. The floor area measurement used by the VO for different building uses, found in the VO’s Code of Measuring Practice for Rating Purposes 2009, often differs to the floor areas used to measure energy use in the CIBSE guides. In these cases, a 9 It is important to note that it is not guaranteed that this is an exhaustive list of businesses and there may be some businesses unaccounted for.
correction factor has been applied where applicable, for example to convert gross floor area to sales floor area, etc. Estimating the costs of energy associated with commercial energy use is difficult as the CIBSE energy benchmarks only breakdown the energy use into electricity and fossil fuel consumption. The only available source of information on fossil fuel types used in this sector is from national level studies, which give a breakdown of fuels used in the industrial and services sectors, and so this is used to give an estimate of fossil fuel types consumed. Using this data will have the unwanted effect of pricing more energy use according to oil prices rather than gas prices, as there will be higher use of gas in the Dublin City area compared to national usage due to the penetration of the gas grid in Dublin. Therefore, costs allocated to fossil fuel uses are likely to be slightly overestimated for this sector. The costs used are from the latest SEAI ‘Commercial/Industrial Fuels: Comparison of Energy Costs’, which includes all taxes and standing charges, and costs are allocated to each building taking account of the price bands used in gas and electricity pricing.
Results The map shown in Figure 16 (p.35) shows the location and energy use of each commercial property in Dublin City. Each location has been mapped individually to show exactly where in each small area the business is located, and shows clusters which may overlap into other small areas. Each location is marked with a coloured circle, with colour representing annual energy usage in MWh, the orange and red circles having higher than average energy use. There are so many commercial properties densely packed into the city centre area that the points overlap one another on this mapping scale. A zoomed-in section of the city centre area can be seen in Figure 15 (next page), and the individual business locations can be identified. Most are located along main commuter routes and pedestrianised shopping areas. The majority of commercial activities in and around the city centre have similar energy usage, in the range 0-380 MWh/year. The highest energy users within the city centre are hotels, large office complexes, theatres, and large department stores, as seen in Figure 14 (p.35). There are many areas of highly
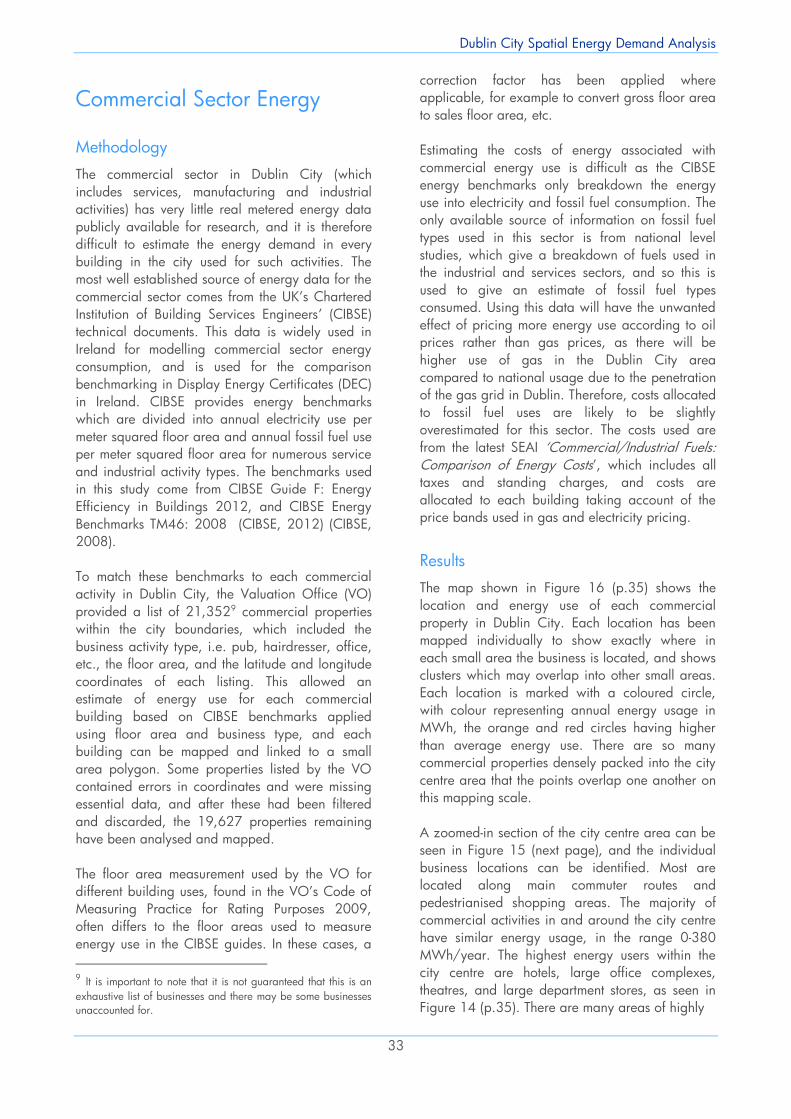
Dublin City Spatial Energy Demand Analysis
32
Dublin City Spatial Energy Demand Analysis
33
Commercial Sector Energy
Methodology
The commercial sector in Dublin City (which includes services, manufacturing and industrial activities) has very little real metered energy data publicly available for research, and it is therefore difficult to estimate the energy demand in every building in the city used for such activities. The most well established source of energy data for the commercial sector comes from the UK’s Chartered Institution of Building Services Engineers’ (CIBSE) technical documents. This data is widely used in Ireland for modelling commercial sector energy consumption, and is used for the comparison benchmarking in Display Energy Certificates (DEC) in Ireland. CIBSE provides energy benchmarks which are divided into annual electricity use per meter squared floor area and annual fossil fuel use per meter squared floor area for numerous service and industrial activity types. The benchmarks used in this study come from CIBSE Guide F: Energy Efficiency in Buildings 2012, and CIBSE Energy Benchmarks TM46: 2008 (CIBSE, 2012) (CIBSE, 2008). To match these benchmarks to each commercial activity in Dublin City, the Valuation Office (VO) provided a list of 21,3529 commercial properties within the city boundaries, which included the business activity type, i.e. pub, hairdresser, office, etc., the floor area, and the latitude and longitude coordinates of each listing. This allowed an estimate of energy use for each commercial building based on CIBSE benchmarks applied using floor area and business type, and each building can be mapped and linked to a small area polygon. Some properties listed by the VO contained errors in coordinates and were missing essential data, and after these had been filtered and discarded, the 19,627 properties remaining have been analysed and mapped. The floor area measurement used by the VO for different building uses, found in the VO’s Code of Measuring Practice for Rating Purposes 2009, often differs to the floor areas used to measure energy use in the CIBSE guides. In these cases, a 9 It is important to note that it is not guaranteed that this is an exhaustive list of businesses and there may be some businesses unaccounted for.
correction factor has been applied where applicable, for example to convert gross floor area to sales floor area, etc. Estimating the costs of energy associated with commercial energy use is difficult as the CIBSE energy benchmarks only breakdown the energy use into electricity and fossil fuel consumption. The only available source of information on fossil fuel types used in this sector is from national level studies, which give a breakdown of fuels used in the industrial and services sectors, and so this is used to give an estimate of fossil fuel types consumed. Using this data will have the unwanted effect of pricing more energy use according to oil prices rather than gas prices, as there will be higher use of gas in the Dublin City area compared to national usage due to the penetration of the gas grid in Dublin. Therefore, costs allocated to fossil fuel uses are likely to be slightly overestimated for this sector. The costs used are from the latest SEAI ‘Commercial/Industrial Fuels: Comparison of Energy Costs’, which includes all taxes and standing charges, and costs are allocated to each building taking account of the price bands used in gas and electricity pricing.
Results The map shown in Figure 16 (p.35) shows the location and energy use of each commercial property in Dublin City. Each location has been mapped individually to show exactly where in each small area the business is located, and shows clusters which may overlap into other small areas. Each location is marked with a coloured circle, with colour representing annual energy usage in MWh, the orange and red circles having higher than average energy use. There are so many commercial properties densely packed into the city centre area that the points overlap one another on this mapping scale. A zoomed-in section of the city centre area can be seen in Figure 15 (next page), and the individual business locations can be identified. Most are located along main commuter routes and pedestrianised shopping areas. The majority of commercial activities in and around the city centre have similar energy usage, in the range 0-380 MWh/year. The highest energy users within the city centre are hotels, large office complexes, theatres, and large department stores, as seen in Figure 14 (p.35). There are many areas of highly
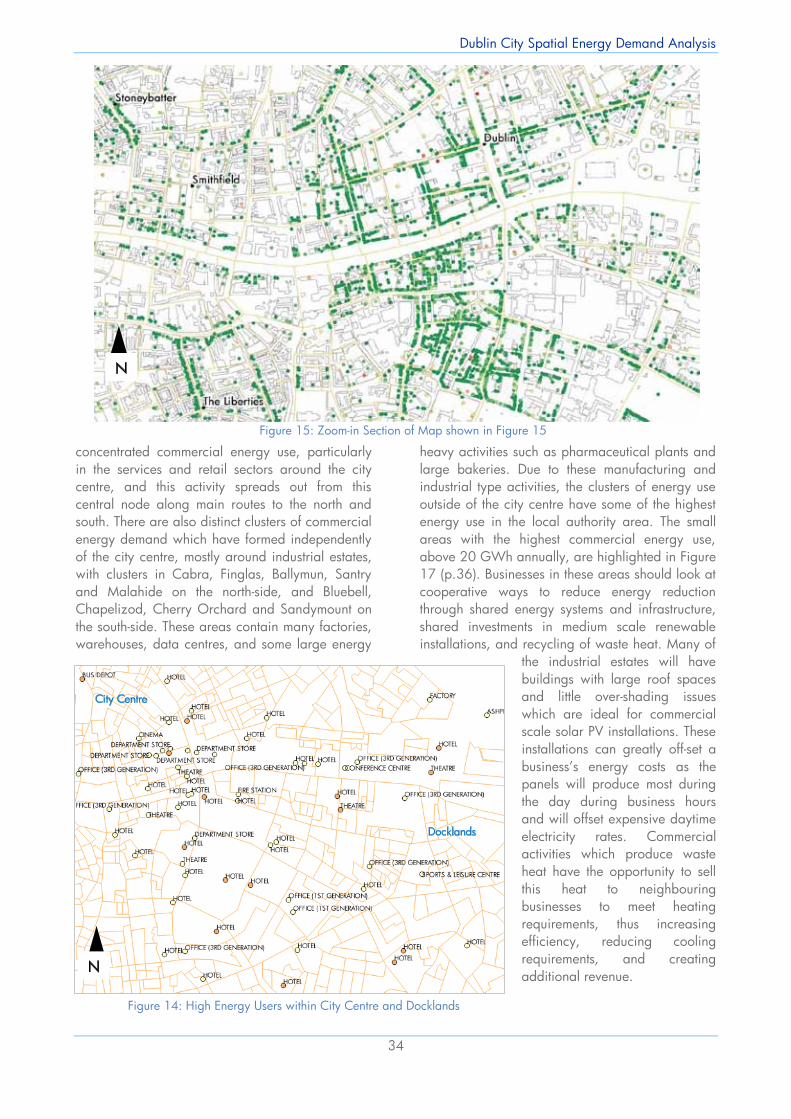
Dublin City Spatial Energy Demand Analysis
34
concentrated commercial energy use, particularly in the services and retail sectors around the city centre, and this activity spreads out from this central node along main routes to the north and south. There are also distinct clusters of commercial energy demand which have formed independently of the city centre, mostly around industrial estates, with clusters in Cabra, Finglas, Ballymun, Santry and Malahide on the north-side, and Bluebell, Chapelizod, Cherry Orchard and Sandymount on the south-side. These areas contain many factories, warehouses, data centres, and some large energy
heavy activities such as pharmaceutical plants and large bakeries. Due to these manufacturing and industrial type activities, the clusters of energy use outside of the city centre have some of the highest energy use in the local authority area. The small areas with the highest commercial energy use, above 20 GWh annually, are highlighted in Figure 17 (p.36). Businesses in these areas should look at cooperative ways to reduce energy reduction through shared energy systems and infrastructure, shared investments in medium scale renewable installations, and recycling of waste heat. Many of
the industrial estates will have buildings with large roof spaces and little over-shading issues which are ideal for commercial scale solar PV installations. These installations can greatly off-set a business’s energy costs as the panels will produce most during the day during business hours and will offset expensive daytime electricity rates. Commercial activities which produce waste heat have the opportunity to sell this heat to neighbouring businesses to meet heating requirements, thus increasing efficiency, reducing cooling requirements, and creating additional revenue. N
N
Figure 15: Zoom-in Section of Map shown in Figure 15
Figure 14: High Energy Users within City Centre and Docklands
Docklands
City Centre
N
Dublin City Spatial Energy Demand Analysis
35
Figure 16: Annual Energy Use (MWh) and Location of Each Commercial
Premises Analysed
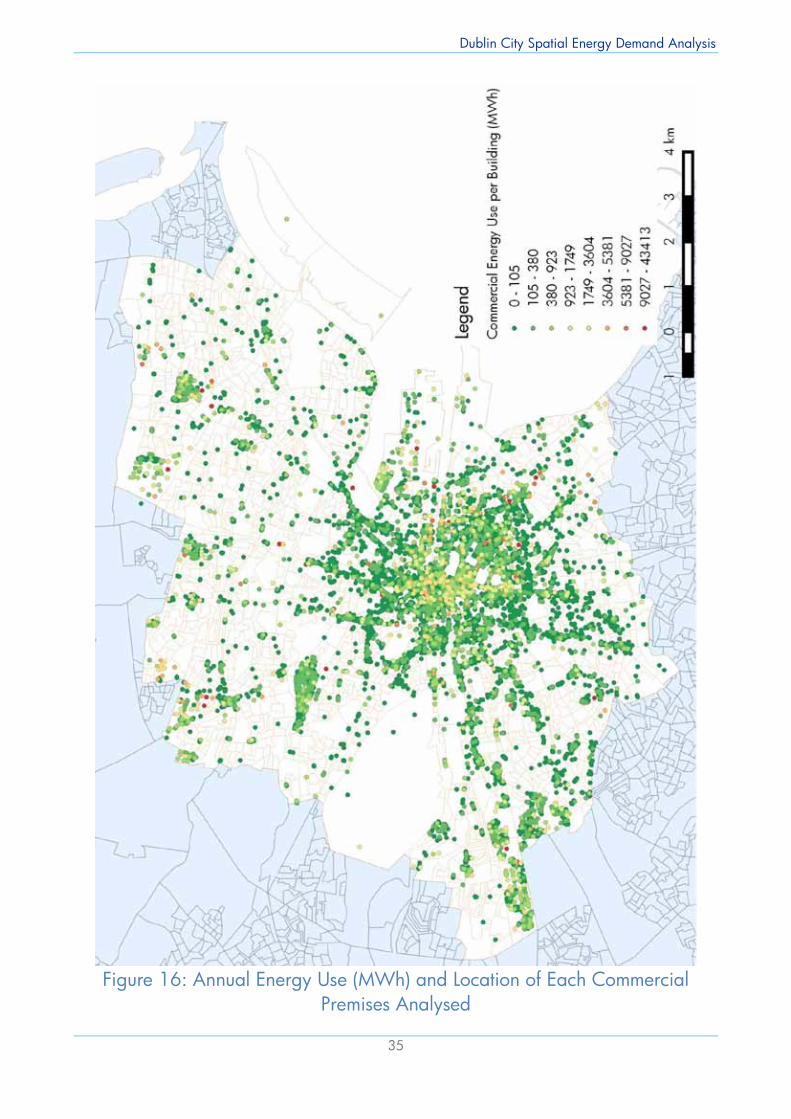
Dublin City Spatial Energy Demand Analysis
34
concentrated commercial energy use, particularly in the services and retail sectors around the city centre, and this activity spreads out from this central node along main routes to the north and south. There are also distinct clusters of commercial energy demand which have formed independently of the city centre, mostly around industrial estates, with clusters in Cabra, Finglas, Ballymun, Santry and Malahide on the north-side, and Bluebell, Chapelizod, Cherry Orchard and Sandymount on the south-side. These areas contain many factories, warehouses, data centres, and some large energy
heavy activities such as pharmaceutical plants and large bakeries. Due to these manufacturing and industrial type activities, the clusters of energy use outside of the city centre have some of the highest energy use in the local authority area. The small areas with the highest commercial energy use, above 20 GWh annually, are highlighted in Figure 17 (p.36). Businesses in these areas should look at cooperative ways to reduce energy reduction through shared energy systems and infrastructure, shared investments in medium scale renewable installations, and recycling of waste heat. Many of
the industrial estates will have buildings with large roof spaces and little over-shading issues which are ideal for commercial scale solar PV installations. These installations can greatly off-set a business’s energy costs as the panels will produce most during the day during business hours and will offset expensive daytime electricity rates. Commercial activities which produce waste heat have the opportunity to sell this heat to neighbouring businesses to meet heating requirements, thus increasing efficiency, reducing cooling requirements, and creating additional revenue. N
N
Figure 15: Zoom-in Section of Map shown in Figure 15
Figure 14: High Energy Users within City Centre and Docklands
Docklands
City Centre
N
Dublin City Spatial Energy Demand Analysis
35
Figure 16: Annual Energy Use (MWh) and Location of Each Commercial
Premises Analysed
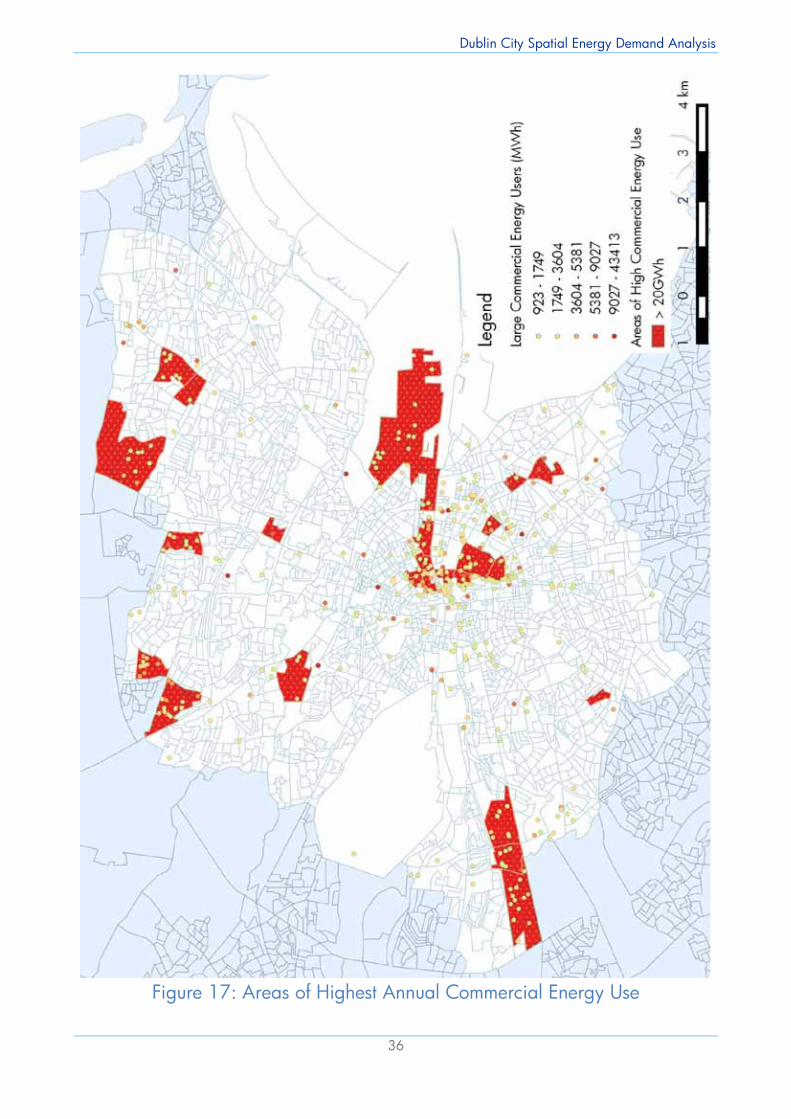
Dublin City Spatial Energy Demand Analysis
36
Figure 17: Areas of Highest Annual Commercial Energy Use
Dublin City Spatial Energy Demand Analysis
37
Total Commercial Sector Energy Demand The map in Figure 19 (next page) shows the total annual commercial energy usage in each small area. The areas highlighted which have high energy demands largely overlap with the clusters of commercial businesses seen in Figure 16, but there are some which have high energy demand due to one or two very large energy users within that small area. For example, the area in dark orange in the Kimmage area holds a large pharmaceutical facility, amongst other smaller warehouses and workshops within an industrial estate. The small area in dark orange near Whitehall has a large hospital which is an energy intensive industry and pushes up the commercial energy use in this area. Most other areas of medium to high energy demand are found around the city centre area where there is a high density of smaller energy users. The North Docks area has the highest energy demand of any area in Dublin City. The area holds 182 businesses and the demand amounts to over 116GWh annually for commercial activities alone.
Many of these activities are linked to the port, with many oil and fuel depots, cold stores, factories and terminals located in this area. This small area stretches down to the newly developed Spencer Dock area, and includes the Conference Centre Dublin, the 3Arena, hotels, and many offices. Due to the coastal location and large roof spaces, this area has many advantages for the integration of renewable resources. Many port and harbour areas in other cities have integrated on-shore and
off-shore wind power to take advantage of coastal wind speeds, such as Port Corpus Christi in Texas which has six 1.5 MW turbines installed on industrial port property, and closer to home, the wind power installed in Cork Harbour by the large pharmaceutical companies based there. The port also makes this area an ideal location for the import of biofuels, either by sea, road or rail, as the port already has the infrastructure in place to deal with large deliveries. Many of the large warehouse and stores will have suitable roof spaces for solar PV integration. There is a real opportunity for the businesses based here to create an energy group and work together to reduce their energy use and costs, and at the same time help Dublin to become a more sustainable city. The heat demand density of the commercial sector is shown in Figure 20 (p.39), and for comparison, the heat demand is also shown in Figure 21. The highest heat demands largely overlap with the areas of high energy demand. As discussed previously, heat density is used to measure suitability for DH schemes. The commercial sector
is particularly suitable for DH as it will typically have longer hours of demand than the residential sector, meaning a higher load factor for the centralised heating plant. Buildings with a steady 24 hour load, particularly public sector buildings like hospitals are best economically and are sometimes referred to as anchor loads. The density of the demand is important
as the shorter the pipe runs, the less losses and costs are involved. With this in mind, it can be seen that the areas with the highest heat demands are not always the areas with the highest heat density. Some of the areas highlighted with high heat demands are spread out over a larger area, with industrial estates and business parks having a much larger land area than commercial activities closer to the city centre. Also, these areas can be somewhat isolated from other
Figure 18: North Docks Area with Highest Energy Demand in Commercial Sector
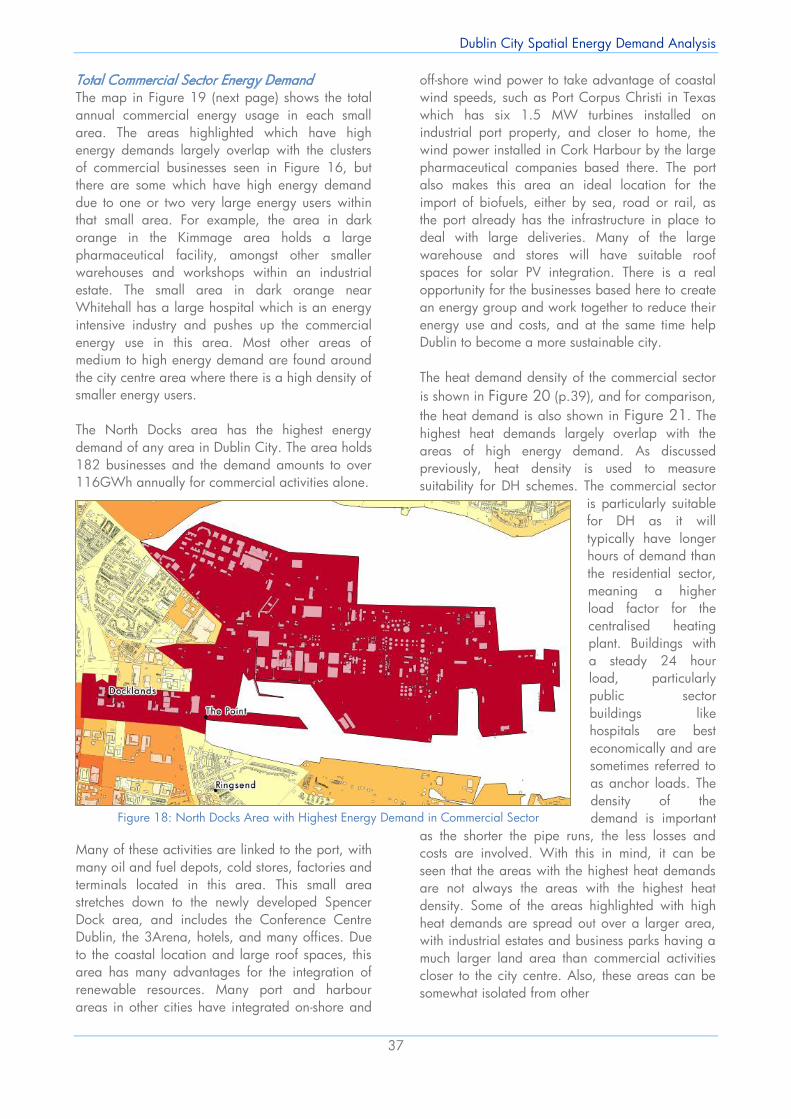
Dublin City Spatial Energy Demand Analysis
36
Figure 17: Areas of Highest Annual Commercial Energy Use
Dublin City Spatial Energy Demand Analysis
37
Total Commercial Sector Energy Demand The map in Figure 19 (next page) shows the total annual commercial energy usage in each small area. The areas highlighted which have high energy demands largely overlap with the clusters of commercial businesses seen in Figure 16, but there are some which have high energy demand due to one or two very large energy users within that small area. For example, the area in dark orange in the Kimmage area holds a large pharmaceutical facility, amongst other smaller warehouses and workshops within an industrial estate. The small area in dark orange near Whitehall has a large hospital which is an energy intensive industry and pushes up the commercial energy use in this area. Most other areas of medium to high energy demand are found around the city centre area where there is a high density of smaller energy users. The North Docks area has the highest energy demand of any area in Dublin City. The area holds 182 businesses and the demand amounts to over 116GWh annually for commercial activities alone.
Many of these activities are linked to the port, with many oil and fuel depots, cold stores, factories and terminals located in this area. This small area stretches down to the newly developed Spencer Dock area, and includes the Conference Centre Dublin, the 3Arena, hotels, and many offices. Due to the coastal location and large roof spaces, this area has many advantages for the integration of renewable resources. Many port and harbour areas in other cities have integrated on-shore and
off-shore wind power to take advantage of coastal wind speeds, such as Port Corpus Christi in Texas which has six 1.5 MW turbines installed on industrial port property, and closer to home, the wind power installed in Cork Harbour by the large pharmaceutical companies based there. The port also makes this area an ideal location for the import of biofuels, either by sea, road or rail, as the port already has the infrastructure in place to deal with large deliveries. Many of the large warehouse and stores will have suitable roof spaces for solar PV integration. There is a real opportunity for the businesses based here to create an energy group and work together to reduce their energy use and costs, and at the same time help Dublin to become a more sustainable city. The heat demand density of the commercial sector is shown in Figure 20 (p.39), and for comparison, the heat demand is also shown in Figure 21. The highest heat demands largely overlap with the areas of high energy demand. As discussed previously, heat density is used to measure suitability for DH schemes. The commercial sector
is particularly suitable for DH as it will typically have longer hours of demand than the residential sector, meaning a higher load factor for the centralised heating plant. Buildings with a steady 24 hour load, particularly public sector buildings like hospitals are best economically and are sometimes referred to as anchor loads. The density of the demand is important
as the shorter the pipe runs, the less losses and costs are involved. With this in mind, it can be seen that the areas with the highest heat demands are not always the areas with the highest heat density. Some of the areas highlighted with high heat demands are spread out over a larger area, with industrial estates and business parks having a much larger land area than commercial activities closer to the city centre. Also, these areas can be somewhat isolated from other
Figure 18: North Docks Area with Highest Energy Demand in Commercial Sector
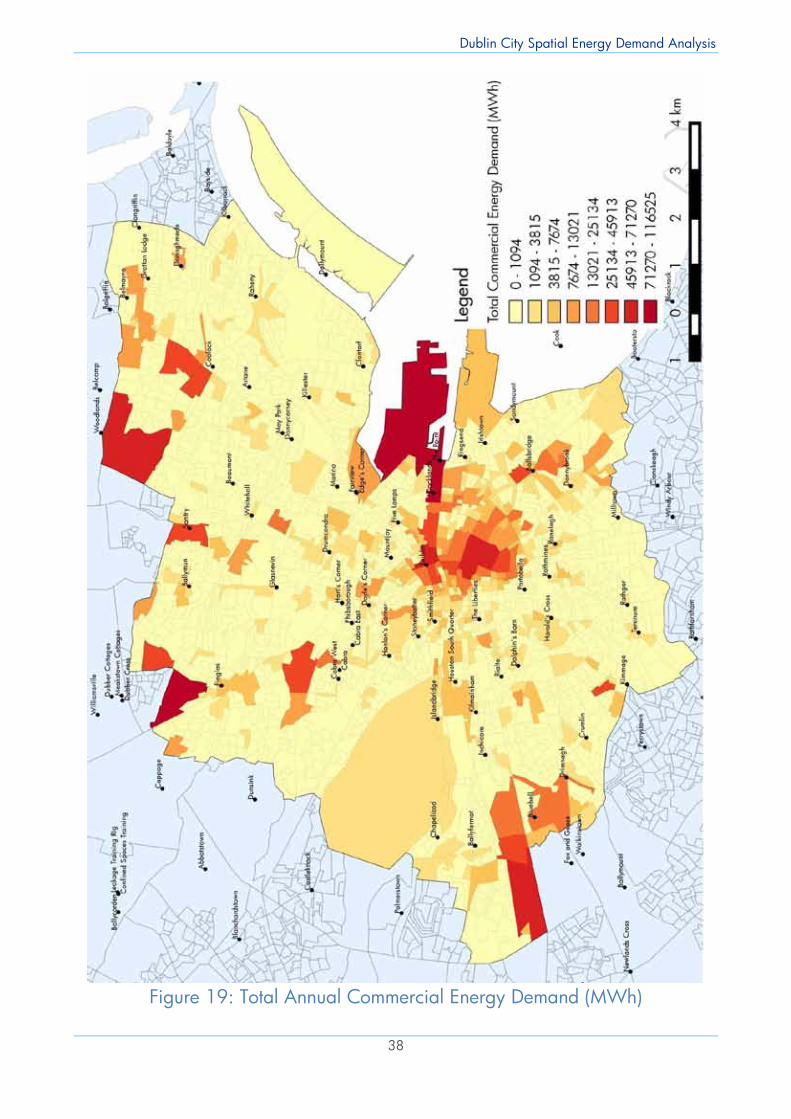
Dublin City Spatial Energy Demand Analysis
38
Figure 19: Total Annual Commercial Energy Demand (MWh)
Dublin City Spatial Energy Demand Analysis
39
Figure 20: Commercial Sector Heat Demand Density (TJ/km2)
Figure 21: Total Annual Commercial Heat Demand (MWh)
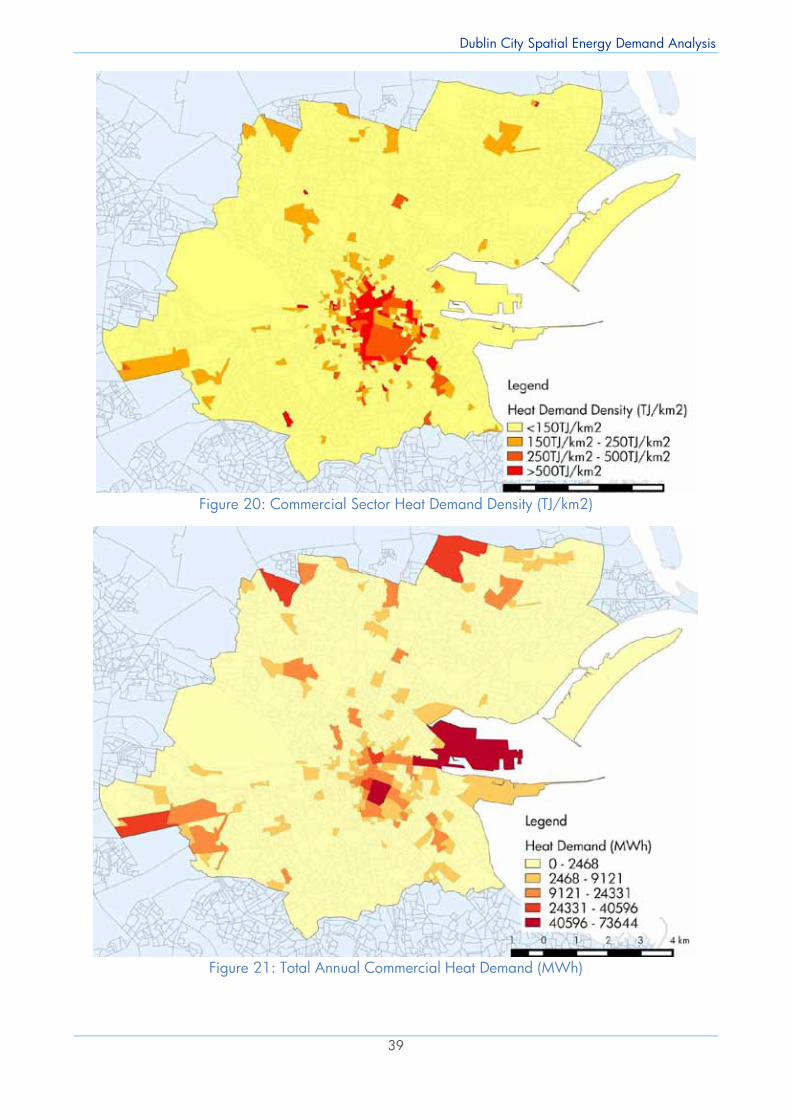
Dublin City Spatial Energy Demand Analysis
38
Figure 19: Total Annual Commercial Energy Demand (MWh)
Dublin City Spatial Energy Demand Analysis
39
Figure 20: Commercial Sector Heat Demand Density (TJ/km2)
Figure 21: Total Annual Commercial Heat Demand (MWh)
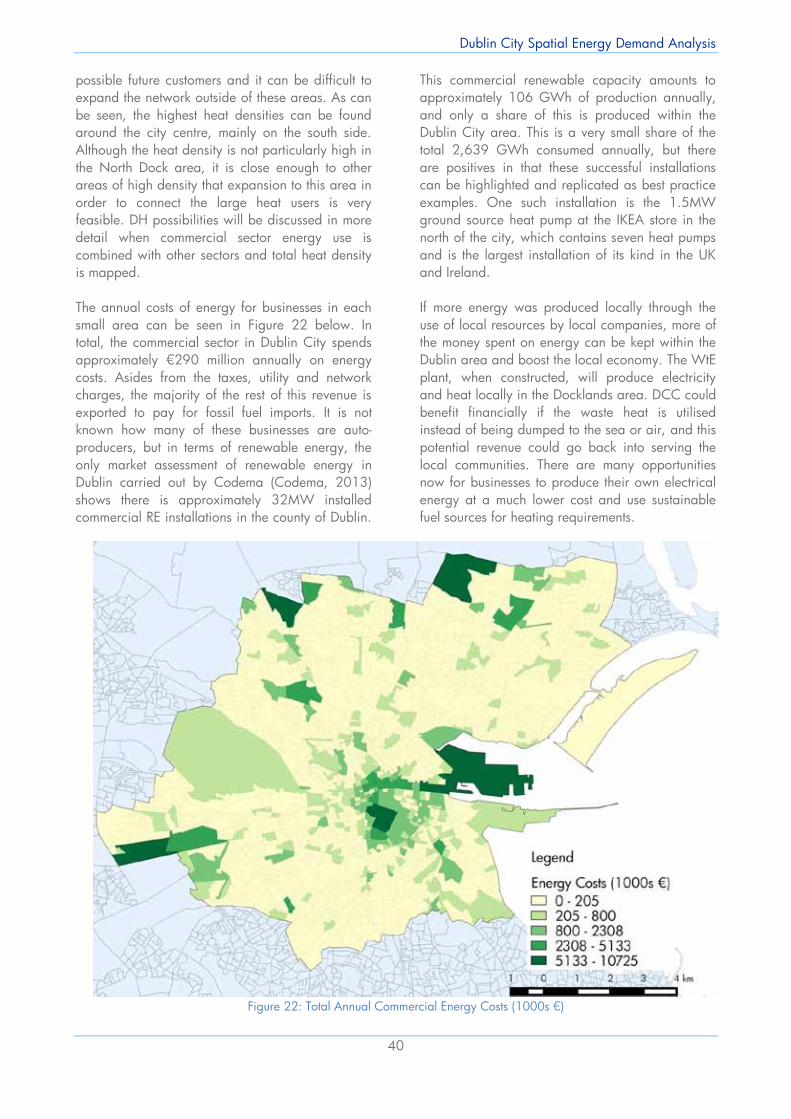
Dublin City Spatial Energy Demand Analysis
40
possible future customers and it can be difficult to expand the network outside of these areas. As can be seen, the highest heat densities can be found around the city centre, mainly on the south side. Although the heat density is not particularly high in the North Dock area, it is close enough to other areas of high density that expansion to this area in order to connect the large heat users is very feasible. DH possibilities will be discussed in more detail when commercial sector energy use is combined with other sectors and total heat density is mapped. The annual costs of energy for businesses in each small area can be seen in Figure 22 below. In total, the commercial sector in Dublin City spends approximately €290 million annually on energy costs. Asides from the taxes, utility and network charges, the majority of the rest of this revenue is exported to pay for fossil fuel imports. It is not known how many of these businesses are auto-producers, but in terms of renewable energy, the only market assessment of renewable energy in Dublin carried out by Codema (Codema, 2013) shows there is approximately 32MW installed commercial RE installations in the county of Dublin.
This commercial renewable capacity amounts to approximately 106 GWh of production annually, and only a share of this is produced within the Dublin City area. This is a very small share of the total 2,639 GWh consumed annually, but there are positives in that these successful installations can be highlighted and replicated as best practice examples. One such installation is the 1.5MW ground source heat pump at the IKEA store in the north of the city, which contains seven heat pumps and is the largest installation of its kind in the UK and Ireland. If more energy was produced locally through the use of local resources by local companies, more of the money spent on energy can be kept within the Dublin area and boost the local economy. The WtE plant, when constructed, will produce electricity and heat locally in the Docklands area. DCC could benefit financially if the waste heat is utilised instead of being dumped to the sea or air, and this potential revenue could go back into serving the local communities. There are many opportunities now for businesses to produce their own electrical energy at a much lower cost and use sustainable fuel sources for heating requirements.
Figure 22: Total Annual Commercial Energy Costs (1000s €)
Dublin City Spatial Energy Demand Analysis
41
Municipal Sector Energy Dublin City Council is responsible for the energy use in a number of buildings within the city which provide services to the local authority area. There are over 1,000 known building-based energy accounts where DCC is responsible for the energy used, with some sites mapped having more than one utility account for several buildings on that site. Some of these sites are located outside of the Dublin City boundaries; these are mostly for provision of water and fire fighter services. The building addresses10 were geocoded to attach to the energy data gathered for each small area. The energy use is metered energy and as such is actual rather than estimated energy use. Figure 24 (p.43) shows all of the DCC energy account locations and energy use mapped. The main cluster of DCC energy use is around the city centre area, and some of the biggest users in this cluster are shown in the zoomed-in map section below. Large energy users such as the DCC Civic Offices on Wood Quay, a public leisure centre and fire station headquarters can be seen in the centre of the city. The biggest energy consuming
10 Approximately 75 of these account addresses could not be geo-coded and therefore could not be mapped. Although every effort has been made to obtain accuracy those which have been geo-coded may not be at the exact location of the building but within the same general area.
building by far is the Civic Offices, which consumes over 6 GWh annually, with two-thirds of this energy being electricity usage. Although this is high energy usage, there have been many projects carried out in the Civic Offices aimed at reducing the power consumption which has led to a 13% decrease in energy use over the period 2013 to 2014. There are plans in place to install an additional large roof-top solar PV array on the Civic Offices building which will help to offset some of the imported electricity currently being used. The other large energy users shown in orange and red in Figure 23 are mainly made up of similar large office buildings, fire stations and leisure centres, with some other buildings such as art museums and elderly homes also having high energy demands. These buildings also have very high energy costs, particularly those with high electricity demands due to the high cost of electricity. Other sites which may not have very high energy use, but the energy use of the site is all electrical energy, also rank highly in terms of energy costs, such as electricity provisions for
halting sites. The small areas within Dublin City with the highest municipal energy demand can be seen in Figure 25. Those highlighted in orange and red are areas with either one large energy user, or an accumulation of different buildings which are located very close to one another, such as areas where a mix of public leisure centres, libraries, community halls, senior citizen housing and Civic
Offices are within close proximity. Implementing good practice in energy management in public buildings and leading the
DCC Civic Offices Markievicz Leisure Centre
Tara St. Fire Brigade HQ
Figure 23: Zoom-in Section Showing Large Energy Users
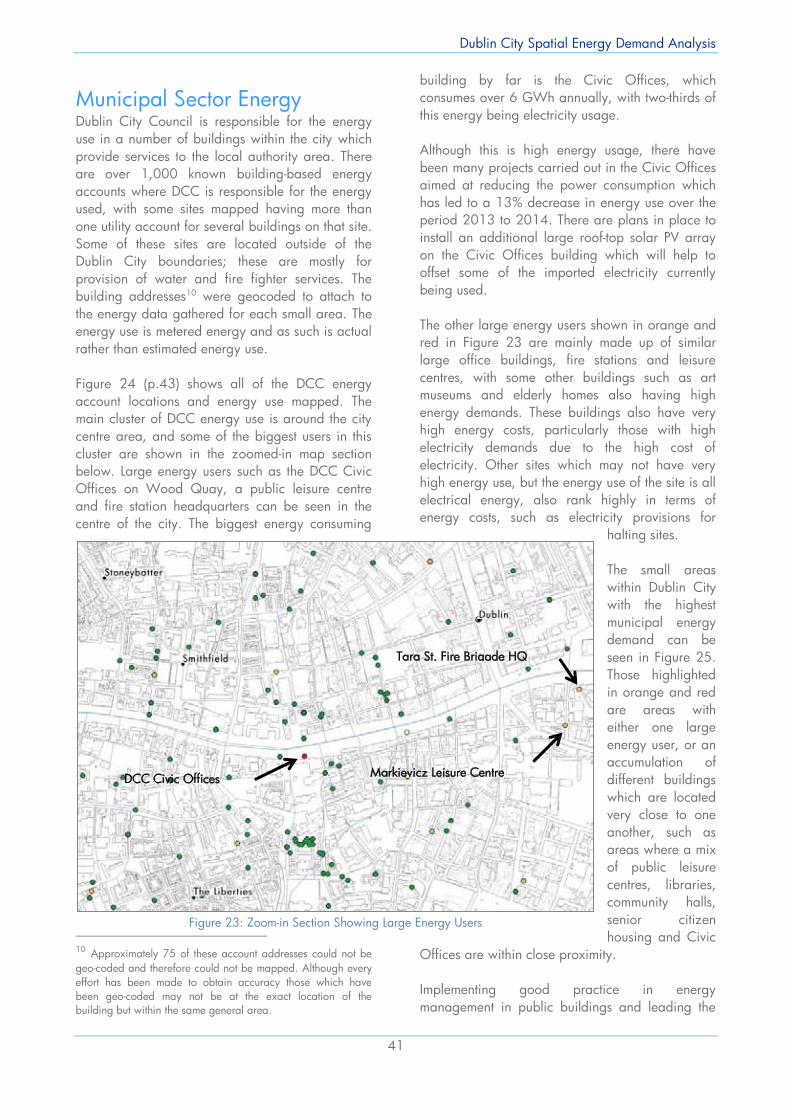
Dublin City Spatial Energy Demand Analysis
40
possible future customers and it can be difficult to expand the network outside of these areas. As can be seen, the highest heat densities can be found around the city centre, mainly on the south side. Although the heat density is not particularly high in the North Dock area, it is close enough to other areas of high density that expansion to this area in order to connect the large heat users is very feasible. DH possibilities will be discussed in more detail when commercial sector energy use is combined with other sectors and total heat density is mapped. The annual costs of energy for businesses in each small area can be seen in Figure 22 below. In total, the commercial sector in Dublin City spends approximately €290 million annually on energy costs. Asides from the taxes, utility and network charges, the majority of the rest of this revenue is exported to pay for fossil fuel imports. It is not known how many of these businesses are auto-producers, but in terms of renewable energy, the only market assessment of renewable energy in Dublin carried out by Codema (Codema, 2013) shows there is approximately 32MW installed commercial RE installations in the county of Dublin.
This commercial renewable capacity amounts to approximately 106 GWh of production annually, and only a share of this is produced within the Dublin City area. This is a very small share of the total 2,639 GWh consumed annually, but there are positives in that these successful installations can be highlighted and replicated as best practice examples. One such installation is the 1.5MW ground source heat pump at the IKEA store in the north of the city, which contains seven heat pumps and is the largest installation of its kind in the UK and Ireland. If more energy was produced locally through the use of local resources by local companies, more of the money spent on energy can be kept within the Dublin area and boost the local economy. The WtE plant, when constructed, will produce electricity and heat locally in the Docklands area. DCC could benefit financially if the waste heat is utilised instead of being dumped to the sea or air, and this potential revenue could go back into serving the local communities. There are many opportunities now for businesses to produce their own electrical energy at a much lower cost and use sustainable fuel sources for heating requirements.
Figure 22: Total Annual Commercial Energy Costs (1000s €)
Dublin City Spatial Energy Demand Analysis
41
Municipal Sector Energy Dublin City Council is responsible for the energy use in a number of buildings within the city which provide services to the local authority area. There are over 1,000 known building-based energy accounts where DCC is responsible for the energy used, with some sites mapped having more than one utility account for several buildings on that site. Some of these sites are located outside of the Dublin City boundaries; these are mostly for provision of water and fire fighter services. The building addresses10 were geocoded to attach to the energy data gathered for each small area. The energy use is metered energy and as such is actual rather than estimated energy use. Figure 24 (p.43) shows all of the DCC energy account locations and energy use mapped. The main cluster of DCC energy use is around the city centre area, and some of the biggest users in this cluster are shown in the zoomed-in map section below. Large energy users such as the DCC Civic Offices on Wood Quay, a public leisure centre and fire station headquarters can be seen in the centre of the city. The biggest energy consuming
10 Approximately 75 of these account addresses could not be geo-coded and therefore could not be mapped. Although every effort has been made to obtain accuracy those which have been geo-coded may not be at the exact location of the building but within the same general area.
building by far is the Civic Offices, which consumes over 6 GWh annually, with two-thirds of this energy being electricity usage. Although this is high energy usage, there have been many projects carried out in the Civic Offices aimed at reducing the power consumption which has led to a 13% decrease in energy use over the period 2013 to 2014. There are plans in place to install an additional large roof-top solar PV array on the Civic Offices building which will help to offset some of the imported electricity currently being used. The other large energy users shown in orange and red in Figure 23 are mainly made up of similar large office buildings, fire stations and leisure centres, with some other buildings such as art museums and elderly homes also having high energy demands. These buildings also have very high energy costs, particularly those with high electricity demands due to the high cost of electricity. Other sites which may not have very high energy use, but the energy use of the site is all electrical energy, also rank highly in terms of energy costs, such as electricity provisions for
halting sites. The small areas within Dublin City with the highest municipal energy demand can be seen in Figure 25. Those highlighted in orange and red are areas with either one large energy user, or an accumulation of different buildings which are located very close to one another, such as areas where a mix of public leisure centres, libraries, community halls, senior citizen housing and Civic
Offices are within close proximity. Implementing good practice in energy management in public buildings and leading the
DCC Civic Offices Markievicz Leisure Centre
Tara St. Fire Brigade HQ
Figure 23: Zoom-in Section Showing Large Energy Users
Dublin City Spatial Energy Demand Analysis
42
way in sustainable energy practices in the public sector is a good way to showcase sustainable solutions as the public will often visit these premises, and also to encourage commercial buildings by leading by example. This is especially important for DCC as it is a very visible and influential presence in the capital city and can help Dublin build an international reputation as a sustainable city. DCC and Codema are currently involved in many projects which focus on energy efficiency and sustainable resources, such as the Solar PV installations which are due to be installed in the last quarter of 2015, which will see a large proportion of the electricity demand in four of Dublin City’s Public Libraries met by RE. These libraries will show the public the power output and savings achieved by the panels. DCC and Codema are also in the process of developing an Energy Performance Contracting (EPC) project which will see three leisure centres have their very large energy demands reduced through the innovative EPC process, which involves guaranteed energy reductions for a share of the energy cost savings. Through the obligatory energy monitoring and reporting process for the public sector in Ireland, DCC has shown to reduce its overall energy consumption by 17% compared to its original energy baseline.
Dublin City Spatial Energy Demand Analysis
43
Figure 24: Municipal Energy Use (MWh) and Locations of Each Account
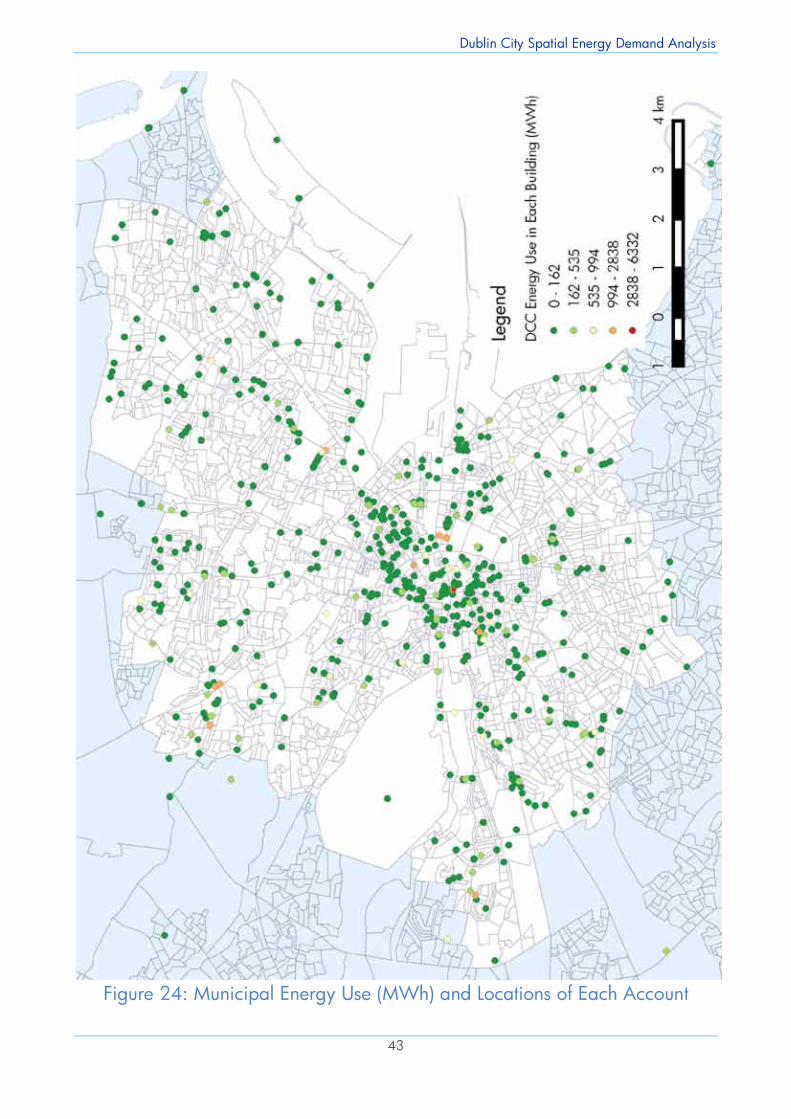
Dublin City Spatial Energy Demand Analysis
42
way in sustainable energy practices in the public sector is a good way to showcase sustainable solutions as the public will often visit these premises, and also to encourage commercial buildings by leading by example. This is especially important for DCC as it is a very visible and influential presence in the capital city and can help Dublin build an international reputation as a sustainable city. DCC and Codema are currently involved in many projects which focus on energy efficiency and sustainable resources, such as the Solar PV installations which are due to be installed in the last quarter of 2015, which will see a large proportion of the electricity demand in four of Dublin City’s Public Libraries met by RE. These libraries will show the public the power output and savings achieved by the panels. DCC and Codema are also in the process of developing an Energy Performance Contracting (EPC) project which will see three leisure centres have their very large energy demands reduced through the innovative EPC process, which involves guaranteed energy reductions for a share of the energy cost savings. Through the obligatory energy monitoring and reporting process for the public sector in Ireland, DCC has shown to reduce its overall energy consumption by 17% compared to its original energy baseline.
Dublin City Spatial Energy Demand Analysis
43
Figure 24: Municipal Energy Use (MWh) and Locations of Each Account
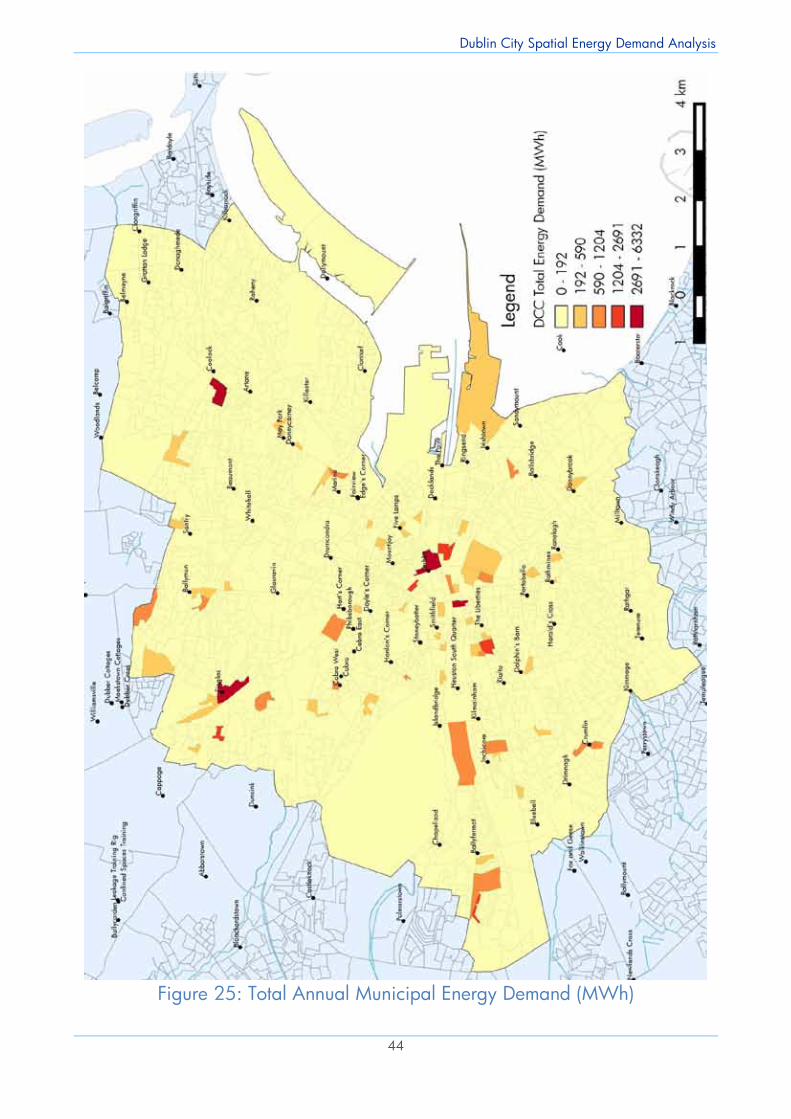
Dublin City Spatial Energy Demand Analysis
44
Figure 25: Total Annual Municipal Energy Demand (MWh)
Dublin City Spatial Energy Demand Analysis
45
Total Energy in all Sectors This section examines the resulting total energy demand in each small area when all residential, commercial and municipal energy demands are totalled for each small area. The total energy use in all buildings analysed in this SEDA is 6.87 TWh annually, and 5.1 TWh of this is used to meet heating demands which is equal to 74% of overall energy use. This is a vast amount of energy being used to heat buildings and for industrial heating processes.
District Heating Potential As discussed in the introduction, heating is fundamentally a local and regional issue and national level energy strategies often do not deal with heating effectively. As there is no national heating grid, in the same way as there is a national electrical grid, there is no real way to deal with heating from a top down approach. Typically heat is provided by individual heating plant and equipment within each building, fuelled mainly by gas in the case of Dublin City. DH is a real way to influence the way we currently think about heating provision. This more holistic
approach to meeting heating requirements means one large highly efficient renewable or sustainably fuelled heat plant can supply almost all of the heating requirements to numerous buildings without the need to pressure each individual to install a new renewable heating system in their building. The total heat density of all the small areas in Dublin City is shown in Figure 28. Using the same thresholds for DH viability typically used by Danish energy planners in their own municipality areas, over 75% of the small areas in Dublin City would be classified as suitable for DH. There are over 140 small areas with densities between 500 and 800 TJ/km2, and 49 areas with very high heat densities above 800TJ/km2 (seen in dark red). These very high density areas are all found within a 2.5 km radius of the city centre, with most found on the south-side of the Liffey. A more detailed map of this area is shown below in Figure 26, which also shows the building outlines and the clusters of commercial energy use which give this area its high heat demand.
Figure 26: Section of Dublin City Map with High Heat Demand Densities and Clustered Commercial Activity
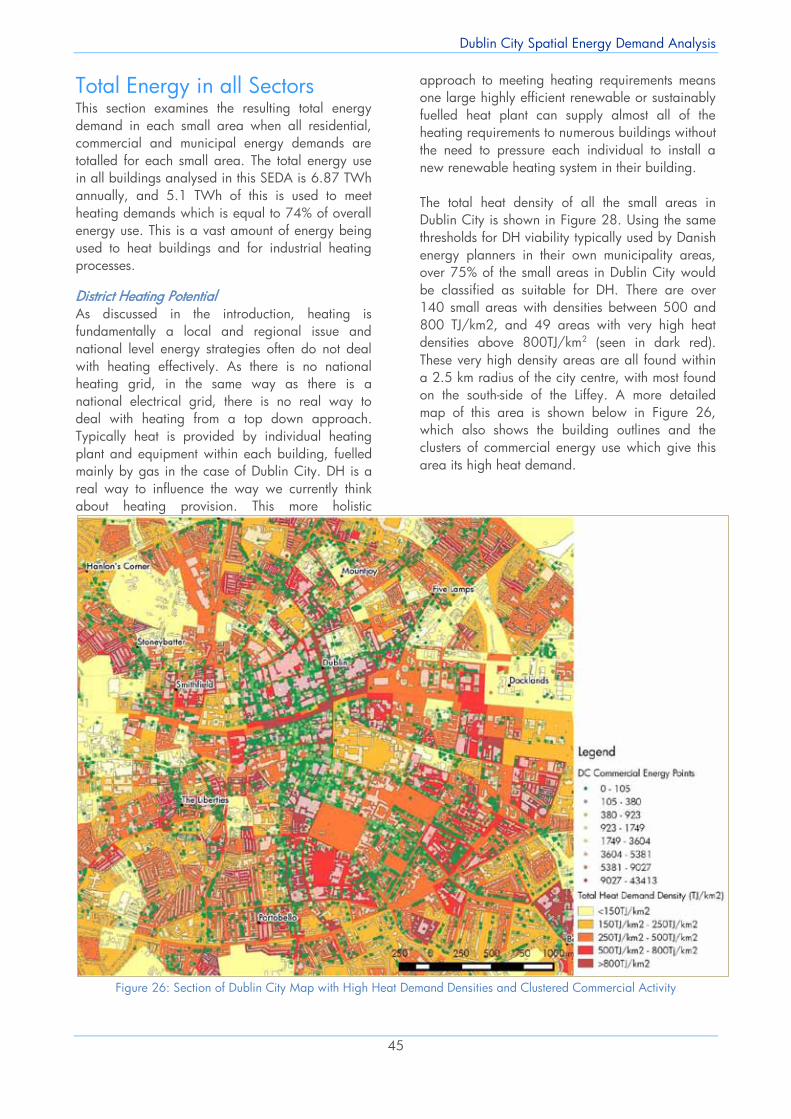
Dublin City Spatial Energy Demand Analysis
44
Figure 25: Total Annual Municipal Energy Demand (MWh)
Dublin City Spatial Energy Demand Analysis
45
Total Energy in all Sectors This section examines the resulting total energy demand in each small area when all residential, commercial and municipal energy demands are totalled for each small area. The total energy use in all buildings analysed in this SEDA is 6.87 TWh annually, and 5.1 TWh of this is used to meet heating demands which is equal to 74% of overall energy use. This is a vast amount of energy being used to heat buildings and for industrial heating processes.
District Heating Potential As discussed in the introduction, heating is fundamentally a local and regional issue and national level energy strategies often do not deal with heating effectively. As there is no national heating grid, in the same way as there is a national electrical grid, there is no real way to deal with heating from a top down approach. Typically heat is provided by individual heating plant and equipment within each building, fuelled mainly by gas in the case of Dublin City. DH is a real way to influence the way we currently think about heating provision. This more holistic
approach to meeting heating requirements means one large highly efficient renewable or sustainably fuelled heat plant can supply almost all of the heating requirements to numerous buildings without the need to pressure each individual to install a new renewable heating system in their building. The total heat density of all the small areas in Dublin City is shown in Figure 28. Using the same thresholds for DH viability typically used by Danish energy planners in their own municipality areas, over 75% of the small areas in Dublin City would be classified as suitable for DH. There are over 140 small areas with densities between 500 and 800 TJ/km2, and 49 areas with very high heat densities above 800TJ/km2 (seen in dark red). These very high density areas are all found within a 2.5 km radius of the city centre, with most found on the south-side of the Liffey. A more detailed map of this area is shown below in Figure 26, which also shows the building outlines and the clusters of commercial energy use which give this area its high heat demand.
Figure 26: Section of Dublin City Map with High Heat Demand Densities and Clustered Commercial Activity
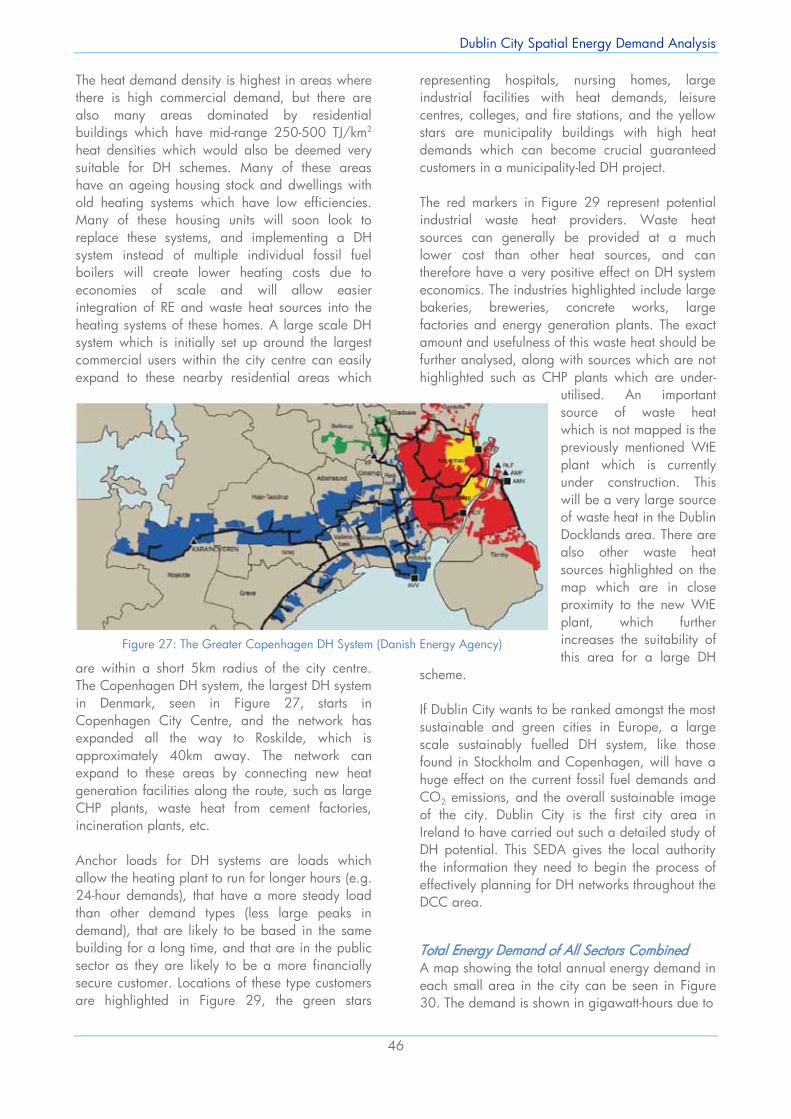
Dublin City Spatial Energy Demand Analysis
46
The heat demand density is highest in areas where there is high commercial demand, but there are also many areas dominated by residential buildings which have mid-range 250-500 TJ/km2 heat densities which would also be deemed very suitable for DH schemes. Many of these areas have an ageing housing stock and dwellings with old heating systems which have low efficiencies. Many of these housing units will soon look to replace these systems, and implementing a DH system instead of multiple individual fossil fuel boilers will create lower heating costs due to economies of scale and will allow easier integration of RE and waste heat sources into the heating systems of these homes. A large scale DH system which is initially set up around the largest commercial users within the city centre can easily expand to these nearby residential areas which
are within a short 5km radius of the city centre. The Copenhagen DH system, the largest DH system in Denmark, seen in Figure 27, starts in Copenhagen City Centre, and the network has expanded all the way to Roskilde, which is approximately 40km away. The network can expand to these areas by connecting new heat generation facilities along the route, such as large CHP plants, waste heat from cement factories, incineration plants, etc. Anchor loads for DH systems are loads which allow the heating plant to run for longer hours (e.g. 24-hour demands), that have a more steady load than other demand types (less large peaks in demand), that are likely to be based in the same building for a long time, and that are in the public sector as they are likely to be a more financially secure customer. Locations of these type customers are highlighted in Figure 29, the green stars
representing hospitals, nursing homes, large industrial facilities with heat demands, leisure centres, colleges, and fire stations, and the yellow stars are municipality buildings with high heat demands which can become crucial guaranteed customers in a municipality-led DH project. The red markers in Figure 29 represent potential industrial waste heat providers. Waste heat sources can generally be provided at a much lower cost than other heat sources, and can therefore have a very positive effect on DH system economics. The industries highlighted include large bakeries, breweries, concrete works, large factories and energy generation plants. The exact amount and usefulness of this waste heat should be further analysed, along with sources which are not highlighted such as CHP plants which are under-
utilised. An important source of waste heat which is not mapped is the previously mentioned WtE plant which is currently under construction. This will be a very large source of waste heat in the Dublin Docklands area. There are also other waste heat sources highlighted on the map which are in close proximity to the new WtE plant, which further increases the suitability of this area for a large DH
scheme. If Dublin City wants to be ranked amongst the most sustainable and green cities in Europe, a large scale sustainably fuelled DH system, like those found in Stockholm and Copenhagen, will have a huge effect on the current fossil fuel demands and CO2 emissions, and the overall sustainable image of the city. Dublin City is the first city area in Ireland to have carried out such a detailed study of DH potential. This SEDA gives the local authority the information they need to begin the process of effectively planning for DH networks throughout the DCC area.
Total Energy Demand of All Sectors Combined A map showing the total annual energy demand in each small area in the city can be seen in Figure 30. The demand is shown in gigawatt-hours due to
Figure 27: The Greater Copenhagen DH System (Danish Energy Agency)
Dublin City Spatial Energy Demand Analysis
47
Figure 28: Total Heat Demand Density of All Sectors (TJ/km2)
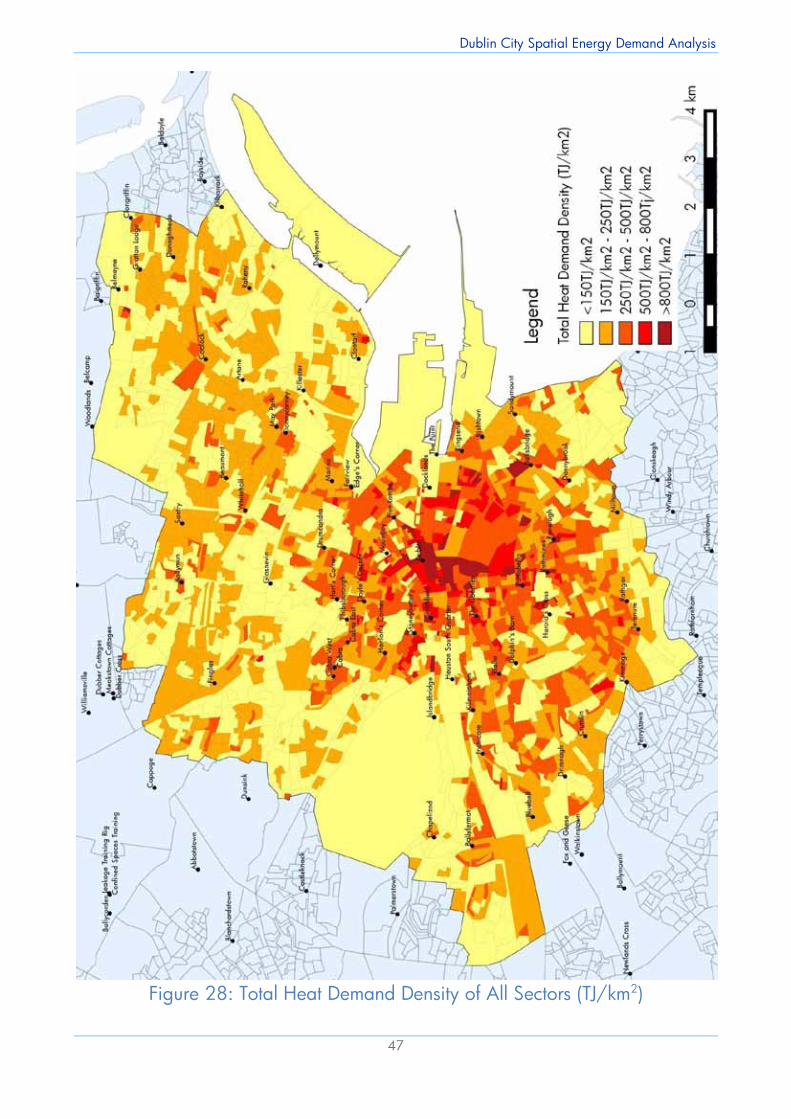
Dublin City Spatial Energy Demand Analysis
46
The heat demand density is highest in areas where there is high commercial demand, but there are also many areas dominated by residential buildings which have mid-range 250-500 TJ/km2 heat densities which would also be deemed very suitable for DH schemes. Many of these areas have an ageing housing stock and dwellings with old heating systems which have low efficiencies. Many of these housing units will soon look to replace these systems, and implementing a DH system instead of multiple individual fossil fuel boilers will create lower heating costs due to economies of scale and will allow easier integration of RE and waste heat sources into the heating systems of these homes. A large scale DH system which is initially set up around the largest commercial users within the city centre can easily expand to these nearby residential areas which
are within a short 5km radius of the city centre. The Copenhagen DH system, the largest DH system in Denmark, seen in Figure 27, starts in Copenhagen City Centre, and the network has expanded all the way to Roskilde, which is approximately 40km away. The network can expand to these areas by connecting new heat generation facilities along the route, such as large CHP plants, waste heat from cement factories, incineration plants, etc. Anchor loads for DH systems are loads which allow the heating plant to run for longer hours (e.g. 24-hour demands), that have a more steady load than other demand types (less large peaks in demand), that are likely to be based in the same building for a long time, and that are in the public sector as they are likely to be a more financially secure customer. Locations of these type customers are highlighted in Figure 29, the green stars
representing hospitals, nursing homes, large industrial facilities with heat demands, leisure centres, colleges, and fire stations, and the yellow stars are municipality buildings with high heat demands which can become crucial guaranteed customers in a municipality-led DH project. The red markers in Figure 29 represent potential industrial waste heat providers. Waste heat sources can generally be provided at a much lower cost than other heat sources, and can therefore have a very positive effect on DH system economics. The industries highlighted include large bakeries, breweries, concrete works, large factories and energy generation plants. The exact amount and usefulness of this waste heat should be further analysed, along with sources which are not highlighted such as CHP plants which are under-
utilised. An important source of waste heat which is not mapped is the previously mentioned WtE plant which is currently under construction. This will be a very large source of waste heat in the Dublin Docklands area. There are also other waste heat sources highlighted on the map which are in close proximity to the new WtE plant, which further increases the suitability of this area for a large DH
scheme. If Dublin City wants to be ranked amongst the most sustainable and green cities in Europe, a large scale sustainably fuelled DH system, like those found in Stockholm and Copenhagen, will have a huge effect on the current fossil fuel demands and CO2 emissions, and the overall sustainable image of the city. Dublin City is the first city area in Ireland to have carried out such a detailed study of DH potential. This SEDA gives the local authority the information they need to begin the process of effectively planning for DH networks throughout the DCC area.
Total Energy Demand of All Sectors Combined A map showing the total annual energy demand in each small area in the city can be seen in Figure 30. The demand is shown in gigawatt-hours due to
Figure 27: The Greater Copenhagen DH System (Danish Energy Agency)
Dublin City Spatial Energy Demand Analysis
47
Figure 28: Total Heat Demand Density of All Sectors (TJ/km2)
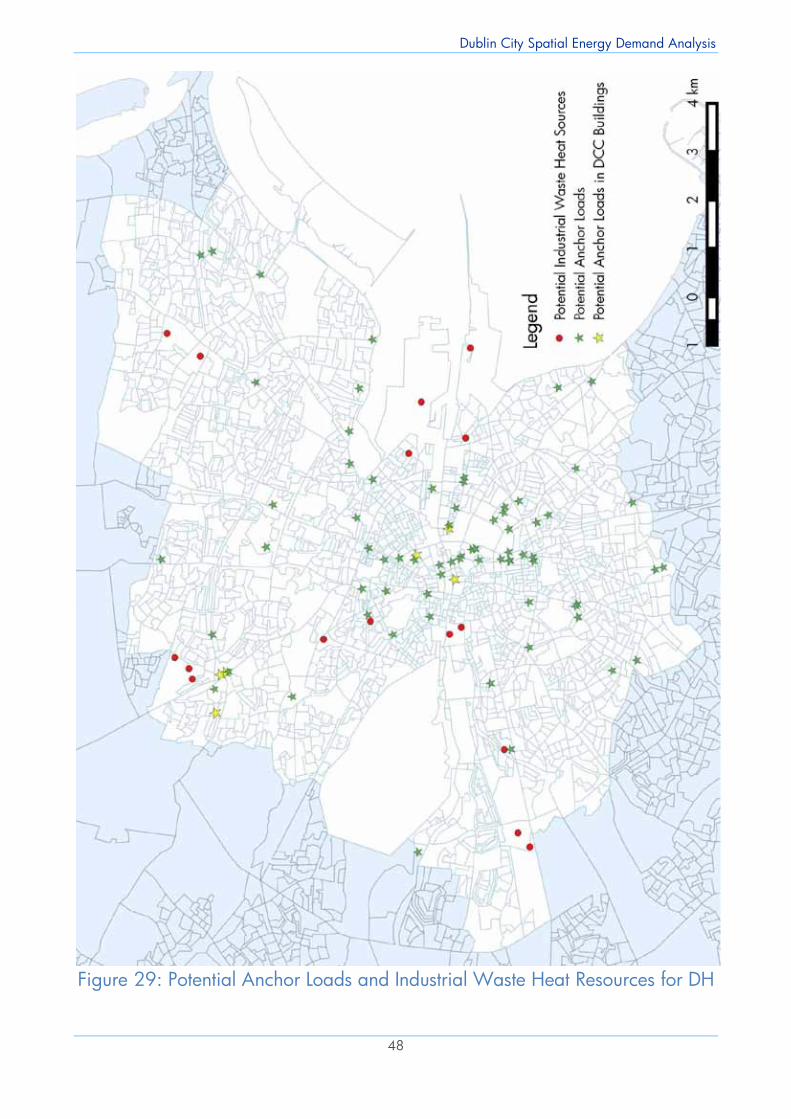
Dublin City Spatial Energy Demand Analysis
48
Figure 29: Potential Anchor Loads and Industrial Waste Heat Resources for DH
Dublin City Spatial Energy Demand Analysis
49
the increased size of the demands when all sectoral energy is combined. The highest areas of energy use are dominated by those with large industrial and clusters of commercial activity. The range of demands coloured yellow to orange represent mainly residential areas, while the orange to dark red areas are mainly commercial or a mix of residential and commercial demands. There are many areas on the periphery which have just as high if not higher energy demands than many of those in the city centre. These areas are just as important to target for energy reductions. Since these areas are further away from built up areas, they can have advantages for renewable energy integration, such as less traffic issues regarding transport of biofuels and biomass, distance from dwellings which may make it easier to implement small to medium scale wind power, and in terms of PV installations, potentially less over-shading issues from neighbouring high-rise buildings. In order to match RE technology to energy demand, it is important to understand how much demand for heat, fossil fuels and electricity is needed in each area. Implementing a large CHP unit in an area to meet electricity requirements is no use if there is not sufficient local heat demand. Buildings with large heat demands, small electricity use and south facing roof spaces may be better suited to solar thermal installations than solar PV. Figure 31 and Figure 32 show the total annual fossil fuel and electricity use in each small area respectively. It can be seen that the use of high levels of fossil fuel is much more widespread and not just concentrated around commercial areas and city centre, as the residential sector has a high fossil fuel demand. On the other hand, the highest levels of electricity usage are in areas dominated by commercial and industrial energy demands. Wind, hydro and solar PV are all well-established renewable electricity generator technologies, with bio-fuelled CHP a highly efficient sustainable option for businesses which also have a heat demand. The high use of fossil fuels in the residential sector, which is mostly used for heating needs, can be
replaced with renewable and sustainable solutions. When looking to replace a gas or oil boiler, households should be encouraged to prioritise the most sustainable options. As mentioned earlier, there are grant supports for homeowners installing new gas or oil boilers, but no supports for biomass or biofuel boilers, or any heat pump systems. This limits homeowners’ options, the only RE heating solution supported is solar thermal, but not all dwellings will be suited to this solution. Commercial sector buildings which are planning to install CHP units sized to offset electricity use could look at providing nearby households with heat, thereby allowing the CHP to run at high efficiency mode for longer, produce the maximum amount of electricity possible, and create an additional revenue stream. As can be seen in the maps, there are plenty of heating demands in close proximity to large commercial buildings. To better show where electricity use is most prevalent, the electricity share as a percentage of the total energy demand is shown in Figure 33 (p.53). Most residential areas will typically have 25% or lower electricity share of total demand. The map shows areas where a high percentage (over 60%) of the total demand is electricity use (dark blue), this is influenced by high shares of electrical heating and cooling demands in these areas. These areas typically have high levels of apartments which are electrically heated, retail units which use electrical heating, hotels with air conditioning units, and data centres which have large cooling demands. These areas will most benefit from a source of low cost renewable electricity to offset the high costs of grid electricity. The total cost of energy use annually in Dublin City is €657 million; €290 million in the commercial sector, €361 million in the residential sector and €6 million in the municipal sector. The areas with the highest energy spends are highlighted in dark green in Figure 34, (p.54). The highest energy spends again overlap with areas of high commercial energy consumption, and particularly overlap with areas with highest total electricity demand. The costs in the areas shown in dark green range from €5.8 to €10.8 million annually.
Dublin City Spatial Energy Demand Analysis
48
Figure 29: Potential Anchor Loads and Industrial Waste Heat Resources for DH
Dublin City Spatial Energy Demand Analysis
49
the increased size of the demands when all sectoral energy is combined. The highest areas of energy use are dominated by those with large industrial and clusters of commercial activity. The range of demands coloured yellow to orange represent mainly residential areas, while the orange to dark red areas are mainly commercial or a mix of residential and commercial demands. There are many areas on the periphery which have just as high if not higher energy demands than many of those in the city centre. These areas are just as important to target for energy reductions. Since these areas are further away from built up areas, they can have advantages for renewable energy integration, such as less traffic issues regarding transport of biofuels and biomass, distance from dwellings which may make it easier to implement small to medium scale wind power, and in terms of PV installations, potentially less over-shading issues from neighbouring high-rise buildings. In order to match RE technology to energy demand, it is important to understand how much demand for heat, fossil fuels and electricity is needed in each area. Implementing a large CHP unit in an area to meet electricity requirements is no use if there is not sufficient local heat demand. Buildings with large heat demands, small electricity use and south facing roof spaces may be better suited to solar thermal installations than solar PV. Figure 31 and Figure 32 show the total annual fossil fuel and electricity use in each small area respectively. It can be seen that the use of high levels of fossil fuel is much more widespread and not just concentrated around commercial areas and city centre, as the residential sector has a high fossil fuel demand. On the other hand, the highest levels of electricity usage are in areas dominated by commercial and industrial energy demands. Wind, hydro and solar PV are all well-established renewable electricity generator technologies, with bio-fuelled CHP a highly efficient sustainable option for businesses which also have a heat demand. The high use of fossil fuels in the residential sector, which is mostly used for heating needs, can be
replaced with renewable and sustainable solutions. When looking to replace a gas or oil boiler, households should be encouraged to prioritise the most sustainable options. As mentioned earlier, there are grant supports for homeowners installing new gas or oil boilers, but no supports for biomass or biofuel boilers, or any heat pump systems. This limits homeowners’ options, the only RE heating solution supported is solar thermal, but not all dwellings will be suited to this solution. Commercial sector buildings which are planning to install CHP units sized to offset electricity use could look at providing nearby households with heat, thereby allowing the CHP to run at high efficiency mode for longer, produce the maximum amount of electricity possible, and create an additional revenue stream. As can be seen in the maps, there are plenty of heating demands in close proximity to large commercial buildings. To better show where electricity use is most prevalent, the electricity share as a percentage of the total energy demand is shown in Figure 33 (p.53). Most residential areas will typically have 25% or lower electricity share of total demand. The map shows areas where a high percentage (over 60%) of the total demand is electricity use (dark blue), this is influenced by high shares of electrical heating and cooling demands in these areas. These areas typically have high levels of apartments which are electrically heated, retail units which use electrical heating, hotels with air conditioning units, and data centres which have large cooling demands. These areas will most benefit from a source of low cost renewable electricity to offset the high costs of grid electricity. The total cost of energy use annually in Dublin City is €657 million; €290 million in the commercial sector, €361 million in the residential sector and €6 million in the municipal sector. The areas with the highest energy spends are highlighted in dark green in Figure 34, (p.54). The highest energy spends again overlap with areas of high commercial energy consumption, and particularly overlap with areas with highest total electricity demand. The costs in the areas shown in dark green range from €5.8 to €10.8 million annually.
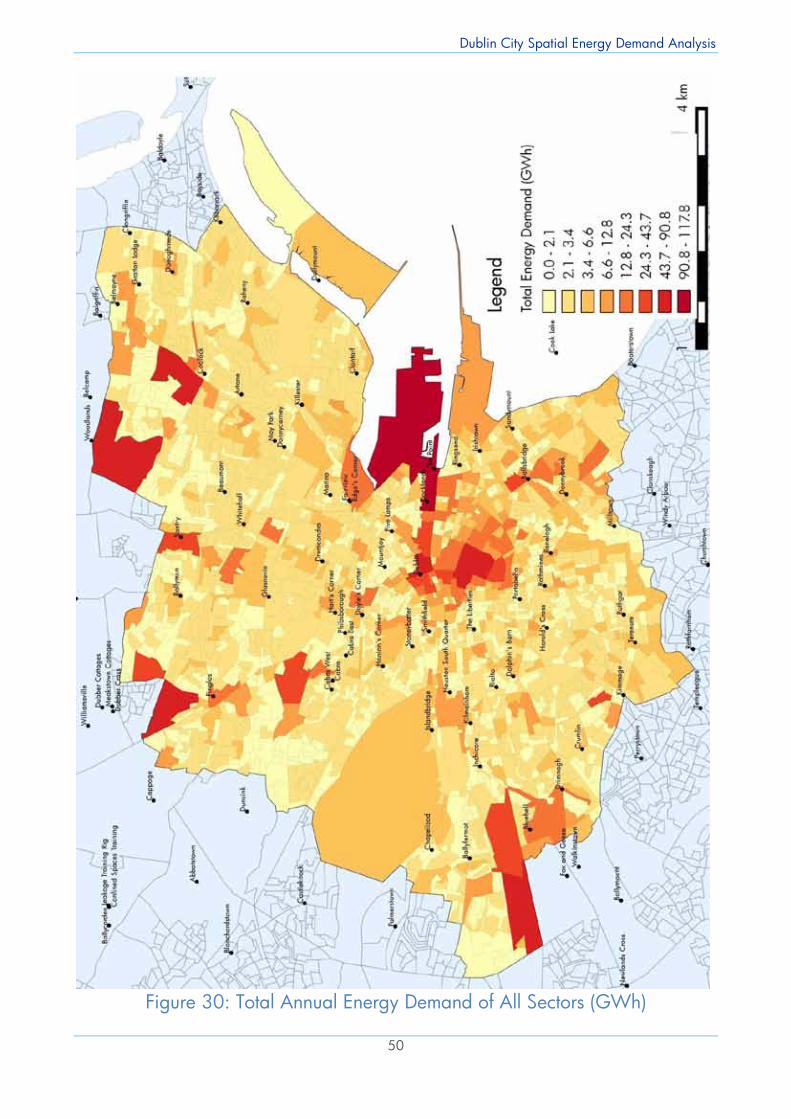
Dublin City Spatial Energy Demand Analysis
50
Figure 30: Total Annual Energy Demand of All Sectors (GWh)
Dublin City Spatial Energy Demand Analysis
51
Figure 31: Total Annual Fossil Fuel Use (GWh) of All Sectors
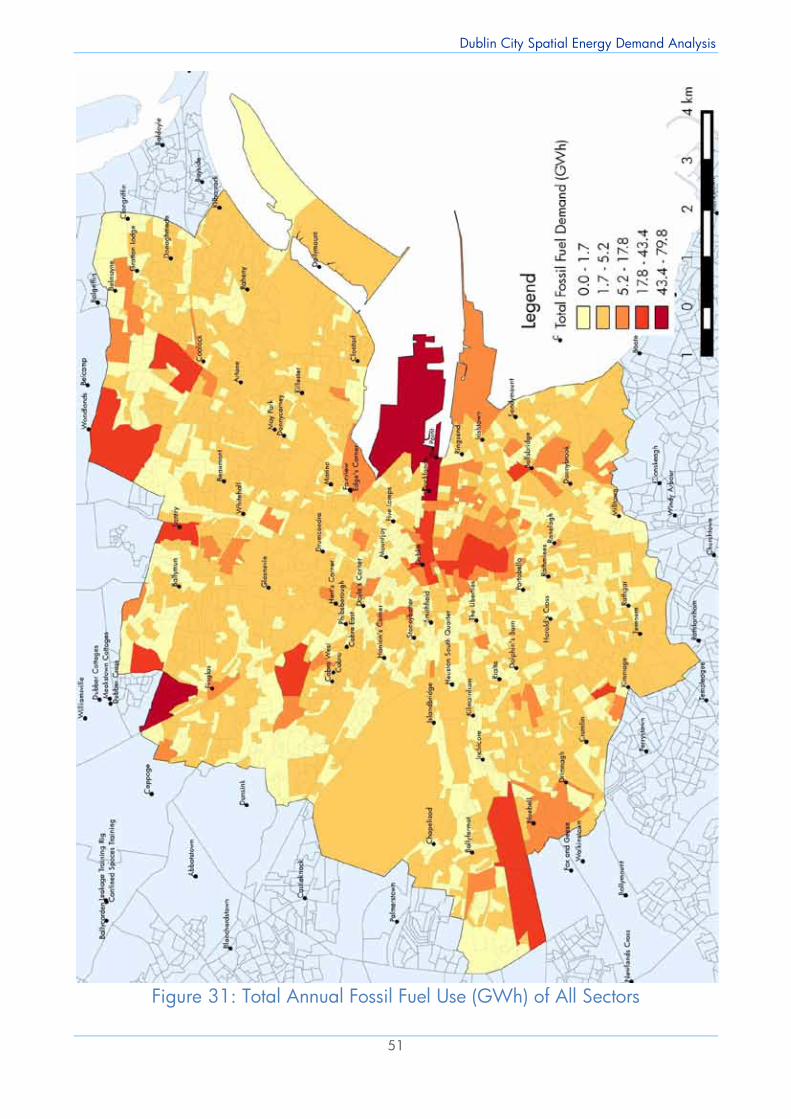
Dublin City Spatial Energy Demand Analysis
50
Figure 30: Total Annual Energy Demand of All Sectors (GWh)
Dublin City Spatial Energy Demand Analysis
51
Figure 31: Total Annual Fossil Fuel Use (GWh) of All Sectors
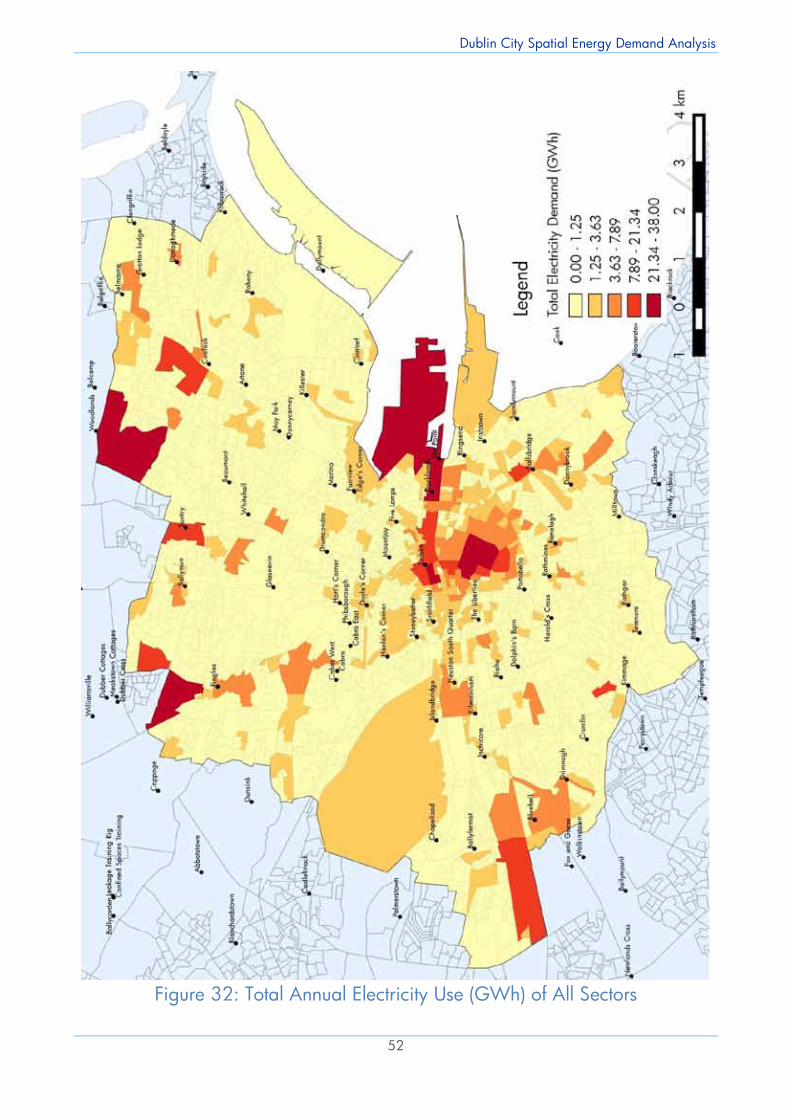
Dublin City Spatial Energy Demand Analysis
52
Figure 32: Total Annual Electricity Use (GWh) of All Sectors
Dublin City Spatial Energy Demand Analysis
53
Figure 33: Electricity Share (%) of Total Energy Demand of All Sectors
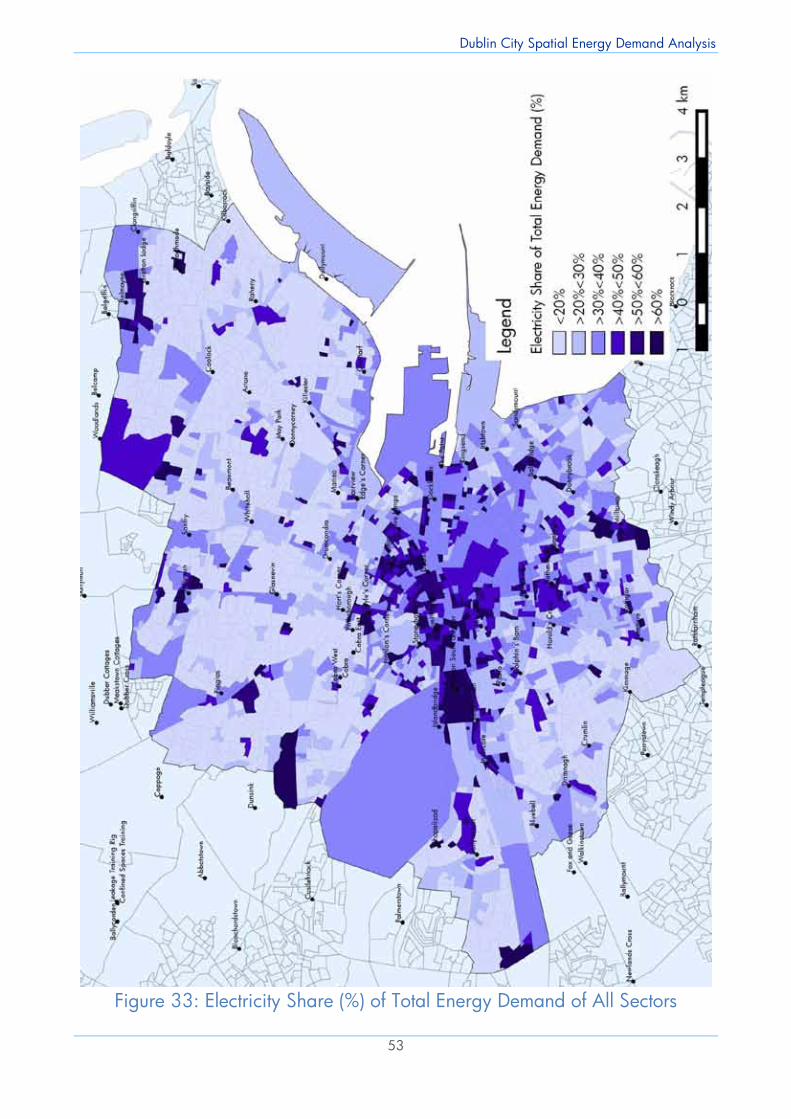
Dublin City Spatial Energy Demand Analysis
52
Figure 32: Total Annual Electricity Use (GWh) of All Sectors
Dublin City Spatial Energy Demand Analysis
53
Figure 33: Electricity Share (%) of Total Energy Demand of All Sectors
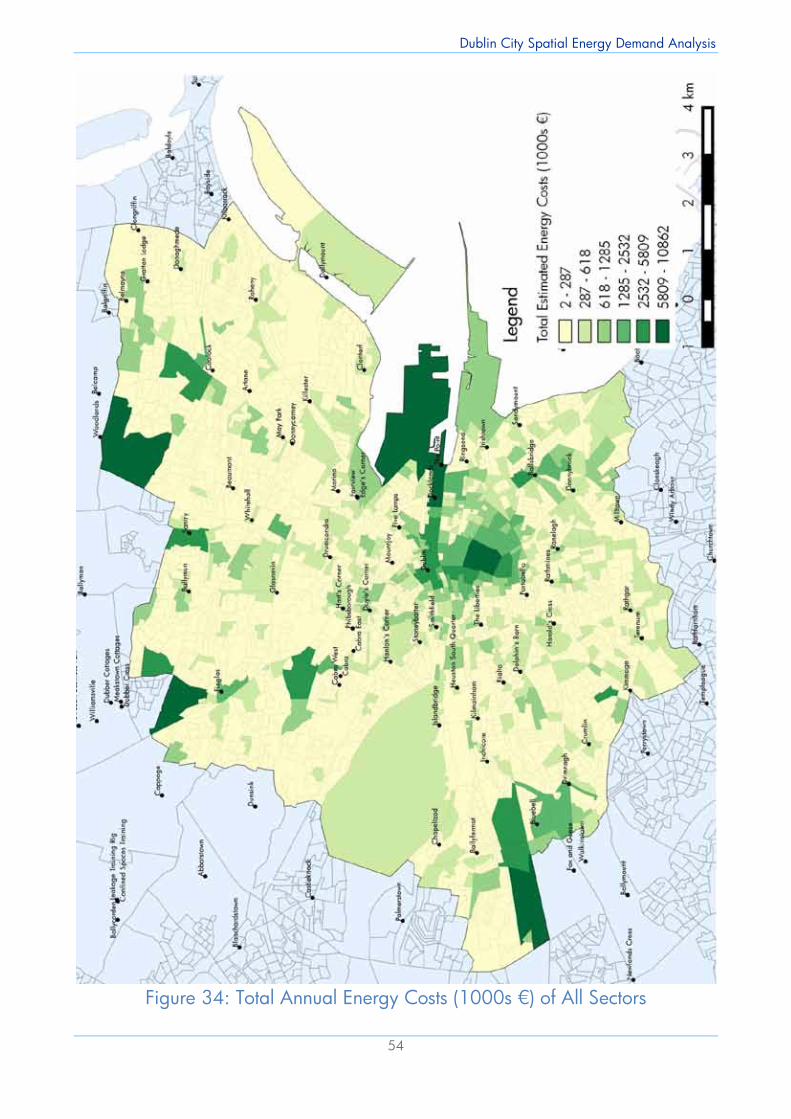
Dublin City Spatial Energy Demand Analysis
54
Figure 34: Total Annual Energy Costs (1000s €) of All Sectors
Dublin City Spatial Energy Demand Analysis
55
Renewable Energy Resources in Dublin City The SEDA has shown a spatial representation of the energy demand in Dublin City. The type of energy demand and location of this demand is specific to Dublin City, due to many influencing factors such as the building construction periods, availability of fuels in this area, topology, geography and urban and spatial planning regulations. This region will also have renewable resource potential specific to this landscape, influenced again by many local factors such as the geology, anemology, hydrology, geography and urban and spatial planning regulations of the area. Important to note in terms of financial feasibility of all small-scale renewable installations is that there are currently no feed-in tariffs being offered for power fed to the grid from micro-generation installations. This means that the size of these installations needs to be carefully matched to the owners’ own power demands so that all power produced is used and not exported without payment. Commercial scale installations can negotiate a power purchase agreement with utilities and can apply for Renewable Energy Feed-In Tariffs (REFIT) which are available depending on eligibility.
Geothermal Resources Geothermal energy is solar energy stored in the form of heat within the earth’s surface, heating the soil itself or groundwater beneath the surface. It is used to produce heat to meet building heating requirements, and can produce both space and hot water heating, but is most commonly used for low-temperature space heating. The makeup of the soil and bedrock in Dublin City will affect the suitability and potential to exploit geothermal resources. Geothermal resources are classified into ‘shallow’ and ‘deep’ geothermal resources. Shallow geothermal is a relatively low temperature heat source found up to 400m below the surface which is boosted through the use of a heat pump to useful heating temperatures. Deep geothermal involves drilling boreholes deeper than 400m below the surface to obtain higher ground-source temperatures usually hot enough to use directly. As mentioned previously, there is a good
example of geothermal energy in use in the IKEA store in the north of the city. The Geological Survey of Ireland (GSI) Shallow Geothermal Energy Resource Project has produced maps which show the shallow geothermal energy suitability of areas across Ireland. The maps show the suitability of different types of systems (open loop and closed loop) and for both domestic and commercial applications. These maps can be accessed on their website at http://www.gsi.ie/Mapping.htm. As can be seen in Figure 35, the Dublin City area has areas classified as possibly suitable and generally unsuitable, with no areas classified as highly suitable or suitable within Dublin for shallow geothermal open-loop systems. The maps for horizontal and vertical closed-loop shallow geothermal systems shows some very small areas highlighted as suitable, but mainly show Dublin City as being possibly suitable and generally unsuitable. The GSI has also produced a homeowner manual for ground source and geothermal energy which explains the whole process and terminology involved, and estimated costs of installations, which can be found on
Figure 35: Suitability of Domestic Open-Loop Shallow Geothermal System (Dublin City area circled) (GSI , 2015)
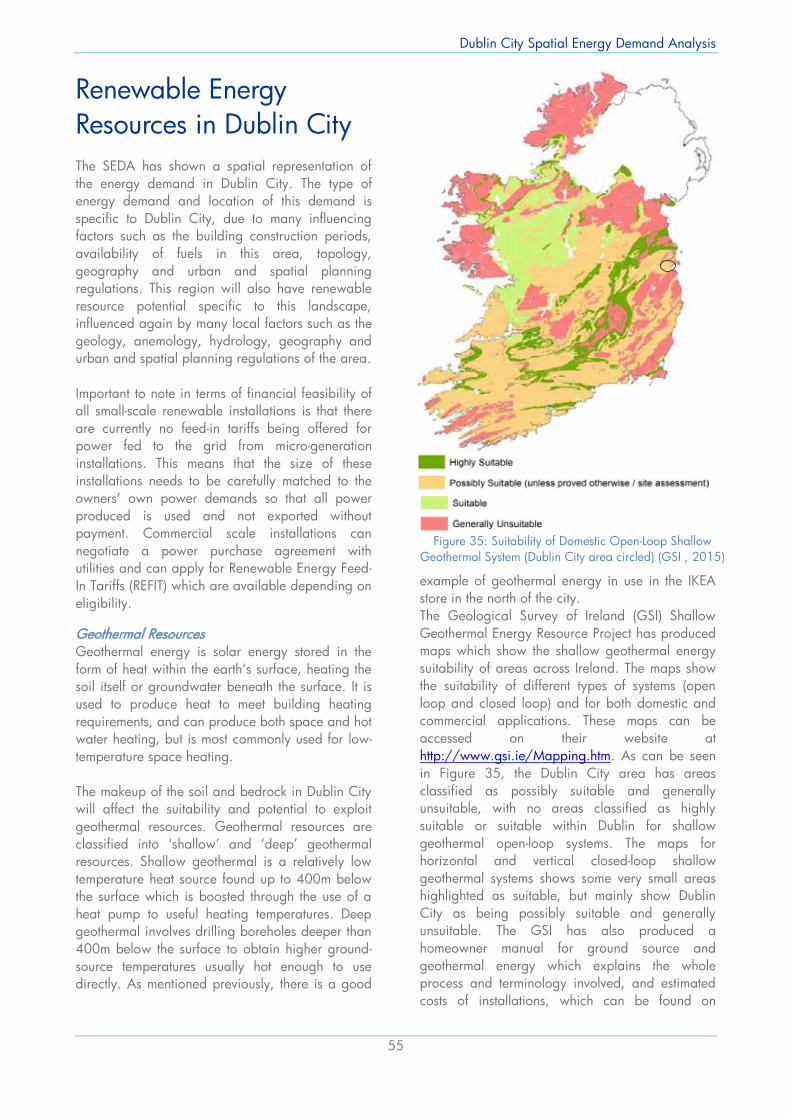
Dublin City Spatial Energy Demand Analysis
54
Figure 34: Total Annual Energy Costs (1000s €) of All Sectors
Dublin City Spatial Energy Demand Analysis
55
Renewable Energy Resources in Dublin City The SEDA has shown a spatial representation of the energy demand in Dublin City. The type of energy demand and location of this demand is specific to Dublin City, due to many influencing factors such as the building construction periods, availability of fuels in this area, topology, geography and urban and spatial planning regulations. This region will also have renewable resource potential specific to this landscape, influenced again by many local factors such as the geology, anemology, hydrology, geography and urban and spatial planning regulations of the area. Important to note in terms of financial feasibility of all small-scale renewable installations is that there are currently no feed-in tariffs being offered for power fed to the grid from micro-generation installations. This means that the size of these installations needs to be carefully matched to the owners’ own power demands so that all power produced is used and not exported without payment. Commercial scale installations can negotiate a power purchase agreement with utilities and can apply for Renewable Energy Feed-In Tariffs (REFIT) which are available depending on eligibility.
Geothermal Resources Geothermal energy is solar energy stored in the form of heat within the earth’s surface, heating the soil itself or groundwater beneath the surface. It is used to produce heat to meet building heating requirements, and can produce both space and hot water heating, but is most commonly used for low-temperature space heating. The makeup of the soil and bedrock in Dublin City will affect the suitability and potential to exploit geothermal resources. Geothermal resources are classified into ‘shallow’ and ‘deep’ geothermal resources. Shallow geothermal is a relatively low temperature heat source found up to 400m below the surface which is boosted through the use of a heat pump to useful heating temperatures. Deep geothermal involves drilling boreholes deeper than 400m below the surface to obtain higher ground-source temperatures usually hot enough to use directly. As mentioned previously, there is a good
example of geothermal energy in use in the IKEA store in the north of the city. The Geological Survey of Ireland (GSI) Shallow Geothermal Energy Resource Project has produced maps which show the shallow geothermal energy suitability of areas across Ireland. The maps show the suitability of different types of systems (open loop and closed loop) and for both domestic and commercial applications. These maps can be accessed on their website at http://www.gsi.ie/Mapping.htm. As can be seen in Figure 35, the Dublin City area has areas classified as possibly suitable and generally unsuitable, with no areas classified as highly suitable or suitable within Dublin for shallow geothermal open-loop systems. The maps for horizontal and vertical closed-loop shallow geothermal systems shows some very small areas highlighted as suitable, but mainly show Dublin City as being possibly suitable and generally unsuitable. The GSI has also produced a homeowner manual for ground source and geothermal energy which explains the whole process and terminology involved, and estimated costs of installations, which can be found on
Figure 35: Suitability of Domestic Open-Loop Shallow Geothermal System (Dublin City area circled) (GSI , 2015)
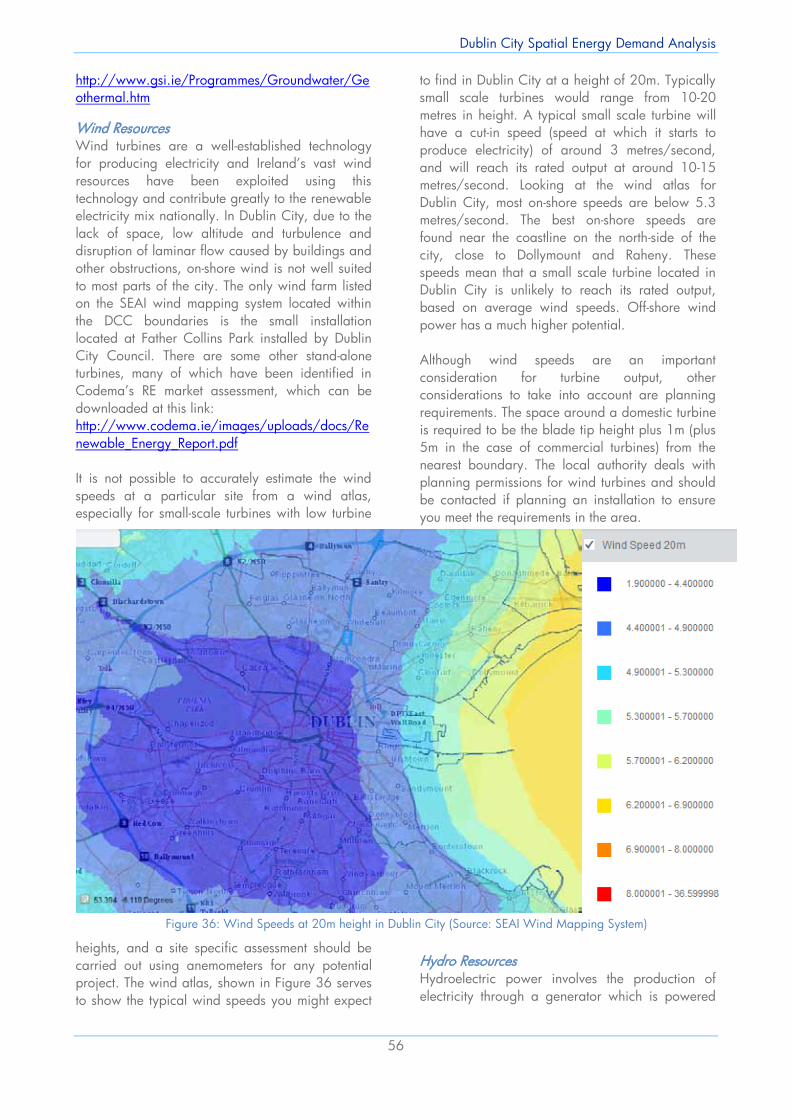
Dublin City Spatial Energy Demand Analysis
56
http://www.gsi.ie/Programmes/Groundwater/Geothermal.htm
Wind Resources Wind turbines are a well-established technology for producing electricity and Ireland’s vast wind resources have been exploited using this technology and contribute greatly to the renewable electricity mix nationally. In Dublin City, due to the lack of space, low altitude and turbulence and disruption of laminar flow caused by buildings and other obstructions, on-shore wind is not well suited to most parts of the city. The only wind farm listed on the SEAI wind mapping system located within the DCC boundaries is the small installation located at Father Collins Park installed by Dublin City Council. There are some other stand-alone turbines, many of which have been identified in Codema’s RE market assessment, which can be downloaded at this link: http://www.codema.ie/images/uploads/docs/Renewable_Energy_Report.pdf It is not possible to accurately estimate the wind speeds at a particular site from a wind atlas, especially for small-scale turbines with low turbine
heights, and a site specific assessment should be carried out using anemometers for any potential project. The wind atlas, shown in Figure 36 serves to show the typical wind speeds you might expect
to find in Dublin City at a height of 20m. Typically small scale turbines would range from 10-20 metres in height. A typical small scale turbine will have a cut-in speed (speed at which it starts to produce electricity) of around 3 metres/second, and will reach its rated output at around 10-15 metres/second. Looking at the wind atlas for Dublin City, most on-shore speeds are below 5.3 metres/second. The best on-shore speeds are found near the coastline on the north-side of the city, close to Dollymount and Raheny. These speeds mean that a small scale turbine located in Dublin City is unlikely to reach its rated output, based on average wind speeds. Off-shore wind power has a much higher potential. Although wind speeds are an important consideration for turbine output, other considerations to take into account are planning requirements. The space around a domestic turbine is required to be the blade tip height plus 1m (plus 5m in the case of commercial turbines) from the nearest boundary. The local authority deals with planning permissions for wind turbines and should be contacted if planning an installation to ensure you meet the requirements in the area.
Hydro Resources Hydroelectric power involves the production of electricity through a generator which is powered
Figure 36: Wind Speeds at 20m height in Dublin City (Source: SEAI Wind Mapping System)
Dublin City Spatial Energy Demand Analysis
57
by the force of moving water. It is used at very large scales in some countries which have vast river resources and high mountainous areas, such as Brazil, where hydropower provides over 75% of the country’s electricity. The biggest hydro sites in Ireland are found at Ardnacrusha, Cathleen’s Fall and Pollaphuca, the latter being fed by the River Liffey. Suitable sites are sites where there is a running flow of water year round, where this flow has a high fall height (or head height), and where re-routing the water resource through a turbine will not have a negative effect on the environment. Schemes can either use the flow of the river directly (“run-of-river” schemes) or build a small dam or reservoir to increase the flow when the river has a low flow rate. A site assessment measuring the quantity and speed of flowing water should be conducted to evaluate the potential hydro power output. A very useful guide on how to develop small scale hydro power is available from the European Small Hydropower Association at the link: http://www.esha.be/fileadmin/esha_files/documents/publications/GUIDES/GUIDE_SHP/GUIDE_SHP_EN.pdf
Dublin City has three main rivers, the Tolka, the Liffey and the Dodder, and other smaller mainly underground rivers such as the Poddle. There is no water flow data available for hydro resources in Dublin City, but the locations of waterways in the
city can be seen in Figure 37, which includes all rivers and canals. Dublin City is quite a flat land area, and so head heights on these waterways will not be very substantial. The higher the head height, the higher the flow speed of water and the more power can be generated. Mountainous areas, closer to the Dublin Mountains, would be more suitable.
Solar Resources Solar energy production involves using the energy from the sun to produce either heat or electricity. Solar thermal installations use the heat energy from the sun to heat water and solar photovoltaic (PV) installations convert energy from light into electricity. The only resource needed for these installations is a space which is facing the daytime sun direction (south-southeast is best in Ireland) and is free from nearby tall obstacles which may cause over-shading issues. From analysis of actual PV installations in Dublin City, the solar resources in Dublin allow approximately 800-1000kWh/m2/year to be produced with a south facing installation. A 1m2 installation will therefore provide approximately
one fifth of the average household’s electricity requirements and save €250/year on electricity bills. If all houses and bungalows in Dublin City installed only 1m2 of PV panels on their roofs, the potential output is over 133 GWh/year, which is nearly 13% of the residential sector electricity demand11. Solar power has real potential in Dublin City, and in order to further analyse the total solar electricity potential resource, a solar atlas which outlines the viability of each roof space should be created. Similar atlases have
11 Some houses will not have any south facing roof space, while others will have space for more than 1m2 of south facing PV panels. Apartment complexes could also install roof-top panels.
Figure 37: Locations of Waterways in Dublin City
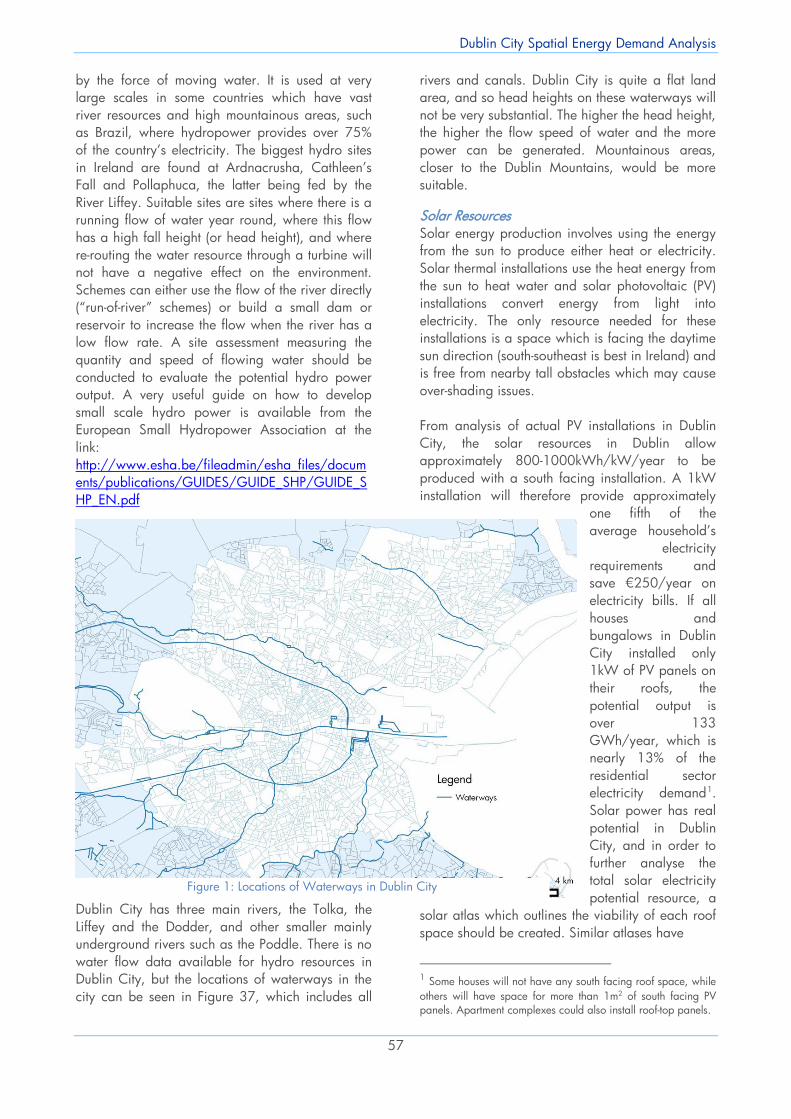
Dublin City Spatial Energy Demand Analysis
57
by the force of moving water. It is used at very large scales in some countries which have vast river resources and high mountainous areas, such as Brazil, where hydropower provides over 75% of the country’s electricity. The biggest hydro sites in Ireland are found at Ardnacrusha, Cathleen’s Fall and Pollaphuca, the latter being fed by the River Liffey. Suitable sites are sites where there is a running flow of water year round, where this flow has a high fall height (or head height), and where re-routing the water resource through a turbine will not have a negative effect on the environment. Schemes can either use the flow of the river directly (“run-of-river” schemes) or build a small dam or reservoir to increase the flow when the river has a low flow rate. A site assessment measuring the quantity and speed of flowing water should be conducted to evaluate the potential hydro power output. A very useful guide on how to develop small scale hydro power is available from the European Small Hydropower Association at the link: http://www.esha.be/fileadmin/esha_files/documents/publications/GUIDES/GUIDE_SHP/GUIDE_SHP_EN.pdf
Dublin City has three main rivers, the Tolka, the Liffey and the Dodder, and other smaller mainly underground rivers such as the Poddle. There is no water flow data available for hydro resources in Dublin City, but the locations of waterways in the city can be seen in Figure 37, which includes all
rivers and canals. Dublin City is quite a flat land area, and so head heights on these waterways will not be very substantial. The higher the head height, the higher the flow speed of water and the more power can be generated. Mountainous areas, closer to the Dublin Mountains, would be more suitable.
Solar Resources Solar energy production involves using the energy from the sun to produce either heat or electricity. Solar thermal installations use the heat energy from the sun to heat water and solar photovoltaic (PV) installations convert energy from light into electricity. The only resource needed for these installations is a space which is facing the daytime sun direction (south-southeast is best in Ireland) and is free from nearby tall obstacles which may cause over-shading issues. From analysis of actual PV installations in Dublin City, the solar resources in Dublin allow approximately 800-1000kWh/kW/year to be produced with a south facing installation. A 1kW installation will therefore provide approximately
one fifth of the average household’s
electricity requirements and save €250/year on electricity bills. If all houses and bungalows in Dublin City installed only 1kW of PV panels on their roofs, the potential output is over 133 GWh/year, which is nearly 13% of the residential sector electricity demand1. Solar power has real potential in Dublin City, and in order to further analyse the total solar electricity potential resource, a
solar atlas which outlines the viability of each roof space should be created. Similar atlases have
1 Some houses will not have any south facing roof space, while others will have space for more than 1m2 of south facing PV panels. Apartment complexes could also install roof-top panels.
Figure 1: Locations of Waterways in Dublin City
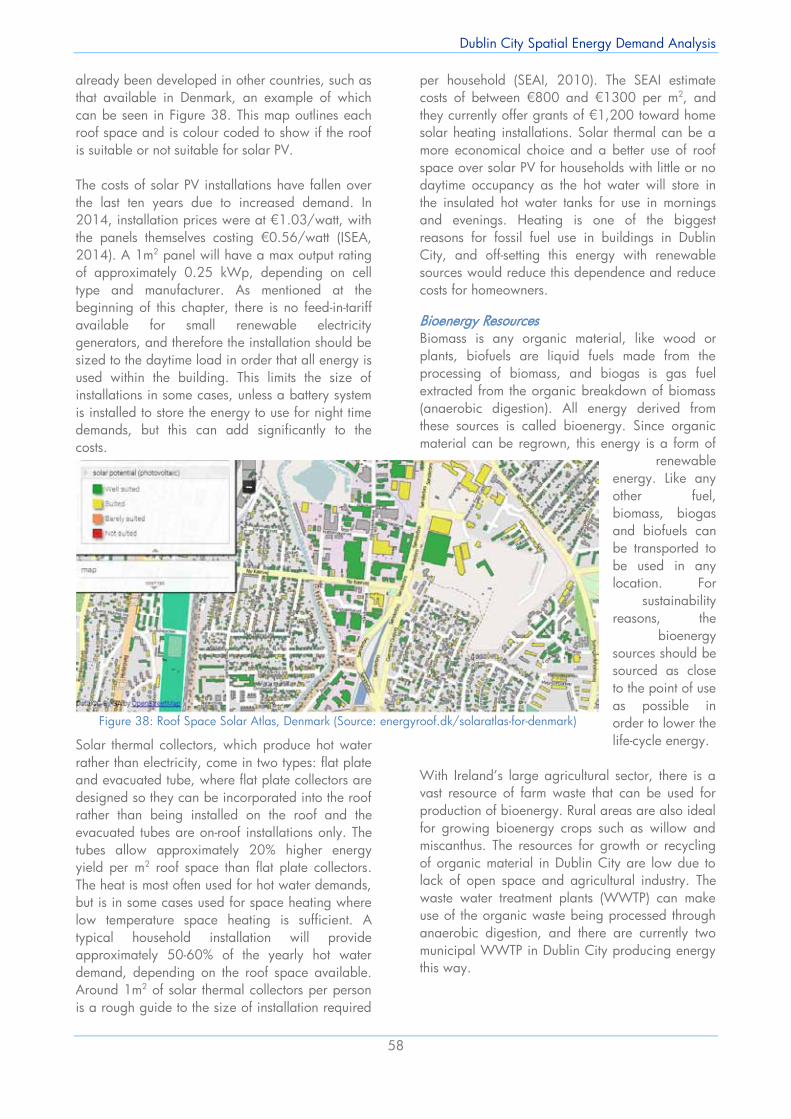
Dublin City Spatial Energy Demand Analysis
58
already been developed in other countries, such as that available in Denmark, an example of which can be seen in Figure 38. This map outlines each roof space and is colour coded to show if the roof is suitable or not suitable for solar PV. The costs of solar PV installations have fallen over the last ten years due to increased demand. In 2014, installation prices were at €1.03/watt, with the panels themselves costing €0.56/watt (ISEA, 2014). A 1m2 panel will have a max output rating of approximately 0.25 kWp, depending on cell type and manufacturer. As mentioned at the beginning of this chapter, there is no feed-in-tariff available for small renewable electricity generators, and therefore the installation should be sized to the daytime load in order that all energy is used within the building. This limits the size of installations in some cases, unless a battery system is installed to store the energy to use for night time demands, but this can add significantly to the costs.
Solar thermal collectors, which produce hot water rather than electricity, come in two types: flat plate and evacuated tube, where flat plate collectors are designed so they can be incorporated into the roof rather than being installed on the roof and the evacuated tubes are on-roof installations only. The tubes allow approximately 20% higher energy yield per m2 roof space than flat plate collectors. The heat is most often used for hot water demands, but is in some cases used for space heating where low temperature space heating is sufficient. A typical household installation will provide approximately 50-60% of the yearly hot water demand, depending on the roof space available. Around 1m2 of solar thermal collectors per person is a rough guide to the size of installation required
per household (SEAI, 2010). The SEAI estimate costs of between €800 and €1300 per m2, and they currently offer grants of €1,200 toward home solar heating installations. Solar thermal can be a more economical choice and a better use of roof space over solar PV for households with little or no daytime occupancy as the hot water will store in the insulated hot water tanks for use in mornings and evenings. Heating is one of the biggest reasons for fossil fuel use in buildings in Dublin City, and off-setting this energy with renewable sources would reduce this dependence and reduce costs for homeowners.
Bioenergy Resources Biomass is any organic material, like wood or plants, biofuels are liquid fuels made from the processing of biomass, and biogas is gas fuel extracted from the organic breakdown of biomass (anaerobic digestion). All energy derived from these sources is called bioenergy. Since organic material can be regrown, this energy is a form of
renewable energy. Like any other fuel, biomass, biogas and biofuels can be transported to be used in any location. For
sustainability reasons, the
bioenergy sources should be sourced as close to the point of use as possible in order to lower the life-cycle energy.
With Ireland’s large agricultural sector, there is a vast resource of farm waste that can be used for production of bioenergy. Rural areas are also ideal for growing bioenergy crops such as willow and miscanthus. The resources for growth or recycling of organic material in Dublin City are low due to lack of open space and agricultural industry. The waste water treatment plants (WWTP) can make use of the organic waste being processed through anaerobic digestion, and there are currently two municipal WWTP in Dublin City producing energy this way.
Figure 38: Roof Space Solar Atlas, Denmark (Source: energyroof.dk/solaratlas-for-denmark)
Dublin City Spatial Energy Demand Analysis
59
The map in Figure 39 shows the suitability of land for miscanthus, oil seed, reed canary grass and willow growth. The purple area is all land which is unavailable, and there are some very small green and light green areas in the north of the City, near Finglas and in areas on the border with Fingal County. The green areas are deemed to have medium and high suitability for these types of energy crops. Although Dublin City does not have much capability to produce sources of bioenergy locally, there are many sources of bioenergy fuels within Ireland which can easily be imported. Currently, the biggest renewable energy source used in Dublin City is biomass. Biomass fired CHP units and boilers are widely used in commercial applications. There is a 2MW wood-pellet boiler in Dáil Eireann, and other biomass boilers are found mainly in hotel and leisure businesses. Because biomass can be used in boilers just like any other fuel, they can easily be incorporated into existing wet heating systems. Like oil, the fuel must also be delivered in bulk and stored, so the only limiting factor is storage space and delivery access. Even at a smaller scale, replacing open fires with wood burning or wood-pellet stoves will greatly increase efficiency and reduce costs and fossil fuel use. Wood logs are widely available and sold in many local grocery stores and petrol stations.
Heat Pumps and CHP Although not specifically renewable technologies and not always reliant on the local resources, both heat pumps and CHP plants can use renewable fuels and have much higher efficiencies than traditional alternatives. Heat pumps use a low grade heat source, such as that discussed earlier from shallow geothermal sources, and increase the temperature through a compressor, operating on the same principle as a refrigerator. Depending on the input temperature, the heat pump will produce 3 kWh of heat for every 1 kWh of electricity input (a coefficient of performance (COP) of 3). There are air, ground and water source heat pump technologies. Air source uses the ambient air temperature, ground source uses the solar heat emitted and stored in the earth, and water source uses solar heat stored in lake, river or sea water. Typically, ground and water sources will have a higher and steadier temperature than air source temperatures in winter, when heat is most required, and because of this will generally have higher seasonal performance factors. Air source heat pumps can be installed in any location, are relatively low-cost to install, and have gained popularity in households with low heating needs. They are often used in combination with CHP plants to extract useful heat from flue gases. Ground source heat pumps need either deep bore holes to be drilled vertically or lay horizontal
Figure 39: Biomass Production Suitability in Dublin City (Source: SEAI Bioenergy Mapping System)
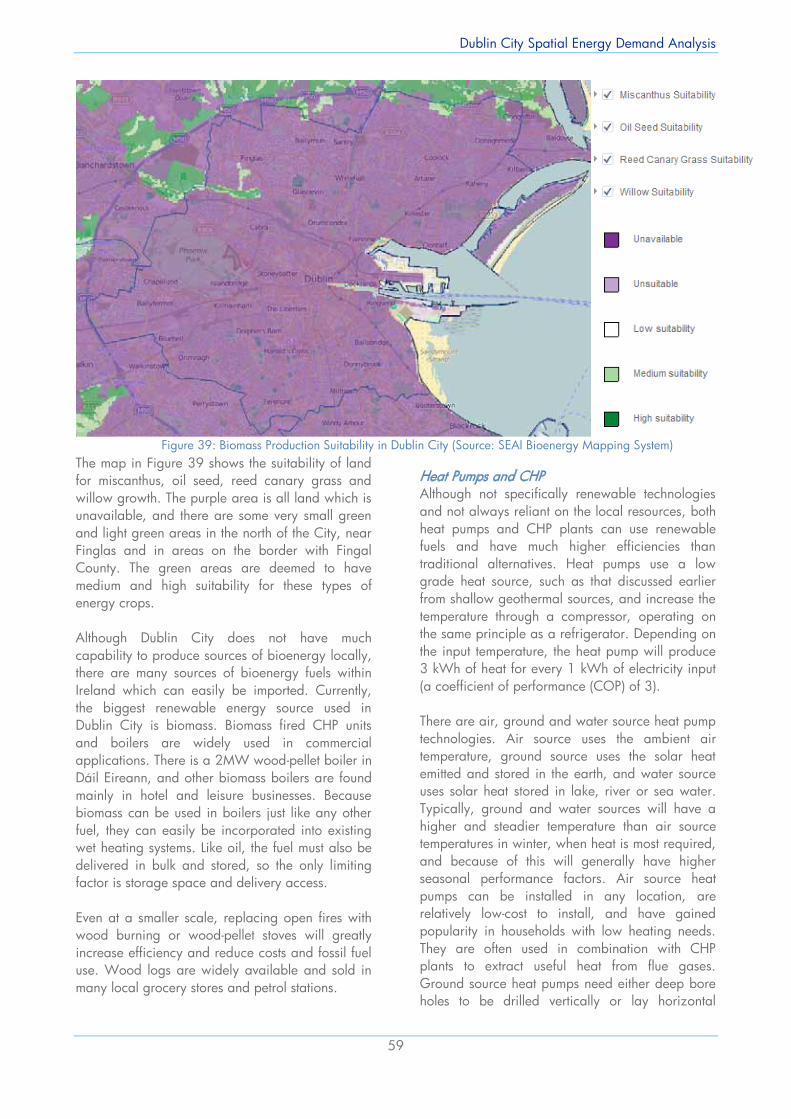
Dublin City Spatial Energy Demand Analysis
58
already been developed in other countries, such as that available in Denmark, an example of which can be seen in Figure 38. This map outlines each roof space and is colour coded to show if the roof is suitable or not suitable for solar PV. The costs of solar PV installations have fallen over the last ten years due to increased demand. In 2014, installation prices were at €1.03/watt, with the panels themselves costing €0.56/watt (ISEA, 2014). A 1m2 panel will have a max output rating of approximately 0.25 kWp, depending on cell type and manufacturer. As mentioned at the beginning of this chapter, there is no feed-in-tariff available for small renewable electricity generators, and therefore the installation should be sized to the daytime load in order that all energy is used within the building. This limits the size of installations in some cases, unless a battery system is installed to store the energy to use for night time demands, but this can add significantly to the costs.
Solar thermal collectors, which produce hot water rather than electricity, come in two types: flat plate and evacuated tube, where flat plate collectors are designed so they can be incorporated into the roof rather than being installed on the roof and the evacuated tubes are on-roof installations only. The tubes allow approximately 20% higher energy yield per m2 roof space than flat plate collectors. The heat is most often used for hot water demands, but is in some cases used for space heating where low temperature space heating is sufficient. A typical household installation will provide approximately 50-60% of the yearly hot water demand, depending on the roof space available. Around 1m2 of solar thermal collectors per person is a rough guide to the size of installation required
per household (SEAI, 2010). The SEAI estimate costs of between €800 and €1300 per m2, and they currently offer grants of €1,200 toward home solar heating installations. Solar thermal can be a more economical choice and a better use of roof space over solar PV for households with little or no daytime occupancy as the hot water will store in the insulated hot water tanks for use in mornings and evenings. Heating is one of the biggest reasons for fossil fuel use in buildings in Dublin City, and off-setting this energy with renewable sources would reduce this dependence and reduce costs for homeowners.
Bioenergy Resources Biomass is any organic material, like wood or plants, biofuels are liquid fuels made from the processing of biomass, and biogas is gas fuel extracted from the organic breakdown of biomass (anaerobic digestion). All energy derived from these sources is called bioenergy. Since organic material can be regrown, this energy is a form of
renewable energy. Like any other fuel, biomass, biogas and biofuels can be transported to be used in any location. For
sustainability reasons, the
bioenergy sources should be sourced as close to the point of use as possible in order to lower the life-cycle energy.
With Ireland’s large agricultural sector, there is a vast resource of farm waste that can be used for production of bioenergy. Rural areas are also ideal for growing bioenergy crops such as willow and miscanthus. The resources for growth or recycling of organic material in Dublin City are low due to lack of open space and agricultural industry. The waste water treatment plants (WWTP) can make use of the organic waste being processed through anaerobic digestion, and there are currently two municipal WWTP in Dublin City producing energy this way.
Figure 38: Roof Space Solar Atlas, Denmark (Source: energyroof.dk/solaratlas-for-denmark)
Dublin City Spatial Energy Demand Analysis
59
The map in Figure 39 shows the suitability of land for miscanthus, oil seed, reed canary grass and willow growth. The purple area is all land which is unavailable, and there are some very small green and light green areas in the north of the City, near Finglas and in areas on the border with Fingal County. The green areas are deemed to have medium and high suitability for these types of energy crops. Although Dublin City does not have much capability to produce sources of bioenergy locally, there are many sources of bioenergy fuels within Ireland which can easily be imported. Currently, the biggest renewable energy source used in Dublin City is biomass. Biomass fired CHP units and boilers are widely used in commercial applications. There is a 2MW wood-pellet boiler in Dáil Eireann, and other biomass boilers are found mainly in hotel and leisure businesses. Because biomass can be used in boilers just like any other fuel, they can easily be incorporated into existing wet heating systems. Like oil, the fuel must also be delivered in bulk and stored, so the only limiting factor is storage space and delivery access. Even at a smaller scale, replacing open fires with wood burning or wood-pellet stoves will greatly increase efficiency and reduce costs and fossil fuel use. Wood logs are widely available and sold in many local grocery stores and petrol stations.
Heat Pumps and CHP Although not specifically renewable technologies and not always reliant on the local resources, both heat pumps and CHP plants can use renewable fuels and have much higher efficiencies than traditional alternatives. Heat pumps use a low grade heat source, such as that discussed earlier from shallow geothermal sources, and increase the temperature through a compressor, operating on the same principle as a refrigerator. Depending on the input temperature, the heat pump will produce 3 kWh of heat for every 1 kWh of electricity input (a coefficient of performance (COP) of 3). There are air, ground and water source heat pump technologies. Air source uses the ambient air temperature, ground source uses the solar heat emitted and stored in the earth, and water source uses solar heat stored in lake, river or sea water. Typically, ground and water sources will have a higher and steadier temperature than air source temperatures in winter, when heat is most required, and because of this will generally have higher seasonal performance factors. Air source heat pumps can be installed in any location, are relatively low-cost to install, and have gained popularity in households with low heating needs. They are often used in combination with CHP plants to extract useful heat from flue gases. Ground source heat pumps need either deep bore holes to be drilled vertically or lay horizontal
Figure 39: Biomass Production Suitability in Dublin City (Source: SEAI Bioenergy Mapping System)
Dublin City Spatial Energy Demand Analysis
60
piping over a much larger space but at a much shallower level. The drilling of boreholes is a much more expensive installation, but can yield higher temperatures and may be the only option if there is no space for a horizontal pipe installation. Water source heat pumps will need a nearby or onsite water source which can be diverted for use in the heat pump and returned to the source. All heat pumps are run on electricity, and the costs should be weighed up and compared to other renewable heating solutions with low or no running costs. Heat pumps are best suited to low-energy housing and in combination with other renewable solutions like solar thermal. CHP plants are a highly efficient power production plant, which utilises the heat produced in the process of electrical generation. In traditional electricity generation, the efficiencies are as low 40%, with much of the energy lost in the form of waste heat. By utilising this waste heat, CHP units can achieve efficiencies of more than 80%. In order for this to be a suitable energy solution, there needs to be a heating demand as well an electrical demand at the same or a nearby location. A CHP plant will produce nearly twice as many kWh of heat as electricity. CHP units are commonly found in hotels and leisure centres as these facilities have both electricity and heat demands onsite. CHP units are ideal production units for DH systems as they can offset the cost of heat production by selling the electricity to the grid. There are currently incentives and feed-in tariffs supporting high efficiency and renewable CHP.
The renewable resources outlined above give an idea of the types of resources available in Dublin City and an indication of how suitable each technology is in this area. Reducing demand through energy efficiency is always a priority, and only then should the use of renewable resources be considered to meet remaining energy demand. Waste heat is not a renewable source, but is a source of heat which is currently lost to atmosphere and its potential to be utilised has not yet been fully explored. A full assessment of the heat currently going to waste from industrial and manufacturing processes in the city is recommended.
Dublin City Spatial Energy Demand Analysis
61
Conclusion This SEDA has identified the location of electricity and heat demands throughout the city. This gives the city planners the tools to become involved in how Dublin City uses energy in the future and begin to integrate energy planning and spatial planning practices. The SEDA builds on from the Dublin City SEAP and for the first time has been able to identify specific priority locations for energy efficiency and sustainable energy solutions. This enables a more efficient and direct approach to implementing energy action plans. In the residential sector, areas with the highest energy use have been identified, and also, importantly, areas most at risk of energy poverty. Targeting these areas first puts Dublin City on the path to effectively reducing the energy demand in the residential sector, which is the largest energy consuming sector in the city. Residential areas which have high levels of electricity and electrical heating consumption can be targeted for upgrades to high-efficiency electrical heating systems and renewable electricity sources to offset their use. Areas that are an ideal match for DH systems are highlighted through the mapping of heat demand densities. The areas of highest heat densities are the strongest candidates for first phase development of a city-wide DH system which would drastically and effectively lower the cities energy demand and fossil fuel use in the heating sector. The potential anchor loads and sources identified could be key stakeholders in the development of such systems. Clusters of large commercial sector energy users identified can work together to reduce their energy demands and costs through projects which can capitalise on economies of scale. Creation of commercial sector energy groups or cooperatives can create knowledge sharing and help realise ambitious energy projects which may not be as economical or practical on an individual SME level. This SEDA can now be built upon to create a strategic evidence-based energy plan for the city, which outlines a number of energy mix scenarios for the city based on evidence gathered on demand and resources. Further analysis of
potential local sustainable resources is recommended so these energy resources can begin to be quantified and located, and then best matched with the demands already identified. Quantifying large sources of industrial waste heat should be prioritised in this resource analysis, as it is potentially a very low cost heat source which is currently going to waste. With solar PV being a very suitable RE source in an urban landscape like Dublin City which is not particularly suited to some other developed RE sources, mapping and quantifying the solar resource space available is also a priority in terms of local RE electricity production. Location of planned future developments and their estimated energy use should be analysed further as these developments can be used to influence the energy use of existing surrounding buildings, particularly through shared heating systems.
Dublin City Spatial Energy Demand Analysis
62
Works Cited Chittum, A., & Ostergaard, P. A. (2014). How
Danish Communal Heat Planning Empowers Municipalities and Benefits Individual Consumers. Energy Policy Vol.74, 465-474.
CIBSE. (2008). Energy Benchmarks TM46: 2008. London: CIBSE Publications.
CIBSE. (2012). Guide F: Energy Efficiency in Buildings (3rd ed.). London: CIBSE Publications.
Codema. (2013). Renewable Energy in Dublin: Market Assessment. Dublin: Codema.
Connolly, D., Vad Mathiesen, B., Lund, H., Moller, B., Hvelplund, F., Sperling, K., et al. (2014). Heat Roadmap Europe; Inputs for Technical Modelling and Policy Recommendations. Aalborg: Aalborg University.
Danish Energy Agency. (n.d.). District Heating - Danish and Chinese Experience. Retrieved July 27, 2015, from www.ens.dk: www.ens.dk/sites/ens.../district_heating_danish-chinese_experiences.pdf
DCENR. (January 2015). Towards a New Affordable Energy Strategy for Ireland. Dublin: Department of Communications Energy and Natural Resources.
ESB. (2015). Connect a Micro-Generator. Retrieved March 18, 2015, from www.esb.ie: http://www.esb.ie/esbnetworks/en/generator-connections/micro_gen_connections.jsp
Eurostat. (2014). Electricity prices for domestic consumers, from 2007 onwards - bi-annual data. Retrieved December 17th, 2014, from eurostat.eu: http://appsso.eurostat.ec.europa.eu/nui/submitViewTableAction.do
eurostat. (2015, May 7). Electricity prices for domestic consumers - bi-annual data (from 2007 onwards). Retrieved July 8, 2015, from eurostat Your Key to European Statistics: http://ec.europa.eu/eurostat/data/database
Gartland, D. (2013). Dublin City Sustanable Energy Action Plan; Monitoring and Progress Report 2014. Dublin: Codema.
GSI . (2015). Ground Source Heat & Shallow Geothermal Energy - Homeowner Manual. Dublin: Geological Survey of Ireland.
IPCC. (2007). IPCC Fourth Assessment Report: Climate Change 2007 Synthesis Report. Intergovernmental Panel on Climate Change.
ISEA. (2014). ISEA Submisison to Green Paper on Energy Policy in Ireland. Irish Solar Energy Association.
Pasqualetti, M. J. (2013). Reading the Changing Energy Landscape. In S. Stremke, & A. v. Dobbelsteen, Sustainable Energy Landscapes: Designing, Planning and Development (pp. 11-44). Florida: CRC Press.
Ranhagen, U. (2011). Suatainable Municipality- 4 big leaps and 20 small steps. Swedish Energy Agency.
SEAI. (2004). Geothermal Mapping System. Retrieved March 2015, from SEAI Geothermal Mapping System: http://maps.seai.ie/geothermal/
SEAI. (2010). Domestic Solar Systems for Hot Water: A Consumer Guide. Dublin: SEAI.
SEAI. (2010). Solar Thermal Information and Resources. Retrieved March 2015, from www.seai.ie: http://www.seai.ie/Renewables/Solar_Energy/Solar_Information_Resources/Solar_Thermal/
SEAI. (2013 (b)). Energy in the Residential Sector: 2013 Report. Dublin: SEAI.
Sperling, K., Hvelplund, F., & Mathiesen, B. (2011). Centralisation and Decentralisation in Strategic Municipal Energy Planning in Denmark. Energy Policy Vol.39, 1338-1351.
Stoeglehner, G., Niemetz, N., & Kettl, K.-H. (2011). Spatial Dimensions of Sustainable Enrgy Systems: New Visions for Integrated Spatial and Energy Planning. Energy, Sustainability and Society, 1(2).
The Royal Society & The US National Academy of Sciences. (2014). Climate Change: Evidence & Causes. The Royal Society & The US National Academy of Sciences.
Dublin City Spatial Energy Demand Analysis
63
Author
Donna Gartland Strategic Sustainable Energy Planner
Ms Donna Gartland holds a Master of Science (MSc) Degree in Sustainable Energy Planning and Management from Aalborg University, Denmark. She previously completed a Bachelor of Engineering Degree (BEng) in Energy and Environmental Engineering from the Institute of Technology Tallaght, and is a qualified Electrician. Her areas of expertise include regional energy demand analysis, local level energy planning, district heating system analysis and energy system modelling.
Acknowledgements Codema would like to thank the Central Statistics Office, the Valuation Office and the Dublin City Council Planning Department for the invaluable data they provided for the completion of this work.
Dublin City Spatial Energy Demand Analysis
64
Appendix
Figure 40: Electoral Districts in Dublin City
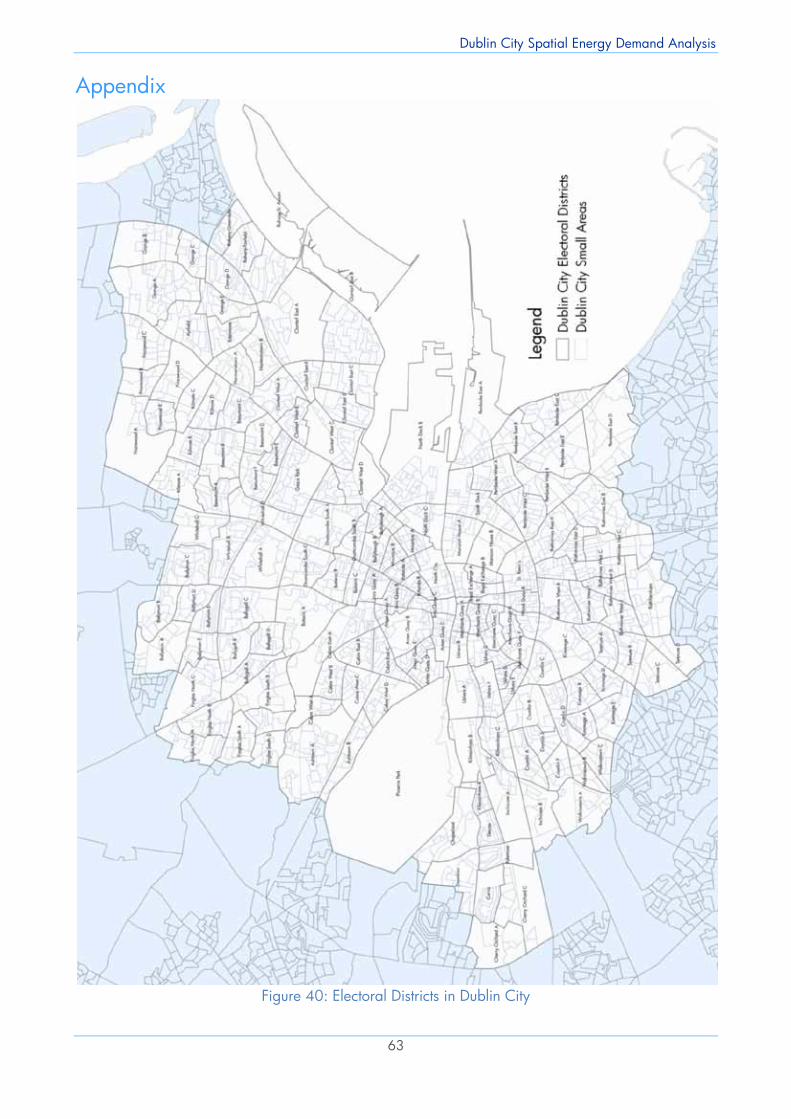
Dublin City Spatial Energy Demand Analysis
64
Appendix
Figure 40: Electoral Districts in Dublin City
Dublin City Spatial Energy Demand Analysis
63
Author
Donna Gartland Strategic Sustainable Energy Planner
Ms Donna Gartland holds a Master of Science (MSc) Degree in Sustainable Energy Planning and Management from Aalborg University, Denmark. She previously completed a Bachelor of Engineering Degree (BEng) in Energy and Environmental Engineering from the Institute of Technology Tallaght, and is a qualified Electrician. Her areas of expertise include regional energy demand analysis, local level energy planning, district heating system analysis and energy system modelling.
Acknowledgements Codema would like to thank the Central Statistics Office, the Valuation Office and the Dublin City Council Planning Department for the invaluable data they provided for the completion of this work.

Dublin City Spatial Energy Demand Analysis
64
Appendix
Figure 40: Electoral Districts in Dublin City
Dublin City Spatial Energy Demand Analysis
63
Author
Donna Gartland Strategic Sustainable Energy Planner
Ms Donna Gartland holds a Master of Science (MSc) Degree in Sustainable Energy Planning and Management from Aalborg University, Denmark. She previously completed a Bachelor of Engineering Degree (BEng) in Energy and Environmental Engineering from the Institute of Technology Tallaght, and is a qualified Electrician. Her areas of expertise include regional energy demand analysis, local level energy planning, district heating system analysis and energy system modelling.
Acknowledgements Codema would like to thank the Central Statistics Office, the Valuation Office and the Dublin City Council Planning Department for the invaluable data they provided for the completion of this work.

www.codema.ie
Top Related