


Languages
Pages
Legal

FOR THE FISCAL YEAR ENDED JUNE 30, 20177030 COFFMAN ROAD • DUBLIN, OHIO
DUBLIN CITY SCHOOL DISTRICTCOMPREHENSIVE ANNUAL FINANCIAL REPORT

Comprehensive Annual Financial Report
Dublin City School District Dublin, Ohio
Fiscal Year Ended June 30, 2017
Board of Education
Lynn B. May, President
Scott W. Melody, Vice President
Stu W. Harris, Member
Chris M. Valentine, Member
Rick L. Weininger, Member
Issued by the Treasurer’s Office
Chris McDowell, Fiscal Coordinator
Tyson Hodges, Assistant Treasurer
Brian Kern, Treasurer/CFO
i

Dublin City School District Board Of Education
Lynn B. May President
Scott W. Melody Vice President
Stu W. Harris Member
Chris M. Valentine Member
Rick L. Weininger Member
Dr. Todd Hoadley Superintendent
Brian Kern Treasurer/CFO
ii
Dublin City School District, Ohio
Comprehensive Annual Financial Report
For the Fiscal Year Ended June 30, 2017
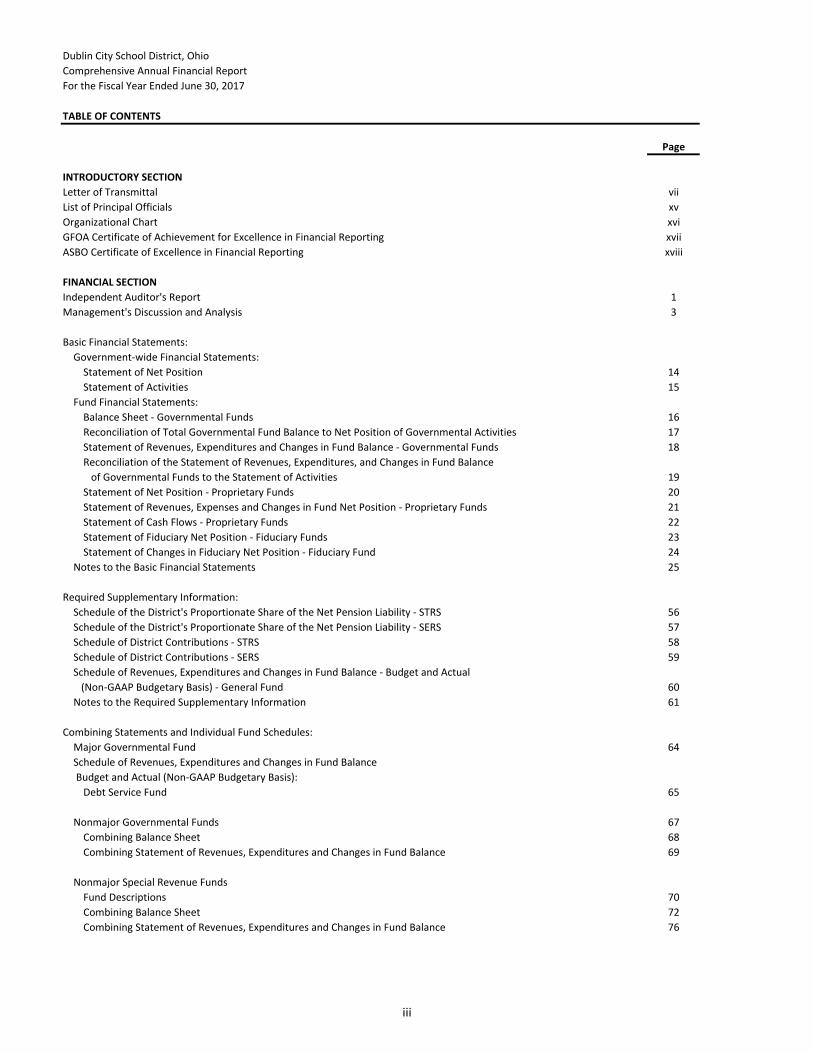
TABLE OF CONTENTS
Page
INTRODUCTORY SECTION
Letter of Transmittal vii
List of Principal Officials xv
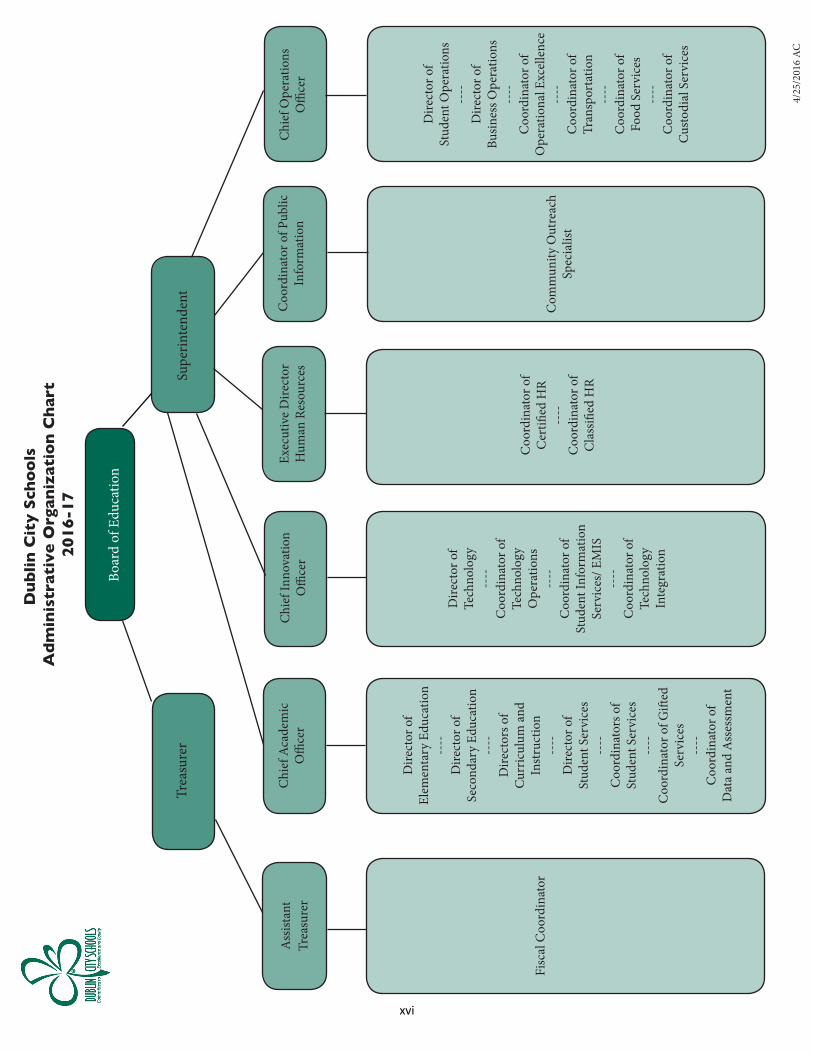
Organizational Chart xvi
GFOA Certificate of Achievement for Excellence in Financial Reporting xvii
ASBO Certificate of Excellence in Financial Reporting xviii
FINANCIAL SECTION
Independent Auditor's Report 1
Management's Discussion and Analysis 3
Basic Financial Statements:
Government-wide Financial Statements:
Statement of Net Position 14
Statement of Activities 15
Fund Financial Statements:
Balance Sheet - Governmental Funds 16
Reconciliation of Total Governmental Fund Balance to Net Position of Governmental Activities 17
Statement of Revenues, Expenditures and Changes in Fund Balance - Governmental Funds 18
Reconciliation of the Statement of Revenues, Expenditures, and Changes in Fund Balance
of Governmental Funds to the Statement of Activities 19
Statement of Net Position - Proprietary Funds 20
Statement of Revenues, Expenses and Changes in Fund Net Position - Proprietary Funds 21
Statement of Cash Flows - Proprietary Funds 22
Statement of Fiduciary Net Position - Fiduciary Funds 23
Statement of Changes in Fiduciary Net Position - Fiduciary Fund 24
Notes to the Basic Financial Statements 25
Required Supplementary Information:
Schedule of the District's Proportionate Share of the Net Pension Liability - STRS 56
Schedule of the District's Proportionate Share of the Net Pension Liability - SERS 57
Schedule of District Contributions - STRS 58
Schedule of District Contributions - SERS 59
Schedule of Revenues, Expenditures and Changes in Fund Balance - Budget and Actual
(Non-GAAP Budgetary Basis) - General Fund 60
Notes to the Required Supplementary Information 61
Combining Statements and Individual Fund Schedules:
Major Governmental Fund 64
Schedule of Revenues, Expenditures and Changes in Fund Balance
Budget and Actual (Non-GAAP Budgetary Basis):
Debt Service Fund 65
Nonmajor Governmental Funds 67
Combining Balance Sheet 68
Combining Statement of Revenues, Expenditures and Changes in Fund Balance 69
Nonmajor Special Revenue Funds
Fund Descriptions 70
Combining Balance Sheet 72
Combining Statement of Revenues, Expenditures and Changes in Fund Balance 76
iii
Dublin City School District, Ohio
Comprehensive Annual Financial Report
For the Fiscal Year Ended June 30, 2017
TABLE OF CONTENTS
Page
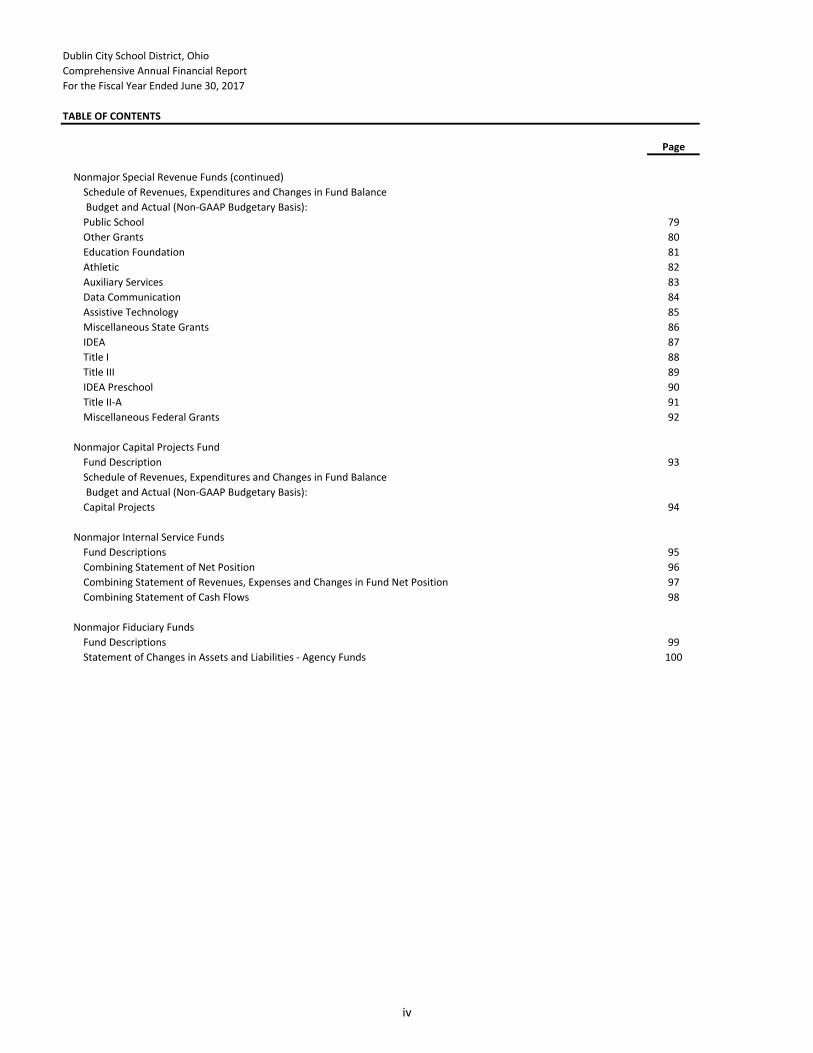
Nonmajor Special Revenue Funds (continued)
Schedule of Revenues, Expenditures and Changes in Fund Balance
Budget and Actual (Non-GAAP Budgetary Basis):
Public School 79
Other Grants 80
Education Foundation 81
Athletic 82
Auxiliary Services 83
Data Communication 84
Assistive Technology 85
Miscellaneous State Grants 86
IDEA 87
Title I 88
Title III 89
IDEA Preschool 90
Title II-A 91
Miscellaneous Federal Grants 92
Nonmajor Capital Projects Fund
Fund Description 93
Schedule of Revenues, Expenditures and Changes in Fund Balance
Budget and Actual (Non-GAAP Budgetary Basis):
Capital Projects 94
Nonmajor Internal Service Funds
Fund Descriptions 95
Combining Statement of Net Position 96
Combining Statement of Revenues, Expenses and Changes in Fund Net Position 97
Combining Statement of Cash Flows 98
Nonmajor Fiduciary Funds
Fund Descriptions 99
Statement of Changes in Assets and Liabilities - Agency Funds 100
iv
Dublin City School District, Ohio
Comprehensive Annual Financial Report
For the Fiscal Year Ended June 30, 2017
TABLE OF CONTENTS
Schedule Page
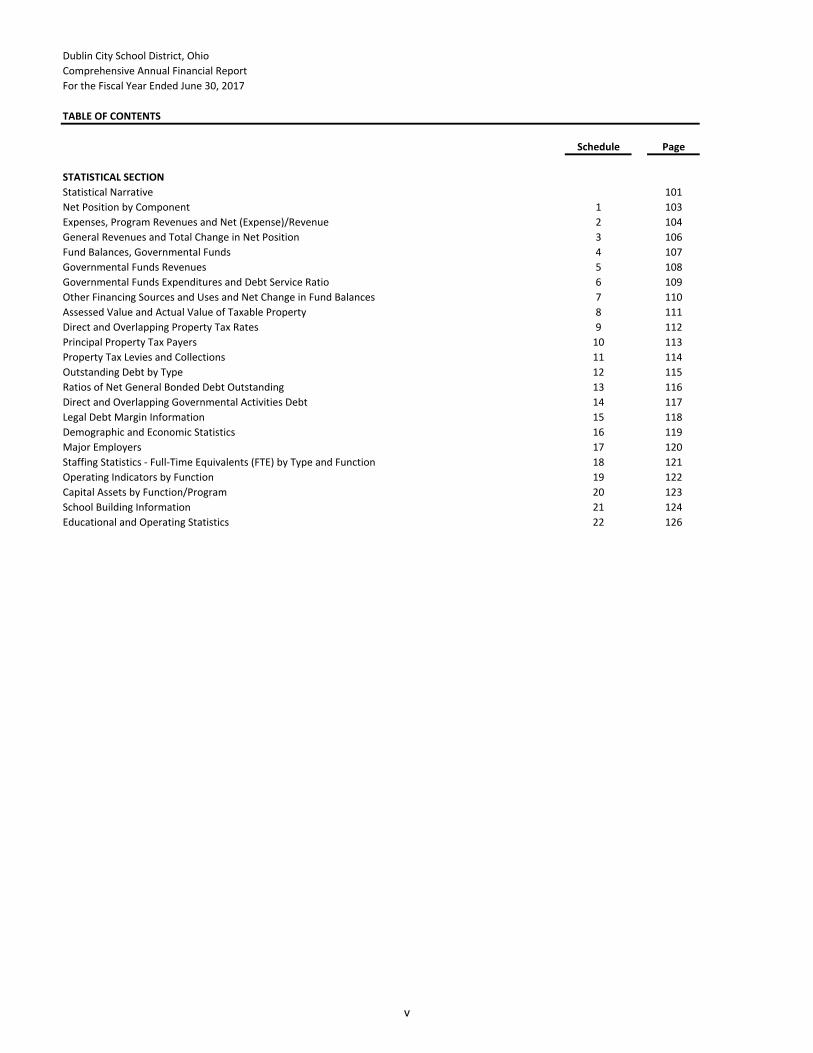
STATISTICAL SECTION
Statistical Narrative 101
Net Position by Component 1 103
Expenses, Program Revenues and Net (Expense)/Revenue 2 104
General Revenues and Total Change in Net Position 3 106
Fund Balances, Governmental Funds 4 107
Governmental Funds Revenues 5 108
Governmental Funds Expenditures and Debt Service Ratio 6 109
Other Financing Sources and Uses and Net Change in Fund Balances 7 110
Assessed Value and Actual Value of Taxable Property 8 111
Direct and Overlapping Property Tax Rates 9 112
Principal Property Tax Payers 10 113
Property Tax Levies and Collections 11 114
Outstanding Debt by Type 12 115
Ratios of Net General Bonded Debt Outstanding 13 116
Direct and Overlapping Governmental Activities Debt 14 117
Legal Debt Margin Information 15 118
Demographic and Economic Statistics 16 119
Major Employers 17 120
Staffing Statistics - Full-Time Equivalents (FTE) by Type and Function 18 121
Operating Indicators by Function 19 122
Capital Assets by Function/Program 20 123
School Building Information 21 124
Educational and Operating Statistics 22 126
v

vi
INTRODUCTORY SECTION
Office of the Treasurer
Dublin City Schools (614) 764-5913
7030 Coffman Road (614) 761-5856 (Fax)
Dublin, Ohio 43017-1068 www.dublinschools.net
December 28, 2017
To the Citizens and Board of Education of the Dublin City School District:
The Comprehensive Annual Financial Report (CAFR) of the Dublin City School District (District) for the
fiscal year ended June 30, 2017, is hereby submitted. This report was prepared by the Treasurer’s
Office, and includes the unmodified opinion of our independent auditors, Plattenburg & Associates, Inc.
Responsibility for both the accuracy of the data, and the completeness and fairness of the presentation,
including all disclosures, rests with the District. To the best of our knowledge and belief, the enclosed
data is accurate in all material respects and is reported in a manner designed to present fairly the
financial position and results of operations of the various funds of the District. All disclosures necessary
to enable the reader to gain an understanding of the District’s financial activities have been included.
The CAFR for the year ended June 30, 2017, is prepared in accordance with generally accepted
accounting principles (GAAP) and in conformance with standards of financial reporting established by
the Governmental Accounting Standards Board (GASB) using guidelines recommended by the
Government Finance Officers Association of the United States and Canada (GFOA).
GAAP requires that management provide a narrative introduction, overview, and analysis to accompany
the basic financial statements in the form of Management’s Discussion and Analysis (MD&A). The letter
of transmittal is designed to complement MD&A and should be read in conjunction with it. The
District’s MD&A can be found immediately following the independent auditor’s report.
Copies of this report will be widely distributed throughout the District, and an electronic copy will be
placed on the District website. A copy will be sent to all school buildings, the Chamber of Commerce,
major taxpayers, Dublin Public Library, Moody’s and Standard and Poor’s Financial Rating Services,
banks, the District’s Business Advisory Council, and any other interested parties.
This report includes all funds of the District. The District provides a full range of traditional and
nontraditional educational programs and services. These include elementary and secondary curriculum
offerings at the general, college preparatory and vocational levels; a broad range of co-curricular and
extracurricular activities; adult and community education offerings; and special education programs and
facilities.
In addition to providing these general activities, the District has administrative responsibility for state
funds distributed to private schools located within the district boundaries; therefore in accordance with
GASB Statement 24, this responsibility is included in the reporting entity as a special revenue fund. The
private schools served are St. Brigid’s of Kildare, Tree of Life Christian, and Linworth Children’s Center.
While these organizations share operational and service similarity with the District, all are separate and
distinct entities. Because of their independent nature, none of these organization’s financial statements
are included in this report.
vii
THE DISTRICT AND ITS FACILITIES
The District serves an area of approximately 47 square miles in and around the City of Dublin. It is
located in Franklin, Delaware and Union Counties, approximately 16 miles north and northwest of
downtown Columbus, the state capital. The Dublin City School District is a steadily growing suburban
district. Nearly 100% of the City of Dublin is located within the school district. Dublin’s population in
1970 was 681 residents. From the 2010 census, according to U.S. Census Bureau estimates, Dublin’s
population had grown to 41,751. The school district population is considerably larger, estimated at
80,196.
Because of the growth of Dublin and the surrounding area, this year marks the 39th consecutive year
that the District’s enrollment has increased. The District had an estimated enrollment of 15,866
students for fiscal year end June 30, 2017, compared to 15,579 students for the fiscal year that ended
June 30, 2016. The district estimates enrollment to be 16,330, 17,592 and 19,486 for the fiscal years
ended June 30, 2018, 2021, and 2026, respectively. The District’s enrollment figures do not include
students living within the District’s attendance area who attend charter schools. Currently, the District
has 192 students attending 22 different charter schools.
The District’s facilities include 12 neighborhood elementary schools, 4 middle schools (Grades 6 to 8), 3
comprehensive high schools (Grades 9 to 12), a digital learning center, a maintenance building, a bus
garage, the 1919 Building, an administration building, and several athletic fields. The age of buildings
varies with the oldest built in 1919 and the latest Glacier Ridge Elementary which opened fall 2006. Of
the District’s 24 buildings, 19 have been built since 1980 of which 8 have opened since 1994.
ECONOMIC CONDITION AND OUTLOOK
Ohio’s seasonally adjusted unemployment rate increased to 5.0% in June 2017 compared to 4.9% in
June 2016 while the nation’s unemployment rate for June 2017 was 4.4%. Additionally, June 2017
employment in the state of Ohio numbered 5,492,000 (Ohio Labor Market Information, June 2017, Ohio
Department of Job and Family Services). Specific employment figures for the Dublin City School District
are not available but for Franklin County the June 2017 figure was 652,100 as compared to the June
2016 figure of 640,200. This resulted in the unemployment rates for Franklin County of 4.4% in June
2017 compared to 4.2% in June 2016 (Ohio Department of Job and Family Services website).
Dublin’s employment is dominated by the service industry with the corporate headquarters of the IGS
Energy (Natural Gas Retailer), Online Computer Library Center (OCLC), Cardinal Health (healthcare
services), Ashland Chemical (research and office headquarters), CareWorks Family of Companies
(insurance and financial), NCO Financial Group (financial institutions), City of Dublin (government) and
Wendy’s International (fast food restaurants) ranking among the highest in local employment. Dublin
markets itself to the service industry and as a home for the corporate headquarters of businesses.
Additionally, the city is the home to numerous R & D companies, telecommunications, health care
providers, insurance & financial, and high-tech manufacturing businesses.
While economic growth both nationally and locally has been slow over the last several years, Dublin has
remained a desirable location for commerce and industry. Continued economic growth and expansion
are anticipated and increases to the District’s commercial tax base are expected. The District has an
excellent relationship with the City of Dublin, which assures that development projects selected by the
City are also highly desirable for the School District. When the City of Dublin uses an inducement to
viii
attract a business, which is not a common practice, it uses Tax Increment Financing. Through
negotiations with the City, the District is reimbursed for property taxes it would have otherwise
collected through an income tax sharing agreement with the City of Dublin. One example of cooperative
relationship the District and City practices is the Bridge Street Cooperative Agreement that was
negotiated in the spring of 2014. The District will continue to work with the City of Dublin to attract
desirable development to the community.
ORGANIZATION OF THE DISTRICT
The Board of Education of the Dublin City School District (the Board) is a five-member body politic and
corporate, as defined by Section 3313.02, Ohio Revised Code. The Board serves as the taxing authority,
contracting body, policy maker, and ensures that all other general laws of the State of Ohio are followed
in the expenditure of the District’s tax dollars, and approves the annual appropriation resolution and tax
budget.
The Board members represent a cross section of professions found in Dublin. The Board members on
June 30, 2017, were as follows:
Board Member Began Expires
Lynn May 01/01/06 12/31/17 Business Office Manager, Dublin Spring Hospital
Scott Melody 01/01/08 12/31/19 IT Manager, Express
Stuart Harris 01/01/06 12/31/17 Assistant General Counsel, Nationwide Insurance
Chris Valentine 01/01/04 12/31/19 Small Business Owner
Rick Weininger 01/01/14 12/31/17 Retired School Administrator
The Superintendent is the chief executive officer of the District, responsible directly to the Board of
Education for all educational and support operations. Dr. Hoadley began his tenure with Dublin City
Schools on August 1, 2013. He brings fifteen years of experience as a superintendent to the position.
Dr. Hoadley came to the district from Olmsted Falls City Schools where he had been the superintendent
for nine years. He served as the Van Buren Local Schools Superintendent for six years prior to his
position with Olmsted Falls. Dr. Hoadley’s career in education began in 1990 when he became a math
teacher and coach at Van Buren. In 1995, his administrative career began when he became a Junior
High/High School Principal. He earned his Ph. D. in Educational Administration and Supervision from
Bowling Green State University. He also holds a Masters of Business in Operational Excellence from the
Fisher College of Business from The Ohio State University. Dr. Hoadley sits on the Governing Board of
the Buckeye Association of School Administrators and the American Association of School
Administrators. He is also a member of the Alliance for Adequate School Funding, Mid-American
Association of School Superintendents, and Midwest Association of School Superintendents.
The Treasurer is the chief financial officer of the District, responsible directly to the Board of Education
for maintaining all financial records, issuing all payments, maintaining custody of all District funds and
assets, and investing idle funds as specified by Ohio Law. Brian Kern returned to Dublin City Schools and
was appointed as Treasurer on September 1, 2016. Prior to returning to Dublin City Schools, Brian
served as the treasurer for Olentangy Local School District from 2013-2016. He worked for the Dublin
ix
City Schools Finance Department for 10 years. He served as an accountant from 2003-2007, and as
assistant treasurer under past Dublin City Schools Treasurer Stephen Osborne from 2007 to 2013. Brian
worked for the Auditor of State of Ohio from 1996-2001, serving as Assistant Auditor and Auditor in
Charge.
He has private sector experience as a Senior Auditor with Haran, Watson & Company Inc. He served as
an Ohio Association of School Business Officials officer from 2009-2013. He holds a B.S. in Accounting
and Public Administration from Heidelberg College.
LONG-TERM FINANCIAL PLANNING
The current financial forecast for the General Fund operations over the next five years demonstrates
that the ending unrestricted balance at the end of fiscal year 2018 is projected at $64,868,342 with
positive balances until the end of fiscal year 2021.
The District utilizes a five-year forecasting model to monitor the District’s financial health and
implement appropriate actions to maintain a positive cash balance. The District’s diminishing balance
reflects the challenge of Ohio school district financing. The current biennium budget, which covers fiscal
years 2018 and 2019, contained funding increases for each fiscal year compared to fiscal year 2017.
EMPLOYEE RELATIONS
The District currently has approximately 1,890 full-time and part-time employees. There are two
organizations representing District employees. The Dublin Educators’ Association (DEA) represents
certificated employees, including teachers and educational specialists, for collective bargaining
purposes. Classified employees; including bus drivers, cooks, and clerical staff, are represented for
collective bargaining purposes by the Dublin Support Association (DSA.) During the spring of 2017, the
Board successfully concluded negotiations with both labor organizations on a multi-year agreement, for
wages and fringe benefits. The Dublin Educator’s Association’s wage agreement for the period August 1,
2017, through July 31, 2020, includes raises of 2.00%, 2.10%, and 2.15%, effective each August 1st for
fiscal years 2018, 2019, and 2020, respectively. The Dublin Support Association’s wage agreement for
the period July 1, 2017, through June 30, 2020, includes raises of 2.00%, 2.10%, and 2.15%, effective
each July 1st for fiscal years 2018, 2019, and 2020, respectively.
SERVICES PROVIDED
The District provides a wide variety of educational and support services as mandated by the Ohio
Revised Code or Board directives. During the 2016-2017 fiscal year the District’s fleet of 146 buses
traveled approximately 9,000 miles each day providing transportation services to approximately 8,140
public and 600 private and parochial students. Many of the District’s students walk to school because of
the proximity of neighborhood schools to student population centers. The Food Service Department
serves over 9,800 meals daily for a total of about 1,710,630 meals annually through the District’s
lunchrooms.
In addition to transportation and school lunch support services offered to children in the District, they
also receive guidance, psychological, and health services free of charge. The guidance services are
designed to help a student match her/his natural skills with vocational and/or academic programs to
help her/him achieve her/his full potential in life. Psychological services offer a wide variety of help to
x

students ranging from early developmentally handicapped identification to drug and behavior
counseling. Health services provide limited medical services free of charge to many of Dublin’s youths.
At the center of the District’s services are the instructional programs. The District offers regular
instructional programs daily to students in Grades K to 12. The District serves approximately 315
students with an interest in vocational education, and approximately 1,842 children who need individual
instruction, or who are physically or mentally handicapped. These students receive service through the
wide array of special education programs offered in the District. Overall, the District issued 1,170
diplomas in 2017.
Finally, there are several academic and athletic programs for students, providing them with a number of
enriching experiences. The programs and activities provide a lifetime of memories for Dublin’s students.
MAJOR INITIATIVES AND EVENTS - FISCAL YEAR 2017
ACADEMIC PATHWAYS
The goal of the District was to start and expand on current academic pathways and alternatives that
may lead career field choices and college majors, but also other post graduate options other than
college prep. This could include certifications earned in high school that lead to direct job placement
post graduation. The District currently has several academies and pathways including biomedical,
technology, business, and engineering.
DRUG EPIDEMIC
Dublin City Schools is not immune to the nation epidemic of drug abuse and the opioid crisis. In the fall,
the District hosted a summit for the community bringing in local leaders in the fight against this crisis
including law enforcement, medical, faith based, etc. The District has added additional staff and
resources to help our students and families deal with this terrible problem.
BRIDGE STREET COOPERATIVE AGREEMENT
In the spring of 2014, the District and the City of Dublin negotiated a cooperative agreement, which will
provide a predictable annual income stream to the Dublin City School District dedicated for strategic
investments in technology advancements. It also provides the City of Dublin with the ability to
implement the vision of the Bridge Street District by providing long-term financing tools for the public
infrastructure improvements necessary to create the vibrant, more densely developed, walkable
neighborhoods in the Bridge Street District. As part of the agreement, the City of Dublin will pay Dublin
City Schools $1.5 million dollars per year over the next 33 years for a total of $50 million to advance the
school district’s strategic technology plans as well as 10% of additional tax revenues for years 16-30 on
all Tax Increment Financing (TIF) granted. In exchange for the set annual payment, the City may
authorize TIF’s and other real property tax exemptions within the Bridge Street District in order to help
underwrite the costs of the District’s needed infrastructure.
Pursuant to Section 1(c)(ii) of Bridge Street District agreement; no later than October 31 of each year of
the agreement, the City is required to reasonably determine the aggregate square footage of new
construction within the District that would be treated as an improvement and exempted from real
property taxation pursuant to an Ordinance. The parties agree that if the City reasonably determines
that the aggregate assessed valuation of that square footage does not equal at least $24.5 million, then
the payments required pursuant to Sections 1(s) and 1(b) of the agreement (and mentioned in the
xi
paragraph above), shall be modified. The City hit the benchmark for the fiscal year ended June 30, 2017,
as such no modification to the annual payment of $1.5 million will be recommended.
MAJOR INITIATIVES FOR THE FUTURE
The District has numerous programs on the agenda to be pursued in future years. These programs
include the following:
MASTER PLANNING
A wide-ranging committee, including Board members, Lead Principals from the K-12 levels,
Administrators and Parents was created with the objective to develop a plan to accommodate the
student growth in our district and also how to protect and preserve the enormous investment the
community has already made in the current facilities at future markers of three years, five years, seven
years and ten years out. The committee met numerous times throughout the 2016-2017 school year.
This committee developed recommendations including two new elementary schools, a new middle
school, and high school additions. A similar smaller committee of district administrators reconvened in
the fall of 2017 to recommend clarity on timing of when new buildings should open and how to finance
the cost of new construction and maintaining our current facilities. The recommendation of this new
committee was to build and have open the two new elementaries in the fall of 2020, new middle school
fall of 2021, and high school addition fall of 2022. This would require the District to go on the ballot in
November 2018 for a no new millage bond issue, permanent improvement levy, and operating levy. The
bond issue and permanent improvement levy would fund the new construction and maintain the
current District facilities. The operating levy would help fund the new staff needed to open the new
buildings and to handle the additional costs associated with the District’s growing enrollment.
FINANCIAL INFORMATION
Internal Controls The management of the District is responsible for establishing and maintaining
an internal control structure designed to ensure that the assets of the District are protected from loss,
theft or misuse, and to ensure that adequate accounting data are compiled to allow for the preparation
of financial statements in conformity with generally accepted accounting principles. The internal control
structure is designed to provide reasonable, but not absolute, assurance that these objectives are met.
The concept of “reasonable assurance” recognizes that: (1) the cost of a control should not exceed the
benefits likely to be derived from its implementation; and (2) the valuation of cost and benefits requires
estimates and judgments by management. Management believes the internal controls adequately meet
the above objectives.
Budgetary Controls In addition, the District maintains budgetary controls. The objective of these
budgetary controls is to ensure compliance with legal provisions embodied in the annual appropriation
resolution approved by the Board of Education. Activities of all funds are included in the annual
appropriation resolution. The level of budgetary control (that is, the level at which expenditures cannot
legally exceed the appropriated amount) is established by function and object of expenditure within the
general fund and at the fund level for all other funds. The District also maintains an encumbrance
accounting system as one technique of accomplishing budgetary control. Unencumbered amounts lapse
at year end. As demonstrated by the statements and schedules included in the financial section of this
report, the District continues to meet its responsibility for sound financial management.
xii
OTHER INFORMATION
Awards:
Certificate of Achievement
The Government Finance Officers Association of the United States and Canada (GFOA) awarded a
Certificate of Achievement for Excellence in Financial Reporting to the Dublin City School District for its
Comprehensive Annual Financial Report for the fiscal year ended June 30, 2016.
In order to be awarded a Certificate of Achievement, a government must publish an easily readable and
efficiently organized comprehensive annual financial report. This report must satisfy both generally
accepted accounting principles and applicable legal requirements.
A Certificate of Achievement is valid for a period of one year only. We believe that our current
comprehensive annual financial report continues to meet the Certificate of Achievement Program’s
requirements, and we are submitting it to the GFOA to determine its eligibility for another certificate.
ASBO Certificate of Excellence
The District also received the Association of School Business Officials International (ASBO) Certificate of
Excellence on Financial Reporting award for the fiscal year ended June 30, 2016. This award certifies
that the Comprehensive Annual Financial Report conforms to the principles and standards of financial
reporting as recommended and adopted by the Association of Schools Business Officials. This award is
granted only after an intensive review of the financial report by an expert panel of certified public
accountants and practicing school business officials.
Dublin City School District staff members are proud of the fact that the GFOA and ASBO have awarded
these certificates for the Comprehensive Annual Financial Report prepared by the District. It is the
District’s belief that the current report continues to conform to the standards set by GFOA & ASBO, and
it will be submitted for review to determine its eligibility for a certificate.
Independent Audit
Statutes require an annual audit by independent auditors. The independent public accounting firm
Plattenburg & Associates, Inc. conducted the District’s 2017 fiscal year audit. In addition to meeting the
requirements set forth in statutes, the audit also was designed to meet the requirements of the Federal
Single Audit and requirements of Uniform Guidance. The auditor’s report on the basic financial
statements is included in the financial section of this report.
Acknowledgments
The preparation and publication of this Comprehensive Annual Financial Report on a timely basis could
not have been possible without the cooperation of the entire Treasurer’s Department. A special note of
appreciation is extended to the District’s Fiscal Coordinator, Christine McDowell, and the Assistant
Treasurer, Tyson Hodges, for their efforts in preparing this report.
xiii
Finally, this report would not have been possible without the continued support of the Board of
Education who values quality financial information with which to help make decisions. Without their
leadership and commitment to excellence this report would not be possible.
Sincerely,
Brian Kern Todd F. Hoadley, Ph.D.
Treasurer/CFO Superintendent
xiv

LIST OF PRINCIPAL OFFICIALS
JUNE 30, 2017
BOARD OF EDUCATION
Lynn B. May, President
Scott W. Melody, Vice President
Stuart W. Harris, Member
Chris M. Valentine, Member
Rick L. Weininger, Member
TREASURER/CFO
Brian Kern
SUPERINTENDENT OF SCHOOLS
Todd Hoadley, Ph.D.
xv
Dub
lin C
ity
Scho
ols
Adm
inis
trat
ive
Org
aniz
atio
n C
hart
20
16-1
7
Boar
d of
Edu
catio
n
Trea
sure
r
Ass
istan
t Tr
easu
rer
Supe
rinte
nden
t
Chi
ef A
cade
mic
O
ffice
rC
hief
Ope
ratio
ns
Offi
cer
Chi
ef In
nova
tion
Offi
cer
Exec
utiv
e D
irect
orH
uman
Res
ourc
esC
oord
inat
or o
f Pub
lic
Info
rmat
ion
Dire
ctor
of
Elem
enta
ry E
duca
tion
----
Dire
ctor
of
Seco
ndar
y Ed
ucat
ion
----
Dire
ctor
s of
Curr
icul
um a
nd
Inst
ruct
ion
----
Dire
ctor
of
Stud
ent S
ervi
ces
----
C
oord
inat
ors o
f St
uden
t Ser
vice
s --
--
Coo
rdin
ator
of G
ifted
Se
rvic
es
----
Coo
rdin
ator
of
Dat
a an
d A
sses
smen
t
Dire
ctor
of
Stud
ent O
pera
tions
----
Dire
ctor
of
Busin
ess O
pera
tions
----
Coo
rdin
ator
of
Ope
ratio
nal E
xcel
lenc
e--
--C
oord
inat
or o
f Tr
ansp
orta
tion
----
Coo
rdin
ator
of
Food
Ser
vice
s--
--C
oord
inat
or o
f Cu
stod
ial S
ervi
ces
Dire
ctor
of
Tech
nolo
gy--
--C
oord
inat
or o
f Te
chno
logy
O
pera
tions
----
Coo
rdin
ator
of
Stud
ent I
nfor
mat
ion
Serv
ices
/ EM
IS--
--C
oord
inat
or o
fTe
chno
logy
In
tegr
atio
n
Coo
rdin
ator
of
Cer
tified
HR
----
Coo
rdin
ator
of
Cla
ssifi
ed H
R
Com
mun
ity O
utre
ach
Spec
ialis
t
Fisc
al C
oord
inat
or
4/25
/201
6 A
C
xvi

xvii

The Certificate of Excellence in Financial Reporting
is presented to
Dublin City School District
for its Comprehensive Annual Financial Report (CAFR)
for the Fiscal Year Ended June 30, 2016.
The CAFR has been reviewed and met or exceeded
ASBO International’s Certificate of Excellence standards.
Anthony N. Dragona, Ed.D.Anthony N. Dragona, Ed.D.Anthony N. Dragona, Ed.D.Anthony N. Dragona, Ed.D., RSB, RSB, RSB, RSBAAAA John D. Musso, CAE, RSBAJohn D. Musso, CAE, RSBAJohn D. Musso, CAE, RSBAJohn D. Musso, CAE, RSBA
President Executive Director
xviii

FINANCIAL SECTION
PLATTENBURG PLATTENBURG PLATTENBURG PLATTENBURG Certified Public Accountants
1 8260 NORTHCREEK DRIVE, SUITE 330 / CINCINNATI, OH 45236 • (513) 891-2722 • FAX (513) 891-2760
TWO PRESTIGE PLACE, SUITE 240 / DAYTON, OH 45342 • (937) 433-0400 • FAX (937) 433-0429 www.plattenburg.com
INDEPENDENT AUDITOR’S REPORT
To the Board of Education
Dublin City School District
Report on the Financial Statements
We have audited the accompanying financial statements of the governmental activities, the business-type activities,
each major fund, and the aggregate remaining fund information of the Dublin City School District (the District) as of
and for the year ended June 30, 2017, and the related notes to the financial statements, which collectively comprise
the District's basic financial statements as listed in the table of contents.
Management's Responsibility for the Financial Statements
Management is responsible for the preparation and fair presentation of these financial statements in accordance with
accounting principles generally accepted in the United States of America; this includes the design, implementation,
and maintenance of internal control relevant to the preparation and fair presentation of financial statements that are
free from material misstatement, whether due to fraud or error.
Auditor's Responsibility
Our responsibility is to express opinions on these financial statements based on our audit. We conducted our audit in
accordance with auditing standards generally accepted in the United States of America and the standards applicable
to financial audits contained in Government Auditing Standards, issued by the Comptroller General of the United
States. Those standards require that we plan and perform the audit to obtain reasonable assurance about whether
the financial statements are free from material misstatement.
An audit involves performing procedures to obtain audit evidence about the amounts and disclosures in the financial
statements. The procedures selected depend on the auditor's judgment, including the assessment of the risks of
material misstatement of the financial statements, whether due to fraud or error. In making those risk assessments,
the auditor considers internal control relevant to the entity's preparation and fair presentation of the financial
statements in order to design audit procedures that are appropriate in the circumstances, but not for the purpose of
expressing an opinion on the effectiveness of the entity's internal control. Accordingly, we express no such opinion.
An audit also includes evaluating the appropriateness of accounting policies used and the reasonableness of
significant accounting estimates made by management, as well as evaluating the overall presentation of the financial
statements.
We believe that the audit evidence we have obtained is sufficient and appropriate to provide a basis for our audit
opinions.
Opinions
In our opinion, the financial statements referred to previously present fairly, in all material respects, the respective
financial position of the governmental activities, the business-type activities, each major fund, and the aggregate
remaining fund information of the District, as of June 30, 2017, and the respective changes in financial position and,
where applicable, cash flows, thereof for the year then ended in accordance with accounting principles generally
accepted in the United States of America.
2
PPPPLLLLAAAATTTTTTTTEEEENNNNBBBBUUUURRRRGGGG Certified Public Accountants
Other Matters
Required Supplementary Information
Accounting principles generally accepted in the United States of America require that the management's discussion
and analysis, budgetary comparison information and schedules of pension liabilities and pension contributions listed
in the table of contents be presented to supplement the basic financial statements. Such information, although not a
part of the basic financial statements, is required by the Governmental Accounting Standards Board who considers it
to be an essential part of financial reporting for placing the basic financial statements in an appropriate operational,
economic, or historical context. We have applied certain limited procedures to the required supplementary
information in accordance with auditing standards generally accepted in the United States of America, which
consisted of inquiries of management about the methods of preparing the information and comparing the
information for consistency with management's responses to our inquiries, the basic financial statements, and other
knowledge we obtained during our audit of the basic financial statements. We do not express an opinion or provide
any assurance on the information because the limited procedures do not provide us with sufficient evidence to
express an opinion or provide any assurance.
Supplementary and Other Information
Our audit was conducted for the purpose of forming opinions on the financial statements that collectively comprise
the District’s basic financial statements. The introductory section, combining and individual nonmajor fund financial
statements and schedules and statistical section, are presented for purposes of additional analysis and are not a
required part of the basic financial statements.
The combining and individual nonmajor fund financial statements and schedules are the responsibility of
management and were derived from and relate directly to the underlying accounting and other records used to
prepare the basic financial statements. Such information has been subjected to the auditing procedures applied in the
audit of the basic financial statements and certain additional procedures, including comparing and reconciling such
information directly to the underlying accounting and other records used to prepare the basic financial statements or
to the basic financial statements themselves, and other additional procedures in accordance with auditing standards
generally accepted in the United States of America. In our opinion, the combining and individual nonmajor fund
financial statements and schedules are fairly stated in all material respects in relation to the basic financial statements
as a whole.
The introductory and statistical sections have not been subjected to the auditing procedures applied in the audit of
the basic financial statements and, accordingly, we do not express an opinion or provide any assurance on them.
Other Reporting Required by Government Auditing Standards
In accordance with Government Auditing Standards, we have also issued our report dated December 28, 2017, on our
consideration of the District’s internal control over financial reporting and our tests of its compliance with certain
provisions of laws, regulations, contracts, and grant agreements and other matters. The purpose of that report is to
describe the scope of our testing of internal control over financial reporting and compliance and the results of that
testing, and not to provide an opinion on internal control over financial reporting or on compliance. That report is an
integral part of an audit performed in accordance with Government Auditing Standards in considering the District’s
internal control over financial reporting and compliance.
Plattenburg & Associates, Inc.
Cincinnati, Ohio
December 28, 2017
Dublin City School District
Management’s Discussion and Analysis
For the Fiscal Year Ended June 30, 2017
(Unaudited)
The discussion and analysis of Dublin City School District’s (“District”) financial performance provides an
overall review of the District’s financial activities for the fiscal year ended June 30, 2017. The intent of
this discussion and analysis is to look at the District’s financial performance as a whole; readers should
also review the notes to the basic financial statements and the basic financial statements to enhance
their understanding of the District’s performance.
Financial Highlights
Key financial highlights for 2017 are as follows:
• Net position of governmental activities increased $4,248,644 which represents a 3% increase from
2016.
• General revenues accounted for $223,439,338 in revenue or 93% of all revenues. Program specific
revenues in the form of charges for services and sales, grants and contributions accounted for
$16,742,298 or 7% of total revenues of $240,181,636.
• Business-type operations reflected an operating loss of $1,873,950.
• The District had $230,222,270 in expenses related to governmental activities; $11,173,132 of these
expenses were offset by program specific charges for services, grants or contributions. General
revenues of $223,297,782 were also used to provide for these programs.
Overview of the Financial Statements
This annual report consists of a series of financial statements and notes to those statements. These
statements are organized so the reader can understand the District as a financial whole, an entire
operating entity. The statements then proceed to provide an increasingly detailed look at specific
financial activities.
The Statement of Net Position and Statement of Activities provide information about the activities of the
whole District, presenting both an aggregate view of the District’s finances and a longer-term view of
those finances. Fund financial statements provide the next level of detail. For governmental funds,
these statements tell how services were financed in the short-term as well as what remains for future
spending. The fund financial statements also look at the District’s most significant funds with all other
nonmajor funds presented in total in one column.
Government-Wide Financial Statements
While this document contains the large number of funds used by the District to provide programs and
activities, the view of the District as a whole looks at all financial transactions and asks the questions,
“How did we do financially during 2017?” The Government-wide Financial Statements answers this
question. These statements include all assets and deferred outflows of resourses, and liabilities and
deferred inflows of resources using the accrual basis of accounting similar to the accounting used by
most private-sector companies. This basis of accounting takes into account all of the current year’s
revenues and expenses regardless of when cash is received or paid.
3
Dublin City School District
Management’s Discussion and Analysis
For the Fiscal Year Ended June 30, 2017
(Unaudited)
These two statements report the District’s net position and changes in net position. This change in net
position is important because it tells the reader that, for the District as a whole, the financial position
has improved or diminished. The causes of this change may be the result of many factors, both financial
and non-financial. Non-financial factors include the District’s property tax base, current property tax
laws in Ohio restricting revenue growth, facility conditions, required educational programs and other
factors.
In the Government-wide Financial Statements, the overall financial position of the District is presented
in the following manner:
• Governmental Activities – Most of the District’s programs and services are reported here including
instruction, support services, operation of non-instructional services, extracurricular activities and
interest and fiscal charges.
• Business-Type Activities – These services are provided on a charge for goods or services basis to
recover all of the expenses of the goods or services provided. Food service provided for other local
districts and schools is reported as business activities.
Fund Financial Statements
The analysis of the District’s major funds are presented in the Fund Financial Statements. Fund financial
statements provide detailed information about the District’s major funds. The District uses many funds
to account for a multitude of financial transactions. However, these fund financial statements focus on
the District’s most significant funds. The General Fund, Debt Service Fund, Community Education Fund,
Summer School, and Food Service Fund are the major funds of the District.
Governmental Funds Most of the District’s activities are reported in governmental funds, which focus
on how money flows into and out of those funds and the balances left at year-end available for spending
in future periods. These funds are reported using an accounting method called modified accrual
accounting, which measures cash and all other financial assets that can readily be converted to cash.
The governmental fund statements provide a detailed short-term view of the District’s general
government operations and the basic services it provides. Governmental fund information helps you
determine whether there are more or fewer financial resources that can be spent in the near future to
finance educational programs. The relationship (or differences) between governmental activities
(reported in the Statement of Net Position and the Statement of Activities) and governmental funds is
reconciled in the financial statements.
Proprietary Funds Proprietary funds use the same basis of accounting as business-type activities;
therefore, these statements will essentially match.
Fiduciary Funds Fiduciary Funds are used to account for resources held for the benefits of parties
outside the government. Fiduciary Funds are not reflected in the government-wide financial statements
because the resources of those funds are not available to support the District’s own programs.
4
Dublin City School District Management’s Discussion and Analysis For the Fiscal Year Ended June 30, 2017 (Unaudited)
The District as a Whole
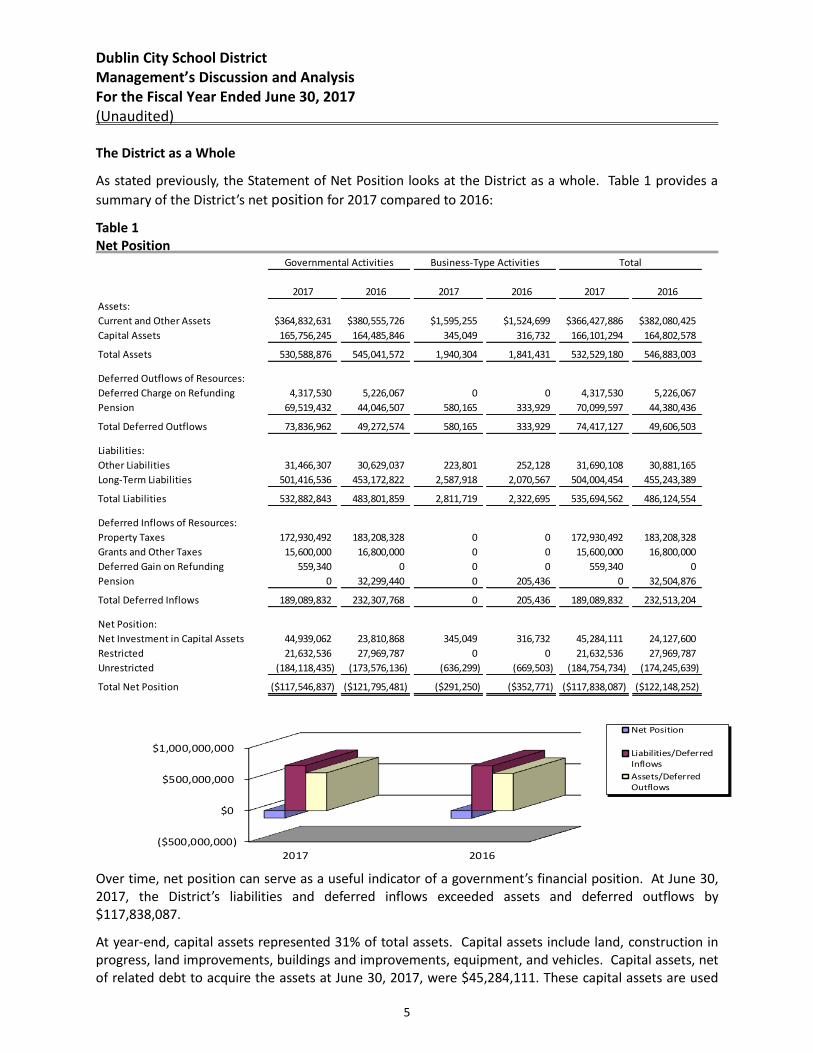
As stated previously, the Statement of Net Position looks at the District as a whole. Table 1 provides a
summary of the District’s net position for 2017 compared to 2016:
Table 1 Net Position
2017 2016 2017 2016 2017 2016
Assets:
Current and Other Assets $364,832,631 $380,555,726 $1,595,255 $1,524,699 $366,427,886 $382,080,425
Capital Assets 165,756,245 164,485,846 345,049 316,732 166,101,294 164,802,578
Total Assets 530,588,876 545,041,572 1,940,304 1,841,431 532,529,180 546,883,003
Deferred Outflows of Resources:
Deferred Charge on Refunding 4,317,530 5,226,067 0 0 4,317,530 5,226,067
Pension 69,519,432 44,046,507 580,165 333,929 70,099,597 44,380,436
Total Deferred Outflows 73,836,962 49,272,574 580,165 333,929 74,417,127 49,606,503
Liabilities:
Other Liabilities 31,466,307 30,629,037 223,801 252,128 31,690,108 30,881,165
Long-Term Liabilities 501,416,536 453,172,822 2,587,918 2,070,567 504,004,454 455,243,389
Total Liabilities 532,882,843 483,801,859 2,811,719 2,322,695 535,694,562 486,124,554
Deferred Inflows of Resources:
Property Taxes 172,930,492 183,208,328 0 0 172,930,492 183,208,328
Grants and Other Taxes 15,600,000 16,800,000 0 0 15,600,000 16,800,000
Deferred Gain on Refunding 559,340 0 0 0 559,340 0
Pension 0 32,299,440 0 205,436 0 32,504,876
Total Deferred Inflows 189,089,832 232,307,768 0 205,436 189,089,832 232,513,204
Net Position:
Net Investment in Capital Assets 44,939,062 23,810,868 345,049 316,732 45,284,111 24,127,600
Restricted 21,632,536 27,969,787 0 0 21,632,536 27,969,787
Unrestricted (184,118,435) (173,576,136) (636,299) (669,503) (184,754,734) (174,245,639)
Total Net Position ($117,546,837) ($121,795,481) ($291,250) ($352,771) ($117,838,087) ($122,148,252)
Governmental Activities Business-Type Activities Total
($500,000,000)
$0
$500,000,000
$1,000,000,000
2017 2016
Net Position
Liabilities/DeferredInflows
Assets/DeferredOutflows
Over time, net position can serve as a useful indicator of a government’s financial position. At June 30, 2017, the District’s liabilities and deferred inflows exceeded assets and deferred outflows by $117,838,087.
At year-end, capital assets represented 31% of total assets. Capital assets include land, construction in progress, land improvements, buildings and improvements, equipment, and vehicles. Capital assets, net of related debt to acquire the assets at June 30, 2017, were $45,284,111. These capital assets are used
5

Dublin City School District
Management’s Discussion and Analysis
For the Fiscal Year Ended June 30, 2017
(Unaudited)
to provide services to the students and are not available for future spending. Although the District’s
investment in capital assets is reported net of related debt, it should be noted that the resources to
repay the debt must be provided from other sources, since capital assets may not be used to liquidate
these liabilities.
A portion of the District’s net position, $21,632,536 represents resources that are subject to external
restriction on how they must be used. The external restriction will not affect the availability of fund
resources for future use.
Current and other assets decreased from the prior year mainly due to a decrease in cash. Capital assets
increased from the prior year due to additions exceeding depreciation expense and disposals in 2017.
Total liabilities increased from the prior year primarily due to the increase in net pension liability.
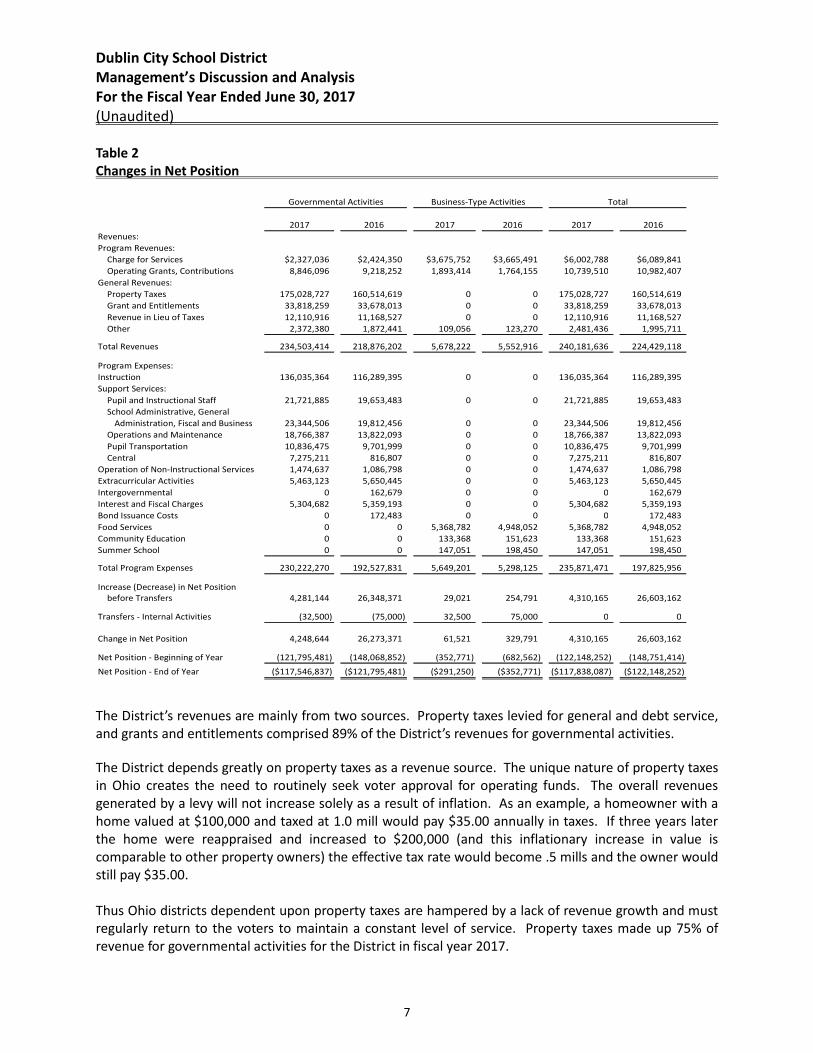
Table 2 shows the changes in net position for fiscal years 2017 and 2016.
This Space Intentionally Left Blank
6
Dublin City School District
Management’s Discussion and Analysis
For the Fiscal Year Ended June 30, 2017
(Unaudited)
Table 2
Changes in Net Position
2017 2016 2017 2016 2017 2016
Revenues:
Program Revenues:
Charge for Services $2,327,036 $2,424,350 $3,675,752 $3,665,491 $6,002,788 $6,089,841
Operating Grants, Contributions 8,846,096 9,218,252 1,893,414 1,764,155 10,739,510 10,982,407
General Revenues:
Property Taxes 175,028,727 160,514,619 0 0 175,028,727 160,514,619
Grant and Entitlements 33,818,259 33,678,013 0 0 33,818,259 33,678,013
Revenue in Lieu of Taxes 12,110,916 11,168,527 0 0 12,110,916 11,168,527
Other 2,372,380 1,872,441 109,056 123,270 2,481,436 1,995,711
Total Revenues 234,503,414 218,876,202 5,678,222 5,552,916 240,181,636 224,429,118
Program Expenses:
Instruction 136,035,364 116,289,395 0 0 136,035,364 116,289,395
Support Services:
Pupil and Instructional Staff 21,721,885 19,653,483 0 0 21,721,885 19,653,483
School Administrative, General
Administration, Fiscal and Business 23,344,506 19,812,456 0 0 23,344,506 19,812,456
Operations and Maintenance 18,766,387 13,822,093 0 0 18,766,387 13,822,093
Pupil Transportation 10,836,475 9,701,999 0 0 10,836,475 9,701,999
Central 7,275,211 816,807 0 0 7,275,211 816,807
Operation of Non-Instructional Services 1,474,637 1,086,798 0 0 1,474,637 1,086,798
Extracurricular Activities 5,463,123 5,650,445 0 0 5,463,123 5,650,445
Intergovernmental 0 162,679 0 0 0 162,679
Interest and Fiscal Charges 5,304,682 5,359,193 0 0 5,304,682 5,359,193
Bond Issuance Costs 0 172,483 0 0 0 172,483
Food Services 0 0 5,368,782 4,948,052 5,368,782 4,948,052
Community Education 0 0 133,368 151,623 133,368 151,623
Summer School 0 0 147,051 198,450 147,051 198,450
Total Program Expenses 230,222,270 192,527,831 5,649,201 5,298,125 235,871,471 197,825,956
Increase (Decrease) in Net Position
before Transfers 4,281,144 26,348,371 29,021 254,791 4,310,165 26,603,162
Transfers - Internal Activities (32,500) (75,000) 32,500 75,000 0 0
Change in Net Position 4,248,644 26,273,371 61,521 329,791 4,310,165 26,603,162
Net Position - Beginning of Year (121,795,481) (148,068,852) (352,771) (682,562) (122,148,252) (148,751,414)
Net Position - End of Year ($117,546,837) ($121,795,481) ($291,250) ($352,771) ($117,838,087) ($122,148,252)
Governmental Activities Business-Type Activities Total
The District’s revenues are mainly from two sources. Property taxes levied for general and debt service,
and grants and entitlements comprised 89% of the District’s revenues for governmental activities.
The District depends greatly on property taxes as a revenue source. The unique nature of property taxes
in Ohio creates the need to routinely seek voter approval for operating funds. The overall revenues
generated by a levy will not increase solely as a result of inflation. As an example, a homeowner with a
home valued at $100,000 and taxed at 1.0 mill would pay $35.00 annually in taxes. If three years later
the home were reappraised and increased to $200,000 (and this inflationary increase in value is
comparable to other property owners) the effective tax rate would become .5 mills and the owner would
still pay $35.00.
Thus Ohio districts dependent upon property taxes are hampered by a lack of revenue growth and must
regularly return to the voters to maintain a constant level of service. Property taxes made up 75% of
revenue for governmental activities for the District in fiscal year 2017.
7
Dublin City School District
Management’s Discussion and Analysis
For the Fiscal Year Ended June 30, 2017
(Unaudited)
Governmental Activities
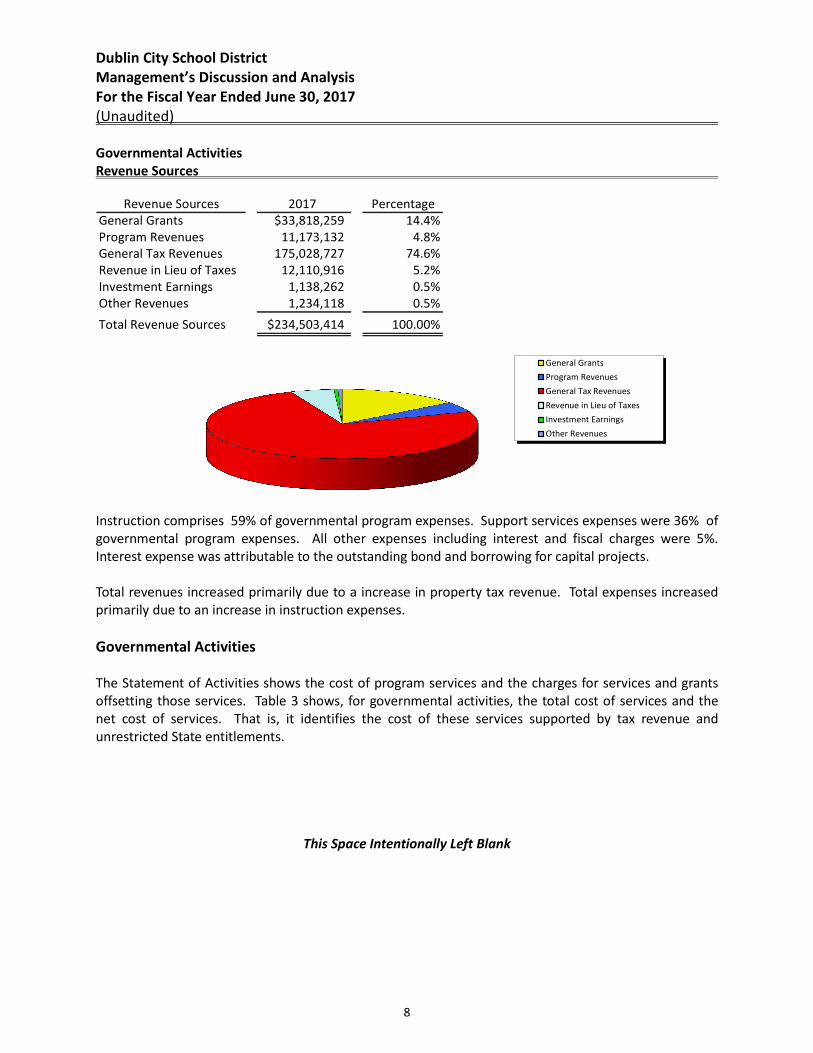
Revenue Sources
Revenue Sources 2017 Percentage
General Grants $33,818,259 14.4%
Program Revenues 11,173,132 4.8%
General Tax Revenues 175,028,727 74.6%
Revenue in Lieu of Taxes 12,110,916 5.2%
Investment Earnings 1,138,262 0.5%
Other Revenues 1,234,118 0.5%
Total Revenue Sources $234,503,414 100.00%
General Grants
Program Revenues
General Tax Revenues
Revenue in Lieu of Taxes
Investment Earnings
Other Revenues
Instruction comprises 59% of governmental program expenses. Support services expenses were 36% of
governmental program expenses. All other expenses including interest and fiscal charges were 5%.
Interest expense was attributable to the outstanding bond and borrowing for capital projects.
Total revenues increased primarily due to a increase in property tax revenue. Total expenses increased
primarily due to an increase in instruction expenses.
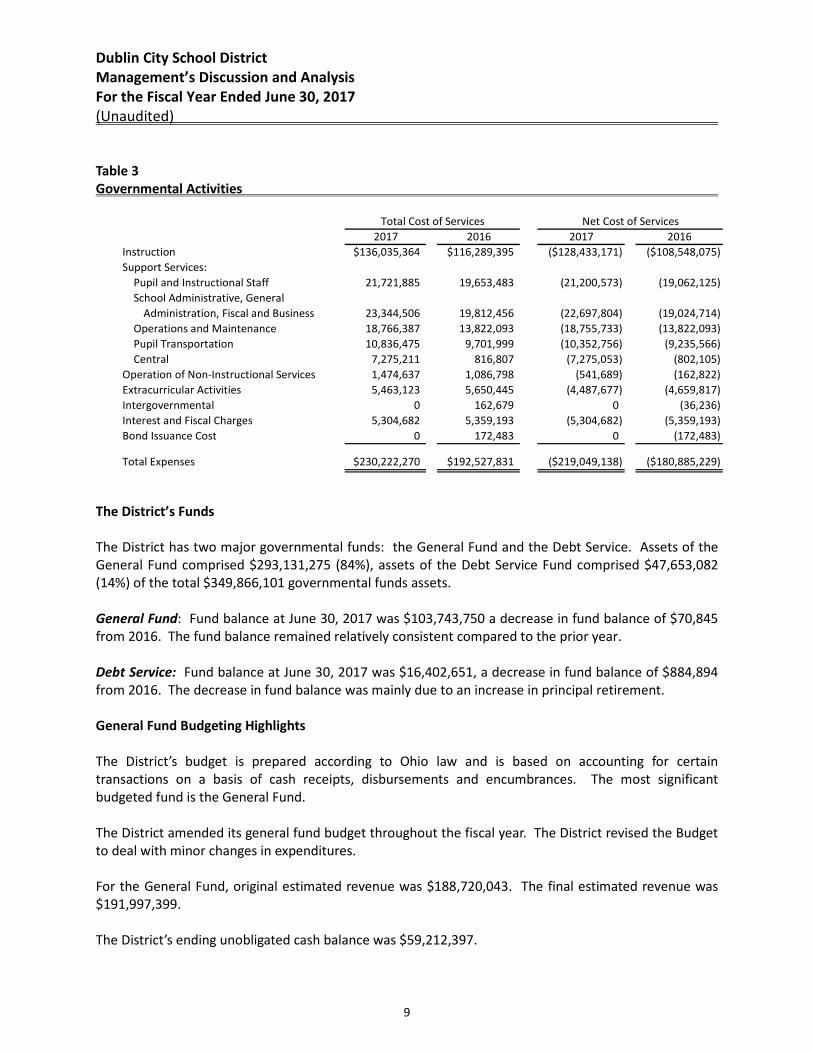
Governmental Activities
The Statement of Activities shows the cost of program services and the charges for services and grants
offsetting those services. Table 3 shows, for governmental activities, the total cost of services and the
net cost of services. That is, it identifies the cost of these services supported by tax revenue and
unrestricted State entitlements.
This Space Intentionally Left Blank
8
Dublin City School District
Management’s Discussion and Analysis
For the Fiscal Year Ended June 30, 2017
(Unaudited)
Table 3
Governmental Activities
2017 2016 2017 2016
Instruction $136,035,364 $116,289,395 ($128,433,171) ($108,548,075)
Support Services:
Pupil and Instructional Staff 21,721,885 19,653,483 (21,200,573) (19,062,125)
School Administrative, General
Administration, Fiscal and Business 23,344,506 19,812,456 (22,697,804) (19,024,714)
Operations and Maintenance 18,766,387 13,822,093 (18,755,733) (13,822,093)
Pupil Transportation 10,836,475 9,701,999 (10,352,756) (9,235,566)
Central 7,275,211 816,807 (7,275,053) (802,105)
Operation of Non-Instructional Services 1,474,637 1,086,798 (541,689) (162,822)
Extracurricular Activities 5,463,123 5,650,445 (4,487,677) (4,659,817)
Intergovernmental 0 162,679 0 (36,236)
Interest and Fiscal Charges 5,304,682 5,359,193 (5,304,682) (5,359,193)
Bond Issuance Cost 0 172,483 0 (172,483)
Total Expenses $230,222,270 $192,527,831 ($219,049,138) ($180,885,229)
Total Cost of Services Net Cost of Services
The District’s Funds
The District has two major governmental funds: the General Fund and the Debt Service. Assets of the
General Fund comprised $293,131,275 (84%), assets of the Debt Service Fund comprised $47,653,082
(14%) of the total $349,866,101 governmental funds assets.
General Fund: Fund balance at June 30, 2017 was $103,743,750 a decrease in fund balance of $70,845
from 2016. The fund balance remained relatively consistent compared to the prior year.
Debt Service: Fund balance at June 30, 2017 was $16,402,651, a decrease in fund balance of $884,894
from 2016. The decrease in fund balance was mainly due to an increase in principal retirement.
General Fund Budgeting Highlights
The District’s budget is prepared according to Ohio law and is based on accounting for certain
transactions on a basis of cash receipts, disbursements and encumbrances. The most significant
budgeted fund is the General Fund.
The District amended its general fund budget throughout the fiscal year. The District revised the Budget
to deal with minor changes in expenditures.
For the General Fund, original estimated revenue was $188,720,043. The final estimated revenue was
$191,997,399.
The District’s ending unobligated cash balance was $59,212,397.
9
Dublin City School District
Management’s Discussion and Analysis
For the Fiscal Year Ended June 30, 2017
(Unaudited)
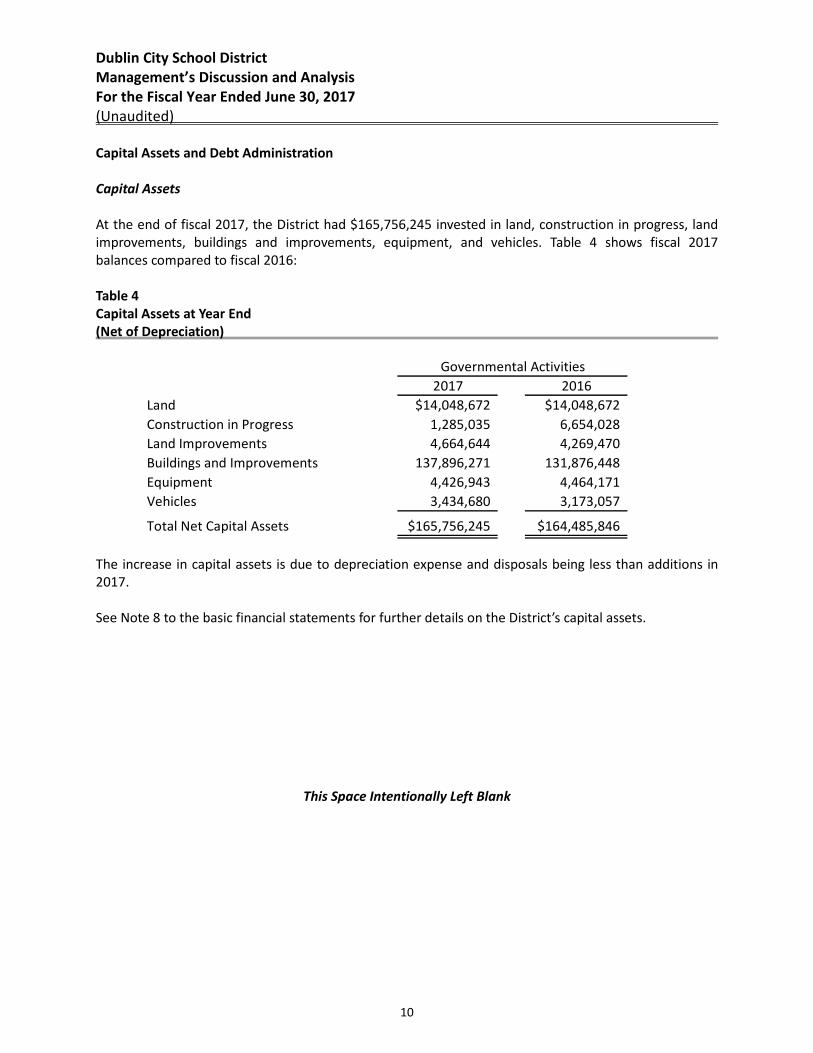
Capital Assets and Debt Administration
Capital Assets
At the end of fiscal 2017, the District had $165,756,245 invested in land, construction in progress, land
improvements, buildings and improvements, equipment, and vehicles. Table 4 shows fiscal 2017
balances compared to fiscal 2016:
Table 4
Capital Assets at Year End
(Net of Depreciation)
2017 2016
Land $14,048,672 $14,048,672
Construction in Progress 1,285,035 6,654,028
Land Improvements 4,664,644 4,269,470
Buildings and Improvements 137,896,271 131,876,448
Equipment 4,426,943 4,464,171
Vehicles 3,434,680 3,173,057
Total Net Capital Assets $165,756,245 $164,485,846
Governmental Activities
The increase in capital assets is due to depreciation expense and disposals being less than additions in
2017.
See Note 8 to the basic financial statements for further details on the District’s capital assets.
This Space Intentionally Left Blank
10
Dublin City School District Management’s Discussion and Analysis For the Fiscal Year Ended June 30, 2017 (Unaudited)
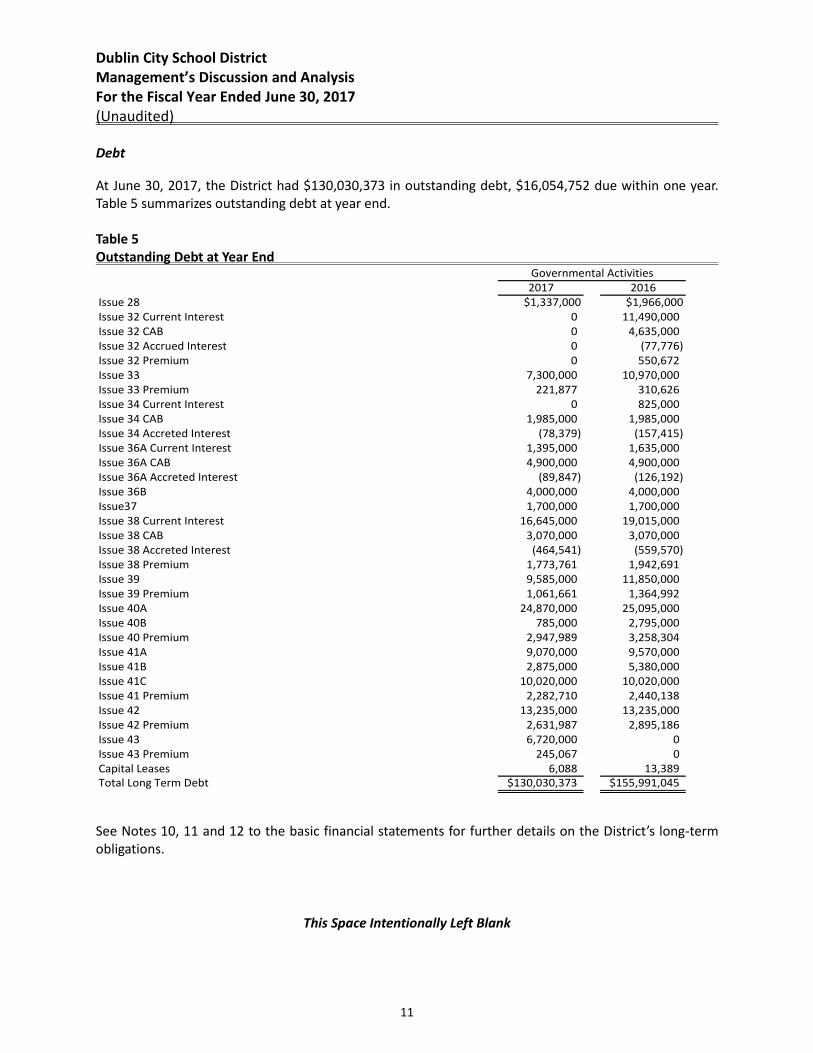
Debt
At June 30, 2017, the District had $130,030,373 in outstanding debt, $16,054,752 due within one year. Table 5 summarizes outstanding debt at year end. Table 5 Outstanding Debt at Year End
2017 2016Issue 28 $1,337,000 $1,966,000Issue 32 Current Interest 0 11,490,000Issue 32 CAB 0 4,635,000Issue 32 Accrued Interest 0 (77,776)Issue 32 Premium 0 550,672Issue 33 7,300,000 10,970,000Issue 33 Premium 221,877 310,626Issue 34 Current Interest 0 825,000Issue 34 CAB 1,985,000 1,985,000Issue 34 Accreted Interest (78,379) (157,415)Issue 36A Current Interest 1,395,000 1,635,000Issue 36A CAB 4,900,000 4,900,000Issue 36A Accreted Interest (89,847) (126,192)Issue 36B 4,000,000 4,000,000Issue37 1,700,000 1,700,000Issue 38 Current Interest 16,645,000 19,015,000Issue 38 CAB 3,070,000 3,070,000Issue 38 Accreted Interest (464,541) (559,570)Issue 38 Premium 1,773,761 1,942,691Issue 39 9,585,000 11,850,000Issue 39 Premium 1,061,661 1,364,992Issue 40A 24,870,000 25,095,000Issue 40B 785,000 2,795,000Issue 40 Premium 2,947,989 3,258,304Issue 41A 9,070,000 9,570,000Issue 41B 2,875,000 5,380,000Issue 41C 10,020,000 10,020,000Issue 41 Premium 2,282,710 2,440,138Issue 42 13,235,000 13,235,000Issue 42 Premium 2,631,987 2,895,186Issue 43 6,720,000 0Issue 43 Premium 245,067 0Capital Leases 6,088 13,389Total Long Term Debt $130,030,373 $155,991,045
Governmental Activities
See Notes 10, 11 and 12 to the basic financial statements for further details on the District’s long-term obligations.
This Space Intentionally Left Blank
11
Dublin City School District
Management’s Discussion and Analysis
For the Fiscal Year Ended June 30, 2017
(Unaudited)
For the Future
With the passage of the November 2004, 2008 and 2012 operating levies and the November 2000, 2004,
2008 and 2012 bond issues, as well as staff reductions, the District is in a good financial position through
fiscal year 2020. The operating levy combined with the bond issue provides the necessary funds for the
District to manage current growth patterns while maintaining the educational program and the facilities.
However, the future financial stability of the District is not without challenges.
The first challenge is for management to ensure resources can be preserved as long as possible. The five-
year forecast of the general fund and the five-year capital plan is utilized by management as a tool to
manage resources effectively.
The second challenge facing the District is based in the local economy. The District has experienced
significant growth over the last 22 years. If the growth patterns in student population change so
additional students enter the District more than currently anticipated, adjustments will have to be made
to the financial models upon which assumptions have been made. This scenario or an economic
slowdown could cause the District to scale down the educational program offerings or seek additional
resources.
The third challenge facing the District is House Bill 64 (HB64). HB64, the current state budget,
reinstitutes the phase out of district Tangible Personal Property (TPP) reimbursements that were
promised under previous budget bills. HB64 begins the phase out in FY16 & FY17 based on Quintiles.
Beginning in FY18, Senate Bill 208 (SB208) will take over and ease the TPP phase out by lowering the
payment each year by what five-eights (5/8) of a mill would raise locally. The District has estimated that
TPP will be gone after FY16. This will cost the District $4,298,250 in reduced state revenue equal to a 1.4
mill-operating levy annually.
The last challenge facing the District comes in FY18 and beyond if the state economy worsens or if the
funding formula in future state budgets reduce funding to the District. There are two future State
Biennium Budgets covering the period from FY18 through FY21 in the forecast. Future uncertainty in
both the state foundation funding formula and the state’s economy makes this area an elevated risk to
district funding long range through FY21.
The District carefully prepares its five-year forecast with the best information available, and utilizes the
forecast for financial planning. The administration will continue to monitor federal, state, and local
issues that affect the finances of the District and take necessary actions to maintain the long-term
stability of the District.
Contacting the District’s Financial Management
This financial report is designed to provide our citizens, taxpayers, investors and creditors with a general
overview of the School District’s finances and to show the School District’s accountability for the money
it receives. If you have questions about this report or need additional financial information contact the
Treasurer’s Office at Dublin City School District, 7030 Coffman Road, Dublin, OH 43017 or call (614) 764-
5913.
12

13
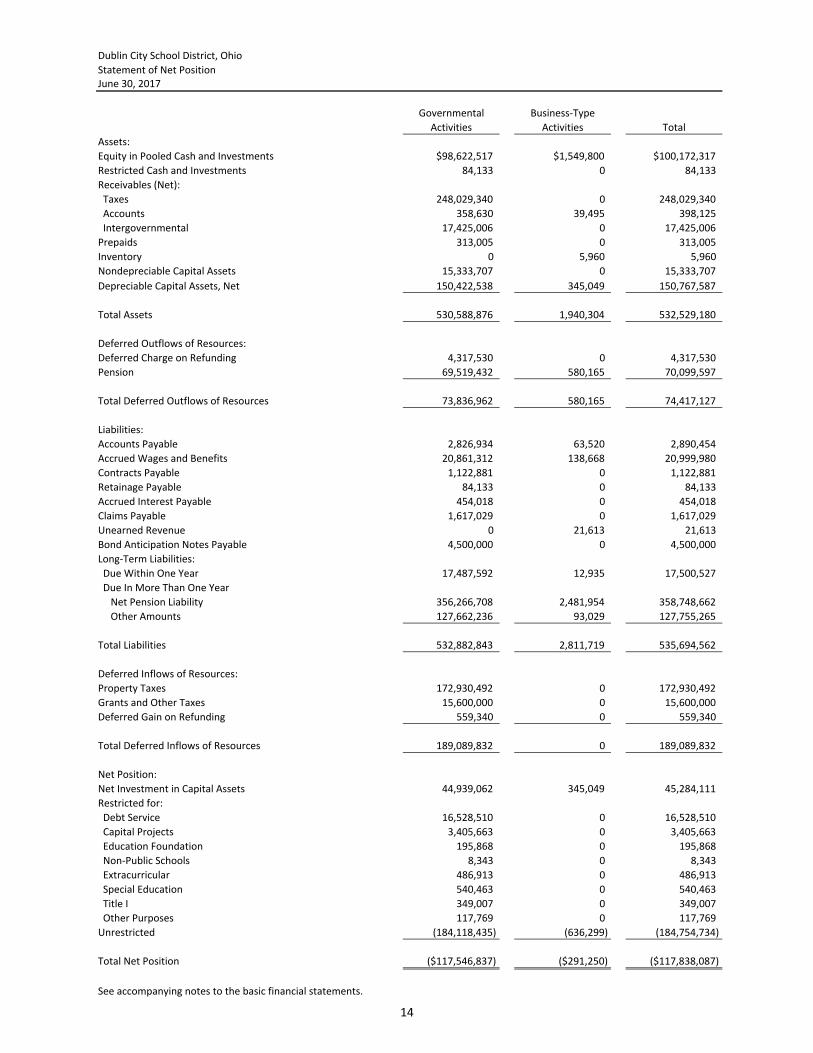
Dublin City School District, Ohio
Statement of Net Position
June 30, 2017
Governmental Business-Type
Activities Activities Total
Assets:
Equity in Pooled Cash and Investments $98,622,517 $1,549,800 $100,172,317
Restricted Cash and Investments 84,133 0 84,133
Receivables (Net):
Taxes 248,029,340 0 248,029,340
Accounts 358,630 39,495 398,125
Intergovernmental 17,425,006 0 17,425,006
Prepaids 313,005 0 313,005
Inventory 0 5,960 5,960
Nondepreciable Capital Assets 15,333,707 0 15,333,707
Depreciable Capital Assets, Net 150,422,538 345,049 150,767,587
Total Assets 530,588,876 1,940,304 532,529,180
Deferred Outflows of Resources:
Deferred Charge on Refunding 4,317,530 0 4,317,530
Pension 69,519,432 580,165 70,099,597
Total Deferred Outflows of Resources 73,836,962 580,165 74,417,127
Liabilities:
Accounts Payable 2,826,934 63,520 2,890,454
Accrued Wages and Benefits 20,861,312 138,668 20,999,980
Contracts Payable 1,122,881 0 1,122,881
Retainage Payable 84,133 0 84,133
Accrued Interest Payable 454,018 0 454,018
Claims Payable 1,617,029 0 1,617,029
Unearned Revenue 0 21,613 21,613
Bond Anticipation Notes Payable 4,500,000 0 4,500,000
Long-Term Liabilities:
Due Within One Year 17,487,592 12,935 17,500,527
Due In More Than One Year
Net Pension Liability 356,266,708 2,481,954 358,748,662
Other Amounts 127,662,236 93,029 127,755,265
Total Liabilities 532,882,843 2,811,719 535,694,562
Deferred Inflows of Resources:
Property Taxes 172,930,492 0 172,930,492
Grants and Other Taxes 15,600,000 0 15,600,000
Deferred Gain on Refunding 559,340 0 559,340
Total Deferred Inflows of Resources 189,089,832 0 189,089,832
Net Position:
Net Investment in Capital Assets 44,939,062 345,049 45,284,111
Restricted for:
Debt Service 16,528,510 0 16,528,510
Capital Projects 3,405,663 0 3,405,663
Education Foundation 195,868 0 195,868
Non-Public Schools 8,343 0 8,343
Extracurricular 486,913 0 486,913
Special Education 540,463 0 540,463
Title I 349,007 0 349,007
Other Purposes 117,769 0 117,769
Unrestricted (184,118,435) (636,299) (184,754,734)
Total Net Position ($117,546,837) ($291,250) ($117,838,087)
See accompanying notes to the basic financial statements.
14
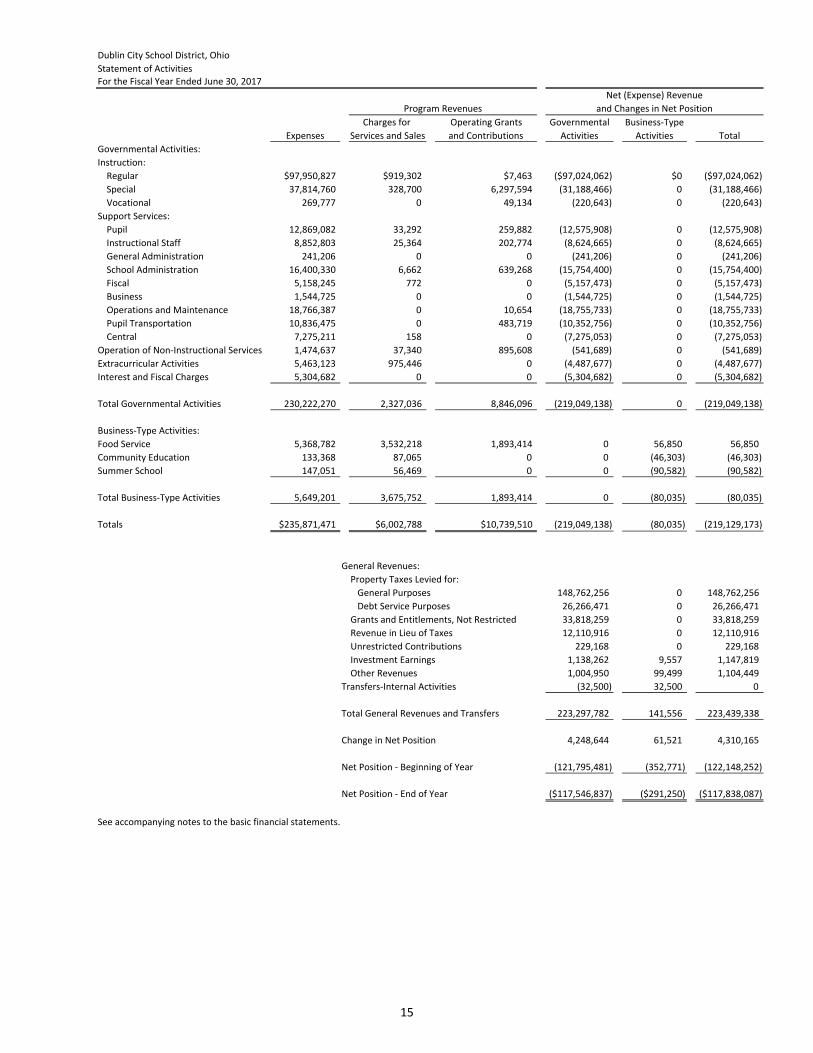
Dublin City School District, Ohio
Statement of Activities
For the Fiscal Year Ended June 30, 2017
Charges for Operating Grants Governmental Business-Type
Expenses Services and Sales and Contributions Activities Activities Total
Governmental Activities:
Instruction:
Regular $97,950,827 $919,302 $7,463 ($97,024,062) $0 ($97,024,062)
Special 37,814,760 328,700 6,297,594 (31,188,466) 0 (31,188,466)
Vocational 269,777 0 49,134 (220,643) 0 (220,643)
Support Services:
Pupil 12,869,082 33,292 259,882 (12,575,908) 0 (12,575,908)
Instructional Staff 8,852,803 25,364 202,774 (8,624,665) 0 (8,624,665)
General Administration 241,206 0 0 (241,206) 0 (241,206)
School Administration 16,400,330 6,662 639,268 (15,754,400) 0 (15,754,400)
Fiscal 5,158,245 772 0 (5,157,473) 0 (5,157,473)
Business 1,544,725 0 0 (1,544,725) 0 (1,544,725)
Operations and Maintenance 18,766,387 0 10,654 (18,755,733) 0 (18,755,733)
Pupil Transportation 10,836,475 0 483,719 (10,352,756) 0 (10,352,756)
Central 7,275,211 158 0 (7,275,053) 0 (7,275,053)
Operation of Non-Instructional Services 1,474,637 37,340 895,608 (541,689) 0 (541,689)
Extracurricular Activities 5,463,123 975,446 0 (4,487,677) 0 (4,487,677)
Interest and Fiscal Charges 5,304,682 0 0 (5,304,682) 0 (5,304,682)
Total Governmental Activities 230,222,270 2,327,036 8,846,096 (219,049,138) 0 (219,049,138)
Business-Type Activities:
Food Service 5,368,782 3,532,218 1,893,414 0 56,850 56,850
Community Education 133,368 87,065 0 0 (46,303) (46,303)
Summer School 147,051 56,469 0 0 (90,582) (90,582)
Total Business-Type Activities 5,649,201 3,675,752 1,893,414 0 (80,035) (80,035)
Totals $235,871,471 $6,002,788 $10,739,510 (219,049,138) (80,035) (219,129,173)
General Revenues:
Property Taxes Levied for:
General Purposes 148,762,256 0 148,762,256
Debt Service Purposes 26,266,471 0 26,266,471
Grants and Entitlements, Not Restricted 33,818,259 0 33,818,259
Revenue in Lieu of Taxes 12,110,916 0 12,110,916
Unrestricted Contributions 229,168 0 229,168
Investment Earnings 1,138,262 9,557 1,147,819
Other Revenues 1,004,950 99,499 1,104,449
Transfers-Internal Activities (32,500) 32,500 0
Total General Revenues and Transfers 223,297,782 141,556 223,439,338
Change in Net Position 4,248,644 61,521 4,310,165
Net Position - Beginning of Year (121,795,481) (352,771) (122,148,252)
Net Position - End of Year ($117,546,837) ($291,250) ($117,838,087)
See accompanying notes to the basic financial statements.
Net (Expense) Revenue
and Changes in Net PositionProgram Revenues
15
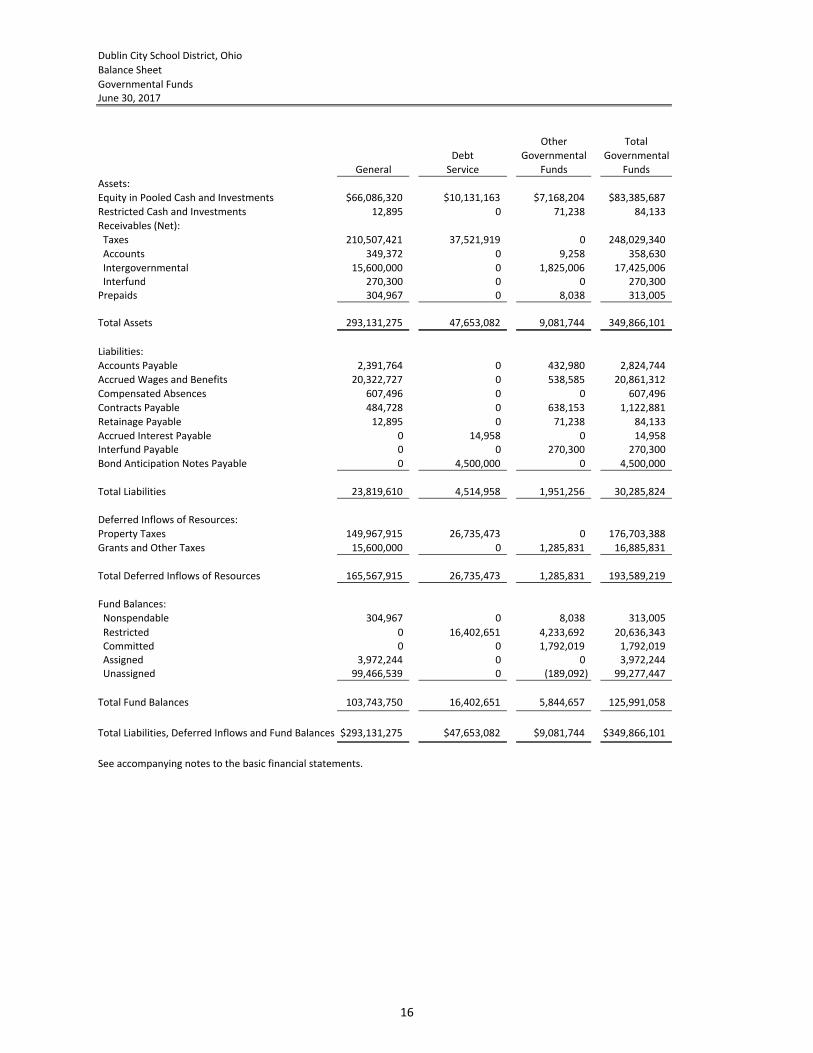
Dublin City School District, Ohio
Balance Sheet
Governmental Funds
June 30, 2017
Other Total
Debt Governmental Governmental
General Service Funds Funds
Assets:
Equity in Pooled Cash and Investments $66,086,320 $10,131,163 $7,168,204 $83,385,687
Restricted Cash and Investments 12,895 0 71,238 84,133
Receivables (Net):
Taxes 210,507,421 37,521,919 0 248,029,340
Accounts 349,372 0 9,258 358,630
Intergovernmental 15,600,000 0 1,825,006 17,425,006
Interfund 270,300 0 0 270,300
Prepaids 304,967 0 8,038 313,005
Total Assets 293,131,275 47,653,082 9,081,744 349,866,101
Liabilities:
Accounts Payable 2,391,764 0 432,980 2,824,744
Accrued Wages and Benefits 20,322,727 0 538,585 20,861,312
Compensated Absences 607,496 0 0 607,496
Contracts Payable 484,728 0 638,153 1,122,881
Retainage Payable 12,895 0 71,238 84,133
Accrued Interest Payable 0 14,958 0 14,958
Interfund Payable 0 0 270,300 270,300
Bond Anticipation Notes Payable 0 4,500,000 0 4,500,000
Total Liabilities 23,819,610 4,514,958 1,951,256 30,285,824
Deferred Inflows of Resources:
Property Taxes 149,967,915 26,735,473 0 176,703,388
Grants and Other Taxes 15,600,000 0 1,285,831 16,885,831
Total Deferred Inflows of Resources 165,567,915 26,735,473 1,285,831 193,589,219
Fund Balances:
Nonspendable 304,967 0 8,038 313,005
Restricted 0 16,402,651 4,233,692 20,636,343
Committed 0 0 1,792,019 1,792,019
Assigned 3,972,244 0 0 3,972,244
Unassigned 99,466,539 0 (189,092) 99,277,447
Total Fund Balances 103,743,750 16,402,651 5,844,657 125,991,058
Total Liabilities, Deferred Inflows and Fund Balances $293,131,275 $47,653,082 $9,081,744 $349,866,101
See accompanying notes to the basic financial statements.
16
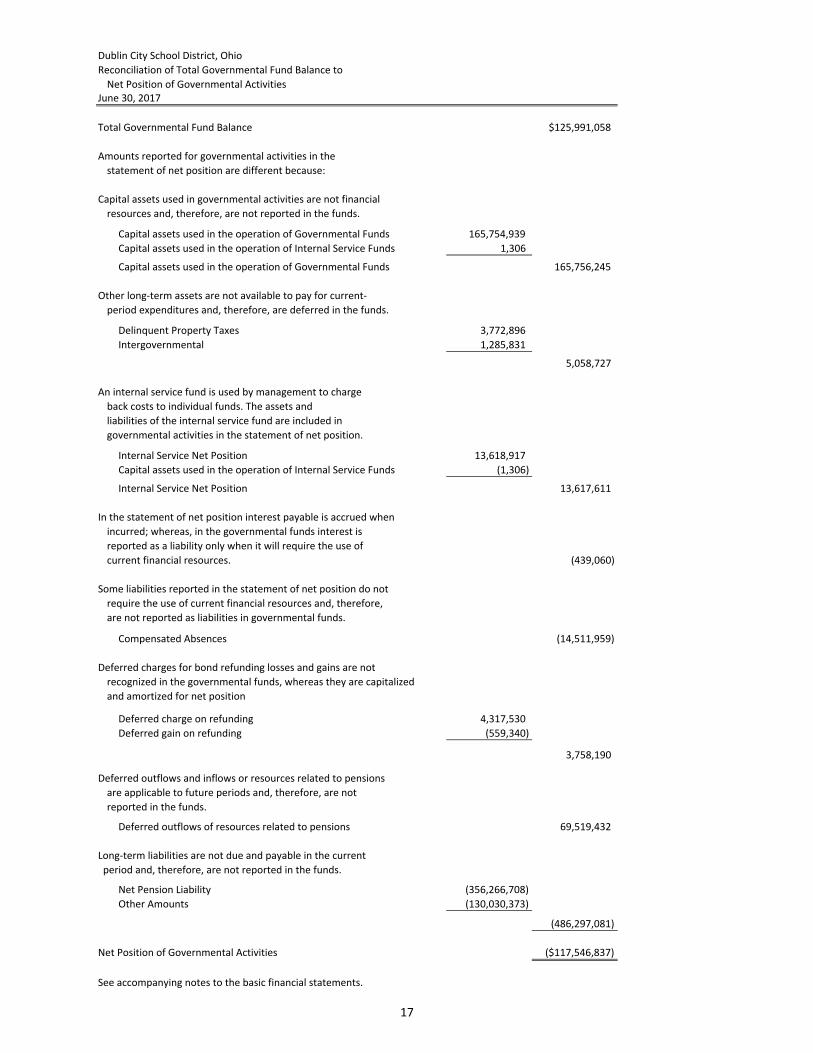
Dublin City School District, Ohio
Reconciliation of Total Governmental Fund Balance to
Net Position of Governmental Activities
Total Governmental Fund Balance $125,991,058
Amounts reported for governmental activities in the
statement of net position are different because:
Capital assets used in governmental activities are not financial
resources and, therefore, are not reported in the funds.
Capital assets used in the operation of Governmental Funds 165,754,939
Capital assets used in the operation of Internal Service Funds 1,306
Capital assets used in the operation of Governmental Funds 165,756,245
Other long-term assets are not available to pay for current-
period expenditures and, therefore, are deferred in the funds.
Delinquent Property Taxes 3,772,896
Intergovernmental 1,285,831
5,058,727
An internal service fund is used by management to charge
back costs to individual funds. The assets and
liabilities of the internal service fund are included in
governmental activities in the statement of net position.
Internal Service Net Position 13,618,917
Capital assets used in the operation of Internal Service Funds (1,306)
Internal Service Net Position 13,617,611
In the statement of net position interest payable is accrued when
incurred; whereas, in the governmental funds interest is
reported as a liability only when it will require the use of
current financial resources. (439,060)
Some liabilities reported in the statement of net position do not
require the use of current financial resources and, therefore,
are not reported as liabilities in governmental funds.
Compensated Absences (14,511,959)
Deferred charges for bond refunding losses and gains are not
recognized in the governmental funds, whereas they are capitalized
and amortized for net position
Deferred charge on refunding 4,317,530
Deferred gain on refunding (559,340)
3,758,190
Deferred outflows and inflows or resources related to pensions
are applicable to future periods and, therefore, are not
reported in the funds.
Deferred outflows of resources related to pensions 69,519,432
Long-term liabilities are not due and payable in the current
period and, therefore, are not reported in the funds.
Net Pension Liability (356,266,708)
Other Amounts (130,030,373)
(486,297,081)
Net Position of Governmental Activities ($117,546,837)
See accompanying notes to the basic financial statements.
June 30, 2017
17
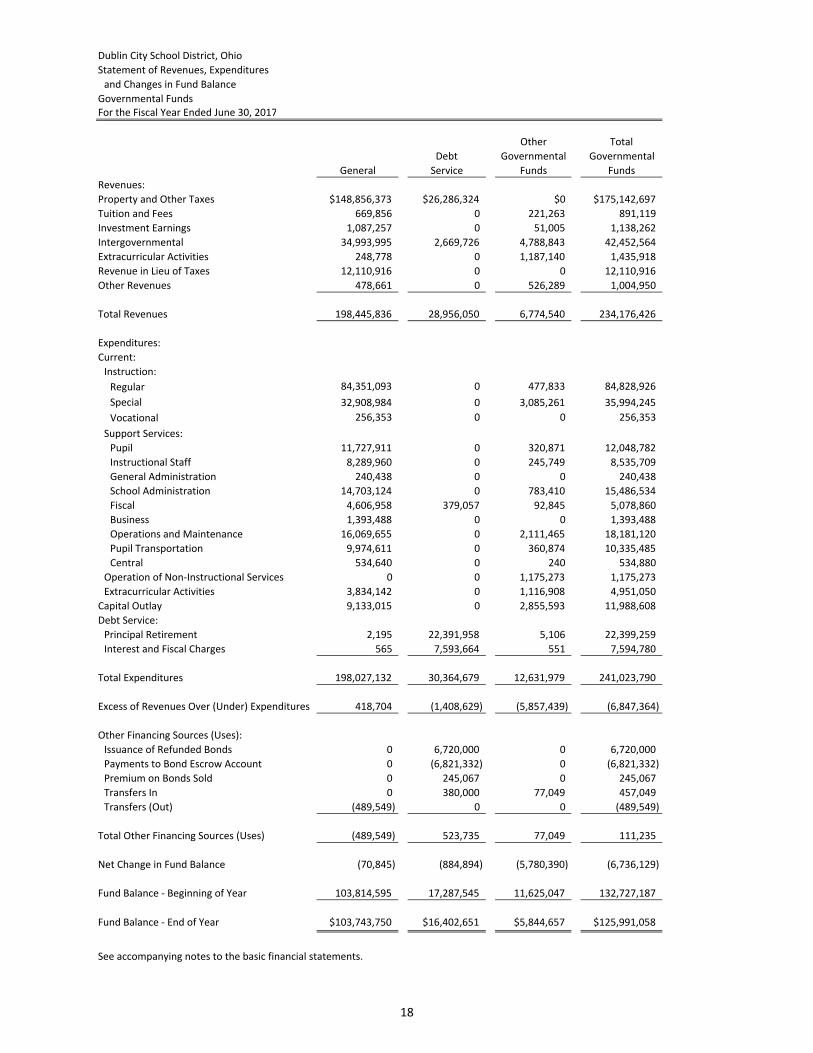
Dublin City School District, Ohio
Statement of Revenues, Expenditures
and Changes in Fund Balance
Governmental Funds
For the Fiscal Year Ended June 30, 2017
Other Total
Debt Governmental Governmental
General Service Funds Funds
Revenues:
Property and Other Taxes $148,856,373 $26,286,324 $0 $175,142,697
Tuition and Fees 669,856 0 221,263 891,119
Investment Earnings 1,087,257 0 51,005 1,138,262
Intergovernmental 34,993,995 2,669,726 4,788,843 42,452,564
Extracurricular Activities 248,778 0 1,187,140 1,435,918
Revenue in Lieu of Taxes 12,110,916 0 0 12,110,916
Other Revenues 478,661 0 526,289 1,004,950
Total Revenues 198,445,836 28,956,050 6,774,540 234,176,426
Expenditures:
Current:
Instruction:
Regular 84,351,093 0 477,833 84,828,926
Special 32,908,984 0 3,085,261 35,994,245
Vocational 256,353 0 0 256,353
Support Services:
Pupil 11,727,911 0 320,871 12,048,782
Instructional Staff 8,289,960 0 245,749 8,535,709
General Administration 240,438 0 0 240,438
School Administration 14,703,124 0 783,410 15,486,534
Fiscal 4,606,958 379,057 92,845 5,078,860
Business 1,393,488 0 0 1,393,488
Operations and Maintenance 16,069,655 0 2,111,465 18,181,120
Pupil Transportation 9,974,611 0 360,874 10,335,485
Central 534,640 0 240 534,880
Operation of Non-Instructional Services 0 0 1,175,273 1,175,273
Extracurricular Activities 3,834,142 0 1,116,908 4,951,050
Capital Outlay 9,133,015 0 2,855,593 11,988,608
Debt Service:
Principal Retirement 2,195 22,391,958 5,106 22,399,259
Interest and Fiscal Charges 565 7,593,664 551 7,594,780
Total Expenditures 198,027,132 30,364,679 12,631,979 241,023,790
Excess of Revenues Over (Under) Expenditures 418,704 (1,408,629) (5,857,439) (6,847,364)
Other Financing Sources (Uses):
Issuance of Refunded Bonds 0 6,720,000 0 6,720,000
Payments to Bond Escrow Account 0 (6,821,332) 0 (6,821,332)
Premium on Bonds Sold 0 245,067 0 245,067
Transfers In 0 380,000 77,049 457,049
Transfers (Out) (489,549) 0 0 (489,549)
Total Other Financing Sources (Uses) (489,549) 523,735 77,049 111,235
Net Change in Fund Balance (70,845) (884,894) (5,780,390) (6,736,129)
Fund Balance - Beginning of Year 103,814,595 17,287,545 11,625,047 132,727,187
Fund Balance - End of Year $103,743,750 $16,402,651 $5,844,657 $125,991,058
See accompanying notes to the basic financial statements.
18
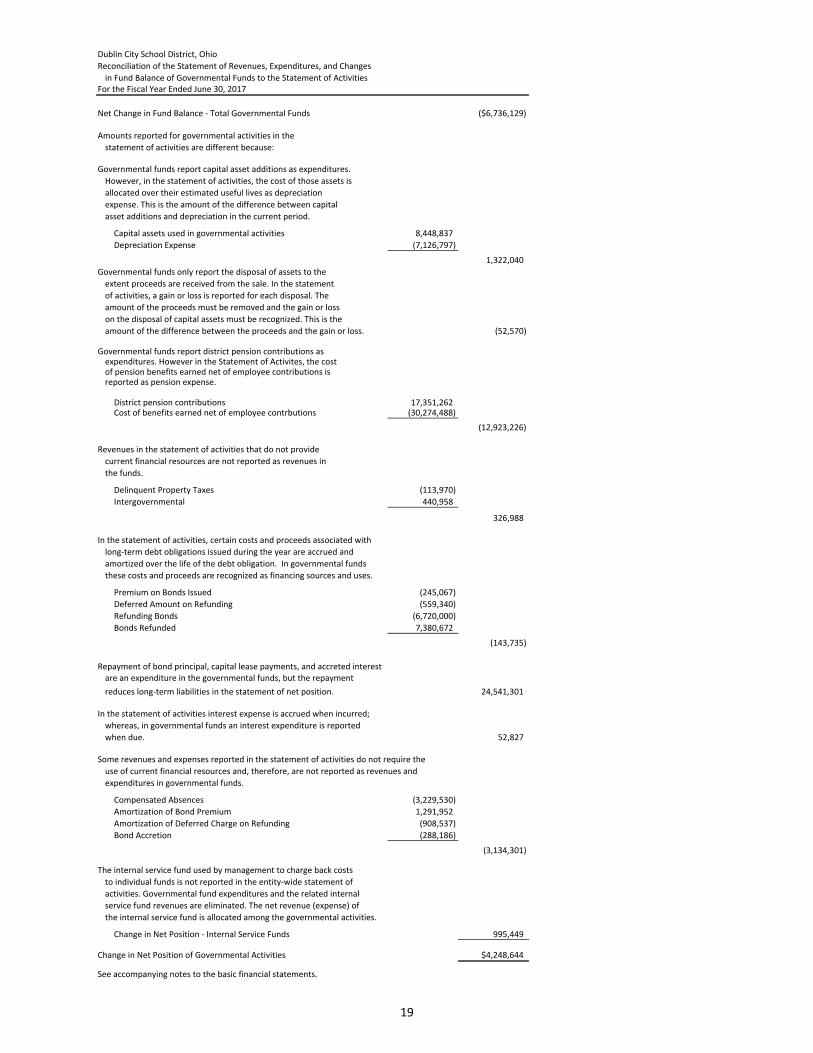
Dublin City School District, Ohio
Reconciliation of the Statement of Revenues, Expenditures, and Changes
in Fund Balance of Governmental Funds to the Statement of Activities
For the Fiscal Year Ended June 30, 2017
Net Change in Fund Balance - Total Governmental Funds ($6,736,129)
Amounts reported for governmental activities in the
statement of activities are different because:
Governmental funds report capital asset additions as expenditures.
However, in the statement of activities, the cost of those assets is
allocated over their estimated useful lives as depreciation
expense. This is the amount of the difference between capital
asset additions and depreciation in the current period.
Capital assets used in governmental activities 8,448,837
Depreciation Expense (7,126,797)
1,322,040
Governmental funds only report the disposal of assets to the
extent proceeds are received from the sale. In the statement
of activities, a gain or loss is reported for each disposal. The
amount of the proceeds must be removed and the gain or loss
on the disposal of capital assets must be recognized. This is the
amount of the difference between the proceeds and the gain or loss. (52,570)
Governmental funds report district pension contributions as expenditures. However in the Statement of Activites, the cost of pension benefits earned net of employee contributions is reported as pension expense.
District pension contributions 17,351,262Cost of benefits earned net of employee contrbutions (30,274,488)
(12,923,226)
Revenues in the statement of activities that do not provide
current financial resources are not reported as revenues in
the funds.
Delinquent Property Taxes (113,970)
Intergovernmental 440,958
326,988
In the statement of activities, certain costs and proceeds associated with
long-term debt obligations issued during the year are accrued and
amortized over the life of the debt obligation. In governmental funds
these costs and proceeds are recognized as financing sources and uses.
Premium on Bonds Issued (245,067)
Deferred Amount on Refunding (559,340)
Refunding Bonds (6,720,000)
Bonds Refunded 7,380,672
(143,735)
Repayment of bond principal, capital lease payments, and accreted interest
are an expenditure in the governmental funds, but the repayment
reduces long-term liabilities in the statement of net position. 24,541,301
In the statement of activities interest expense is accrued when incurred;
whereas, in governmental funds an interest expenditure is reported
when due. 52,827
Some revenues and expenses reported in the statement of activities do not require the
use of current financial resources and, therefore, are not reported as revenues and
expenditures in governmental funds.
Compensated Absences (3,229,530)
Amortization of Bond Premium 1,291,952
Amortization of Deferred Charge on Refunding (908,537)
Bond Accretion (288,186)
(3,134,301)
The internal service fund used by management to charge back costs
to individual funds is not reported in the entity-wide statement of
activities. Governmental fund expenditures and the related internal
service fund revenues are eliminated. The net revenue (expense) of
the internal service fund is allocated among the governmental activities.
Change in Net Position - Internal Service Funds 995,449
Change in Net Position of Governmental Activities $4,248,644
See accompanying notes to the basic financial statements.
19
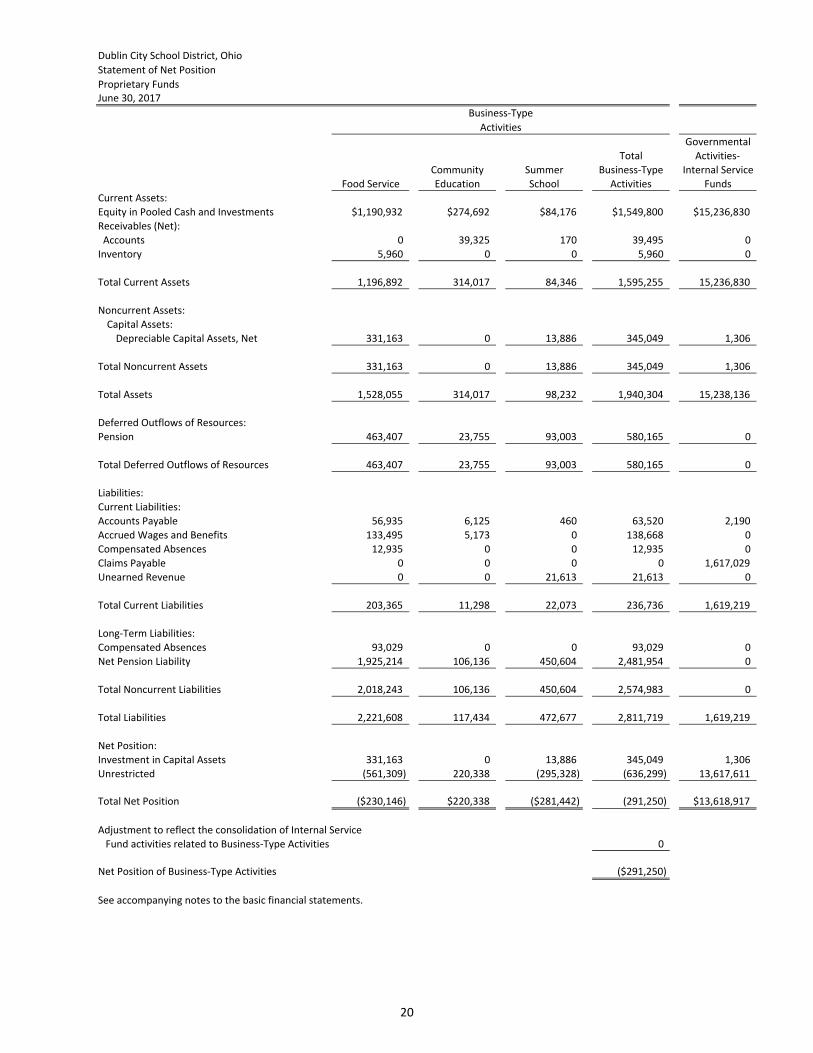
Dublin City School District, Ohio
Statement of Net Position
Proprietary Funds
Governmental
Total Activities-
Community Summer Business-Type Internal Service
Food Service Education School Activities Funds
Current Assets:
Equity in Pooled Cash and Investments $1,190,932 $274,692 $84,176 $1,549,800 $15,236,830
Receivables (Net):
Accounts 0 39,325 170 39,495 0
Inventory 5,960 0 0 5,960 0
Total Current Assets 1,196,892 314,017 84,346 1,595,255 15,236,830
Noncurrent Assets:
Capital Assets:
Depreciable Capital Assets, Net 331,163 0 13,886 345,049 1,306
Total Noncurrent Assets 331,163 0 13,886 345,049 1,306
Total Assets 1,528,055 314,017 98,232 1,940,304 15,238,136
Deferred Outflows of Resources:
Pension 463,407 23,755 93,003 580,165 0
Total Deferred Outflows of Resources 463,407 23,755 93,003 580,165 0
Liabilities:
Current Liabilities:
Accounts Payable 56,935 6,125 460 63,520 2,190
Accrued Wages and Benefits 133,495 5,173 0 138,668 0
Compensated Absences 12,935 0 0 12,935 0
Claims Payable 0 0 0 0 1,617,029
Unearned Revenue 0 0 21,613 21,613 0
Total Current Liabilities 203,365 11,298 22,073 236,736 1,619,219
Long-Term Liabilities:
Compensated Absences 93,029 0 0 93,029 0
Net Pension Liability 1,925,214 106,136 450,604 2,481,954 0
Total Noncurrent Liabilities 2,018,243 106,136 450,604 2,574,983 0
Total Liabilities 2,221,608 117,434 472,677 2,811,719 1,619,219
Net Position:
Investment in Capital Assets 331,163 0 13,886 345,049 1,306
Unrestricted (561,309) 220,338 (295,328) (636,299) 13,617,611
Total Net Position ($230,146) $220,338 ($281,442) (291,250) $13,618,917
Adjustment to reflect the consolidation of Internal Service
Fund activities related to Business-Type Activities 0
Net Position of Business-Type Activities ($291,250)
See accompanying notes to the basic financial statements.
Activities
June 30, 2017
Business-Type
20
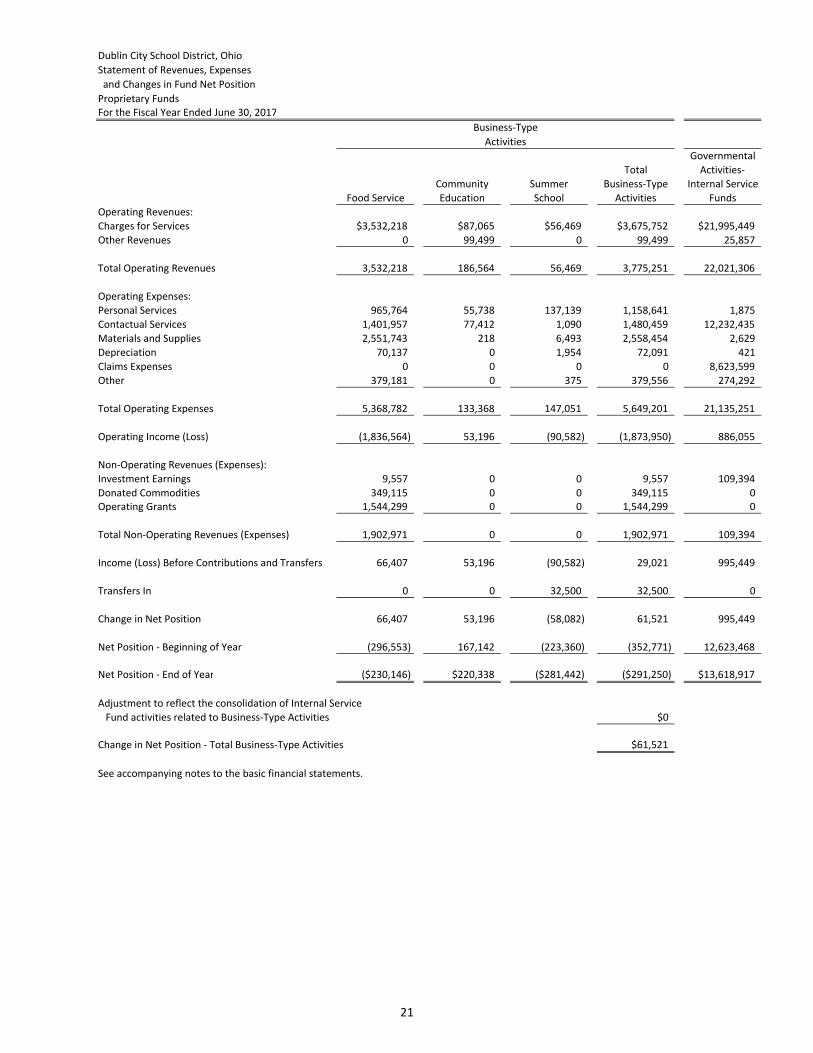
Dublin City School District, Ohio
Statement of Revenues, Expenses
and Changes in Fund Net Position
Proprietary Funds
For the Fiscal Year Ended June 30, 2017
Governmental
Total Activities-
Community Summer Business-Type Internal Service
Food Service Education School Activities Funds
Operating Revenues:
Charges for Services $3,532,218 $87,065 $56,469 $3,675,752 $21,995,449
Other Revenues 0 99,499 0 99,499 25,857
Total Operating Revenues 3,532,218 186,564 56,469 3,775,251 22,021,306
Operating Expenses:
Personal Services 965,764 55,738 137,139 1,158,641 1,875
Contactual Services 1,401,957 77,412 1,090 1,480,459 12,232,435
Materials and Supplies 2,551,743 218 6,493 2,558,454 2,629
Depreciation 70,137 0 1,954 72,091 421
Claims Expenses 0 0 0 0 8,623,599
Other 379,181 0 375 379,556 274,292
Total Operating Expenses 5,368,782 133,368 147,051 5,649,201 21,135,251
Operating Income (Loss) (1,836,564) 53,196 (90,582) (1,873,950) 886,055
Non-Operating Revenues (Expenses):
Investment Earnings 9,557 0 0 9,557 109,394
Donated Commodities 349,115 0 0 349,115 0
Operating Grants 1,544,299 0 0 1,544,299 0
Total Non-Operating Revenues (Expenses) 1,902,971 0 0 1,902,971 109,394
Income (Loss) Before Contributions and Transfers 66,407 53,196 (90,582) 29,021 995,449
Transfers In 0 0 32,500 32,500 0
Change in Net Position 66,407 53,196 (58,082) 61,521 995,449
Net Position - Beginning of Year (296,553) 167,142 (223,360) (352,771) 12,623,468
Net Position - End of Year ($230,146) $220,338 ($281,442) ($291,250) $13,618,917
Adjustment to reflect the consolidation of Internal Service
Fund activities related to Business-Type Activities $0
Change in Net Position - Total Business-Type Activities $61,521
See accompanying notes to the basic financial statements.
Activities
Business-Type
21
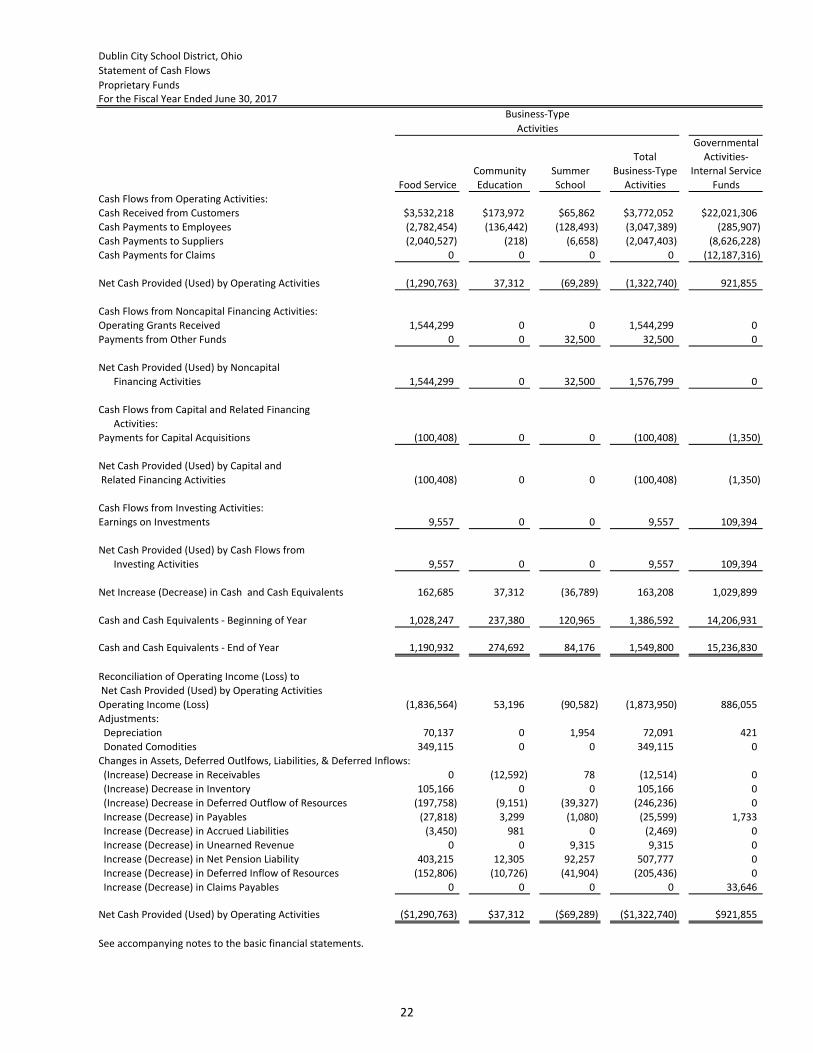
Dublin City School District, Ohio
Statement of Cash Flows
Proprietary FundsFor the Fiscal Year Ended June 30, 2017
Governmental
Total Activities-
Community Summer Business-Type Internal Service
Food Service Education School Activities Funds
Cash Flows from Operating Activities:
Cash Received from Customers $3,532,218 $173,972 $65,862 $3,772,052 $22,021,306
Cash Payments to Employees (2,782,454) (136,442) (128,493) (3,047,389) (285,907)
Cash Payments to Suppliers (2,040,527) (218) (6,658) (2,047,403) (8,626,228)
Cash Payments for Claims 0 0 0 0 (12,187,316)
Net Cash Provided (Used) by Operating Activities (1,290,763) 37,312 (69,289) (1,322,740) 921,855
Cash Flows from Noncapital Financing Activities:
Operating Grants Received 1,544,299 0 0 1,544,299 0
Payments from Other Funds 0 0 32,500 32,500 0
Net Cash Provided (Used) by Noncapital
Financing Activities 1,544,299 0 32,500 1,576,799 0
Cash Flows from Capital and Related Financing
Activities:
Payments for Capital Acquisitions (100,408) 0 0 (100,408) (1,350)
Net Cash Provided (Used) by Capital and
Related Financing Activities (100,408) 0 0 (100,408) (1,350)
Cash Flows from Investing Activities:
Earnings on Investments 9,557 0 0 9,557 109,394
Net Cash Provided (Used) by Cash Flows from
Investing Activities 9,557 0 0 9,557 109,394
Net Increase (Decrease) in Cash and Cash Equivalents 162,685 37,312 (36,789) 163,208 1,029,899
Cash and Cash Equivalents - Beginning of Year 1,028,247 237,380 120,965 1,386,592 14,206,931
Cash and Cash Equivalents - End of Year 1,190,932 274,692 84,176 1,549,800 15,236,830
Reconciliation of Operating Income (Loss) to
Net Cash Provided (Used) by Operating Activities
Operating Income (Loss) (1,836,564) 53,196 (90,582) (1,873,950) 886,055
Adjustments:
Depreciation 70,137 0 1,954 72,091 421
Donated Comodities 349,115 0 0 349,115 0
Changes in Assets, Deferred Outlfows, Liabilities, & Deferred Inflows:
(Increase) Decrease in Receivables 0 (12,592) 78 (12,514) 0
(Increase) Decrease in Inventory 105,166 0 0 105,166 0
(Increase) Decrease in Deferred Outflow of Resources (197,758) (9,151) (39,327) (246,236) 0
Increase (Decrease) in Payables (27,818) 3,299 (1,080) (25,599) 1,733
Increase (Decrease) in Accrued Liabilities (3,450) 981 0 (2,469) 0
Increase (Decrease) in Unearned Revenue 0 0 9,315 9,315 0
Increase (Decrease) in Net Pension Liability 403,215 12,305 92,257 507,777 0
Increase (Decrease) in Deferred Inflow of Resources (152,806) (10,726) (41,904) (205,436) 0
Increase (Decrease) in Claims Payables 0 0 0 0 33,646
Net Cash Provided (Used) by Operating Activities ($1,290,763) $37,312 ($69,289) ($1,322,740) $921,855
See accompanying notes to the basic financial statements.
Activities
Business-Type
22
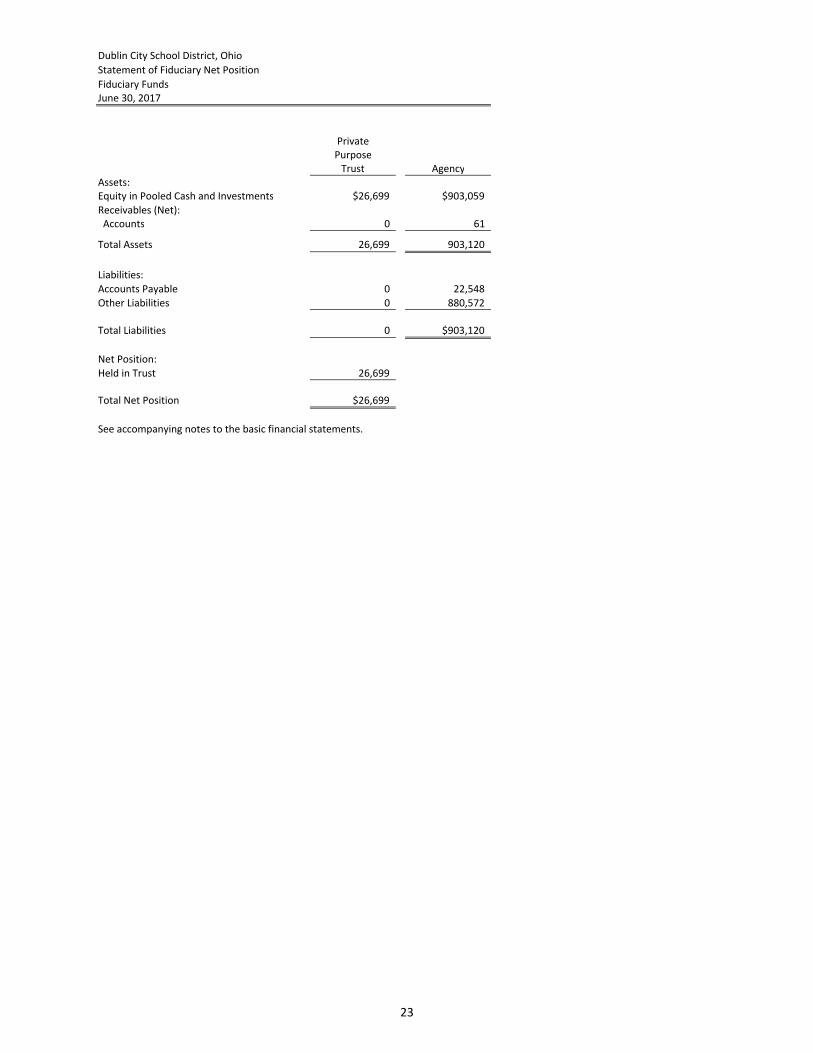
Dublin City School District, Ohio
Statement of Fiduciary Net Position
Fiduciary Funds
June 30, 2017
Private
Purpose
Trust Agency
Assets:
Equity in Pooled Cash and Investments $26,699 $903,059
Receivables (Net):
Accounts 0 61
Total Assets 26,699 903,120
Liabilities:
Accounts Payable 0 22,548
Other Liabilities 0 880,572
Total Liabilities 0 $903,120
Net Position:
Held in Trust 26,699
Total Net Position $26,699
See accompanying notes to the basic financial statements.
23
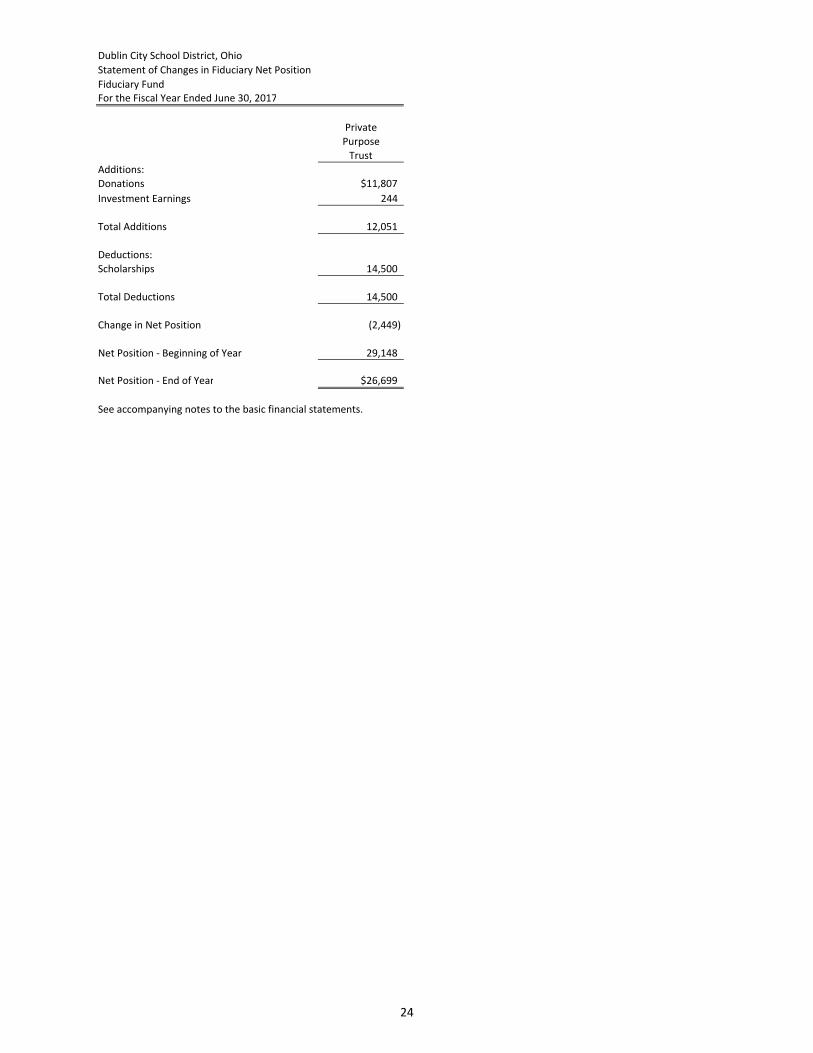
Dublin City School District, Ohio
Statement of Changes in Fiduciary Net Position
Fiduciary Fund
For the Fiscal Year Ended June 30, 2017
Private
Purpose
Trust
Additions:
Donations $11,807
Investment Earnings 244
Total Additions 12,051
Deductions:
Scholarships 14,500
Total Deductions 14,500
Change in Net Position (2,449)
Net Position - Beginning of Year 29,148
Net Position - End of Year $26,699
See accompanying notes to the basic financial statements.
24
Dublin City School District, Ohio
Notes to the Basic Financial Statements
For the Fiscal Year Ended June 30, 2017
Note 1 - Summary of Significant Accounting Policies
The significant accounting policies followed in the preparation of these financial statements are
summarized below. These policies conform to generally accepted accounting principles (GAAP) as
applied to governmental units prescribed in the statements issued by the Governmental Accounting
Standards Board (GASB) and other recognized authoritative sources.
Fund Accounting
The District’s accounts are maintained on the basis of funds, each of which is considered a separate
accounting entity. Fund accounting is designed to demonstrate legal compliance and to aid
management by segregating transactions related to specific District functions or activities. The
operation of each fund is accounted for within a separate set of self-balancing accounts.
Major Governmental Funds:
General Fund - The General Fund is the general operating fund of the District and is used to account for
all financial resources except those required to be accounted for in another fund.
Debt Service Fund - The Debt Service Fund is used to account for the accumulation of resources for, and
the payment of, general long-term debt principal, interest and related costs.
Major Enterprise Funds:
Food Service Fund – The Food Service Fund is used to account for all financial transactions related to the
food service operation.
Community Education Fund – The Community Education Fund is used to account for all financial
activities related to community education programs and operations.
Summer School Fund – The Summer School Fund is used to account for all financial activities related to
summer school operations. This program is primarily remedial in nature and is offered to both resident
and non-resident students.
Other Fund Types:
Internal Service Funds - Internal Service funds are used to account for the financing of health and vision
insurance and testing services provided by one department or agency to other departments or agencies
of the District on a cost-reimbursement basis.
Fiduciary Funds - Fiduciary Funds are used to account for assets held by the District in a trustee capacity
or as an agent for individuals, private organizations, other governmental units and/or other funds.
These include private-purpose trust and agency funds. Private-purpose trust funds account for
resources, including both principal and earnings, which must be expended according to the provision of
a trust agreement, and are accounted for in essentially the same manner as proprietary funds. The
private-purpose trust funds are primarily used for the award of scholarships to graduating seniors of the
District. Agency funds are purely custodial and thus do not involve measurement of results of
operations. The agency funds are primarily used to account for the resources collected for employee
portions of premiums and retirement as well as resources collected for the Win-Win Agreement with
Columbus City Schools and the liquidation of the established obligation owed.
25
Dublin City School District, Ohio
Notes to the Basic Financial Statements
For the Fiscal Year Ended June 30, 2017
Basis of Presentation
Government-wide Financial Statements – The statement of net position and the statement of activities
display information about the School District as a whole. These statements include the financial
activities of the primary government, except for fiduciary funds. As a general rule, the effect of
interfund activity has been eliminated from the government-wide financial statements except for
interfund services provided and used. Internal Service fund operating activity is eliminated to avoid
overstatement of revenues and expenses. The statements distinguish between governmental and
business-type activities of the District.
The government-wide statements are prepared using the economic resources measurement focus. This
is the same approach used in the preparation of proprietary fund financial statements but differs from
the manner in which governmental fund financial statements are prepared. Governmental fund
financial statements therefore include a reconciliation with brief explanations to better identify the
relationship between the government-wide statements and the statements for governmental funds.
The government-wide statement of activities presents a comparison between direct expenses and
program revenues for each segment of the business-type, and for each function or program of the
governmental activities of the District. Direct expenses are those that are specifically associated with a
service, program or department and therefore clearly identifiable to a particular function. Program
revenues include amounts paid by the recipient of goods or services offered by the program and grants
and contributions that are restricted to meeting the operational or capital requirements of a particular
program. Revenues not classified as program revenues are presented as general revenues of the
District.
Fund Financial Statements
Fund financial statements report detailed information about the District. The focus of governmental
and enterprise fund financial statements is on major funds rather than reporting funds by type. Each
major fund is presented in a separate column, and all nonmajor funds are aggregated into one column.
Internal Service funds are combined and the totals are presented in a single column on the face of the
proprietary fund statements. Fiduciary funds are reported by fund type.
The accounting and financial reporting treatment applied to a fund is determined by its measurement
focus. All governmental funds are accounted for using a flow of current financial resources
measurement focus. With this measurement focus, only current assets and current liabilities generally
are included on the balance sheet. Operating statements of these funds present increases (i.e.,
revenues and other financing sources) and decreases (i.e., expenditures and other financing uses) in net
current assets.
All proprietary funds and private-purpose trust funds are accounted for on a flow of economic resources
measurement focus. With this measurement focus, all assets and all liabilities associated with the
operations of these funds are included on the statement of net position. Fund equity (i.e., net total
position) is segregated into amounts invested in capital assets and unrestricted components.
Proprietary fund’s operating statements present increases (e.g., revenues) and decreases (expenses) in
net total position.
26
Dublin City School District, Ohio
Notes to the Basic Financial Statements
For the Fiscal Year Ended June 30, 2017
Proprietary funds distinguish operating revenues and expenses from nonoperating items. Operating
revenues and expenses generally result from providing services and producing and delivering goods in
connection with a proprietary fund’s principal ongoing operation. The principal operating revenues of
the Food Service enterprise fund, the Community Education enterprise fund, the Summer School
enterprise fund, and of the District’s internal service funds are charges for sales and services. Operating
expenses for enterprise funds and internal service funds include the cost of sales and services,
administrative expenses, and depreciation on capital assets. All revenues and expenses not meeting this
definition are reported as nonoperating revenues and expenses.
Basis of Accounting
Basis of accounting refers to when revenues and expenditures or expenses are recognized in the
accounts and reported in the financial statements. Government-wide financial statements are prepared
using the accrual basis of accounting. The Fund financial statements are prepared using either modified
accrual for governmental funds or accrual basis for proprietary and fiduciary funds.
Revenues, Exchange and Non-exchange Transactions
Revenue resulting from exchange transactions is recorded on the accrual basis when the exchange takes
place. On a modified accrual basis, revenues are recognized in the accounting period when they
become both measurable and available. Available means collectible within the current period or soon
enough thereafter to be used to pay liabilities of the current fiscal year. The available period of the
District is sixty days after year end.
Nonexchange transactions, in which the District receives value without directly giving equal value in
return, include property taxes, grants, entitlements and donations. On an accrual basis, revenue from
property taxes is recognized in the fiscal year for which the taxes are levied. Revenue from grants,
entitlements and donations is recognized in the fiscal year in which all eligibility requirements have been
met. On the modified accrual basis, revenue from nonexchange transactions must also be available
before it can be recognized.
In applying the susceptible to accrual concept under the modified accrual basis, the following revenue
sources are deemed both measurable and available: property taxes available for advance, investment
earnings, tuition, grants and student fees.
Unearned Revenue
Unearned revenue arises when assets are recognized before revenue recognition criteria have been
satisfied.
On proprietary fund financial statements, summer school receipts collected for classes that will be held
subsequent to year-end are reported as unearned revenue.
Deferred Outflows/Inflows of Resources
In addition to assets, the statements of financial position will sometimes report a separate section for
deferred outflows of resources. Deferred outflows of resources, represents a consumption of net
position that applies to a future period and will not be recognized as an outflow of resources
(expense/expenditure) until then. For the School District, deferred outflows or resources include a
27
Dublin City School District, Ohio
Notes to the Basic Financial Statements
For the Fiscal Year Ended June 30, 2017
deferred charge on refunding reported in the government-wide statement of net position. A deferred
charge on refunding results from the difference in the carrying value of refunded debt and its
reacquisition price. This amount is deferred and amortized over the shorter of the life of the refunded or
refunding debt. The deferred outflows of resources related to pension are reported on the
governmental-wide statement of net position. For more pension related information, see in Note 14.
In addition to liabilities, the statements of financial position report a separate section for deferred
inflows of resources. Deferred inflows of resources represent an acquisition of net position that applies
to a future period and will not be recognized as an inflow of resources (revenue) until that time. For the
School District, deferred inflows of resources include property taxes, deferred gain on refunding, and
grants and other taxes (which includes tax incremental financing ‘TIF’). Property taxes represent
amounts for which there is an enforceable legal claim as of June 30, 2017, but which were levied to
finance fiscal year 2018 operations. These amounts have been recorded as a deferred inflow on both the
government-wide statement of net position and the governmental fund financial statements. A deferred
gain on refunding has been recorded as deferred inflows on the governmental-wide statement of net
position. Other taxes (TIFs) have been recorded as deferred inflows on both the governmental-wide
statement of net position and the governmental fund financial statements. Grants have been recorded
as deferred inflows on the governmental fund financial statements.
Expenditures/Expenses
On the accrual basis of accounting, expenses are recorded at the time they are incurred. The
measurement focus of governmental fund accounting is on flow of current financial resources.
Expenditures are generally recognized in the accounting period in which the related fund liability is
incurred except for (1) principal and interest on general long-term debt, which are recorded as fund
liabilities when due and (2) the costs of accumulated unpaid vacation and sick leave are reported as fund
liabilities in which they will expect to be liquidated with expendable available financial resources to the
extent the liabilities mature in the period rather than in the period earned by employees.
Cash and Investments
The District maintains a cash and investment pool used by all funds. The cash and investment pool has
the same characteristics as demand deposits. Each fund’s portion of this pool is displayed in the
financial statements as cash and cash equivalents. Cash equivalent are defined by the District as being
able to withdraw resources without prior notice or penalty. The District utilizes a financial institution to
service bonded debt as principal and interest payments come due. The monies are either maintained in
a central bank account or used to purchase legal investments.
It is the policy of the District to value investment contracts and money market investments with
maturity of one year or less at the time of purchase at cost or amortized cost. Investment contracts and
money market investments that had a remaining maturity of greater than one year at the time of
purchase are reported at fair value.
STAR Ohio (the State Treasury Asset Reserve of Ohio), is an investment pool managed by the State
Treasurer’s Office which allows governments within the State to pool their funds for investment
purposes. STAR Ohio is not registered with the SEC as an investment company, but has adopted
Governmental Accounting Standards Board (GASB), Statement No. 79, “Certain External Investment
Pools and Pool Participants.” The District measures their investment in STAR Ohio at the net asset value
28
Dublin City School District, Ohio
Notes to the Basic Financial Statements
For the Fiscal Year Ended June 30, 2017
(NAV) per share provided by STAR Ohio. The NAV per share is calculated on an amortized cost basis that
provides an NAV per share that approximates fair value.
For 2017, there were no limitations or restrictions on any participant withdrawals due to redemption
notice periods, liquidity fees, or redemption gates. However, notice must be given 24 hours in advance
of all deposits and withdrawals exceeding $25 million. STAR Ohio reserves the right to limit the
transaction to $50 million, requiring the excess amount to be transacted the following business day(s),
but only to the $50 million limit. All accounts of the participant will be combined for these purposes.
The Ohio Revised Code authorizes the District to invest in United States and State of Ohio bonds, notes
and other obligations; bank certificates of deposit; banker’s acceptances; commercial paper notes rated
prime and issued by United States corporations; and STAR Ohio. It is management’s policy to invest in
all of the above types of investments. Under existing Ohio statutes, all investment earnings accrue to
the general, food service, and auxiliary funds except certain trust funds and those funds individually
authorized by Board resolution. Interest earnings are allocated to these funds based on average
monthly cash balances. Investment income credited to the general fund during the fiscal year
amounted to $1,087,257. Other Governmental Funds, Food Service Fund, and Self-Insurance Fund also
received interest revenue of $51,005, $9,557, and $109,394 respectively.
Prepaid Items
Payments made to vendors for services that will benefit periods beyond June 30, 2017, are recorded as
prepaid items using the consumption method. A current asset for the prepaid amount is recorded at the
time of the purchase and expenditure/expense is reported in the year in which the services are
consumed.
Inventory
On government-wide financial statements, inventories are presented at the lower of cost or market
using the first in, first out (FIFO) method and are expensed when used. On fund financial statements,
inventories of governmental funds are valued at cost while inventories of proprietary funds are stated at
lower of cost or market. For all funds, cost is determined using the FIFO method, and are determined by
physical count. Inventory in governmental funds consists of expendable supplies held for consumption.
The cost is recorded as an expenditure at the time of purchase. Reported inventories in these funds are
equally offset by a nonspendable fund balance, which indicates they do not represent available
spendable resources. Inventories of proprietary funds consist of donated and purchased food.
Capital Assets and Depreciation
General capital assets are those assets not specifically related to activities reported in the proprietary
funds. These assets are reported in the government-wide statement of net position but are not
reported in the fund financial statements. Capital assets utilized by proprietary funds are reported on
both statement types.
All capital assets are capitalized at cost (or estimated historical cost) and updated for additions and
retirements during the year. Donated capital assets are recorded at their acquisition values. Donated
capital assets, donated works of art and similar items, and capital assets received in a service concession
arrangement are reported at acquisition value rather than fair value. The District follows the policy of
not capitalizing assets with a cost of less than $1,000 and a useful life of less than 1 year.
29
Dublin City School District, Ohio
Notes to the Basic Financial Statements
For the Fiscal Year Ended June 30, 2017
All reported capital assets, with the exception of land and construction in progress, are depreciated.
Improvements are depreciated over the remaining useful lives of the related capital assets.
Depreciation is computed using the straight-line method over the following useful lives.
Description Useful Life
Land and Construction in Progress not depreciated
Land Improvements 30 years
Buildings & Improvements 10 – 50 years
Furniture and Equipment 5 – 15 years
Vehicles/Buses 10 years
Interfund Activity
Transfers between governmental and business-type activities on the entity-wide statements are
reported in the same manner as general revenues. Exchange transactions between funds are reported
as revenues in the seller funds and as expenditures/expenses in the purchaser funds. Flows of cash or
goods from one fund to another without a requirement for repayment are reported as interfund
transfers. Interfund transfers are reported as other financing sources/uses in governmental funds and
after nonoperating revenues/expenses in proprietary funds.
On fund financial statements, short-term interfund loans are classified as interfund receivables/
payables. These amounts are eliminated in the statement of net position, except for amounts due
between governmental and business-type activities, which are presented as internal balances.
Compensated Absences
Vacation benefits are accrued as a liability as the benefits are earned if the employee’s right to receive
compensation is attributable to services already rendered and it is probable that the employer will
compensate the employees for the benefits through paid time off or some other means. Sick leave
benefits are accrued as a liability using the vesting method. The liability is based on the sick leave
accumulated at June 30 by those employees who are currently eligible to receive termination payments
and those employees for whom it is probable they will become eligible to receive termination benefits in
the future. The criteria for determining the vacation and sick leave liability is derived from Board policy,
negotiated agreements, and state laws. The general fund is primarily responsible for liquidating the
liability.
The entire compensated absence liability is reported on the government-wide financial statements. For
governmental fund financial statements, the amount of accumulated vacation and sick leave of
employees has been recorded as a current liability to the extent that the amounts are expected to be
paid using expendable available financial resources to the extent that the liabilities mature each period.
The balance of the liability is not recorded, only the matured compensated absences are reported. For
proprietary funds, the entire amount of compensated absences is recorded as an expense and liability of
the fund.
Pensions
For purposes of measuring the net pension liability, deferred outflows of resources and deferred inflows
of resources related to pensions, and pension expense, information about the fiduciary net position of
the pension plans and additions to/deductions from their fiduciary net position have been determined
on the same basis as they are reported by the pension systems. For this purpose, benefit payments
30
Dublin City School District, Ohio
Notes to the Basic Financial Statements
For the Fiscal Year Ended June 30, 2017
(including refunds of employee contributions) are recognized when due and payable in accordance with
the benefit terms. The pension systems report investments at fair value.
Accrued Liabilities and Long-term Debt
All accrued liabilities and long-term debt are reported in the government-wide financial statements as
well as the proprietary fund financial statements.
For governmental fund financial statements, the accrued liabilities are generally reported as a
governmental fund liability if due for payment as of the balance sheet date regardless of whether they
will be liquidated with current financial resources. However, claims and judgments and compensated
absences paid from governmental funds (typically the General fund) are reported as a liability in the
fund financial statements only for the portion expected to be financed from expendable available
financial resources to the extent the liabilities mature in the period. Long-term debt paid from
governmental funds is not recognized as a liability in the fund financial statements.
Deferred charges and bond premiums are deferred and amortized over the term of the bonds using the
bonds-outstanding method, which approximates the effective interest method. Deferred charges are
recorded as deferred outflows and generally paid from debt proceeds. On the governmental fund
financial statements, deferred outflows, and bond premiums are recognized in the period in which the
bonds are issued.
Net Position
Net Position represents the difference between assets and deferred outflows and liabilities and deferred
inflows. Net investment in capital assets consists of capital assets, net of accumulated depreciation,
reduced by the outstanding balances of any borrowings used for the acquisition, construction or
improvement of those assets. Net position is reported as restricted when there are limitations imposed
on their use through external restrictions imposed by creditors, grantors or laws or regulations of other
governments. Net position restricted for other purposes include resources restricted for non-public
schools and community involvement. The District applies restricted resources when an expense is
incurred for purposes for which both restricted and unrestricted net position are available.
Fund Balance
The District reports classifications of fund equity based on the purpose for which resources were
received and the level of constraint placed on the resources. Nonspendable fund balance indicates
resources that are not expected to be converted to cash because they are not in a spendable form.
Resources that have purpose constraints placed upon them by laws, regulations, creditors, grantors, or
other external parties are considered available only for the purpose for which they were received and
are reported as a restricted fund balance. The District may limit the use of unrestricted resources and
may be reported as committed or assigned fund balance depending on at what level of governance the
constraints were placed. With an affirmative vote of its members, the Board of Education may create
funds for which resources are committed to the established purpose of that fund. Through the District’s
purchasing policy the Board has given the Treasurer the authority to constrain monies for intended
purposes, which are reported as assigned fund balances. All other funds in spendable form not
restricted, committed, or assigned are reported as an unassigned fund balance.
The District applies restricted resources when an expense is incurred for purposes for which both
restricted and unrestricted net positions are available. The District considers committed, assigned, and
31
Dublin City School District, Ohio Notes to the Basic Financial Statements For the Fiscal Year Ended June 30, 2017
unassigned fund balances, respectively, to be spent when expenditures are incurred for purposes for which any of the unrestricted fund balance classifications could be used. Note 2 - Description of the District and Reporting Entity The Dublin City School District (the “District”) is a body politic and corporate established for the purpose of exercising the rights and privileges conveyed to it by the constitution and laws of the State of Ohio. The District is a city district as defined by Section 3311.02 of the Ohio Revised Code. The District operates under a locally elected five member board and is responsible for the provision of public education to residents of the District. The Board controls the District’s twenty-three instructional/support facilities staffed by 622 non-certificated employees, 1,130 certificated full time-teaching personnel and 61 administrative employees to provide services to approximately 15,866 students and other community members. Reporting Entity The District’s Comprehensive Annual Financial Report (CAFR) includes all funds, agencies and boards for which the District is financially accountable. Governmental Accounting Standards Board (GASB) states the primary basis of determining whether outside agencies and organizations should be considered component units of the District and included in the District’s financial statements is financial accountability. Financial accountability has been defined as follows: A primary government has substantive authority to appoint a voting majority of the component unit’s board; the primary government is either able to impose its will on a component unit or there is a potential for the component unit to provide specific financial burdens on the primary government; and the component unit is fiscally dependent on the primary government. The District has no component units. Note 3 - Fund Deficits At June 30, 2017, the following funds had a deficit fund balance:
Fund Deficit Fund Deficit
Other Governmental Funds: Proprietary Funds:
Miscellaneous State Grant $12,768 Food Service $230,146
IDEA 73,354 Summer School 281,442
Title I 71,453
Title III 9,499
IDEA Preschool Grant 558
Title II-A 10,529
Miscellaneous Federal Grants 3,637
The deficits were caused by the application of generally accepted accounting principles. Note 4 - Equity in Pooled Cash and Investments State statutes require the classification of monies held by the District into three categories. Active Monies - Those monies required to be kept in a “cash” or “near-cash” status for immediate use by the district. Such monies must be maintained either as cash in the District Treasury, in depository accounts payable or withdrawable on demand, including negotiable order of withdrawal (NOW)
32
Dublin City School District, Ohio
Notes to the Basic Financial Statements
For the Fiscal Year Ended June 30, 2017
accounts, or in money market deposit accounts.
Inactive Monies - Those monies not required for use within the current five year period of designation of
depositories. Inactive monies may be deposited or invested as certificates of deposit maturing not later
than the end of the current period of designation of depositories, or as savings or deposit accounts
including, but not limited to, passbook accounts.
Interim Monies - Those monies which are not needed for immediate use but which will be needed
before the end of the current period of designation of depositories. Ohio law permits interim monies to
be invested in legal securities.
Deposits
Custodial credit risk is the risk that in the event of bank failure, the District’s deposits may not be
returned to it. Protection of District cash and deposits is provided by the federal deposit insurance
corporation as well as qualified securities pledged by the institution holding the assets. By law and
District investment policy, financial institutions must collateralize all public deposits and the face value
of the pooled collateral must equal at least 105 percent of public funds deposited. Collateral is held by
trustees including the Federal Reserve Bank and designated third party trustees of the financial
institutions.
At year end, the bank balance was $13,870,661. Of the bank balance, $5,250,000 was covered by
standard federal depository insurance. The remaining balance was uninsured. Of the uninsured bank
balance, all was collateralized with securities held by the pledging institution’s trust department not in
the District’s name or as specific collateral held in the name of the District.
Investments
As of June 30, 2017, the District had the following investments:
Fair Value Weighted Average
Fair Value Hierarchy Maturity (Years)
Anthem Stock $1,862,100 Level 1 0.00
Federal Home Loan Mortgage Corporation 9,842,020 Level 2 1.28
Federal Home Loan Bank 4,281,622 Level 2 2.79
Federal Farm Credit Bank 996,808 Level 2 0.99
Negotiable CDs 7,408,496 Level 2 0.46
Federal National Mortgage Association 16,377,894 Level 2 3.01
Commercial Paper 11,629,639 Level 2 0.48
StarOhio 34,980,952 N/A 0.12
Money Market Funds 42,235 N/A 0.00
Total Fair Value $87,421,766
Portfolio Weighted Average Maturity 1.03
The District categorizes its fair value measurements within the fair value hierarchy established by
generally accepted accounting principles. The hierarchy is based on the valuation inputs used to
measure the fair value of the asset. Level 1 inputs are quoted prices in active markets for identical
assets. Level 2 inputs are significant other observable inputs. Level 3 inputs are significant
33
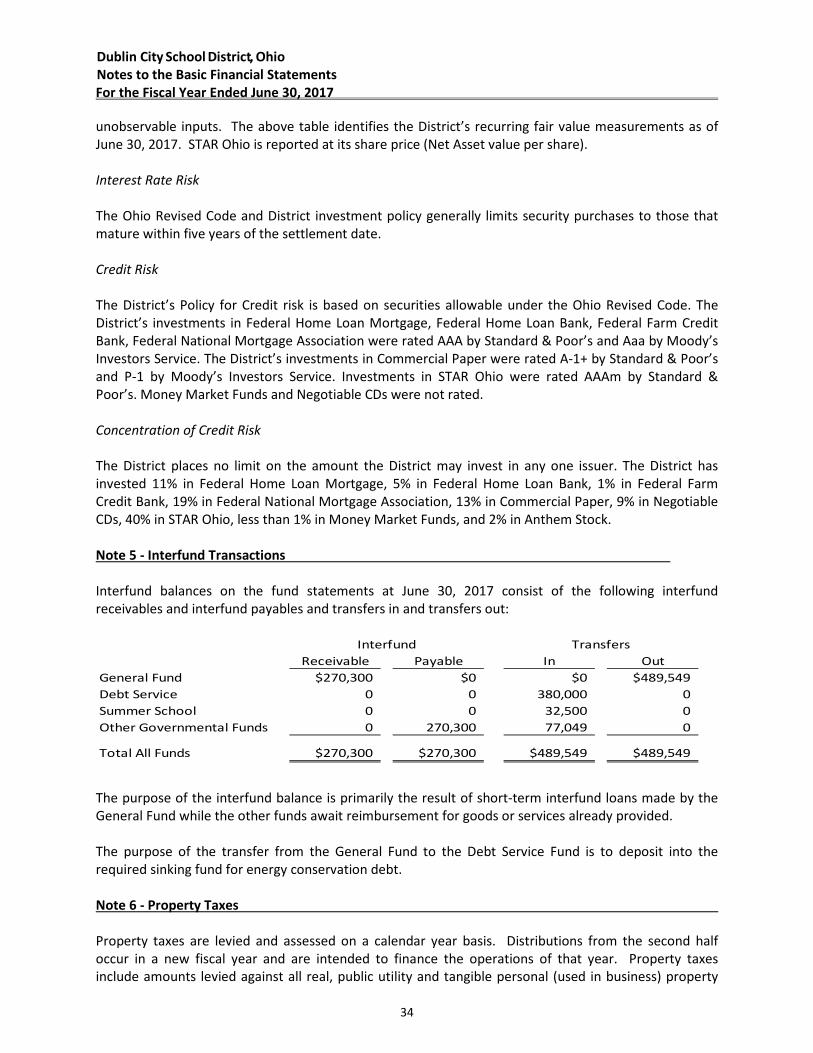
Dublin City School District, Ohio
Notes to the Basic Financial Statements
For the Fiscal Year Ended June 30, 2017
unobservable inputs. The above table identifies the District’s recurring fair value measurements as of
June 30, 2017. STAR Ohio is reported at its share price (Net Asset value per share).
Interest Rate Risk
The Ohio Revised Code and District investment policy generally limits security purchases to those that
mature within five years of the settlement date.
Credit Risk
The District’s Policy for Credit risk is based on securities allowable under the Ohio Revised Code. The
District’s investments in Federal Home Loan Mortgage, Federal Home Loan Bank, Federal Farm Credit
Bank, Federal National Mortgage Association were rated AAA by Standard & Poor’s and Aaa by Moody’s
Investors Service. The District’s investments in Commercial Paper were rated A-1+ by Standard & Poor’s
and P-1 by Moody’s Investors Service. Investments in STAR Ohio were rated AAAm by Standard &
Poor’s. Money Market Funds and Negotiable CDs were not rated.
Concentration of Credit Risk
The District places no limit on the amount the District may invest in any one issuer. The District has
invested 11% in Federal Home Loan Mortgage, 5% in Federal Home Loan Bank, 1% in Federal Farm
Credit Bank, 19% in Federal National Mortgage Association, 13% in Commercial Paper, 9% in Negotiable
CDs, 40% in STAR Ohio, less than 1% in Money Market Funds, and 2% in Anthem Stock.
Note 5 - Interfund Transactions
Interfund balances on the fund statements at June 30, 2017 consist of the following interfund
receivables and interfund payables and transfers in and transfers out:
Receivable Payable In Out
General Fund $270,300 $0 $0 $489,549
Debt Service 0 0 380,000 0
Summer School 0 0 32,500 0
Other Governmental Funds 0 270,300 77,049 0
Total All Funds $270,300 $270,300 $489,549 $489,549
Interfund Transfers
The purpose of the interfund balance is primarily the result of short-term interfund loans made by the
General Fund while the other funds await reimbursement for goods or services already provided.
The purpose of the transfer from the General Fund to the Debt Service Fund is to deposit into the
required sinking fund for energy conservation debt.
Note 6 - Property Taxes
Property taxes are levied and assessed on a calendar year basis. Distributions from the second half
occur in a new fiscal year and are intended to finance the operations of that year. Property taxes
include amounts levied against all real, public utility and tangible personal (used in business) property
34
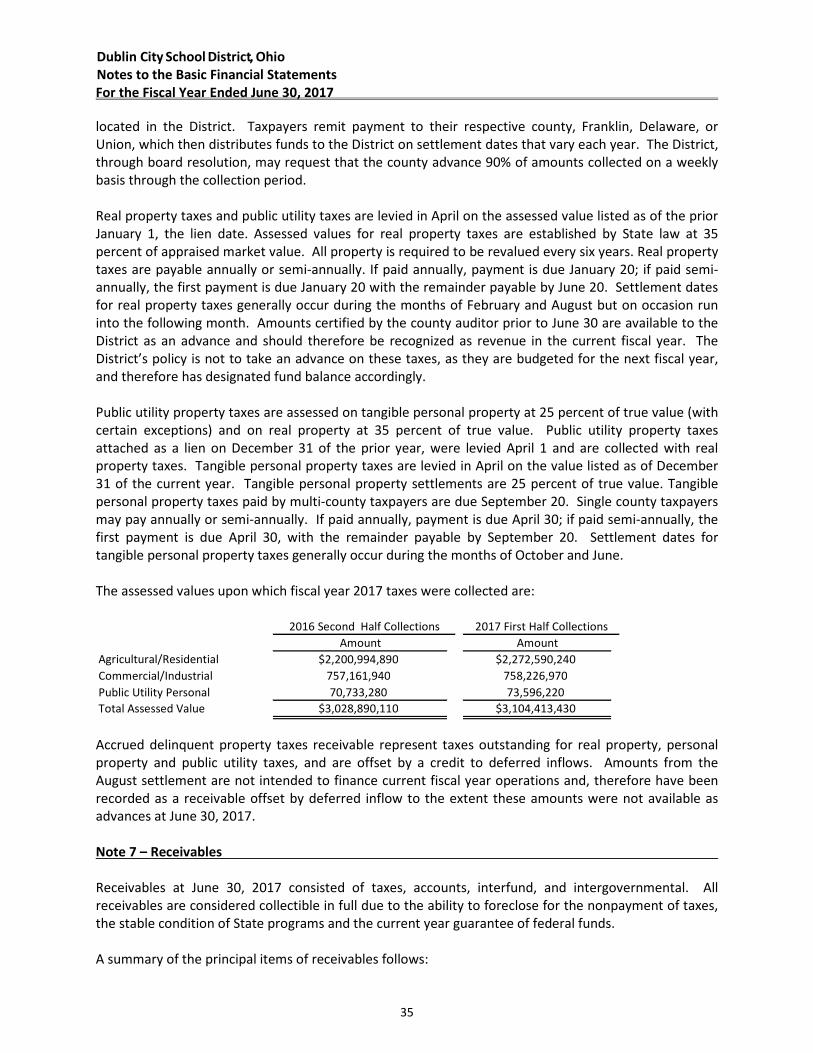
Dublin City School District, Ohio
Notes to the Basic Financial Statements
For the Fiscal Year Ended June 30, 2017
located in the District. Taxpayers remit payment to their respective county, Franklin, Delaware, or
Union, which then distributes funds to the District on settlement dates that vary each year. The District,
through board resolution, may request that the county advance 90% of amounts collected on a weekly
basis through the collection period.
Real property taxes and public utility taxes are levied in April on the assessed value listed as of the prior
January 1, the lien date. Assessed values for real property taxes are established by State law at 35
percent of appraised market value. All property is required to be revalued every six years. Real property
taxes are payable annually or semi-annually. If paid annually, payment is due January 20; if paid semi-
annually, the first payment is due January 20 with the remainder payable by June 20. Settlement dates
for real property taxes generally occur during the months of February and August but on occasion run
into the following month. Amounts certified by the county auditor prior to June 30 are available to the
District as an advance and should therefore be recognized as revenue in the current fiscal year. The
District’s policy is not to take an advance on these taxes, as they are budgeted for the next fiscal year,
and therefore has designated fund balance accordingly.
Public utility property taxes are assessed on tangible personal property at 25 percent of true value (with
certain exceptions) and on real property at 35 percent of true value. Public utility property taxes
attached as a lien on December 31 of the prior year, were levied April 1 and are collected with real
property taxes. Tangible personal property taxes are levied in April on the value listed as of December
31 of the current year. Tangible personal property settlements are 25 percent of true value. Tangible
personal property taxes paid by multi-county taxpayers are due September 20. Single county taxpayers
may pay annually or semi-annually. If paid annually, payment is due April 30; if paid semi-annually, the
first payment is due April 30, with the remainder payable by September 20. Settlement dates for
tangible personal property taxes generally occur during the months of October and June.
The assessed values upon which fiscal year 2017 taxes were collected are:
Amount Amount
Agricultural/Residential $2,200,994,890 $2,272,590,240
Commercial/Industrial 757,161,940 758,226,970
Public Utility Personal 70,733,280 73,596,220
Total Assessed Value $3,028,890,110 $3,104,413,430
2016 Second Half Collections 2017 First Half Collections
Accrued delinquent property taxes receivable represent taxes outstanding for real property, personal
property and public utility taxes, and are offset by a credit to deferred inflows. Amounts from the
August settlement are not intended to finance current fiscal year operations and, therefore have been
recorded as a receivable offset by deferred inflow to the extent these amounts were not available as
advances at June 30, 2017.
Note 7 – Receivables
Receivables at June 30, 2017 consisted of taxes, accounts, interfund, and intergovernmental. All
receivables are considered collectible in full due to the ability to foreclose for the nonpayment of taxes,
the stable condition of State programs and the current year guarantee of federal funds.
A summary of the principal items of receivables follows:
35
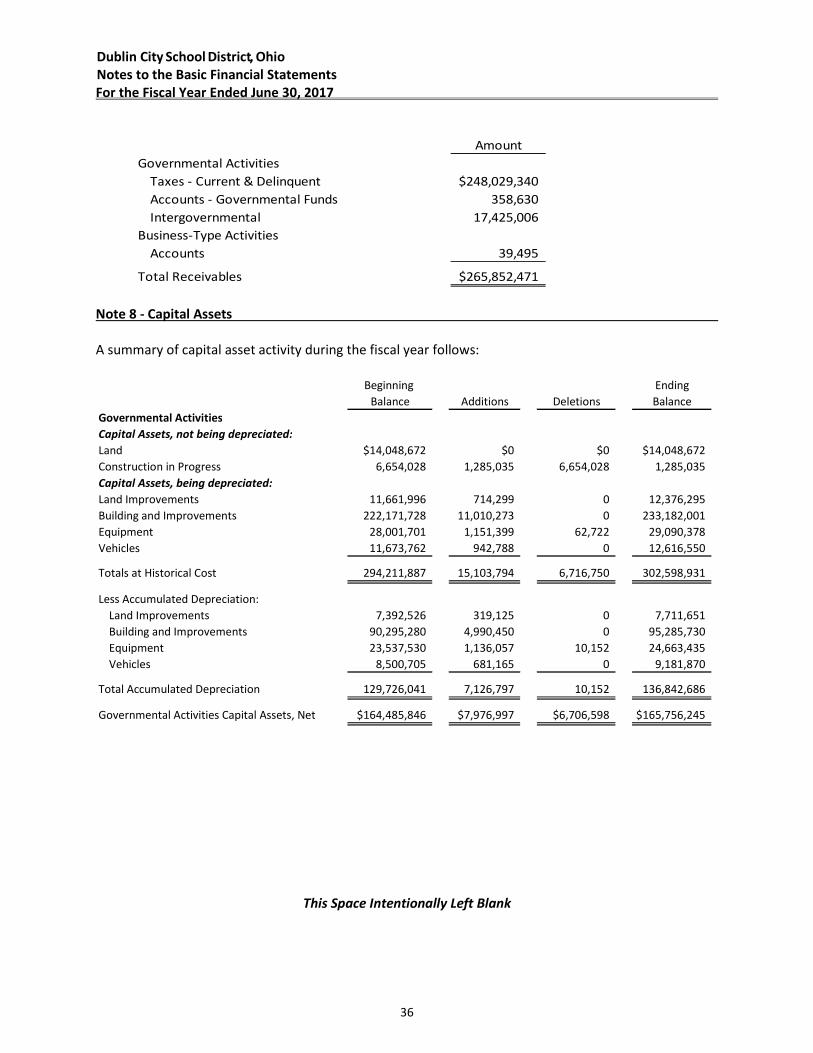
Dublin City School District, Ohio
Notes to the Basic Financial Statements
For the Fiscal Year Ended June 30, 2017
Amount
Governmental Activities
Taxes - Current & Delinquent $248,029,340
Accounts - Governmental Funds 358,630
Intergovernmental 17,425,006
Business-Type Activities
Accounts 39,495
Total Receivables $265,852,471
Note 8 - Capital Assets
A summary of capital asset activity during the fiscal year follows:
Beginning Ending
Balance Additions Deletions Balance
Governmental Activities
Capital Assets, not being depreciated:
Land $14,048,672 $0 $0 $14,048,672
Construction in Progress 6,654,028 1,285,035 6,654,028 1,285,035
Capital Assets, being depreciated:
Land Improvements 11,661,996 714,299 0 12,376,295
Building and Improvements 222,171,728 11,010,273 0 233,182,001
Equipment 28,001,701 1,151,399 62,722 29,090,378
Vehicles 11,673,762 942,788 0 12,616,550
Totals at Historical Cost 294,211,887 15,103,794 6,716,750 302,598,931
Less Accumulated Depreciation:
Land Improvements 7,392,526 319,125 0 7,711,651
Building and Improvements 90,295,280 4,990,450 0 95,285,730
Equipment 23,537,530 1,136,057 10,152 24,663,435
Vehicles 8,500,705 681,165 0 9,181,870
Total Accumulated Depreciation 129,726,041 7,126,797 10,152 136,842,686
Governmental Activities Capital Assets, Net $164,485,846 $7,976,997 $6,706,598 $165,756,245
This Space Intentionally Left Blank
36
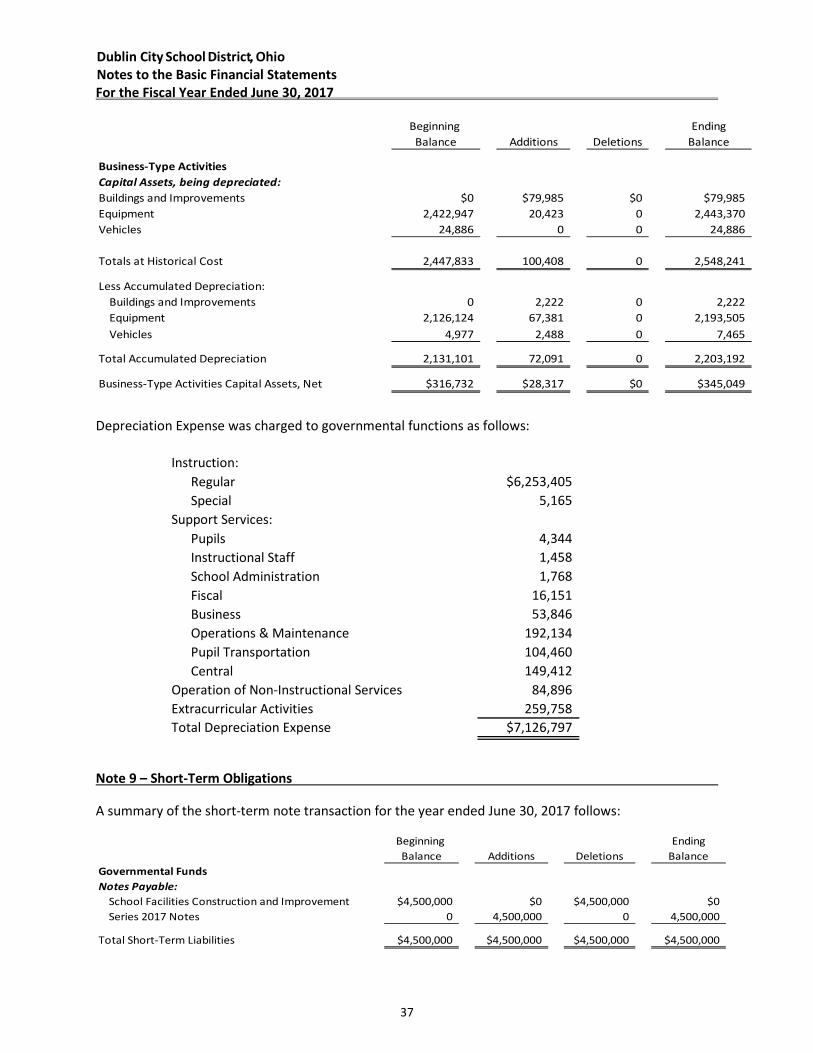
Dublin City School District, Ohio
Notes to the Basic Financial Statements
For the Fiscal Year Ended June 30, 2017
Beginning Ending
Balance Additions Deletions Balance
Business-Type Activities
Capital Assets, being depreciated:
Buildings and Improvements $0 $79,985 $0 $79,985
Equipment 2,422,947 20,423 0 2,443,370
Vehicles 24,886 0 0 24,886
Totals at Historical Cost 2,447,833 100,408 0 2,548,241
Less Accumulated Depreciation:
Buildings and Improvements 0 2,222 0 2,222
Equipment 2,126,124 67,381 0 2,193,505
Vehicles 4,977 2,488 0 7,465
Total Accumulated Depreciation 2,131,101 72,091 0 2,203,192
Business-Type Activities Capital Assets, Net $316,732 $28,317 $0 $345,049
Depreciation Expense was charged to governmental functions as follows:
Instruction:
Regular $6,253,405
Special 5,165
Support Services:
Pupils 4,344
Instructional Staff 1,458
School Administration 1,768
Fiscal 16,151
Business 53,846
Operations & Maintenance 192,134
Pupil Transportation 104,460
Central 149,412
Operation of Non-Instructional Services 84,896
Extracurricular Activities 259,758
Total Depreciation Expense $7,126,797
Note 9 – Short-Term Obligations
A summary of the short-term note transaction for the year ended June 30, 2017 follows:
Beginning Ending
Balance Additions Deletions Balance
Governmental Funds
Notes Payable:
School Facilities Construction and Improvement $4,500,000 $0 $4,500,000 $0
Series 2017 Notes 0 4,500,000 0 4,500,000
Total Short-Term Liabilities $4,500,000 $4,500,000 $4,500,000 $4,500,000
37

Dublin City School District, Ohio
Notes to the Basic Financial Statements
For the Fiscal Year Ended June 30, 2017
The $4,500,000 of Bond Anticipation Notes was issued to pay for construction of buildings.
Note 10 - Long-Term Debt
Long-Term Liabilities
The following changes occurred in long-term liabilities during the year.
This Space Intentionally Left Blank
38
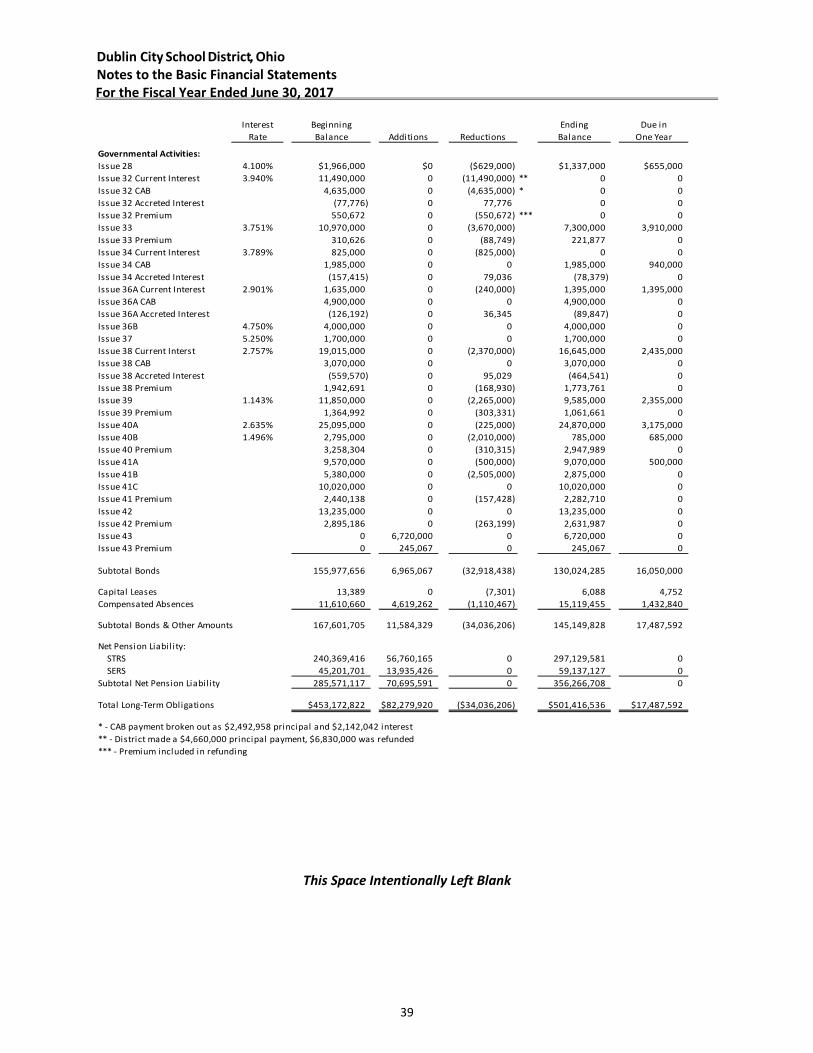
Dublin City School District, Ohio
Notes to the Basic Financial Statements
For the Fiscal Year Ended June 30, 2017
Interest Beginning Ending Due in
Rate Balance Additions Reductions Balance One Year
Governmental Activities:
Issue 28 4.100% $1,966,000 $0 ($629,000) $1,337,000 $655,000
Issue 32 Current Interest 3.940% 11,490,000 0 (11,490,000) ** 0 0
Issue 32 CAB 4,635,000 0 (4,635,000) * 0 0
Issue 32 Accreted Interest (77,776) 0 77,776 0 0
Issue 32 Premium 550,672 0 (550,672) *** 0 0
Issue 33 3.751% 10,970,000 0 (3,670,000) 7,300,000 3,910,000
Issue 33 Premium 310,626 0 (88,749) 221,877 0
Issue 34 Current Interest 3.789% 825,000 0 (825,000) 0 0
Issue 34 CAB 1,985,000 0 0 1,985,000 940,000
Issue 34 Accreted Interest (157,415) 0 79,036 (78,379) 0
Issue 36A Current Interest 2.901% 1,635,000 0 (240,000) 1,395,000 1,395,000
Issue 36A CAB 4,900,000 0 0 4,900,000 0
Issue 36A Accreted Interest (126,192) 0 36,345 (89,847) 0
Issue 36B 4.750% 4,000,000 0 0 4,000,000 0
Issue 37 5.250% 1,700,000 0 0 1,700,000 0
Issue 38 Current Interst 2.757% 19,015,000 0 (2,370,000) 16,645,000 2,435,000
Issue 38 CAB 3,070,000 0 0 3,070,000 0
Issue 38 Accreted Interest (559,570) 0 95,029 (464,541) 0
Issue 38 Premium 1,942,691 0 (168,930) 1,773,761 0
Issue 39 1.143% 11,850,000 0 (2,265,000) 9,585,000 2,355,000
Issue 39 Premium 1,364,992 0 (303,331) 1,061,661 0
Issue 40A 2.635% 25,095,000 0 (225,000) 24,870,000 3,175,000
Issue 40B 1.496% 2,795,000 0 (2,010,000) 785,000 685,000
Issue 40 Premium 3,258,304 0 (310,315) 2,947,989 0
Issue 41A 9,570,000 0 (500,000) 9,070,000 500,000
Issue 41B 5,380,000 0 (2,505,000) 2,875,000 0
Issue 41C 10,020,000 0 0 10,020,000 0
Issue 41 Premium 2,440,138 0 (157,428) 2,282,710 0
Issue 42 13,235,000 0 0 13,235,000 0
Issue 42 Premium 2,895,186 0 (263,199) 2,631,987 0
Issue 43 0 6,720,000 0 6,720,000 0
Issue 43 Premium 0 245,067 0 245,067 0
Subtotal Bonds 155,977,656 6,965,067 (32,918,438) 130,024,285 16,050,000
Capital Leases 13,389 0 (7,301) 6,088 4,752
Compensated Absences 11,610,660 4,619,262 (1,110,467) 15,119,455 1,432,840
Subtotal Bonds & Other Amounts 167,601,705 11,584,329 (34,036,206) 145,149,828 17,487,592
Net Pension Liabil ity:
STRS 240,369,416 56,760,165 0 297,129,581 0
SERS 45,201,701 13,935,426 0 59,137,127 0
Subtotal Net Pension Liabil ity 285,571,117 70,695,591 0 356,266,708 0
Total Long-Term Obligations $453,172,822 $82,279,920 ($34,036,206) $501,416,536 $17,487,592
* - CAB payment broken out as $2,492,958 principal and $2,142,042 interest
** - District made a $4,660,000 principal payment, $6,830,000 was refunded
*** - Premium included in refunding
This Space Intentionally Left Blank
39
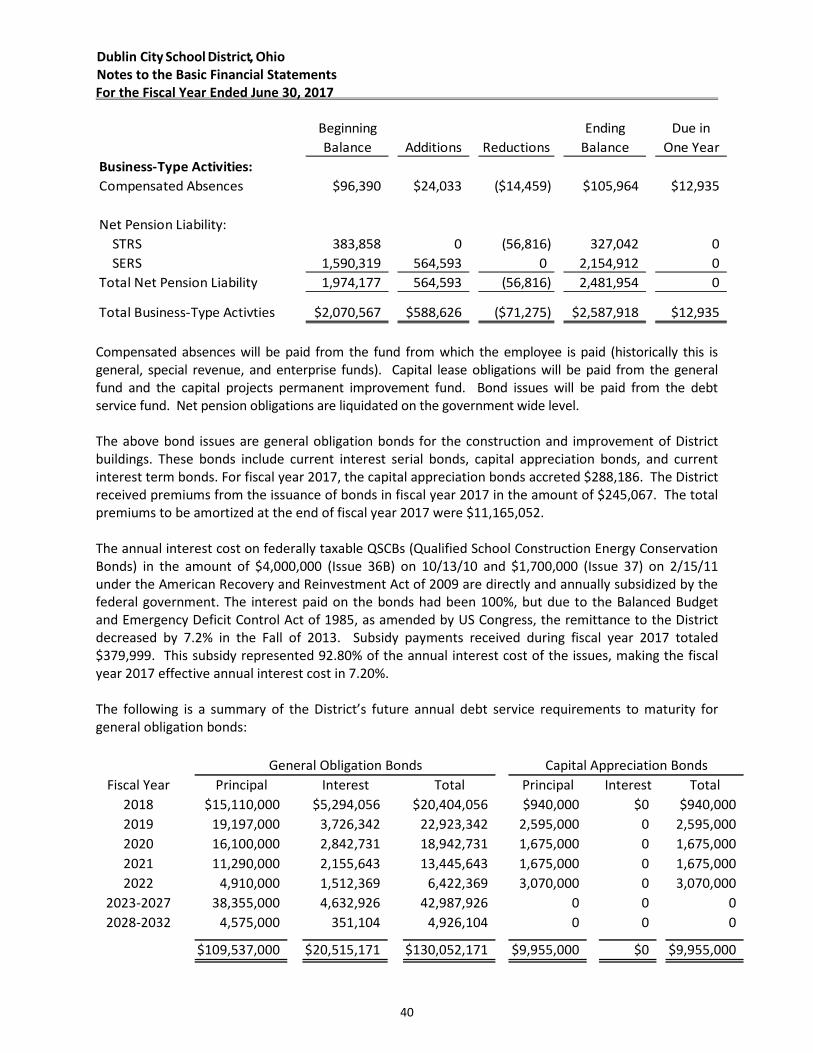
Dublin City School District, Ohio
Notes to the Basic Financial Statements
For the Fiscal Year Ended June 30, 2017
Beginning Ending Due in
Balance Additions Reductions Balance One Year
Business-Type Activities:
Compensated Absences $96,390 $24,033 ($14,459) $105,964 $12,935
Net Pension Liability:
STRS 383,858 0 (56,816) 327,042 0
SERS 1,590,319 564,593 0 2,154,912 0
Total Net Pension Liability 1,974,177 564,593 (56,816) 2,481,954 0
Total Business-Type Activties $2,070,567 $588,626 ($71,275) $2,587,918 $12,935
Compensated absences will be paid from the fund from which the employee is paid (historically this is
general, special revenue, and enterprise funds). Capital lease obligations will be paid from the general
fund and the capital projects permanent improvement fund. Bond issues will be paid from the debt
service fund. Net pension obligations are liquidated on the government wide level.
The above bond issues are general obligation bonds for the construction and improvement of District
buildings. These bonds include current interest serial bonds, capital appreciation bonds, and current
interest term bonds. For fiscal year 2017, the capital appreciation bonds accreted $288,186. The District
received premiums from the issuance of bonds in fiscal year 2017 in the amount of $245,067. The total
premiums to be amortized at the end of fiscal year 2017 were $11,165,052.
The annual interest cost on federally taxable QSCBs (Qualified School Construction Energy Conservation
Bonds) in the amount of $4,000,000 (Issue 36B) on 10/13/10 and $1,700,000 (Issue 37) on 2/15/11
under the American Recovery and Reinvestment Act of 2009 are directly and annually subsidized by the
federal government. The interest paid on the bonds had been 100%, but due to the Balanced Budget
and Emergency Deficit Control Act of 1985, as amended by US Congress, the remittance to the District
decreased by 7.2% in the Fall of 2013. Subsidy payments received during fiscal year 2017 totaled
$379,999. This subsidy represented 92.80% of the annual interest cost of the issues, making the fiscal
year 2017 effective annual interest cost in 7.20%.
The following is a summary of the District’s future annual debt service requirements to maturity for
general obligation bonds:
Fiscal Year Principal Interest Total Principal Interest Total
2018 $15,110,000 $5,294,056 $20,404,056 $940,000 $0 $940,000
2019 19,197,000 3,726,342 22,923,342 2,595,000 0 2,595,000
2020 16,100,000 2,842,731 18,942,731 1,675,000 0 1,675,000
2021 11,290,000 2,155,643 13,445,643 1,675,000 0 1,675,000
2022 4,910,000 1,512,369 6,422,369 3,070,000 0 3,070,000
2023-2027 38,355,000 4,632,926 42,987,926 0 0 0
2028-2032 4,575,000 351,104 4,926,104 0 0 0
$109,537,000 $20,515,171 $130,052,171 $9,955,000 $0 $9,955,000
General Obligation Bonds Capital Appreciation Bonds
40
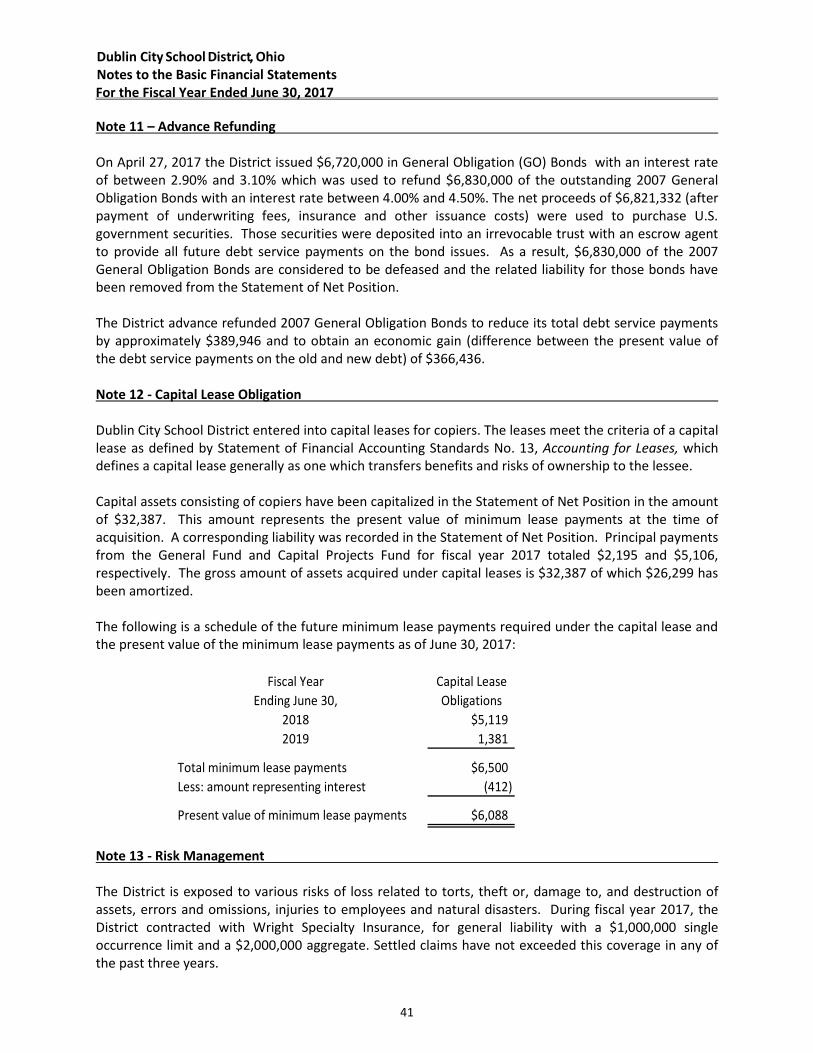
Dublin City School District, Ohio
Notes to the Basic Financial Statements
For the Fiscal Year Ended June 30, 2017
Note 11 – Advance Refunding
On April 27, 2017 the District issued $6,720,000 in General Obligation (GO) Bonds with an interest rate
of between 2.90% and 3.10% which was used to refund $6,830,000 of the outstanding 2007 General
Obligation Bonds with an interest rate between 4.00% and 4.50%. The net proceeds of $6,821,332 (after
payment of underwriting fees, insurance and other issuance costs) were used to purchase U.S.
government securities. Those securities were deposited into an irrevocable trust with an escrow agent
to provide all future debt service payments on the bond issues. As a result, $6,830,000 of the 2007
General Obligation Bonds are considered to be defeased and the related liability for those bonds have
been removed from the Statement of Net Position.
The District advance refunded 2007 General Obligation Bonds to reduce its total debt service payments
by approximately $389,946 and to obtain an economic gain (difference between the present value of
the debt service payments on the old and new debt) of $366,436.
Note 12 - Capital Lease Obligation
Dublin City School District entered into capital leases for copiers. The leases meet the criteria of a capital
lease as defined by Statement of Financial Accounting Standards No. 13, Accounting for Leases, which
defines a capital lease generally as one which transfers benefits and risks of ownership to the lessee.
Capital assets consisting of copiers have been capitalized in the Statement of Net Position in the amount
of $32,387. This amount represents the present value of minimum lease payments at the time of
acquisition. A corresponding liability was recorded in the Statement of Net Position. Principal payments
from the General Fund and Capital Projects Fund for fiscal year 2017 totaled $2,195 and $5,106,
respectively. The gross amount of assets acquired under capital leases is $32,387 of which $26,299 has
been amortized.
The following is a schedule of the future minimum lease payments required under the capital lease and
the present value of the minimum lease payments as of June 30, 2017:
Fiscal Year Capital Lease
Ending June 30, Obligations
2018 $5,119
2019 1,381
Total minimum lease payments $6,500
Less: amount representing interest (412)
Present value of minimum lease payments $6,088
Note 13 - Risk Management
The District is exposed to various risks of loss related to torts, theft or, damage to, and destruction of
assets, errors and omissions, injuries to employees and natural disasters. During fiscal year 2017, the
District contracted with Wright Specialty Insurance, for general liability with a $1,000,000 single
occurrence limit and a $2,000,000 aggregate. Settled claims have not exceeded this coverage in any of
the past three years.
41
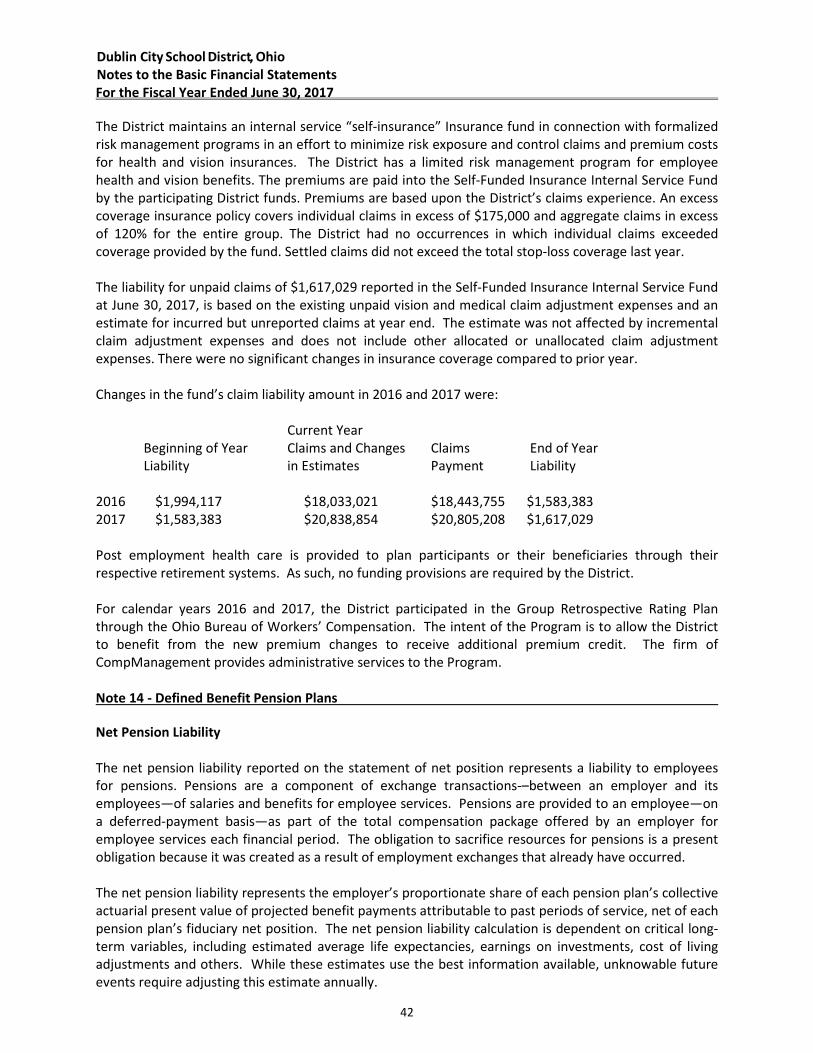
Dublin City School District, Ohio
Notes to the Basic Financial Statements
For the Fiscal Year Ended June 30, 2017
The District maintains an internal service “self-insurance” Insurance fund in connection with formalized
risk management programs in an effort to minimize risk exposure and control claims and premium costs
for health and vision insurances. The District has a limited risk management program for employee
health and vision benefits. The premiums are paid into the Self-Funded Insurance Internal Service Fund
by the participating District funds. Premiums are based upon the District’s claims experience. An excess
coverage insurance policy covers individual claims in excess of $175,000 and aggregate claims in excess
of 120% for the entire group. The District had no occurrences in which individual claims exceeded
coverage provided by the fund. Settled claims did not exceed the total stop-loss coverage last year.
The liability for unpaid claims of $1,617,029 reported in the Self-Funded Insurance Internal Service Fund
at June 30, 2017, is based on the existing unpaid vision and medical claim adjustment expenses and an
estimate for incurred but unreported claims at year end. The estimate was not affected by incremental
claim adjustment expenses and does not include other allocated or unallocated claim adjustment
expenses. There were no significant changes in insurance coverage compared to prior year.
Changes in the fund’s claim liability amount in 2016 and 2017 were:
Current Year
Beginning of Year Claims and Changes Claims End of Year
Liability in Estimates Payment Liability
2016 $1,994,117 $18,033,021 $18,443,755 $1,583,383
2017 $1,583,383 $20,838,854 $20,805,208 $1,617,029
Post employment health care is provided to plan participants or their beneficiaries through their
respective retirement systems. As such, no funding provisions are required by the District.
For calendar years 2016 and 2017, the District participated in the Group Retrospective Rating Plan
through the Ohio Bureau of Workers’ Compensation. The intent of the Program is to allow the District
to benefit from the new premium changes to receive additional premium credit. The firm of
CompManagement provides administrative services to the Program.
Note 14 - Defined Benefit Pension Plans
Net Pension Liability
The net pension liability reported on the statement of net position represents a liability to employees
for pensions. Pensions are a component of exchange transactions-–between an employer and its
employees—of salaries and benefits for employee services. Pensions are provided to an employee—on
a deferred-payment basis—as part of the total compensation package offered by an employer for
employee services each financial period. The obligation to sacrifice resources for pensions is a present
obligation because it was created as a result of employment exchanges that already have occurred.
The net pension liability represents the employer’s proportionate share of each pension plan’s collective
actuarial present value of projected benefit payments attributable to past periods of service, net of each
pension plan’s fiduciary net position. The net pension liability calculation is dependent on critical long-
term variables, including estimated average life expectancies, earnings on investments, cost of living
adjustments and others. While these estimates use the best information available, unknowable future
events require adjusting this estimate annually.
42
Dublin City School District, Ohio
Notes to the Basic Financial Statements
For the Fiscal Year Ended June 30, 2017
Ohio Revised Code limits the obligation for this liability to annually required payments. The employer
cannot control benefit terms or the manner in which pensions are financed; however, the employer
does receive the benefit of employees’ services in exchange for compensation including pension.
GASB 68 assumes the liability is solely the obligation of the employer, because (1) they benefit from
employee services; and (2) State statute requires all funding to come from these employers. All
contributions to date have come solely from these employers (which also includes costs paid in the form
of withholdings from employees). State statute requires the pension plans to amortize unfunded
liabilities within 30 years. If the amortization period exceeds 30 years, each pension plan’s board must
propose corrective action to the State legislature. Any resulting legislative change to benefits or funding
could significantly affect the net pension liability. Resulting adjustments to the net pension liability
would be effective when the changes are legally enforceable.
The proportionate share of each plan’s unfunded benefits is presented as a long-term net pension
liability on the accrual basis of accounting. Any liability for the contractually-required pension
contribution outstanding at the end of the year is included in accrued wages and benefits on both the
accrual and modified accrual bases of accounting.
Plan Description - School Employees Retirement System (SERS)
Plan Description – Non-teaching employees participate in SERS, a cost-sharing multiple-employer
defined benefit pension plan administered by SERS. SERS provides retirement, disability and survivor
benefits, annual cost-of-living adjustments, and death benefits to plan members and beneficiaries.
Authority to establish and amend benefits is provided by Ohio Revised Code Chapter 3309. SERS issues
a publicly available, stand-alone financial report that includes financial statements, required
supplementary information and detailed information about SERS’ fiduciary net position. That report can
be obtained by visiting the SERS website at www.ohsers.org under Employers/Audit Resources.
Age and service requirements for retirement are as follows:
Eligible to Eligible to
Retire on or before Retire on or after
August 1, 2017 * August 1, 2017
Full Benefits Any age with 30 years of service credit Age 67 with 10 years of service credit; or
Age 65 with 5 years of service credit Age 57 with 30 years of service credit
Actuarial ly Reduced Benefits Age 60 with 5 years of service credit Age 62 with 10 years of service credit; or
Age 55 with 25 years of service credit Age 60 with 25 years of service credit
* Members with 25 years of service credit as of August 1, 2017, wil l be included in this plan.
Annual retirement benefits are calculated based on final average salary multiplied by a percentage that
varies based on year of service; 2.2 percent for the first thirty years of service and 2.5 percent for years
of service credit over 30 or $86.00 multiplied by the years of service credit. Final average salary is the
average of the highest three years of salary.
One year after an effective benefit date, a benefit recipient is entitled to a three percent cost-of-living
adjustment (COLA). This same COLA is added each year to the base benefit amount on the anniversary
date of the benefit.
43

Dublin City School District, Ohio
Notes to the Basic Financial Statements
For the Fiscal Year Ended June 30, 2017
Funding Policy – Plan members are required to contribute 10 percent of their annual covered salary and
the employer is required to contribute 14 percent of annual covered payroll. The contribution
requirements of plan members and employers are established and may be amended by the SERS’
Retirement Board up to statutory maximum amounts of 10 percent for plan members and 14 percent
for employers. The Retirement Board, acting with the advice of the actuary, allocates the employer
contribution rate among four of the System’s funds (Pension Trust Fund, Death Benefit Fund, Medicare
B Fund, and Health Care Fund). For the fiscal year ended June 30, 2017, the allocation to pension, death
benefits, and Medicare B was 14.00 percent. None of the 14 percent contribution rate was allocated to
the Health Care Fund.
The contractually required contribution to SERS was $3,797,943 for fiscal year 2017. Of this amount
$747,657 is reported as accrued wages and benefits.
Plan Description - State Teachers Retirement System (STRS)
Plan Description – Licensed teachers and other faculty members participate in STRS Ohio, a cost-sharing
multiple-employer public employee retirement system administered by STRS. STRS provides retirement
and disability benefits to members and death and survivor benefits to beneficiaries. STRS issues a stand-
alone financial report that includes financial statements, required supplementary information and
detailed information about STRS’ fiduciary net position. That report can be obtained by writing to STRS,
275 E. Broad St., Columbus, OH 43215-3771, by calling (888) 227-7877, or by visiting the STRS Web site
at www.strsoh.org.
New members have a choice of three retirement plans; a Defined Benefit (DB) Plan, a Defined
Contribution (DC) Plan and a Combined Plan. Benefits are established by Ohio Revised Code Chapter
3307. The DB plan offers an annual retirement allowance based on final average salary multiplied by a
percentage that varies based on years of service. Effective August 1, 2015, the calculation will be 2.2
percent of final average salary for the five highest years of earnings multiplied by all years of service.
With certain exceptions, the basic benefit is increased each year by two percent of the original base
benefit. For members retiring August 1, 2013, or later, the first two percent is paid on the fifth
anniversary of the retirement benefit. Members are eligible to retire at age 60 with five years of
qualifying service credit, or age 55 with 25 years of service, or 30 years of service regardless of age. Age
and service requirements for retirement increased effective August 1, 2015, and will continue to
increase periodically until they reach age 60 with 35 years of service or age 65 with five years of service
on August 1, 2026.
The DC Plan allows members to place all their member contributions and 9.5 percent of the 14 percent
employer contributions into an investment account. Investment allocation decisions are determined by
the member. The remaining 4.5 percent of the 14 percent employer rate is allocated to the defined
benefit unfunded liability. A member is eligible to receive a retirement benefit at age 50 and
termination of employment. The member may elect to receive a lifetime monthly annuity or a lump
sum withdrawal.
The Combined Plan offers features of both the DB Plan and the DC Plan. In the Combined Plan, member
contributions are allocated among investment choices by the member, and employer contributions are
used to fund the defined benefit payment at a reduced level from the regular DB Plan. The defined
benefit portion of the Combined Plan payment is payable to a member on or after age 60 with five years
of services. The defined contribution portion of the account may be taken as a lump sum payment or
converted to a lifetime monthly annuity at age 50.
44
Dublin City School District, Ohio Notes to the Basic Financial Statements For the Fiscal Year Ended June 30, 2017
New members who choose the DC plan or Combined Plan will have another opportunity to reselect a permanent plan during their fifth year of membership. Members may remain in the same plan or transfer to another STRS plan. The optional annuitization of a member’s defined contribution account or the defined contribution portion of a member’s Combined Plan account to a lifetime benefit results in STRS bearing the risk of investment gain or loss on the account. STRS has therefore included all three plan options as one defined benefit plan for GASB 68 reporting purposes. A DB or Combined Plan member with five or more years of credited service who is determined to be disabled may qualify for a disability benefit. Eligible survivors of members who die before service retirement may qualify for monthly benefits. New members on or after July 1, 2013, must have at least ten years of qualifying service credit that apply for disability benefits. Members in the DC Plan who become disabled are entitled only to their account balance. If a member of the DC Plan dies before retirement benefits begin, the member’s designated beneficiary is entitled to receive the member’s account balance. Funding Policy – Employer and member contribution rates are established by the State Teachers Retirement Board and limited by Chapter 3307 of the Ohio Revised Code. The statutory maximum employee contribution rate was increased one percent July 1, 2014, and will be increased one percent each year until it reaches 14 percent on July 1, 2016. For the fiscal year ended June 30, 2017, plan members were required to contribute 14 percent of their annual covered salary. The employer was required to contribute 14 percent; the entire 14 percent was the portion used to fund pension obligations. The fiscal year 2017 contribution rates were equal to the statutory maximum rates. The contractually required contribution to STRS was $13,701,912 for fiscal year 2017. Of this amount $1,723,044 is reported as accrued wages and benefits. Pension Liabilities, Pension Expense, and Deferred Outflows of Resources and Deferred Inflows of Resources Related to Pensions
The net pension liability was measured as of June 30, 2016, and the total pension liability used to calculate the net pension liability was determined by an actuarial valuation as of that date. The proportion of the net pension liability was based on the share of contributions to the pension plan relative to the contributions of all participating entities. Following is information related to the proportionate share and pension expense:
SERS STRS Total
Proportionate Share of the Net Pension Liability $61,292,039 $297,456,623 $358,748,662
Proportion of the Net Pension Prior Measurement Date 0.82003550% 0.87112429%
Proportion of the Net Pension Current Measurement Date 0.83742850% 0.88864606%
Change in Proportion 0.01739300% 0.01752177%
Pension Expense 6,984,120 23,346,474 30,330,594
At June 30, 2017, reported deferred outflows of resources and deferred inflows of resources related to pensions from the following sources:
45
Dublin City School District, Ohio
Notes to the Basic Financial Statements
For the Fiscal Year Ended June 30, 2017
SERS STRS Total
Deferred Outflows of Resources
Differences between expected and actual experience $826,688 $12,018,678 $12,845,366
Changes of assumptions 4,091,579 0 4,091,579
Net difference between projected and actual earnings
on pension plan investments 5,055,703 24,696,891 29,752,594
Changes in employer proportionate share of net
pension liability 999,447 4,910,756 5,910,203
Contributions subsequent to the measurement date 3,797,943 13,701,912 17,499,855
Total Deferred Outflows of Resources $14,771,360 $55,328,237 $70,099,597
$17,499,855 reported as deferred outflows of resources related to pension resulting from contributions
subsequent to the measurement date will be recognized as a reduction of the net pension liability in the
year ending June 30, 2018. Other amounts reported as deferred outflows of resources and deferred
inflows of resources related to pension will be recognized in pension expense as follows:
Fiscal Year
Ending June 30: SERS STRS Total
2018 $2,889,915 $7,118,766 $10,008,681
2019 2,886,271 7,118,766 10,005,037
2020 3,743,924 16,595,657 20,339,581
2021 1,453,307 10,793,136 12,246,443
Total $10,973,417 $41,626,325 $52,599,742
Actuarial Assumptions - SERS
SERS’ total pension liability was determined by their actuaries in accordance with GASB Statement No.
67, as part of their annual actuarial valuation for each defined benefit retirement plan. Actuarial
valuations of an ongoing plan involve estimates of the value of reported amounts (e.g., salaries, credited
service) and assumptions about the probability of occurrence of events far into the future (e.g.,
mortality, disabilities, retirements, employment termination). Actuarially determined amounts are
subject to continual review and potential modifications, as actual results are compared with past
expectations and new estimates are made about the future.
Projections of benefits for financial reporting purposes are based on the substantive plan (the plan as
understood by the employers and plan members) and include the types of benefits provided at the time
of each valuation and the historical pattern of sharing benefit costs between the employers and plan
members to that point. The projection of benefits for financial reporting purposes does not explicitly
incorporate the potential effects of legal or contractual funding limitations.
Actuarial calculations reflect a long-term perspective. For a newly hired employee, actuarial calculations
will take into account the employee’s entire career with the employer and also take into consideration
the benefits, if any, paid to the employee after termination of employment until the death of the
employee and any applicable contingent annuitant. In many cases actuarial calculations reflect several
decades of service with the employer and the payment of benefits after termination.
46
Dublin City School District, Ohio
Notes to the Basic Financial Statements
For the Fiscal Year Ended June 30, 2017
Key methods and assumptions used in calculating the total pension liability in the latest actuarial
valuation, prepared as of June 30, 2016, are presented below:
Wage Inflation 3.00 percent
Future Salary Increases, including inflation 3.50-18.20 percent
COLA or Ad Hoc COLA 3.00 percent
Investment Rate of Return 7.50 percent net of investments expense, including inflation
Actuarial Cost Method Entry Age Normal
For post-retirement mortality, the table used in evaluating allowances to be paid is the RP-2014 Blue
Collar Mortality Table with fully generational projection and Scale BB, with 120% of male rates and 110%
of female rates used. The RP-2000 Disabled Mortality Table with 90% for male rates and 100% for
female rates set back five years is used for the period after disability retirement. Special mortality tables
are used for the period after disability retirement.
The long-term return expectation for the Pension Plan Investments has been determined using a
building-block approach and assumes a time horizon, as defined in SERS’ Statement of Investment
Policy. A forecasted rate of inflation serves as the baseline for the return expectation. Various real
return premiums over the baseline inflation rate have been established for each asset class. The long-
term expected nominal rate of return has been determined by calculating a weighted averaged of the
expected real return premiums for each asset class, adding the projected inflation rate, and adding the
expected return from rebalancing uncorrelated asset classes. The target allocation and best estimates of
arithmetic real rates of return for each major assets class are summarized in the following table:
Target
Asset Class Allocation
Cash 1.00 % 0.50 %
US Stocks 22.50 4.75
Non-US Stocks 22.50 7.00
Fixed Income 19.00 1.50
Private Equity 10.00 8.00
Real Assets 15.00 5.00
Multi-Asset Strategies 10.00 3.00
Total 100.00 %
Long-Term Expected
Real Rate of Return
Discount Rate
The total pension liability was calculated using the discount rate of 7.50 percent. The projection of cash
flows used to determine the discount rate assumed the contributions from employers and from the
members would be computed based on contribution requirements as stipulated by State statute.
Projected inflows from investment earning were calculated using the long-term assumed investment
rate of return (7.50 percent). Based on those assumptions, the plan’s fiduciary net position was
projected to be available to make all future benefit payments of current plan members. Therefore, the
long-term expected rate of return on pension plan investments was applied to all periods of projected
benefits to determine the total pension liability.
47
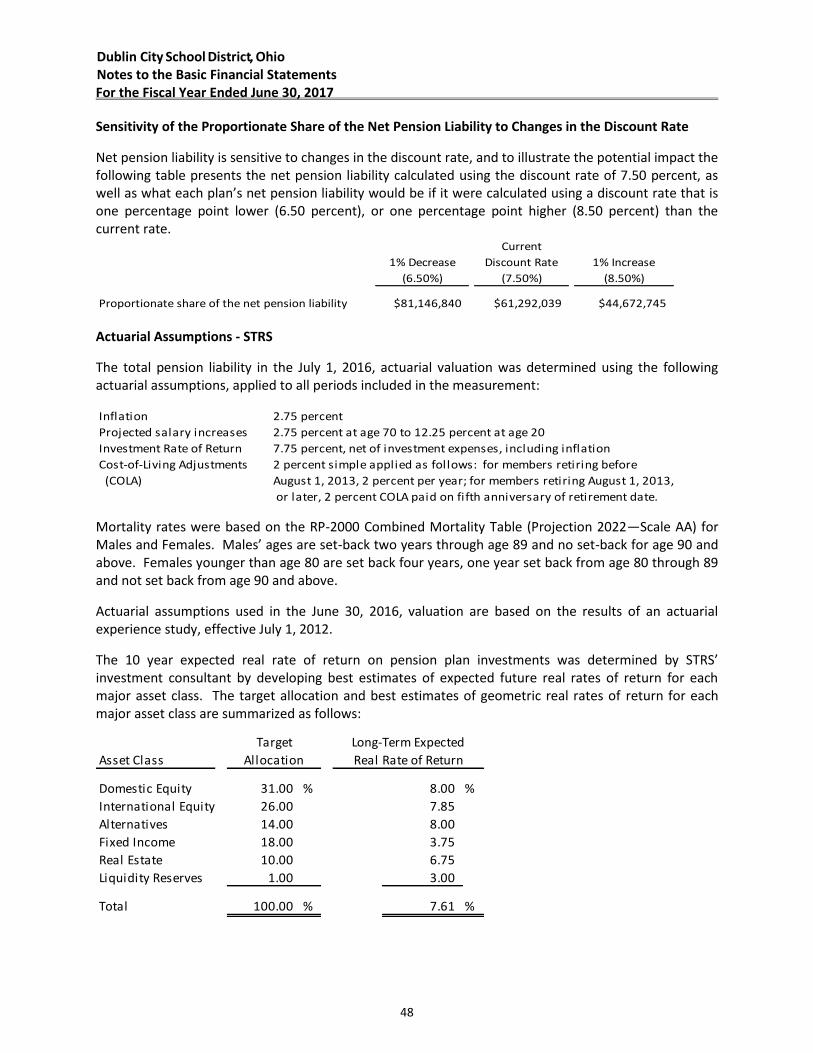
Dublin City School District, Ohio Notes to the Basic Financial Statements For the Fiscal Year Ended June 30, 2017
Sensitivity of the Proportionate Share of the Net Pension Liability to Changes in the Discount Rate
Net pension liability is sensitive to changes in the discount rate, and to illustrate the potential impact the following table presents the net pension liability calculated using the discount rate of 7.50 percent, as well as what each plan’s net pension liability would be if it were calculated using a discount rate that is one percentage point lower (6.50 percent), or one percentage point higher (8.50 percent) than the current rate.
Current
1% Decrease Discount Rate 1% Increase
(6.50%) (7.50%) (8.50%)
Proportionate share of the net pension liability $81,146,840 $61,292,039 $44,672,745
Actuarial Assumptions - STRS
The total pension liability in the July 1, 2016, actuarial valuation was determined using the following actuarial assumptions, applied to all periods included in the measurement:
Inflation 2.75 percent
Projected salary increases 2.75 percent at age 70 to 12.25 percent at age 20
Investment Rate of Return 7.75 percent, net of investment expenses, including inflation
Cost-of-Living Adjustments 2 percent simple applied as follows: for members retiring before
(COLA) August 1, 2013, 2 percent per year; for members retiring August 1, 2013,
or later, 2 percent COLA paid on fifth anniversary of retirement date.
Mortality rates were based on the RP-2000 Combined Mortality Table (Projection 2022—Scale AA) for Males and Females. Males’ ages are set-back two years through age 89 and no set-back for age 90 and above. Females younger than age 80 are set back four years, one year set back from age 80 through 89 and not set back from age 90 and above.
Actuarial assumptions used in the June 30, 2016, valuation are based on the results of an actuarial experience study, effective July 1, 2012.
The 10 year expected real rate of return on pension plan investments was determined by STRS’ investment consultant by developing best estimates of expected future real rates of return for each major asset class. The target allocation and best estimates of geometric real rates of return for each major asset class are summarized as follows:
Target
Asset Class Allocation
Domestic Equity 31.00 % 8.00 %
International Equity 26.00 7.85
Alternatives 14.00 8.00
Fixed Income 18.00 3.75
Real Estate 10.00 6.75
Liquidity Reserves 1.00 3.00
Total 100.00 % 7.61 %
Long-Term Expected
Real Rate of Return
48
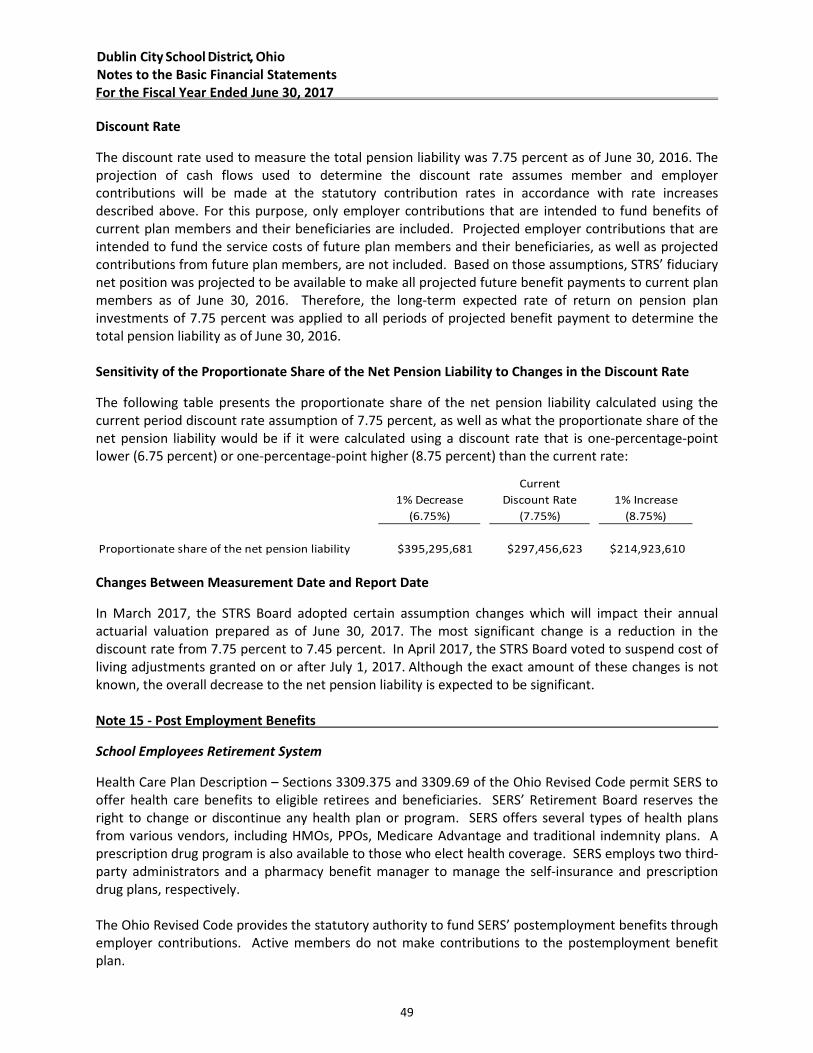
Dublin City School District, Ohio
Notes to the Basic Financial Statements
For the Fiscal Year Ended June 30, 2017
Discount Rate
The discount rate used to measure the total pension liability was 7.75 percent as of June 30, 2016. The
projection of cash flows used to determine the discount rate assumes member and employer
contributions will be made at the statutory contribution rates in accordance with rate increases
described above. For this purpose, only employer contributions that are intended to fund benefits of
current plan members and their beneficiaries are included. Projected employer contributions that are
intended to fund the service costs of future plan members and their beneficiaries, as well as projected
contributions from future plan members, are not included. Based on those assumptions, STRS’ fiduciary
net position was projected to be available to make all projected future benefit payments to current plan
members as of June 30, 2016. Therefore, the long-term expected rate of return on pension plan
investments of 7.75 percent was applied to all periods of projected benefit payment to determine the
total pension liability as of June 30, 2016.
Sensitivity of the Proportionate Share of the Net Pension Liability to Changes in the Discount Rate
The following table presents the proportionate share of the net pension liability calculated using the
current period discount rate assumption of 7.75 percent, as well as what the proportionate share of the
net pension liability would be if it were calculated using a discount rate that is one-percentage-point
lower (6.75 percent) or one-percentage-point higher (8.75 percent) than the current rate:
Current
1% Decrease Discount Rate 1% Increase
(6.75%) (7.75%) (8.75%)
Proportionate share of the net pension liability $395,295,681 $297,456,623 $214,923,610
Changes Between Measurement Date and Report Date
In March 2017, the STRS Board adopted certain assumption changes which will impact their annual
actuarial valuation prepared as of June 30, 2017. The most significant change is a reduction in the
discount rate from 7.75 percent to 7.45 percent. In April 2017, the STRS Board voted to suspend cost of
living adjustments granted on or after July 1, 2017. Although the exact amount of these changes is not
known, the overall decrease to the net pension liability is expected to be significant.
Note 15 - Post Employment Benefits
School Employees Retirement System
Health Care Plan Description – Sections 3309.375 and 3309.69 of the Ohio Revised Code permit SERS to
offer health care benefits to eligible retirees and beneficiaries. SERS’ Retirement Board reserves the
right to change or discontinue any health plan or program. SERS offers several types of health plans
from various vendors, including HMOs, PPOs, Medicare Advantage and traditional indemnity plans. A
prescription drug program is also available to those who elect health coverage. SERS employs two third-
party administrators and a pharmacy benefit manager to manage the self-insurance and prescription
drug plans, respectively.
The Ohio Revised Code provides the statutory authority to fund SERS’ postemployment benefits through
employer contributions. Active members do not make contributions to the postemployment benefit
plan.
49
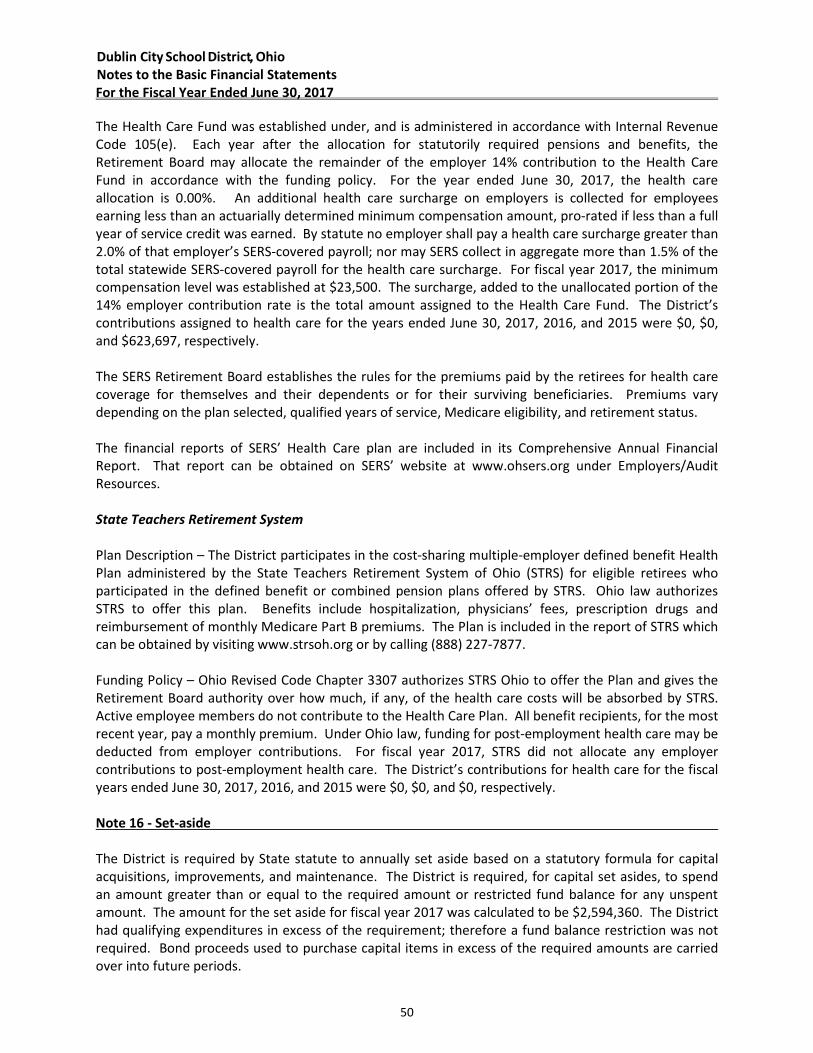
Dublin City School District, Ohio
Notes to the Basic Financial Statements
For the Fiscal Year Ended June 30, 2017
The Health Care Fund was established under, and is administered in accordance with Internal Revenue
Code 105(e). Each year after the allocation for statutorily required pensions and benefits, the
Retirement Board may allocate the remainder of the employer 14% contribution to the Health Care
Fund in accordance with the funding policy. For the year ended June 30, 2017, the health care
allocation is 0.00%. An additional health care surcharge on employers is collected for employees
earning less than an actuarially determined minimum compensation amount, pro-rated if less than a full
year of service credit was earned. By statute no employer shall pay a health care surcharge greater than
2.0% of that employer’s SERS-covered payroll; nor may SERS collect in aggregate more than 1.5% of the
total statewide SERS-covered payroll for the health care surcharge. For fiscal year 2017, the minimum
compensation level was established at $23,500. The surcharge, added to the unallocated portion of the
14% employer contribution rate is the total amount assigned to the Health Care Fund. The District’s
contributions assigned to health care for the years ended June 30, 2017, 2016, and 2015 were $0, $0,
and $623,697, respectively.
The SERS Retirement Board establishes the rules for the premiums paid by the retirees for health care
coverage for themselves and their dependents or for their surviving beneficiaries. Premiums vary
depending on the plan selected, qualified years of service, Medicare eligibility, and retirement status.
The financial reports of SERS’ Health Care plan are included in its Comprehensive Annual Financial
Report. That report can be obtained on SERS’ website at www.ohsers.org under Employers/Audit
Resources.
State Teachers Retirement System
Plan Description – The District participates in the cost-sharing multiple-employer defined benefit Health
Plan administered by the State Teachers Retirement System of Ohio (STRS) for eligible retirees who
participated in the defined benefit or combined pension plans offered by STRS. Ohio law authorizes
STRS to offer this plan. Benefits include hospitalization, physicians’ fees, prescription drugs and
reimbursement of monthly Medicare Part B premiums. The Plan is included in the report of STRS which
can be obtained by visiting www.strsoh.org or by calling (888) 227-7877.
Funding Policy – Ohio Revised Code Chapter 3307 authorizes STRS Ohio to offer the Plan and gives the
Retirement Board authority over how much, if any, of the health care costs will be absorbed by STRS.
Active employee members do not contribute to the Health Care Plan. All benefit recipients, for the most
recent year, pay a monthly premium. Under Ohio law, funding for post-employment health care may be
deducted from employer contributions. For fiscal year 2017, STRS did not allocate any employer
contributions to post-employment health care. The District’s contributions for health care for the fiscal
years ended June 30, 2017, 2016, and 2015 were $0, $0, and $0, respectively.
Note 16 - Set-aside
The District is required by State statute to annually set aside based on a statutory formula for capital
acquisitions, improvements, and maintenance. The District is required, for capital set asides, to spend
an amount greater than or equal to the required amount or restricted fund balance for any unspent
amount. The amount for the set aside for fiscal year 2017 was calculated to be $2,594,360. The District
had qualifying expenditures in excess of the requirement; therefore a fund balance restriction was not
required. Bond proceeds used to purchase capital items in excess of the required amounts are carried
over into future periods.
50
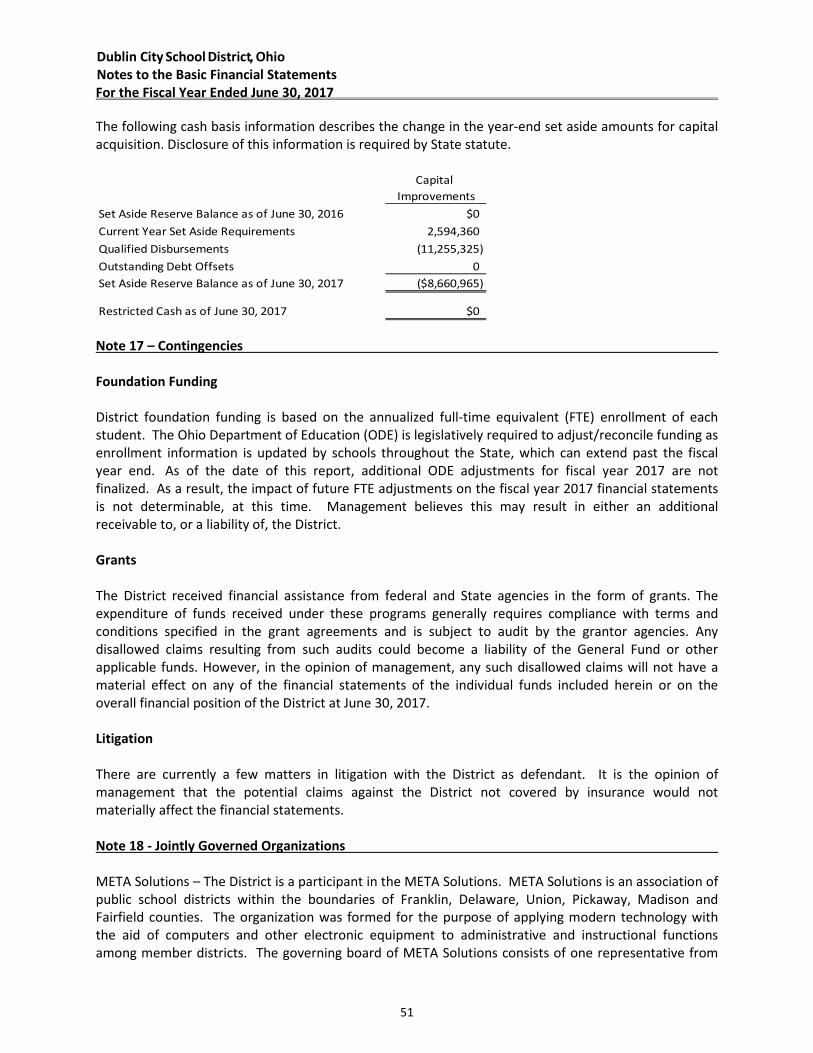
Dublin City School District, Ohio
Notes to the Basic Financial Statements
For the Fiscal Year Ended June 30, 2017
The following cash basis information describes the change in the year-end set aside amounts for capital
acquisition. Disclosure of this information is required by State statute.
Capital
Improvements
Set Aside Reserve Balance as of June 30, 2016 $0
Current Year Set Aside Requirements 2,594,360
Qualified Disbursements (11,255,325)
Outstanding Debt Offsets 0
Set Aside Reserve Balance as of June 30, 2017 ($8,660,965)
Restricted Cash as of June 30, 2017 $0
Note 17 – Contingencies
Foundation Funding
District foundation funding is based on the annualized full-time equivalent (FTE) enrollment of each
student. The Ohio Department of Education (ODE) is legislatively required to adjust/reconcile funding as
enrollment information is updated by schools throughout the State, which can extend past the fiscal
year end. As of the date of this report, additional ODE adjustments for fiscal year 2017 are not
finalized. As a result, the impact of future FTE adjustments on the fiscal year 2017 financial statements
is not determinable, at this time. Management believes this may result in either an additional
receivable to, or a liability of, the District.
Grants
The District received financial assistance from federal and State agencies in the form of grants. The
expenditure of funds received under these programs generally requires compliance with terms and
conditions specified in the grant agreements and is subject to audit by the grantor agencies. Any
disallowed claims resulting from such audits could become a liability of the General Fund or other
applicable funds. However, in the opinion of management, any such disallowed claims will not have a
material effect on any of the financial statements of the individual funds included herein or on the
overall financial position of the District at June 30, 2017.
Litigation
There are currently a few matters in litigation with the District as defendant. It is the opinion of
management that the potential claims against the District not covered by insurance would not
materially affect the financial statements.
Note 18 - Jointly Governed Organizations
META Solutions – The District is a participant in the META Solutions. META Solutions is an association of
public school districts within the boundaries of Franklin, Delaware, Union, Pickaway, Madison and
Fairfield counties. The organization was formed for the purpose of applying modern technology with
the aid of computers and other electronic equipment to administrative and instructional functions
among member districts. The governing board of META Solutions consists of one representative from
51
Dublin City School District, Ohio
Notes to the Basic Financial Statements
For the Fiscal Year Ended June 30, 2017
each of the member school districts. Financial information can be obtained from the fiscal officer, at
2100 Citygate Drive, Columbus, Ohio 43219.
The Tolles Career and Technical Center is a distinct political subdivision of the State of Ohio operated
under the direction of a Board consisting of one representative from each of the participating district’s
elected boards, which possesses its own budgeting and taxing authority. The District is a member of this
organization. Financial information can be obtained from the Treasurer, at 7877 Route 42 NE, Plain City,
Ohio 43064.
Note 19 - Demutualization of Anthem Healthcare
On November 2, 2001, Anthem Insurance Companies, Inc. converted from a mutual insurance company
to a stock insurance company in a process called demutualization. On the date of demutualization, all
membership interests in Anthem Insurance were extinguished and the eligible members of Anthem
Insurance were entitled to receive consideration in the form of Anthem, Inc.’s common stock. As a
result of demutualization, the District received 56,193 shares of Anthem, Inc. common stock (ATH). In
November 2004, Anthem merged with Wellpoint and the resulting company was named Wellpoint. In
December 2014, Wellpoint changed their name to Anthem, Inc. On June 1, 2005, there was a 2:1 stock
split resulting in the District holding 112,386 shares of Wellpoint stock. On January 13, 2006, January 8,
2007, January 10, 2008, June 23, 2009, and August 12, 2010, the District sold 12,386, 33,000, 40,000,
7,000, and 10,000 shares, respectively. At June 30, 2017, the market value of Anthem, Inc. common
stock was $186.21 per share. The total value of the District’s stock at June 30, 2017 was $1,862,100.
Note 20 – Fund Balances
Fund balance is classified as nonspendable, restricted, committed, assigned and/or unassigned based
primarily on the extent to which the District is bound to observe constraints imposed upon the use of
the resources in the government funds. The constraints placed on fund balance for the major
governmental fund and all other governmental funds are presented below:
This Space Intentionally Left Blank
52
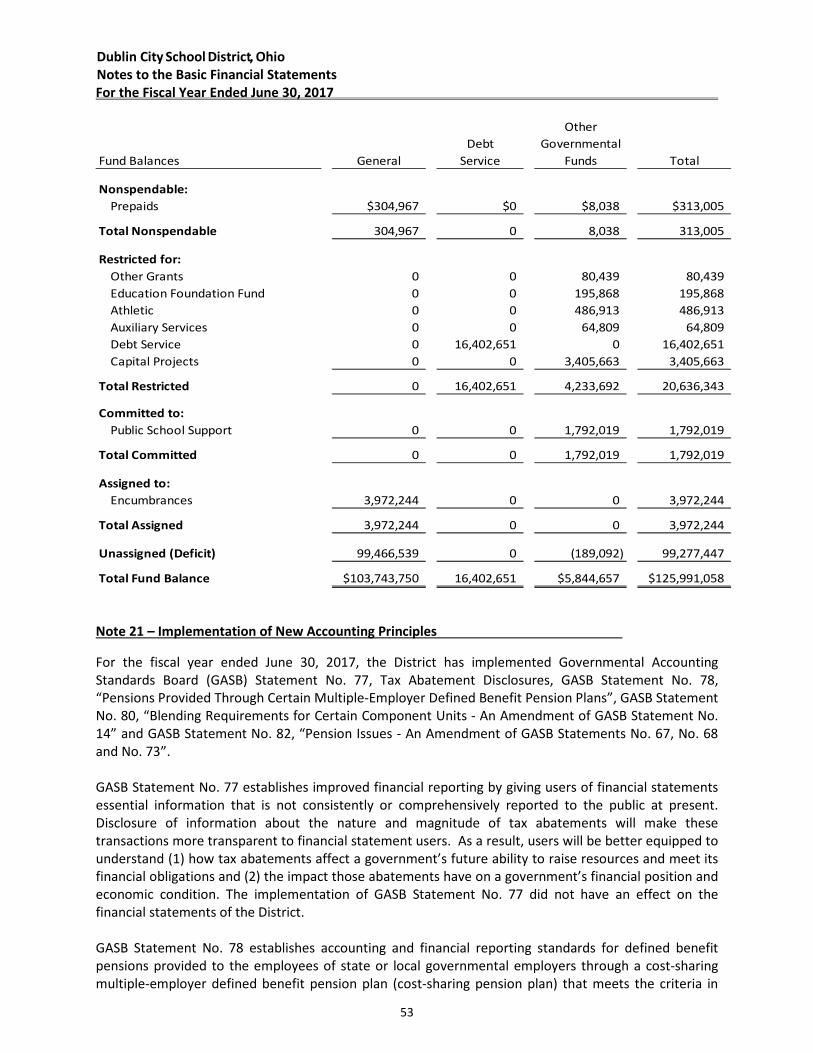
Dublin City School District, Ohio
Notes to the Basic Financial Statements
For the Fiscal Year Ended June 30, 2017
Other
Debt Governmental
Fund Balances General Service Funds Total
Nonspendable:
Prepaids $304,967 $0 $8,038 $313,005
Total Nonspendable 304,967 0 8,038 313,005
Restricted for:
Other Grants 0 0 80,439 80,439
Education Foundation Fund 0 0 195,868 195,868
Athletic 0 0 486,913 486,913
Auxiliary Services 0 0 64,809 64,809
Debt Service 0 16,402,651 0 16,402,651
Capital Projects 0 0 3,405,663 3,405,663
Total Restricted 0 16,402,651 4,233,692 20,636,343
Committed to:
Public School Support 0 0 1,792,019 1,792,019
Total Committed 0 0 1,792,019 1,792,019
Assigned to:
Encumbrances 3,972,244 0 0 3,972,244
Total Assigned 3,972,244 0 0 3,972,244
Unassigned (Deficit) 99,466,539 0 (189,092) 99,277,447
Total Fund Balance $103,743,750 16,402,651 $5,844,657 $125,991,058
Note 21 – Implementation of New Accounting Principles
For the fiscal year ended June 30, 2017, the District has implemented Governmental Accounting
Standards Board (GASB) Statement No. 77, Tax Abatement Disclosures, GASB Statement No. 78,
“Pensions Provided Through Certain Multiple-Employer Defined Benefit Pension Plans”, GASB Statement
No. 80, “Blending Requirements for Certain Component Units - An Amendment of GASB Statement No.
14” and GASB Statement No. 82, “Pension Issues - An Amendment of GASB Statements No. 67, No. 68
and No. 73”.
GASB Statement No. 77 establishes improved financial reporting by giving users of financial statements
essential information that is not consistently or comprehensively reported to the public at present.
Disclosure of information about the nature and magnitude of tax abatements will make these
transactions more transparent to financial statement users. As a result, users will be better equipped to
understand (1) how tax abatements affect a government’s future ability to raise resources and meet its
financial obligations and (2) the impact those abatements have on a government’s financial position and
economic condition. The implementation of GASB Statement No. 77 did not have an effect on the
financial statements of the District.
GASB Statement No. 78 establishes accounting and financial reporting standards for defined benefit
pensions provided to the employees of state or local governmental employers through a cost-sharing
multiple-employer defined benefit pension plan (cost-sharing pension plan) that meets the criteria in
53
Dublin City School District, Ohio
Notes to the Basic Financial Statements
For the Fiscal Year Ended June 30, 2017
paragraph 4 of Statement 68 and that (a) is not a state or local governmental pension plan, (b) is used to
provide defined benefit pensions both to employees of state or local governmental employers and to
employees of employers that are not state or local governmental employers, and (c) has no
predominant state or local governmental employer (either individually or collectively with other state or
local governmental employers that provide pensions through the pension plan). The implementation of
GASB Statement No. 78 did not have an effect on the financial statements of the District.
GASB Statement No. 80 amends the blending requirements for the financial statement presentation of
component units of all state and local governments. The additional criterion requires blending of a
component unit incorporated as a not-for-profit corporation in which the primary government is the
sole corporate member. The additional criterion does not apply to component units included in the
financial reporting entity pursuant to the provisions of Statement No. 39, Determining Whether Certain
Organizations Are Component Units. The implementation of GASB Statement No. 80 did not have an
effect on the financial statements of the District.
GASB Statement No. 82 addresses issues regarding (1) the presentation of payroll-related measures in
required supplementary information, (2) the selection of assumptions and the treatment of deviations
from the guidance in an Actuarial Standard of Practice for financial reporting purposes, and (3) the
classification of payments made by employers to satisfy employee (plan member) contribution
requirements. The implementation of GASB Statement No. 82 did not have an effect on the financial
statements of the District.
Note 21 – Tax Abatements entered Into By Other Governments
Other governments entered into property tax abatement agreements with property owners under the
Ohio Community Reinvestment Area (“CRA”) and Enterprise Zone Agreement (“EZA”) programs with the
taxing districts of the District. The CRA program is a directive incentive tax exemption program
benefiting property owners who renovate or construct new buildings. Under this program, the other
governments designated areas to encourage revitalization of the existing housing stock and the
development of new structures. The EZA program is an economic development tool administered by
municipal and county governments that provides real and personal property tax exemptions to
businesses making investments in the community. Within the taxing districts of the District, The City of
Dublin has entered into CRA and EZA agreements. Under these agreements the District’s property taxes
were reduced by an immaterial amount.
This Space Intentionally Left Blank
54

REQUIRED SUPPLEMENTARY INFORMATION
55
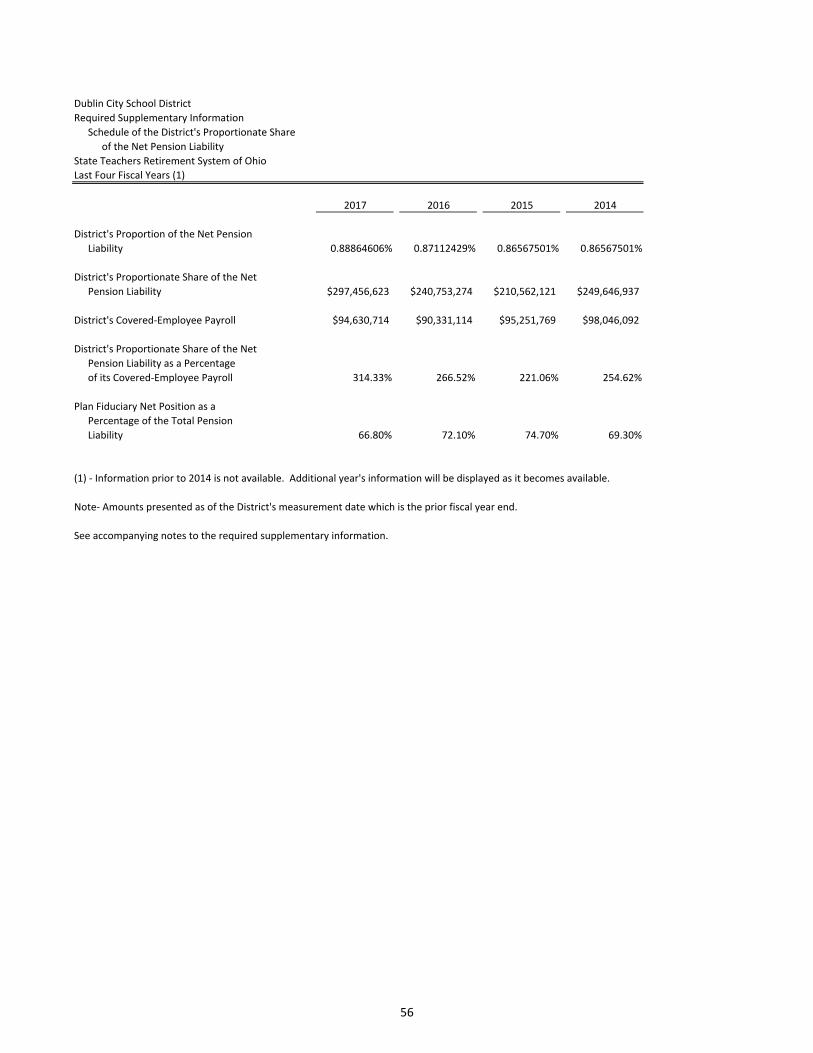
Dublin City School District
Required Supplementary Information
Schedule of the District's Proportionate Share
of the Net Pension Liability
State Teachers Retirement System of Ohio
Last Four Fiscal Years (1)
2017 2016 2015 2014
District's Proportion of the Net Pension
Liability 0.88864606% 0.87112429% 0.86567501% 0.86567501%
District's Proportionate Share of the Net
Pension Liability $297,456,623 $240,753,274 $210,562,121 $249,646,937
District's Covered-Employee Payroll $94,630,714 $90,331,114 $95,251,769 $98,046,092
District's Proportionate Share of the Net
Pension Liability as a Percentage
of its Covered-Employee Payroll 314.33% 266.52% 221.06% 254.62%
Plan Fiduciary Net Position as a
Percentage of the Total Pension
Liability 66.80% 72.10% 74.70% 69.30%
(1) - Information prior to 2014 is not available. Additional year's information will be displayed as it becomes available.
Note- Amounts presented as of the District's measurement date which is the prior fiscal year end.
See accompanying notes to the required supplementary information.
56
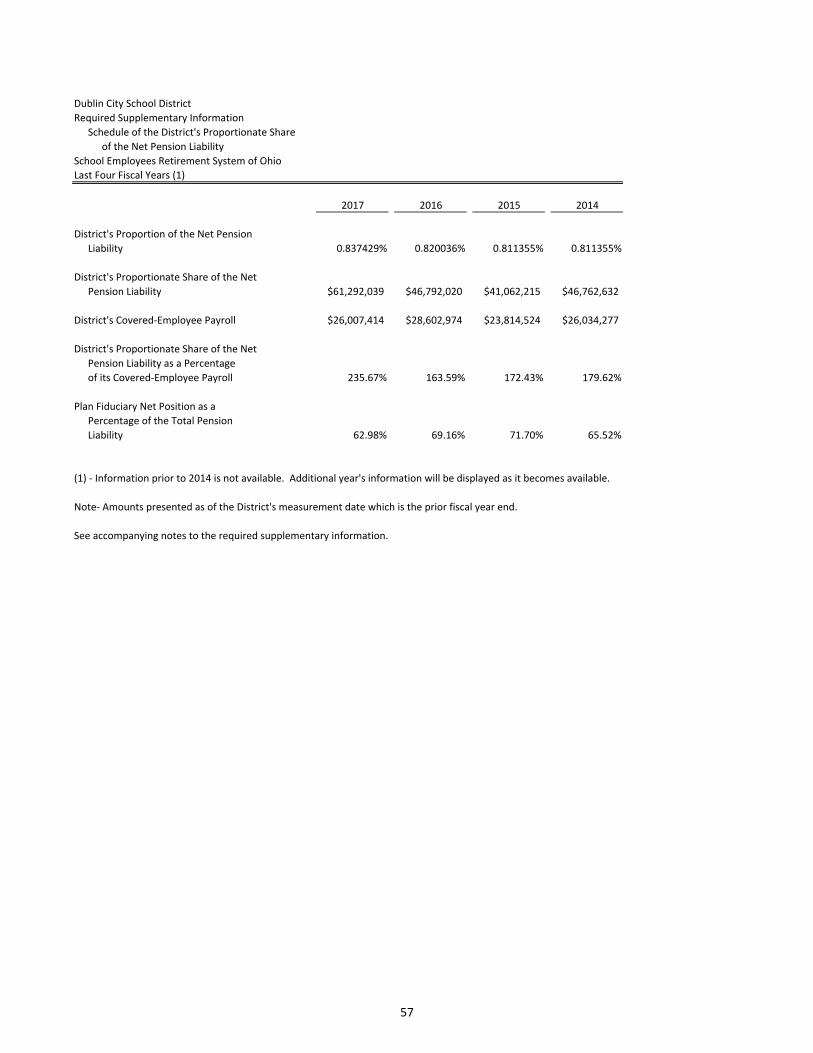
Dublin City School District
Required Supplementary Information
Schedule of the District's Proportionate Share
of the Net Pension Liability
School Employees Retirement System of Ohio
Last Four Fiscal Years (1)
2017 2016 2015 2014
District's Proportion of the Net Pension
Liability 0.837429% 0.820036% 0.811355% 0.811355%
District's Proportionate Share of the Net
Pension Liability $61,292,039 $46,792,020 $41,062,215 $46,762,632
District's Covered-Employee Payroll $26,007,414 $28,602,974 $23,814,524 $26,034,277
District's Proportionate Share of the Net
Pension Liability as a Percentage
of its Covered-Employee Payroll 235.67% 163.59% 172.43% 179.62%
Plan Fiduciary Net Position as a
Percentage of the Total Pension
Liability 62.98% 69.16% 71.70% 65.52%
(1) - Information prior to 2014 is not available. Additional year's information will be displayed as it becomes available.
Note- Amounts presented as of the District's measurement date which is the prior fiscal year end.
See accompanying notes to the required supplementary information.
57
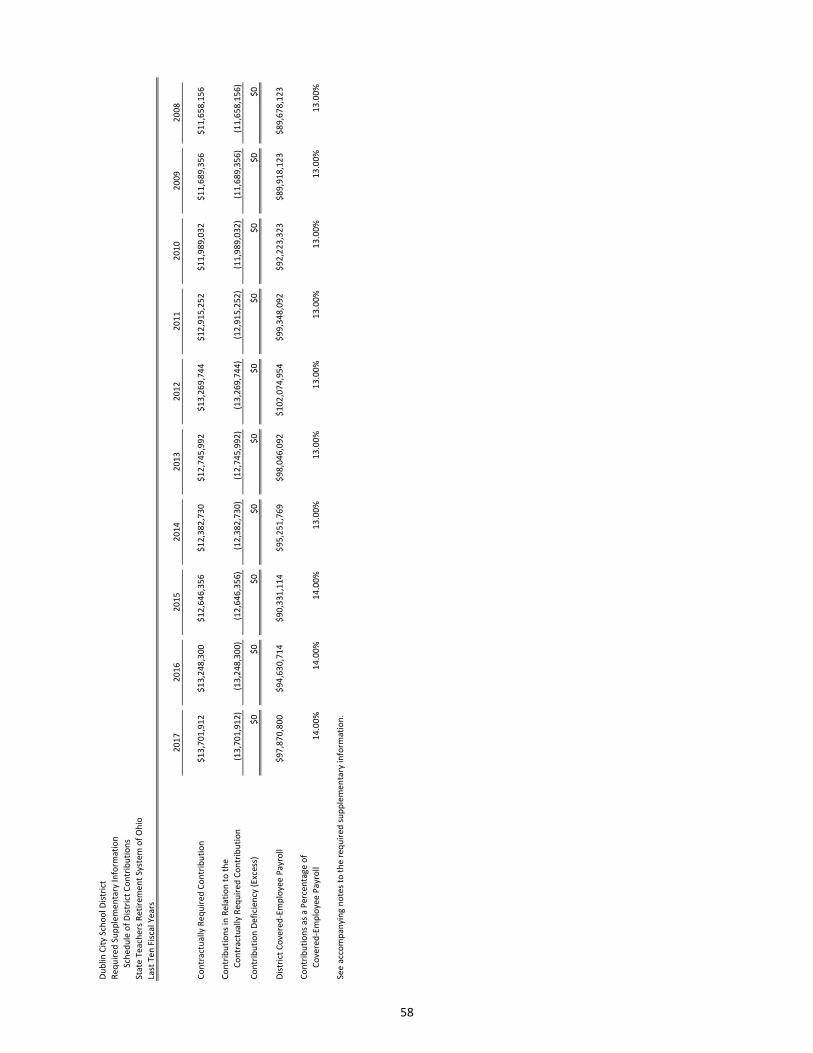
Du
blin
Cit
y Sc
ho
ol D
istr
ict
Re
qu
ire
d S
up
ple
me
nta
ry I
nfo
rma
tio
n
Sc
he
du
le o
f D
istr
ict
Co
ntr
ibu
tio
ns
Sta
te T
ea
che
rs R
eti
rem
en
t Sy
ste
m o
f O
hio
Last
Te
n F
isca
l Ye
ars
20
17
20
16
20
15
20
14
20
13
20
12
20
11
20
10
20
09
20
08
Co
ntr
act
ua
lly R
eq
uir
ed
Co
ntr
ibu
tio
n$
13
,70
1,9
12
$1
3,2
48
,30
0$
12
,64
6,3
56
$1
2,3
82
,73
0$
12
,74
5,9
92
$1
3,2
69
,74
4$
12
,91
5,2
52
$1
1,9
89
,03
2$
11
,68
9,3
56
$1
1,6
58
,15
6
Co
ntr
ibu
tio
ns
in R
ela
tio
n t
o t
he
Co
ntr
act
ua
lly R
eq
uir
ed
Co
ntr
ibu
tio
n(1
3,7
01
,91
2)
(13
,24
8,3
00
)(1
2,6
46
,35
6)
(12
,38
2,7
30
)(1
2,7
45
,99
2)
(13
,26
9,7
44
)(1
2,9
15
,25
2)
(11
,98
9,0
32
)(1
1,6
89
,35
6)
(11
,65
8,1
56
)
Co
ntr
ibu
tio
n D
efi
cie
ncy
(E
xce
ss)
$0
$0
$0
$0
$0
$0
$0
$0
$0
$0
Dis
tric
t C
ove
red
-Em
plo
yee
Pa
yro
ll$
97
,87
0,8
00
$9
4,6
30
,71
4$
90
,33
1,1
14
$9
5,2
51
,76
9$
98
,04
6,0
92
$1
02
,07
4,9
54
$9
9,3
48
,09
2$
92
,22
3,3
23
$8
9,9
18
,12
3$
89
,67
8,1
23
Co
ntr
ibu
tio
ns
as
a P
erc
en
tag
e o
f
Co
vere
d-E
mp
loye
e P
ayr
oll
14
.00
%1
4.0
0%
14
.00
%1
3.0
0%
13
.00
%1
3.0
0%
13
.00
%1
3.0
0%
13
.00
%1
3.0
0%
See
acc
om
pa
nyi
ng
no
tes
to t
he
re
qu
ire
d s
up
ple
me
nta
ry in
form
ati
on
.
58
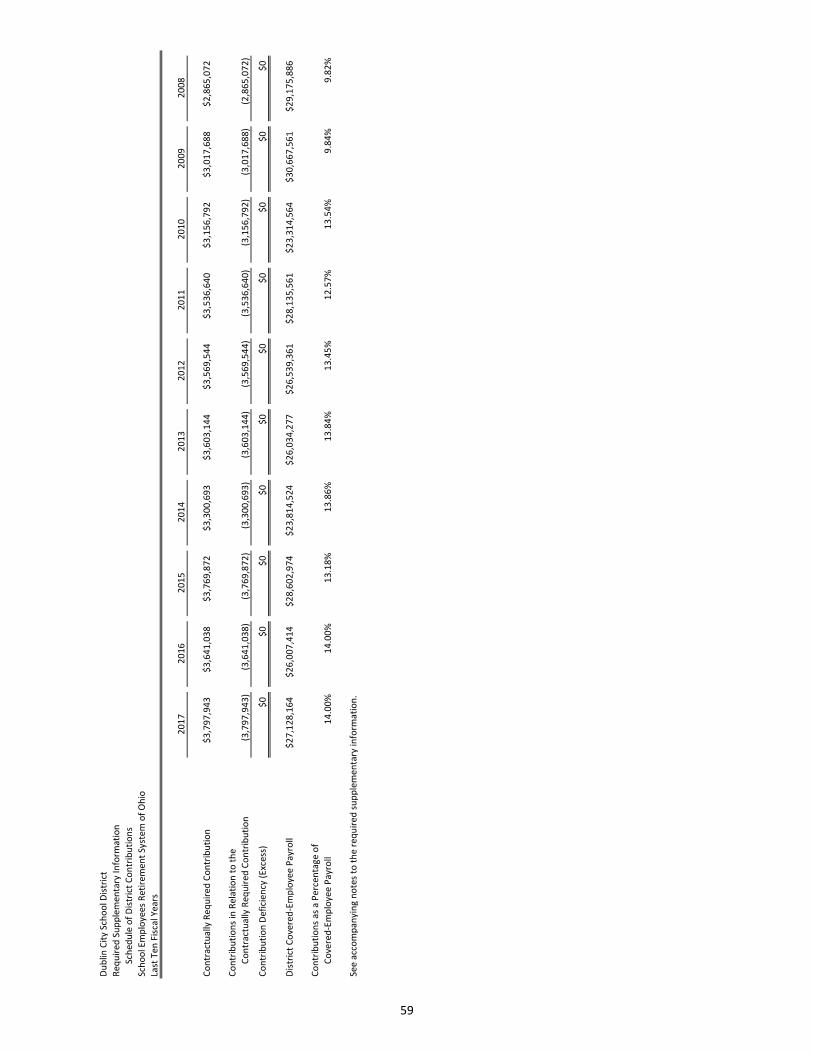
Du
blin
Cit
y Sc
ho
ol D
istr
ict
Req
uir
ed S
up
ple
men
tary
Info
rmat
ion
Sc
hed
ule
of
Dis
tric
t C
on
trib
uti
on
s
Sch
oo
l Em
plo
yees
Ret
irem
ent
Syst
em o
f O
hio
Last
Ten
Fis
cal Y
ears
20
17
20
16
20
15
20
14
20
13
20
12
20
11
20
10
20
09
20
08
Co
ntr
actu
ally
Req
uir
ed C
on
trib
uti
on
$3
,79
7,9
43
$3
,64
1,0
38
$3
,76
9,8
72
$3
,30
0,6
93
$3
,60
3,1
44
$3
,56
9,5
44
$3
,53
6,6
40
$3
,15
6,7
92
$3
,01
7,6
88
$2
,86
5,0
72
Co
ntr
ibu
tio
ns
in R
elat
ion
to
th
e
Co
ntr
actu
ally
Req
uir
ed C
on
trib
uti
on
(3,7
97
,94
3)
(3,6
41
,03
8)
(3,7
69
,87
2)
(3,3
00
,69
3)
(3,6
03
,14
4)
(3,5
69
,54
4)
(3,5
36
,64
0)
(3,1
56
,79
2)
(3,0
17
,68
8)
(2,8
65
,07
2)
Co
ntr
ibu
tio
n D
efic
ien
cy (
Exce
ss)
$0
$0
$0
$0
$0
$0
$0
$0
$0
$0
Dis
tric
t C
ove
red
-Em
plo
yee
Pay
roll
$2
7,1
28
,16
4$
26
,00
7,4
14
$2
8,6
02
,97
4$
23
,81
4,5
24
$2
6,0
34
,27
7$
26
,53
9,3
61
$2
8,1
35
,56
1$
23
,31
4,5
64
$3
0,6
67
,56
1$
29
,17
5,8
86
Co
ntr
ibu
tio
ns
as a
Per
cen
tage
of
Co
vere
d-E
mp
loye
e P
ayro
ll1
4.0
0%
14
.00
%1
3.1
8%
13
.86
%1
3.8
4%
13
.45
%1
2.5
7%
13
.54
%9
.84
%9
.82
%
See
acco
mp
anyi
ng
no
tes
to t
he
req
uir
ed s
up
ple
men
tary
info
rmat
ion
.
59
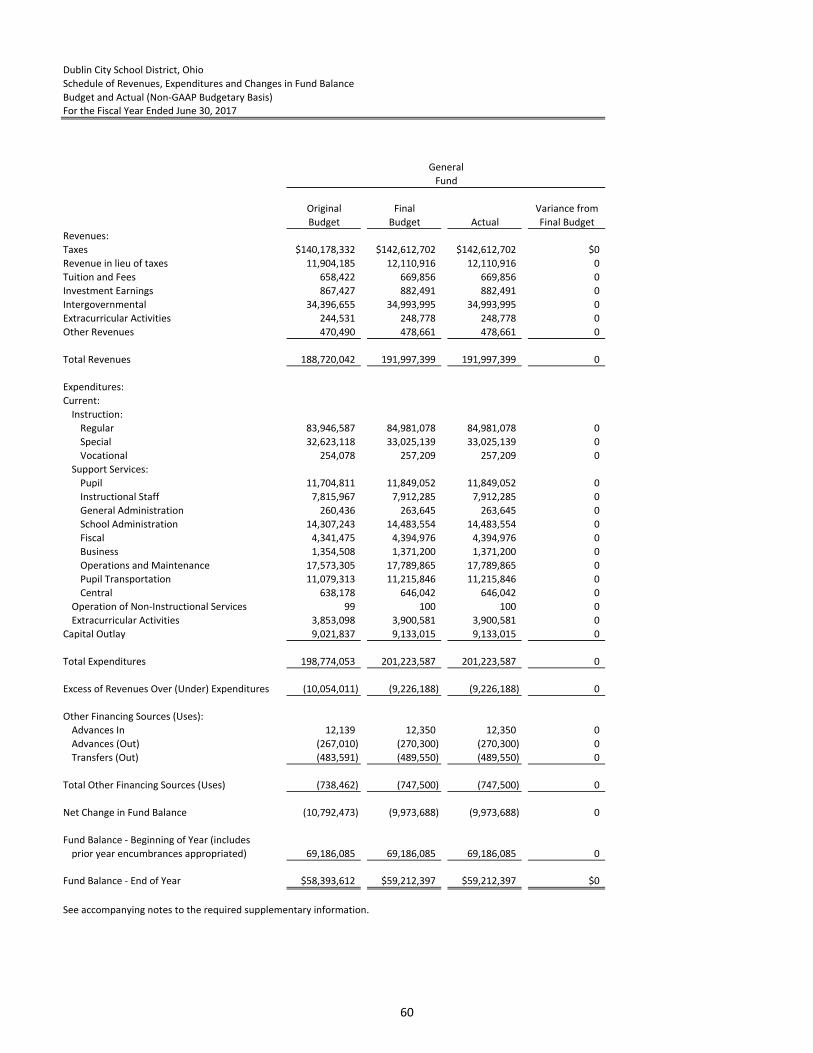
Dublin City School District, Ohio
Schedule of Revenues, Expenditures and Changes in Fund Balance
Budget and Actual (Non-GAAP Budgetary Basis)For the Fiscal Year Ended June 30, 2017
Original Final Variance from
Budget Budget Actual Final Budget
Revenues:
Taxes $140,178,332 $142,612,702 $142,612,702 $0
Revenue in lieu of taxes 11,904,185 12,110,916 12,110,916 0
Tuition and Fees 658,422 669,856 669,856 0
Investment Earnings 867,427 882,491 882,491 0
Intergovernmental 34,396,655 34,993,995 34,993,995 0
Extracurricular Activities 244,531 248,778 248,778 0
Other Revenues 470,490 478,661 478,661 0
Total Revenues 188,720,042 191,997,399 191,997,399 0
Expenditures:
Current:
Instruction:
Regular 83,946,587 84,981,078 84,981,078 0
Special 32,623,118 33,025,139 33,025,139 0
Vocational 254,078 257,209 257,209 0
Support Services:
Pupil 11,704,811 11,849,052 11,849,052 0
Instructional Staff 7,815,967 7,912,285 7,912,285 0
General Administration 260,436 263,645 263,645 0
School Administration 14,307,243 14,483,554 14,483,554 0
Fiscal 4,341,475 4,394,976 4,394,976 0
Business 1,354,508 1,371,200 1,371,200 0
Operations and Maintenance 17,573,305 17,789,865 17,789,865 0
Pupil Transportation 11,079,313 11,215,846 11,215,846 0
Central 638,178 646,042 646,042 0
Operation of Non-Instructional Services 99 100 100 0
Extracurricular Activities 3,853,098 3,900,581 3,900,581 0
Capital Outlay 9,021,837 9,133,015 9,133,015 0
Total Expenditures 198,774,053 201,223,587 201,223,587 0
Excess of Revenues Over (Under) Expenditures (10,054,011) (9,226,188) (9,226,188) 0
Other Financing Sources (Uses):
Advances In 12,139 12,350 12,350 0
Advances (Out) (267,010) (270,300) (270,300) 0
Transfers (Out) (483,591) (489,550) (489,550) 0
Total Other Financing Sources (Uses) (738,462) (747,500) (747,500) 0
Net Change in Fund Balance (10,792,473) (9,973,688) (9,973,688) 0
Fund Balance - Beginning of Year (includes
prior year encumbrances appropriated) 69,186,085 69,186,085 69,186,085 0
Fund Balance - End of Year $58,393,612 $59,212,397 $59,212,397 $0
See accompanying notes to the required supplementary information.
Fund
General
60
Dublin City School District
Notes to the Required Supplementary Information
For The Fiscal Year Ended June 30, 2017
Note 1 – Budgetary Process
All funds, except agency funds, are legally required to be budgeted and appropriated. The major
documents prepared are the tax budget, the appropriations resolution and the certificate of estimated
resources which are prepared on the budgetary basis of accounting. The tax budget demonstrates a
need for existing or increased tax rates. The certificate of estimated resources establishes a limit on the
amount that the Board of Education may appropriate. The appropriation resolution is Board’s
authorization to spend resources and sets annual limits on expenditures plus encumbrances at the level
of control selected by Board. The legal level of control has been established by Board at the fund level.
Any budgetary modifications at this level may only be made by resolution of the Board of Education.
The certificate of estimated resources may be amended during the year if projected increases or
decreases in revenue are identified by the School District Treasurer. The amounts reported as the
original budgeted amounts on the budgetary statements reflect the amounts on the certificate of
estimated resources when the original appropriations were adopted. The amounts reported as the final
budgeted amounts on the budgetary statements reflect the amounts on the final amended certificate of
estimated resources issued during the fiscal year 2017.
The appropriation resolution is subject to amendment by the Board throughout the year with the
restriction that appropriations cannot exceed estimated resources. The amounts reported as the original
budgeted amounts reflect the first appropriation resolution for that fund that covered the entire year,
including amounts automatically carried forward from prior years. The amounts reported as the final
budgeted amounts represent the final appropriation amounts passed by Board during the year.
While the District is reporting financial position, results of operations and changes in fund balance on
the basis of generally accepted accounting principles (GAAP), the budgetary basis as provided by law is
based upon accounting for certain transactions on a basis of cash receipts, disbursements and
encumbrances. The Combined Schedule of Revenues, Expenditures and Changes in Fund Balances -
Budget (Non-GAAP Basis) and Actual presented on the budgetary basis to provide a meaningful
comparison of actual results with the budget. The major differences between the budget basis and
GAAP basis are as follows:
1. Revenues are recorded when received in cash (budget basis) as opposed to when susceptible to
accrual (GAAP basis).
2. Expenditures are recorded when paid in cash (budget basis) as opposed to when the liability is
incurred (GAAP basis).
3. Encumbrances are treated as expenditures for all funds (budget basis) rather than as a
reservation of fund balance for governmental fund types and expendable trust funds (GAAP
basis).
4. Advances in and advances out are operating transactions (budget basis) as opposed to balance
sheet transactions.
61
Dublin City School District
Notes to the Required Supplementary Information
For The Fiscal Year Ended June 30, 2017
The following table summarizes the adjustments necessary to reconcile the GAAP basis to the budgetary
basis for the general fund.
Net Change in Fund Balance
General
GAAP Basis ($70,845)
Revenue Accruals (6,448,434)
Expenditure Accruals 1,955,080
Transfers (Out) (1)
Advances In 12,350
Advances (Out) (270,300)
Encumbrances (5,151,538)
Budget Basis ($9,973,688)
Note 2 – SERS Change in Assumptions _____________________________________
Changes in benefit terms: There were no changes in benefit terms from the amounts reported for fiscal
years 2014 - 2017.
Changes in assumptions: There were no changes in methods and assumptions used in the calculation of
actuarial determined contributions for fiscal years 2014-2016. For fiscal year 2017, the following
changes of assumptions affected the total pension liability since the prior measurement date: (1)
discount rate was reduced from 7.75% to 7.50%, (2) the assumed rate of inflation was reduced from
3.25% to 3.00%, (3) payroll growth assumption was reduced from 4.00% to 3.50%, (4) assumed real
wage growth was reduced from 0.75% to 0.50%, (5) Rates of withdrawal, retirement and disability were
updated to reflect recent experience, (6) mortality among active members was updated to RP-2014 Blue
Collar Mortality Table with fully generational projection and a five year age set-back for both males and
females, (7) mortality among service retired members, and beneficiaries was updated to the following
RP-2014 Blue Collar Mortality Table with fully generational projection with Scale BB, 120% of male rates,
and 110% of female rates and (8) mortality among disabled members was updated to RP-2000 Disabled
Mortality Table, 90% for male rates and 100% for female rates, set back five years is used for the period
after disability retirement.
Note 3 – STRS Change in Assumptions _____________________________________
Changes in benefit terms: There were no changes in benefit terms from the amounts reported for fiscal
years 2014 - 2017.
Changes in assumptions: There were no changes in methods and assumptions used in the calculation of
actuarial determined contributions for fiscal years 2014 - 2017. See the notes to the basic financials for
the methods and assumptions in this calculation.
62

COMBINING STATEMENTS AND
INDIVIDUAL FUND SCHEDULES
63
MAJOR GOVERNMENTAL FUND
Debt Service Fund - The Debt Service Fund is used to account for and report financial resources
that are restricted, committed, or assigned to expenditure for principal and interest. The debt
service fund should be used to report resources if legally mandated (i.e. debt payable from
property taxes). Financial resources that are being accumulated for principal and interest
maturing in future years also should be reported in the debt service fund. The Balance Sheet
and Statement of Revenues, Expenditures and Changes in Fund Balance for the Debt
Retirement Fund has been included in the Basic Financial Statements. The Schedule of
Revenues, Expenditures and Changes in Fund Balance Budget and Actual (Non-GAAP Budgetary
Basis) follows this page.
64

Dublin City School District, Ohio
Schedule of Revenues, Expenditures and Changes in Fund Balance
Budget and Actual (Non-GAAP Budgetary Basis)
For the Fiscal Year Ended June 30, 2017
Final Variance from
Budget Actual Final Budget
Revenues:
Taxes $30,362,349 $25,144,777 ($5,217,572)
Intergovernmental 3,223,697 2,669,726 (553,971)
Total Revenues 33,586,046 27,814,503 (5,771,543)
Expenditures:
Current:
Support Services:
Fiscal 453,177 379,057 74,120
Debt Service:
Principal Retirement 29,034,000 29,034,000 0
Interest and Fiscal Charges 5,309,476 5,309,476 0
Bond Issuance Cost 194,452 162,648 31,804
Total Expenditures 34,991,105 34,885,181 105,924
Excess of Revenues Over (Under) Expenditures (1,405,059) (7,070,678) (5,665,619)
Other Financing Sources (Uses):
Proceeds of Short-Term Notes 5,433,755 4,500,000 (933,755)
Issuance of Refunded Bonds 8,114,408 6,720,000 (1,394,408)
Payments to Bond Escrow Account (8,654,152) (6,821,332) 1,832,820
Premium on Bonds Sold 338,737 280,527 (58,210)
Transfers In 458,850 380,000 (78,850)
Total Other Financing Sources (Uses) 5,691,598 5,059,195 (632,403)
Net Change in Fund Balance 4,286,539 (2,011,483) (6,298,022)
Fund Balance - Beginning of Year (includes
prior year encumbrances appropriated) 12,142,697 12,142,697 0
Fund Balance - End of Year $16,429,236 $10,131,214 ($6,298,022)
Fund
Debt
Service
65

66

NONMAJOR GOVERNMENTAL FUNDS
Special Revenue Funds
Special Revenue Funds are used to account for and report the proceeds of specific revenue
sources that are restricted or committed to expenditures for specified purposes other than
debt service or capital projects. The term proceeds of specific revenue sources establishes that
one or more specific restricted or committed revenues should be the foundation for a special
revenue fund.
Capital Projects Fund
The Capital Projects Fund is used to account for and report financial resources that are
restricted, committed, or assigned to expenditure for capital outlays, including the acquisition
or construction of capital facilities and other capital assets. Capital projects funds exclude
those types of capital-related outflows financed by proprietary funds or for assets that will be
held in trust for individuals, private organizations, or other governments.
67
Dublin City School District, Ohio
Combining Balance Sheet
Nonmajor Governmental Funds
June 30, 2017
Nonmajor Nonmajor Total
Special Capital Nonmajor
Revenue Projects Governmental
Funds Funds Funds
Assets:
Equity in Pooled Cash and Investments $2,916,860 $4,251,344 $7,168,204
Restricted Cash and Investments 0 71,238 71,238
Receivables (Net):
Accounts 9,258 0 9,258
Intergovernmental 1,825,006 0 1,825,006
Prepaids 8,038 0 8,038
Total Assets 4,759,162 4,322,582 9,081,744
Liabilities:
Accounts Payable 225,452 207,528 432,980
Accrued Wages and Benefits 538,585 0 538,585
Contracts Payable 0 638,153 638,153
Retainage Payable 0 71,238 71,238
Interfund Payable 270,300 0 270,300
Total Liabilities 1,034,337 916,919 1,951,256
Deferred Inflows of Resources:
Grants and Other Taxes 1,285,831 0 1,285,831
Total Deferred Inflows of Resources 1,285,831 0 1,285,831
Fund Balances:
Nonspendable 8,038 0 8,038
Restricted 828,029 3,405,663 4,233,692
Committed 1,792,019 0 1,792,019
Unassigned (189,092) 0 (189,092)
Total Fund Balances 2,438,994 3,405,663 5,844,657
Total Liabilities, Deferred Inflows and Fund Balances $4,759,162 $4,322,582 $9,081,744
68
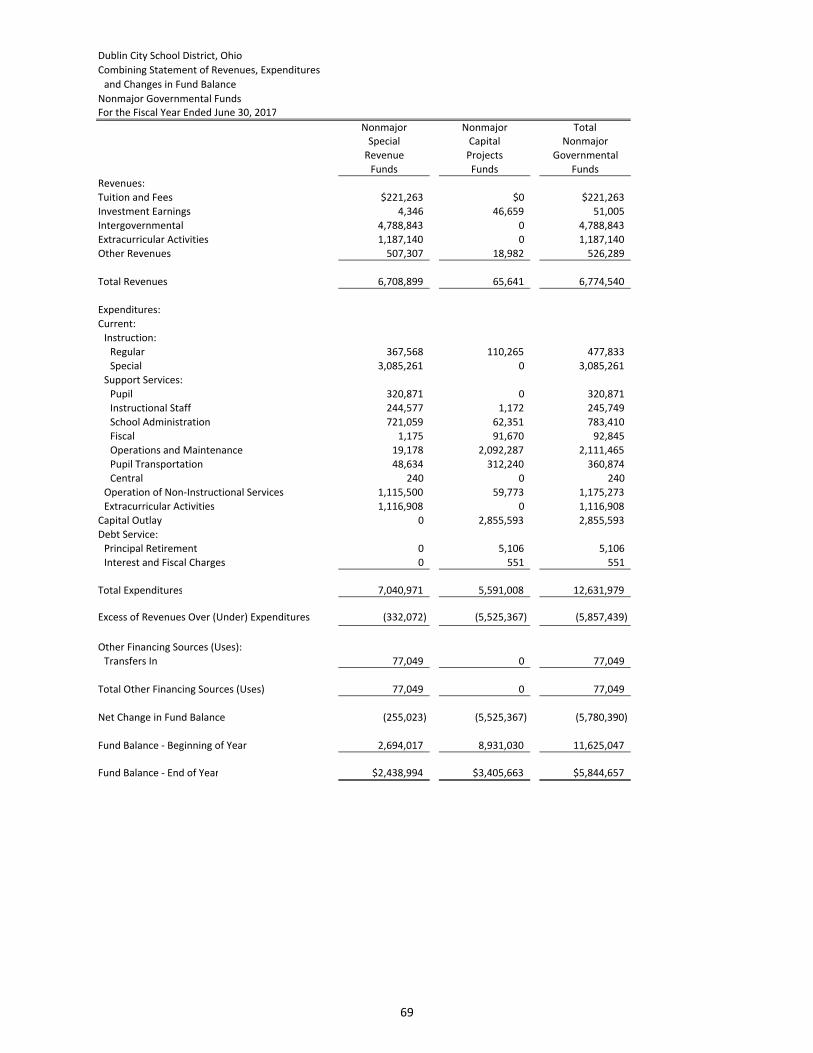
Dublin City School District, Ohio
Combining Statement of Revenues, Expenditures
and Changes in Fund Balance
Nonmajor Governmental Funds
For the Fiscal Year Ended June 30, 2017
Nonmajor Nonmajor Total
Special Capital Nonmajor
Revenue Projects Governmental
Funds Funds Funds
Revenues:
Tuition and Fees $221,263 $0 $221,263
Investment Earnings 4,346 46,659 51,005
Intergovernmental 4,788,843 0 4,788,843
Extracurricular Activities 1,187,140 0 1,187,140
Other Revenues 507,307 18,982 526,289
Total Revenues 6,708,899 65,641 6,774,540
Expenditures:
Current:
Instruction:
Regular 367,568 110,265 477,833
Special 3,085,261 0 3,085,261
Support Services:
Pupil 320,871 0 320,871
Instructional Staff 244,577 1,172 245,749
School Administration 721,059 62,351 783,410
Fiscal 1,175 91,670 92,845
Operations and Maintenance 19,178 2,092,287 2,111,465
Pupil Transportation 48,634 312,240 360,874
Central 240 0 240
Operation of Non-Instructional Services 1,115,500 59,773 1,175,273
Extracurricular Activities 1,116,908 0 1,116,908
Capital Outlay 0 2,855,593 2,855,593
Debt Service:
Principal Retirement 0 5,106 5,106
Interest and Fiscal Charges 0 551 551
Total Expenditures 7,040,971 5,591,008 12,631,979
Excess of Revenues Over (Under) Expenditures (332,072) (5,525,367) (5,857,439)
Other Financing Sources (Uses):
Transfers In 77,049 0 77,049
Total Other Financing Sources (Uses) 77,049 0 77,049
Net Change in Fund Balance (255,023) (5,525,367) (5,780,390)
Fund Balance - Beginning of Year 2,694,017 8,931,030 11,625,047
Fund Balance - End of Year $2,438,994 $3,405,663 $5,844,657
69

NONMAJOR SPECIAL REVENUE FUNDS
Fund Descriptions
Public School Support - This fund is provided to account for specific local revenue sources,
other than taxes (i.e. profits from vending machines, sale of pictures, etc.), that are restricted to
expenditures for specified purposes approved by board resolution. Such expenditures may
include curricular and extracurricular related purchases.
Other Grants - This fund is used to account for the proceeds of specific revenue sources except
state and federal grants that are legally restricted to expenditures for specified purposes.
Education Foundation Fund - This fund is used to account for the proceeds of any bequest, gift,
or endowment given to the school district or transfers from the General Fund for operating or
capital costs of any existing or new and innovative program designed to enhance or promote
education within the district.
Athletic - This fund is provided to account for those student activity programs that have student
participation in the activity, but do not have student management of the programs. This fund
would usually include athletic programs but could also include the band, cheerleaders, flag
corps, and similar types of activities.
Auxiliary Services - This fund is provided to account for State of Ohio monies that provide
services and materials to pupils attending non-public schools within the district.
Data Communication - A fund provided to account for monies received from the State of Ohio
for expenses supporting the establishment, maintenance and upgrade of data communication
links from the schools to the Metropolitan Educational Council, data acquisition site, and
further to the Ohio Department of Education.
Assistive Technology - A fund provided to account for monies received from the State of Ohio
for eTech Mobile Assistive Technology Grant monies expended to expand and/or enhance
learning opportunities for special needs learners through the use of mobile assistive
technology.
Miscellaneous State Grants – A fund used to account for various monies received from state
agencies which are not classified elsewhere. A separate special cost center must be used for
each grant.
IDEA - This fund is to account for Federal monies that assist states in the identification of
handicapped children, and provision of full educational opportunities to handicapped children
at the preschool, elementary, and secondary levels.
70

NONMAJOR SPECIAL REVENUE FUNDS
Fund Descriptions
Title I – This fund is to account for Federal monies that are used to help targeted buildings
improve the teaching and learning of children failing, or most at-risk of failing, to meet
challenging State academic standards.
Title III – This fund is to account for Federal monies that are used to develop and carry out
elementary and secondary school programs, including activities at the pre-school level, to meet
the educational needs of children of limited English proficiency.
IDEA Preschool Grant - A fund used to provide for the education of handicapped children ages
three through five, and account for the monies received and expended for the purpose of this
grant.
Title II-A - This fund is to account for Federal monies received and expended for the purpose of
hiring new teachers in grades 1 through 3 in an effort to improve student achievement through
reduced class sizes.
Miscellaneous Federal Grants – A fund used to account for various monies received through
state agencies from the federal government or directly from the federal government which are
not classified elsewhere. A separate cost center must be used for each grant.
71
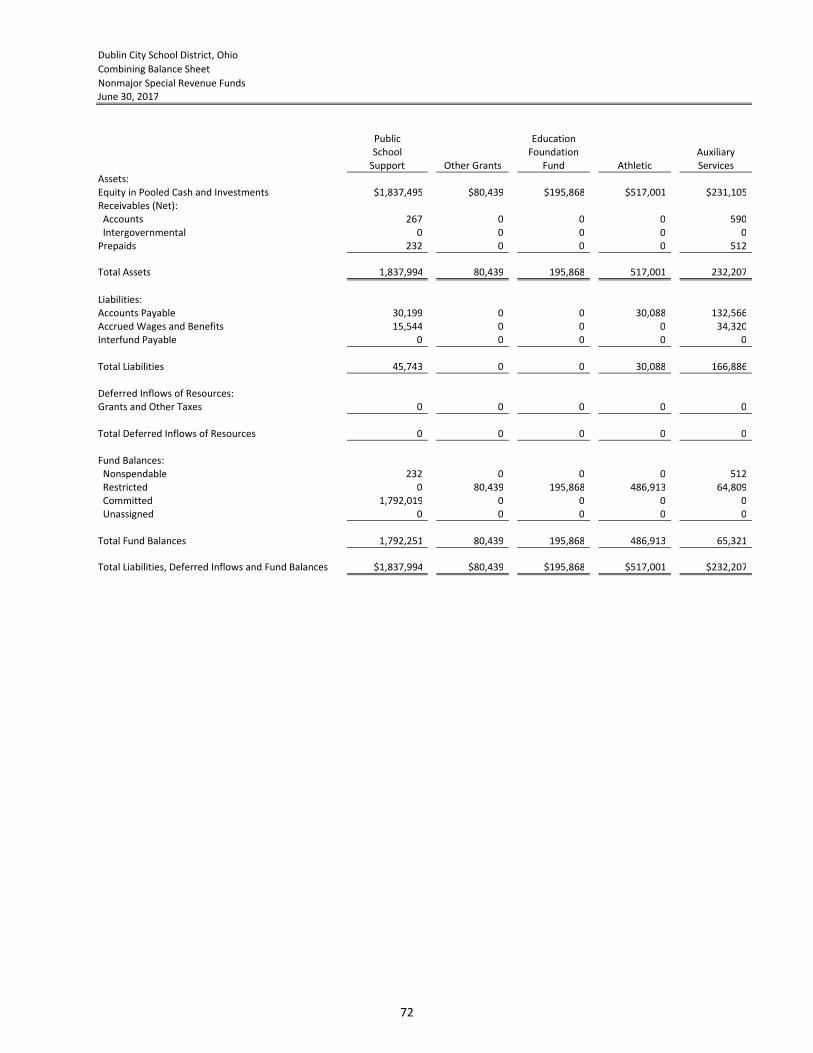
Dublin City School District, Ohio
Combining Balance Sheet
Nonmajor Special Revenue Funds
June 30, 2017
Public Education
School Foundation Auxiliary
Support Other Grants Fund Athletic Services
Assets:
Equity in Pooled Cash and Investments $1,837,495 $80,439 $195,868 $517,001 $231,105
Receivables (Net):
Accounts 267 0 0 0 590
Intergovernmental 0 0 0 0 0
Prepaids 232 0 0 0 512
Total Assets 1,837,994 80,439 195,868 517,001 232,207
Liabilities:
Accounts Payable 30,199 0 0 30,088 132,566
Accrued Wages and Benefits 15,544 0 0 0 34,320
Interfund Payable 0 0 0 0 0
Total Liabilities 45,743 0 0 30,088 166,886
Deferred Inflows of Resources:
Grants and Other Taxes 0 0 0 0 0
Total Deferred Inflows of Resources 0 0 0 0 0
Fund Balances:
Nonspendable 232 0 0 0 512
Restricted 0 80,439 195,868 486,913 64,809
Committed 1,792,019 0 0 0 0
Unassigned 0 0 0 0 0
Total Fund Balances 1,792,251 80,439 195,868 486,913 65,321
Total Liabilities, Deferred Inflows and Fund Balances $1,837,994 $80,439 $195,868 $517,001 $232,207
72
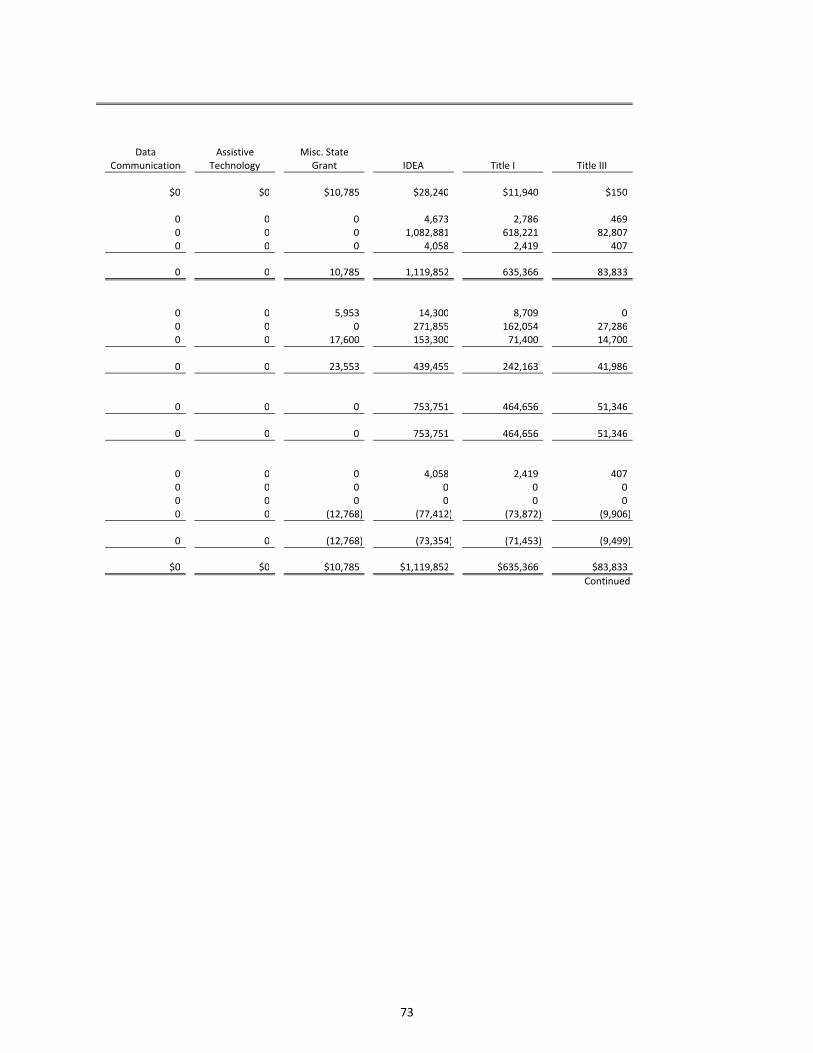
Data Assistive Misc. State
Communication Technology Grant IDEA Title I Title III
$0 $0 $10,785 $28,240 $11,940 $150
0 0 0 4,673 2,786 469
0 0 0 1,082,881 618,221 82,807
0 0 0 4,058 2,419 407
0 0 10,785 1,119,852 635,366 83,833
0 0 5,953 14,300 8,709 0
0 0 0 271,855 162,054 27,286
0 0 17,600 153,300 71,400 14,700
0 0 23,553 439,455 242,163 41,986
0 0 0 753,751 464,656 51,346
0 0 0 753,751 464,656 51,346
0 0 0 4,058 2,419 407
0 0 0 0 0 0
0 0 0 0 0 0
0 0 (12,768) (77,412) (73,872) (9,906)
0 0 (12,768) (73,354) (71,453) (9,499)
$0 $0 $10,785 $1,119,852 $635,366 $83,833
Continued
73
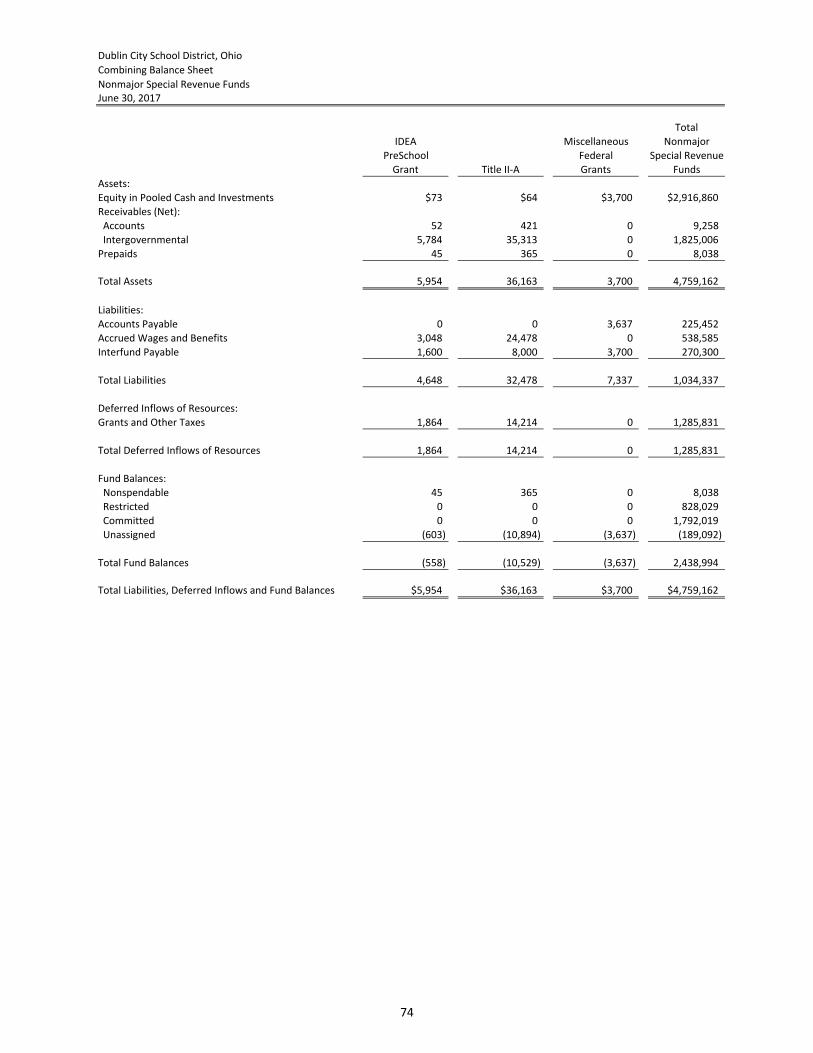
Dublin City School District, Ohio
Combining Balance Sheet
Nonmajor Special Revenue Funds
June 30, 2017
Total
IDEA Miscellaneous Nonmajor
PreSchool Federal Special Revenue
Grant Title II-A Grants Funds
Assets:
Equity in Pooled Cash and Investments $73 $64 $3,700 $2,916,860
Receivables (Net):
Accounts 52 421 0 9,258
Intergovernmental 5,784 35,313 0 1,825,006
Prepaids 45 365 0 8,038
Total Assets 5,954 36,163 3,700 4,759,162
Liabilities:
Accounts Payable 0 0 3,637 225,452
Accrued Wages and Benefits 3,048 24,478 0 538,585
Interfund Payable 1,600 8,000 3,700 270,300
Total Liabilities 4,648 32,478 7,337 1,034,337
Deferred Inflows of Resources:
Grants and Other Taxes 1,864 14,214 0 1,285,831
Total Deferred Inflows of Resources 1,864 14,214 0 1,285,831
Fund Balances:
Nonspendable 45 365 0 8,038
Restricted 0 0 0 828,029
Committed 0 0 0 1,792,019
Unassigned (603) (10,894) (3,637) (189,092)
Total Fund Balances (558) (10,529) (3,637) 2,438,994
Total Liabilities, Deferred Inflows and Fund Balances $5,954 $36,163 $3,700 $4,759,162
74

75
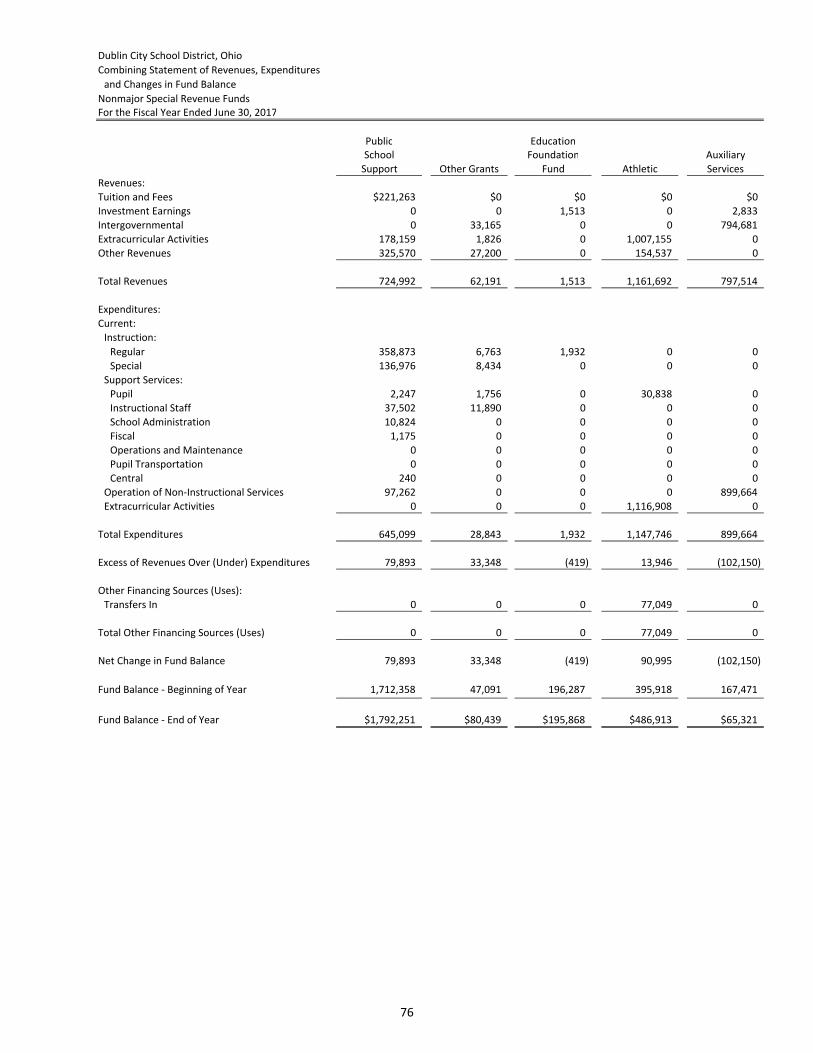
Dublin City School District, Ohio
Combining Statement of Revenues, Expenditures
and Changes in Fund Balance
Nonmajor Special Revenue Funds
For the Fiscal Year Ended June 30, 2017
Public Education
School Foundation Auxiliary
Support Other Grants Fund Athletic Services
Revenues:
Tuition and Fees $221,263 $0 $0 $0 $0
Investment Earnings 0 0 1,513 0 2,833
Intergovernmental 0 33,165 0 0 794,681
Extracurricular Activities 178,159 1,826 0 1,007,155 0
Other Revenues 325,570 27,200 0 154,537 0
Total Revenues 724,992 62,191 1,513 1,161,692 797,514
Expenditures:
Current:
Instruction:
Regular 358,873 6,763 1,932 0 0
Special 136,976 8,434 0 0 0
Support Services:
Pupil 2,247 1,756 0 30,838 0
Instructional Staff 37,502 11,890 0 0 0
School Administration 10,824 0 0 0 0
Fiscal 1,175 0 0 0 0
Operations and Maintenance 0 0 0 0 0
Pupil Transportation 0 0 0 0 0
Central 240 0 0 0 0
Operation of Non-Instructional Services 97,262 0 0 0 899,664
Extracurricular Activities 0 0 0 1,116,908 0
Total Expenditures 645,099 28,843 1,932 1,147,746 899,664
Excess of Revenues Over (Under) Expenditures 79,893 33,348 (419) 13,946 (102,150)
Other Financing Sources (Uses):
Transfers In 0 0 0 77,049 0
Total Other Financing Sources (Uses) 0 0 0 77,049 0
Net Change in Fund Balance 79,893 33,348 (419) 90,995 (102,150)
Fund Balance - Beginning of Year 1,712,358 47,091 196,287 395,918 167,471
Fund Balance - End of Year $1,792,251 $80,439 $195,868 $486,913 $65,321
76
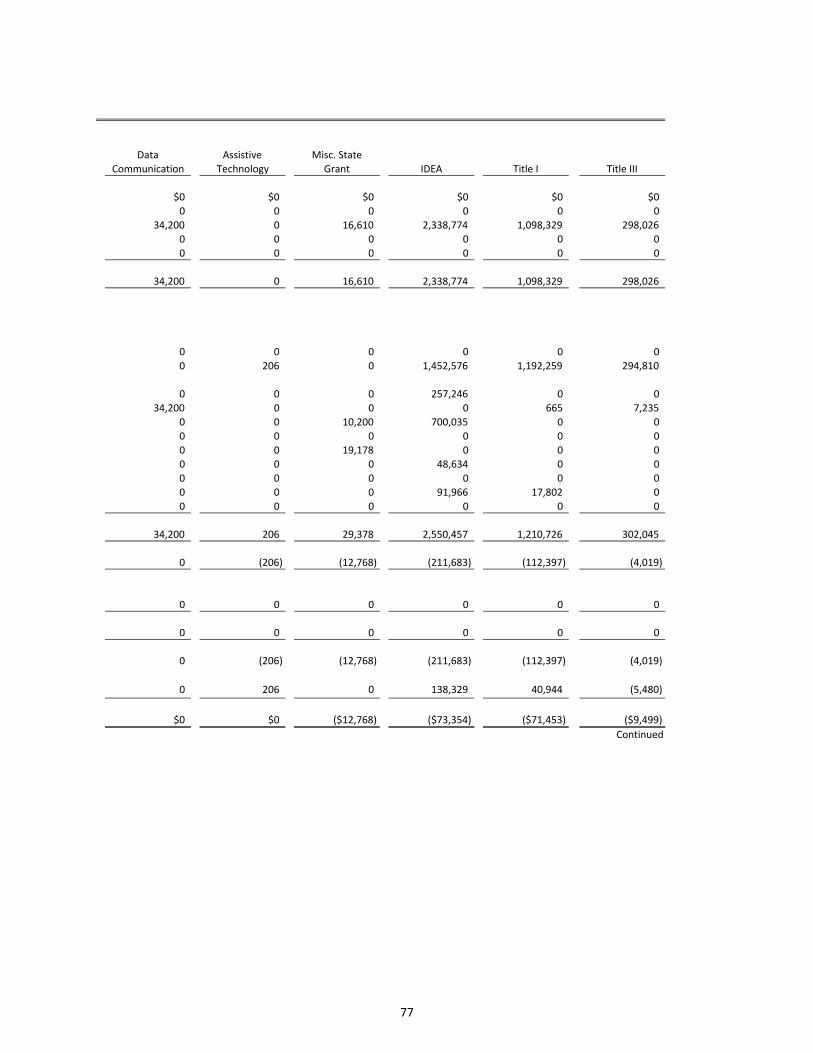
Data Assistive Misc. State
Communication Technology Grant IDEA Title I Title III
$0 $0 $0 $0 $0 $0
0 0 0 0 0 0
34,200 0 16,610 2,338,774 1,098,329 298,026
0 0 0 0 0 0
0 0 0 0 0 0
34,200 0 16,610 2,338,774 1,098,329 298,026
0 0 0 0 0 0
0 206 0 1,452,576 1,192,259 294,810
0 0 0 257,246 0 0
34,200 0 0 0 665 7,235
0 0 10,200 700,035 0 0
0 0 0 0 0 0
0 0 19,178 0 0 0
0 0 0 48,634 0 0
0 0 0 0 0 0
0 0 0 91,966 17,802 0
0 0 0 0 0 0
34,200 206 29,378 2,550,457 1,210,726 302,045
0 (206) (12,768) (211,683) (112,397) (4,019)
0 0 0 0 0 0
0 0 0 0 0 0
0 (206) (12,768) (211,683) (112,397) (4,019)
0 206 0 138,329 40,944 (5,480)
$0 $0 ($12,768) ($73,354) ($71,453) ($9,499)
Continued
77
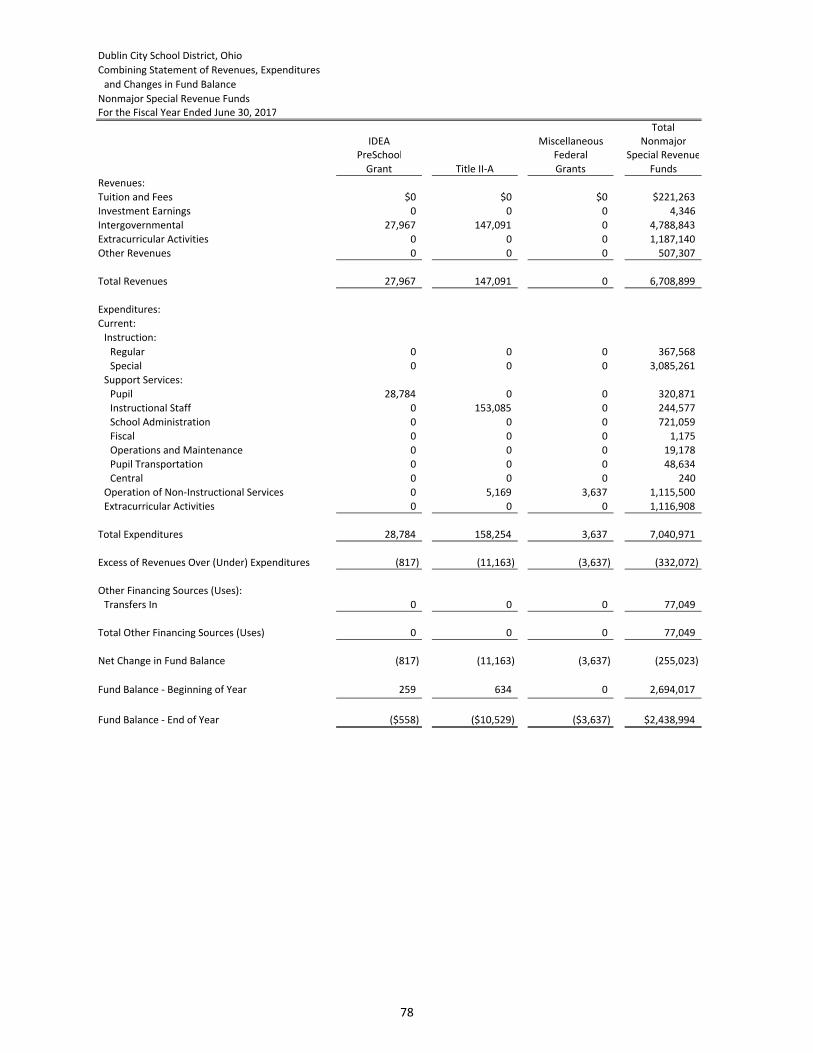
Dublin City School District, Ohio
Combining Statement of Revenues, Expenditures
and Changes in Fund Balance
Nonmajor Special Revenue Funds
For the Fiscal Year Ended June 30, 2017
Total
IDEA Miscellaneous Nonmajor
PreSchool Federal Special Revenue
Grant Title II-A Grants Funds
Revenues:
Tuition and Fees $0 $0 $0 $221,263
Investment Earnings 0 0 0 4,346
Intergovernmental 27,967 147,091 0 4,788,843
Extracurricular Activities 0 0 0 1,187,140
Other Revenues 0 0 0 507,307
Total Revenues 27,967 147,091 0 6,708,899
Expenditures:
Current:
Instruction:
Regular 0 0 0 367,568
Special 0 0 0 3,085,261
Support Services:
Pupil 28,784 0 0 320,871
Instructional Staff 0 153,085 0 244,577
School Administration 0 0 0 721,059
Fiscal 0 0 0 1,175
Operations and Maintenance 0 0 0 19,178
Pupil Transportation 0 0 0 48,634
Central 0 0 0 240
Operation of Non-Instructional Services 0 5,169 3,637 1,115,500
Extracurricular Activities 0 0 0 1,116,908
Total Expenditures 28,784 158,254 3,637 7,040,971
Excess of Revenues Over (Under) Expenditures (817) (11,163) (3,637) (332,072)
Other Financing Sources (Uses):
Transfers In 0 0 0 77,049
Total Other Financing Sources (Uses) 0 0 0 77,049
Net Change in Fund Balance (817) (11,163) (3,637) (255,023)
Fund Balance - Beginning of Year 259 634 0 2,694,017
Fund Balance - End of Year ($558) ($10,529) ($3,637) $2,438,994
78
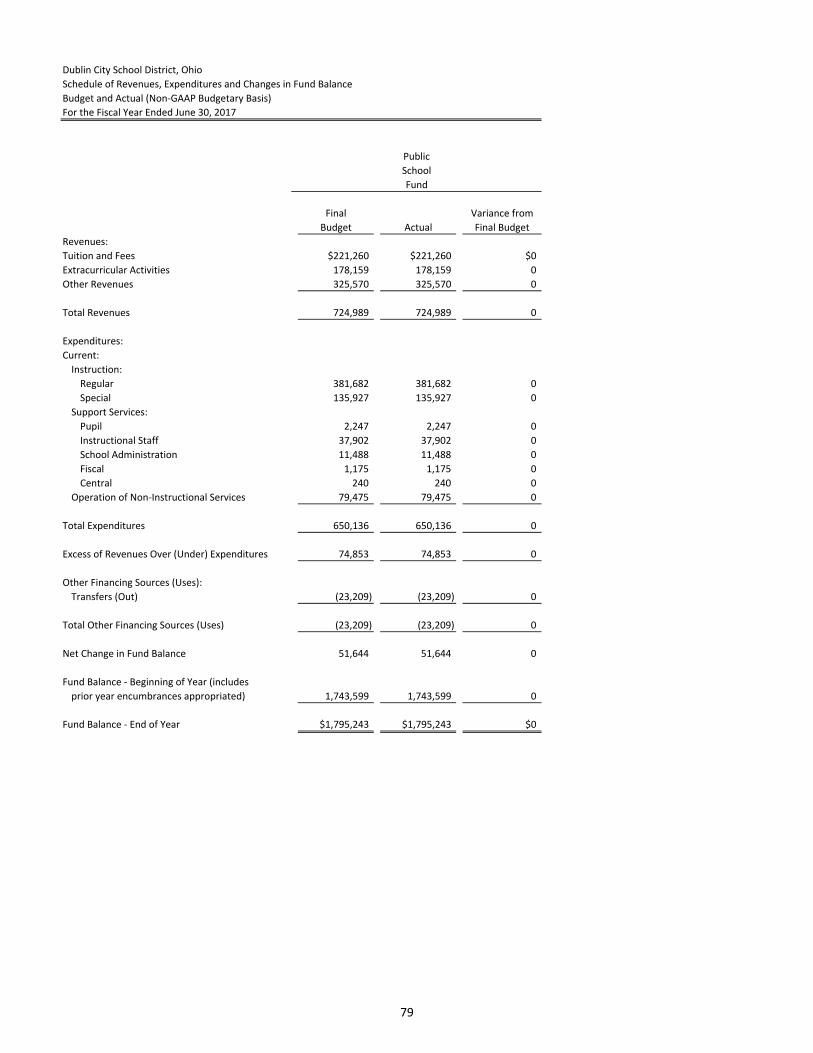
Dublin City School District, Ohio
Schedule of Revenues, Expenditures and Changes in Fund Balance
Budget and Actual (Non-GAAP Budgetary Basis)
For the Fiscal Year Ended June 30, 2017
Final Variance from
Budget Actual Final Budget
Revenues:
Tuition and Fees $221,260 $221,260 $0
Extracurricular Activities 178,159 178,159 0
Other Revenues 325,570 325,570 0
Total Revenues 724,989 724,989 0
Expenditures:
Current:
Instruction:
Regular 381,682 381,682 0
Special 135,927 135,927 0
Support Services:
Pupil 2,247 2,247 0
Instructional Staff 37,902 37,902 0
School Administration 11,488 11,488 0
Fiscal 1,175 1,175 0
Central 240 240 0
Operation of Non-Instructional Services 79,475 79,475 0
Total Expenditures 650,136 650,136 0
Excess of Revenues Over (Under) Expenditures 74,853 74,853 0
Other Financing Sources (Uses):
Transfers (Out) (23,209) (23,209) 0
Total Other Financing Sources (Uses) (23,209) (23,209) 0
Net Change in Fund Balance 51,644 51,644 0
Fund Balance - Beginning of Year (includes
prior year encumbrances appropriated) 1,743,599 1,743,599 0
Fund Balance - End of Year $1,795,243 $1,795,243 $0
Fund
Public
School
79
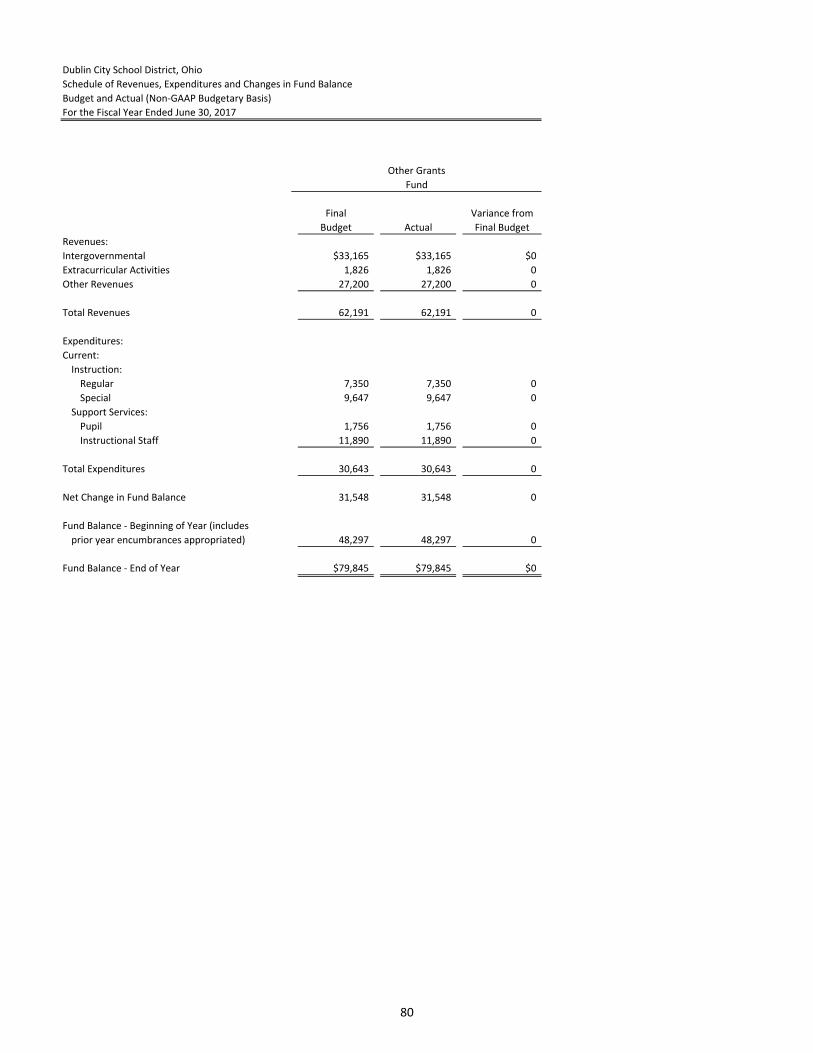
Dublin City School District, Ohio
Schedule of Revenues, Expenditures and Changes in Fund Balance
Budget and Actual (Non-GAAP Budgetary Basis)
For the Fiscal Year Ended June 30, 2017
Final Variance from
Budget Actual Final Budget
Revenues:
Intergovernmental $33,165 $33,165 $0
Extracurricular Activities 1,826 1,826 0
Other Revenues 27,200 27,200 0
Total Revenues 62,191 62,191 0
Expenditures:
Current:
Instruction:
Regular 7,350 7,350 0
Special 9,647 9,647 0
Support Services:
Pupil 1,756 1,756 0
Instructional Staff 11,890 11,890 0
Total Expenditures 30,643 30,643 0
Net Change in Fund Balance 31,548 31,548 0
Fund Balance - Beginning of Year (includes
prior year encumbrances appropriated) 48,297 48,297 0
Fund Balance - End of Year $79,845 $79,845 $0
Fund
Other Grants
80
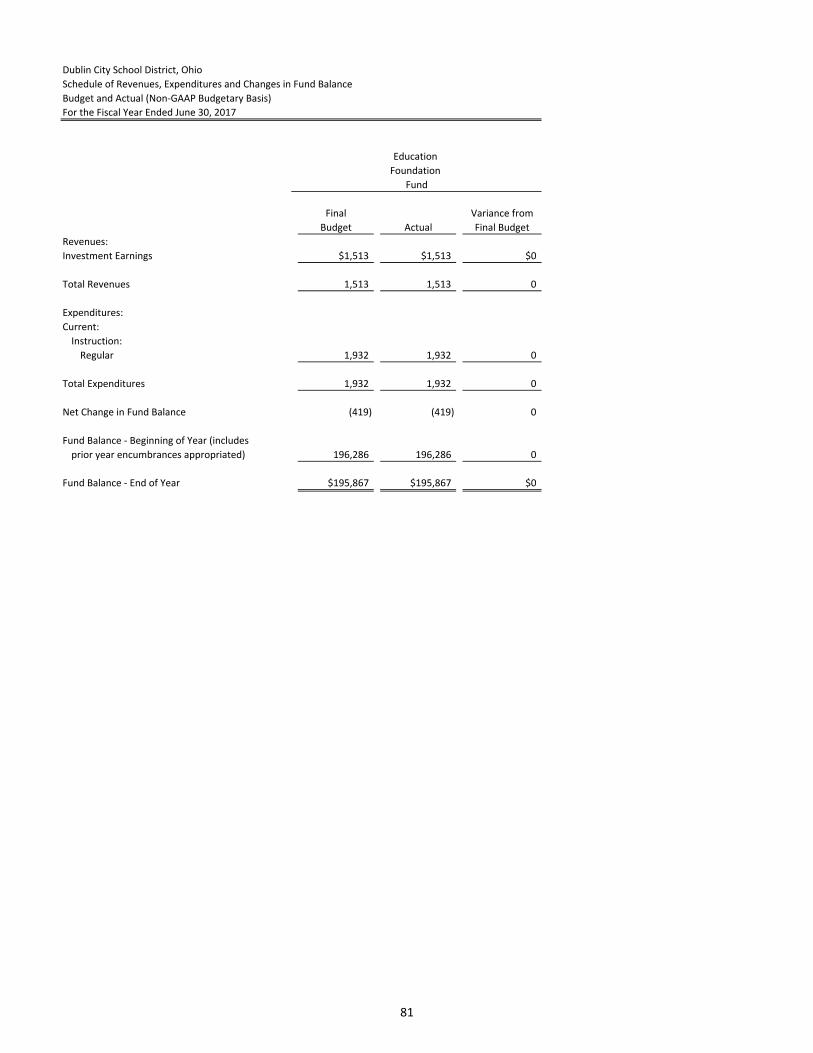
Dublin City School District, Ohio
Schedule of Revenues, Expenditures and Changes in Fund Balance
Budget and Actual (Non-GAAP Budgetary Basis)
For the Fiscal Year Ended June 30, 2017
Final Variance from
Budget Actual Final Budget
Revenues:
Investment Earnings $1,513 $1,513 $0
Total Revenues 1,513 1,513 0
Expenditures:
Current:
Instruction:
Regular 1,932 1,932 0
Total Expenditures 1,932 1,932 0
Net Change in Fund Balance (419) (419) 0
Fund Balance - Beginning of Year (includes
prior year encumbrances appropriated) 196,286 196,286 0
Fund Balance - End of Year $195,867 $195,867 $0
Fund
Education
Foundation
81

Dublin City School District, Ohio
Schedule of Revenues, Expenditures and Changes in Fund Balance
Budget and Actual (Non-GAAP Budgetary Basis)
For the Fiscal Year Ended June 30, 2017
Final Variance from
Budget Actual Final Budget
Revenues:
Extracurricular Activities $1,037,243 $1,037,243 $0
Other Revenues 131,328 131,328 0
Total Revenues 1,168,571 1,168,571 0
Expenditures:
Current:
Support Services:
Pupil 57,757 57,757 0
Extracurricular Activities 1,218,175 1,218,175 0
Total Expenditures 1,275,932 1,275,932 (0)
Excess of Revenues Over (Under) Expenditures (107,361) (107,361) 0
Other Financing Sources (Uses):
Transfers In 100,258 100,258 0
Total Other Financing Sources (Uses) 100,258 100,258 0
Net Change in Fund Balance (7,103) (7,103) 0
Fund Balance - Beginning of Year (includes
prior year encumbrances appropriated) 419,526 419,526 0
Fund Balance - End of Year $412,423 $412,423 $0
Fund
Athletic
82
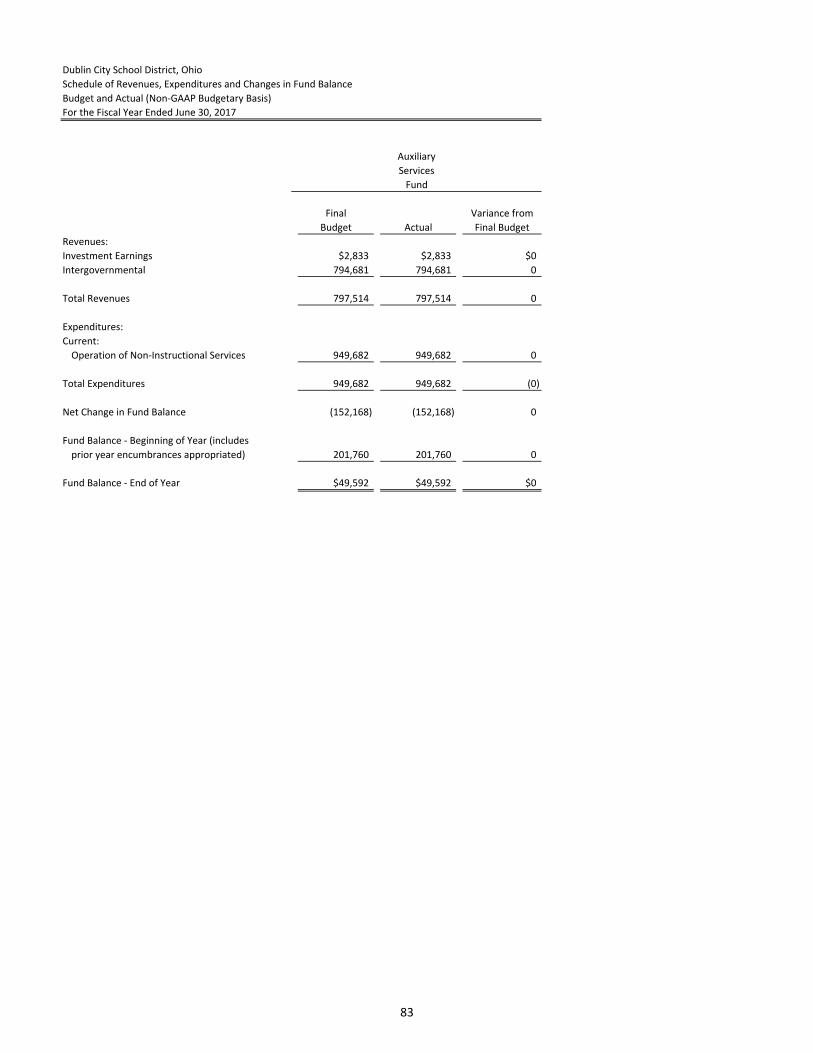
Dublin City School District, Ohio
Schedule of Revenues, Expenditures and Changes in Fund Balance
Budget and Actual (Non-GAAP Budgetary Basis)
For the Fiscal Year Ended June 30, 2017
Final Variance from
Budget Actual Final Budget
Revenues:
Investment Earnings $2,833 $2,833 $0
Intergovernmental 794,681 794,681 0
Total Revenues 797,514 797,514 0
Expenditures:
Current:
Operation of Non-Instructional Services 949,682 949,682 0
Total Expenditures 949,682 949,682 (0)
Net Change in Fund Balance (152,168) (152,168) 0
Fund Balance - Beginning of Year (includes
prior year encumbrances appropriated) 201,760 201,760 0
Fund Balance - End of Year $49,592 $49,592 $0
Fund
Auxiliary
Services
83
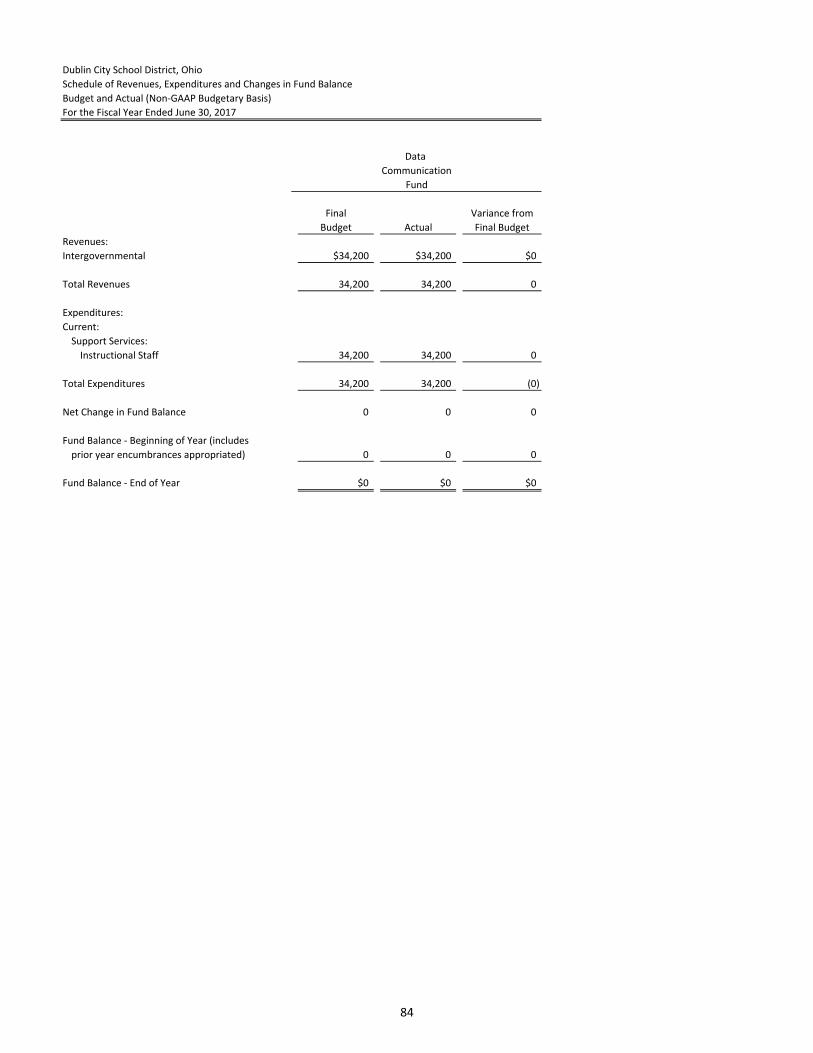
Dublin City School District, Ohio
Schedule of Revenues, Expenditures and Changes in Fund Balance
Budget and Actual (Non-GAAP Budgetary Basis)
For the Fiscal Year Ended June 30, 2017
Final Variance from
Budget Actual Final Budget
Revenues:
Intergovernmental $34,200 $34,200 $0
Total Revenues 34,200 34,200 0
Expenditures:
Current:
Support Services:
Instructional Staff 34,200 34,200 0
Total Expenditures 34,200 34,200 (0)
Net Change in Fund Balance 0 0 0
Fund Balance - Beginning of Year (includes
prior year encumbrances appropriated) 0 0 0
Fund Balance - End of Year $0 $0 $0
Fund
Data
Communication
84

Dublin City School District, Ohio
Schedule of Revenues, Expenditures and Changes in Fund Balance
Budget and Actual (Non-GAAP Budgetary Basis)
For the Fiscal Year Ended June 30, 2017
Final Variance from
Budget Actual Final Budget
Revenues:
Intergovernmental $0 $0 $0
Total Revenues 0 0 0
Expenditures:
Instruction:
Special 206 206 0
Total Expenditures 206 206 (0)
Net Change in Fund Balance (206) (206) 0
Fund Balance - Beginning of Year (includes
prior year encumbrances appropriated) 206 206 0
Fund Balance - End of Year $0 $0 $0
Fund
Assistive
Technology
85

Dublin City School District, Ohio
Schedule of Revenues, Expenditures and Changes in Fund Balance
Budget and Actual (Non-GAAP Budgetary Basis)
For the Fiscal Year Ended June 30, 2017
Final Variance from
Budget Actual Final Budget
Revenues:
Intergovernmental $16,610 $16,610 $0
Total Revenues 16,610 16,610 0
Expenditures:
Current:
Support Services:
School Administration 15,000 15,000 0
Operations and Maintenance 19,177 19,177 0
Total Expenditures 34,177 34,177 0
Excess of Revenues Over (Under) Expenditures (17,567) (17,567) 0
Other Financing Sources (Uses):
Advances In 17,600 17,600 0
Total Other Financing Sources (Uses) 17,600 17,600 0
Net Change in Fund Balance 33 33 0
Fund Balance - Beginning of Year (includes
prior year encumbrances appropriated) 0 0 0
Fund Balance - End of Year $33 $33 $0
Fund
Miscellaneous
State Grants
86
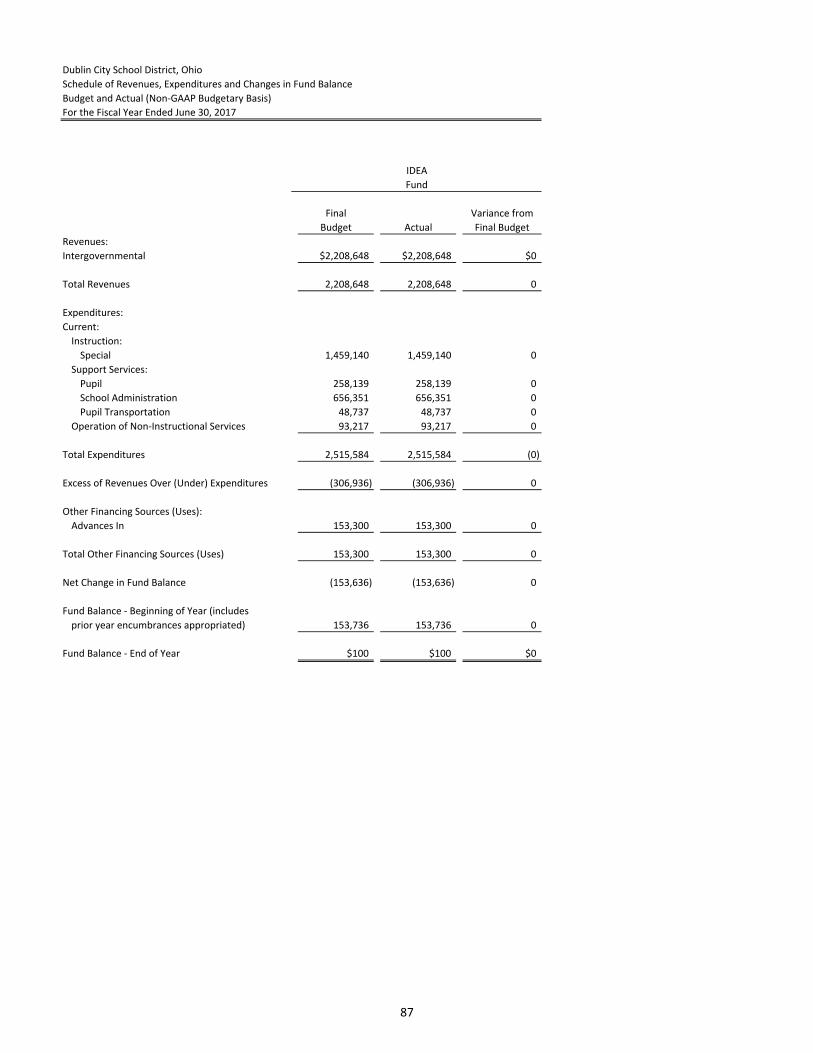
Dublin City School District, Ohio
Schedule of Revenues, Expenditures and Changes in Fund Balance
Budget and Actual (Non-GAAP Budgetary Basis)
For the Fiscal Year Ended June 30, 2017
Final Variance from
Budget Actual Final Budget
Revenues:
Intergovernmental $2,208,648 $2,208,648 $0
Total Revenues 2,208,648 2,208,648 0
Expenditures:
Current:
Instruction:
Special 1,459,140 1,459,140 0
Support Services:
Pupil 258,139 258,139 0
School Administration 656,351 656,351 0
Pupil Transportation 48,737 48,737 0
Operation of Non-Instructional Services 93,217 93,217 0
Total Expenditures 2,515,584 2,515,584 (0)
Excess of Revenues Over (Under) Expenditures (306,936) (306,936) 0
Other Financing Sources (Uses):
Advances In 153,300 153,300 0
Total Other Financing Sources (Uses) 153,300 153,300 0
Net Change in Fund Balance (153,636) (153,636) 0
Fund Balance - Beginning of Year (includes
prior year encumbrances appropriated) 153,736 153,736 0
Fund Balance - End of Year $100 $100 $0
Fund
IDEA
87

Dublin City School District, Ohio
Schedule of Revenues, Expenditures and Changes in Fund Balance
Budget and Actual (Non-GAAP Budgetary Basis)
For the Fiscal Year Ended June 30, 2017
Final Variance from
Budget Actual Final Budget
Revenues:
Intergovernmental $1,056,081 $1,056,081 $0
Total Revenues 1,056,081 1,056,081 0
Expenditures:
Current:
Instruction:
Special 1,184,223 1,184,223 0
Support Services:
Instructional Staff 665 665 0
Operation of Non-Instructional Services 17,983 17,983 0
Total Expenditures 1,202,871 1,202,871 (0)
Excess of Revenues Over (Under) Expenditures (146,790) (146,790) 0
Other Financing Sources (Uses):
Advances In 71,400 71,400 0
Total Other Financing Sources (Uses) 71,400 71,400 0
Net Change in Fund Balance (75,390) (75,390) 0
Fund Balance - Beginning of Year (includes
prior year encumbrances appropriated) 75,473 75,473 0
Fund Balance - End of Year $83 $83 $0
Fund
Title I
88
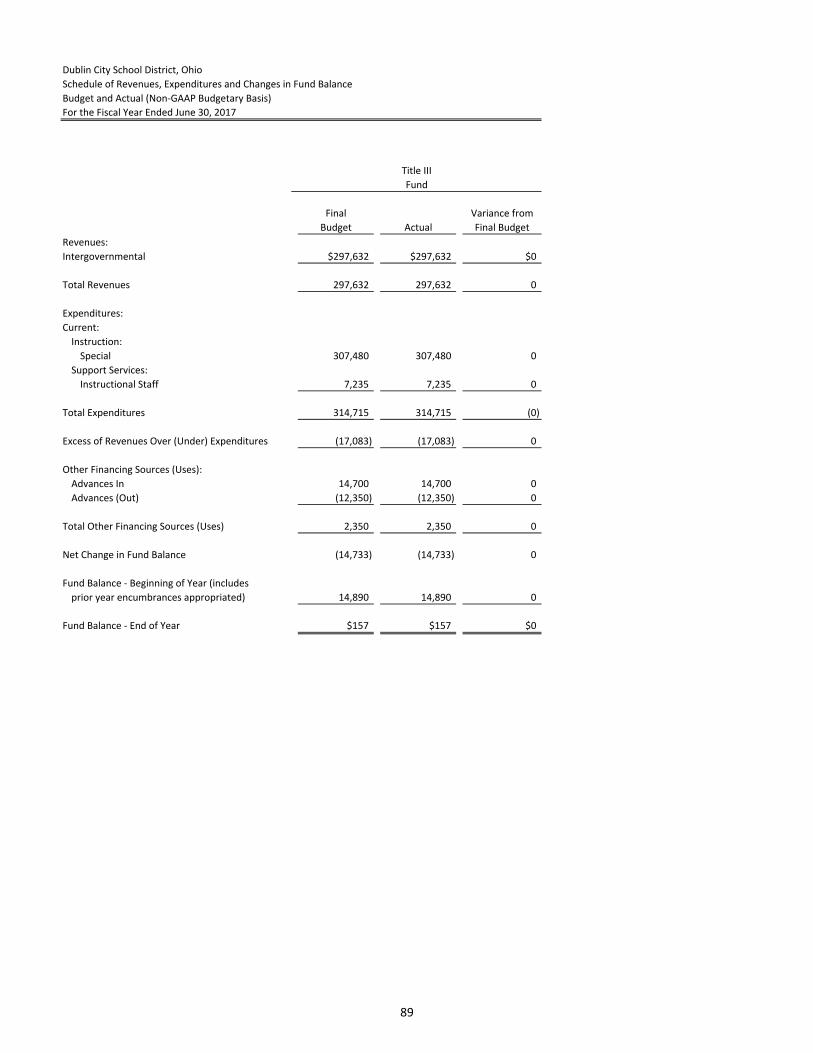
Dublin City School District, Ohio
Schedule of Revenues, Expenditures and Changes in Fund Balance
Budget and Actual (Non-GAAP Budgetary Basis)
For the Fiscal Year Ended June 30, 2017
Final Variance from
Budget Actual Final Budget
Revenues:
Intergovernmental $297,632 $297,632 $0
Total Revenues 297,632 297,632 0
Expenditures:
Current:
Instruction:
Special 307,480 307,480 0
Support Services:
Instructional Staff 7,235 7,235 0
Total Expenditures 314,715 314,715 (0)
Excess of Revenues Over (Under) Expenditures (17,083) (17,083) 0
Other Financing Sources (Uses):
Advances In 14,700 14,700 0
Advances (Out) (12,350) (12,350) 0
Total Other Financing Sources (Uses) 2,350 2,350 0
Net Change in Fund Balance (14,733) (14,733) 0
Fund Balance - Beginning of Year (includes
prior year encumbrances appropriated) 14,890 14,890 0
Fund Balance - End of Year $157 $157 $0
Fund
Title III
89
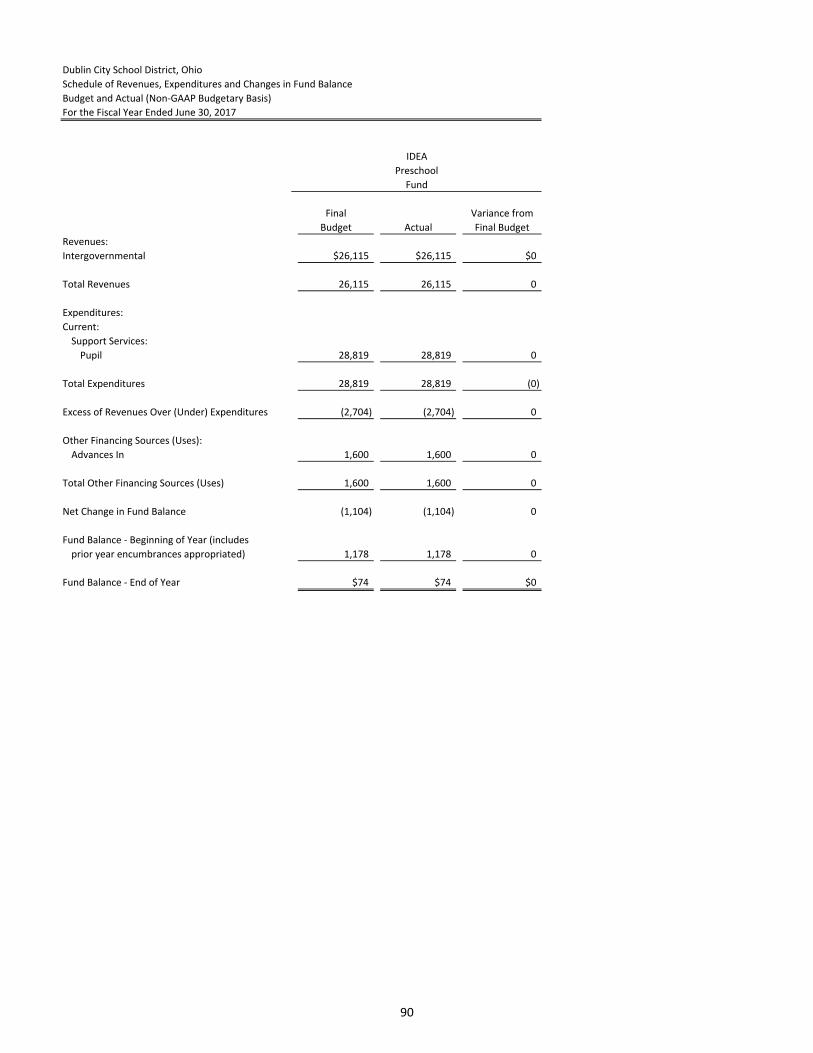
Dublin City School District, Ohio
Schedule of Revenues, Expenditures and Changes in Fund Balance
Budget and Actual (Non-GAAP Budgetary Basis)
For the Fiscal Year Ended June 30, 2017
Final Variance from
Budget Actual Final Budget
Revenues:
Intergovernmental $26,115 $26,115 $0
Total Revenues 26,115 26,115 0
Expenditures:
Current:
Support Services:
Pupil 28,819 28,819 0
Total Expenditures 28,819 28,819 (0)
Excess of Revenues Over (Under) Expenditures (2,704) (2,704) 0
Other Financing Sources (Uses):
Advances In 1,600 1,600 0
Total Other Financing Sources (Uses) 1,600 1,600 0
Net Change in Fund Balance (1,104) (1,104) 0
Fund Balance - Beginning of Year (includes
prior year encumbrances appropriated) 1,178 1,178 0
Fund Balance - End of Year $74 $74 $0
Fund
IDEA
Preschool
90
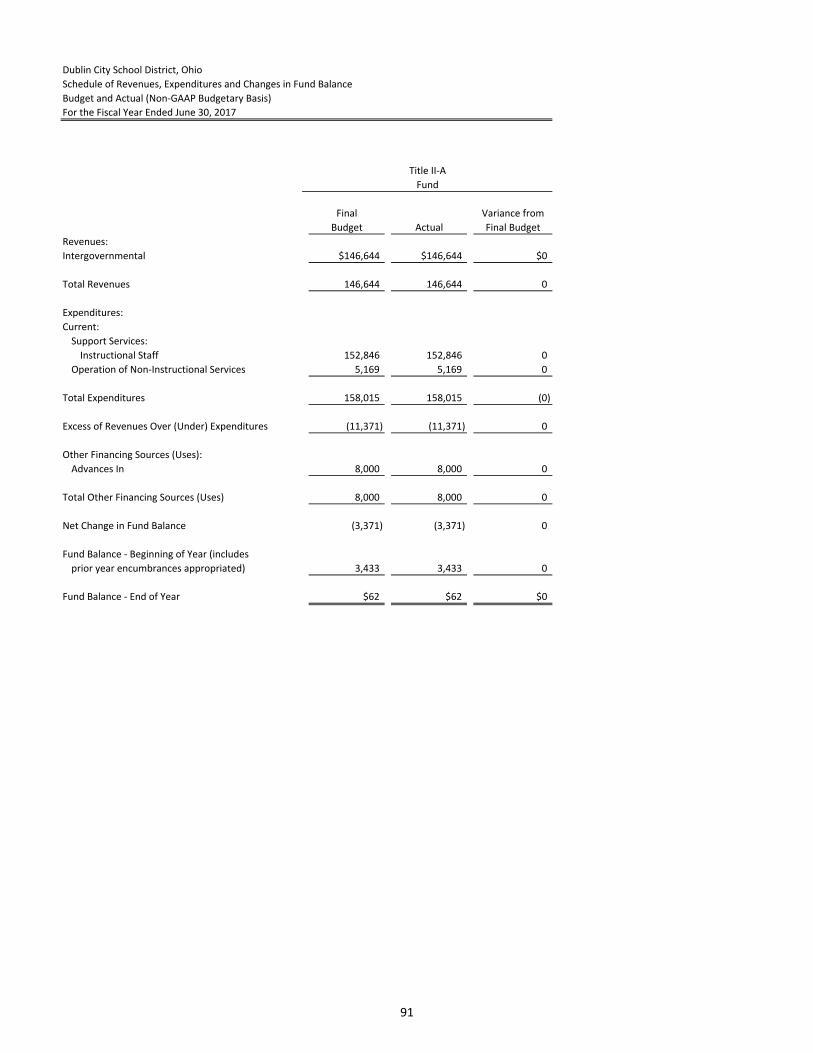
Dublin City School District, Ohio
Schedule of Revenues, Expenditures and Changes in Fund Balance
Budget and Actual (Non-GAAP Budgetary Basis)
For the Fiscal Year Ended June 30, 2017
Final Variance from
Budget Actual Final Budget
Revenues:
Intergovernmental $146,644 $146,644 $0
Total Revenues 146,644 146,644 0
Expenditures:
Current:
Support Services:
Instructional Staff 152,846 152,846 0
Operation of Non-Instructional Services 5,169 5,169 0
Total Expenditures 158,015 158,015 (0)
Excess of Revenues Over (Under) Expenditures (11,371) (11,371) 0
Other Financing Sources (Uses):
Advances In 8,000 8,000 0
Total Other Financing Sources (Uses) 8,000 8,000 0
Net Change in Fund Balance (3,371) (3,371) 0
Fund Balance - Beginning of Year (includes
prior year encumbrances appropriated) 3,433 3,433 0
Fund Balance - End of Year $62 $62 $0
Fund
Title II-A
91
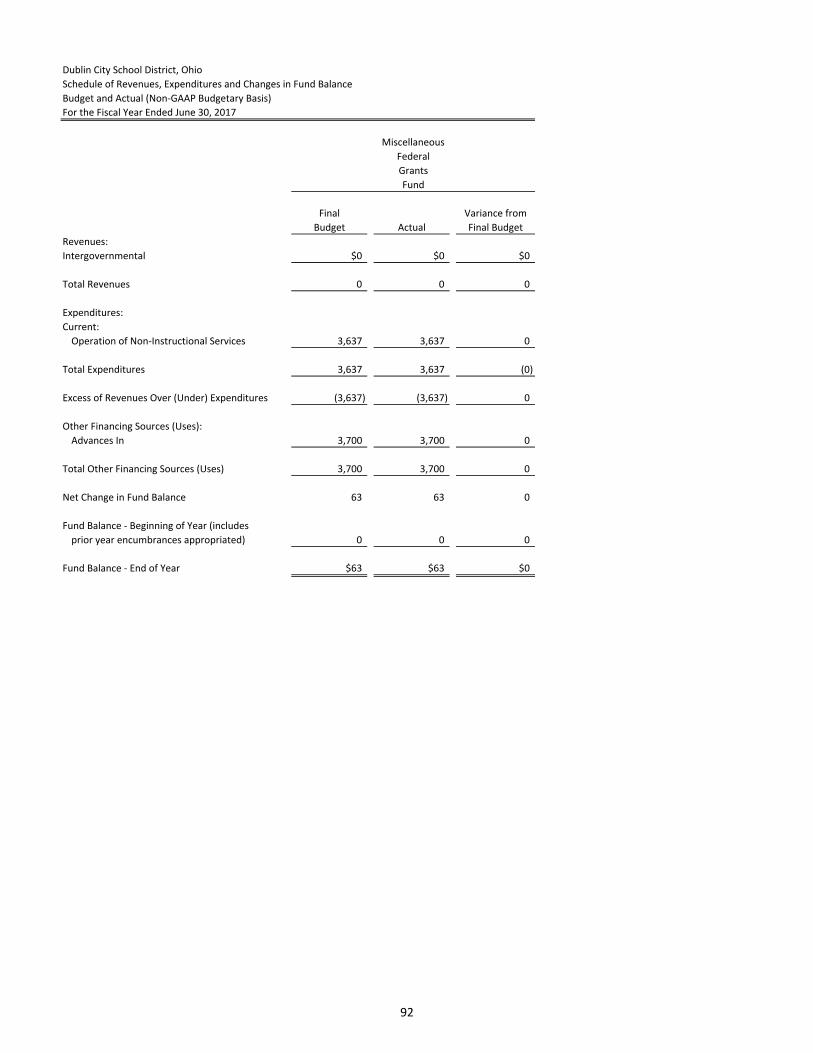
Dublin City School District, Ohio
Schedule of Revenues, Expenditures and Changes in Fund Balance
Budget and Actual (Non-GAAP Budgetary Basis)
For the Fiscal Year Ended June 30, 2017
Final Variance from
Budget Actual Final Budget
Revenues:
Intergovernmental $0 $0 $0
Total Revenues 0 0 0
Expenditures:
Current:
Operation of Non-Instructional Services 3,637 3,637 0
Total Expenditures 3,637 3,637 (0)
Excess of Revenues Over (Under) Expenditures (3,637) (3,637) 0
Other Financing Sources (Uses):
Advances In 3,700 3,700 0
Total Other Financing Sources (Uses) 3,700 3,700 0
Net Change in Fund Balance 63 63 0
Fund Balance - Beginning of Year (includes
prior year encumbrances appropriated) 0 0 0
Fund Balance - End of Year $63 $63 $0
Fund
Miscellaneous
Federal
Grants
92

NONMAJOR CAPITAL PROJECTS FUND
Fund Description
Capital Projects Fund - The Capital Projects Fund is used to account for financial resources to be
used for the acquisition or construction of major capital facilities, other than those financed by
proprietary and trust funds. The District also uses the capital projects fund to pay initial
functional costs, such as textbooks, involved in opening a facility, therefore all expenditures are
not recorded as capital outlay.
93
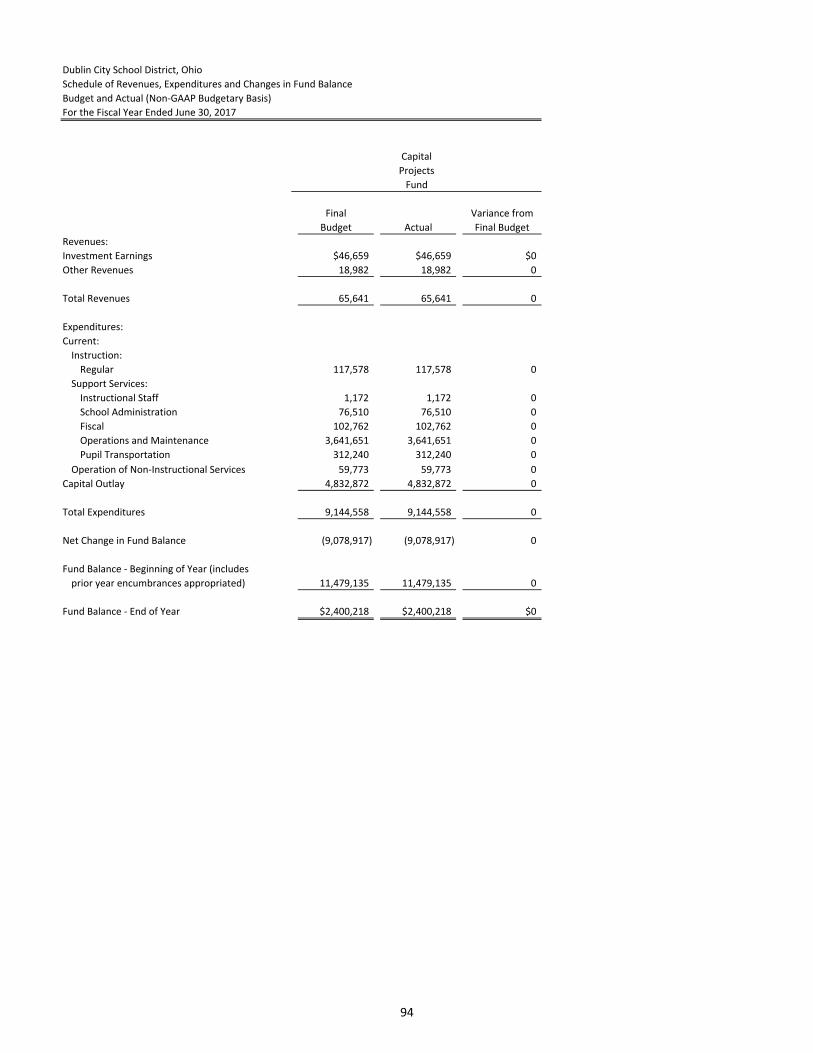
Dublin City School District, Ohio
Schedule of Revenues, Expenditures and Changes in Fund Balance
Budget and Actual (Non-GAAP Budgetary Basis)
For the Fiscal Year Ended June 30, 2017
Final Variance from
Budget Actual Final Budget
Revenues:
Investment Earnings $46,659 $46,659 $0
Other Revenues 18,982 18,982 0
Total Revenues 65,641 65,641 0
Expenditures:
Current:
Instruction:
Regular 117,578 117,578 0
Support Services:
Instructional Staff 1,172 1,172 0
School Administration 76,510 76,510 0
Fiscal 102,762 102,762 0
Operations and Maintenance 3,641,651 3,641,651 0
Pupil Transportation 312,240 312,240 0
Operation of Non-Instructional Services 59,773 59,773 0
Capital Outlay 4,832,872 4,832,872 0
Total Expenditures 9,144,558 9,144,558 0
Net Change in Fund Balance (9,078,917) (9,078,917) 0
Fund Balance - Beginning of Year (includes
prior year encumbrances appropriated) 11,479,135 11,479,135 0
Fund Balance - End of Year $2,400,218 $2,400,218 $0
Fund
Capital
Projects
94
NONMAJOR FUNDS
Internal Service Funds
The Internal Service Funds are used to account for the financing of services provided by one
department to other departments of the District on a cost-reimbursement basis. The following
is a description of the District’s non-major internal service funds.
Fund Descriptions
Self-Funded Insurance Fund - A fund provided to account for monies received from other funds
as payment for providing health and vision or any other similar employee benefits. The
District’s self-funded health and vision plans comprise of the activity in this fund. The Self-
Funded Insurance Fund may make payments for services provided to employees, for
reimbursement to employees who have paid providers, to third party administrators for claim
payment or administration, for stop-loss coverage, or any other reinsurance or other similar
purposes.
Guidance/Testing Fund - This fund is used to account for monies received as payment for
providing college entrance examinations, transcript fees, and college application fees. The
Guidance/Testing fund makes payments for college application materials, testing materials, and
other items deemed necessary to assist future graduates in gaining admittance to college.
95

Dublin City School District, Ohio
Combining Statement of Net Position
Internal Service Funds
June 30, 2017
Total
Self-Funded Guidance - Internal Service
Insurance Testing Funds
Current Assets:
Equity in Pooled Cash and Investments $15,077,964 $158,866 $15,236,830
Total Current Assets 15,077,964 158,866 15,236,830
Noncurrent Assets:
Depreciable Capital Assets, Net 0 1,306 1,306
Total Noncurrent Assets 0 1,306 1,306
Total Assets 15,077,964 160,172 15,238,136
Liabilities:
Current Liabilities:
Accounts Payable 0 2,190 2,190
Claims Payable 1,617,029 0 1,617,029
Total Liabilities 1,617,029 2,190 1,619,219
Net Position:
Investment in Capital Assets 0 1,306 1,306
Restricted for:
Unrestricted 13,460,935 156,676 13,617,611
Total Net Position $13,460,935 $157,982 $13,618,917
96
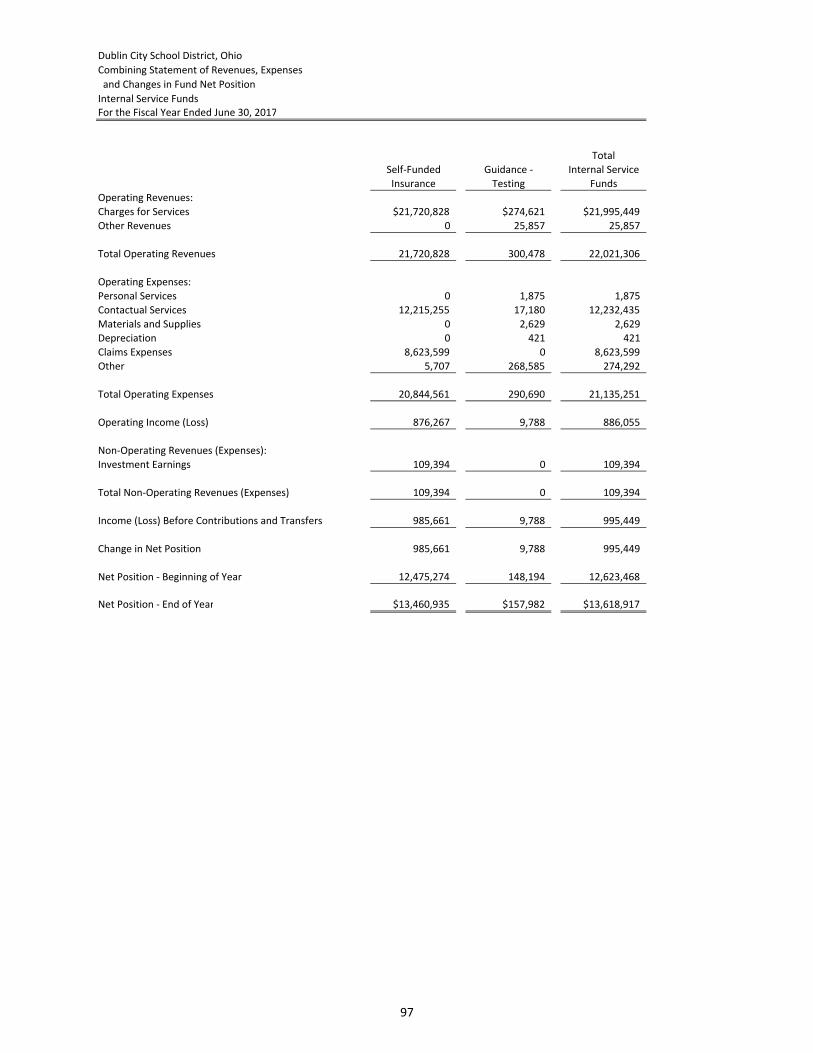
Dublin City School District, Ohio
Combining Statement of Revenues, Expenses
and Changes in Fund Net Position
Internal Service Funds
For the Fiscal Year Ended June 30, 2017
Total
Self-Funded Guidance - Internal Service
Insurance Testing Funds
Operating Revenues:
Charges for Services $21,720,828 $274,621 $21,995,449
Other Revenues 0 25,857 25,857
Total Operating Revenues 21,720,828 300,478 22,021,306
Operating Expenses:
Personal Services 0 1,875 1,875
Contactual Services 12,215,255 17,180 12,232,435
Materials and Supplies 0 2,629 2,629
Depreciation 0 421 421
Claims Expenses 8,623,599 0 8,623,599
Other 5,707 268,585 274,292
Total Operating Expenses 20,844,561 290,690 21,135,251
Operating Income (Loss) 876,267 9,788 886,055
Non-Operating Revenues (Expenses):
Investment Earnings 109,394 0 109,394
Total Non-Operating Revenues (Expenses) 109,394 0 109,394
Income (Loss) Before Contributions and Transfers 985,661 9,788 995,449
Change in Net Position 985,661 9,788 995,449
Net Position - Beginning of Year 12,475,274 148,194 12,623,468
Net Position - End of Year $13,460,935 $157,982 $13,618,917
97
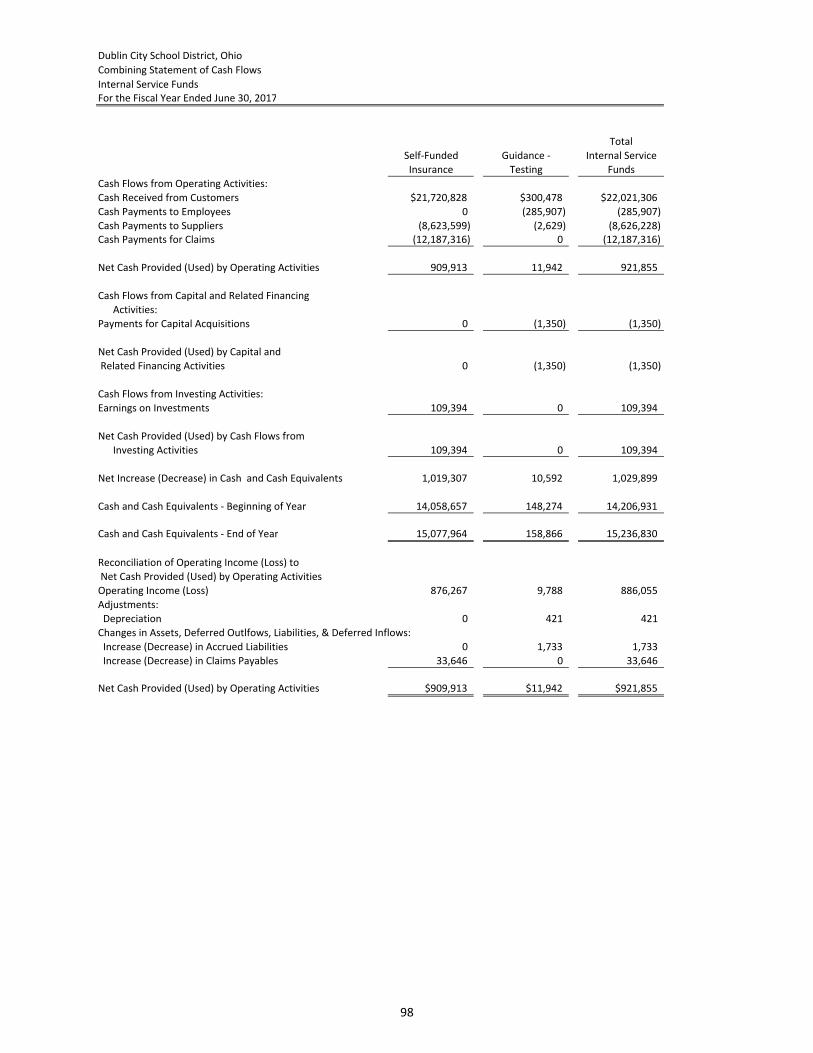
Dublin City School District, Ohio
Combining Statement of Cash Flows
Internal Service Funds
For the Fiscal Year Ended June 30, 2017
Total
Self-Funded Guidance - Internal Service
Insurance Testing Funds
Cash Flows from Operating Activities:
Cash Received from Customers $21,720,828 $300,478 $22,021,306
Cash Payments to Employees 0 (285,907) (285,907)
Cash Payments to Suppliers (8,623,599) (2,629) (8,626,228)
Cash Payments for Claims (12,187,316) 0 (12,187,316)
Net Cash Provided (Used) by Operating Activities 909,913 11,942 921,855
Cash Flows from Capital and Related Financing
Activities:
Payments for Capital Acquisitions 0 (1,350) (1,350)
Net Cash Provided (Used) by Capital and
Related Financing Activities 0 (1,350) (1,350)
Cash Flows from Investing Activities:
Earnings on Investments 109,394 0 109,394
Net Cash Provided (Used) by Cash Flows from
Investing Activities 109,394 0 109,394
Net Increase (Decrease) in Cash and Cash Equivalents 1,019,307 10,592 1,029,899
Cash and Cash Equivalents - Beginning of Year 14,058,657 148,274 14,206,931
Cash and Cash Equivalents - End of Year 15,077,964 158,866 15,236,830
Reconciliation of Operating Income (Loss) to
Net Cash Provided (Used) by Operating Activities
Operating Income (Loss) 876,267 9,788 886,055
Adjustments:
Depreciation 0 421 421
Changes in Assets, Deferred Outlfows, Liabilities, & Deferred Inflows:
Increase (Decrease) in Accrued Liabilities 0 1,733 1,733
Increase (Decrease) in Claims Payables 33,646 0 33,646
Net Cash Provided (Used) by Operating Activities $909,913 $11,942 $921,855
98

NONMAJOR FUNDS
Fiduciary funds
Fiduciary fund types are used to account for assets held by the District in a trustee capacity or
as an agent for individuals, private organizations, other governmental unites and/or other
funds.
District Agency Fund - This fund is used to account for monies received through employee
payroll deductions to be paid to retirement systems and for various insurances. This fund is also
used to account for monies collected for the Win-Win Agreement with Columbus City Schools
and for the payment of the obligation owed.
Student Activities Fund - This fund is used to account for monies received by various student
organizations. The funds are expended in accordance with a specific purpose statement that
has been approved by the District.
99
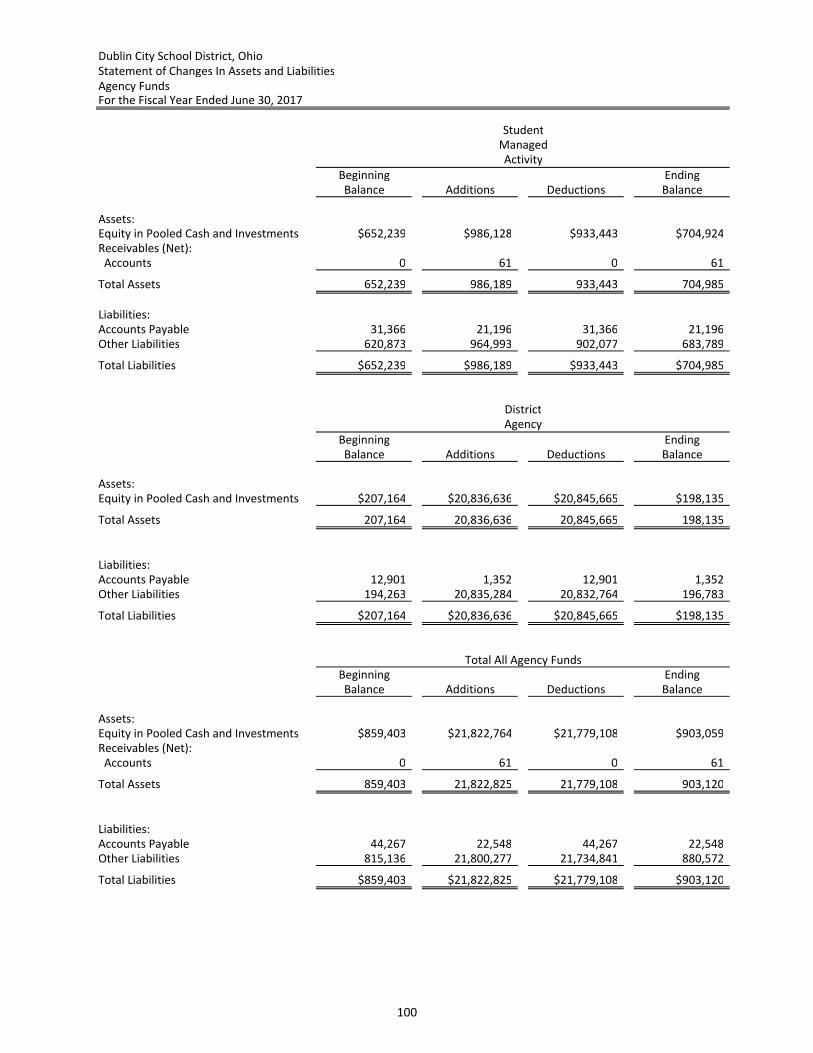
Dublin City School District, Ohio
Statement of Changes In Assets and Liabilities
Agency FundsFor the Fiscal Year Ended June 30, 2017
Beginning EndingBalance Additions Deductions Balance
Assets:Equity in Pooled Cash and Investments $652,239 $986,128 $933,443 $704,924Receivables (Net): Accounts 0 61 0 61
Total Assets 652,239 986,189 933,443 704,985
Liabilities:Accounts Payable 31,366 21,196 31,366 21,196Other Liabilities 620,873 964,993 902,077 683,789
Total Liabilities $652,239 $986,189 $933,443 $704,985
Beginning EndingBalance Additions Deductions Balance
Assets:Equity in Pooled Cash and Investments $207,164 $20,836,636 $20,845,665 $198,135
Total Assets 207,164 20,836,636 20,845,665 198,135
Liabilities:Accounts Payable 12,901 1,352 12,901 1,352Other Liabilities 194,263 20,835,284 20,832,764 196,783
Total Liabilities $207,164 $20,836,636 $20,845,665 $198,135
Total All Agency FundsBeginning EndingBalance Additions Deductions Balance
Assets:Equity in Pooled Cash and Investments $859,403 $21,822,764 $21,779,108 $903,059Receivables (Net): Accounts 0 61 0 61
Total Assets 859,403 21,822,825 21,779,108 903,120
Liabilities:Accounts Payable 44,267 22,548 44,267 22,548Other Liabilities 815,136 21,800,277 21,734,841 880,572
Total Liabilities $859,403 $21,822,825 $21,779,108 $903,120
StudentManaged
DistrictAgency
Activity
100
STATISTICAL SECTION
STATISTICAL SECTION This part of the District's comprehensive annual financial report presents detailed information as a context for understanding what the information in the financial statements, note disclosures, and required supplementary information says about the District's overall financial health. CONTENTS Financial Trends ‐ These schedules contain trend information to help the reader understand how the District's financial position has changed over time. Revenue Capacity ‐ These schedules contain information to help the reader understand and assess the factors affecting the District's ability to generate its most significant local revenue source(s), the property tax (and the income tax). Debt Capacity ‐ These schedules present information to help the reader assess the affordability of the District's current levels of outstanding debt and the District's ability to issue additional debt in the future. Economic and Demographic Information ‐ These schedules offer economic and demographic indicators to help the reader understand the environment within which the District's financial activities take place and to provide information that facilitates comparisons of financial information over time and among governments. Operation Information ‐ These schedules contain service and infrastructure data to help the reader understand how the information in the District's financial report relates to the services the District provides and the activities it performs. Sources ‐ Unless otherwise noted, the information in these schedules is derived from the comprehensive annual financial reports for the relevant year.
101

102
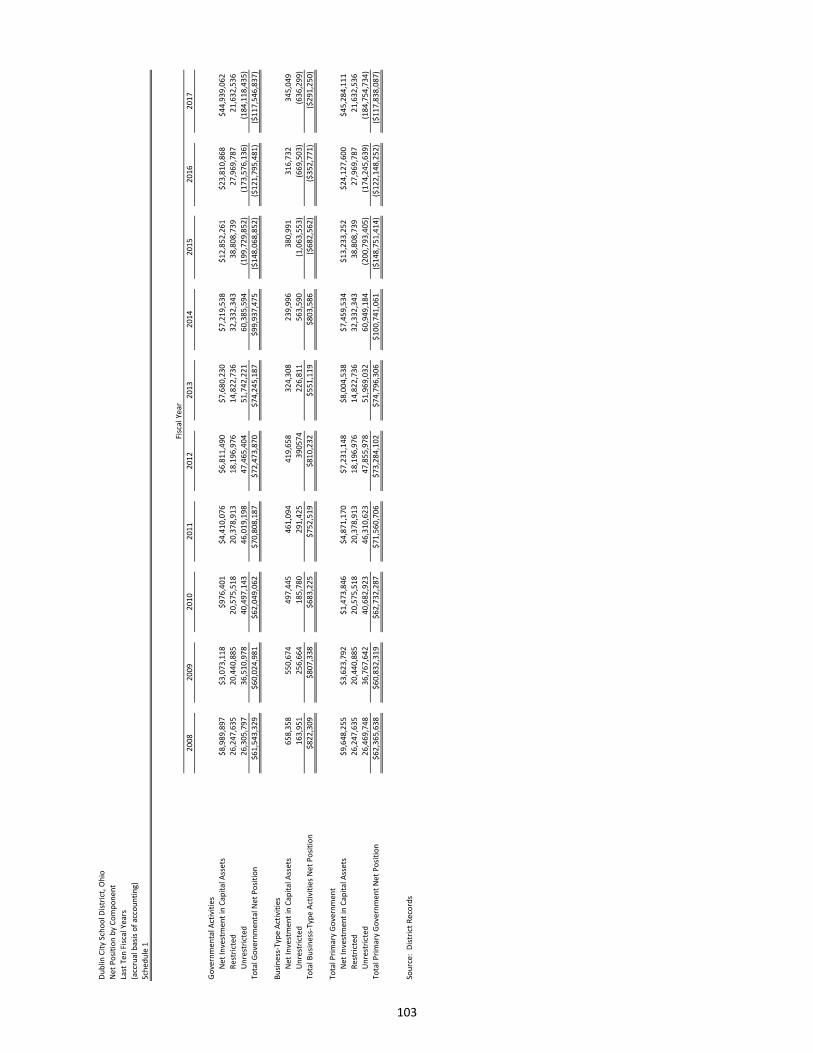
Du
blin
Cit
y Sc
ho
ol D
istr
ict,
Oh
io
Ne
t P
osi
tio
n b
y C
om
po
ne
nt
Last
Te
n F
isca
l Ye
ars
(acc
rua
l ba
sis
of
acc
ou
nti
ng
)
Sch
ed
ule
1
20
08
20
09
20
10
20
11
20
12
20
13
20
14
20
15
20
16
20
17
Go
vern
me
nta
l Act
ivit
ies
Ne
t In
vest
me
nt
in C
ap
ita
l Ass
ets
$8
,98
9,8
97
$3
,07
3,1
18
$9
76
,40
1$
4,4
10
,07
6$
6,8
11
,49
0$
7,6
80
,23
0$
7,2
19
,53
8$
12
,85
2,2
61
$2
3,8
10
,86
8$
44
,93
9,0
62
Re
stri
cte
d2
6,2
47
,63
52
0,4
40
,88
52
0,5
75
,51
82
0,3
78
,91
31
8,1
96
,97
61
4,8
22
,73
63
2,3
32
,34
33
8,8
08
,73
92
7,9
69
,78
72
1,6
32
,53
6
Un
rest
rict
ed
26
,30
5,7
97
36
,51
0,9
78
40
,49
7,1
43
46
,01
9,1
98
47
,46
5,4
04
51
,74
2,2
21
60
,38
5,5
94
(19
9,7
29
,85
2)
(17
3,5
76
,13
6)
(18
4,1
18
,43
5)
To
tal G
ove
rnm
en
tal N
et
Po
siti
on
$6
1,5
43
,32
9$
60
,02
4,9
81
$6
2,0
49
,06
2$
70
,80
8,1
87
$7
2,4
73
,87
0$
74
,24
5,1
87
$9
9,9
37
,47
5($
14
8,0
68
,85
2)
($1
21
,79
5,4
81
)($
11
7,5
46
,83
7)
Bu
sin
ess
-Typ
e A
ctiv
itie
s
Ne
t In
vest
me
nt
in C
ap
ita
l Ass
ets
65
8,3
58
55
0,6
74
49
7,4
45
46
1,0
94
41
9,6
58
32
4,3
08
23
9,9
96
38
0,9
91
31
6,7
32
34
5,0
49
Un
rest
rict
ed
16
3,9
51
25
6,6
64
18
5,7
80
29
1,4
25
39
05
74
22
6,8
11
56
3,5
90
(1,0
63
,55
3)
(66
9,5
03
)(6
36
,29
9)
To
tal B
usi
ne
ss-T
ype
Act
ivit
ies
Ne
t P
osi
tio
n$
82
2,3
09
$8
07
,33
8$
68
3,2
25
$7
52
,51
9$
81
0,2
32
$5
51
,11
9$
80
3,5
86
($6
82
,56
2)
($3
52
,77
1)
($2
91
,25
0)
To
tal P
rim
ary
Go
vern
me
nt
Ne
t In
vest
me
nt
in C
ap
ita
l Ass
ets
$9
,64
8,2
55
$3
,62
3,7
92
$1
,47
3,8
46
$4
,87
1,1
70
$7
,23
1,1
48
$8
,00
4,5
38
$7
,45
9,5
34
$1
3,2
33
,25
2$
24
,12
7,6
00
$4
5,2
84
,11
1
Re
stri
cte
d2
6,2
47
,63
52
0,4
40
,88
52
0,5
75
,51
82
0,3
78
,91
31
8,1
96
,97
61
4,8
22
,73
63
2,3
32
,34
33
8,8
08
,73
92
7,9
69
,78
72
1,6
32
,53
6
Un
rest
rict
ed
26
,46
9,7
48
36
,76
7,6
42
40
,68
2,9
23
46
,31
0,6
23
47
,85
5,9
78
51
,96
9,0
32
60
,94
9,1
84
(20
0,7
93
,40
5)
(17
4,2
45
,63
9)
(18
4,7
54
,73
4)
To
tal P
rim
ary
Go
vern
me
nt
Ne
t P
osi
tio
n$
62
,36
5,6
38
$6
0,8
32
,31
9$
62
,73
2,2
87
$7
1,5
60
,70
6$
73
,28
4,1
02
$7
4,7
96
,30
6$
10
0,7
41
,06
1($
14
8,7
51
,41
4)
($1
22
,14
8,2
52
)($
11
7,8
38
,08
7)
Sou
rce
: D
istr
ict
Re
cord
s
Fisc
al Y
ea
r
103
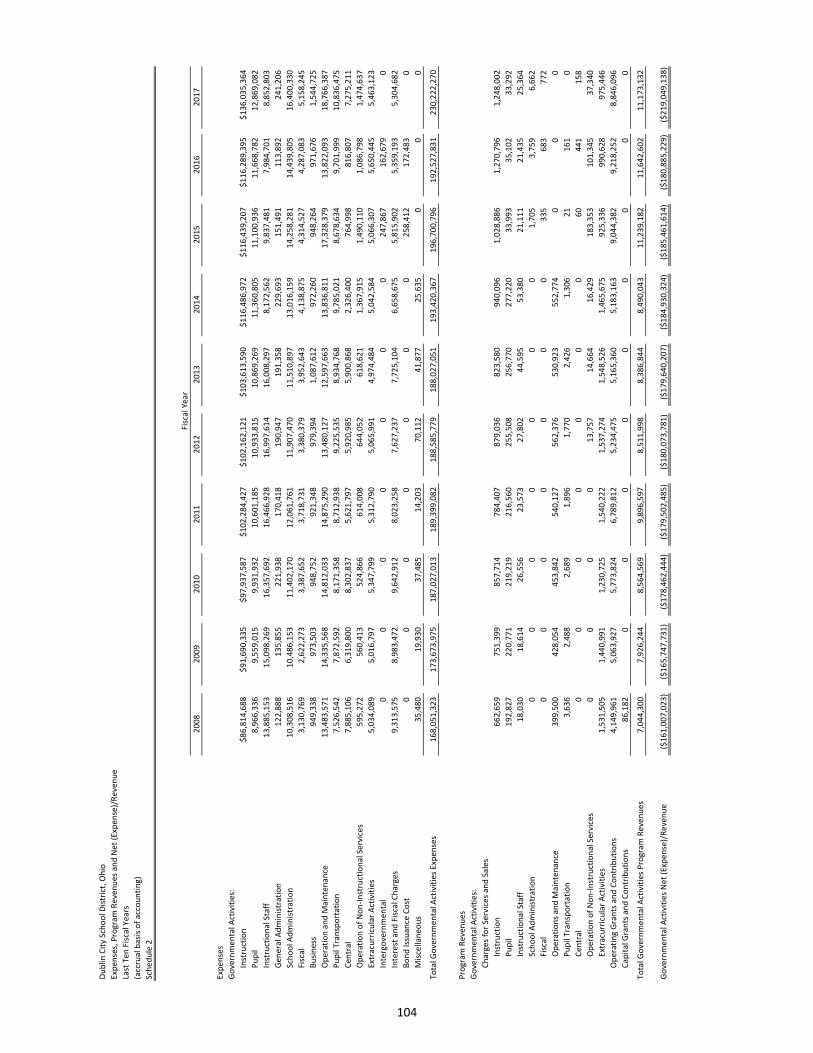
Du
blin
Cit
y Sc
ho
ol D
istr
ict,
Oh
io
Exp
en
ses,
Pro
gra
m R
eve
nu
es
an
d N
et
(Exp
en
se)/
Re
ven
ue
Last
Te
n F
isca
l Ye
ars
(acc
rua
l ba
sis
of
acc
ou
nti
ng
)
Sch
ed
ule
2
20
08
20
09
20
10
20
11
20
12
20
13
20
14
20
15
20
16
20
17
Exp
en
ses
Go
vern
me
nta
l Act
ivit
ies:
Inst
ruct
ion
$8
6,8
14
,68
8$
91
,69
0,3
35
$9
7,9
37
,58
7$
10
2,2
84
,42
7$
10
2,1
62
,12
1$
10
3,6
13
,59
0$
11
6,4
86
,97
2$
11
6,4
39
,20
7$
11
6,2
89
,39
5$
13
6,0
35
,36
4
Pu
pil
8,9
66
,33
69
,55
9,0
15
9,9
31
,93
21
0,6
01
,18
51
0,9
33
,81
51
0,8
69
,26
91
1,3
60
,80
51
1,1
00
,93
61
1,6
68
,78
21
2,8
69
,08
2
Inst
ruct
ion
al S
taff
13
,88
5,1
53
15
,09
8,2
69
16
,35
7,6
92
16
,46
6,9
28
16
,99
7,6
14
16
,00
8,2
97
8,1
72
,56
29
,83
7,4
81
7,9
84
,70
18
,85
2,8
03
Ge
ne
ral A
dm
inis
tra
tio
n1
22
,88
81
35
,85
52
21
,93
81
70
,41
81
90
,94
71
91
,35
82
29
,69
31
51
,49
11
13
,89
22
41
,20
6
Sch
oo
l Ad
min
istr
ati
on
10
,30
8,5
16
10
,48
6,1
53
11
,40
2,1
70
12
,06
1,7
61
11
,90
7,4
70
11
,51
0,8
97
13
,01
6,1
59
14
,25
8,2
81
14
,43
9,8
05
16
,40
0,3
30
Fisc
al
3,1
30
,76
92
,62
2,2
73
3,3
87
,65
23
,71
8,7
31
3,3
80
,37
93
,95
2,6
43
4,1
38
,87
54
,31
4,5
27
4,2
87
,08
35
,15
8,2
45
Bu
sin
ess
94
9,3
38
97
3,5
03
94
8,7
52
92
1,3
48
97
9,3
94
1,0
87
,61
29
72
,26
09
48
,26
49
71
,67
61
,54
4,7
25
Op
era
tio
n a
nd
Ma
inte
na
nce
13
,48
3,5
71
14
,33
5,5
68
14
,81
2,0
33
14
,87
5,2
90
13
,48
0,1
27
12
,59
7,6
63
13
,83
6,8
11
17
,32
8,3
79
13
,82
2,0
93
18
,76
6,3
87
Pu
pil
Tra
nsp
ort
ati
on
7,5
26
,54
27
,87
2,5
92
8,1
71
,35
88
,71
2,9
38
9,2
25
,53
58
,93
4,7
68
9,7
85
,02
18
,67
8,6
34
9,7
01
,99
91
0,8
36
,47
5
Ce
ntr
al
7,8
85
,10
66
,31
9,8
00
8,3
02
,83
75
,62
1,7
97
5,9
20
,98
55
,90
0,8
68
2,3
26
,40
07
64
,99
88
16
,80
77
,27
5,2
11
Op
era
tio
n o
f N
on
-In
stru
ctio
na
l Se
rvic
es
59
5,2
72
56
0,4
13
52
4,8
66
61
4,0
08
64
4,0
52
61
8,6
21
1,3
67
,91
51
,49
0,1
10
1,0
86
,79
81
,47
4,6
37
Ext
racu
rric
ula
r A
ctiv
itie
s5
,03
4,0
89
5,0
16
,79
75
,34
7,7
99
5,3
12
,79
05
,06
5,9
91
4,9
74
,48
45
,04
2,5
84
5,0
66
,30
75
,65
0,4
45
5,4
63
,12
3
Inte
rgo
vern
me
nta
l0
00
00
00
24
7,8
67
16
2,6
79
0
Inte
rest
an
d F
isca
l Ch
arg
es
9,3
13
,57
58
,98
3,4
72
9,6
42
,91
28
,02
3,2
58
7,6
27
,23
77
,72
5,1
04
6,6
58
,67
55
,81
5,9
02
5,3
59
,19
35
,30
4,6
82
Bo
nd
Iss
ua
nce
Co
st0
00
00
00
25
8,4
12
17
2,4
83
0
Mis
cella
ne
ou
s3
5,4
80
19
,93
03
7,4
85
14
,20
37
0,1
12
41
,87
72
5,6
35
00
0
To
tal G
ove
rnm
en
tal A
ctiv
itie
s E
xpe
nse
s1
68
,05
1,3
23
17
3,6
73
,97
51
87
,02
7,0
13
18
9,3
99
,08
21
88
,58
5,7
79
18
8,0
27
,05
11
93
,42
0,3
67
19
6,7
00
,79
61
92
,52
7,8
31
23
0,2
22
,27
0
Pro
gra
m R
eve
nu
es
Go
vern
me
nta
l Act
ivit
ies:
Ch
arg
es
for
Serv
ice
s a
nd
Sa
les
Inst
ruct
ion
66
2,6
59
75
1,3
99
85
7,7
14
78
4,4
07
87
9,0
36
82
3,5
80
94
0,0
96
1,0
28
,88
61
,27
0,7
96
1,2
48
,00
2
Pu
pil
19
2,8
27
22
0,7
71
21
9,2
19
21
6,5
60
25
5,5
08
25
6,7
70
27
7,2
20
33
,99
33
5,1
02
33
,29
2
Inst
ruct
ion
al S
taff
18
,03
01
8,6
14
26
,55
62
3,5
73
27
,80
24
4,5
95
53
,38
02
1,1
11
21
,43
52
5,3
64
Sch
oo
l Ad
min
istr
ati
on
00
00
00
01
,70
53
,75
96
,66
2
Fisc
al
00
00
00
03
35
68
37
72
Op
era
tio
ns
an
d M
ain
ten
an
ce3
99
,50
04
28
,05
44
53
,84
25
40
,12
75
62
,37
65
30
,92
35
52
,77
40
00
Pu
pil
Tra
nsp
ort
ati
on
3,6
36
2,4
88
2,6
89
1,8
96
1,7
70
2,4
26
1,3
06
21
16
10
Ce
ntr
al
00
00
00
06
04
41
15
8
Op
era
tio
n o
f N
on
-In
stru
ctio
na
l Se
rvic
es
00
00
13
,75
71
4,6
64
16
,42
91
83
,35
31
01
,34
53
7,3
40
Ext
racu
rric
ula
r A
ctiv
itie
s1
,53
1,5
05
1,4
40
,99
11
,23
0,7
25
1,5
40
,22
21
,53
7,2
74
1,5
48
,52
61
,46
5,6
75
92
5,3
36
99
0,6
28
97
5,4
46
Op
era
tin
g G
ran
ts a
nd
Co
ntr
ibu
tio
ns
4,1
49
,96
15
,06
3,9
27
5,7
73
,82
46
,78
9,8
12
5,2
34
,47
55
,16
5,3
60
5,1
83
,16
39
,04
4,3
82
9,2
18
,25
28
,84
6,0
96
Ca
pit
al G
ran
ts a
nd
Co
ntr
ibu
tio
ns
86
,18
20
00
00
00
00
To
tal G
ove
rnm
en
tal A
ctiv
itie
s P
rog
ram
Re
ven
ue
s7
,04
4,3
00
7,9
26
,24
48
,56
4,5
69
9,8
96
,59
78
,51
1,9
98
8,3
86
,84
48
,49
0,0
43
11
,23
9,1
82
11
,64
2,6
02
11
,17
3,1
32
Go
vern
me
nta
l Act
ivit
ies
Ne
t (E
xpe
nse
)/R
eve
nu
e($
16
1,0
07
,02
3)
($1
65
,74
7,7
31
)($
17
8,4
62
,44
4)
($1
79
,50
2,4
85
)($
18
0,0
73
,78
1)
($1
79
,64
0,2
07
)($
18
4,9
30
,32
4)
($1
85
,46
1,6
14
)($
18
0,8
85
,22
9)
($2
19
,04
9,1
38
)
Fisc
al Y
ea
r
104
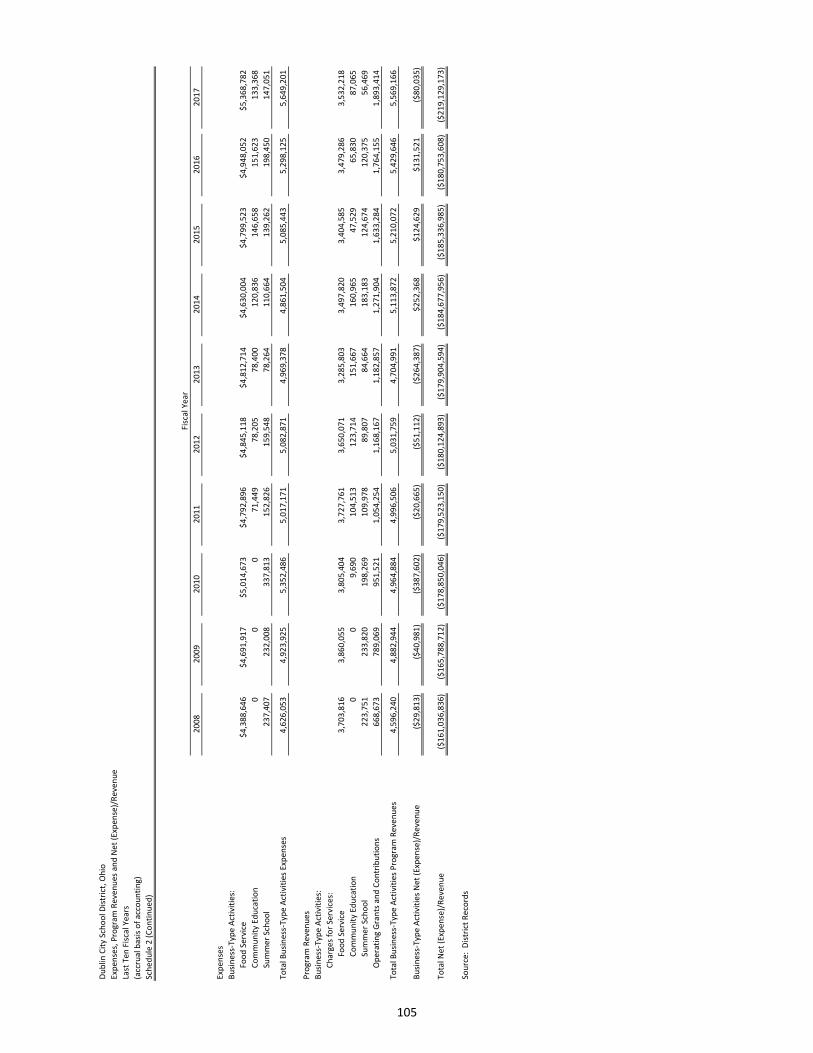
Du
blin
Cit
y Sc
ho
ol D
istr
ict,
Oh
io
Exp
en
ses,
Pro
gra
m R
eve
nu
es
an
d N
et
(Exp
en
se)/
Re
ven
ue
Last
Te
n F
isca
l Ye
ars
(acc
rua
l ba
sis
of
acc
ou
nti
ng
)
Sch
ed
ule
2 (
Co
nti
nu
ed
)
20
08
20
09
20
10
20
11
20
12
20
13
20
14
20
15
20
16
20
17
Exp
en
ses
Bu
sin
ess
-Typ
e A
ctiv
itie
s:
Foo
d S
erv
ice
$4
,38
8,6
46
$4
,69
1,9
17
$5
,01
4,6
73
$4
,79
2,8
96
$4
,84
5,1
18
$4
,81
2,7
14
$4
,63
0,0
04
$4
,79
9,5
23
$4
,94
8,0
52
$5
,36
8,7
82
Co
mm
un
ity
Ed
uca
tio
n0
00
71
,44
97
8,2
05
78
,40
01
20
,83
61
46
,65
81
51
,62
31
33
,36
8
Sum
me
r Sc
ho
ol
23
7,4
07
23
2,0
08
33
7,8
13
15
2,8
26
15
9,5
48
78
,26
41
10
,66
41
39
,26
21
98
,45
01
47
,05
1
To
tal B
usi
ne
ss-T
ype
Act
ivit
ies
Exp
en
ses
4,6
26
,05
34
,92
3,9
25
5,3
52
,48
65
,01
7,1
71
5,0
82
,87
14
,96
9,3
78
4,8
61
,50
45
,08
5,4
43
5,2
98
,12
55
,64
9,2
01
Pro
gra
m R
eve
nu
es
Bu
sin
ess
-Typ
e A
ctiv
itie
s:
Ch
arg
es
for
Serv
ice
s:
Foo
d S
erv
ice
3,7
03
,81
63
,86
0,0
55
3,8
05
,40
43
,72
7,7
61
3,6
50
,07
13
,28
5,8
03
3,4
97
,82
03
,40
4,5
85
3,4
79
,28
63
,53
2,2
18
Co
mm
un
ity
Ed
uca
tio
n0
09
,69
01
04
,51
31
23
,71
41
51
,66
71
60
,96
54
7,5
29
65
,83
08
7,0
65
Sum
me
r Sc
ho
ol
22
3,7
51
23
3,8
20
19
8,2
69
10
9,9
78
89
,80
78
4,6
64
18
3,1
83
12
4,6
74
12
0,3
75
56
,46
9
Op
era
tin
g G
ran
ts a
nd
Co
ntr
ibu
tio
ns
66
8,6
73
78
9,0
69
95
1,5
21
1,0
54
,25
41
,16
8,1
67
1,1
82
,85
71
,27
1,9
04
1,6
33
,28
41
,76
4,1
55
1,8
93
,41
4
To
tal B
usi
ne
ss-T
ype
Act
ivit
ies
Pro
gra
m R
eve
nu
es
4,5
96
,24
04
,88
2,9
44
4,9
64
,88
44
,99
6,5
06
5,0
31
,75
94
,70
4,9
91
5,1
13
,87
25
,21
0,0
72
5,4
29
,64
65
,56
9,1
66
Bu
sin
ess
-Typ
e A
ctiv
itie
s N
et
(Exp
en
se)/
Re
ven
ue
($2
9,8
13
)($
40
,98
1)
($3
87
,60
2)
($2
0,6
65
)($
51
,11
2)
($2
64
,38
7)
$2
52
,36
8$
12
4,6
29
$1
31
,52
1($
80
,03
5)
To
tal N
et
(Exp
en
se)/
Re
ven
ue
($1
61
,03
6,8
36
)($
16
5,7
88
,71
2)
($1
78
,85
0,0
46
)($
17
9,5
23
,15
0)
($1
80
,12
4,8
93
)($
17
9,9
04
,59
4)
($1
84
,67
7,9
56
)($
18
5,3
36
,98
5)
($1
80
,75
3,6
08
)($
21
9,1
29
,17
3)
Sou
rce
: D
istr
ict
Re
cord
s
Fisc
al Y
ea
r
105
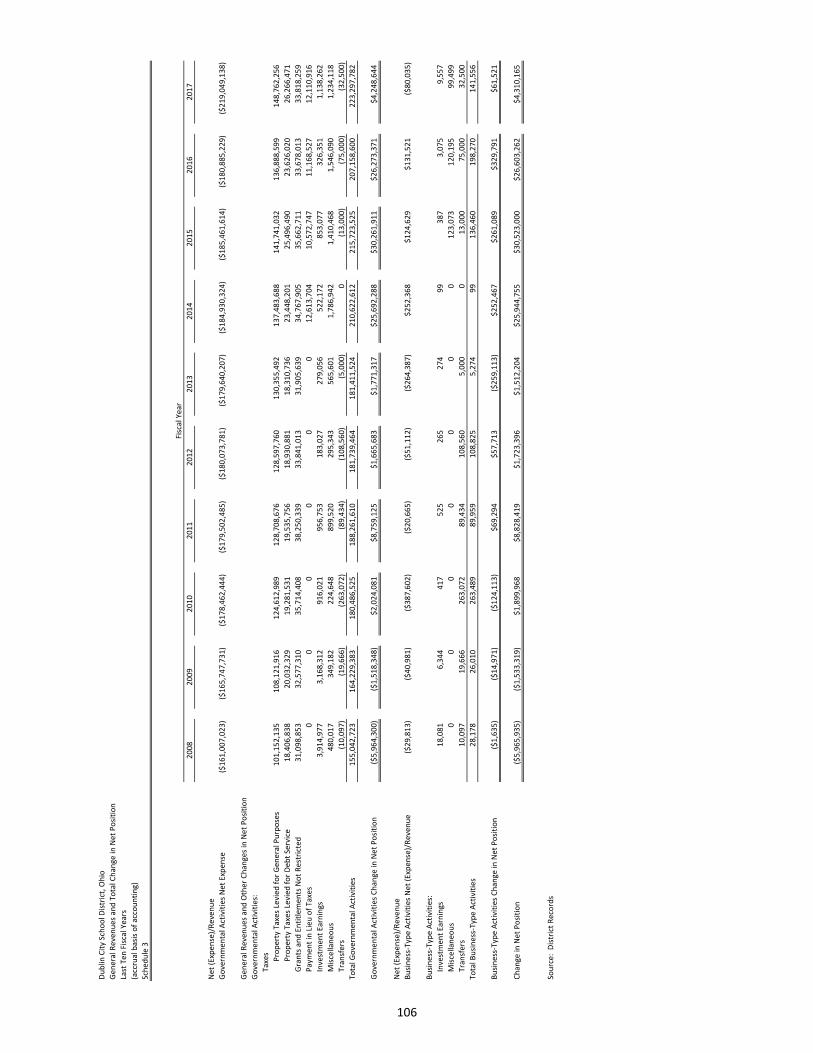
Du
blin
Cit
y Sc
ho
ol D
istr
ict,
Oh
io
Ge
ne
ral R
eve
nu
es
an
d T
ota
l Ch
an
ge
in N
et
Po
siti
on
Last
Te
n F
isca
l Ye
ars
(acc
rua
l ba
sis
of
acc
ou
nti
ng
)
Sch
ed
ule
3
20
08
20
09
20
10
20
11
20
12
20
13
20
14
20
15
20
16
20
17
Ne
t (E
xpe
nse
)/R
eve
nu
e
Go
vern
me
nta
l Act
ivit
ies
Ne
t E
xpe
nse
($1
61
,00
7,0
23
)($
16
5,7
47
,73
1)
($1
78
,46
2,4
44
)($
17
9,5
02
,48
5)
($1
80
,07
3,7
81
)($
17
9,6
40
,20
7)
($1
84
,93
0,3
24
)($
18
5,4
61
,61
4)
($1
80
,88
5,2
29
)($
21
9,0
49
,13
8)
Ge
ne
ral R
eve
nu
es
an
d O
the
r C
ha
ng
es
in N
et
Po
siti
on
Go
vern
me
nta
l Act
ivit
ies:
Ta
xes
Pro
pe
rty
Ta
xes
Levi
ed
fo
r G
en
era
l Pu
rpo
ses
10
1,1
52
,13
51
08
,12
1,9
16
12
4,6
12
,98
91
28
,70
8,6
76
12
8,5
97
,76
01
30
,35
5,4
92
13
7,4
83
,68
81
41
,74
1,0
32
13
6,8
88
,59
91
48
,76
2,2
56
Pro
pe
rty
Ta
xes
Levi
ed
fo
r D
eb
t Se
rvic
e1
8,4
06
,83
82
0,0
32
,32
91
9,2
81
,53
11
9,5
35
,75
61
8,9
30
,88
11
8,3
10
,73
62
3,4
48
,20
12
5,4
96
,49
02
3,6
26
,02
02
6,2
66
,47
1
Gra
nts
an
d E
nti
tle
me
nts
No
t R
est
rict
ed
31
,09
8,8
53
32
,57
7,3
10
35
,71
4,4
08
38
,25
0,3
39
33
,84
1,0
13
31
,90
5,6
39
34
,76
7,9
05
35
,66
2,7
11
33
,67
8,0
13
33
,81
8,2
59
Pa
yme
nt
in L
ieu
of
Ta
xes
00
00
00
12
,61
3,7
04
10
,57
2,7
47
11
,16
8,5
27
12
,11
0,9
16
Inve
stm
en
t E
arn
ing
s3
,91
4,9
77
3,1
68
,31
29
16
,02
19
56
,75
31
83
,02
72
79
,05
65
22
,17
28
53
,07
73
26
,35
11
,13
8,2
62
Mis
cella
ne
ou
s4
80
,01
73
49
,18
22
24
,64
88
99
,52
02
95
,34
35
65
,60
11
,78
6,9
42
1,4
10
,46
81
,54
6,0
90
1,2
34
,11
8
Tra
nsf
ers
(10
,09
7)
(19
,66
6)
(26
3,0
72
)(8
9,4
34
)(1
08
,56
0)
(5,0
00
)0
(13
,00
0)
(75
,00
0)
(32
,50
0)
To
tal G
ove
rnm
en
tal A
ctiv
itie
s1
55
,04
2,7
23
16
4,2
29
,38
31
80
,48
6,5
25
18
8,2
61
,61
01
81
,73
9,4
64
18
1,4
11
,52
42
10
,62
2,6
12
21
5,7
23
,52
52
07
,15
8,6
00
22
3,2
97
,78
2
Go
vern
me
nta
l Act
ivit
ies
Ch
an
ge
in N
et
Po
siti
on
($5
,96
4,3
00
)($
1,5
18
,34
8)
$2
,02
4,0
81
$8
,75
9,1
25
$1
,66
5,6
83
$1
,77
1,3
17
$2
5,6
92
,28
8$
30
,26
1,9
11
$2
6,2
73
,37
1$
4,2
48
,64
4
Ne
t (E
xpe
nse
)/R
eve
nu
e
Bu
sin
ess
-Typ
e A
ctiv
itie
s N
et
(Exp
en
se)/
Re
ven
ue
($2
9,8
13
)($
40
,98
1)
($3
87
,60
2)
($2
0,6
65
)($
51
,11
2)
($2
64
,38
7)
$2
52
,36
8$
12
4,6
29
$1
31
,52
1($
80
,03
5)
Bu
sin
ess
-Typ
e A
ctiv
itie
s:
Inve
stm
en
t E
arn
ing
s1
8,0
81
6,3
44
41
75
25
26
52
74
99
38
73
,07
59
,55
7
Mis
cella
ne
ou
s0
00
00
00
12
3,0
73
12
0,1
95
99
,49
9
Tra
nsf
ers
10
,09
71
9,6
66
26
3,0
72
89
,43
41
08
,56
05
,00
00
13
,00
07
5,0
00
32
,50
0
To
tal B
usi
ne
ss-T
ype
Act
ivit
ies
28
,17
8
26
,01
0
26
3,4
89
8
9,9
59
1
08
,82
5
5,2
74
9
9
13
6,4
60
1
98
,27
01
41
,55
6
Bu
sin
ess
-Typ
e A
ctiv
itie
s C
ha
ng
e in
Ne
t P
osi
tio
n($
1,6
35
)
($1
4,9
71
)
($1
24
,11
3)
$
69
,29
4
$5
7,7
13
($
25
9,1
13
)
$2
52
,46
7
$2
61
,08
9
$3
29
,79
1$
61
,52
1
Ch
an
ge
in N
et
Po
siti
on
($5
,96
5,9
35
)
($1
,53
3,3
19
)
$1
,89
9,9
68
$
8,8
28
,41
9
$1
,72
3,3
96
$
1,5
12
,20
4
$2
5,9
44
,75
5
$3
0,5
23
,00
0
$2
6,6
03
,26
2$
4,3
10
,16
5
Sou
rce
: D
istr
ict
Re
cord
s
Fisc
al Y
ea
r
106
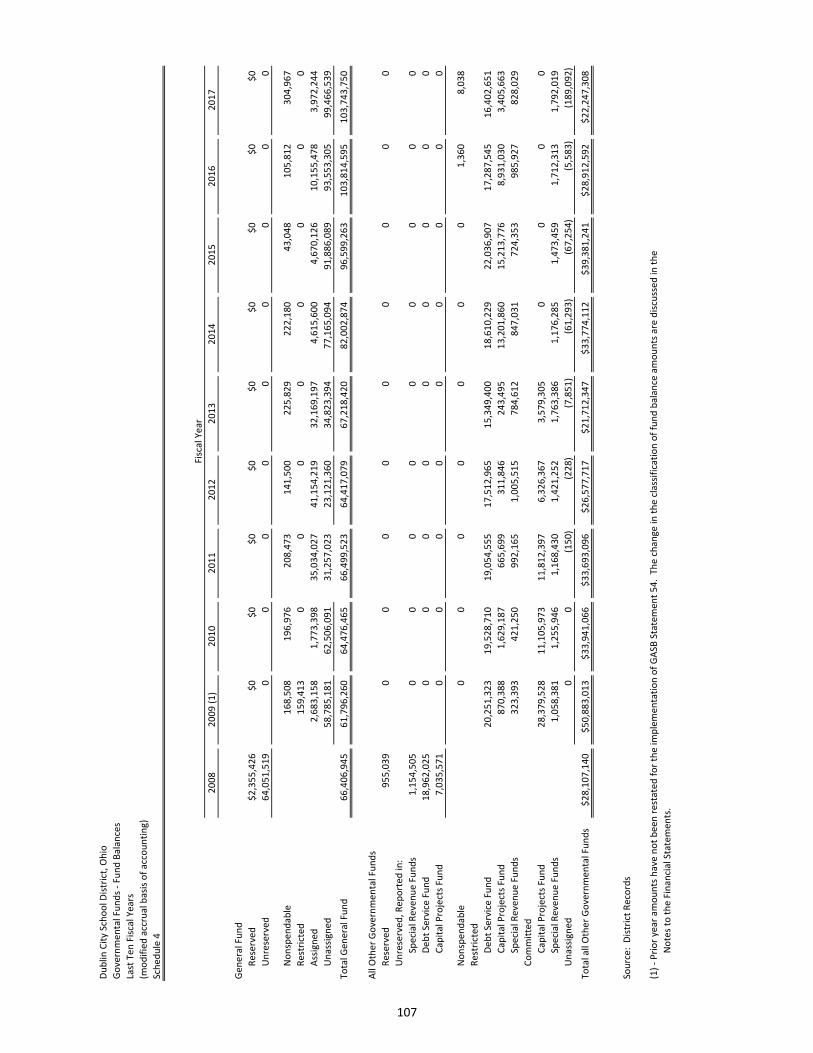
Du
blin
Cit
y Sc
ho
ol D
istr
ict,
Oh
io
Go
vern
me
nta
l Fu
nd
s -
Fun
d B
ala
nce
s
Last
Te
n F
isca
l Ye
ars
(mo
dif
ied
acc
rua
l ba
sis
of
acc
ou
nti
ng
)
Sch
ed
ule
4
20
08
20
09
(1
)2
01
02
01
12
01
22
01
32
01
42
01
52
01
62
01
7
Ge
ne
ral F
un
d
Re
serv
ed
$2
,35
5,4
26
$0
$0
$0
$0
$0
$0
$0
$0
$0
Un
rese
rve
d6
4,0
51
,51
90
00
00
00
00
No
nsp
en
da
ble
16
8,5
08
19
6,9
76
20
8,4
73
14
1,5
00
22
5,8
29
22
2,1
80
43
,04
81
05
,81
23
04
,96
7
Re
stri
cte
d1
59
,41
30
00
00
00
0
Ass
ign
ed
2,6
83
,15
81
,77
3,3
98
35
,03
4,0
27
41
,15
4,2
19
32
,16
9,1
97
4,6
15
,60
04
,67
0,1
26
10
,15
5,4
78
3,9
72
,24
4
Un
ass
ign
ed
58
,78
5,1
81
62
,50
6,0
91
31
,25
7,0
23
23
,12
1,3
60
34
,82
3,3
94
77
,16
5,0
94
91
,88
6,0
89
93
,55
3,3
05
99
,46
6,5
39
To
tal G
en
era
l Fu
nd
66
,40
6,9
45
61
,79
6,2
60
64
,47
6,4
65
66
,49
9,5
23
64
,41
7,0
79
67
,21
8,4
20
82
,00
2,8
74
96
,59
9,2
63
10
3,8
14
,59
51
03
,74
3,7
50
All
Oth
er
Go
vern
me
nta
l Fu
nd
s
Re
serv
ed
95
5,0
39
00
00
00
00
0
Un
rese
rve
d,
Re
po
rte
d in
:
Spe
cia
l Re
ven
ue
Fu
nd
s1
,15
4,5
05
00
00
00
00
0
De
bt
Serv
ice
Fu
nd
18
,96
2,0
25
00
00
00
00
0
Ca
pit
al P
roje
cts
Fun
d7
,03
5,5
71
00
00
00
00
0
No
nsp
en
da
ble
00
00
00
01
,36
08
,03
8
Re
stri
cte
d
De
bt
Serv
ice
Fu
nd
20
,25
1,3
23
19
,52
8,7
10
19
,05
4,5
55
17
,51
2,9
65
15
,34
9,4
00
18
,61
0,2
29
22
,03
6,9
07
17
,28
7,5
45
16
,40
2,6
51
Ca
pit
al P
roje
cts
Fun
d8
70
,38
81
,62
9,1
87
66
5,6
99
31
1,8
46
24
3,4
95
13
,20
1,8
60
15
,21
3,7
76
8,9
31
,03
03
,40
5,6
63
Spe
cia
l Re
ven
ue
Fu
nd
s3
23
,39
34
21
,25
09
92
,16
51
,00
5,5
15
78
4,6
12
84
7,0
31
72
4,3
53
98
5,9
27
82
8,0
29
Co
mm
itte
d
Ca
pit
al P
roje
cts
Fun
d2
8,3
79
,52
81
1,1
05
,97
31
1,8
12
,39
76
,32
6,3
67
3,5
79
,30
50
00
0
Spe
cia
l Re
ven
ue
Fu
nd
s1
,05
8,3
81
1,2
55
,94
61
,16
8,4
30
1,4
21
,25
21
,76
3,3
86
1,1
76
,28
51
,47
3,4
59
1,7
12
,31
31
,79
2,0
19
Un
ass
ign
ed
00
(15
0)
(22
8)
(7,8
51
)(6
1,2
93
)(6
7,2
54
)(5
,58
3)
(18
9,0
92
)
To
tal a
ll O
the
r G
ove
rnm
en
tal F
un
ds
$2
8,1
07
,14
0$
50
,88
3,0
13
$3
3,9
41
,06
6$
33
,69
3,0
96
$2
6,5
77
,71
7$
21
,71
2,3
47
$3
3,7
74
,11
2$
39
,38
1,2
41
$2
8,9
12
,59
2$
22
,24
7,3
08
Sou
rce
: D
istr
ict
Re
cord
s
(1)
- P
rio
r ye
ar
am
ou
nts
ha
ve n
ot
be
en
re
sta
ted
fo
r th
e im
ple
me
nta
tio
n o
f G
ASB
Sta
tem
en
t 5
4.
Th
e c
ha
ng
e in
th
e c
lass
ific
ati
on
of
fun
d b
ala
nce
am
ou
nts
are
dis
cuss
ed
in t
he
No
tes
to t
he
Fin
an
cia
l Sta
tem
en
ts.
Fisc
al Y
ea
r
107
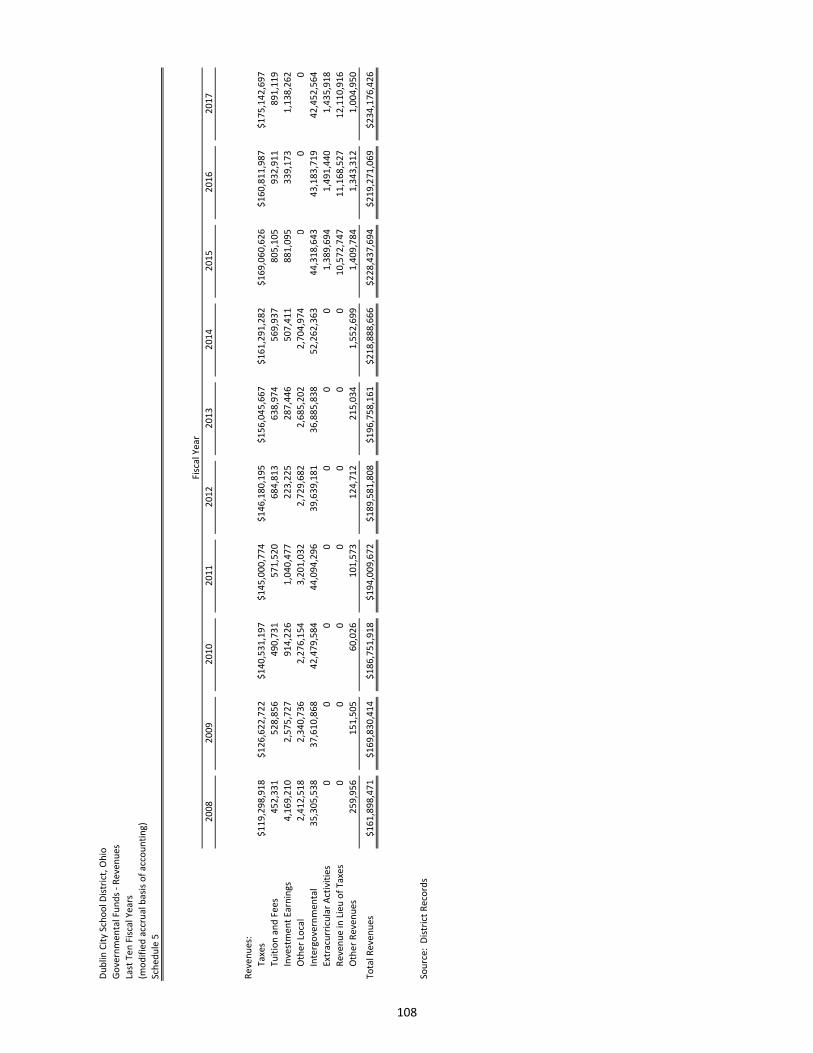
Du
blin
Cit
y Sc
ho
ol D
istr
ict,
Oh
io
Go
vern
me
nta
l Fu
nd
s -
Re
ven
ue
s
Last
Te
n F
isca
l Ye
ars
(mo
dif
ied
acc
rua
l ba
sis
of
acc
ou
nti
ng
)
Sch
ed
ule
5
20
08
20
09
20
10
20
11
20
12
20
13
20
14
20
15
20
16
20
17
Re
ven
ue
s:
Ta
xes
$1
19
,29
8,9
18
$1
26
,62
2,7
22
$1
40
,53
1,1
97
$1
45
,00
0,7
74
$1
46
,18
0,1
95
$1
56
,04
5,6
67
$1
61
,29
1,2
82
$1
69
,06
0,6
26
$1
60
,81
1,9
87
$1
75
,14
2,6
97
Tu
itio
n a
nd
Fe
es
45
2,3
31
52
8,8
56
49
0,7
31
57
1,5
20
68
4,8
13
63
8,9
74
56
9,9
37
80
5,1
05
93
2,9
11
89
1,1
19
Inve
stm
en
t E
arn
ing
s4
,16
9,2
10
2,5
75
,72
79
14
,22
61
,04
0,4
77
22
3,2
25
28
7,4
46
50
7,4
11
88
1,0
95
33
9,1
73
1,1
38
,26
2
Oth
er
Loca
l2
,41
2,5
18
2,3
40
,73
62
,27
6,1
54
3,2
01
,03
22
,72
9,6
82
2,6
85
,20
22
,70
4,9
74
00
0
Inte
rgo
vern
me
nta
l3
5,3
05
,53
83
7,6
10
,86
84
2,4
79
,58
44
4,0
94
,29
63
9,6
39
,18
13
6,8
85
,83
85
2,2
62
,36
34
4,3
18
,64
34
3,1
83
,71
94
2,4
52
,56
4
Ext
racu
rric
ula
r A
ctiv
itie
s0
00
00
00
1,3
89
,69
41
,49
1,4
40
1,4
35
,91
8
Re
ven
ue
in L
ieu
of
Ta
xes
00
00
00
01
0,5
72
,74
71
1,1
68
,52
71
2,1
10
,91
6
Oth
er
Re
ven
ue
s2
59
,95
61
51
,50
56
0,0
26
10
1,5
73
12
4,7
12
21
5,0
34
1,5
52
,69
91
,40
9,7
84
1,3
43
,31
21
,00
4,9
50
To
tal R
eve
nu
es
$1
61
,89
8,4
71
$1
69
,83
0,4
14
$1
86
,75
1,9
18
$1
94
,00
9,6
72
$1
89
,58
1,8
08
$1
96
,75
8,1
61
$2
18
,88
8,6
66
$2
28
,43
7,6
94
$2
19
,27
1,0
69
$2
34
,17
6,4
26
Sou
rce
: D
istr
ict
Re
cord
s
Fisc
al Y
ea
r
108
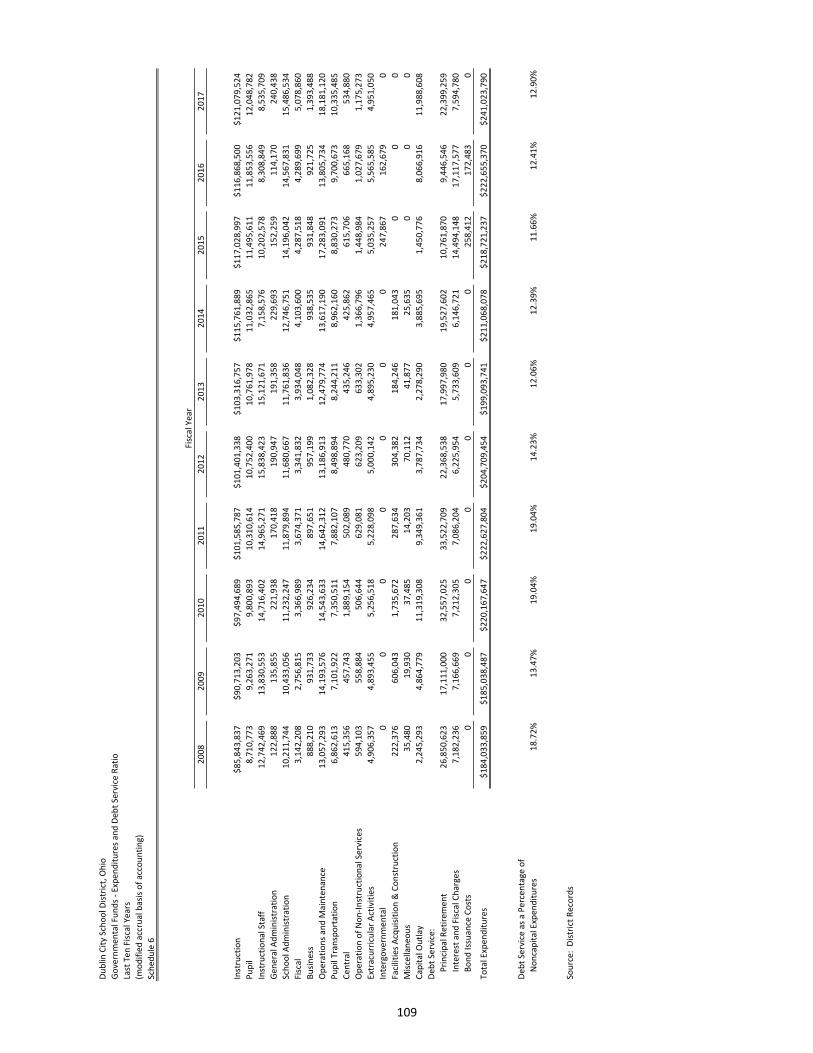
Du
blin
Cit
y Sc
ho
ol D
istr
ict,
Oh
io
Go
vern
me
nta
l Fu
nd
s -
Exp
en
dit
ure
s a
nd
De
bt
Serv
ice
Ra
tio
Last
Te
n F
isca
l Ye
ars
(mo
dif
ied
acc
rua
l ba
sis
of
acc
ou
nti
ng
)
Sch
ed
ule
6
20
08
20
09
20
10
20
11
20
12
20
13
20
14
20
15
20
16
20
17
Inst
ruct
ion
$8
5,8
43
,83
7$
90
,71
3,2
03
$9
7,4
94
,68
9$
10
1,5
85
,78
7$
10
1,4
01
,33
8$
10
3,3
16
,75
7$
11
5,7
61
,88
9$
11
7,0
28
,99
7$
11
6,8
68
,50
0$
12
1,0
79
,52
4
Pu
pil
8,7
10
,77
39
,26
3,2
71
9,8
00
,89
31
0,3
10
,61
41
0,7
52
,40
01
0,7
61
,97
81
1,0
32
,86
51
1,4
95
,61
11
1,8
53
,55
61
2,0
48
,78
2
Inst
ruct
ion
al S
taff
12
,74
2,4
69
13
,83
0,5
53
14
,71
6,4
02
14
,96
5,2
71
15
,83
8,4
23
15
,12
1,6
71
7,1
58
,57
61
0,2
02
,57
88
,30
8,8
49
8,5
35
,70
9
Ge
ne
ral A
dm
inis
tra
tio
n1
22
,88
81
35
,85
52
21
,93
81
70
,41
81
90
,94
71
91
,35
82
29
,69
31
52
,25
91
14
,17
02
40
,43
8
Sch
oo
l Ad
min
istr
ati
on
10
,21
1,7
44
10
,43
3,0
56
11
,23
2,2
47
11
,87
9,8
94
11
,68
0,6
67
11
,76
1,8
36
12
,74
6,7
51
14
,19
6,0
42
14
,56
7,8
31
15
,48
6,5
34
Fisc
al
3,1
42
,20
82
,75
6,8
15
3,3
66
,98
93
,67
4,3
71
3,3
41
,83
23
,93
4,0
48
4,1
03
,60
04
,28
7,5
18
4,2
89
,69
95
,07
8,8
60
Bu
sin
ess
88
8,2
10
93
1,7
33
92
6,2
34
89
7,6
51
95
7,1
99
1,0
82
,32
89
38
,53
59
31
,84
89
21
,72
51
,39
3,4
88
Op
era
tio
ns
an
d M
ain
ten
an
ce1
3,0
57
,29
31
4,1
93
,57
61
4,5
43
,63
31
4,6
42
,31
21
3,1
86
,91
31
2,4
79
,77
41
3,6
17
,19
01
7,2
83
,09
11
3,8
05
,73
41
8,1
81
,12
0
Pu
pil
Tra
nsp
ort
ati
on
6,8
62
,61
37
,10
1,9
22
7,3
50
,51
17
,88
2,1
07
8,4
98
,89
48
,24
4,2
11
8,9
62
,16
08
,83
0,2
73
9,7
00
,67
31
0,3
35
,48
5
Ce
ntr
al
41
5,3
56
45
7,7
43
1,8
89
,15
45
02
,08
94
80
,77
04
35
,24
64
25
,86
26
15
,70
66
65
,16
85
34
,88
0
Op
era
tio
n o
f N
on
-In
stru
ctio
na
l Se
rvic
es
59
4,1
03
55
8,8
84
50
6,6
44
62
9,0
81
62
3,2
09
63
3,3
02
1,3
66
,79
61
,44
8,9
84
1,0
27
,67
91
,17
5,2
73
Ext
racu
rric
ula
r A
ctiv
itie
s4
,90
6,3
57
4,8
93
,45
55
,25
6,5
18
5,2
28
,09
85
,00
0,1
42
4,8
95
,23
04
,95
7,4
65
5,0
35
,25
75
,56
5,5
85
4,9
51
,05
0
Inte
rgo
vern
me
nta
l0
00
00
00
24
7,8
67
16
2,6
79
0
Faci
litie
s A
cqu
isit
ion
& C
on
stru
ctio
n2
22
,37
66
06
,04
31
,73
5,6
72
28
7,6
34
30
4,3
82
18
4,2
46
18
1,0
43
00
0
Mis
cella
ne
ou
s3
5,4
80
19
,93
03
7,4
85
14
,20
37
0,1
12
41
,87
72
5,6
35
00
0
Ca
pit
al O
utl
ay
2,2
45
,29
34
,86
4,7
79
11
,31
9,3
08
9,3
49
,36
13
,78
7,7
34
2,2
78
,29
03
,88
5,6
95
1,4
50
,77
68
,06
6,9
16
11
,98
8,6
08
De
bt
Serv
ice
:
Pri
nci
pa
l Re
tire
me
nt
26
,85
0,6
23
17
,11
1,0
00
32
,55
7,0
25
33
,52
2,7
09
22
,36
8,5
38
17
,99
7,9
80
19
,52
7,6
02
10
,76
1,8
70
9,4
46
,54
62
2,3
99
,25
9
Inte
rest
an
d F
isca
l Ch
arg
es
7,1
82
,23
67
,16
6,6
69
7,2
12
,30
57
,08
6,2
04
6,2
25
,95
45
,73
3,6
09
6,1
46
,72
11
4,4
94
,14
81
7,1
17
,57
77
,59
4,7
80
Bo
nd
Iss
ua
nce
Co
sts
00
00
00
02
58
,41
21
72
,48
30
To
tal E
xpe
nd
itu
res
$1
84
,03
3,8
59
$1
85
,03
8,4
87
$2
20
,16
7,6
47
$2
22
,62
7,8
04
$2
04
,70
9,4
54
$1
99
,09
3,7
41
$2
11
,06
8,0
78
$2
18
,72
1,2
37
$2
22
,65
5,3
70
$2
41
,02
3,7
90
De
bt
Serv
ice
as
a P
erc
en
tag
e o
f
No
nca
pit
al E
xpe
nd
itu
res
18
.72
%1
3.4
7%
19
.04
%1
9.0
4%
14
.23
%1
2.0
6%
12
.39
%1
1.6
6%
12
.41
%1
2.9
0%
Sou
rce
: D
istr
ict
Re
cord
s
Fisc
al Y
ea
r
109
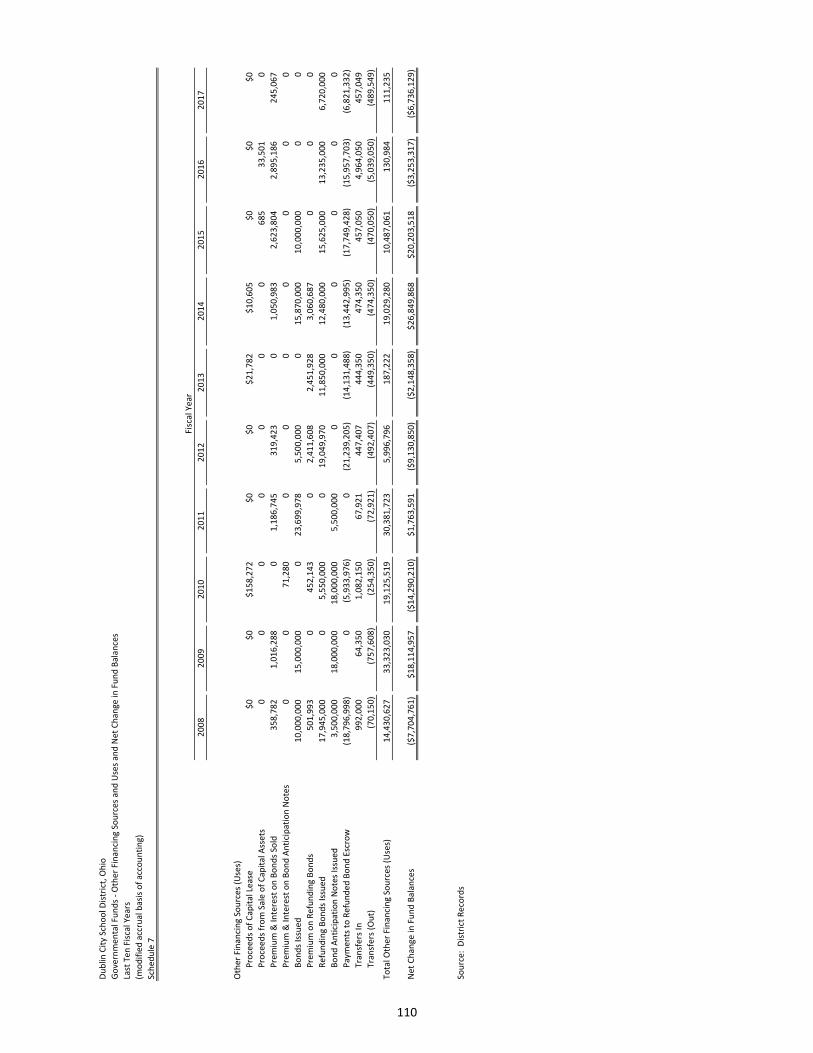
Du
blin
Cit
y Sc
ho
ol D
istr
ict,
Oh
io
Go
vern
me
nta
l Fu
nd
s -
Oth
er
Fin
an
cin
g S
ou
rce
s a
nd
Use
s a
nd
Ne
t C
ha
ng
e in
Fu
nd
Ba
lan
ces
Last
Te
n F
isca
l Ye
ars
(mo
dif
ied
acc
rua
l ba
sis
of
acc
ou
nti
ng
)
Sch
ed
ule
7
20
08
20
09
20
10
20
11
20
12
20
13
20
14
20
15
20
16
20
17
Oth
er
Fin
an
cin
g S
ou
rce
s (U
ses)
Pro
cee
ds
of
Ca
pit
al L
ea
se$
0$
0$
15
8,2
72
$0
$0
$2
1,7
82
$1
0,6
05
$0
$0
$0
Pro
cee
ds
fro
m S
ale
of
Ca
pit
al A
sse
ts0
00
00
00
68
53
3,5
01
0
Pre
miu
m &
In
tere
st o
n B
on
ds
Sold
35
8,7
82
1,0
16
,28
80
1,1
86
,74
53
19
,42
30
1,0
50
,98
32
,62
3,8
04
2,8
95
,18
62
45
,06
7
Pre
miu
m &
In
tere
st o
n B
on
d A
nti
cip
ati
on
No
tes
00
71
,28
00
00
00
00
Bo
nd
s Is
sue
d1
0,0
00
,00
01
5,0
00
,00
00
23
,69
9,9
78
5,5
00
,00
00
15
,87
0,0
00
10
,00
0,0
00
00
Pre
miu
m o
n R
efu
nd
ing
Bo
nd
s5
01
,99
30
45
2,1
43
02
,41
1,6
08
2,4
51
,92
83
,06
0,6
87
00
0
Re
fun
din
g B
on
ds
Issu
ed
17
,94
5,0
00
05
,55
0,0
00
01
9,0
49
,97
01
1,8
50
,00
01
2,4
80
,00
01
5,6
25
,00
01
3,2
35
,00
06
,72
0,0
00
Bo
nd
An
tici
pa
tio
n N
ote
s Is
sue
d3
,50
0,0
00
18
,00
0,0
00
18
,00
0,0
00
5,5
00
,00
00
00
00
0
Pa
yme
nts
to
Re
fun
de
d B
on
d E
scro
w(1
8,7
96
,99
8)
0(5
,93
3,9
76
)0
(21
,23
9,2
05
)(1
4,1
31
,48
8)
(13
,44
2,9
95
)(1
7,7
49
,42
8)
(15
,95
7,7
03
)(6
,82
1,3
32
)
Tra
nsf
ers
In
99
2,0
00
64
,35
01
,08
2,1
50
67
,92
14
47
,40
74
44
,35
04
74
,35
04
57
,05
04
,96
4,0
50
45
7,0
49
Tra
nsf
ers
(O
ut)
(70
,15
0)
(75
7,6
08
)(2
54
,35
0)
(72
,92
1)
(49
2,4
07
)(4
49
,35
0)
(47
4,3
50
)(4
70
,05
0)
(5,0
39
,05
0)
(48
9,5
49
)
To
tal O
the
r Fi
na
nci
ng
So
urc
es
(Use
s)1
4,4
30
,62
73
3,3
23
,03
01
9,1
25
,51
93
0,3
81
,72
35
,99
6,7
96
18
7,2
22
19
,02
9,2
80
10
,48
7,0
61
13
0,9
84
11
1,2
35
Ne
t C
ha
ng
e in
Fu
nd
Ba
lan
ces
($7
,70
4,7
61
)$
18
,11
4,9
57
($1
4,2
90
,21
0)
$1
,76
3,5
91
($9
,13
0,8
50
)($
2,1
48
,35
8)
$2
6,8
49
,86
8$
20
,20
3,5
18
($3
,25
3,3
17
)($
6,7
36
,12
9)
Sou
rce
: D
istr
ict
Re
cord
s
Fisc
al Y
ea
r
110
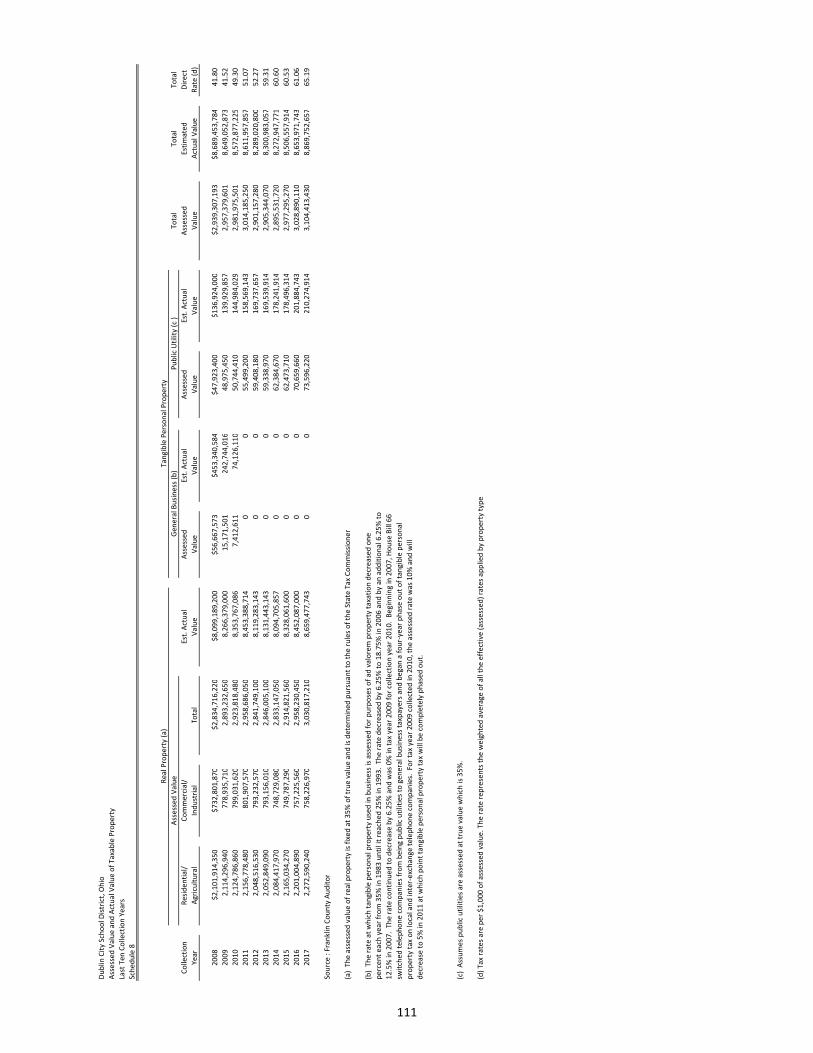
Du
blin
Cit
y Sc
ho
ol D
istr
ict,
Oh
io
Ass
ess
ed
Va
lue
an
d A
ctu
al V
alu
e o
f T
axa
ble
Pro
pe
rty
Last
Te
n C
olle
ctio
n Y
ea
rs
Sch
ed
ule
8
To
tal
To
tal
To
tal
Re
sid
en
tia
l/C
om
me
rcia
l/E
st.
Act
ua
lA
sse
sse
dE
st.
Act
ua
lA
sse
sse
dE
st.
Act
ua
lA
sse
sse
dE
stim
ate
dD
ire
ct
Ag
ricu
ltu
ral
Ind
ust
ria
lT
ota
lV
alu
eV
alu
eV
alu
eV
alu
eV
alu
eV
alu
eA
ctu
al V
alu
eR
ate
(d
)
$2
,10
1,9
14
,35
0$
73
2,8
01
,87
0$
2,8
34
,71
6,2
20
$8
,09
9,1
89
,20
0$
56
,66
7,5
73
$4
53
,34
0,5
84
$4
7,9
23
,40
0$
13
6,9
24
,00
0$
2,9
39
,30
7,1
93
$8
,68
9,4
53
,78
44
1.8
0
2,1
14
,29
6,9
40
77
8,9
35
,71
02
,89
3,2
32
,65
08
,26
6,3
79
,00
01
5,1
71
,50
12
42
,74
4,0
16
48
,97
5,4
50
13
9,9
29
,85
72
,95
7,3
79
,60
18
,64
9,0
52
,87
34
1.5
2
2,1
24
,78
6,8
60
79
9,0
31
,62
02
,92
3,8
18
,48
08
,35
3,7
67
,08
67
,41
2,6
11
74
,12
6,1
10
50
,74
4,4
10
14
4,9
84
,02
92
,98
1,9
75
,50
18
,57
2,8
77
,22
54
9.3
0
2,1
56
,77
8,4
80
80
1,9
07
,57
02
,95
8,6
86
,05
08
,45
3,3
88
,71
40
05
5,4
99
,20
01
58
,56
9,1
43
3,0
14
,18
5,2
50
8,6
11
,95
7,8
57
51
.07
2,0
48
,51
6,5
30
79
3,2
32
,57
02
,84
1,7
49
,10
08
,11
9,2
83
,14
30
05
9,4
08
,18
01
69
,73
7,6
57
2,9
01
,15
7,2
80
8,2
89
,02
0,8
00
52
.27
2,0
52
,84
9,0
90
79
3,1
56
,01
02
,84
6,0
05
,10
08
,13
1,4
43
,14
30
05
9,3
38
,97
01
69
,53
9,9
14
2,9
05
,34
4,0
70
8,3
00
,98
3,0
57
59
.31
2,0
84
,41
7,9
70
74
8,7
29
,08
02
,83
3,1
47
,05
08
,09
4,7
05
,85
70
06
2,3
84
,67
01
78
,24
1,9
14
2,8
95
,53
1,7
20
8,2
72
,94
7,7
71
60
.60
2,1
65
,03
4,2
70
74
9,7
87
,29
02
,91
4,8
21
,56
08
,32
8,0
61
,60
00
06
2,4
73
,71
01
78
,49
6,3
14
2,9
77
,29
5,2
70
8,5
06
,55
7,9
14
60
.53
2,2
01
,00
4,8
90
75
7,2
25
,56
02
,95
8,2
30
,45
08
,45
2,0
87
,00
00
07
0,6
59
,66
02
01
,88
4,7
43
3,0
28
,89
0,1
10
8,6
53
,97
1,7
43
61
.06
2,2
72
,59
0,2
40
75
8,2
26
,97
03
,03
0,8
17
,21
08
,65
9,4
77
,74
30
07
3,5
96
,22
02
10
,27
4,9
14
3,1
04
,41
3,4
30
8,8
69
,75
2,6
57
65
.19
Sou
rce
: F
ran
klin
Co
un
ty A
ud
ito
r
(a)
Th
e a
sse
sse
d v
alu
e o
f re
al p
rop
ert
y is
fix
ed
at
35
% o
f tr
ue
va
lue
an
d is
de
term
ine
d p
urs
ua
nt
to t
he
ru
les
of
the
Sta
te T
ax
Co
mm
issi
on
er.
(c)
Ass
um
es
pu
blic
uti
litie
s a
re a
sse
sse
d a
t tr
ue
va
lue
wh
ich
is 3
5%
.
(d)
Ta
x ra
tes
are
pe
r $
1,0
00
of
ass
ess
ed
va
lue
. T
he
ra
te r
ep
rese
nts
th
e w
eig
hte
d a
vera
ge
of
all
the
eff
ect
ive
(a
sse
sse
d)
rate
s a
pp
lied
by
pro
pe
rty
typ
e.
20
12
20
17
Ass
ess
ed
Va
lueRe
al P
rop
ert
y (a
)
Ge
ne
ral B
usi
ne
ss (
b)
Ta
ng
ible
Pe
rso
na
l Pro
pe
rty
(b)
Th
e r
ate
at
wh
ich
ta
ng
ible
pe
rso
na
l pro
pe
rty
use
d in
bu
sin
ess
is a
sse
sse
d f
or
pu
rpo
ses
of
ad
va
lore
m p
rop
ert
y ta
xati
on
de
cre
ase
d o
ne
pe
rce
nt
ea
ch y
ea
r fr
om
35
% in
19
83
un
til i
t re
ach
ed
25
% in
19
93
. T
he
ra
te d
ecr
ea
sed
by
6.2
5%
to
18
.75
% in
20
06
an
d b
y a
n a
dd
itio
na
l 6.2
5%
to
12
.5%
in 2
00
7.
Th
e r
ate
co
nti
nu
ed
to
de
cre
ase
by
6.2
5%
an
d w
as
0%
in t
ax
yea
r 2
00
9 f
or
colle
ctio
n y
ea
r 2
01
0.
Be
gin
nin
g in
20
07
, H
ou
se B
ill 6
6
swit
che
d t
ele
ph
on
e c
om
pa
nie
s fr
om
be
ing
pu
blic
uti
litie
s to
ge
ne
ral b
usi
ne
ss t
axp
aye
rs a
nd
be
ga
n a
fo
ur-
yea
r p
ha
se o
ut
of
tan
gib
le p
ers
on
al
pro
pe
rty
tax
on
loca
l an
d in
ter-
exc
ha
ng
e t
ele
ph
on
e c
om
pa
nie
s. F
or
tax
yea
r 2
00
9 c
olle
cte
d in
20
10
, th
e a
sse
sse
d r
ate
wa
s 1
0%
an
d w
ill
de
cre
ase
to
5%
in 2
01
1 a
t w
hic
h p
oin
t ta
ng
ible
pe
rso
na
l pro
pe
rty
tax
will
be
co
mp
lete
ly p
ha
sed
ou
t.
Pu
blic
Uti
lity
(c )
Co
llect
ion
Ye
ar
20
13
20
14
20
15
20
16
20
08
20
09
20
10
20
11
111
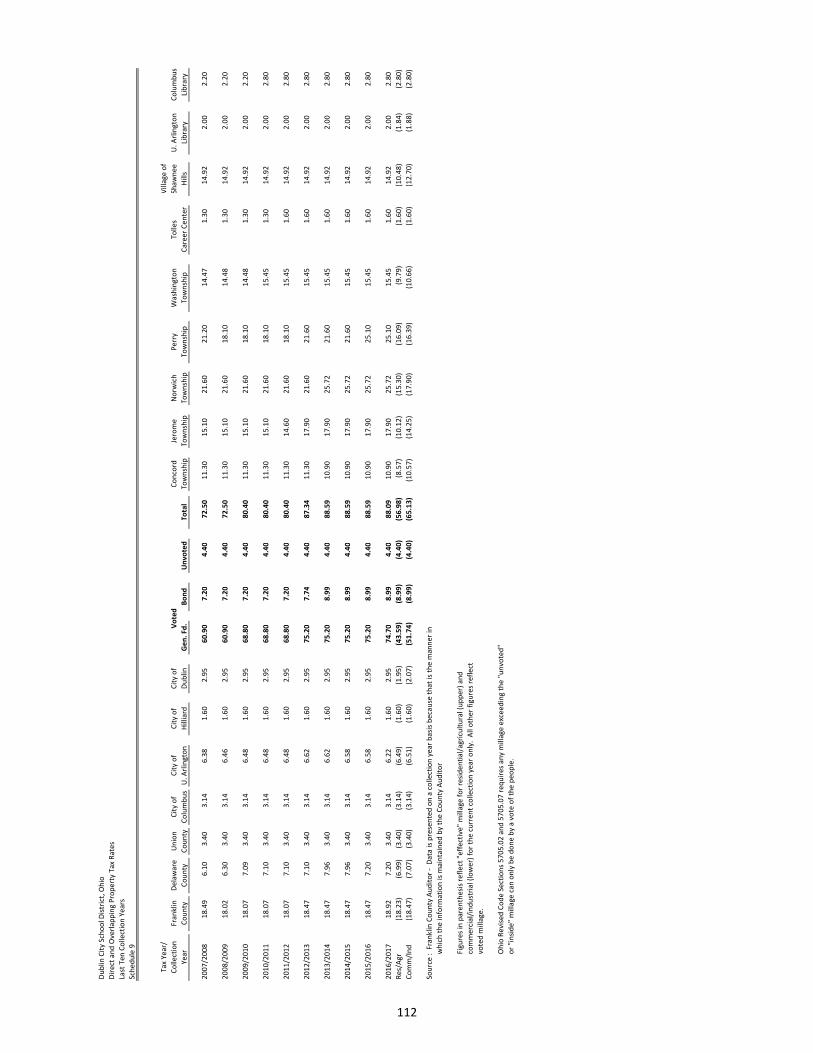
Du
blin
Cit
y Sc
ho
ol D
istr
ict,
Oh
io
Dir
ect
an
d O
verl
ap
pin
g P
rop
ert
y T
ax
Ra
tes
Last
Te
n C
olle
ctio
n Y
ea
rs
Sch
ed
ule
9
Ta
x Y
ea
r/V
illa
ge
of
Co
llect
ion
Fra
nkl
inD
ela
wa
reU
nio
nC
ity
of
Cit
y o
fC
ity
of
Cit
y o
fC
on
cord
Jero
me
No
rwic
hP
err
yW
ash
ing
ton
To
lles
Sha
wn
ee
U.
Arl
ing
ton
Co
lum
bu
s
Ye
ar
Co
un
tyC
ou
nty
Co
un
tyC
olu
mb
us
U.
Arl
ing
ton
Hill
iard
Du
blin
Ge
n.
Fd
.B
on
dU
nv
ote
dT
ota
lT
ow
nsh
ipT
ow
nsh
ipT
ow
nsh
ipT
ow
nsh
ipT
ow
nsh
ipC
are
er
Ce
nte
rH
ills
Lib
rary
Lib
rary
20
07
/20
08
18
.49
6.1
0
3.4
0
3
.14
6
.38
1.6
0
2.9
5
6
0.9
0
7
.20
4.4
0
7
2.5
0
1
1.3
0
1
5.1
0
2
1.6
0
2
1.2
0
1
4.4
7
1.3
0
1
4.9
2
2
.00
2
.20
20
08
/20
09
18
.02
6.3
0
3.4
0
3
.14
6
.46
1.6
0
2.9
5
6
0.9
0
7
.20
4.4
0
7
2.5
0
1
1.3
0
1
5.1
0
2
1.6
0
1
8.1
0
1
4.4
8
1.3
0
1
4.9
2
2
.00
2
.20
20
09
/20
10
18
.07
7.0
9
3.4
0
3
.14
6
.48
1.6
0
2.9
5
6
8.8
0
7
.20
4.4
0
8
0.4
0
1
1.3
0
1
5.1
0
2
1.6
0
1
8.1
0
1
4.4
8
1.3
0
1
4.9
2
2
.00
2
.20
20
10
/20
11
18
.07
7.1
0
3.4
0
3
.14
6
.48
1.6
0
2.9
5
6
8.8
0
7
.20
4.4
0
8
0.4
0
1
1.3
0
1
5.1
0
2
1.6
0
1
8.1
0
1
5.4
5
1.3
0
1
4.9
2
2
.00
2
.80
20
11
/20
12
18
.07
7.1
0
3.4
0
3
.14
6
.48
1.6
0
2.9
5
6
8.8
0
7
.20
4.4
0
8
0.4
0
1
1.3
0
1
4.6
0
2
1.6
0
1
8.1
0
1
5.4
5
1.6
0
1
4.9
2
2
.00
2
.80
20
12
/20
13
18
.47
7.1
0
3.4
0
3
.14
6
.62
1.6
0
2.9
5
7
5.2
0
7
.74
4.4
0
8
7.3
4
1
1.3
0
1
7.9
0
2
1.6
0
2
1.6
0
1
5.4
5
1.6
0
1
4.9
2
2
.00
2
.80
20
13
/20
14
18
.47
7.9
6
3.4
0
3
.14
6
.62
1.6
0
2.9
5
7
5.2
0
8
.99
4.4
0
8
8.5
9
1
0.9
0
1
7.9
0
2
5.7
2
2
1.6
0
1
5.4
5
1.6
0
1
4.9
2
2
.00
2
.80
20
14
/20
15
18
.47
7.9
6
3.4
0
3
.14
6
.58
1.6
0
2.9
5
7
5.2
0
8
.99
4.4
0
8
8.5
9
1
0.9
0
1
7.9
0
2
5.7
2
2
1.6
0
1
5.4
5
1.6
0
1
4.9
2
2
.00
2
.80
20
15
/20
16
18
.47
7.2
0
3.4
0
3
.14
6
.58
1.6
0
2.9
5
7
5.2
0
8
.99
4.4
0
8
8.5
9
1
0.9
0
1
7.9
0
2
5.7
2
2
5.1
0
1
5.4
5
1.6
0
1
4.9
2
2
.00
2
.80
20
16
/20
17
18
.92
7.2
0
3.4
0
3
.14
6
.22
1.6
0
2.9
5
7
4.7
0
8
.99
4.4
0
8
8.0
9
1
0.9
0
1
7.9
0
2
5.7
2
2
5.1
0
1
5.4
5
1.6
0
1
4.9
2
2
.00
2
.80
Re
s/A
gr
(18
.23
)
(6
.99
)
(3.4
0)
(3
.14
)
(6.4
9)
(1.6
0)
(1.9
5)
(4
3.5
9)
(8.9
9)
(4.4
0)
(5
6.9
8)
(8.5
7)
(10
.12
)
(1
5.3
0)
(16
.09
)
(9.7
9)
(1
.60
)
(10
.48
)
(1
.84
)
(2
.80
)
Co
mm
/In
d(1
8.4
7)
(7.0
7)
(3
.40
)
(3.1
4)
(6
.51
)
(1
.60
)
(2
.07
)
(51
.74
)
(8.9
9)
(4.4
0)
(6
5.1
3)
(10
.57
)
(1
4.2
5)
(17
.90
)
(1
6.3
9)
(1
0.6
6)
(1.6
0)
(1
2.7
0)
(1.8
8)
(2.8
0)
Sou
rce
: F
ran
klin
Co
un
ty A
ud
ito
r -
Da
ta is
pre
sen
ted
on
a c
olle
ctio
n y
ea
r b
asi
s b
eca
use
th
at
is t
he
ma
nn
er
in
wh
ich
th
e in
form
ati
on
is m
ain
tain
ed
by
the
Co
un
ty A
ud
ito
r
Fig
ure
s in
pa
ren
the
sis
refl
ect
"e
ffe
ctiv
e"
mill
ag
e f
or
resi
de
nti
al/
ag
ricu
ltu
ral (
up
pe
r) a
nd
co
mm
erc
ial/
ind
ust
ria
l (lo
we
r) f
or
the
cu
rre
nt
colle
ctio
n y
ea
r o
nly
. A
ll o
the
r fi
gu
res
refl
ect
vo
ted
mill
ag
e.
Oh
io R
evi
sed
Co
de
Se
ctio
ns
57
05
.02
an
d 5
70
5.0
7 r
eq
uir
es
an
y m
illa
ge
exc
ee
din
g t
he
"u
nvo
ted
"
or
"in
sid
e"
mill
ag
e c
an
on
ly b
e d
on
e b
y a
vo
te o
f th
e p
eo
ple
.
Vo
ted
112
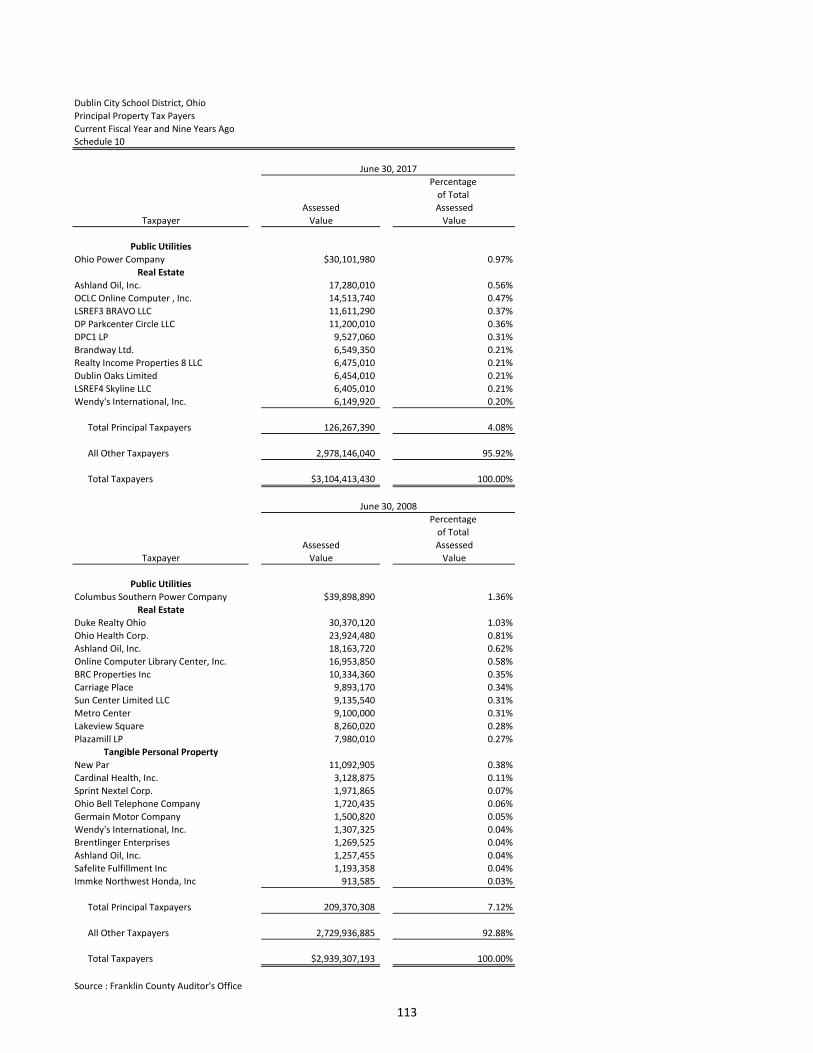
Dublin City School District, Ohio
Principal Property Tax Payers
Current Fiscal Year and Nine Years AgoSchedule 10
Percentage
of Total
Assessed Assessed
Taxpayer Value Value
Public Utilities
Ohio Power Company $30,101,980 0.97%
Real Estate
Ashland Oil, Inc. 17,280,010 0.56%
OCLC Online Computer , Inc. 14,513,740 0.47%
LSREF3 BRAVO LLC 11,611,290 0.37%
DP Parkcenter Circle LLC 11,200,010 0.36%
DPC1 LP 9,527,060 0.31%
Brandway Ltd. 6,549,350 0.21%
Realty Income Properties 8 LLC 6,475,010 0.21%
Dublin Oaks Limited 6,454,010 0.21%
LSREF4 Skyline LLC 6,405,010 0.21%
Wendy's International, Inc. 6,149,920 0.20%
Total Principal Taxpayers 126,267,390 4.08%
All Other Taxpayers 2,978,146,040 95.92%
Total Taxpayers $3,104,413,430 100.00%
Percentage
of Total
Assessed Assessed
Taxpayer Value Value
Public Utilities
Columbus Southern Power Company $39,898,890 1.36%
Real Estate
Duke Realty Ohio 30,370,120 1.03%
Ohio Health Corp. 23,924,480 0.81%
Ashland Oil, Inc. 18,163,720 0.62%
Online Computer Library Center, Inc. 16,953,850 0.58%
BRC Properties Inc 10,334,360 0.35%
Carriage Place 9,893,170 0.34%
Sun Center Limited LLC 9,135,540 0.31%
Metro Center 9,100,000 0.31%
Lakeview Square 8,260,020 0.28%
Plazamill LP 7,980,010 0.27%
Tangible Personal Property
New Par 11,092,905 0.38%
Cardinal Health, Inc. 3,128,875 0.11%
Sprint Nextel Corp. 1,971,865 0.07%
Ohio Bell Telephone Company 1,720,435 0.06%
Germain Motor Company 1,500,820 0.05%
Wendy's International, Inc. 1,307,325 0.04%
Brentlinger Enterprises 1,269,525 0.04%
Ashland Oil, Inc. 1,257,455 0.04%
Safelite Fulfillment Inc 1,193,358 0.04%
Immke Northwest Honda, Inc 913,585 0.03%
Total Principal Taxpayers 209,370,308 7.12%
All Other Taxpayers 2,729,936,885 92.88%
Total Taxpayers $2,939,307,193 100.00%
Source : Franklin County Auditor's Office
June 30, 2017
June 30, 2008
113
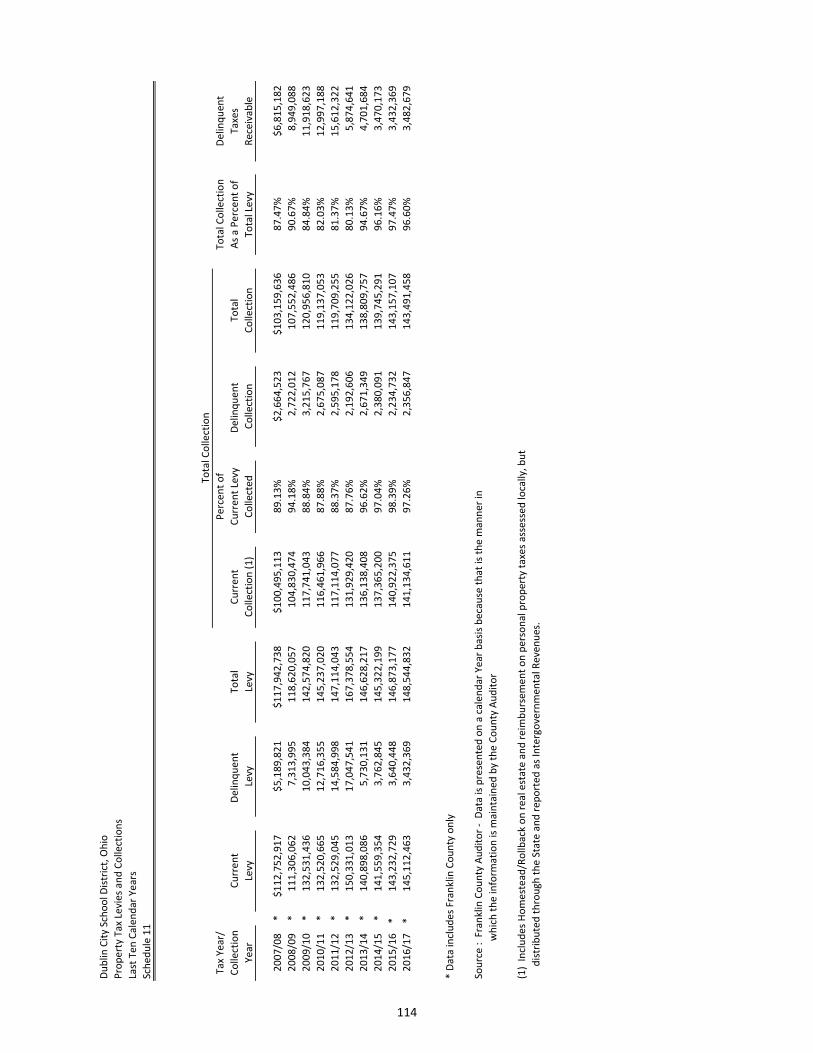
Du
blin
Cit
y Sc
ho
ol D
istr
ict,
Oh
io
Pro
pe
rty
Ta
x Le
vie
s a
nd
Co
llect
ion
s
Last
Te
n C
ale
nd
ar
Ye
ars
Sch
ed
ule
11
Ta
x Y
ea
r/P
erc
en
t o
fT
ota
l Co
llect
ion
De
linq
ue
nt
Co
llect
ion
Cu
rre
nt
De
linq
ue
nt
To
tal
Cu
rre
nt
Cu
rre
nt
Levy
De
linq
ue
nt
To
tal
As
a P
erc
en
t o
fT
axe
s
Ye
ar
Levy
Levy
Levy
Co
llect
ion
(1
)C
olle
cte
dC
olle
ctio
nC
olle
ctio
nT
ota
l Le
vyR
ece
iva
ble
20
07
/08
*$
11
2,7
52
,91
7$
5,1
89
,82
1$
11
7,9
42
,73
8$
10
0,4
95
,11
38
9.1
3%
$2
,66
4,5
23
$1
03
,15
9,6
36
87
.47
%$
6,8
15
,18
2
20
08
/09
*1
11
,30
6,0
62
7,3
13
,99
51
18
,62
0,0
57
10
4,8
30
,47
49
4.1
8%
2,7
22
,01
2
1
07
,55
2,4
86
9
0.6
7%
8,9
49
,08
8
20
09
/10
*1
32
,53
1,4
36
10
,04
3,3
84
14
2,5
74
,82
01
17
,74
1,0
43
88
.84
%3
,21
5,7
67
12
0,9
56
,81
0
84
.84
%1
1,9
18
,62
3
20
10
/11
*1
32
,52
0,6
65
12
,71
6,3
55
14
5,2
37
,02
01
16
,46
1,9
66
87
.88
%2
,67
5,0
87
11
9,1
37
,05
3
82
.03
%1
2,9
97
,18
8
20
11
/12
*1
32
,52
9,0
45
14
,58
4,9
98
14
7,1
14
,04
31
17
,11
4,0
77
88
.37
%2
,59
5,1
78
11
9,7
09
,25
5
81
.37
%1
5,6
12
,32
2
20
12
/13
*1
50
,33
1,0
13
17
,04
7,5
41
16
7,3
78
,55
41
31
,92
9,4
20
87
.76
%2
,19
2,6
06
13
4,1
22
,02
6
80
.13
%5
,87
4,6
41
20
13
/14
*1
40
,89
8,0
86
5,7
30
,13
11
46
,62
8,2
17
13
6,1
38
,40
89
6.6
2%
2,6
71
,34
9
1
38
,80
9,7
57
9
4.6
7%
4,7
01
,68
4
20
14
/15
*1
41
,55
9,3
54
3,7
62
,84
51
45
,32
2,1
99
13
7,3
65
,20
09
7.0
4%
2,3
80
,09
1
1
39
,74
5,2
91
9
6.1
6%
3,4
70
,17
3
20
15
/16
*1
43
,23
2,7
29
3,6
40
,44
81
46
,87
3,1
77
14
0,9
22
,37
59
8.3
9%
2,2
34
,73
2
1
43
,15
7,1
07
9
7.4
7%
3,4
32
,36
9
20
16
/17
*1
45
,11
2,4
63
3,4
32
,36
91
48
,54
4,8
32
14
1,1
34
,61
19
7.2
6%
2,3
56
,84
7
1
43
,49
1,4
58
9
6.6
0%
3,4
82
,67
9
* D
ata
incl
ud
es
Fra
nkl
in C
ou
nty
on
ly
Sou
rce
: F
ran
klin
Co
un
ty A
ud
ito
r -
Da
ta is
pre
sen
ted
on
a c
ale
nd
ar
Ye
ar
ba
sis
be
cau
se t
ha
t is
th
e m
an
ne
r in
w
hic
h t
he
info
rma
tio
n is
ma
inta
ine
d b
y th
e C
ou
nty
Au
dit
or
(1)
In
clu
de
s H
om
est
ea
d/R
ollb
ack
on
re
al e
sta
te a
nd
re
imb
urs
em
en
t o
n p
ers
on
al p
rop
ert
y ta
xes
ass
ess
ed
loca
lly,
bu
t
d
istr
ibu
ted
th
rou
gh
th
e S
tate
an
d r
ep
ort
ed
as
Inte
rgo
vern
me
nta
l Re
ven
ue
s.
To
tal C
olle
ctio
n
114
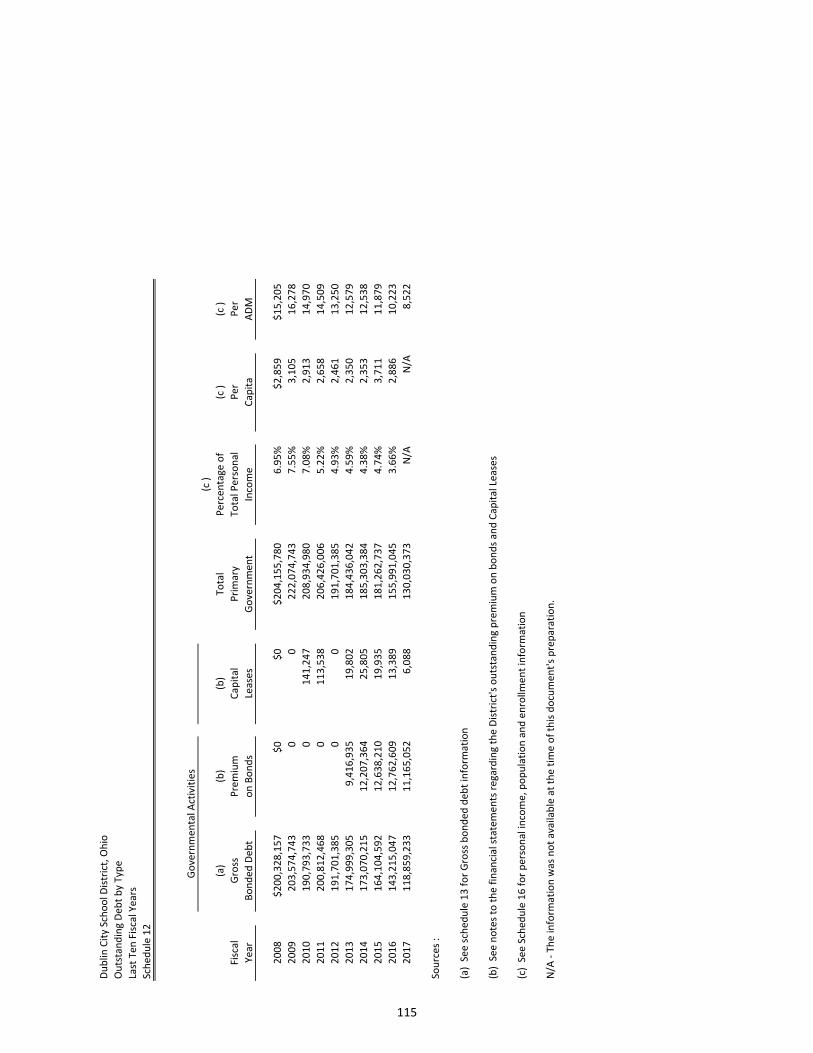
Du
blin
Cit
y Sc
ho
ol D
istr
ict,
Oh
io
Ou
tsta
nd
ing
De
bt
by
Typ
e
Last
Te
n F
isca
l Ye
ars
Sch
ed
ule
12
(c )
(a)
(b)
(b)
To
tal
Pe
rce
nta
ge
of
(c )
(c )
Fisc
al
Gro
ssP
rem
ium
Ca
pit
al
Pri
ma
ryT
ota
l Pe
rso
na
lP
er
Pe
r
Ye
ar
Bo
nd
ed
De
bt
on
Bo
nd
sLe
ase
sG
ove
rnm
en
tIn
com
eC
ap
ita
AD
M
20
08
$2
00
,32
8,1
57
$0
$0
$2
04
,15
5,7
80
6.9
5%
$2
,85
9$
15
,20
5
20
09
20
3,5
74
,74
30
02
22
,07
4,7
43
7.5
5%
3,1
05
16
,27
8
20
10
19
0,7
93
,73
30
14
1,2
47
20
8,9
34
,98
07
.08
%2
,91
31
4,9
70
20
11
20
0,8
12
,46
80
11
3,5
38
20
6,4
26
,00
65
.22
%2
,65
81
4,5
09
20
12
19
1,7
01
,38
50
01
91
,70
1,3
85
4.9
3%
2,4
61
13
,25
0
20
13
17
4,9
99
,30
59
,41
6,9
35
19
,80
21
84
,43
6,0
42
4.5
9%
2,3
50
12
,57
9
20
14
17
3,0
70
,21
51
2,2
07
,36
42
5,8
05
18
5,3
03
,38
44
.38
%2
,35
31
2,5
38
20
15
16
4,1
04
,59
21
2,6
38
,21
01
9,9
35
18
1,2
62
,73
74
.74
%3
,71
11
1,8
79
20
16
14
3,2
15
,04
71
2,7
62
,60
91
3,3
89
15
5,9
91
,04
53
.66
%2
,88
61
0,2
23
20
17
11
8,8
59
,23
31
1,1
65
,05
26
,08
81
30
,03
0,3
73
N/A
N/A
8,5
22
Sou
rce
s :
(a)
Se
e s
che
du
le 1
3 f
or
Gro
ss b
on
de
d d
eb
t in
form
ati
on
(b)
Se
e n
ote
s to
th
e f
ina
nci
al s
tate
me
nts
re
ga
rdin
g t
he
Dis
tric
t's
ou
tsta
nd
ing
pre
miu
m o
n b
on
ds
an
d C
ap
ita
l Le
ase
s
(c)
Se
e S
che
du
le 1
6 f
or
pe
rso
na
l in
com
e,
po
pu
lati
on
an
d e
nro
llme
nt
info
rma
tio
n
N/A
- T
he
info
rma
tio
n w
as
no
t a
vaila
ble
at
the
tim
e o
f th
is d
ocu
me
nt'
s p
rep
ara
tio
n.
Go
vern
me
nta
l Act
ivit
ies
115
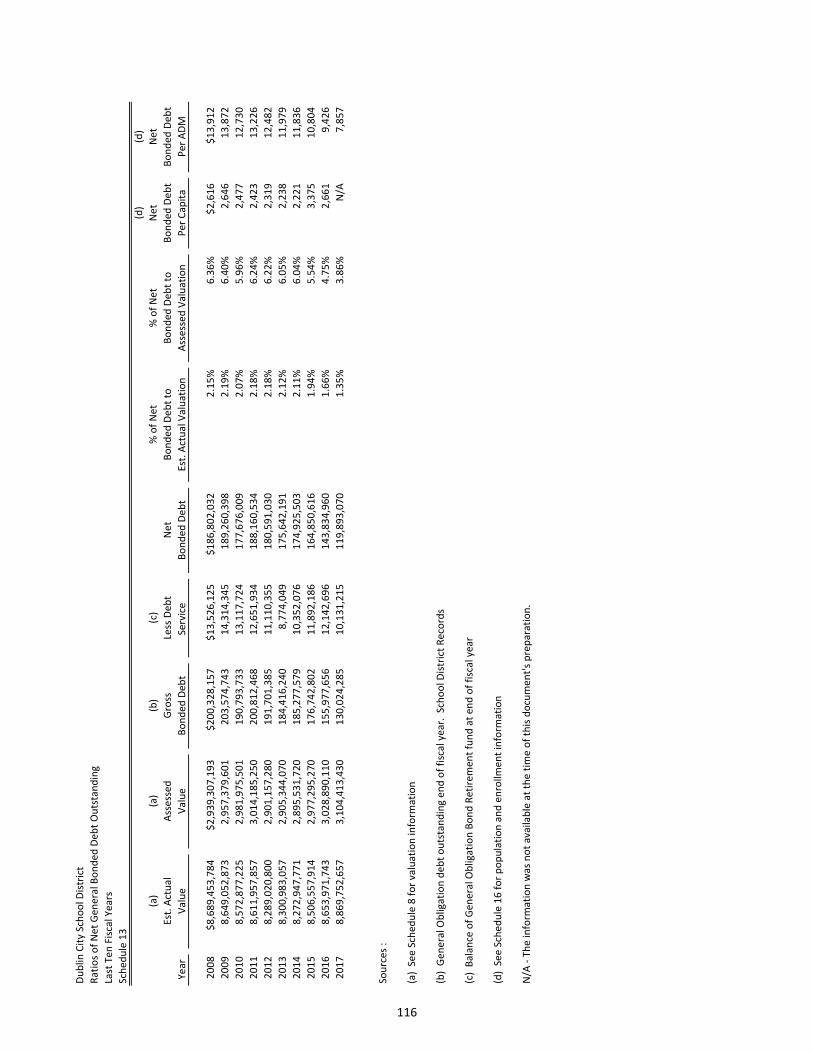
Du
blin
Cit
y Sc
ho
ol D
istr
ict
Ra
tio
s o
f N
et
Ge
ne
ral B
on
de
d D
eb
t O
uts
tan
din
g
Last
Te
n F
isca
l Ye
ars
Sch
ed
ule
13
(d)
(d)
(a)
(a)
(b)
(c)
% o
f N
et
% o
f N
et
Ne
tN
et
Est
. A
ctu
al
Ass
ess
ed
Gro
ssLe
ss D
eb
tN
et
Bo
nd
ed
De
bt
toB
on
de
d D
eb
t to
Bo
nd
ed
De
bt
Bo
nd
ed
De
bt
Ye
ar
Va
lue
Va
lue
Bo
nd
ed
De
bt
Serv
ice
B
on
de
d D
eb
tE
st.
Act
ua
l Va
lua
tio
nA
sse
sse
d V
alu
ati
on
Pe
r C
ap
ita
Pe
r A
DM
20
08
$8
,68
9,4
53
,78
4$
2,9
39
,30
7,1
93
$2
00
,32
8,1
57
$1
3,5
26
,12
5$
18
6,8
02
,03
22
.15
%6
.36
%$
2,6
16
$1
3,9
12
20
09
8,6
49
,05
2,8
73
2
,95
7,3
79
,60
1
20
3,5
74
,74
3
14
,31
4,3
45
1
89
,26
0,3
98
2
.19
%6
.40
%2
,64
6
13
,87
2
20
10
8,5
72
,87
7,2
25
2
,98
1,9
75
,50
1
19
0,7
93
,73
3
13
,11
7,7
24
1
77
,67
6,0
09
2
.07
%5
.96
%2
,47
7
12
,73
0
20
11
8,6
11
,95
7,8
57
3
,01
4,1
85
,25
0
20
0,8
12
,46
8
12
,65
1,9
34
1
88
,16
0,5
34
2
.18
%6
.24
%2
,42
3
13
,22
6
20
12
8,2
89
,02
0,8
00
2
,90
1,1
57
,28
0
19
1,7
01
,38
5
11
,11
0,3
55
1
80
,59
1,0
30
2
.18
%6
.22
%2
,31
9
12
,48
2
20
13
8,3
00
,98
3,0
57
2
,90
5,3
44
,07
0
18
4,4
16
,24
0
8,7
74
,04
9
1
75
,64
2,1
91
2
.12
%6
.05
%2
,23
8
11
,97
9
20
14
8,2
72
,94
7,7
71
2
,89
5,5
31
,72
0
18
5,2
77
,57
9
10
,35
2,0
76
1
74
,92
5,5
03
2
.11
%6
.04
%2
,22
1
11
,83
6
20
15
8,5
06
,55
7,9
14
2
,97
7,2
95
,27
0
17
6,7
42
,80
2
11
,89
2,1
86
1
64
,85
0,6
16
1
.94
%5
.54
%3
,37
5
10
,80
4
20
16
8,6
53
,97
1,7
43
3,0
28
,89
0,1
10
15
5,9
77
,65
61
2,1
42
,69
61
43
,83
4,9
60
1
.66
%4
.75
%2
,66
1
9,4
26
20
17
8,8
69
,75
2,6
57
3,1
04
,41
3,4
30
13
0,0
24
,28
51
0,1
31
,21
51
19
,89
3,0
70
1
.35
%3
.86
%N
/A7
,85
7
Sou
rce
s :
(a)
Se
e S
che
du
le 8
fo
r va
lua
tio
n in
form
ati
on
(b)
Ge
ne
ral O
blig
ati
on
de
bt
ou
tsta
nd
ing
en
d o
f fi
sca
l ye
ar.
Sch
oo
l Dis
tric
t R
eco
rds
(c)
Ba
lan
ce o
f G
en
era
l Ob
liga
tio
n B
on
d R
eti
rem
en
t fu
nd
at
en
d o
f fi
sca
l ye
ar
(d)
Se
e S
che
du
le 1
6 f
or
po
pu
lati
on
an
d e
nro
llme
nt
info
rma
tio
n
N/A
- T
he
info
rma
tio
n w
as
no
t a
vaila
ble
at
the
tim
e o
f th
is d
ocu
me
nt'
s p
rep
ara
tio
n.
116
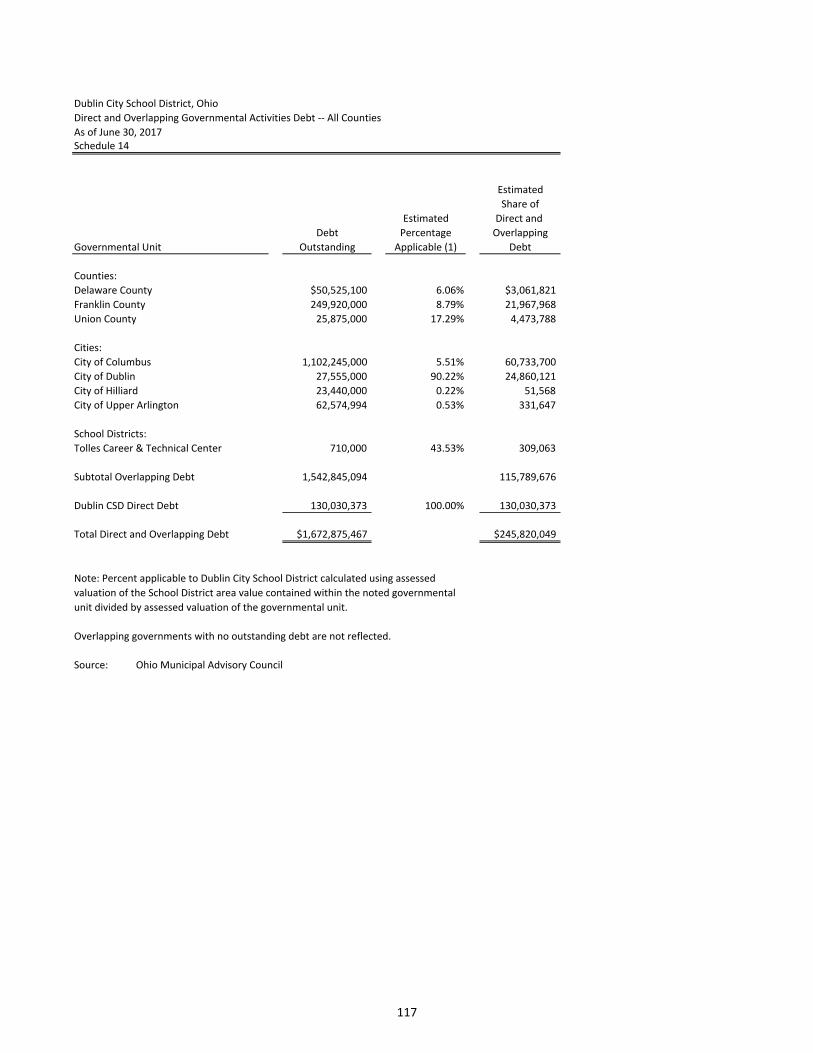
Dublin City School District, Ohio
Direct and Overlapping Governmental Activities Debt -- All Counties
As of June 30, 2017
Schedule 14
Estimated
Share of
Estimated Direct and
Debt Percentage Overlapping
Governmental Unit Outstanding Applicable (1) Debt
Counties:
Delaware County $50,525,100 6.06% $3,061,821
Franklin County 249,920,000 8.79% 21,967,968
Union County 25,875,000 17.29% 4,473,788
Cities:
City of Columbus 1,102,245,000 5.51% 60,733,700
City of Dublin 27,555,000 90.22% 24,860,121
City of Hilliard 23,440,000 0.22% 51,568
City of Upper Arlington 62,574,994 0.53% 331,647
School Districts:
Tolles Career & Technical Center 710,000 43.53% 309,063
Subtotal Overlapping Debt 1,542,845,094 115,789,676
Dublin CSD Direct Debt 130,030,373 100.00% 130,030,373
Total Direct and Overlapping Debt $1,672,875,467 $245,820,049
Overlapping governments with no outstanding debt are not reflected.
Source: Ohio Municipal Advisory Council
Note: Percent applicable to Dublin City School District calculated using assessed
valuation of the School District area value contained within the noted governmental
unit divided by assessed valuation of the governmental unit.
117
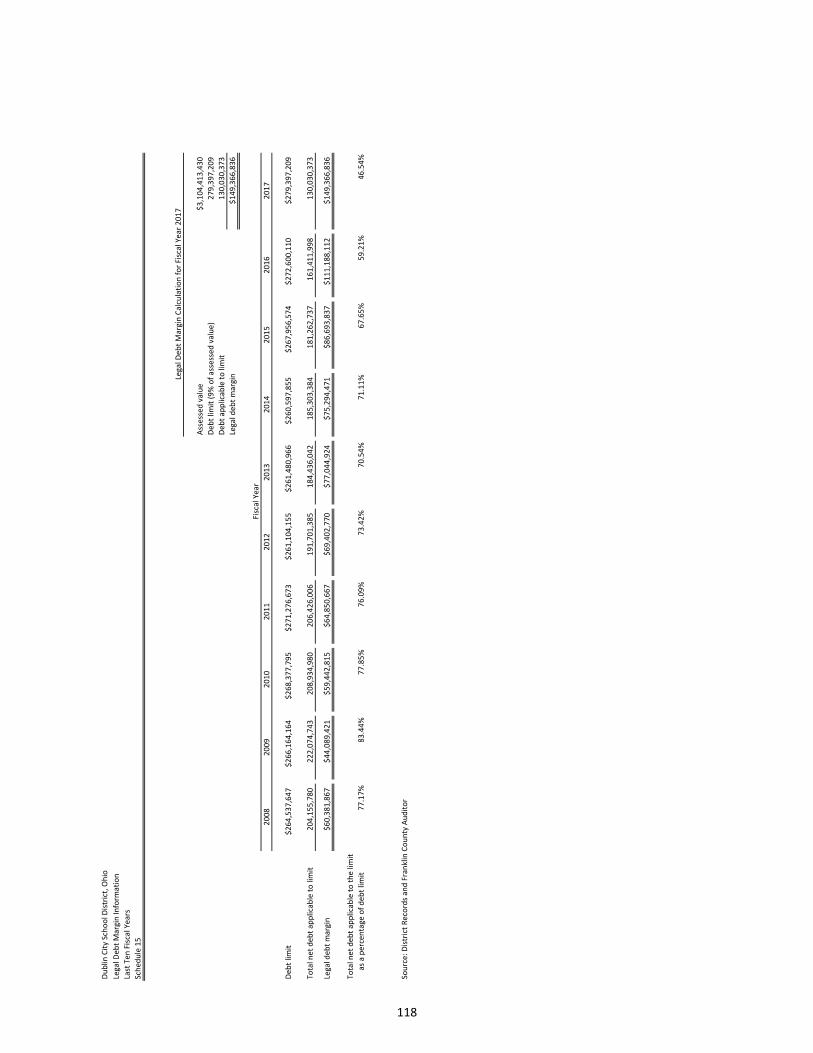
Du
blin
Cit
y Sc
ho
ol D
istr
ict,
Oh
io
Leg
al D
eb
t M
arg
in I
nfo
rma
tio
n
Last
Te
n F
isca
l Ye
ars
Sch
ed
ule
15
Ass
ess
ed
va
lue
$3
,10
4,4
13
,43
0
De
bt
limit
(9
% o
f a
sse
sse
d v
alu
e)
27
9,3
97
,20
9
De
bt
ap
plic
ab
le t
o li
mit
13
0,0
30
,37
3
Leg
al d
eb
t m
arg
in$
14
9,3
66
,83
6
20
08
20
09
20
10
20
11
20
12
20
13
20
14
20
15
20
16
20
17
De
bt
limit
$2
64
,53
7,6
47
$2
66
,16
4,1
64
$2
68
,37
7,7
95
$2
71
,27
6,6
73
$2
61
,10
4,1
55
$2
61
,48
0,9
66
$2
60
,59
7,8
55
$2
67
,95
6,5
74
$2
72
,60
0,1
10
$2
79
,39
7,2
09
To
tal n
et
de
bt
ap
plic
ab
le t
o li
mit
20
4,1
55
,78
02
22
,07
4,7
43
20
8,9
34
,98
02
06
,42
6,0
06
19
1,7
01
,38
51
84
,43
6,0
42
18
5,3
03
,38
41
81
,26
2,7
37
16
1,4
11
,99
81
30
,03
0,3
73
Leg
al d
eb
t m
arg
in$
60
,38
1,8
67
$4
4,0
89
,42
1$
59
,44
2,8
15
$6
4,8
50
,66
7$
69
,40
2,7
70
$7
7,0
44
,92
4$
75
,29
4,4
71
$8
6,6
93
,83
7$
11
1,1
88
,11
2$
14
9,3
66
,83
6
To
tal n
et
de
bt
ap
plic
ab
le t
o t
he
lim
it
as
a p
erc
en
tag
e o
f d
eb
t lim
it7
7.1
7%
83
.44
%7
7.8
5%
76
.09
%7
3.4
2%
70
.54
%7
1.1
1%
67
.65
%5
9.2
1%
46
.54
%
Sou
rce
: D
istr
ict
Re
cord
s a
nd
Fra
nkl
in C
ou
nty
Au
dit
or
Leg
al D
eb
t M
arg
in C
alc
ula
tio
n f
or
Fisc
al Y
ea
r 2
01
7
Fisc
al Y
ea
r
118
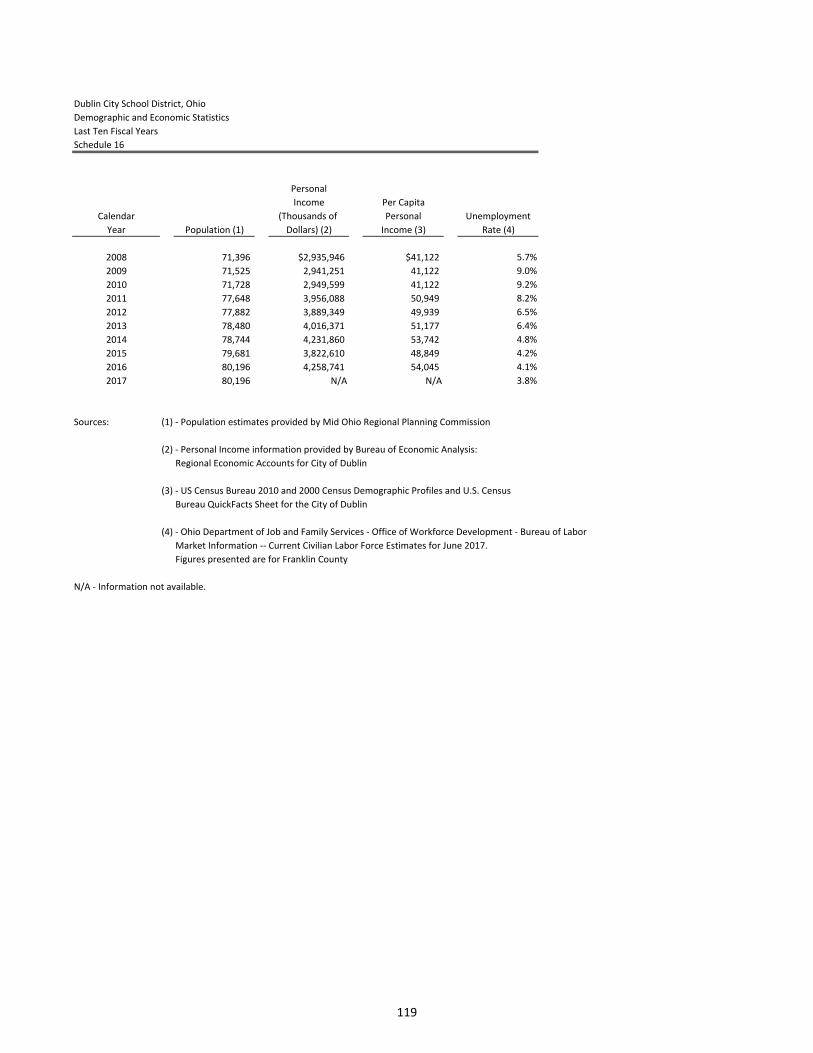
Dublin City School District, Ohio
Demographic and Economic Statistics
Last Ten Fiscal Years
Schedule 16
Personal
Income Per Capita
Calendar (Thousands of Personal Unemployment
Year Population (1) Dollars) (2) Income (3) Rate (4)
2008 71,396 $2,935,946 $41,122 5.7%
2009 71,525 2,941,251 41,122 9.0%
2010 71,728 2,949,599 41,122 9.2%
2011 77,648 3,956,088 50,949 8.2%
2012 77,882 3,889,349 49,939 6.5%
2013 78,480 4,016,371 51,177 6.4%
2014 78,744 4,231,860 53,742 4.8%
2015 79,681 3,822,610 48,849 4.2%
2016 80,196 4,258,741 54,045 4.1%
2017 80,196 N/A N/A 3.8%
Sources: (1) - Population estimates provided by Mid Ohio Regional Planning Commission
(2) - Personal Income information provided by Bureau of Economic Analysis:
Regional Economic Accounts for City of Dublin
(3) - US Census Bureau 2010 and 2000 Census Demographic Profiles and U.S. Census
Bureau QuickFacts Sheet for the City of Dublin
(4) - Ohio Department of Job and Family Services - Office of Workforce Development - Bureau of Labor
Market Information -- Current Civilian Labor Force Estimates for June 2017.
Figures presented are for Franklin County
N/A - Information not available.
119
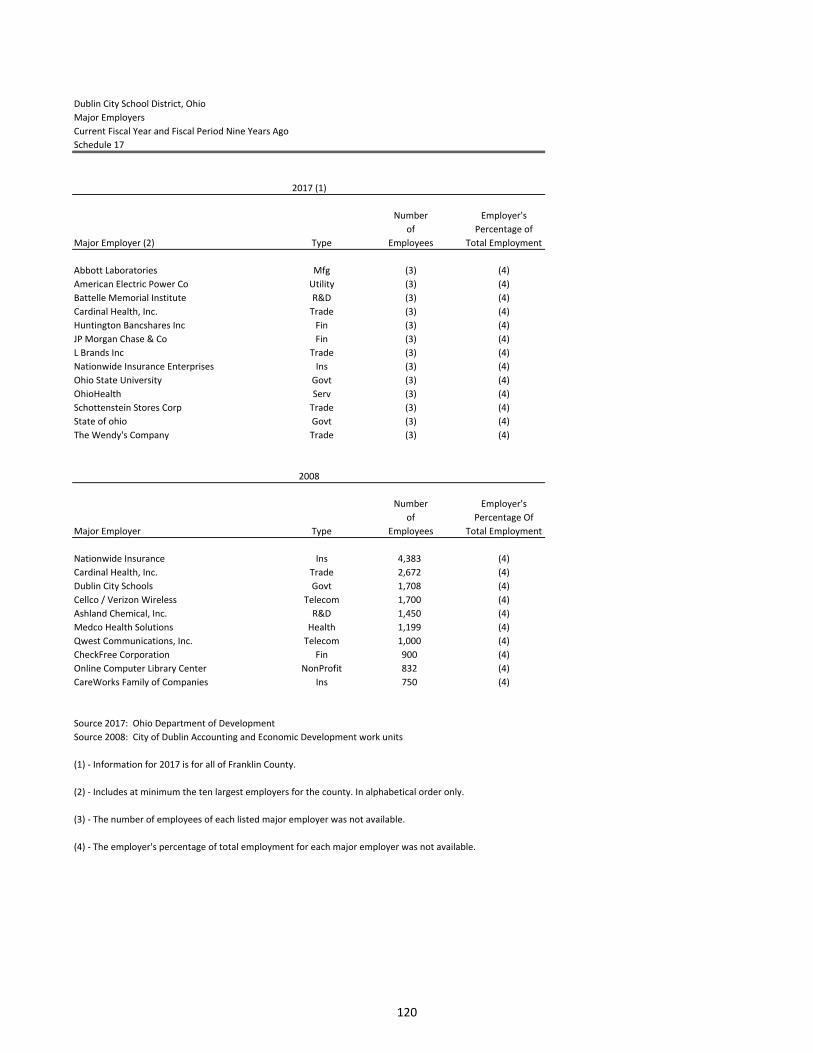
Dublin City School District, Ohio
Major Employers
Current Fiscal Year and Fiscal Period Nine Years Ago
Schedule 17
Number Employer's
of Percentage of
Major Employer (2) Type Employees Total Employment
Abbott Laboratories Mfg (3) (4)
American Electric Power Co Utility (3) (4)
Battelle Memorial Institute R&D (3) (4)
Cardinal Health, Inc. Trade (3) (4)
Huntington Bancshares Inc Fin (3) (4)
JP Morgan Chase & Co Fin (3) (4)
L Brands Inc Trade (3) (4)
Nationwide Insurance Enterprises Ins (3) (4)
Ohio State University Govt (3) (4)
OhioHealth Serv (3) (4)
Schottenstein Stores Corp Trade (3) (4)
State of ohio Govt (3) (4)
The Wendy's Company Trade (3) (4)
Number Employer's
of Percentage Of
Major Employer Type Employees Total Employment
Nationwide Insurance Ins 4,383 (4)
Cardinal Health, Inc. Trade 2,672 (4)
Dublin City Schools Govt 1,708 (4)
Cellco / Verizon Wireless Telecom 1,700 (4)
Ashland Chemical, Inc. R&D 1,450 (4)
Medco Health Solutions Health 1,199 (4)
Qwest Communications, Inc. Telecom 1,000 (4)
CheckFree Corporation Fin 900 (4)
Online Computer Library Center NonProfit 832 (4)
CareWorks Family of Companies Ins 750 (4)
Source 2017: Ohio Department of Development
Source 2008: City of Dublin Accounting and Economic Development work units
(1) - Information for 2017 is for all of Franklin County.
(2) - Includes at minimum the ten largest employers for the county. In alphabetical order only.
(3) - The number of employees of each listed major employer was not available.
(4) - The employer's percentage of total employment for each major employer was not available.
2017 (1)
2008
120
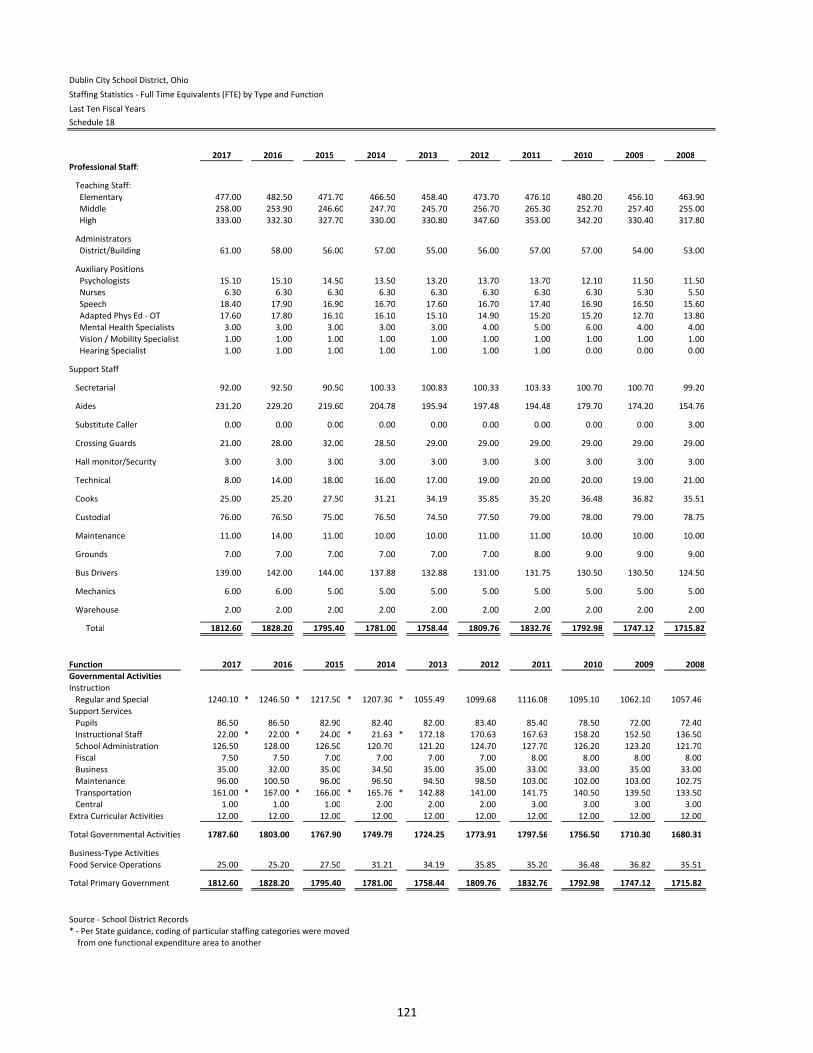
Dublin City School District, Ohio
Staffing Statistics - Full Time Equivalents (FTE) by Type and Function
Last Ten Fiscal Years
Schedule 18
2017 2016 2015 2014 2013 2012 2011 2010 2009 2008
Professional Staff:
Teaching Staff:
Elementary 477.00 482.50 471.70 466.50 458.40 473.70 476.10 480.20 456.10 463.90
Middle 258.00 253.90 246.60 247.70 245.70 256.70 265.30 252.70 257.40 255.00
High 333.00 332.30 327.70 330.00 330.80 347.60 353.00 342.20 330.40 317.80
Administrators
District/Building 61.00 58.00 56.00 57.00 55.00 56.00 57.00 57.00 54.00 53.00
Auxiliary Positions
Psychologists 15.10 15.10 14.50 13.50 13.20 13.70 13.70 12.10 11.50 11.50
Nurses 6.30 6.30 6.30 6.30 6.30 6.30 6.30 6.30 5.30 5.50
Speech 18.40 17.90 16.90 16.70 17.60 16.70 17.40 16.90 16.50 15.60
Adapted Phys Ed - OT 17.60 17.80 16.10 16.10 15.10 14.90 15.20 15.20 12.70 13.80
Mental Health Specialists 3.00 3.00 3.00 3.00 3.00 4.00 5.00 6.00 4.00 4.00
Vision / Mobility Specialist 1.00 1.00 1.00 1.00 1.00 1.00 1.00 1.00 1.00 1.00
Hearing Specialist 1.00 1.00 1.00 1.00 1.00 1.00 1.00 0.00 0.00 0.00
Support Staff
Secretarial 92.00 92.50 90.50 100.33 100.83 100.33 103.33 100.70 100.70 99.20
Aides 231.20 229.20 219.60 204.78 195.94 197.48 194.48 179.70 174.20 154.76
Substitute Caller 0.00 0.00 0.00 0.00 0.00 0.00 0.00 0.00 0.00 3.00
Crossing Guards 21.00 28.00 32.00 28.50 29.00 29.00 29.00 29.00 29.00 29.00
Hall monitor/Security 3.00 3.00 3.00 3.00 3.00 3.00 3.00 3.00 3.00 3.00
Technical 8.00 14.00 18.00 16.00 17.00 19.00 20.00 20.00 19.00 21.00
Cooks 25.00 25.20 27.50 31.21 34.19 35.85 35.20 36.48 36.82 35.51
Custodial 76.00 76.50 75.00 76.50 74.50 77.50 79.00 78.00 79.00 78.75
Maintenance 11.00 14.00 11.00 10.00 10.00 11.00 11.00 10.00 10.00 10.00
Grounds 7.00 7.00 7.00 7.00 7.00 7.00 8.00 9.00 9.00 9.00
Bus Drivers 139.00 142.00 144.00 137.88 132.88 131.00 131.75 130.50 130.50 124.50
Mechanics 6.00 6.00 5.00 5.00 5.00 5.00 5.00 5.00 5.00 5.00
Warehouse 2.00 2.00 2.00 2.00 2.00 2.00 2.00 2.00 2.00 2.00
Total 1812.60 1828.20 1795.40 1781.00 1758.44 1809.76 1832.76 1792.98 1747.12 1715.82
Function 2017 2016 2015 2014 2013 2012 2011 2010 2009 2008
Governmental Activities
Instruction
Regular and Special 1240.10 * 1246.50 * 1217.50 * 1207.30 * 1055.49 1099.68 1116.08 1095.10 1062.10 1057.46
Support Services
Pupils 86.50 86.50 82.90 82.40 82.00 83.40 85.40 78.50 72.00 72.40
Instructional Staff 22.00 * 22.00 * 24.00 * 21.63 * 172.18 170.63 167.63 158.20 152.50 136.50
School Administration 126.50 128.00 126.50 120.70 121.20 124.70 127.70 126.20 123.20 121.70
Fiscal 7.50 7.50 7.00 7.00 7.00 7.00 8.00 8.00 8.00 8.00
Business 35.00 32.00 35.00 34.50 35.00 35.00 33.00 33.00 35.00 33.00
Maintenance 96.00 100.50 96.00 96.50 94.50 98.50 103.00 102.00 103.00 102.75
Transportation 161.00 * 167.00 * 166.00 * 165.76 * 142.88 141.00 141.75 140.50 139.50 133.50
Central 1.00 1.00 1.00 2.00 2.00 2.00 3.00 3.00 3.00 3.00
Extra Curricular Activities 12.00 12.00 12.00 12.00 12.00 12.00 12.00 12.00 12.00 12.00
Total Governmental Activities 1787.60 1803.00 1767.90 1749.79 1724.25 1773.91 1797.56 1756.50 1710.30 1680.31
Business-Type Activities
Food Service Operations 25.00 25.20 27.50 31.21 34.19 35.85 35.20 36.48 36.82 35.51
Total Primary Government 1812.60 1828.20 1795.40 1781.00 1758.44 1809.76 1832.76 1792.98 1747.12 1715.82
Source - School District Records
* - Per State guidance, coding of particular staffing categories were moved
from one functional expenditure area to another
121
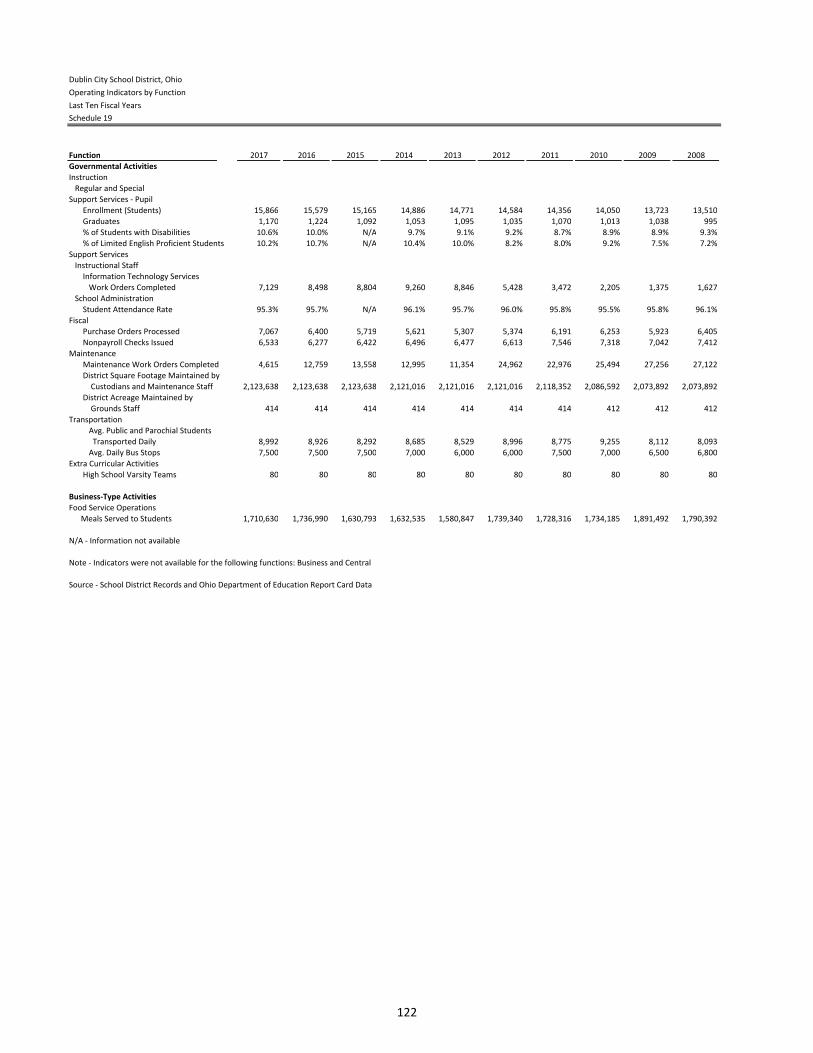
Dublin City School District, Ohio
Operating Indicators by Function
Last Ten Fiscal Years
Schedule 19
Function 2017 2016 2015 2014 2013 2012 2011 2010 2009 2008
Governmental Activities
Instruction
Regular and Special
Support Services - Pupil
Enrollment (Students) 15,866 15,579 15,165 14,886 14,771 14,584 14,356 14,050 13,723 13,510
Graduates 1,170 1,224 1,092 1,053 1,095 1,035 1,070 1,013 1,038 995
% of Students with Disabilities 10.6% 10.0% N/A 9.7% 9.1% 9.2% 8.7% 8.9% 8.9% 9.3%
% of Limited English Proficient Students 10.2% 10.7% N/A 10.4% 10.0% 8.2% 8.0% 9.2% 7.5% 7.2%
Support Services
Instructional Staff
Information Technology Services
Work Orders Completed 7,129 8,498 8,804 9,260 8,846 5,428 3,472 2,205 1,375 1,627
School Administration
Student Attendance Rate 95.3% 95.7% N/A 96.1% 95.7% 96.0% 95.8% 95.5% 95.8% 96.1%
Fiscal
Purchase Orders Processed 7,067 6,400 5,719 5,621 5,307 5,374 6,191 6,253 5,923 6,405
Nonpayroll Checks Issued 6,533 6,277 6,422 6,496 6,477 6,613 7,546 7,318 7,042 7,412
Maintenance
Maintenance Work Orders Completed 4,615 12,759 13,558 12,995 11,354 24,962 22,976 25,494 27,256 27,122
District Square Footage Maintained by
Custodians and Maintenance Staff 2,123,638 2,123,638 2,123,638 2,121,016 2,121,016 2,121,016 2,118,352 2,086,592 2,073,892 2,073,892
District Acreage Maintained by
Grounds Staff 414 414 414 414 414 414 414 412 412 412
Transportation
Avg. Public and Parochial Students
Transported Daily 8,992 8,926 8,292 8,685 8,529 8,996 8,775 9,255 8,112 8,093
Avg. Daily Bus Stops 7,500 7,500 7,500 7,000 6,000 6,000 7,500 7,000 6,500 6,800
Extra Curricular Activities
High School Varsity Teams 80 80 80 80 80 80 80 80 80 80
Business-Type Activities
Food Service Operations
Meals Served to Students 1,710,630 1,736,990 1,630,793 1,632,535 1,580,847 1,739,340 1,728,316 1,734,185 1,891,492 1,790,392
N/A - Information not available
Note - Indicators were not available for the following functions: Business and Central
Source - School District Records and Ohio Department of Education Report Card Data
122
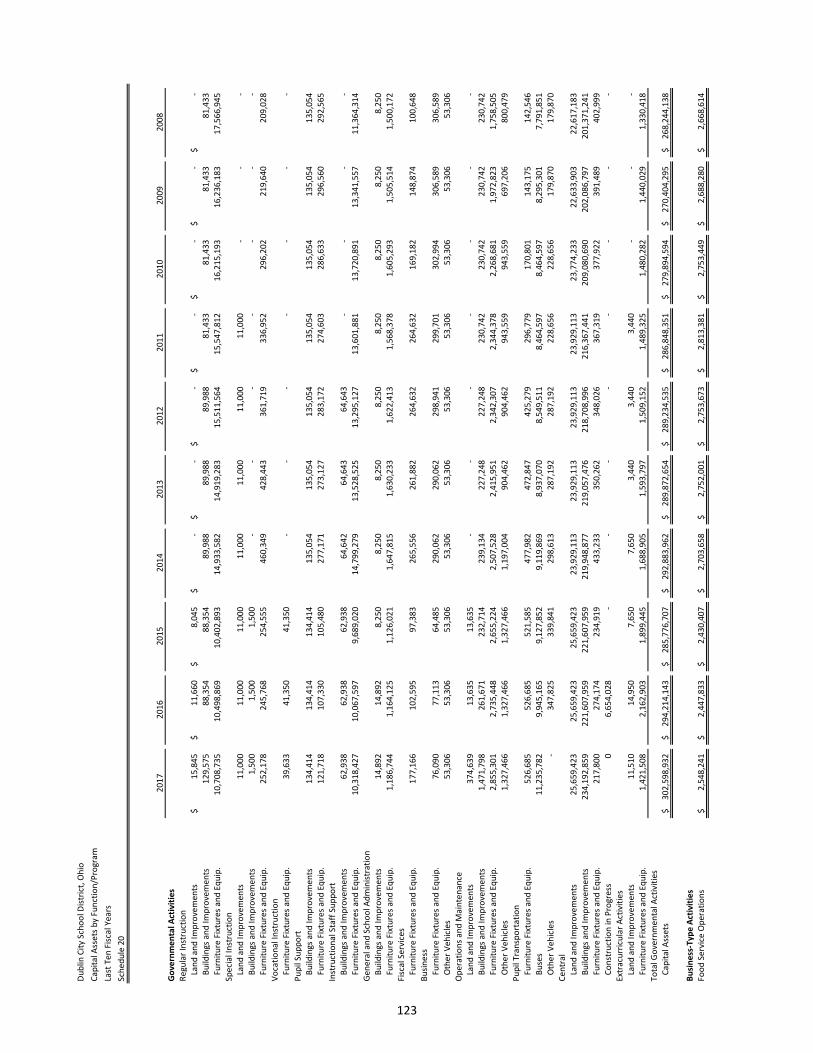
Du
blin
Cit
y Sc
ho
ol D
istr
ict,
Oh
io
Cap
ital
Ass
ets
by
Fun
ctio
n/P
rogr
am
Last
Ten
Fis
cal Y
ears
Sch
edu
le 2
0
20
17
20
1620
1520
1420
1320
122
01
12
01
02
00
92
00
8G
ove
rnm
en
tal A
ctiv
itie
sR
egu
lar
Inst
ruct
ion
La
nd
an
d Im
pro
vem
ents
15,8
45$
1
1,6
60$
8,
045
$
-
$
-$
-
$
-$
-
$
-$
-
$
B
uild
ings
an
d Im
pro
vem
ents
129,
575
88
,35
4
88
,354
89,9
88
89
,988
89,9
88
8
1,4
33
81
,43
3
8
1,4
33
81
,43
3
Furn
itu
re F
ixtu
res
and
Eq
uip
.10
,708
,735
10
,498
,86
9
10,4
02,8
93
14,9
33,5
82
14,9
19,2
83
15,5
11,5
64
15
,54
7,8
12
1
6,2
15
,19
3
16
,23
6,1
83
1
7,5
66
,94
5
Spec
ial I
nst
ruct
ion
La
nd
an
d Im
pro
vem
ents
11,0
001
1,0
0011
,000
11,0
0011
,000
11,0
001
1,0
00
-
-
-
Bu
ildin
gs a
nd
Imp
rove
men
ts1,
500
1,5
00
1,50
0-
-
-
-
-
-
-
Fu
rnit
ure
Fix
ture
s an
d E
qu
ip.
252,
178
245
,768
254,
555
460,
349
428,
443
361,
719
33
6,9
52
29
6,2
02
21
9,6
40
20
9,0
28
Vo
cati
on
al In
stru
ctio
n
Furn
itu
re F
ixtu
res
and
Eq
uip
.39
,633
41
,350
41,3
50
-
-
-
-
-
-
-
Pu
pil
Sup
po
rt
Bu
ildin
gs a
nd
Imp
rove
men
ts13
4,41
413
4,4
1413
4,41
413
5,05
413
5,05
413
5,05
41
35
,05
41
35
,05
41
35
,05
41
35
,05
4
Furn
itu
re F
ixtu
res
and
Eq
uip
.12
1,71
810
7,3
3010
5,48
027
7,17
127
3,12
728
3,17
22
74
,60
32
86
,63
32
96
,56
02
92
,56
5In
stru
ctio
nal
Sta
ff S
up
po
rt
Bu
ildin
gs a
nd
Imp
rove
men
ts62
,938
62
,938
62,9
3864
,642
64,6
4364
,643
-
-
-
-
Fu
rnit
ure
Fix
ture
s an
d E
qu
ip.
10,3
18,4
2710
,067
,59
79,
689,
020
14,7
99,2
7913
,528
,525
13,2
95,1
271
3,6
01
,88
11
3,7
20
,89
11
3,3
41
,55
71
1,3
64
,31
4G
ener
al a
nd
Sch
oo
l Ad
min
istr
atio
n
Bu
ildin
gs a
nd
Imp
rove
men
ts14
,892
14
,892
8,25
08,
250
8,25
08,
250
8,2
50
8,2
50
8,2
50
8,2
50
Fu
rnit
ure
Fix
ture
s an
d E
qu
ip.
1,18
6,74
41,
16
4,12
51,
126,
021
1,64
7,81
51,
630,
233
1,62
2,41
31
,56
8,3
78
1,6
05
,29
31
,50
5,5
14
1,5
00
,17
2Fi
scal
Ser
vice
s
Furn
itu
re F
ixtu
res
and
Eq
uip
.17
7,16
610
2,5
9597
,383
265,
556
261,
882
264,
632
26
4,6
32
16
9,1
82
14
8,8
74
10
0,6
48
Bu
sin
ess
Fu
rnit
ure
Fix
ture
s an
d E
qu
ip.
76,0
907
7,1
1364
,485
290,
062
290,
062
298,
941
29
9,7
01
30
2,9
94
30
6,5
89
30
6,5
89
O
ther
Ve
hic
les
53,3
065
3,3
0653
,306
53,3
0653
,306
53,3
065
3,3
06
53
,30
65
3,3
06
53
,30
6O
per
atio
ns
and
Mai
nte
nan
ce
Lan
d a
nd
Imp
rove
men
ts37
4,63
913
,63
513
,635
-
-
-
-
-
-
-
Bu
ildin
gs a
nd
Imp
rove
men
ts1,
471,
798
261
,671
232,
714
239,
134
227,
248
227,
248
23
0,7
42
23
0,7
42
23
0,7
42
23
0,7
42
Fu
rnit
ure
Fix
ture
s an
d E
qu
ip.
2,85
5,30
12,
73
5,44
82,
655,
224
2,50
7,52
82,
415,
951
2,34
2,30
72
,34
4,3
78
2,2
68
,68
11
,97
2,8
23
1,7
58
,50
5
Oth
er V
eh
icle
s1,
327,
466
1,3
27,
466
1,32
7,46
61,
197,
004
904,
462
904,
462
94
3,5
59
94
3,5
59
69
7,2
06
80
0,4
79
Pu
pil
Tran
spo
rtat
ion
Fu
rnit
ure
Fix
ture
s an
d E
qu
ip.
526,
685
526
,685
521,
585
477,
982
472,
847
425,
279
29
6,7
79
17
0,8
01
14
3,1
75
14
2,5
46
B
use
s11
,235
,782
9,9
45,1
65
9,12
7,85
29,
119,
869
8,93
7,07
08,
549,
511
8,4
64
,59
78
,46
4,5
97
8,2
95
,30
17
,79
1,8
51
O
ther
Ve
hic
les
-
34
7,8
25
33
9,84
1
298,
613
28
7,19
2
287,
192
2
28
,65
6
22
8,6
56
1
79
,87
0
17
9,8
70
C
en
tral
La
nd
an
d Im
pro
vem
ents
25,6
59,4
2325
,659
,42
325
,659
,423
23,9
29,1
1323
,929
,113
23,9
29,1
132
3,9
29
,11
32
3,7
74
,23
32
2,6
33
,90
32
2,6
17
,18
3
Bu
ildin
gs a
nd
Imp
rove
men
ts23
4,19
2,85
922
1,6
07,
959
221,
607,
959
219,
948,
877
219,
057,
476
218,
708,
996
21
6,3
67
,44
12
09
,08
0,6
90
20
2,0
86
,79
72
01
,37
1,2
41
Fu
rnit
ure
Fix
ture
s an
d E
qu
ip.
217,
800
274
,174
234,
919
433,
233
350,
262
348,
026
36
7,3
19
37
7,9
22
39
1,4
89
40
2,9
99
C
on
stru
ctio
n in
Pro
gres
s0
6,6
54,0
28
-
-
-
-
-
-
-
-
Extr
acu
rric
ula
r A
ctiv
itie
s
Lan
d a
nd
Imp
rove
men
ts11
,510
14
,950
7,65
07,
650
3,44
03,
440
3,4
40
-
-
-
Furn
itu
re F
ixtu
res
and
Eq
uip
.1,
421,
508
2,1
62,
903
1,89
9,44
51,
688,
905
1,59
3,79
71,
509,
152
1,4
89
,32
51
,48
0,2
82
1,4
40
,02
91
,33
0,4
18
Tota
l Go
vern
men
tal A
ctiv
itie
s
Cap
ital
Ass
ets
302,
598,
932
$
29
4,2
14,
143
$
28
5,77
6,70
7$
292,
883,
962
$
28
9,87
2,65
4$
289,
234,
535
$
2
86
,84
8,3
51
$
2
79
,89
4,5
94
$
2
70
,40
4,2
95
$
2
68
,24
4,1
38
$
Bu
sin
ess-
Typ
e A
ctiv
itie
sFo
od
Ser
vice
Op
erat
ion
s2,
548,
241
$
2,4
47,
833
$
2,43
0,40
7$
2,
703,
658
$
2,75
2,00
1$
2,
753,
673
$
2,8
13
,38
1$
2
,75
3,4
49
$
2,6
88
,28
0$
2
,66
8,6
14
$
123
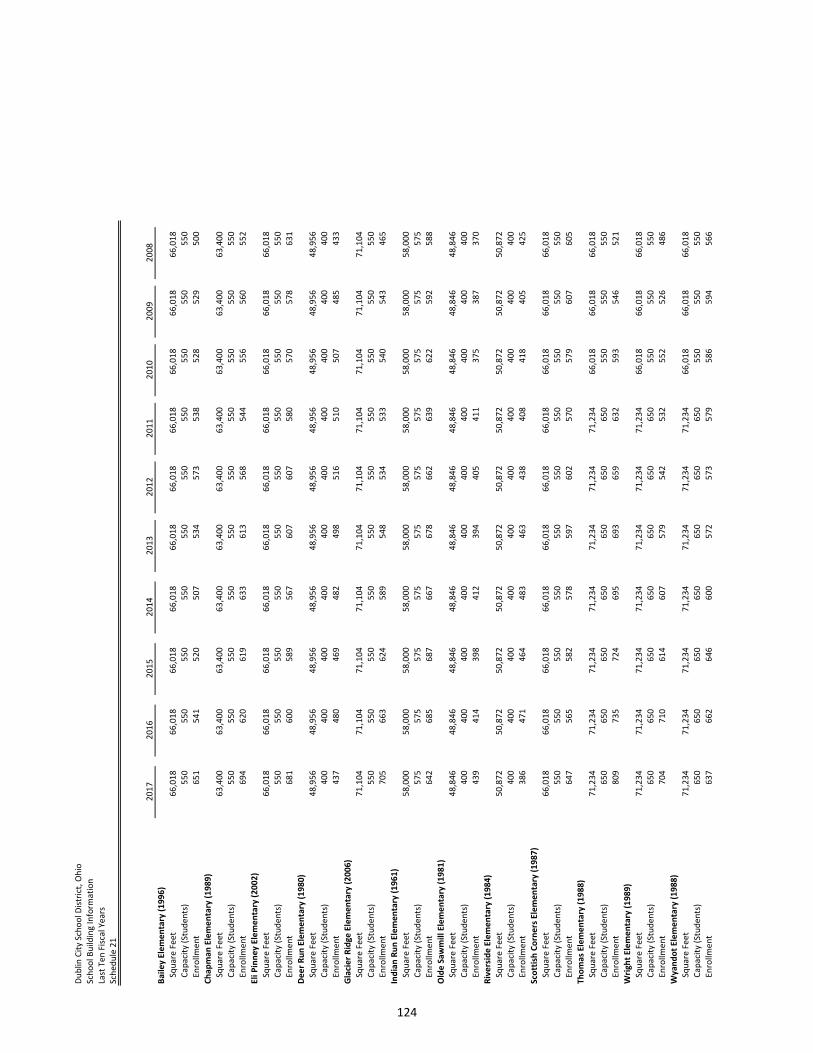
Du
blin
Cit
y Sc
ho
ol D
istr
ict,
Oh
io
Sch
oo
l Bu
ildin
g I
nfo
rma
tio
n
Last
Te
n F
isca
l Ye
ars
Sch
ed
ule
21
20
17
20
16
20
15
20
14
20
13
20
12
20
11
20
10
20
09
20
08
Ba
ile
y E
lem
en
tary
(1
99
6)
Sq
ua
re F
ee
t6
6,0
18
6
6,0
18
6
6,0
18
6
6,0
18
6
6,0
18
6
6,0
18
6
6,0
18
6
6,0
18
6
6,0
18
6
6,0
18
C
ap
aci
ty (
Stu
de
nts
)5
50
5
50
5
50
5
50
5
50
5
50
5
50
5
50
5
50
5
50
E
nro
llme
nt
65
1
54
1
52
0
50
7
53
4
57
3
53
8
52
8
52
9
50
0
Ch
ap
ma
n E
lem
en
tary
(1
98
9)
Sq
ua
re F
ee
t6
3,4
00
63
,40
06
3,4
00
63
,40
06
3,4
00
63
,40
06
3,4
00
63
,40
06
3,4
00
63
,40
0
C
ap
aci
ty (
Stu
de
nts
)5
50
55
05
50
55
05
50
55
05
50
55
05
50
55
0
E
nro
llme
nt
69
46
20
61
96
33
61
35
68
54
45
56
56
05
52
Eli
Pin
ne
y E
lem
en
tary
(2
00
2)
Sq
ua
re F
ee
t6
6,0
18
66
,01
86
6,0
18
66
,01
86
6,0
18
66
,01
86
6,0
18
66
,01
86
6,0
18
66
,01
8
C
ap
aci
ty (
Stu
de
nts
)5
50
55
05
50
55
05
50
55
05
50
55
05
50
55
0
E
nro
llme
nt
68
16
00
58
95
67
60
76
07
58
05
70
57
86
31
De
er
Ru
n E
lem
en
tary
(1
98
0)
Sq
ua
re F
ee
t4
8,9
56
48
,95
64
8,9
56
48
,95
64
8,9
56
48
,95
64
8,9
56
48
,95
64
8,9
56
48
,95
6
C
ap
aci
ty (
Stu
de
nts
)4
00
40
04
00
40
04
00
40
04
00
40
04
00
40
0
E
nro
llme
nt
43
74
80
46
94
82
49
85
16
51
05
07
48
54
33
Gla
cie
r R
idg
e E
lem
en
tary
(2
00
6)
Sq
ua
re F
ee
t7
1,1
04
71
,10
47
1,1
04
71
,10
47
1,1
04
71
,10
47
1,1
04
71
,10
47
1,1
04
71
,10
4
C
ap
aci
ty (
Stu
de
nts
)5
50
55
05
50
55
05
50
55
05
50
55
05
50
55
0
E
nro
llme
nt
70
56
63
62
45
89
54
85
34
53
35
40
54
34
65
Ind
ian
Ru
n E
lem
en
tary
(1
96
1)
Sq
ua
re F
ee
t5
8,0
00
58
,00
05
8,0
00
58
,00
05
8,0
00
58
,00
05
8,0
00
58
,00
05
8,0
00
58
,00
0
C
ap
aci
ty (
Stu
de
nts
)5
75
57
55
75
57
55
75
57
55
75
57
55
75
57
5
E
nro
llme
nt
64
26
85
68
76
67
67
86
62
63
96
22
59
25
88
Old
e S
aw
mil
l E
lem
en
tary
(1
98
1)
Sq
ua
re F
ee
t4
8,8
46
48
,84
64
8,8
46
48
,84
64
8,8
46
48
,84
64
8,8
46
48
,84
64
8,8
46
48
,84
6
C
ap
aci
ty (
Stu
de
nts
)4
00
40
04
00
40
04
00
40
04
00
40
04
00
40
0
E
nro
llme
nt
43
94
14
39
84
12
39
44
05
41
13
75
38
73
70
Riv
ers
ide
Ele
me
nta
ry (
19
84
)
Sq
ua
re F
ee
t5
0,8
72
50
,87
25
0,8
72
50
,87
25
0,8
72
50
,87
25
0,8
72
50
,87
25
0,8
72
50
,87
2
C
ap
aci
ty (
Stu
de
nts
)4
00
40
04
00
40
04
00
40
04
00
40
04
00
40
0
E
nro
llme
nt
38
64
71
46
44
83
46
34
38
40
84
18
40
54
25
Sco
ttis
h C
orn
ers
Ele
me
nta
ry (
19
87
)
Sq
ua
re F
ee
t6
6,0
18
66
,01
86
6,0
18
66
,01
86
6,0
18
66
,01
86
6,0
18
66
,01
86
6,0
18
66
,01
8
C
ap
aci
ty (
Stu
de
nts
)5
50
55
05
50
55
05
50
55
05
50
55
05
50
55
0
E
nro
llme
nt
64
75
65
58
25
78
59
76
02
57
05
79
60
76
05
Th
om
as
Ele
me
nta
ry (
19
88
)
Sq
ua
re F
ee
t7
1,2
34
71
,23
47
1,2
34
71
,23
47
1,2
34
71
,23
47
1,2
34
66
,01
86
6,0
18
66
,01
8
C
ap
aci
ty (
Stu
de
nts
)6
50
65
06
50
65
06
50
65
06
50
55
05
50
55
0
E
nro
llme
nt
80
97
35
72
46
95
69
36
59
63
25
93
54
65
21
Wri
gh
t E
lem
en
tary
(1
98
9)
Sq
ua
re F
ee
t7
1,2
34
71
,23
47
1,2
34
71
,23
47
1,2
34
71
,23
47
1,2
34
66
,01
86
6,0
18
66
,01
8
C
ap
aci
ty (
Stu
de
nts
)6
50
65
06
50
65
06
50
65
06
50
55
05
50
55
0
E
nro
llme
nt
70
47
10
61
46
07
57
95
42
53
25
52
52
64
86
Wy
an
do
t E
lem
en
tary
(1
98
8)
Sq
ua
re F
ee
t7
1,2
34
71
,23
47
1,2
34
71
,23
47
1,2
34
71
,23
47
1,2
34
66
,01
86
6,0
18
66
,01
8
C
ap
aci
ty (
Stu
de
nts
)6
50
65
06
50
65
06
50
65
06
50
55
05
50
55
0
E
nro
llme
nt
63
76
62
64
66
00
57
25
73
57
95
86
59
45
66
124
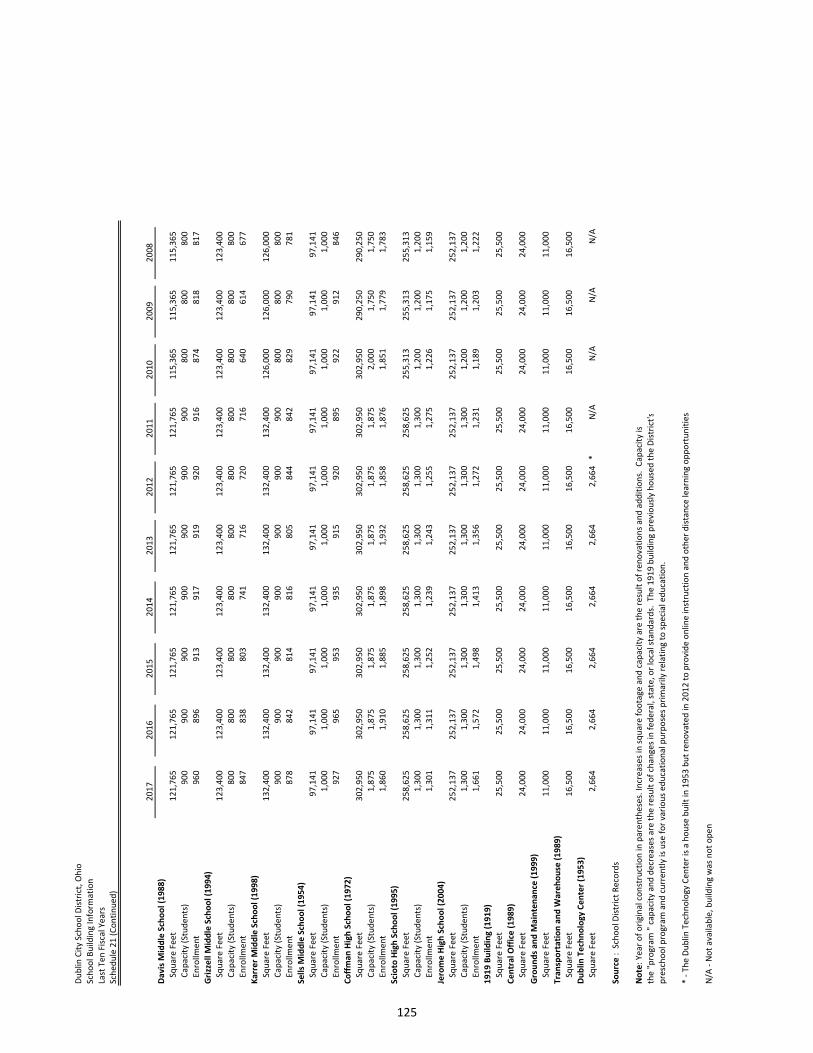
Du
blin
Cit
y Sc
ho
ol D
istr
ict,
Oh
io
Sch
oo
l Bu
ildin
g I
nfo
rma
tio
n
Last
Te
n F
isca
l Ye
ars
Sch
ed
ule
21
(C
on
tin
ue
d)
20
17
20
16
20
15
20
14
20
13
20
12
20
11
20
10
20
09
20
08
Da
vis
Mid
dle
Sch
oo
l (1
98
8)
Sq
ua
re F
ee
t1
21
,76
51
21
,76
51
21
,76
51
21
,76
51
21
,76
51
21
,76
51
21
,76
51
15
,36
51
15
,36
51
15
,36
5
C
ap
aci
ty (
Stu
de
nts
)9
00
90
09
00
90
09
00
90
09
00
80
08
00
80
0
E
nro
llme
nt
96
08
96
91
39
17
91
99
20
91
68
74
81
88
17
Gri
zze
ll M
idd
le S
cho
ol
(19
94
)
Sq
ua
re F
ee
t1
23
,40
01
23
,40
01
23
,40
01
23
,40
01
23
,40
01
23
,40
01
23
,40
01
23
,40
01
23
,40
01
23
,40
0
C
ap
aci
ty (
Stu
de
nts
)8
00
80
08
00
80
08
00
80
08
00
80
08
00
80
0
E
nro
llme
nt
84
78
38
80
37
41
71
67
20
71
66
40
61
46
77
Ka
rre
r M
idd
le S
cho
ol
(19
98
)
Sq
ua
re F
ee
t1
32
,40
01
32
,40
01
32
,40
01
32
,40
01
32
,40
01
32
,40
01
32
,40
01
26
,00
01
26
,00
01
26
,00
0
C
ap
aci
ty (
Stu
de
nts
)9
00
90
09
00
90
09
00
90
09
00
80
08
00
80
0
E
nro
llme
nt
87
88
42
81
48
16
80
58
44
84
28
29
79
07
81
Se
lls
Mid
dle
Sch
oo
l (1
95
4)
Sq
ua
re F
ee
t9
7,1
41
97
,14
19
7,1
41
97
,14
19
7,1
41
97
,14
19
7,1
41
97
,14
19
7,1
41
97
,14
1
C
ap
aci
ty (
Stu
de
nts
)1
,00
01
,00
01
,00
01
,00
01
,00
01
,00
01
,00
01
,00
01
,00
01
,00
0
E
nro
llme
nt
92
79
65
95
39
35
91
59
20
89
59
22
91
28
46
Co
ffm
an
Hig
h S
cho
ol
(19
72
)
Sq
ua
re F
ee
t3
02
,95
03
02
,95
03
02
,95
03
02
,95
03
02
,95
03
02
,95
03
02
,95
03
02
,95
02
90
,25
02
90
,25
0
C
ap
aci
ty (
Stu
de
nts
)1
,87
51
,87
51
,87
51
,87
51
,87
51
,87
51
,87
52
,00
01
,75
01
,75
0
E
nro
llme
nt
1,8
60
1,9
10
1,8
85
1,8
98
1,9
32
1,8
58
1,8
76
1,8
51
1,7
79
1,7
83
Sci
oto
Hig
h S
cho
ol
(19
95
)
Sq
ua
re F
ee
t2
58
,62
52
58
,62
52
58
,62
52
58
,62
52
58
,62
52
58
,62
52
58
,62
52
55
,31
32
55
,31
32
55
,31
3
C
ap
aci
ty (
Stu
de
nts
)1
,30
01
,30
01
,30
01
,30
01
,30
01
,30
01
,30
01
,20
01
,20
01
,20
0
E
nro
llme
nt
1,3
01
1,3
11
1,2
52
1,2
39
1,2
43
1,2
55
1,2
75
1,2
26
1,1
75
1,1
59
Jero
me
Hig
h S
cho
ol
(20
04
)
Sq
ua
re F
ee
t2
52
,13
72
52
,13
72
52
,13
72
52
,13
72
52
,13
72
52
,13
72
52
,13
72
52
,13
72
52
,13
72
52
,13
7
C
ap
aci
ty (
Stu
de
nts
)1
,30
01
,30
01
,30
01
,30
01
,30
01
,30
01
,30
01
,20
01
,20
01
,20
0
E
nro
llme
nt
1,6
61
1,5
72
1,4
98
1,4
13
1,3
56
1,2
72
1,2
31
1,1
89
1,2
03
1,2
22
19
19
Bu
ild
ing
(1
91
9)
Sq
ua
re F
ee
t2
5,5
00
25
,50
02
5,5
00
25
,50
02
5,5
00
25
,50
02
5,5
00
25
,50
02
5,5
00
25
,50
0
Ce
ntr
al
Off
ice
(1
98
9)
Sq
ua
re F
ee
t2
4,0
00
24
,00
02
4,0
00
24
,00
02
4,0
00
24
,00
02
4,0
00
24
,00
02
4,0
00
24
,00
0
Gro
un
ds
an
d M
ain
ten
an
ce (
19
99
)
Sq
ua
re F
ee
t1
1,0
00
11
,00
01
1,0
00
11
,00
01
1,0
00
11
,00
01
1,0
00
11
,00
01
1,0
00
11
,00
0
Tra
nsp
ort
ati
on
an
d W
are
ho
use
(1
98
9)
Sq
ua
re F
ee
t1
6,5
00
16
,50
01
6,5
00
16
,50
01
6,5
00
16
,50
01
6,5
00
16
,50
01
6,5
00
16
,50
0
Du
bli
n T
ech
no
log
y C
en
ter
(19
53
)
Sq
ua
re F
ee
t2
,66
42
,66
42
,66
42
,66
42
,66
42
,66
4*
N/A
N/A
N/A
N/A
So
urc
e :
Sch
oo
l Dis
tric
t R
eco
rds
No
te:
Ye
ar
of
ori
gin
al c
on
stru
ctio
n in
pa
ren
the
ses.
In
cre
ase
s in
sq
ua
re f
oo
tag
e a
nd
ca
pa
city
are
th
e r
esu
lt o
f re
no
vati
on
s a
nd
ad
dit
ion
s. C
ap
aci
ty is
the
"p
rog
ram
" c
ap
aci
ty a
nd
de
cre
ase
s a
re t
he
re
sult
of
cha
ng
es
in f
ed
era
l, s
tate
, o
r lo
cal s
tan
da
rds.
Th
e 1
91
9 b
uild
ing
pre
vio
usl
y h
ou
sed
th
e D
istr
ict'
s
pre
sch
oo
l pro
gra
m a
nd
cu
rre
ntl
y is
use
fo
r va
rio
us
ed
uca
tio
na
l pu
rpo
ses
pri
ma
rily
re
lati
ng
to
sp
eci
al e
du
cati
on
.
* -
Th
e D
ub
lin T
ech
no
log
y C
en
ter
is a
ho
use
bu
ilt in
19
53
bu
t re
no
vate
d in
20
12
to
pro
vid
e o
nlin
e in
stru
ctio
n a
nd
oth
er
dis
tan
ce le
arn
ing
op
po
rtu
nit
ies.
N/A
- N
ot
ava
ilab
le,
bu
ildin
g w
as
no
t o
pe
n
125
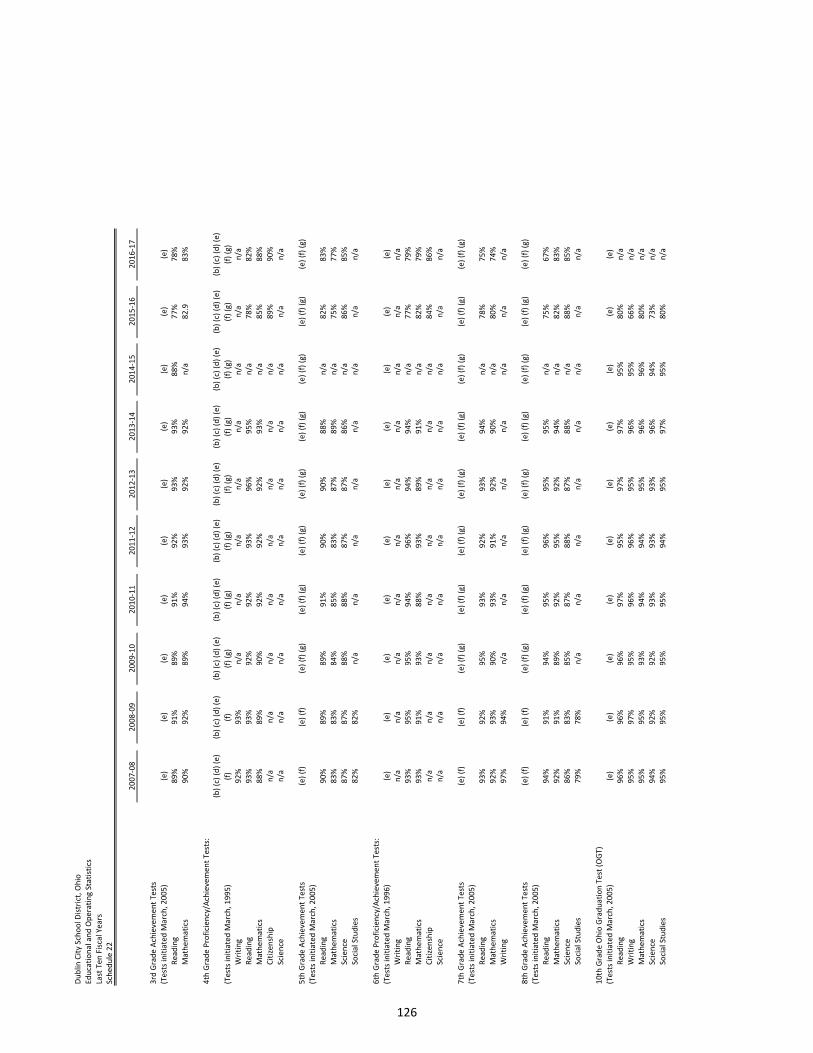
Du
blin
Cit
y Sc
ho
ol D
istr
ict,
Oh
io
Ed
uca
tio
na
l an
d O
pe
rati
ng
Sta
tist
ics
Last
Te
n F
isca
l Ye
ars
Sch
ed
ule
22
20
07
-08
20
08
-09
20
09
-10
20
10
-11
20
11
-12
20
12
-13
20
13
-14
20
14
-15
20
15
-16
20
16
-17
3rd
Gra
de
Ach
ieve
me
nt
Te
sts
(Te
sts
init
iate
d M
arc
h,
20
05
)(e
)(e
)(e
)(e
)(e
)(e
)(e
)(e
)(e
)(e
)
R
ea
din
g8
9%
91
%8
9%
91
%9
2%
93
%9
3%
88
%7
7%
78
%
M
ath
em
ati
cs9
0%
92
%8
9%
94
%9
3%
92
%9
2%
n/a
82
.98
3%
4th
Gra
de
Pro
fici
en
cy/A
chie
vem
en
t T
est
s:
(Te
sts
init
iate
d M
arc
h,
19
95
)
(b)
(c)
(d)
(e)
(f)
(b)
(c)
(d)
(e)
(f)
(b)
(c)
(d)
(e)
(f)
(g)
(b)
(c)
(d)
(e)
(f)
(g)
(b)
(c)
(d)
(e)
(f)
(g)
(b)
(c)
(d)
(e)
(f)
(g)
(b)
(c)
(d)
(e)
(f)
(g)
(b)
(c)
(d)
(e)
(f)
(g)
(b)
(c)
(d)
(e)
(f)
(g)
(b)
(c)
(d)
(e)
(f)
(g)
W
riti
ng
92
%9
3%
n/a
n/a
n/a
n/a
n/a
n/a
n/a
n/a
R
ea
din
g9
3%
93
%9
2%
92
%9
3%
96
%9
5%
n/a
78
%8
2%
M
ath
em
ati
cs8
8%
89
%9
0%
92
%9
2%
92
%9
3%
n/a
85
%8
8%
C
itiz
en
ship
n/a
n/a
n/a
n/a
n/a
n/a
n/a
n/a
89
%9
0%
S
cie
nce
n/a
n/a
n/a
n/a
n/a
n/a
n/a
n/a
n/a
n/a
5th
Gra
de
Ach
ieve
me
nt
Te
sts
(e)
(f)
(e)
(f)
(e)
(f)
(g)
(e)
(f)
(g)
(e)
(f)
(g)
(e)
(f)
(g)
(e)
(f)
(g)
(e)
(f)
(g)
(e)
(f)
(g)
(e)
(f)
(g)
(Te
sts
init
iate
d M
arc
h,
20
05
)
R
ea
din
g9
0%
89
%8
9%
91
%9
0%
90
%8
8%
n/a
82
%8
3%
M
ath
em
ati
cs8
3%
83
%8
4%
85
%8
3%
87
%8
9%
n/a
75
%7
7%
S
cie
nce
87
%8
7%
88
%8
8%
87
%8
7%
86
%n
/a8
6%
85
%
S
oci
al S
tud
ies
82
%8
2%
n/a
n/a
n/a
n/a
n/a
n/a
n/a
n/a
6th
Gra
de
Pro
fici
en
cy/A
chie
vem
en
t T
est
s:
(Te
sts
init
iate
d M
arc
h,
19
96
)(e
)(e
)(e
)(e
)(e
)(e
)(e
)(e
)(e
)(e
)
W
riti
ng
n/a
n/a
n/a
n/a
n/a
n/a
n/a
n/a
n/a
n/a
R
ea
din
g9
3%
95
%9
5%
94
%9
6%
94
%9
4%
n/a
77
%7
9%
M
ath
em
ati
cs9
3%
91
%9
3%
88
%9
3%
89
%9
1%
n/a
82
%7
9%
C
itiz
en
ship
n/a
n/a
n/a
n/a
n/a
n/a
n/a
n/a
84
%8
6%
S
cie
nce
n/a
n/a
n/a
n/a
n/a
n/a
n/a
n/a
n/a
n/a
7th
Gra
de
Ach
ieve
me
nt
Te
sts
(e)
(f)
(e)
(f)
(e)
(f)
(g)
(e)
(f)
(g)
(e)
(f)
(g)
(e)
(f)
(g)
(e)
(f)
(g)
(e)
(f)
(g)
(e)
(f)
(g)
(e)
(f)
(g)
(Te
sts
init
iate
d M
arc
h,
20
05
)
R
ea
din
g9
3%
92
%9
5%
93
%9
2%
93
%9
4%
n/a
78
%7
5%
M
ath
em
ati
cs9
2%
93
%9
0%
93
%9
1%
92
%9
0%
n/a
80
%7
4%
W
riti
ng
97
%9
4%
n/a
n/a
n/a
n/a
n/a
n/a
n/a
n/a
8th
Gra
de
Ach
ieve
me
nt
Te
sts
(e)
(f)
(e)
(f)
(e)
(f)
(g)
(e)
(f)
(g)
(e)
(f)
(g)
(e)
(f)
(g)
(e)
(f)
(g)
(e)
(f)
(g)
(e)
(f)
(g)
(e)
(f)
(g)
(Te
sts
init
iate
d M
arc
h,
20
05
)
R
ea
din
g9
4%
91
%9
4%
95
%9
6%
95
%9
5%
n/a
75
%6
7%
M
ath
em
ati
cs9
2%
91
%8
9%
92
%9
5%
92
%9
4%
n/a
82
%8
3%
S
cie
nce
86
%8
3%
85
%8
7%
88
%8
7%
88
%n
/a8
8%
85
%
S
oci
al S
tud
ies
79
%7
8%
n/a
n/a
n/a
n/a
n/a
n/a
n/a
n/a
10
th G
rad
e O
hio
Gra
du
ati
on
Te
st (
OG
T)
(Te
sts
init
iate
d M
arc
h,
20
05
)(e
)(e
)(e
)(e
)(e
)(e
)(e
)(e
)(e
)(e
)
R
ea
din
g9
6%
96
%9
6%
97
%9
5%
97
%9
7%
95
%8
0%
n/a
W
riti
ng
95
%9
7%
95
%9
6%
96
%9
5%
96
%9
5%
66
%n
/a
M
ath
em
ati
cs9
5%
95
%9
3%
94
%9
4%
95
%9
6%
96
%8
0%
n/a
S
cie
nce
94
%9
2%
92
%9
3%
93
%9
3%
96
%9
4%
73
%n
/a
S
oci
al S
tud
ies
95
%9
5%
95
%9
5%
94
%9
5%
97
%9
5%
80
%n
/a
126
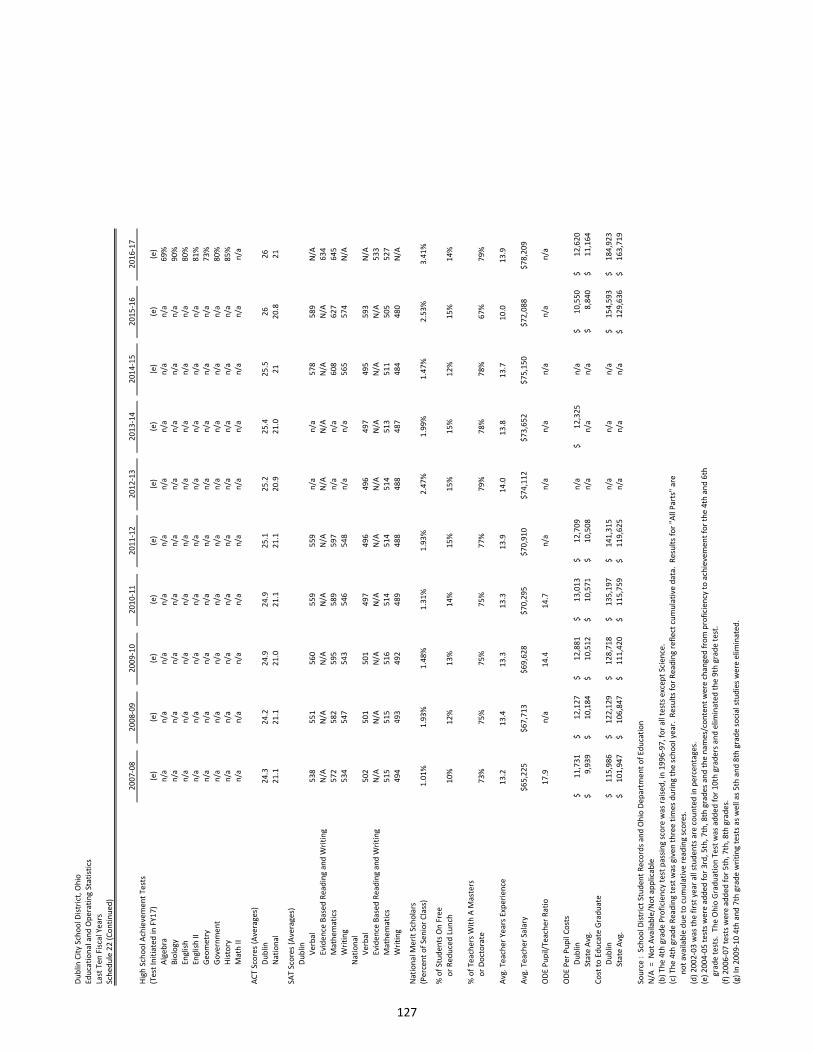
Du
blin
Cit
y Sc
ho
ol D
istr
ict,
Oh
io
Ed
uca
tio
na
l an
d O
pe
rati
ng
Sta
tist
ics
Last
Te
n F
isca
l Ye
ars
Sch
ed
ule
22
(C
on
tin
ue
d)
20
07
-08
20
08
-09
20
09
-10
20
10
-11
20
11
-12
20
12
-13
20
13
-14
20
14
-15
20
15
-16
20
16
-17
Hig
h S
cho
ol A
chie
vem
en
t T
est
s
(Te
st I
nit
iate
d in
FY
17
)(e
)(e
)(e
)(e
)(e
)(e
)(e
)(e
)(e
)(e
)
A
lge
bra
n/a
n/a
n/a
n/a
n/a
n/a
n/a
n/a
n/a
69
%
B
iolo
gy
n/a
n/a
n/a
n/a
n/a
n/a
n/a
n/a
n/a
90
%
E
ng
lish
n/a
n/a
n/a
n/a
n/a
n/a
n/a
n/a
n/a
80
%
E
ng
lish
II
n/a
n/a
n/a
n/a
n/a
n/a
n/a
n/a
n/a
81
%
G
eo
me
try
n/a
n/a
n/a
n/a
n/a
n/a
n/a
n/a
n/a
73
%
G
ove
rnm
en
tn
/an
/an
/an
/an
/an
/an
/an
/an
/a8
0%
H
isto
ryn
/an
/an
/an
/an
/an
/an
/an
/an
/a8
5%
M
ath
II
n/a
n/a
n/a
n/a
n/a
n/a
n/a
n/a
n/a
n/a
AC
T S
core
s (A
vera
ge
s)
D
ub
lin2
4.3
24
.22
4.9
24
.92
5.1
25
.22
5.4
25
.52
62
6
N
ati
on
al
21
.12
1.1
21
.02
1.1
21
.12
0.9
21
.02
12
0.8
21
SAT
Sco
res
(Ave
rag
es)
D
ub
lin
V
erb
al
53
85
51
56
05
59
55
9n
/an
/a5
78
58
9N
/A
E
vid
en
ce B
ase
d R
ea
din
g a
nd
Wri
tin
gN
/AN
/AN
/AN
/AN
/AN
/AN
/AN
/AN
/A6
34
M
ath
em
ati
cs5
72
58
25
95
58
95
97
n/a
n/a
60
86
27
64
5
W
riti
ng
53
45
47
54
35
46
54
8n
/an
/a5
65
57
4N
/A
N
ati
on
al
V
erb
al
50
25
01
50
14
97
49
64
96
49
74
95
59
3N
/A
E
vid
en
ce B
ase
d R
ea
din
g a
nd
Wri
tin
gN
/AN
/AN
/AN
/AN
/AN
/AN
/AN
/AN
/A5
33
M
ath
em
ati
cs5
15
51
55
16
51
45
14
51
45
13
51
15
05
52
7
W
riti
ng
49
44
93
49
24
89
48
84
88
48
74
84
48
0N
/A
Na
tio
na
l Me
rit
Sch
ola
rs
(Pe
rce
nt
of
Sen
ior
Cla
ss)
1.0
1%
1.9
3%
1.4
8%
1.3
1%
1.9
3%
2.4
7%
1.9
9%
1.4
7%
2.5
3%
3.4
1%
% o
f St
ud
en
ts O
n F
ree
o
r R
ed
uce
d L
un
ch1
0%
12
%1
3%
14
%1
5%
15
%1
5%
12
%1
5%
14
%
% o
f T
ea
che
rs W
ith
A M
ast
ers
o
r D
oct
ora
te7
3%
75
%7
5%
75
%7
7%
79
%7
8%
78
%6
7%
79
%
Avg
. T
ea
che
r Y
ea
rs E
xpe
rie
nce
13
.21
3.4
13
.31
3.3
13
.91
4.0
13
.81
3.7
10
.01
3.9
Avg
. T
ea
che
r Sa
lary
$6
5,2
25
$6
7,7
13
$6
9,6
28
$7
0,2
95
$7
0,9
10
$7
4,1
12
$7
3,6
52
$7
5,1
50
$7
2,0
88
$7
8,2
09
OD
E P
up
il/T
ea
che
r R
ati
o1
7.9
n/a
14
.41
4.7
n/a
n/a
n/a
n/a
n/a
n/a
OD
E P
er
Pu
pil
Co
sts
D
ub
lin1
1,7
31
$
12
,12
7$
1
2,8
81
$
13
,01
3$
1
2,7
09
$
n/a
12
,32
5$
n
/a1
0,5
50
$
12
,62
0$
St
ate
Avg
.9
,93
9$
10
,18
4$
1
0,5
12
$
10
,57
1$
1
0,5
08
$
n/a
n/a
n/a
8,8
40
$
1
1,1
64
$
Co
st t
o E
du
cate
Gra
du
ate
D
ub
lin1
15
,98
6$
1
22
,12
9$
1
28
,71
8$
1
35
,19
7$
1
41
,31
5$
n
/an
/an
/a1
54
,59
3$
1
84
,92
3$
St
ate
Avg
.1
01
,94
7$
1
06
,84
7$
1
11
,42
0$
1
15
,75
9$
1
19
,62
5$
n
/an
/an
/a1
29
,63
6$
1
63
,71
9$
Sou
rce
: S
cho
ol D
istr
ict
Stu
de
nt
Re
cord
s a
nd
Oh
io D
ep
art
me
nt
of
Ed
uca
tio
n
N/A
= N
ot
Ava
ilab
le/N
ot
ap
plic
ab
le
(b)
Th
e 4
th g
rad
e P
rofi
cie
ncy
te
st p
ass
ing
sco
re w
as
rais
ed
, in
19
96
-97
, fo
r a
ll te
sts
exc
ep
t Sc
ien
ce.
(c)
Th
e 4
th g
rad
e R
ea
din
g t
est
wa
s g
ive
n t
hre
e t
ime
s d
uri
ng
th
e s
cho
ol y
ea
r. R
esu
lts
for
Re
ad
ing
re
fle
ct c
um
ula
tive
da
ta.
Re
sult
s fo
r "A
ll P
art
s" a
re
n
ot
ava
ilab
le d
ue
to
cu
mu
lati
ve r
ea
din
g s
core
s.
(d)
20
02
-03
wa
s th
e f
irst
ye
ar
all
stu
de
nts
are
co
un
ted
in p
erc
en
tag
es.
(e)
20
04
-05
te
sts
we
re a
dd
ed
fo
r 3
rd,
5th
, 7
th,
8th
gra
de
s a
nd
th
e n
am
es/
con
ten
t w
ere
ch
an
ge
d f
rom
pro
fici
en
cy t
o a
chie
vem
en
t fo
r th
e 4
th a
nd
6th
g
rad
e t
est
s. T
he
Oh
io G
rad
ua
tio
n T
est
wa
s a
dd
ed
fo
r 1
0th
gra
de
rs a
nd
elim
ina
ted
th
e 9
th g
rad
e t
est
.
(f)
20
06
-07
te
sts
we
re a
dd
ed
fo
r 5
th,
7th
, 8
th g
rad
es.
(g)
In 2
00
9-1
0 4
th a
nd
7th
gra
de
wri
tin
g t
est
s a
s w
ell
as
5th
an
d 8
th g
rad
e s
oci
al s
tud
ies
we
re e
limin
ate
d.
127

128
Top Related