


Languages
Pages
Legal

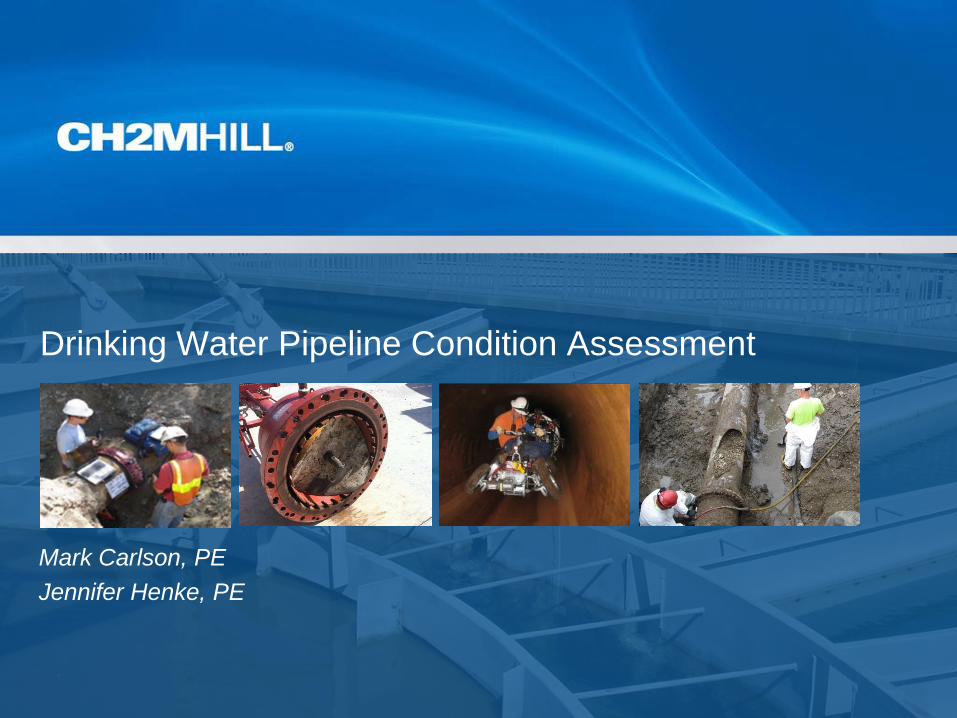
Drinking Water Pipeline Condition Assessment
Mark Carlson, PE
Jennifer Henke, PE

Agenda
Agenda
Introductions
Market Drivers and Opportunities
Approaches to Condition Assessment
– Prioritization Methods
– Field Technologies
Rehabilitation Alternatives
Additional Resources

1. Introductions
Jennifer Henke
Jerry Duppong
Dan Buonadonna
Mark Carlson

1. Introductions
2. What’s Driving Condition Assessment?
3. General Condition Assessment Approach • Prioritization Methods
• Field Technologies
4. Rehabilitation Alternatives
5. Additional Resources

2. What’s Driving Condition Assessment
Understanding the benefits of condition assessment
Establish strategies to meet these challenges
Where do I focus repairing/replacing my aging infrastructure
What’s the Performance of my system?

Understanding Historical Performance
What kinds of failures have occurred, in what kinds of pipe,
when, and where

Predicting the Future
Infrastructure Funding Gap (IFG) to maintain/replace
deteriorating assets
– ASCE Report Card: D-
– EPA estimate: $338 billion over 20 years
– AWWA estimate: $1.7 trillion by 2050

Determining Specific Drivers and Strategies
Compare your system against the historical examples and any
current issues, what will be your condition assessment drivers?
– Customers
• Pressure drops
• Future capacity
– Lost revenue
• Leak detection
– Asset management
• Corrosion mitigation
• Correct improper construction/materials

Quantifying Benefits of Condition Assessment
Cost of Failure
“Just in Time”
Renewal
How did we get here…?
Gradual infrastructure deterioration
Customers have become accustomed to low costs for water utility
services
Buried systems have difficulty competing for public funds against
“visible” infrastructure
1. Introductions
2. Market Drivers and Opportunities
3. Approaches to Condition Assessment • Prioritization Methods
• Field Technologies
4. Rehabilitation Alternatives
5. Additional Resources

3. Approaches to Condition Assessment
Goals of this section:
– Outline of alternative program strategies and prioritization methods
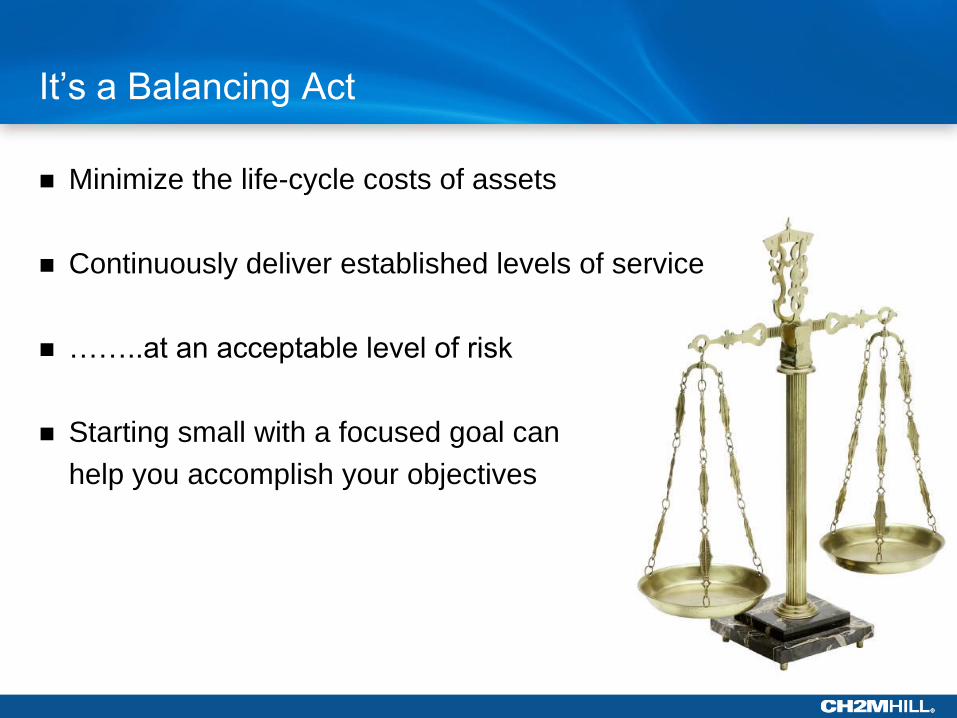
It’s a Balancing Act
Minimize the life-cycle costs of assets
Continuously deliver established levels of service
……..at an acceptable level of risk
Starting small with a focused goal can
help you accomplish your objectives
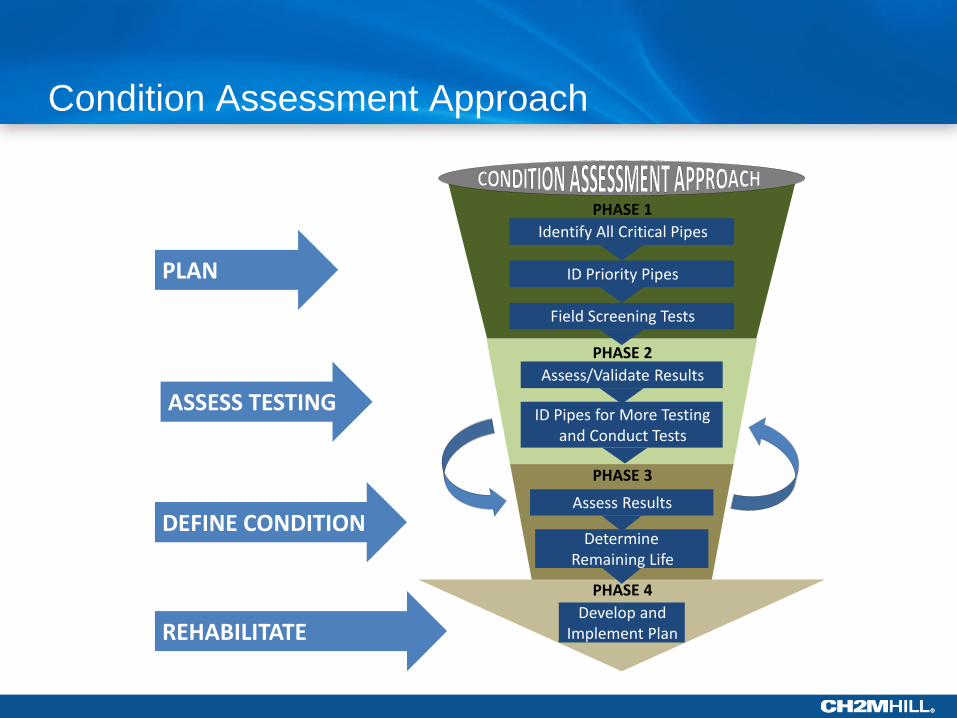
Condition Assessment Approach
PHASE 1
PHASE 2
PHASE 3
PHASE 4
Identify All Critical Pipes
ID Priority Pipes
Field Screening Tests
PLAN
Assess/Validate Results
ID Pipes for More Testing and Conduct Tests
ASSESS TESTING
Assess Results
Determine Remaining Life
DEFINE CONDITION
Develop and Implement Plan REHABILITATE
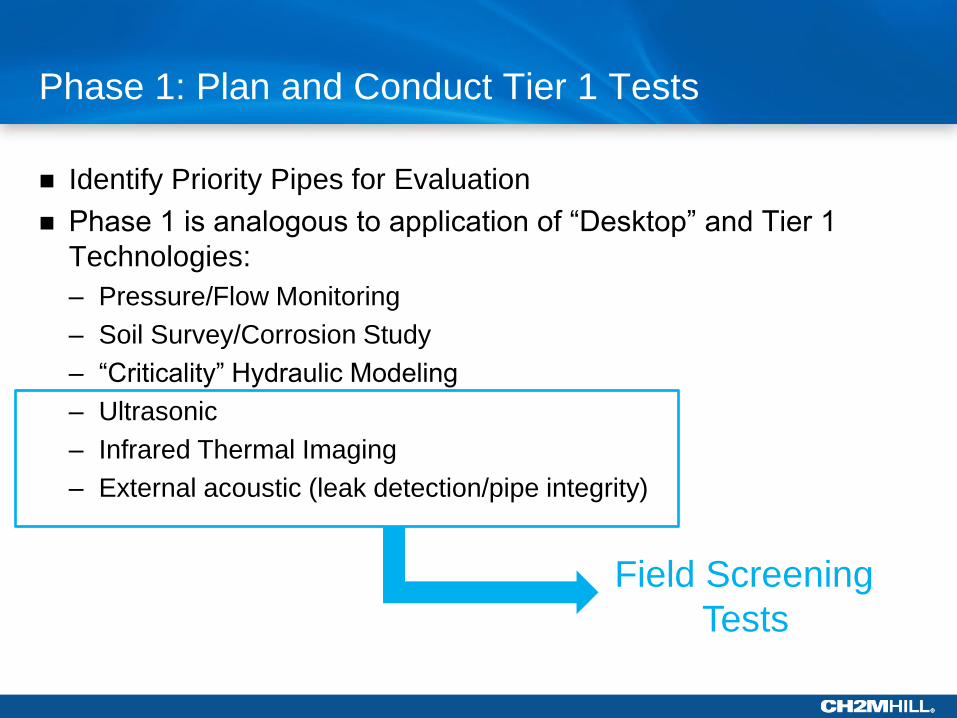
Phase 1: Plan and Conduct Tier 1 Tests
Identify Priority Pipes for Evaluation
Phase 1 is analogous to application of “Desktop” and Tier 1
Technologies:
– Pressure/Flow Monitoring
– Soil Survey/Corrosion Study
– “Criticality” Hydraulic Modeling
– Ultrasonic
– Infrared Thermal Imaging
– External acoustic (leak detection/pipe integrity)
Field Screening
Tests
Phase1 – Priority Pipes through Threat Identification (Desktop Study)
Identify the specific vectors that may compromise the reliability of
a specific cast iron pipe asset or a cohort of pipes
Be creative – study every angle – think bad thoughts
Use all available resources – as-builts, plat cards, route walks,
institutional knowledge, operating records, soil maps, GIS, etc
Internal, External, and Operational

Example Threats
INTERNAL Deteriorated Cement Mortar
Lining (CML)
Corrosion from aggressive
pumped media (salinity, pH,
dissolved oxygen)
Deflected joints that leak
Previous joint seals have failed
Deflected pipe from external
loads
EXTERNAL Corrosive soils
Stray currents
3rd Party damage
Wheel / rail loads resulting in
settlement or brittle fracture
Example Operational Threats
Waterhammer
Lost blow-offs
Failed air release valves
Frozen valves
Red water complaints in potable lines

Phase 1: Desktop Study
Identify facilities/
pipelines at risk
from threat analysis
Summarize historical
information and develop
pipe groups/cohorts
Consider
– System Break History
– Pipeline Condition Assessments
– Future Demand
– Leak Detection
– Water Loss
0
20
40
60
80
100
120
140
160
180
200
Unknown < 1950 1950 - 1970 1970 - 1990 > 1990
Mile
s o
f P
ipe
Year of Installation

Threat identification linked to Risk Assessment and Sample Likelihood and Consequence Criteria
Likelihood Criteria
Age (e.g. ductile iron pipes are newer with a low likelihood of failure)
Material Type (e.g. ductile iron pipe have a low likelihood of failure)
Within known or potential slide area
Within liquefaction area
Within corrosive soil area
Within historical landfill area
High historical pipe leak rate
High pipe pressure
Prior above-ground or below-ground construction activities near water mains
Consequence Criteria
High impact water outage
Near or under a sensitive water body (creek, river, lake, or Puget Sound)
Within wetland-designated area
Under a major transportation corridor (freeway, highway, major arterial road)
Under active and high usage railroad tracks
Attached to a bridge
Inside a tunnel or Utilidor
Within known or potential slide area
Within Central Business District (CBD)
Under a high-density residential, industrial, or commercial building
Pressure variation
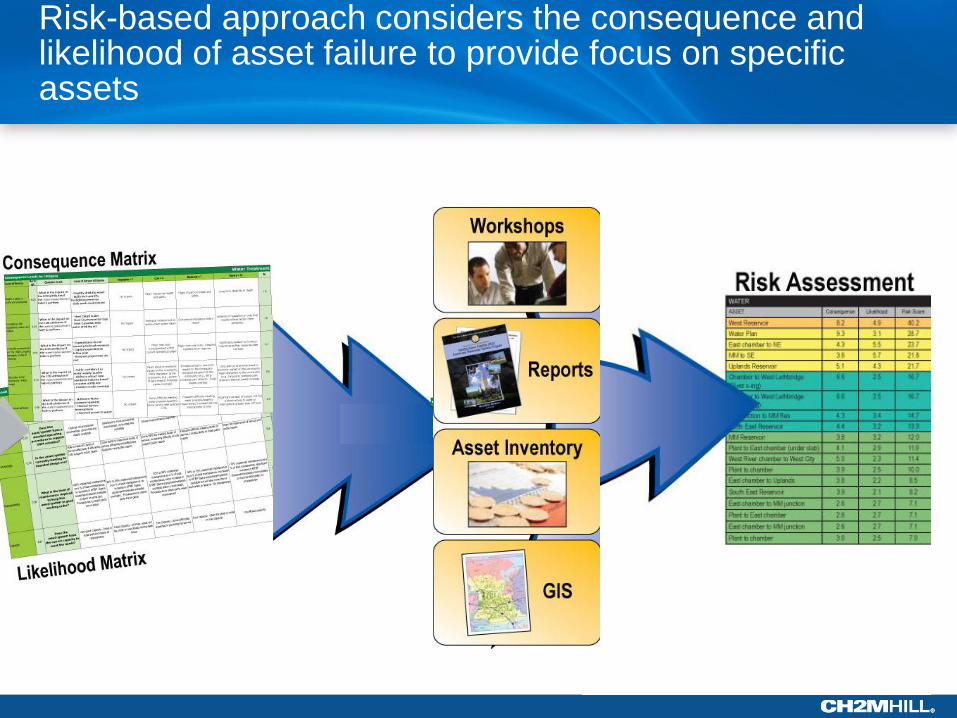
Risk-based approach considers the consequence and likelihood of asset failure to provide focus on specific assets

Risk-based approach considers the consequence and likelihood of asset failure to accurately prioritize projects
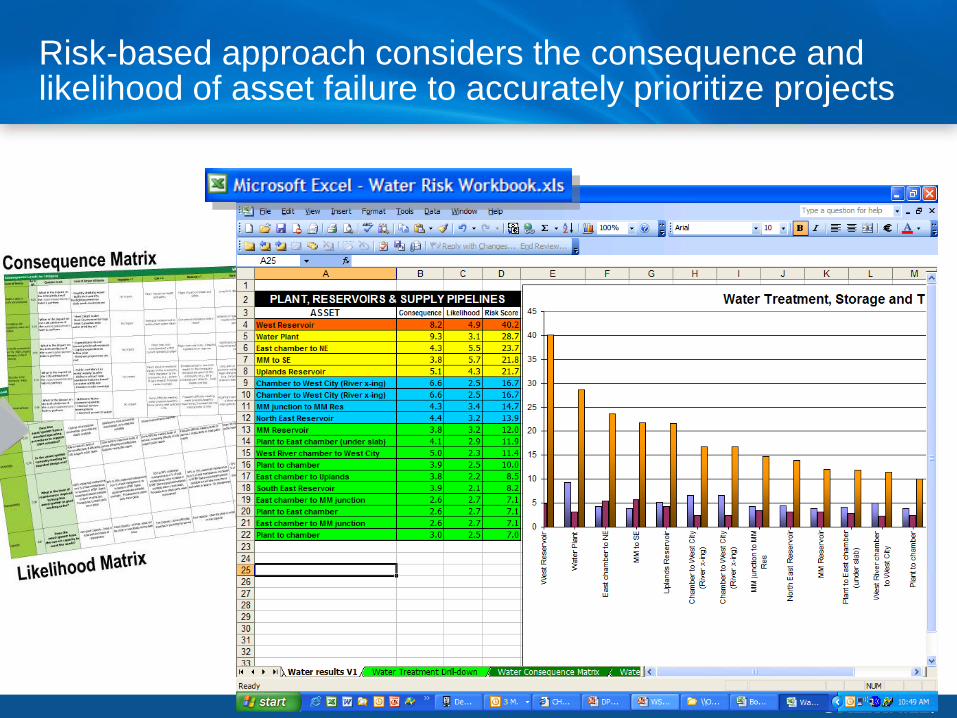
Risk-based approach considers the consequence and likelihood of asset failure to accurately prioritize projects

Pipeline Renewal Decision Process
Asset
inventory and
condition data
review
Is there
enough
data?
Regression
analysis to
predict future
breaks
Use surrogate
data to predict
future failiure
Predictive
Modeling (e.g.
Risk-Based;
KANEW)
No
Yes
Condition
Assessment
Renewal
Options
PIPELINE RENEWAL DECISION PROCESS
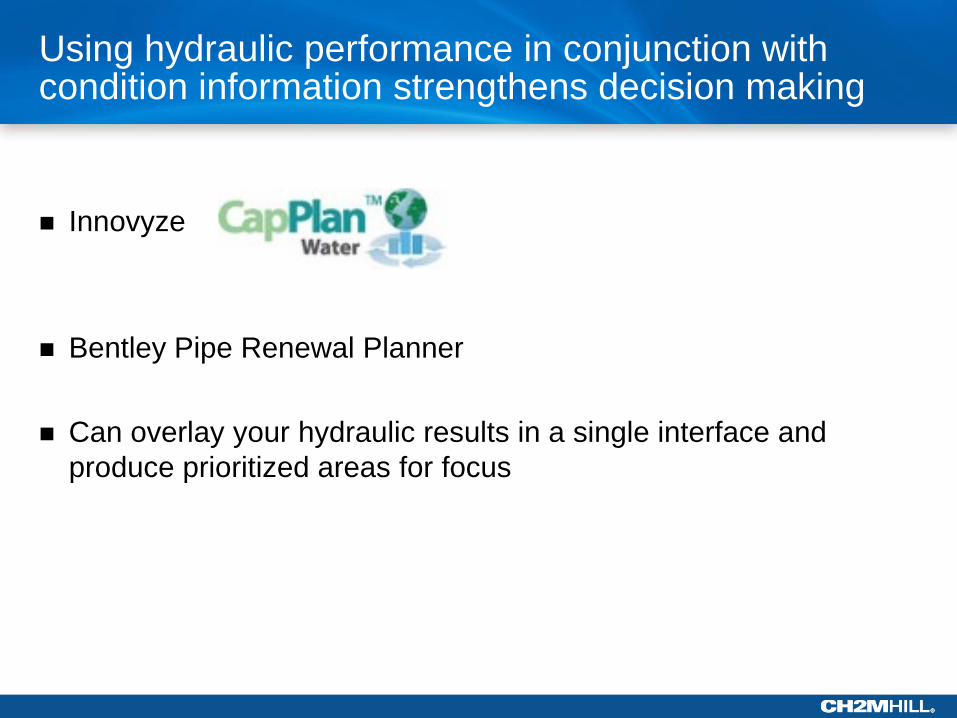
Using hydraulic performance in conjunction with condition information strengthens decision making
Innovyze
Bentley Pipe Renewal Planner
Can overlay your hydraulic results in a single interface and
produce prioritized areas for focus

CapPlan (Innovyze) Setup Likelihood and Consequence of Failure

CapPlan (Innovyze) Risk Results
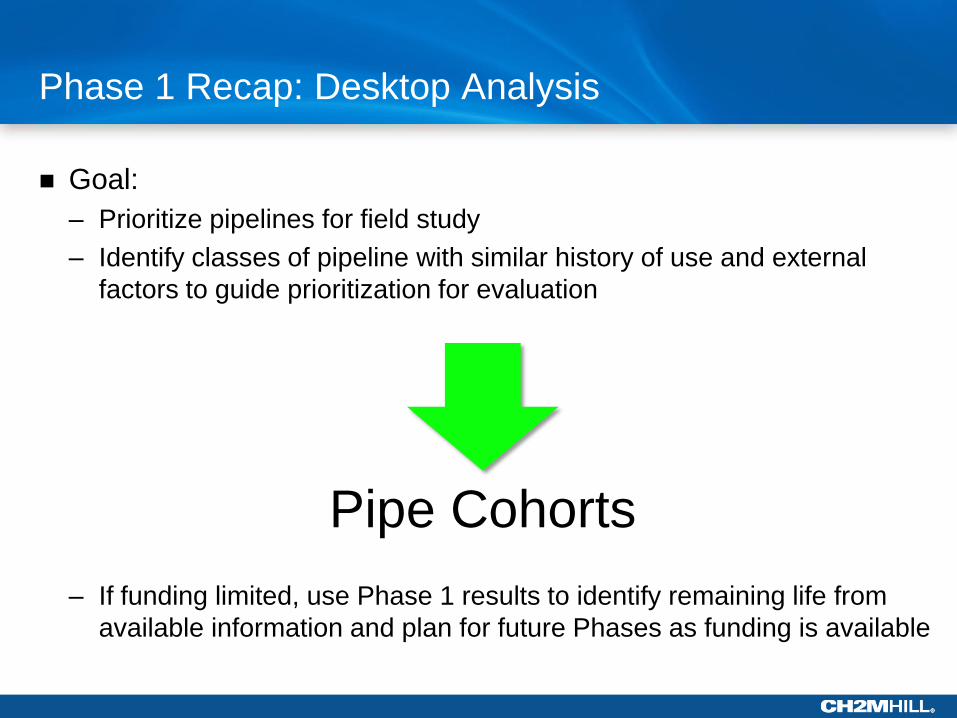
Phase 1 Recap: Desktop Analysis
Goal:
– Prioritize pipelines for field study
– Identify classes of pipeline with similar history of use and external
factors to guide prioritization for evaluation
– If funding limited, use Phase 1 results to identify remaining life from
available information and plan for future Phases as funding is available
Pipe Cohorts
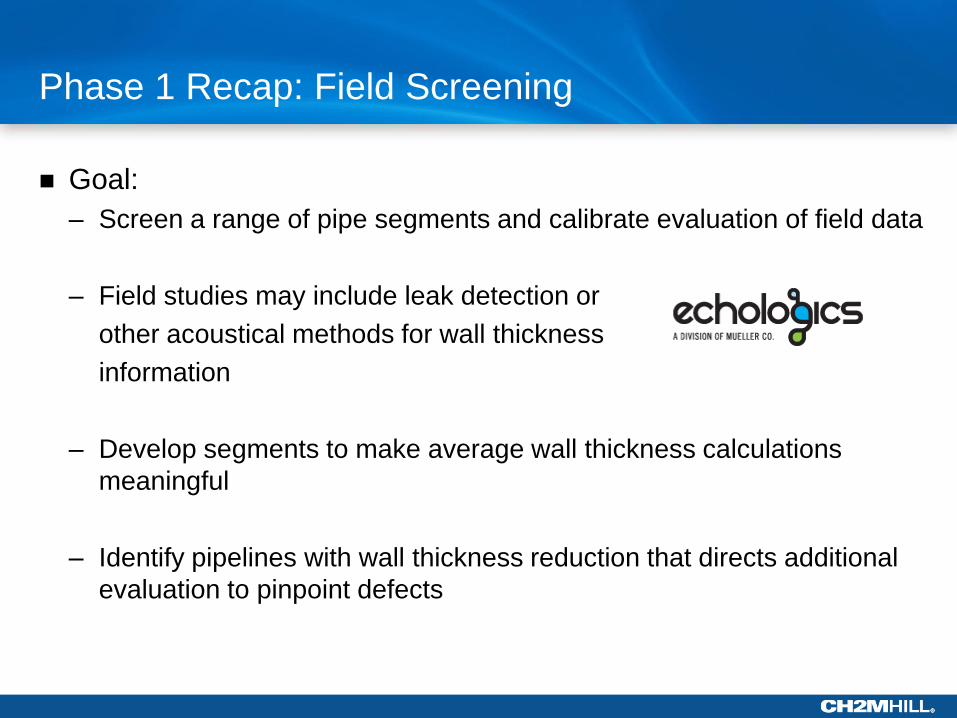
Phase 1 Recap: Field Screening
Goal:
– Screen a range of pipe segments and calibrate evaluation of field data
– Field studies may include leak detection or
other acoustical methods for wall thickness
information
– Develop segments to make average wall thickness calculations
meaningful
– Identify pipelines with wall thickness reduction that directs additional
evaluation to pinpoint defects
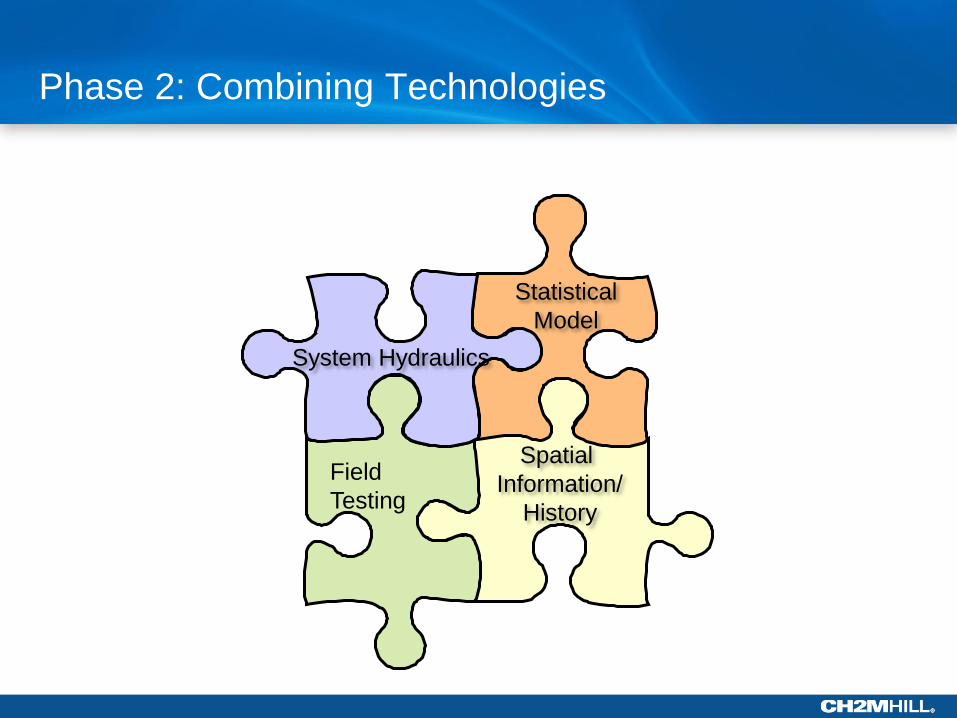
Phase 2: Combining Technologies
Field
Testing
Spatial
Information/
History
Statistical
Model
System Hydraulics
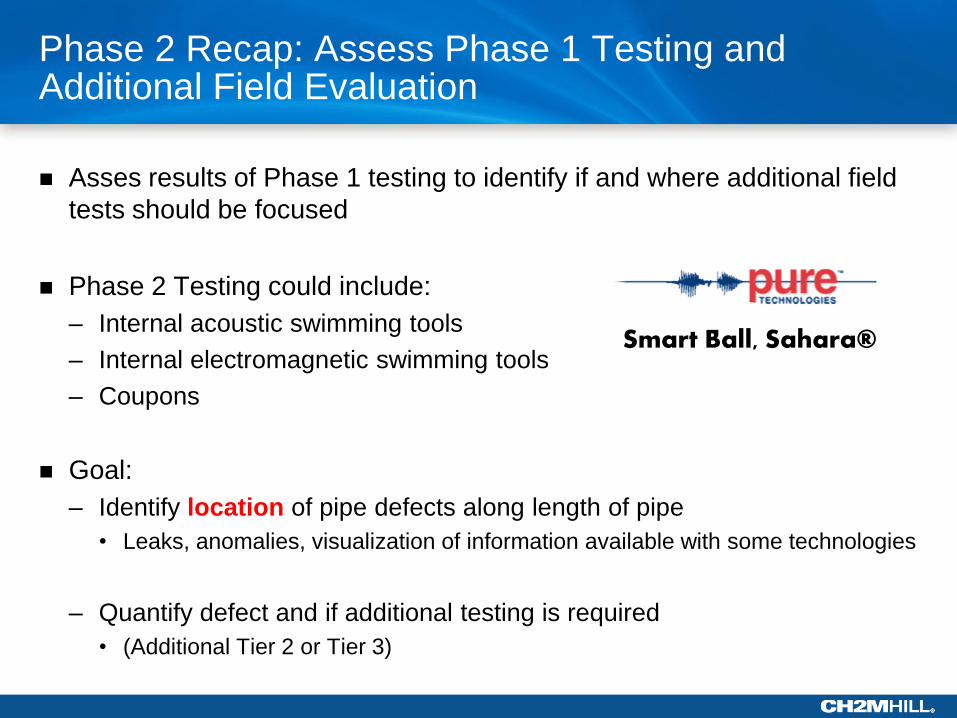
Phase 2 Recap: Assess Phase 1 Testing and Additional Field Evaluation
Asses results of Phase 1 testing to identify if and where additional field
tests should be focused
Phase 2 Testing could include:
– Internal acoustic swimming tools
– Internal electromagnetic swimming tools
– Coupons
Goal:
– Identify location of pipe defects along length of pipe
• Leaks, anomalies, visualization of information available with some technologies
– Quantify defect and if additional testing is required
• (Additional Tier 2 or Tier 3)
Smart Ball, Sahara®

PHASE 1
Average information along pipe segment
PHASE 2
More specific location of defect/anomaly
PHASE 3: Can remaining life be
estimated with results?
Additional testing needed?
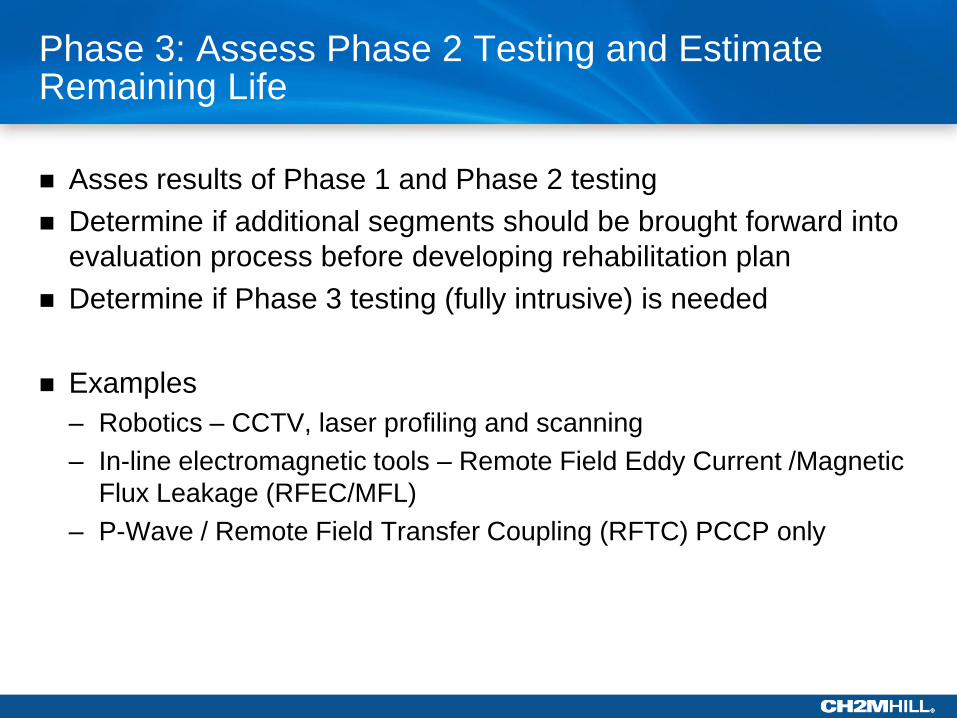
Phase 3: Assess Phase 2 Testing and Estimate Remaining Life
Asses results of Phase 1 and Phase 2 testing
Determine if additional segments should be brought forward into
evaluation process before developing rehabilitation plan
Determine if Phase 3 testing (fully intrusive) is needed
Examples
– Robotics – CCTV, laser profiling and scanning
– In-line electromagnetic tools – Remote Field Eddy Current /Magnetic
Flux Leakage (RFEC/MFL)
– P-Wave / Remote Field Transfer Coupling (RFTC) PCCP only
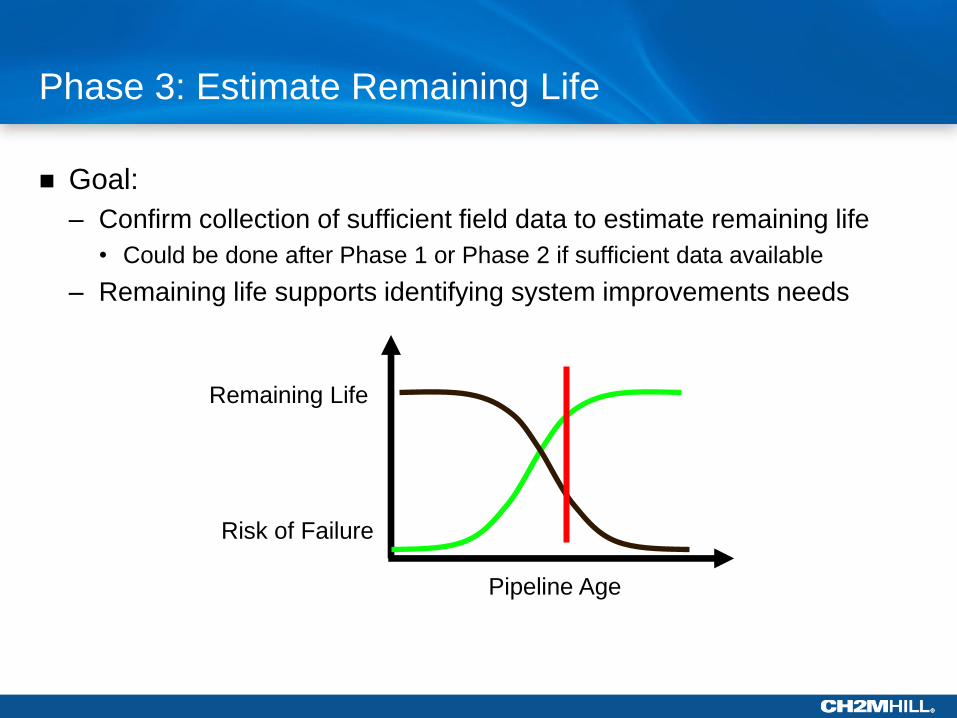
Phase 3: Estimate Remaining Life
Goal:
– Confirm collection of sufficient field data to estimate remaining life
• Could be done after Phase 1 or Phase 2 if sufficient data available
– Remaining life supports identifying system improvements needs
Pipeline Age
Risk of Failure
Remaining Life

Phase 4: Rehabilitate
Develop and implement rehabilitation plan
– Risk mitigation
– Prioritization of focus from highest risk pipelines
– Incorporate fiscal data
• Rehabilitation Costs
• Budget Scenarios
• Develop Capital Plan
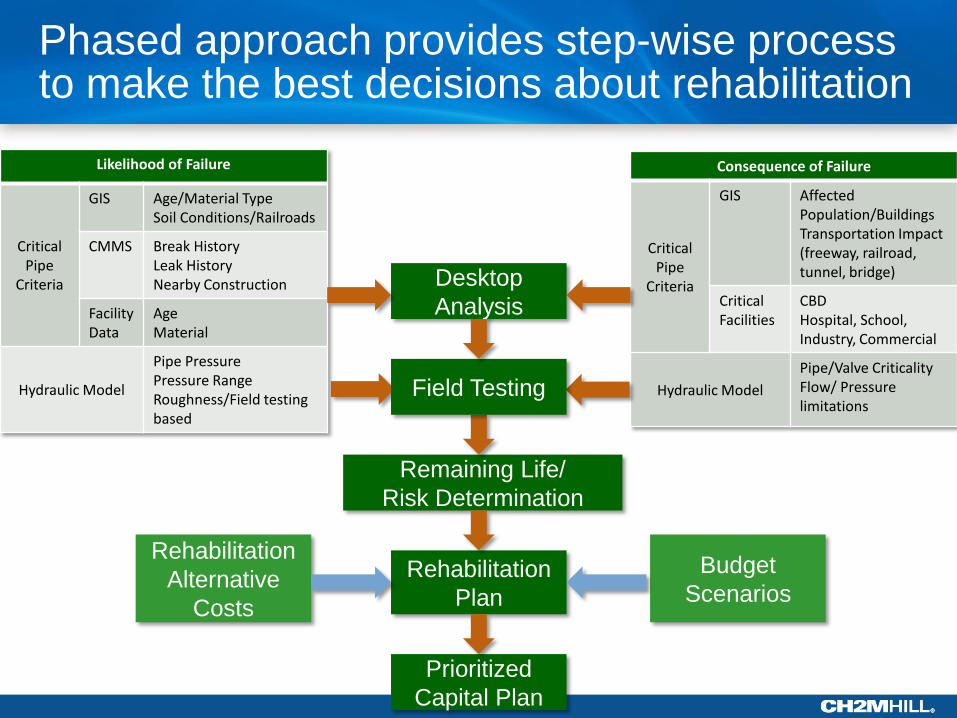
Phased approach provides step-wise process to make the best decisions about rehabilitation
Likelihood of Failure
Critical Pipe
Criteria
GIS Age/Material Type Soil Conditions/Railroads
CMMS Break History Leak History Nearby Construction
Facility Data
Age Material
Hydraulic Model
Pipe Pressure Pressure Range Roughness/Field testing based
Consequence of Failure
Critical Pipe
Criteria
GIS Affected Population/Buildings Transportation Impact (freeway, railroad, tunnel, bridge)
Critical Facilities
CBD Hospital, School, Industry, Commercial
Hydraulic Model
Pipe/Valve Criticality Flow/ Pressure limitations
Remaining Life/
Risk Determination
Rehabilitation
Plan
Prioritized
Capital Plan
Field Testing
Budget
Scenarios
Rehabilitation
Alternative
Costs
Desktop
Analysis
1. Introductions
2. Market Drivers and Opportunities
3. Approaches to Condition Assessment • Prioritization Methods
• Field Technologies
4. Rehabilitation Alternatives
5. Additional Resources
Up Next Hour!!

Questions?
Top Related