


Languages
Pages
Legal


Drinking cultures and social occasionsAlcohol harms in the context of major sporting events

© Copyright 2011 Turning Point Alcohol and Drug Centre
This work is copyright. Apart from any use as permitted under the Copyright Act 1968, no part may be reproduced by any process without permission. Copyright enquiries can be made to the Communications and Publications Unit, Turning Point Alcohol and Drug Centre, 54–62 Gertrude Street, Fitzroy, Victoria 3065, Australia.
The ‘Drinking cultures and social occasions: Alcohol harms in the context of major sporting events’ project is funded by VicHealth.
Published by Turning Point Alcohol and Drug Centre in December 2011.
ISBN: 978-1-921822-85-8
Citation:Lloyd B, Matthews S, Livingston M, Jayasekara H. (2011). Drinking cultures and social occasions: Alcohol harms in the context of major sporting events. Fitzroy, Victoria: Turning Point Alcohol and Drug Centre

Drinking cultures and social occasions:
Alcohol harms in the context of major sporting events
Belinda Lloyd Sharon Matthews Michael Livingston
Harindra Jayasekara
December 2011
Drinking cultures and social occasions: Alcohol harms in the context of major public holidays, sporting and cultural events is a Turning Point Alcohol and Drug Centre project funded by VicHealth

I
Table of Contents LIST OF TABLES .................................................................................................................................II LIST OF FIGURES ..............................................................................................................................III ACKNOWLEDGEMENTS ...................................................................................................................... V ACRONYMS .................................................................................................................................... VII SUMMARY .........................................................................................................................................1 CHAPTER 1: INTRODUCTION ................................................................................................................3 CHAPTER 2: METHODS .......................................................................................................................8 CHAPTER 3: ALCOHOL INTOXICATION ................................................................................................. 12 CHAPTER 4: ASSAULT ...................................................................................................................... 29 CHAPTER 5: MOTOR VEHICLE ACCIDENTS .......................................................................................... 46 CHAPTER 6: DISCUSSION ................................................................................................................. 63 REFERENCES .................................................................................................................................. 67 APPENDIX A .................................................................................................................................... 70

II
List of Tables Table 1: Selected sporting events examined in this report ....................................................................... 70
III
List of Figures
Figure 1: Mean number of ambulance attendances, emergency department presentations and hospital admissions due to alcohol intoxication by month ....................................................................................... 14Figure 2: Mean number of ambulance attendances, emergency department presentations and hospital admissions due to alcohol intoxication by day of week ............................................................................. 14Figure 3: ARIMA model parameters for ambulance attendances, emergency department presentations and hospital admissions due to alcohol intoxication – Sporting Events ................................................... 16Figure 4: Mean number of ambulance attendances, emergency department presentations and hospital admissions due to alcohol intoxication for males by month ........................................................ 18Figure 5: Mean number of ambulance attendances, emergency department presentations and hospital admissions due to alcohol intoxication for males by day of week ............................................................ 18Figure 6: ARIMA model parameters for ambulance attendances, emergency department presentations and hospital admissions due to alcohol intoxication for males – Sporting Events .................................. 20Figure 7: Mean number of ambulance attendances, emergency department presentations and hospital admissions due to alcohol intoxication for females by month ................................................................... 22Figure 8: Mean number of ambulance attendances, emergency department presentations and hospital admissions due to alcohol intoxication for females by day of week ......................................................... 22Figure 9: ARIMA model parameters for ambulance attendances, ED presentations and hospital admissions due to alcohol intoxication for females – Sporting Events .................................................... 24Figure 10: Mean number of ambulance attendances, emergency department presentations and hospital admissions due to alcohol intoxication for youths by month ....................................................... 26Figure 11: Mean number of ambulance attendances, emergency department presentations and hospital admissions due to alcohol intoxication for youths by day of week ............................................. 26Figure 12: ARIMA model parameters for ambulance attendances, ED presentations and hospital admissions due to alcohol intoxication for youths – Sporting Events ....................................................... 28Figure 13: Mean number of police recorded assaults, family incidents, and emergency department presentations and hospital admissions due to assault by month ............................................................. 31Figure 14: Mean number of police recorded assaults, family incidents, and emergency department presentations and hospital admissions due to assault by day of week .................................................... 31Figure 15: ARIMA model parameters for police recorded assaults, family incidents, and emergency department presentations and hospital admissions due to assault – Sporting Events ........................... 33Figure 16: Mean number of police recorded assaults, family incidents, and emergency department presentations and hospital admissions due to assault for males by month ............................................. 35Figure 17: Mean number of police recorded assaults, family incidents, and emergency department presentations and hospital admissions due to assault for males by day of week ................................... 35Figure 18: ARIMA model parameters for police recorded assaults, family incidents, and emergency department presentations and hospital admissions due to assault for males – Sporting Events .......... 37Figure 19: Mean number of police recorded assaults, family incidents, and emergency department presentations and hospital admissions due to assault for females by month .......................................... 39Figure 20: Mean number of police recorded assaults, family incidents, and emergency department presentations and hospital admissions due to assault for females by day of week ................................ 39Figure 21: ARIMA model parameters for police recorded assaults, family incidents, and emergency department presentations and hospital admissions due to assault for females – Sporting Events ....... 41Figure 22: Mean number of police recorded assaults, family incidents, and emergency department presentations and hospital admissions due to assault for youths by month ............................................ 43Figure 23: Mean number of police recorded assaults, family incidents, and emergency department presentations and hospital admissions due to assault for youths by day of week .................................. 43Figure 24: ARIMA model parameters for police recorded assaults, family incidents, and emergency department presentations and hospital admissions due to assault for youths – Sporting Events ......... 45Figure 25: Mean number of serious road incidents and hospital admissions due to motor vehicle accidents by month ...................................................................................................................................... 48Figure 26: Mean number of serious road incidents and hospital admissions due to motor vehicle accidents by day of week ............................................................................................................................ 48Figure 27: ARIMA model parameters for serious road incidents and hospital admissions due to motor vehicle accidents – Sporting Events ........................................................................................................... 50Figure 28: Mean number of serious road incidents and hospital admissions due to motor vehicle accidents for males by month ..................................................................................................................... 52Figure 29: Mean number of serious road incidents and hospital admissions due to motor vehicle accidents for males by day of week ............................................................................................................ 52

IV
Figure 30: ARIMA model parameters for serious road incidents and hospital admissions due to motor vehicle accidents for males – Sporting Events .......................................................................................... 54Figure 31: Mean number of serious road incidents and hospital admissions due to motor vehicle accidents for females by month .................................................................................................................. 56Figure 32: Mean number of serious road incidents and hospital admissions due to motor vehicle accidents for females by day of week ......................................................................................................... 56Figure 33: ARIMA model parameters for serious road incidents and hospital admissions due to motor vehicle accidents for females – Sporting Events ....................................................................................... 58Figure 34: Mean number of serious road incidents and hospital admissions due to motor vehicle accidents for youths by month .................................................................................................................... 60Figure 35: Mean number of serious road incidents and hospital admissions due to motor vehicle accidents for youths by day of week ........................................................................................................... 60Figure 36: ARIMA model parameters for serious road incidents and hospital admissions due to motor vehicle accidents for youths – Sporting Events ......................................................................................... 62

V
Acknowledgements We would like to thank the following people for their valuable contribution: the Victorian Department of Health for access to the VEMD and VAED, VicRoads for access to RNDB, Victoria Police for access to LEAP and Ambulance Victoria for their collaboration on the Ambo Project. Also, we thank Monica Barratt and Annie Haines for their contributions to data preparation.
We thank the project expert advisory group for agreeing to contribute their knowledge and expertise to this project.

VI

VII
Acronyms ABS Australian Bureau of Statistics
ED Emergency department
PCR patient care record
SRI Serious road incident
VACIS Victorian Ambulance Clinical Information System
VAED Victorian Admitted Episode Dataset
VEMD Victorian Emergency Minimum Dataset

VIII

1
Summary
Harms associated with alcohol consumption in the context of major sporting events were explored in
terms of general patterns, gender patterns and age patterns. A range of alcohol-related harms were
considered, including acute intoxication requiring medical attention, assaults, and motor vehicle
accidents. The use of time series analysis allows exploration of the levels of harms associated with
specific events after controlling for the impact of seasonal and temporal variations in alcohol-related
harms.
Acute Alcohol Intoxication
Across all populations examined, the peak months of the year for ambulance attendances,
emergency department presentations, and hospital admissions attributed to acute alcohol intoxication
were November and December, with February also being identified as a peak month among males.
Consistent with the literature, Fridays and Saturdays were the days with the highest concentrations of
alcohol intoxication related attendances, presentations and admissions.
Varying effects were noted for major sporting events. Significantly elevated numbers of cases of acute
alcohol intoxication were evident for all groups examined on the day before the Melbourne Cup, whilst
elevated cases were seen for all patients and for males on the day before the AFL Grand Final. For all
groups examined, elevated cases of alcohol intoxication occurred on the day of the Melbourne Cup,
and also for all groups except females on the day of the AFL Grand Final and the event of the
Commonwealth Games. Numbers of ambulance attendances for acute intoxication were significantly
lower than expected on the day following the Melbourne Cup for all patients, and this was driven by
the trend among females.
Assault
Consistent with previous research, the warmer months of the year represent peak times for assaults
among all groups examined. Similarly, Friday and Saturday are the days of the week with the most
assaults recorded across emergency department and hospital measures examined for all groups, with
Sundays also being a peak day for females. In terms of police recorded assaults and family incidents,
Saturdays and Sundays represented the peak days.
The Melbourne Cup represented a sporting event where assaults were elevated both in the lead up
and on the day of the event for all groups examined, whilst the day preceding the AFL Grand Final
and the Formula 1 Grand Prix were days of elevated assaults for all groups except females. On the
day of the Melbourne Cup all groups experienced significantly increased numbers of assault cases,
while all groups except females showed elevated numbers of cases of assault on the day of the AFL
Grand Final. Police recorded family incidents were significantly elevated on Melbourne Cup Day for all
groups, and among females on the day of the AFL Grand Final.

2
Motor Vehicle Accidents
Smaller effects were noted for motor vehicle accidents in measures of incidents and also
hospitalisations.
The warmer months of the year were the peak times for motor vehicle accidents. For all groups,
Friday and Saturday were found to be peak days of elevated cases of motor vehicle accidents, with
elevated events also occurring on Thursdays among males.
For males, a significant increase in motor vehicle accident presentations was noted on the day before
the AFL Grand Final and the Melbourne Cup. There was an increase in MVA cases on the day of the
AFL Grand Final among females and youths, whilst for the cricket there was a significant elevation
among males and females, and a significant reduction among youths. On the day of the Melbourne
Cup increased MVAs were noted among youths, with an increase in MVAs on the day of the Formula
One Grand Prix for males.

3
Chapter 1: Introduction
Background
Increasing media and public interest has focused on problematic alcohol consumption, and
particularly binge drinking and the link with violence usually assaults. Whilst this attention has
included concern regarding perceived harms associated with public social events such as sporting
events, there is little evidence to assess the relationship between major sporting and social events,
and alcohol-related harms.
A substantial literature exists that examines drinking behaviour and associated harms by ‘time’ – such
as seasonal, monthly, day of the week and time of day trends. (Abel, Strasburger, & Zeidenberg,
1985; Briscoe & Donnelly, 2001; Brower & Carroll, 2007; Budd, 2000; Pridemore, 2004; Silm & Ahas,
2005; Stockwell et al., 1998; Young, 2004). Often the focus is on intoxication, violence and road
injury. While seasons and monthly associations have provided inconsistent results internationally,
day of the week has been a consistent predictor. Weekends and evenings tend to show higher
prevalence of alcohol harms variously defined (Briscoe & Donnelly, 2001; Brower & Carroll, 2007;
Budd, 2000; Young, 2004). At the extreme, homicide has been shown to have a day of week effect in
New York (Abel et al., 1985). Weekends in Russia have a higher incidence of homicide (Pridemore,
2004). While ‘time’ is an important factor, the general association of alcohol and violence is
unequivocal (Brinkman, Chikritzhs, Stockwell, & Mathewson, 2001; Mosher & Jernigan, 2001)
(Bushman & Cooper, 1990; Zhang, Wieczorek, & Welte, 1997).
Alcohol consumption and intoxication
Although weekends and evenings equate to social times and would overlap with social, cultural and
even sporting events, surprisingly there is only a modest literature that examines these events
explicitly in relation to alcohol consumption and associated harms. Where the literature does examine
these events the focus is usually on a particular sport, holiday or event, with a minority examining a
combination. For instance, in Finland alcohol poisonings were shown to peak during weekends and
during celebrations on May Day, Midsummer Day and Christmas Day (Poikolainen, Leppanen, &
Vuori, 2002). In the US, college students have been shown to significantly increase alcohol
consumption on high profile sports days, and fans of the winning team drank more heavily than those
who supported the losing team (Neal, Sugarman, Hustad, Caska, & Carey, 2005). Moreover
celebratory drinking is an often endorsed reason for drinking among college students (Rabow &
Duncan-Schill, 1995). Often the motive for celebratory drinking among this cohort is alcohol
intoxication (Hunter, 1990).
Others have focused on rock concerts as a ‘single day mass gathering event’ to assess the impact on
emergency medical services demand and subsequent response in general. Feldman (2004) showed
very little alcohol harm. Out of a total 450,000 who attended a Rolling Stones concert in Toronto,
1870 sought medical care and only 30 were seen for alcohol or drug intoxication. In contrast,
Erickson et al (1996) examined first aid station presentations across five rock concerts at a single

4
venue in Chicago: 42% were seen for trauma, 17% for alcohol intoxication, 15% drug intoxication.
48% of those treated admitted to using alcohol or drugs while attending the concert. Yet others have
focused on particular venues and events, such as music dance events or football at a particular
stadium. Furr-Holden et al (2006) for instance surveyed music dance event attendees in two US
cities on alcohol and drug use and intent to drive post event. Even though driving status reduced
alcohol consumption, 62% of those who reported their intention to drive away from the event were
positive for drugs or alcohol on leaving. On site doctor attendances were examined for a full season
at the Glasgow Celtic football club, alcohol ‘excess’ was considered a major contributing factor in one
fifth of all casualties (Crawford et al., 2001).
Emergency department presentations during and after music and sporting events have also been
examined, while alcohol often is not considered or measured (Grange, Baumann, & Vaezazizi, 2003;
McGreevy et al., 2010), others have found associations. Chan and Quinn (2003) demonstrated
following rock concerts there was a higher incidence of alcohol or drug use presentations to the
emergency department compared to pop concerts and wrestling events at the same stadium in the
US. They showed that alcohol and drug related presentations occupied the most time in the
emergency department. Others have shown no association between major sporting events such as
EURO96 football matches and the number of emergency department presentations on game day
(Cooke, Allan, & Wilson 1999).
US College sport and football is quite a phenomenon with 47 million attending college football games
in 2006. Much of the international literature on sport and alcohol focuses on college football (Brower
& Carroll, 2007; Grossbard, Geisner, Neighbors, Kilmer, & Larimer, 2007; Merlo & Hong, 2008; Neal
& Fromme, 2007; Nelson & Wechsler, 2003; Paschall & Saltz, 2007; D.I. Rees & Schnepel, 2008).
Some of these have already been mentioned and others below. One study compared traditionally
high drinking days such as new years eve, St. Patricks Day and high profile sporting events
specifically college football games. Comparisons were made on alcohol-related arrests in a midsized
college town. Home game days resulted in higher rates of alcohol consumption (Merlo & Hong,
2008).
Many of these studies have looked at alcohol consumption and intoxication in particular regarding
attendance at music and sports events as well as holiday periods. Although there is overlap, many
have focused on violence and alcohol-related violence specifically.
Violence
Interestingly attendance to an event is not required to impact on emergency department
presentations. During the 1998 World Cup Soccer tournament held in France, the Edinburg
emergency department experienced a significant increase in attendance rates and workload which
was attributed to alcohol-related conditions including injuries. This was evident for only the opening
game between Brazil and Scotland (Mattick, 1999). Similarly the 2002 Soccer World Cup impacted

5
on Irish emergency department presentations for matches held in Japan and South Korea (O'Donnell,
Mattick, Mehta, & Hanrahan, 2003). In this case presenting conditions were mainly minor trauma
resulting from assaults and falls, in over half the presentations alcohol was deemed a factor. The
2006 Soccer World Cup impacted on ambulance call outs in Hampshire England. Call volumes
increased by 50% on day one of the competition. Alcohol was deemed the catalyst for collapse,
unconsciousness, assault and road traffic accidents (Deakin, Thompson, Gibson, & Green, 2007).
Match outcome also impacts on drinking behaviour and aggression of spectators. Moore et al (2007)
found that aggression increased in Welsh rugby fans whose team won or drew, yet motivation to drink
was not impacted by the match result. Analysis of Cardiff’s emergency department presentations and
welsh international matches between 1995 and 2002 revealed a home win resulted in an increase in
emergency department attendances for assault injuries. By winning, alcohol is therefore key in
prompting the formation of crowds of intoxicated people (Sivarajasingam, Moore, & Shepherd, 2005).
It has been suggested that it may not be winning per se that leads to aggression, instead increased
alcohol consumption after winning promotes aggression (Bushman & Cooper, 1990).
Domestic violence has also been associated with particular sports events. The US Super Bowl
Sunday is often the biggest day of the year for domestic violence with emergency department
presentation and police department calls higher (Sachs & L.D., 2000). White et al (1992) found that
assault stabbings and shootings of women increased in Northern Virginia when the Washington
Redskins football team won compared with non match days but neither increased or decreased when
the team lost. Outside of football, White et al (1992) showed that victimisation patterns are different
across gender. Women present to emergency departments more on Christmas day and New Year’s
Day whereas men have higher admissions to the emergency department on thanks giving. Victorian
data over the period 2003 to 2009 indicate that the majority of victims of family violence incidents
reported to police were female, with just under 25% of victims being male (Victoria Police, 2009).
Rees & Schnepel (2008; 2009) write about the mounting anecdotal evidence that college football
games in the US lead to ‘aggressive and destructive’ behaviour by the fans, yet little is known about
the magnitude of the problem. They examined daily offense data from 26 police agencies spanning
six football seasons 2000-2005. They found in communities hosting a game there were increases in
assaults on game days. Also, there were increases in vandalism, arrests for disorderly conduct and
alcohol –related arrests. They found the biggest effect to occur when there was an ‘upset’ that is
when a team won that was not expected to win. Some have argued that frustration intensifies the
effect of alcohol on aggressive behaviour and this explains such an occurrence (Ito, Miller, & Pollock,
1996; Pederson, Fredy, Ito, Miller, & Pollock, 2002). Increased alcohol consumption is common on
game days (Glassman, Chudley, Werch, & Bian, 2007; Neal & Fromme, 2006). Neal & Fromme
(2006) comment that consumption is comparable to other heavy drinking days such as New years eve
and Halloween weekend.

6
A US survey of state alcohol beverage control and local police agencies in each of the cities that have
a professional sports stadium was conducted for the period November 2005 to May 2006 (Lenk,
Toomey, & Erickson, 2009). Underage alcohol compliance checks were the most common type of
enforcement, however around 50% of agencies conducted these. Fights both inside and outside of
the stadiums were the most common complaint received by local law enforcement agencies 74-80%
receiving these sorts of complaints. 65% of state agencies received complaints about intoxicated
patrons.
Little research exists around the occurrence of road traffic accidents and social and sports events. As
indicated earlier there is work around time of day and day of week but little else of relevance here.
One study in Canada examined the impact of traffic crashes following the introduction of beer sales at
a Toronto ball park (Vingilis, Liban, Blefgen, Colbourne, & Reynolds, 1992). They found a higher
proportion of alcohol-related traffic accidents occurred in Toronto following the games compared to
pre game periods. However, they also found the same proportion occurring during the same time
period on non game days. They concluded that drinking at games was common place before the
beer sales were officially introduced
Consuming alcohol in Australia is enmeshed with celebration and cultural traditions. There are
certain expectations on how people should behave in certain social settings (particularly for young
people) and this can involve the expectation of consuming a certain amount of alcohol. Australia’s
endemic drinking culture is demonstrated through large scale music events such as the Big Day Out,
which is partnered with Australia Day. These events have been associated with drinking to excess
(Roche et al., 2007). The Spring Racing Carnival that incorporates the Melbourne Cup is associated
with much celebration nationally, and is accompanied by excessive alcohol consumption. Underage
drinking is a feature of horse racing nationally (Roche et al., 2007). Alcohol and sport participation
has a long Australian tradition as evidenced by the Australian Drug Foundation’s Good Sports
Accreditation Programs which focus on trying to moderate risky drinking practices. While participation
in sport decreases with age, sport fans span all age groups. Thompson et al (2006) explored the role
of alcohol in a group of South Australian football fans and found that alcohol was central to their
football experience.
In the main the research around social and sporting events have tended to examine these events as
discrete groupings and the little Australian research there is, is no exception. There has been a focus
on specific stadiums, emergency department presentation, particular sports and crime statistics for
instance. Even sporting seasons have been examined for a particular sport ranging from rugby to
college football. At best some have adjusted for holiday periods namely known high drinking public
holidays such as new years. However, an examination of several holidays and sporting events have
not been examined simultaneously.

7
Melbourne is a major sporting city, being voted “ultimate sports city” in 2008. The city hosts some
major events in the global sports calendar, specifically the Formula One Grand Prix, Melbourne Cup
Horse Racing and associated carnival, Boxing Day Test Cricket, also hosting in the past the
Commonwealth Games and Rugby World Cups and, more locally, the Australian Rules grand final.
Melbourne hosts innumerable festivals across the year as well, spanning local and international
varieties such as the Melbourne International Comedy Festival and the Melbourne International Film
Festival. All of these events are associated with large crowds usually around the CBD and inner city
area, and many are associated with a drinking culture. Melbourne is an excellent case study to
explore the relationship between drinking and social occasions.
Objectives
The purpose of this study is to develop an understanding of the relationships between public events
and alcohol-related harms. Identification of the timing of major sporting events and their association
with alcohol-related harms will be achieved through analysis of ambulance attendances, traffic
accidents hospital emergency department presentations and hospital admissions in terms of timing
and proximity to major events occurring in Melbourne. Importantly, this study also enables
examination of the role of age and gender in the experience of alcohol-related harms in the context of
sporting events.
Rationale There has been little analysis of the occurrence of alcohol-related harm in relation to major sporting
events in Victoria. This project will provide valuable evidence in terms of alcohol-related harms for
different populations in the context of timing of major social events. Such evidence will be invaluable
in contributing to policy in relation to public health initiatives, emergency services (ambulance and
police) and hospital staffing and resource planning, and event planning.

8
Chapter 2: Methods
The current report examines the pattern of alcohol and other drug related harms associated with
major sporting events in metropolitan Melbourne for the nine year period 2001-09. Categories and
dates of these events were derived from online databases (see Table 1 in Appendix). The report
consists of three separate sections for harms in terms of alcohol intoxication (ambulance attendances,
emergency department presentations & hospital admissions), assaults (police recorded assaults and
family incidents, emergency department presentations & hospital admissions) and motor vehicle
accidents (serious road incidents & hospital admissions). The results are presented for all cases,
males, females and youths under each section. These findings have been complemented with
graphical descriptions of the variation in alcohol-related harms in relation to day of the week and
month of the year in order to allow consideration of temporal and seasonal variations.
Data utilised in the analyses were derived from the Ambo Project dataset (which includes all drug and
alcohol-related ambulance attendances), VicRoads serious road incident data (detailing motor vehicle
accidents), the Victorian Emergency Minimum Dataset (detailing hospital emergency presentations),
the Victorian Admitted Episodes Dataset (that includes all hospital separations) and the Victoria
Police Law Enforcement Assistance Program (LEAP) database (that includes all police recorded
offences).
Ambulance attendances
These data are derived from the Ambo Project: Alcohol and Drug related Ambulance Attendances
(formerly known as the Surveillance of Drug Related Events Attended by Ambulance in Melbourne
project). This project collates information from alcohol and other drug related non-fatal attendances by
ambulance paramedics in metropolitan Melbourne. The data are obtained from the patient care
records that are completed by the attending paramedics for every incident that they attend and for
which they provide a service. These are coded and entered by specifically trained project staff into a
database which contains information including demographic and location characteristics, clinical
signs, treatment details and outcomes. Drug involvement in the attendance is determined by
paramedic clinical assessment and information available at the scene, and cases are included where
the drug played a causal role in the reason for the ambulance attendance.
Data were extracted from a database developed for examining nonfatal drug-related ambulance
attendances in the Melbourne metropolitan area (Dietze et al., 2000). This database is a compilation
of patient care records (PCRs) completed by paramedics for each ambulance attendance.
Paramedics document medications that are considered to be involved in the presentations. Cases
were included in this database where alcohol had a causal role in the patient’s presentation or was a
significant contributor to the presentation, as determined through paramedic assessment. Details
included presenting characteristics of cases (including demographic and clinical signs), treatments
provided, and transportation outcomes. For this study, cases were extracted where alcohol

9
intoxication only was recorded on the case record from January 2000 to June 2009. As a
consequence of paramedic industrial action, data were unavailable from October 2002 to February
2003 inclusive and June to July 2004 inclusive.
Serious Road Incidents - VicRoads Road Network Database (RNDB)
The VicRoads Road Network Database (RNDB) is compiled from Victoria Police information. Forms
completed by police detailing each crash, where (according to LGA) and when it occurred, who was
involved, vehicles involved and a description of the crash are entered into a police database. This
information is transferred electronically and weekly to the VicRoads RNDB. Additional information
from these forms, not entered by police, is added to the RNDB by VicRoads. Data for the financial
years 1999/00 through to 2008/09 were obtained from VicRoads.
Emergency Department Presentations
Data on presentation to Emergency Departments came from the Victorian Emergency Minimum
Dataset (VEMD). The VEMD contains detailed demographic, clinical and administrative information
on all presentations to Victorian public hospitals with 24-hour emergency departments. VEMD data
was available from January 2000 through to June 2009. The VEMD contains a range of information
regarding the reason behind each presentation. This includes three fields for ICD10 diagnoses and a
series of data items relating to injury surveillance.
Presentations relating to acute intoxication were extracted using the three diagnosis codes. If any of
these three codes was ‘F10.0 – acute intoxication due to alcohol use’, then the presentation was
counted as an intoxication presentation.
Assault presentations were extracted using the injury surveillance measures. Any injury presentation
that had a human intent entry of ‘assault – not otherwise specified’ was included in the analysis as an
assault presentation. This excludes sexual assault, domestic violence and child maltreatment. The
VEMD was the subject of a validation study in 2000, which found that approximately 17.5% of cases
were not recorded at all and that there was an error rate of around 11% in the human intent field that
we have used to identify assault-related presentations. The review also found some bias in the data,
with more missing data on Sunday presentations, although it was not clear whether the missing or
erroneous data would be more likely around public holidays or major events (Stokes et al., 2000).
Unfortunately the data does not allow cases to be easily determined where alcohol and assault co-
presented.
Hospital admissions
Information on alcohol-related hospital admissions was obtained from the Victorian Admitted
Episodes Dataset (VAED) for the 1999/00 through to 2008/09 financial years. The VAED is a
database maintained by the Victorian Department of Health and contains details of all acute hospital
separations in Victoria including information on the cause of the admission (according to ICD coding),

10
as well as the age, sex and resident LGA of the admitted patient. The term ‘acute hospitals‟ refers to
public, private and denominational hospitals, acute facilities in rehabilitation and extended care (sub
acute) facilities, day procedure centres and designated acute psychiatric units in public hospitals.
Residential care (nursing homes), hostels, supported residential services and state managed
psychiatric institutions are not included in the VAED.
Police recorded assaults and family incidents
The Victoria Police Law Enforcement Assistance Program (LEAP) database system captures
information on crime reported to Victoria Police. Information is available across various crime
categories including reported assault and family incidents. Data have been collected through the
LEAP system since the 1993-94 financial year. However, owing to Victoria Police privacy protocols,
unit record data are not released to external agencies. Only tabulated data are available from this
system. LEAP was designed primarily for operational policing purposes and is a dynamic database.
That is, Victoria Police updates existing records with new information as it becomes available.
Records are also revised when investigations identify additional information. The Central Data Entry
Bureau also amends records when quality control checks identify inaccurate or incomplete
information. Because of the dynamic nature of LEAP, data extracted over time for the same time
period can feasibly give rise to varying results. Data on assaults and family incidents from the LEAP
database are used in this report.
Assaults in the LEAP database can be variously defined – victim assaults, offenders, incidents and
police assaults. Victim assaults equate to those who have been assaulted—there can be many
victims involved in one incident or per offender. Police assaults relate to where members of Victoria
Police have been assaulted. Victim assaults are included in this report. Police assault data are
excluded owing to the potential biased nature of these data.
Assaults
The LEAP data on family incidents is synonymous with domestic violence. The police attending a
family incident assess whether alcohol is involved. Three categories of alcohol involvement are
available to police: ‘definite’, ‘probable’ and ‘no involvement’. It is important to note that these are
subjective assessments. While the police are confident in the accuracy of this assessment, there will
inevitably be misclassification. The data included in this report incorporate all police recorded family
incidents, regardless of assessment of alcohol involvement. The data refers to the principal victim of
the family incident.
Family incidents
Statistical analysis
As the records are from a daily time-series, there is likely to be serial auto-correlation present in the
data. Serial auto-correlation occurs when observations at a particular point in time are related to

11
observations at a specified number of time points away. Commonly, this occurs when observations
from two time points are correlated. The use of ordinary least square (OLS) regression on time-series
data with serial auto-correlation results in auto-correlated residuals and inefficient estimation. We
have used Auto-Regressive Integrated Moving-Average (ARIMA) methods which provide a range of
options for dealing with the interdependence of time-series data (Yaffee and McGee, 2000). Because
we were interested in assessing the impact of day of week and month of year on alcohol-related
presentations, the modelling process focussed on ensuring the model residuals were free from auto-
correlation and trends, rather than the original dataset. Separate models were developed for alcohol
intoxication, assaults and motor vehicle accidents. These analyses also included investigation of lead
and lag effects in relation to selected events.
To ensure that the daily data meaningfully reflected harms related to particular events, days were
recorded so that they ran from 6 am to 6 am (rather than midnight to midnight). Thus, a presentation
for intoxication at 1 am on a Sunday morning was coded as a Saturday presentation as the alcohol
consumption related to the presentation would have taken place on Saturday night. As this report is
focussed on the alcohol and other drug related harms associated with major events in Melbourne,
only presentations from hospitals within the Melbourne metropolitan regions were examined.
For each of the analyses undertaken, graphs of significant results are presented in the Results
chapters. Full tabulated results are included in the Appendices for reference.

12
Chapter 3: Alcohol Intoxication
In order to explore the relationship between alcohol intoxication and sporting events three measures
of acute alcohol intoxication were utilised in analyses – ambulance attendances for acute alcohol
intoxication with no other drugs present, hospital emergency presentations for alcohol intoxication and
hospital admissions for alcohol intoxication.
Results are presented for all cases, males and females separately, and for youth (persons aged less
than 25 years).

13
Seasonal and time of week patterns
All cases
As shown in Figure 1, peaks in ambulance attendances, emergency department presentations and
hospital admissions for alcohol intoxication occur in the warmer months of the year, with November
and December being the months with the highest numbers of cases. In terms of the distribution of
alcohol intoxication cases over the course of the week, Friday and Saturday are shown as the days of
the week with the greatest concentration of alcohol intoxication attendances, presentations and
admissions (Figure 2).

14
Figure 1: Mean number of ambulance attendances, emergency department presentations and hospital admissions due to alcohol intoxication by month
Figure 2: Mean number of ambulance attendances, emergency department presentations and hospital admissions due to alcohol intoxication by day of week
0
5
10
15
20
25
Jan Feb Mar Apr May Jun Jul Aug Sep Oct Nov Dec
Ambulance attendances
ED presentations
Hospital admissions
0
5
10
15
20
25
30
Mon Tue Wed Thu Fri Sat Sun
Ambulance attendances
ED presentations
Hospital admissions

15
Alcohol intoxication and major sporting events
As shown in Figure 3, significant elevations of alcohol intoxication cases on the day preceding a
sporting event occurred on the day before the Melbourne Cup and the day preceding the Grand Final.
Significant increases in alcohol intoxication cases were found for the Melbourne Cup, the
Commonwealth Games and the Grand Final. There was a significantly lower number of alcohol
intoxication related ambulance attendances than predicted on the day following the Melbourne Cup.

16
Figure 3: ARIMA model parameters for ambulance attendances, emergency department presentations and hospital admissions due to alcohol intoxication – Sporting Events
-15
-5
5
15
Form
ula
1 Gr
and
Prix
am
bula
nce
ED
Hosp
ital
AFL G
rand
Fin
al a
mbu
lanc
e ED
Hosp
ital
Mel
bour
ne C
up a
mbu
lanc
e ED
Hosp
ital
-15
-5
5
15
Com
mon
wea
lth G
ames
am
bula
nce
ED
Hosp
ital
Form
ula
1 Gr
and
Prix
am
bula
nce ED
Hosp
ital
Wor
ld C
up a
mbu
lanc
e ED
Hosp
ital
AFL G
rand
Fin
al a
mbu
lanc
e ED
Hosp
ital
Mel
bour
ne C
up a
mbu
lanc
e ED
Hosp
ital
Cric
ket a
mbu
lanc
e ED
Hosp
ital
-15
-5
5
15
Form
ula
1 Gr
and
Prix
am
bula
nce
ED
Hosp
ital
AFL G
rand
Fin
al a
mbu
lanc
e ED
Hosp
ital
Mel
bour
ne C
up a
mbu
lanc
e ED
Hosp
ital
Event
Lead
Lag

17
Seasonal and time of week patterns
Males
Alcohol-related ambulance attendances, emergency department presentations and hospital
admissions for male patients peaked in the warmer months of the year, with February, November and
December being the months with the highest numbers of cases (Figure 4). As shown in Figure 5, the
distribution of alcohol intoxication cases over the course of the week indicates that Friday and
Saturday were the days of the week with the greatest concentration of alcohol intoxication
attendances, presentations and admissions.

18
Figure 4: Mean number of ambulance attendances, emergency department presentations and hospital admissions due to alcohol intoxication for males by month
Figure 5: Mean number of ambulance attendances, emergency department presentations and hospital admissions due to alcohol intoxication for males by day of week
0
2
4
6
8
10
12
14
16
Jan Feb Mar Apr May Jun Jul Aug Sep Oct Nov Dec
Ambulance attendances
ED presentations
Hospital admissions
0
2
4
6
8
10
12
14
16
18
Mon Tue Wed Thu Fri Sat Sun
Ambulance attendances
ED presentations
Hospital admissions

19
Alcohol intoxication and major sporting events
For males, significant elevations of alcohol intoxication related hospital admissions occurred on the
day preceding the Melbourne Cup and on the day preceding the Grand Final as shown in Figure 6.
Significant increases in alcohol intoxication cases were found for the Melbourne Cup (ambulance
attendances), the Commonwealth Games (hospital admissions) and the Grand Final (ambulance
attendances and emergency department presentations).

20
Figure 6: ARIMA model parameters for ambulance attendances, emergency department presentations and hospital admissions due to alcohol intoxication for males – Sporting Events
-15
-5
5
15
Form
ula
1 Gr
and
Prix
am
bula
nce
ED
Hosp
ital
AFL G
rand
Fin
al a
mbu
lanc
e ED
Hosp
ital
Mel
bour
ne C
up a
mbu
lanc
e ED
Hosp
ital
-15
-5
5
15
Com
mon
wea
lth G
ames
am
bula
nce
ED
Hosp
ital
Form
ula
1 Gr
and
Prix
am
bula
nce ED
Hosp
ital
Wor
ld C
up a
mbu
lanc
e ED
Hosp
ital
AFL G
rand
Fin
al a
mbu
lanc
e ED
Hosp
ital
Mel
bour
ne C
up a
mbu
lanc
e ED
Hosp
ital
Cric
ket a
mbu
lanc
e ED
Hosp
ital
-15
-5
5
15
Form
ula
1 Gr
and
Prix
am
bula
nce
ED
Hosp
ital
AFL G
rand
Fin
al a
mbu
lanc
e ED
Hosp
ital
Mel
bour
ne C
up a
mbu
lanc
e ED
Hosp
ital
Event
Lead
Lag

21
Seasonal and time of week patterns
Females
Alcohol-related ambulance attendances, emergency department presentations and hospital
admissions for female patients peaked in the warmer months of the year, with November and
December being the months with the highest numbers of cases (Figure 7). As shown in Figure 8, the
distribution of alcohol intoxication cases over the course of the week indicates that Friday and
Saturday were the days of the week with the greatest concentration of alcohol intoxication
attendances, presentations and admissions.

22
Figure 7: Mean number of ambulance attendances, emergency department presentations and hospital admissions due to alcohol intoxication for females by month
Figure 8: Mean number of ambulance attendances, emergency department presentations and hospital admissions due to alcohol intoxication for females by day of week
0
1
2
3
4
5
6
7
8
Jan Feb Mar Apr May Jun Jul Aug Sep Oct Nov Dec
Ambulance attendances
ED presentations
Hospital admissions
0
1
2
3
4
5
6
7
8
9
10
Mon Tue Wed Thu Fri Sat Sun
Ambulance attendances
ED presentations
Hospital admissions

23
Alcohol intoxication and major sporting events
There were significant increases in alcohol intoxication related emergency department presentations
and hospital admissions for female patients on the day preceding the Melbourne Cup (Figure 9). A
significant increase in alcohol intoxication related ambulance attendances was found on the day of the
Melbourne Cup, with a significantly lower number of alcohol-related ambulance attendances than
predicted occurring on the day following the Melbourne Cup.

24
Figure 9: ARIMA model parameters for ambulance attendances, ED presentations and hospital admissions due to alcohol intoxication for females – Sporting Events
-15
-5
5
15
Form
ula
1 Gr
and
Prix
am
bula
nce
ED
Hosp
ital
AFL G
rand
Fin
al a
mbu
lanc
e ED
Hosp
ital
Mel
bour
ne C
up a
mbu
lanc
e ED
Hosp
ital
-15
-5
5
15
Com
mon
wea
lth G
ames
am
bula
nce
ED
Hosp
ital
Form
ula
1 Gr
and
Prix
am
bula
nce ED
Hosp
ital
Wor
ld C
up a
mbu
lanc
e ED
Hosp
ital
AFL G
rand
Fin
al a
mbu
lanc
e ED
Hosp
ital
Mel
bour
ne C
up a
mbu
lanc
e ED
Hosp
ital
Cric
ket a
mbu
lanc
e ED
Hosp
ital
-15
-5
5
15
Form
ula
1 Gr
and
Prix
am
bula
nce
ED
Hosp
ital
AFL G
rand
Fin
al a
mbu
lanc
e ED
Hosp
ital
Mel
bour
ne C
up a
mbu
lanc
e ED
Hosp
ital
Event
Lead
Lag

25
Seasonal and time of week patterns
Youths
Alcohol-related ambulance attendances, emergency department presentations and hospital
admissions among youths peaked in the warmer months of the year, with November and December
being the months with the highest numbers of cases (Figure 10). As shown in Figure 11, the
distribution of alcohol intoxication cases over the course of the week indicates that Friday and
Saturday were the days of the week with the greatest concentration of alcohol intoxication
attendances, presentations and admissions.

26
Figure 10: Mean number of ambulance attendances, emergency department presentations and hospital admissions due to alcohol intoxication for youths by month
Figure 11: Mean number of ambulance attendances, emergency department presentations and hospital admissions due to alcohol intoxication for youths by day of week
0
0.5
1
1.5
2
2.5
3
3.5
4
4.5
Jan Feb Mar Apr May Jun Jul Aug Sep Oct Nov Dec
Ambulance attendances
ED presentations
Hospital admissions
0
1
2
3
4
5
6
7
Mon Tue Wed Thu Fri Sat Sun
Ambulance attendances
ED presentations
Hospital admissions

27
Alcohol intoxication and major sporting events
There were significant increases in alcohol intoxication related emergency department presentations
and hospital admissions for youths on the day preceding the Melbourne Cup (Figure 12), and a small
but significantly reduced number of alcohol intoxication related emergency presentations and hospital
admissions on the day preceding the Formula 1 Grand Prix. Significant increases were found in
alcohol intoxication related ambulance attendances on the day of the Melbourne Cup, emergency
department presentations during the Commonwealth Games, and ambulance attendances and
emergency department presentations on the day of the Grand Final.

28
Figure 12: ARIMA model parameters for ambulance attendances, ED presentations and hospital admissions due to alcohol intoxication for youths – Sporting Events
-15
-5
5
15
Form
ula
1 Gr
and
Prix
am
bula
nce
ED
Hosp
ital
AFL G
rand
Fin
al a
mbu
lanc
e ED
Hosp
ital
Mel
bour
ne C
up a
mbu
lanc
e ED
Hosp
ital
-15
-5
5
15
Com
mon
wea
lth G
ames
am
bula
nce
ED
Hosp
ital
Form
ula
1 Gr
and
Prix
am
bula
nce ED
Hosp
ital
Wor
ld C
up a
mbu
lanc
e ED
Hosp
ital
AFL G
rand
Fin
al a
mbu
lanc
e ED
Hosp
ital
Mel
bour
ne C
up a
mbu
lanc
e ED
Hosp
ital
Cric
ket a
mbu
lanc
e ED
Hosp
ital
-15
-5
5
15
Form
ula
1 Gr
and
Prix
am
bula
nce ED
Hosp
ital
AFL G
rand
Fin
al a
mbu
lanc
e ED
Hosp
ital
Mel
bour
ne C
up a
mbu
lanc
e ED
Hosp
ital
Event
Lead
Lag

29
Chapter 4: Assault
Four measures of assault were utilised in analyses of the relationship between major sporting events
and harms – police recorded assaults, police recorded family incidents (domestic violence), hospital
emergency presentations for assault and hospital admissions for assault.
Results are presented for all cases, males and females separately, and for youth (persons aged less
than 25 years).

30
All cases
Seasonal and time of week patterns
Police recorded assaults and family incidents, assault-related emergency department presentations
and hospital admissions peaked in the warmer months of the year, with the highest numbers of cases
occurring between November and March (Figure 13). As shown in Figure 14, the distribution of
assault cases over the course of the week indicates that Friday and Saturday were the days of the
week with the greatest concentration of police recorded assaults, emergency department assault
presentations and hospital admissions, while Saturday and Sunday represented the days of the week
with the highest numbers of police recorded family incidents.

31
Figure 13: Mean number of police recorded assaults, family incidents, and emergency department presentations and hospital admissions due to assault by month
Figure 14: Mean number of police recorded assaults, family incidents, and emergency department presentations and hospital admissions due to assault by day of week
0
5
10
15
20
25
30
35
40
45
Jan Feb Mar Apr May Jun Jul Aug Sep Oct Nov Dec
Police recorded assaults
Family incidents
ED presentations
Hospital admissions
0
10
20
30
40
50
60
Mon Tue Wed Thu Fri Sat Sun
Police recorded assaults
Family incidents
ED presentations
Hospital admissions

32
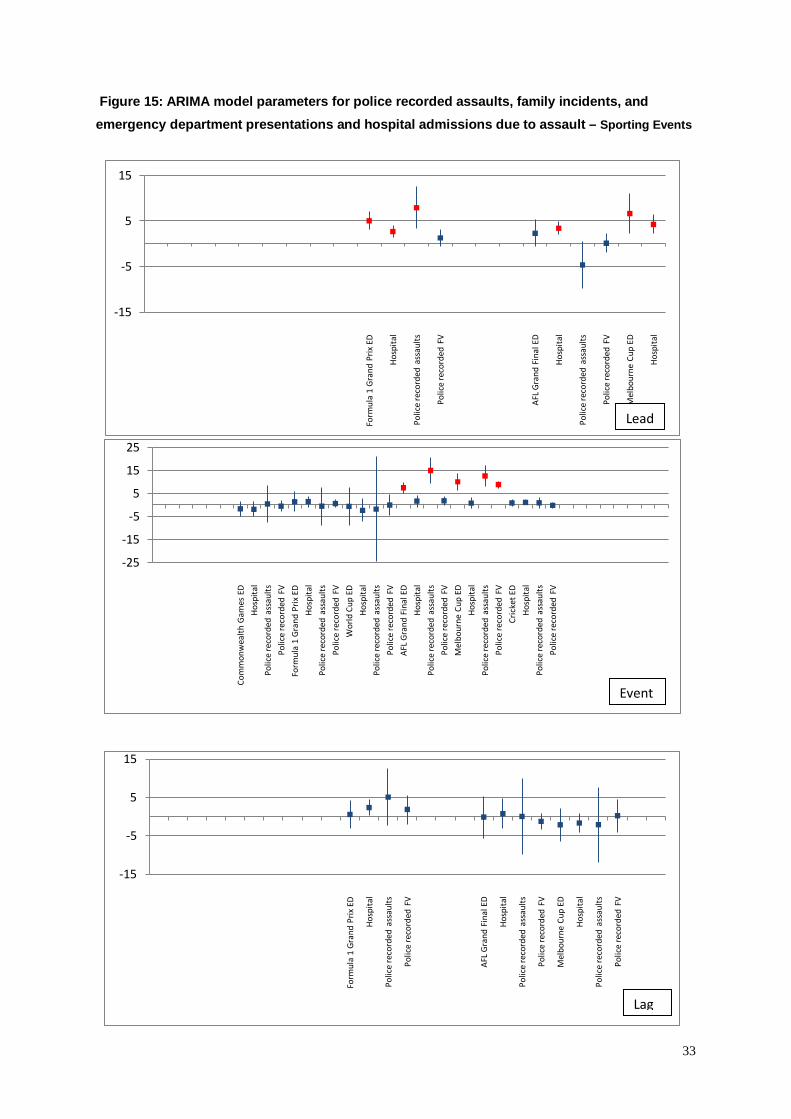
Assaults and major sporting events
There were significant increases in assaults on the day preceding the Melbourne Cup and Formula 1
Grand Prix (police recorded assaults, emergency presentations and hospital admissions), and the
AFL Grand Final (hospital admissions) (Figure 15). Significant increases were found in assaults on
the day of the Melbourne Cup (emergency presentations, police recorded assaults and family
incidents) and AFL Grand Final (emergency presentations and police recorded assaults), and during
International cricket matches (hospital admissions). On the day following the Formula 1 Grand Prix,
there was a significantly higher number of assault related hospital admissions than expected.
33
Figure 15: ARIMA model parameters for police recorded assaults, family incidents, and emergency department presentations and hospital admissions due to assault – Sporting Events
-15
-5
5
15
Form
ula
1 Gr
and
Prix
ED
Hosp
ital
Polic
e re
cord
ed a
ssau
lts
Polic
e re
cord
ed F
V
AFL G
rand
Fin
al E
D
Hosp
ital
Polic
e re
cord
ed a
ssau
lts
Polic
e re
cord
ed F
V
Mel
bour
ne C
up E
D
Hosp
ital
-25
-15
-5
5
15
25
Com
mon
wea
lth G
ames
ED
Hosp
ital
Polic
e re
cord
ed a
ssau
lts
Polic
e re
cord
ed F
V Fo
rmul
a 1
Gran
d Pr
ix E
D Ho
spita
l Po
lice
reco
rded
ass
aults
Po
lice
reco
rded
FV
Wor
ld C
up E
D Ho
spita
l Po
lice
reco
rded
ass
aults
Po
lice
reco
rded
FV
AFL G
rand
Fin
al E
D Ho
spita
l Po
lice
reco
rded
ass
aults
Po
lice
reco
rded
FV
Mel
bour
ne C
up E
D Ho
spita
l Po
lice
reco
rded
ass
aults
Po
lice
reco
rded
FV
Cric
ket E
D Ho
spita
l Po
lice
reco
rded
ass
aults
Po
lice
reco
rded
FV
-15
-5
5
15
Form
ula
1 Gr
and
Prix
ED
Hosp
ital
Polic
e re
cord
ed a
ssau
lts
Polic
e re
cord
ed F
V
AFL G
rand
Fin
al E
D
Hosp
ital
Polic
e re
cord
ed a
ssau
lts
Polic
e re
cord
ed F
V
Mel
bour
ne C
up E
D
Hosp
ital
Polic
e re
cord
ed a
ssau
lts
Polic
e re
cord
ed F
V
Event
Lead
Lag

34
Males
Seasonal and time of week patterns
Police recorded assaults and family incidents, and assault related emergency department
presentations and hospital admissions peaked in the warmer months of the year, with the highest
numbers of cases occurring between November and March (Figure 16). As shown in Figure 17, the
distribution of assault cases for males over the course of the week indicates that Friday and Saturday
were the days of the week with the greatest concentration of assault related offences, presentations
and admissions.

35
Figure 16: Mean number of police recorded assaults, family incidents, and emergency department presentations and hospital admissions due to assault for males by month
Figure 17: Mean number of police recorded assaults, family incidents, and emergency department presentations and hospital admissions due to assault for males by day of week
0
5
10
15
20
25
30
35
Jan Feb Mar Apr May Jun Jul Aug Sep Oct Nov Dec
Police recorded assaults
Family incidents
ED presentations
Hospital admissions
0
5
10
15
20
25
30
35
40
45
Mon Tue Wed Thu Fri Sat Sun
Police recorded assaults
Family incidents
ED presentations
Hospital admissions

36
Assaults and major sporting events
Among males, there were significant increases in assaults on the day preceding the Melbourne Cup
(police recorded assaults, family incidents, emergency presentations and hospital admissions) and
Formula 1 Grand Prix (police recorded assaults, emergency presentations and hospital admissions),
and the AFL Grand Final (hospital admissions) (Figure 18). Significant increases were found in
assaults on the day of the Melbourne Cup (police recorded assaults, family incidents and emergency
presentations) and AFL Grand Final (police recorded assaults, emergency presentations), and during
International cricket matches (hospital admissions). On the day following the Formula 1 Grand Prix,
there were significantly higher numbers of family incidents and assault related hospital admissions
than expected.

37
Figure 18: ARIMA model parameters for police recorded assaults, family incidents, and emergency department presentations and hospital admissions due to assault for males – Sporting Events
-15
-5
5
15
Form
ula
1 Gr
and
Prix
ED
Hosp
ital
Polic
e re
cord
ed a
ssau
lts
Polic
e re
cord
ed F
V
AFL G
rand
Fin
al E
D
Hosp
ital
Polic
e re
cord
ed a
ssau
lts
Polic
e re
cord
ed F
V
Mel
bour
ne C
up E
D
Hosp
ital
Polic
e re
cord
ed a
ssau
lts
Polic
e re
cord
ed F
V
-15
-5
5
15
Com
mon
wea
lth G
ames
ED
Hosp
ital
Polic
e re
cord
ed a
ssau
lts
Polic
e re
cord
ed F
V
Form
ula
1 Gr
and
Prix
ED
Hosp
ital
Polic
e re
cord
ed a
ssau
lts
Polic
e re
cord
ed F
V
Wor
ld C
up E
D
Hosp
ital
Polic
e re
cord
ed a
ssau
lts
Polic
e re
cord
ed F
V
AFL G
rand
Fin
al E
D
Hosp
ital
Polic
e re
cord
ed a
ssau
lts
Polic
e re
cord
ed F
V
Mel
bour
ne C
up E
D
Hosp
ital
Polic
e re
cord
ed a
ssau
lts
Polic
e re
cord
ed F
V
Cric
ket E
D
Hosp
ital
Polic
e re
cord
ed a
ssau
lts
Polic
e re
cord
ed F
V
-15
-5
5
15
Form
ula
1 Gr
and
Prix
ED
Hosp
ital
Polic
e re
cord
ed a
ssau
lts
Polic
e re
cord
ed F
V
AFL G
rand
Fin
al E
D
Hosp
ital
Polic
e re
cord
ed a
ssau
lts
Polic
e re
cord
ed F
V
Mel
bour
ne C
up E
D
Hosp
ital
Polic
e re
cord
ed a
ssau
lts
Polic
e re
cord
ed F
V
Event
Lead
Lag

38
Females
Seasonal and time of week patterns
Police recorded assaults, family incidents, assault related emergency department presentations and
hospital admissions peaked in the warmer months of the year, with the highest numbers of police
recorded assaults and family incidents occurring between November and March, cases occurring
between December and March for emergency presentations, and in February and March for hospital
admissions (Figure 19). As shown in Figure 20, the distribution of assault cases for females over the
course of the week indicates that Friday, Saturday and Sunday were the days of the week with the
greatest concentration of emergency department presentations for assault, with Friday and Saturday
the peak days for hospital admissions, and Saturday and Sunday being the peak days for police
recorded assaults and family incidents.

39
Figure 19: Mean number of police recorded assaults, family incidents, and emergency department presentations and hospital admissions due to assault for females by month
Figure 20: Mean number of police recorded assaults, family incidents, and emergency department presentations and hospital admissions due to assault for females by day of week
0
2
4
6
8
10
12
14
Jan Feb Mar Apr May Jun Jul Aug Sep Oct Nov Dec
Police recorded assaults
Family incidents
ED presentations
Hospital admissions
0
2
4
6
8
10
12
14
Mon Tue Wed Thu Fri Sat Sun
Police recorded assaults
Family incidents
ED presentations
Hospital admissions

40
Assaults and major sporting events
Among females, there were significant increases in assault related emergency presentations and
hospital admissions on the day preceding the Melbourne Cup (Figure 21). A significant increase was
found in family incidents and emergency department presentations for assault on the day of the
Melbourne Cup, and in family incidents on the day of the AFL Grand Final.

41
Figure 21: ARIMA model parameters for police recorded assaults, family incidents, and emergency department presentations and hospital admissions due to assault for females – Sporting Events
-15
-5
5
15
Form
ula
1 Gr
and
Prix
ED
Hosp
ital
Polic
e re
cord
ed a
ssau
lts
Polic
e re
cord
ed F
V
AFL G
rand
Fin
al E
D
Hosp
ital
Polic
e re
cord
ed a
ssau
lts
Polic
e re
cord
ed F
V
Mel
bour
ne C
up E
D
Hosp
ital
Polic
e re
cord
ed a
ssau
lts
Polic
e re
cord
ed F
V
-15
-5
5
15
Com
mon
wea
lth G
ames
ED
Hosp
ital
Polic
e re
cord
ed a
ssau
lts
Polic
e re
cord
ed F
V
Form
ula
1 Gr
and
Prix
ED
Hosp
ital
Polic
e re
cord
ed a
ssau
lts
Polic
e re
cord
ed F
V
Wor
ld C
up E
D
Hosp
ital
Polic
e re
cord
ed a
ssau
lts
Polic
e re
cord
ed F
V
AFL G
rand
Fin
al E
D
Hosp
ital
Polic
e re
cord
ed a
ssau
lts
Polic
e re
cord
ed F
V
Mel
bour
ne C
up E
D
Hosp
ital
Polic
e re
cord
ed a
ssau
lts
Polic
e re
cord
ed F
V
Cric
ket E
D
Hosp
ital
Polic
e re
cord
ed a
ssau
lts
Polic
e re
cord
ed F
V
-15
-5
5
15
Form
ula
1 Gr
and
Prix
ED
Hosp
ital
Polic
e re
cord
ed a
ssau
lts
Polic
e re
cord
ed F
V
AFL G
rand
Fin
al E
D
Hosp
ital
Polic
e re
cord
ed a
ssau
lts
Polic
e re
cord
ed F
V
Mel
bour
ne C
up E
D
Hosp
ital
Polic
e re
cord
ed a
ssau
lts
Polic
e re
cord
ed F
V
Event
Lead
Lag

42
Youths
Seasonal and time of week patterns
Assault related emergency department presentations and hospital admissions peaked in the warmer
months of the year, with the highest numbers of cases occurring between December and March for
emergency presentations, and in November, December, February and March for police recorded
assaults, family incidents and hospital admissions (Figure 22). As shown in Figure 23, the distribution
of assault cases for youths over the course of the week indicates that Friday and Saturday were the
days of the week with the greatest concentration of police recorded assaults, emergency department
presentations and hospital admissions for assaults, with the highest numbers of family incidents
occurring on Saturdays and Sundays.

43
Figure 22: Mean number of police recorded assaults, family incidents, and emergency department presentations and hospital admissions due to assault for youths by month
Figure 23: Mean number of police recorded assaults, family incidents, and emergency department presentations and hospital admissions due to assault for youths by day of week
0
2
4
6
8
10
12
14
Jan Feb Mar Apr May Jun Jul Aug Sep Oct Nov Dec
Police recorded assaults
Family incidents
ED presentations
Hospital admissions
0
2
4
6
8
10
12
14
16
18
20
Mon Tue Wed Thu Fri Sat Sun
Police recorded assaults
Family incidents
ED presentations
Hospital admissions

44
Assaults and major sporting events
Among males, there were significant increases in assaults on the day preceding the Melbourne Cup
(police recorded assaults and emergency presentations), Formula 1 Grand Prix (police recorded
assaults, family incidents, emergency presentations and hospital admissions), and the AFL Grand
Final (hospital admissions), with a significant decrease in police recorded assaults on the day
preceding the AFL Grand Final (Figure 24). Significant increases were found in assaults on the day of
the Melbourne Cup (police recorded assaults, family incidents and emergency department
presentations), Cricket (police recorded assaults) and AFL Grand Final (police recorded assaults,
emergency presentations and hospital admissions).

45
Figure 24: ARIMA model parameters for police recorded assaults, family incidents, and emergency department presentations and hospital admissions due to assault for youths – Sporting Events
-15
-5
5
15
Form
ula
1 Gr
and
Prix
ED
Hosp
ital
Polic
e re
cord
ed a
ssau
lts
Polic
e re
cord
ed F
V
AFL G
rand
Fin
al E
D
Hosp
ital
Polic
e re
cord
ed a
ssau
lts
Polic
e re
cord
ed F
V
Mel
bour
ne C
up E
D
Hosp
ital
Polic
e re
cord
ed a
ssau
lts
Polic
e re
cord
ed F
V
-15
-5
5
15
Com
mon
wea
lth G
ames
ED
Hosp
ital
Polic
e re
cord
ed a
ssau
lts
Polic
e re
cord
ed F
V
Form
ula
1 Gr
and
Prix
ED
Hosp
ital
Polic
e re
cord
ed a
ssau
lts
Polic
e re
cord
ed F
V
Wor
ld C
up E
D
Hosp
ital
Polic
e re
cord
ed a
ssau
lts
Polic
e re
cord
ed F
V
AFL G
rand
Fin
al E
D
Hosp
ital
Polic
e re
cord
ed a
ssau
lts
Polic
e re
cord
ed F
V
Mel
bour
ne C
up E
D
Hosp
ital
Polic
e re
cord
ed a
ssau
lts
Polic
e re
cord
ed F
V
Cric
ket E
D
Hosp
ital
Polic
e re
cord
ed a
ssau
lts
Polic
e re
cord
ed F
V
-15
-5
5
15
Form
ula
1 Gr
and
Prix
ED
Hosp
ital
Polic
e re
cord
ed a
ssau
lts
Polic
e re
cord
ed F
V
AFL G
rand
Fin
al E
D
Hosp
ital
Polic
e re
cord
ed a
ssau
lts
Polic
e re
cord
ed F
V
Mel
bour
ne C
up E
D
Hosp
ital
Polic
e re
cord
ed a
ssau
lts
Polic
e re
cord
ed F
V
Event
Lead
Lag

46
Chapter 5: Motor Vehicle Accidents
Relationships between motor vehicle accidents and sporting events were examined using two
measures of harms associated with road accidents were utilised in analyses – serious road incident
data and hospital admissions for motor vehicle accidents.
Results are presented for all cases, males and females separately, and for youth (persons aged less
than 25 years).

47
All cases
Seasonal and time of week patterns
Serious road incidents and motor vehicle accident related hospital admissions peaked in the warmer
months of the year, with the highest numbers of cases occurring between October and December,
and also in March (Figure 25). As shown in Figure 26, the distribution of motor vehicle accident cases
over the course of the week indicates that Friday and Saturday were the days of the week with the
greatest concentration of serious road incidents and hospital admissions.

48
Figure 25: Mean number of serious road incidents and hospital admissions due to motor vehicle accidents by month
Figure 26: Mean number of serious road incidents and hospital admissions due to motor vehicle accidents by day of week
0
2
4
6
8
10
12
14
16
Jan Feb Mar Apr May Jun Jul Aug Sep Oct Nov Dec
Serious road incidents
Hospital admissions
0
2
4
6
8
10
12
14
16
18
Mon Tue Wed Thu Fri Sat Sun
Serious road incidents
Hospital admissions

49
Motor vehicle accidents and major sporting events
There was a significant increase in motor vehicle accident related hospital admissions on the day
preceding the AFL Grand Final (Figure 27). Significant increases were found in motor vehicle accident
related hospital admissions during international cricket matches and the day of the AFL Grand Final,
whilst a significantly lower number of serious road incidents occurred during international cricket
matches than predicted.

50
Figure 27: ARIMA model parameters for serious road incidents and hospital admissions due to motor vehicle accidents – Sporting Events
-15
-5
5
15
Form
ula
1 Gr
and
Prix
road
in
cide
nts Ho
spita
l
AFL G
rand
Fin
al ro
ad in
cide
nts
Hosp
ital
Mel
bour
ne C
up ro
ad in
cide
nts
Hosp
ital
-15
-5
5
15
Com
mon
wea
lth G
ames
road
in
cide
nts
Hosp
ital
Form
ula
1 Gr
and
Prix
road
in
cide
nts Ho
spita
l
Wor
ld C
up ro
ad in
cide
nts
Hosp
ital
AFL G
rand
Fin
al ro
ad in
cide
nts
Hosp
ital
Mel
bour
ne C
up ro
ad in
cide
nts
Hosp
ital
Cric
ket r
oad
inci
dent
s
Hosp
ital
-15
-5
5
15
Form
ula
1 Gr
and
Prix
road
in
cide
nts Ho
spita
l
AFL G
rand
Fin
al ro
ad in
cide
nts
Hosp
ital
Mel
bour
ne C
up ro
ad in
cide
nts
Hosp
ital
Event
Lead
Lag

51
Males
Seasonal and time of week patterns
Serious road incidents and motor vehicle accident related hospital admissions peaked in the warmer
months of the year, with the highest numbers of cases occurring between October and December,
and also in March (Figure 28). As shown in Figure 29, the distribution of motor vehicle accident cases
over the course of the week indicates that Thursday, Friday and Saturday were the days of the week
with the greatest concentration of serious road incidents, and Friday and Saturday were the peak
days for motor vehicle accident related hospital admissions.

52
Figure 28: Mean number of serious road incidents and hospital admissions due to motor vehicle accidents for males by month
Figure 29: Mean number of serious road incidents and hospital admissions due to motor vehicle accidents for males by day of week
0
1
2
3
4
5
6
7
Jan Feb Mar Apr May Jun Jul Aug Sep Oct Nov Dec
Serious road incidents
Hospital admissions
0
1
2
3
4
5
6
7
Mon Tue Wed Thu Fri Sat Sun
Serious road incidents
Hospital admissions

53
Motor vehicle accidents and major sporting events
There were significant increases in motor vehicle accident related hospital admissions on the day
preceding the AFL Grand Final and the Melbourne Cup (Figure 30). A significant increase was found
in serious road incident during international cricket matches, and a significant increase for motor
vehicle accident related hospital admissions during the Formula 1 Grand Prix.

54
Figure 30: ARIMA model parameters for serious road incidents and hospital admissions due to motor vehicle accidents for males – Sporting Events
-15
-5
5
15
Form
ula
1 Gr
and
Prix
road
in
cide
nts Ho
spita
l
AFL G
rand
Fin
al ro
ad in
cide
nts
Hosp
ital
Mel
bour
ne C
up ro
ad in
cide
nts
Hosp
ital
-15
-5
5
15
Com
mon
wea
lth G
ames
road
in
cide
nts
Hosp
ital
Form
ula
1 Gr
and
Prix
road
in
cide
nts Ho
spita
l
Wor
ld C
up ro
ad in
cide
nts
Hosp
ital
AFL G
rand
Fin
al ro
ad in
cide
nts
Hosp
ital
Mel
bour
ne C
up ro
ad in
cide
nts
Hosp
ital
Cric
ket r
oad
inci
dent
s
Hosp
ital
-15
-5
5
15
Form
ula
1 Gr
and
Prix
road
in
cide
nts Ho
spita
l
AFL G
rand
Fin
al ro
ad in
cide
nts
Hosp
ital
Mel
bour
ne C
up ro
ad in
cide
nts
Hosp
ital
Event
Lead
Lag

55
Females
Seasonal and time of week patterns
Serious road incidents and motor vehicle accident related hospital admissions peaked in the warmer
months of the year, with the highest numbers of cases occurring between October and December,
and also in February and March (Figure 31). As shown in Figure 32, the distribution of motor vehicle
accident cases over the course of the week indicates that Friday and Saturday were the days of the
week with the greatest concentration of serious road incidents and motor vehicle accident related
hospital admissions.

56
Figure 31: Mean number of serious road incidents and hospital admissions due to motor vehicle accidents for females by month
Figure 32: Mean number of serious road incidents and hospital admissions due to motor vehicle accidents for females by day of week
0
1
2
3
4
5
6
7
8
9
Jan Feb Mar Apr May Jun Jul Aug Sep Oct Nov Dec
Serious road incidents
Hospital admissions
0
1
2
3
4
5
6
7
8
9
10
Mon Tue Wed Thu Fri Sat Sun
Serious road incidents
Hospital admissions

57
Motor vehicle accidents and major sporting events
There were significant increases in serious road incidents on the AFL Grand Final and a significantly
lower number of serious road incidents than predicted during international cricket matches (Figure
33). A significant increase was found in motor vehicle accident related hospital admissions during
international cricket matches.

58
Figure 33: ARIMA model parameters for serious road incidents and hospital admissions due to motor vehicle accidents for females – Sporting Events
-15
-5
5
15
Form
ula
1 Gr
and
Prix
road
in
cide
nts Ho
spita
l
AFL G
rand
Fin
al ro
ad in
cide
nts
Hosp
ital
Mel
bour
ne C
up ro
ad in
cide
nts
Hosp
ital
-15
-5
5
15
Com
mon
wea
lth G
ames
road
in
cide
nts
Hosp
ital
Form
ula
1 Gr
and
Prix
road
in
cide
nts Ho
spita
l
Wor
ld C
up ro
ad in
cide
nts
Hosp
ital
AFL G
rand
Fin
al ro
ad in
cide
nts
Hosp
ital
Mel
bour
ne C
up ro
ad in
cide
nts
Hosp
ital
Cric
ket r
oad
inci
dent
s
Hosp
ital
-15
-5
5
15
Form
ula
1 Gr
and
Prix
road
in
cide
nts Ho
spita
l
AFL G
rand
Fin
al ro
ad in
cide
nts
Hosp
ital
Mel
bour
ne C
up ro
ad in
cide
nts
Hosp
ital
Event
Lead
Lag
59
Youths
Seasonal and time of week patterns
Serious road incidents and motor vehicle accident related hospital admissions peaked in the warmer
months of the year, with the highest numbers of cases among youths occurring between October and
December, and also in February and March (Figure 34). As shown in Figure 35, the distribution of
motor vehicle accident cases over the course of the week indicates that Friday and Saturday were the
days of the week with the greatest concentration of serious road incidents and motor vehicle accident
related hospital admissions.

60
Figure 34: Mean number of serious road incidents and hospital admissions due to motor vehicle accidents for youths by month
Figure 35: Mean number of serious road incidents and hospital admissions due to motor vehicle accidents for youths by day of week
0
0.5
1
1.5
2
2.5
3
3.5
4
Jan Feb Mar Apr May Jun Jul Aug Sep Oct Nov Dec
Serious road incidents
Hospital admissions
0
0.5
1
1.5
2
2.5
3
3.5
4
4.5
Mon Tue Wed Thu Fri Sat Sun
Serious road incidents
Hospital admissions

61
Motor vehicle accidents and major sporting events
Among youths, there were significant increases in serious road incidents on the day of the Melbourne
Cup and also the AFL Grand Final and a significantly lower number of serious road incidents than
predicted during international cricket matches (Figure 36).

62
Figure 36: ARIMA model parameters for serious road incidents and hospital admissions due to motor vehicle accidents for youths – Sporting Events
-15
-5
5
15
Form
ula
1 Gr
and
Prix
road
inci
dent
s
Hosp
ital
AFL G
rand
Fin
al ro
ad in
cide
nts
Hosp
ital
Mel
bour
ne C
up ro
ad in
cide
nts
Hosp
ital
-15
-5
5
15
Com
mon
wea
lth G
ames
road
in
cide
nts
Hosp
ital
Form
ula
1 Gr
and
Prix
road
in
cide
nts Ho
spita
l
Wor
ld C
up ro
ad in
cide
nts
Hosp
ital
AFL G
rand
Fin
al ro
ad in
cide
nts
Hosp
ital
Mel
bour
ne C
up ro
ad in
cide
nts
Hosp
ital
Cric
ket r
oad
inci
dent
s
Hosp
ital
-15
-5
5
15
Form
ula
1 Gr
and
Prix
road
in
cide
nts Ho
spita
l
AFL G
rand
Fin
al ro
ad in
cide
nts
Hosp
ital
Mel
bour
ne C
up ro
ad in
cide
nts
Hosp
ital
Event
Lead
Lag

63
Chapter 6: Discussion
Harms associated with alcohol consumption in the context of major sporting events were explored in
terms of general patterns, gender patterns and age patterns. A range of alcohol-related harms were
considered, including acute intoxication requiring medical attention, assaults, and motor vehicle
accidents. The use of time series analysis allows exploration of the levels of harms associated with
specific events after controlling for the impact of seasonal and temporal variations in alcohol-related
harms.
Findings Acute Alcohol Intoxication Across all populations examined, the peak months of the year for ambulance attendances,
emergency department presentations, and hospital admissions attributed to acute alcohol intoxication
were November and December, with February also being identified as a peak month among males.
Consistent with the literature, Fridays and Saturdays were the days with the highest concentrations of
alcohol intoxication related attendances, presentations and admissions.
Varying effects were noted for major sporting events. Significantly elevated numbers of cases of acute
alcohol intoxication were evident for all groups examined on the day before the Melbourne Cup, whilst
elevated cases were seen for all patients and for males on the day before the AFL Grand Final. For all
groups examined, elevated cases of alcohol intoxication occurred on the day of the Melbourne Cup,
and also for all groups except females on the day of the AFL Grand Final and the event of the
Commonwealth Games. Numbers of ambulance attendances for acute intoxication were significantly
lower than expected on the day following the Melbourne Cup for all patients, and this was driven by
the trend among females.
Assault
Consistent with previous research, the warmer months of the year represent peak times for assaults
among all groups examined. Similarly, Friday and Saturday are the days of the week with the most
assaults recorded across emergency department and hospital measures examined for all groups, with
Sundays also being a peak day for females. In terms of police recorded assaults and family incidents,
Saturdays and Sundays represented the peak days.
The Melbourne Cup represented a sporting event where assaults were elevated both in the lead up
and on the day of the event for all groups examined, whilst the day preceding the AFL Grand Final
and the Formula 1 Grand Prix were days of elevated assaults for all groups except females. On the
day of the Melbourne Cup all groups experienced significantly increased numbers of assault cases,
while all groups except females showed elevated numbers of cases of assault on the day of the AFL

64
Grand Final. Police recorded family incidents were significantly elevated on Melbourne Cup Day for all
groups, and among females on the day of the AFL Grand Final.
Motor Vehicle Accidents
Smaller effects were noted for motor vehicle accidents in measures of incidents and also
hospitalisations.
The warmer months of the year were the peak times for motor vehicle accidents. For all groups,
Friday and Saturday were found to be peak days of elevated cases of motor vehicle accidents, with
elevated events also occurring on Thursdays among males.
For males, a significant increase in motor vehicle accident presentations was noted on the day before
the AFL Grand Final and the Melbourne Cup. There was an increase in MVA cases on the day of the
AFL Grand Final among females and youths, whilst for the cricket there was a significant elevation
among males and females, and a significant reduction among youths. On the day of the Melbourne
Cup increased MVAs were noted among youths, with an increase in MVAs on the day of the Formula
One Grand Prix for males.
Implications
The results presented indicate that alcohol-related harms are experienced and treated in patterns of
peaks and troughs that are influenced by seasonal, temporal, social and cultural factors. The types
and range of harms differ across sporting events.
For all measures of alcohol-related harms, peaks in cases were noted for the warmer months of the
year, and for Fridays and Saturdays. This is consistent with previous research as well as the
feedback from emergency services staff, who have identified that troughs in alcohol-related harms in
the cooler months tend to be ‘filled’ by presentations for non-alcohol-related conditions. However, the
winter months are peak times of activity for some sectors – for example, as the football season runs
from March to September, a significant focus for game planning and resourcing relates to minimising
and responding to alcohol-related harms. Assessment and recognition of the impact of the timing of
events and how alcohol-related harms may cluster are useful in terms of effective planning of events,
as well as response to alcohol-related harms.
Whilst many service providers noted that public holidays were known to be peak periods of activity in
responding to alcohol-related harms, the strongly significant findings in terms of elevated harms in the
lead up to public holidays represented new information that can potentially provide information
regarding where to direct prevention, screening and intervention opportunities. The clustering of
different kinds of harms around different public holidays indicates that specific cultural and social

65
aspects of drinking and acceptability of intoxication may play a key role in the risks and harms people
experience.
A focus on specific events or occasions for public education may present good opportunities to target
prevention and intervention. Limited resources play a role in the ability to target intervention,
particularly during periods of high demand. Key experts identified the importance of communication
and collaboration across services for planning, intervention and harm reduction. These linkages can
aid in the development and maintenance of sustainable approaches to address the impact of alcohol
on the community and on service delivery.
Limitations
It is inherently difficult to accurately measure alcohol-related trends in administrative datasets. As
noted above, emergency presentation coding is somewhat problematic in terms of alcohol-related
harms as it is not possible to code both intoxication and assault for a single presentation. The mutual
exclusivity of the categories for coding mean that the opportunity to explore the nature of alcohol-
related emergency presentations is limited. However, reasonable assumptions can be made
regarding the involvement of alcohol in assaults coded for presentations, particularly given the
consistent in temporal and seasonal trends across the three measures presented.
Some events may overlap, thereby impacting on the ability to assess patterns in harms
independently. For example, the Melbourne Cup is a major sporting event, and is also marked with a
public holiday in Melbourne, which occurs on the first Tuesday in November. In addition, a number of
sporting events are scheduled for public holidays, such as cricket international cricket matches
occurring on Boxing Day or Australia Day. This means that effects may not be easily disentangled.
These issues may need additional exploration and data collection, and this is being addressed in this
project through qualitative data collection with key experts in service delivery and event planning.
Future Directions
The results of this project have highlighted some significant new evidence in relation to the
relationships between public holidays, sporting and social events and a range of alcohol-related
harms that have implications for research, policy and practice. Further questions and opportunities for
exploration have emerged from this work, and warrant further consideration for future research.
The impact of weather conditions on patterns of alcohol consumption and harms is a potential factor
that may influence drinking behaviour, and also harms. Further analysis of seasonal effects and also
the relationships between social, sporting and cultural events in relation to meteorological variations in
weather and precipitation would be useful – both in explaining some of the variations seen, and also
in terms of opportunities for monitoring and prevention planning.

66
There are opportunities to extend the analyses undertaken here to include additional events of
interest. These may include music and arts festivals, and also events such as ‘Schoolies’ week
celebrations. Whilst there are limitations to the ability to explore many overlapping events, it would be
beneficial to examine a range of events that may be related to intoxication related harms for specific
populations of interest in the community, such as young people.
Conclusion
There has been little analysis of the occurrence of alcohol-related harm in relation to major public and
social events in Victoria. There is a need for the development of an evidence base in terms of alcohol-
related harms in the context of the timing and nature of major social events. Such evidence can
inform the development and refinement of policy and intervention in relation to public health initiatives,
emergency services and hospital staffing and resource planning, and also event planning. Targeting
of prevention, intervention and treatment resources will provide a basis for reducing the extent of
alcohol-related harms in the community.

67
References
Abel, E. L., Strasburger, E. L., & Zeidenberg, P. (1985). Seasonal, monthly, and day-of-week trends in
homicide as affected by alcohol and race. Alcoholism: Clinical and Experimental Research,
9(3), 281-283.
Brinkman, S., Chikritzhs, T., Stockwell, T., & Mathewson, P. (2001). An Indicator Approach to the
Measurement of Alcohol-Related Violence. In P. Williams (Ed.), Alcohol, Young Persons and
Violence. Canberra: Australian Institute of Criminology.
Briscoe, S., & Donnelly, N. (2001). Assaults on licensed premises in inner-urban areas. Perth: Curtin
University.
Brower, A. M., & Carroll, L. (2007). Spatial and temporal aspects of alcohol-related crime in a college
town. Journal of American College Health, 55(5), 267-275.
Budd, T. (2000). Alcohol-related assault: findings from the British Crime Survey. London: Home
Office.
Bushman, B. J., & Cooper, H. M. (1990). Effects of alcohol on human-aggression - an integrative
research review. Psychological Bulletin, 107(3), 341-354.
Chan, S. B., & Quinn, E. J. (2003). Outcomes In EMS-transported attendees from events at a large
indoor arena. Prehospital Emergency Care, 7(3), 332-335.
Cooke, M. W., Allan, T. F., & Wilson , S. (1999). A major sporting event does not necessarily mean an
increased workload for accident and emergency departments. Euro96 Group of Accident and
Emergency Departments. . British Journal of Sports Medicine, 33(5), 333-335.
Crawford, M., Donnelly, J., Gordon, J., MacCallum, R., MacDonald, I., McNeill, M., et al. (2001). An
analysis of consultations with the crowd doctors at Glasgow Celtic football club, season 1999-
2000. British Journal of Sports Medicine, 35(4), 245-249.
Deakin, C. D., Thompson, F., Gibson, C., & Green, M. (2007). Effects of international football matches
on ambulance call profiles and volumes during the 2006 World Cup. Emergency Medicine
Journal, 24:((6)), 405-407.
Erickson, T., Aks, S., Koenigsberg, M., Bunney, E., Schurgin, B., & P., L. (1996). Drug use patterns at
major rock concert events. Annals of Emergency Medicine, Volume 28(Issue 1,), Pages 22-26.
Feldman, M. J., Lukins, J. L., Verbeek, P. R., MacDonald R.D., Burgess, R. J., & Schwartz, B. (2004).
Half-a-million strong: the Emergency Medical Services response to a single-day, mass-
gathering event. Prehospital and Disaster Medicine, 19(4), 287-296.
Furr-Holden, D., Voas, R. B., Kelley-Baker, T., & Miller, B. (2006). Drug and alcohol-impaired driving
among electronic music dance event attendees. Drug and Alcohol Dependence, 85(1), 83-86.
Glassman, T., Chudley, E., Werch, E. J., & Bian, H. (2007). Alcohol-related fan behaviour on college
football game day. Journal of American College Health, 56(3), 255-261.
Grange, J. T., Baumann, G. W., & Vaezazizi, R. (2003). On-site physicians reduce ambulance
transports at mass gatherings. Prehospital Emergency Care, 7(3), 322-326.
Grossbard, J., Geisner, I. M., Neighbors, C., Kilmer, J. R., & Larimer, M. E. (2007). Are drinking
games sports? College athlete participation in drinking games and alcohol-related problems.
Journal of Studies on Alcohol and Drugs, 68(1), 97-105.

68
Hunter, G. T. (1990). A survey of the social context of drinking among college women. Journal of
Alcohol and Drug Education, 35(3), 73-80.
Ito, T., Miller, N., & Pollock, V. (1996). Alcohol and aggression: a meta-analysis on the moderating
effects of inhibitory cues, triggering events and self focused attention. Psychological Bulletin,
120(1), 60-82.
Lenk, K. M., Toomey, T. L., & Erickson, D. J. (2009). Alcohol-related problems and enforcement at
professional sports stadiums. Drugs-Education Prevention and Policy, 16(5), 451-462.
Mattick, A. P. (1999). The Football World Cup 1998: an analysis of related attendances to an accident
and emergency department. Scottish Medical Journal, 44(3), 75-76.
McGreevy, A., Millar, L., Murphy, B., Davison, G. W., Brown, R., & O’Donnell, M. E. (2010). The effect
of sporting events on emergency department attendance rates in a district general hospital in
Northern Ireland. International Journal of Clinical Practice, 64(11), 1563-1569.
Merlo, L. J., & Hong, J. (2008). Alcohol-related arrests on holidays, college football game days, and
control day. Alcoholism-Clinical and Experimental Research, 32(6), 75A-75A.
Moore, S. C., Shepherd, J. P., Eden, S., & Sivarajasingam, V. (2007). The effect of rugby match
outcome on spectator aggression and intention to drink alcohol. Criminal Behavior and Mental
Health, 17(2), 118-127.
Mosher, J., & Jernigan, D. (2001). Making the link: a public health approach to preventing alcohol-
related violence and crime. Journal of Substance Use, 6(4), 273-289.
Neal, D. J., & Fromme, K. (2006). Hook'em horns and heavy drinking: Alcohol use and collegiate
sports. Alcoholism-Clinical and Experimental Research, 30(6), 52A-52A.
Neal, D. J., & Fromme, K. (2007). Event-level relations among college sports, alcohol use, and
alcohol-related consequences across two football seasons. Alcoholism-Clinical and
Experimental Research, 31(6), 168A-168A.
Neal, D. J., Sugarman, D. E., Hustad, J. T., Caska, C. M., & Carey, K. B. (2005). It's all fun and
games ... or is it? Collegiate sporting events and celebratory drinking. Journal of Studies on
Alcohol, 66(March), 291-294.
Nelson, T. F., & Wechsler, H. (2003). School spirits: alcohol and collegiate sports fans. Addictive
Behaviors, 28(1), 1-11.
O'Donnell, J. J., Mattick, A. P., Mehta, R., & Hanrahan, H. (2003). The Football World Cup 2002--
analysis of related attendances to an Irish Emergency Department. Irish Medical Journal, 96(3),
90-91.
Paschall, M. J., & Saltz, R. F. (2007). Relationships between college settings and student alcohol use
before, during and after events: a multi-level study. Drug and Alcohol Review, 26(6), 635-644.
Pederson, W. C., Fredy, E. A., Ito, T. A., Miller, M., & Pollock, V. (2002). Psycholological
experimentation on alcohol-induced human aggression. Aggression and Violent Behavior, 7(3),
293-312.
Poikolainen, K., Leppanen, K., & Vuori, E. (2002). Alcohol sales and fatal alcohol poisonings: a time-
series analysis. Addiction, 97(8), 1037-1040.

69
Pridemore, W. A. (2004). Weekend effects on binge drinking and homicide: the social connection
between alcohol and violence in Russia. Addiction, 99(8), 1034-1041.
Rabow, J., & Duncan-Schill, M. (1995). Drinking among college students. Journal of Alcohol and Drug
Education, 40(3), 52-64.
Rees, D. I., & Schnepel, K. T. (2008). College football games and crime. Denver: University of
Colorado.
Rees, D. I., & Schnepel, K. T. (2009). College Football Games and Crime. Journal of Sports
Economics, 10(1), 68-87.
Roche, A., Bywood, P., Borlagdan, J., Lunnay, B., Freeman, T., Lawton, L., et al. (2007). Young
People and Alcohol: The Role of Cultural Influences. Adelaide: National Centre for Education
and Training on Addiction.
Sachs, C. J., & L.D., C. (2000). The association between professional football games and domestic
violence in Los Angeles County. Journal of Interpersonal Violence, Vol. 15( No. 11), 1192-1201.
Silm, S., & Ahas, R. (2005). Seasonality of alcohol-related phenomena in Estonia. International
Journal of Biometeorology, 49(4), 215-213.
Sivarajasingam, V., Moore, S., & Shepherd, J. P. (2005). Winning, Losing, And Violence. Injury
Prevention, 11(2), 69(62).
Stockwell, T., Masters, L., Philips, M., Daly, A., Gahegan, M., Midford, R., et al. (1998). Consumption
of different alcoholic beverages as predictors of local rates of night-time assault and acute
alcohol-related morbidity. Australian and New Zealand Journal of Public Health, 22(2), 237-242.
Thompson , K., Palmer, C., & Raven, M. (2006). Alcohol in the lives of Australian Rules Football fans:
Social meanings and public health implications. Adelaide: Flinders University.
Victoria Police (2009) Living free from violence – upholding the right: Victoria Police strategy to
reduce violence against women and children 2009-2014 Victoria Police, Melbourne.
Vingilis, E., Liban, C. B., Blefgen, H., Colbourne, D., & Reynolds, D. (1992). Introducing beer sales at
a Canadian ball park - the effect on motor vehicle accidents. Accident Analysis and Prevention,
24(5), 521-526.
White, G. F., Katz, J., & Scarborough, K. E. (1992). The impact of professional football games upon
violent assaults on women. Violence and Victims, 7, 151-157.
Yaffee, R. & McGee, M. (2000) Introduction to time series analysis and forecasting: With applications
of SAS and SPSS. San Diego, Academic Press.
Young, D. J., Stockwell, T., Cherpitel, C.J., Ye, Y.,Macdonald,S., Borges, G.,Giesbrecht H. (2004).
Emergency Room Injury Presentations as an Indicator of Alcohol-Related Problems in the
Community: A Multilevel Analysis of an International Study. J Studies on Alcohol and Drugs,
65(5), 605-612.
Zhang, L., Wieczorek, W. F., & Welte, J. W. (1997). The nexus between alcohol and violent crime.
Alcoholism: Clinical and Experimental Research, 21(7), 1264-1271.

70
Appendix A
Table 1: Selected sporting events examined in this report
Event Description Date Melbourne Cup Major sporting event and public
holiday in Melbourne First Tuesday in November
Formula 1 Grand Prix Major sporting event Saturday in early March (April in 2006) One Day International Cricket matches involving Australia
Major sporting events December to February, no fixed dates (approx 6 per year)
AFL Grand Final Major sporting event Last Saturday in September International soccer matches involving Australia
Major sporting events No fixed dates (approx 1 per year)
Commonwealth Games Major sporting event 15/3/2006 to 26/3/2006 World cup soccer matches involving Australia
Major sporting events (matches held outside Melbourne, but large crowds gathered in public spaces to watch televised coverage)
12/6/2006, 17/6/2006, 22/6/2006, 26/6/2006
Top Related