


Languages
Pages
Legal

Refractories ManufacturingNESHAP: Industry Profile,
Methodology, and EconomicImpact Analysis
Draft Report
Prepared for
Lisa ConnerU.S. Environmental Protection Agency
Office of Air Quality Planning and StandardsInnovative Strategies and Economics Group (MD-15)
Research Triangle Park, NC 27711
EPA Contract Number 68-D-99-024
RTI Project Number 7647.002.138
March 2001
EPA Contract Number RTI Project Number68-D-99-024 7647.002.138
Refractories ManufacturingNESHAP: Industry Profile,
Methodology, and EconomicImpact Analysis
Draft Report
March 2001
Prepared for
Lisa ConnerU.S. Environmental Protection Agency
Office of Air Quality Planning and StandardsInnovative Strategies and Economics Group (MD-15)
Research Triangle Park, NC 27711
Prepared by
Katherine B. HellerA. Michelle Bullock
Research Triangle InstituteCenter for Economics Research
Research Triangle Park, NC 27709
DRAFT
iii
CONTENTS
Section Page
1 Introduction . . . . . . . . . . . . . . . . . . . . . . . . . . . . . . . . . . . . . . . . . . . . . . . . . . . . 1-1
2 The Supply Side . . . . . . . . . . . . . . . . . . . . . . . . . . . . . . . . . . . . . . . . . . . . . . . . . 2-1
2.1 Production Process, Inputs and Outputs . . . . . . . . . . . . . . . . . . . . . . . . 2-12.1.1 Machines Used in the Production Process . . . . . . . . . . . . . . . . . 2-4
2.1.1.1 Mixing/Kneading Machines . . . . . . . . . . . . . . . . . . . . 2-42.1.1.2 Presses . . . . . . . . . . . . . . . . . . . . . . . . . . . . . . . . . . . . . 2-42.1.1.3 Kilns . . . . . . . . . . . . . . . . . . . . . . . . . . . . . . . . . . . . . . 2-7
2.1.2 Final Commodities . . . . . . . . . . . . . . . . . . . . . . . . . . . . . . . . . . . 2-82.1.2.1 Shaped Refractories . . . . . . . . . . . . . . . . . . . . . . . . . . 2-82.1.2.2 Unshaped Refractories . . . . . . . . . . . . . . . . . . . . . . . . 2-8
2.1.3 Emissions and Controls in Refractory Manufacturing . . . . . . . 2-102.1.3.1 PM and Metals Emissions . . . . . . . . . . . . . . . . . . . . . 2-102.1.3.2 Gaseous and VOC Emissions . . . . . . . . . . . . . . . . . . 2-10
2.1.4 Inputs . . . . . . . . . . . . . . . . . . . . . . . . . . . . . . . . . . . . . . . . . . . . 2-102.1.4.1 Clays . . . . . . . . . . . . . . . . . . . . . . . . . . . . . . . . . . . . . 2-102.1.4.2 Nonclays . . . . . . . . . . . . . . . . . . . . . . . . . . . . . . . . . . 2-12
2.2 Types of Products . . . . . . . . . . . . . . . . . . . . . . . . . . . . . . . . . . . . . . . . . 2-12
2.3 Costs of Production . . . . . . . . . . . . . . . . . . . . . . . . . . . . . . . . . . . . . . . 2-122.3.1 Cost Data . . . . . . . . . . . . . . . . . . . . . . . . . . . . . . . . . . . . . . . . . 2-12
2.4 Supply Trends . . . . . . . . . . . . . . . . . . . . . . . . . . . . . . . . . . . . . . . . . . . 2-14
3 The Demand Side . . . . . . . . . . . . . . . . . . . . . . . . . . . . . . . . . . . . . . . . . . . . . . . . 3-1
3.1 Product Characteristics . . . . . . . . . . . . . . . . . . . . . . . . . . . . . . . . . . . . . 3-1
3.2 Uses and Consumers . . . . . . . . . . . . . . . . . . . . . . . . . . . . . . . . . . . . . . . 3-1
3.3 Substitution Possibilities in Consumption . . . . . . . . . . . . . . . . . . . . . . . 3-4
DRAFT
iv
4 Industry Organization . . . . . . . . . . . . . . . . . . . . . . . . . . . . . . . . . . . . . . . . . . . . . 4-1
4.1 Refractory Manufacturing Plants . . . . . . . . . . . . . . . . . . . . . . . . . . . . . . 4-14.1.1 Refractories Database Facilities . . . . . . . . . . . . . . . . . . . . . . . . . 4-14.1.2 Facility Location . . . . . . . . . . . . . . . . . . . . . . . . . . . . . . . . . . . . 4-1
4.2 Capacity Utilization . . . . . . . . . . . . . . . . . . . . . . . . . . . . . . . . . . . . . . . . 4-9
4.3 Industry Concentration and Market Structure . . . . . . . . . . . . . . . . . . . 4-114.3.1 Measures of Industry Concentration . . . . . . . . . . . . . . . . . . . . 4-124.3.2 Market Structure . . . . . . . . . . . . . . . . . . . . . . . . . . . . . . . . . . . 4-13
4.4 Current Trends in the Refractory Industry . . . . . . . . . . . . . . . . . . . . . . 4-13
5 Markets . . . . . . . . . . . . . . . . . . . . . . . . . . . . . . . . . . . . . . . . . . . . . . . . . . . . . . . 5-1
5.1 Market Data . . . . . . . . . . . . . . . . . . . . . . . . . . . . . . . . . . . . . . . . . . . . . . 5-15.1.1 Domestic Production . . . . . . . . . . . . . . . . . . . . . . . . . . . . . . . . . 5-15.1.2 International Trade . . . . . . . . . . . . . . . . . . . . . . . . . . . . . . . . . . . 5-1
5.2 Market Prices . . . . . . . . . . . . . . . . . . . . . . . . . . . . . . . . . . . . . . . . . . . . . 5-3
5.3 Industry Trends . . . . . . . . . . . . . . . . . . . . . . . . . . . . . . . . . . . . . . . . . . . 5-4
References . . . . . . . . . . . . . . . . . . . . . . . . . . . . . . . . . . . . . . . . . . . . . . . . . . . . . . . . . . . R-1

DRAFT
v
LIST OF FIGURES
Number Page
2-1a Refractory Manufacturing Process Flow Diagram . . . . . . . . . . . . . . . . . . . . . . . 2-22-1b Specific Production Processes . . . . . . . . . . . . . . . . . . . . . . . . . . . . . . . . . . . . . . 2-32-2 Scheme of Mixer and Kneading Machines . . . . . . . . . . . . . . . . . . . . . . . . . . . . 2-52-3 Vacuum Press (Friction, Hydraulic Press) . . . . . . . . . . . . . . . . . . . . . . . . . . . . . 2-62-4 Friction Press (A), and Hydraulic Screw Press (B) . . . . . . . . . . . . . . . . . . . . . . 2-62-5 Vibrating Press . . . . . . . . . . . . . . . . . . . . . . . . . . . . . . . . . . . . . . . . . . . . . . . . . . 2-62-6 Cross Section of CIP . . . . . . . . . . . . . . . . . . . . . . . . . . . . . . . . . . . . . . . . . . . . . 2-62-7 Tunnel Kiln . . . . . . . . . . . . . . . . . . . . . . . . . . . . . . . . . . . . . . . . . . . . . . . . . . . . 2-72-8 Round Kiln and Downdraft System . . . . . . . . . . . . . . . . . . . . . . . . . . . . . . . . . . 2-82-9 Shuttle Kiln . . . . . . . . . . . . . . . . . . . . . . . . . . . . . . . . . . . . . . . . . . . . . . . . . . . . 2-8
4-1 Location of Refractory Manufacturing Facilities . . . . . . . . . . . . . . . . . . . . . . . 4-10
DRAFT
vi
LIST OF TABLES
Number Page
2-1 Types and Descriptions of Refractories Produced . . . . . . . . . . . . . . . . . . . . . . . 2-92-2 Types and Characteristics of Raw Materials used in Refractory
Manufacture Type . . . . . . . . . . . . . . . . . . . . . . . . . . . . . . . . . . . . . . . . . . . . . . 2-112-3 Labor, Material, and New Capital Expenditures for Clay Refractory
Manufacturers (NAICS 327124) . . . . . . . . . . . . . . . . . . . . . . . . . . . . . . . . . . . 2-132-4 Labor, Material, and New Capital Expenditures for Nonclay
Refractory Manufacturers (NAICS 327125) . . . . . . . . . . . . . . . . . . . . . . . . . . 2-142-5 Costs of Materials Used in Refractory Production and Manufacture . . . . . . . 2-16
3-1 Characteristics and Types of Refractories . . . . . . . . . . . . . . . . . . . . . . . . . . . . . 3-23-2 Steel and Nonferrous Production (103 Metric Tons) . . . . . . . . . . . . . . . . . . . . . 3-4
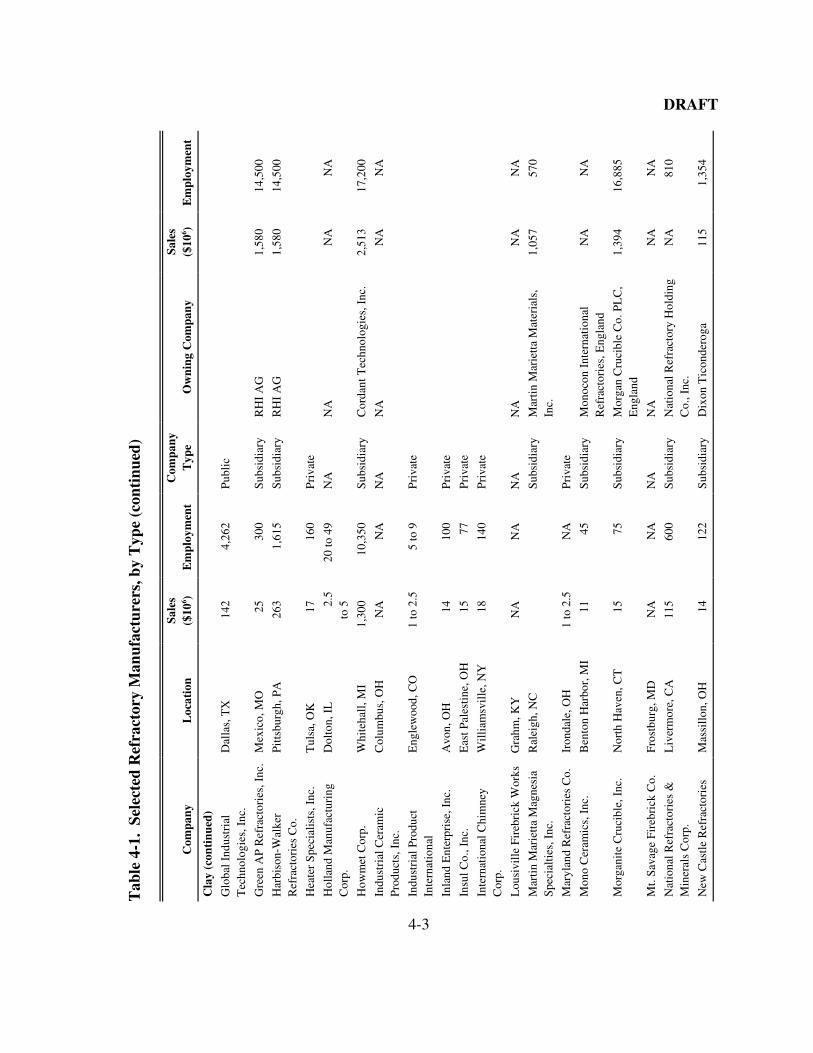
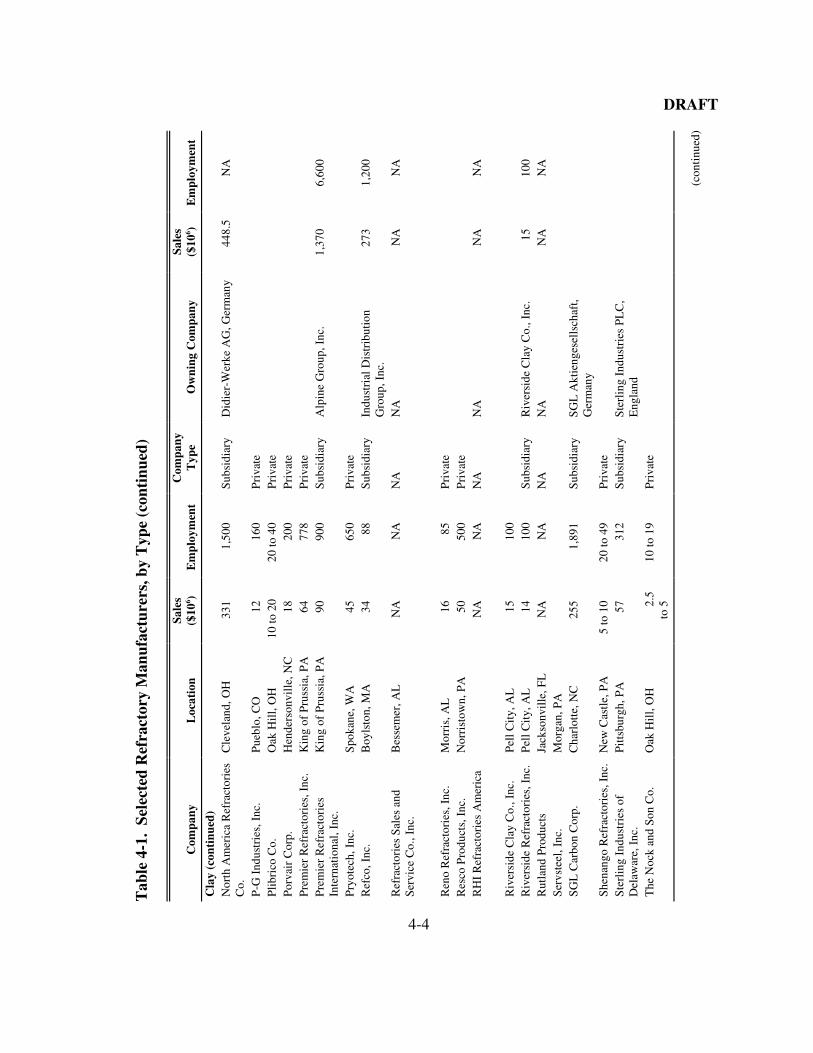
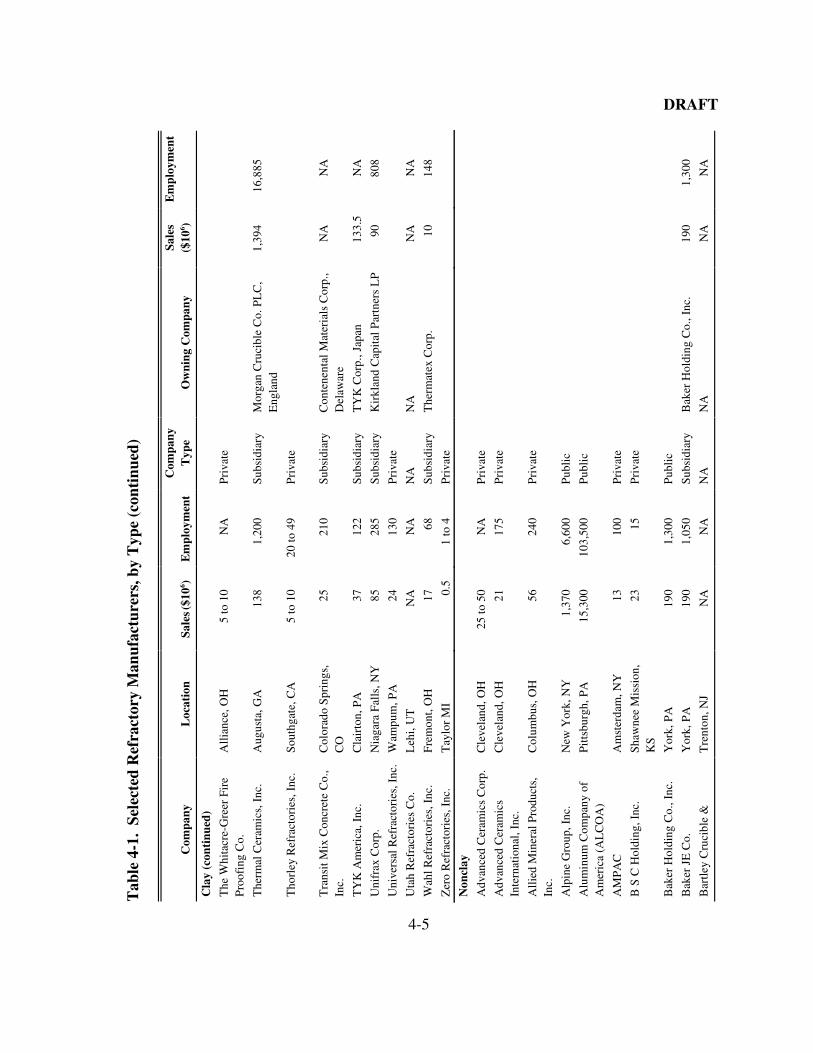
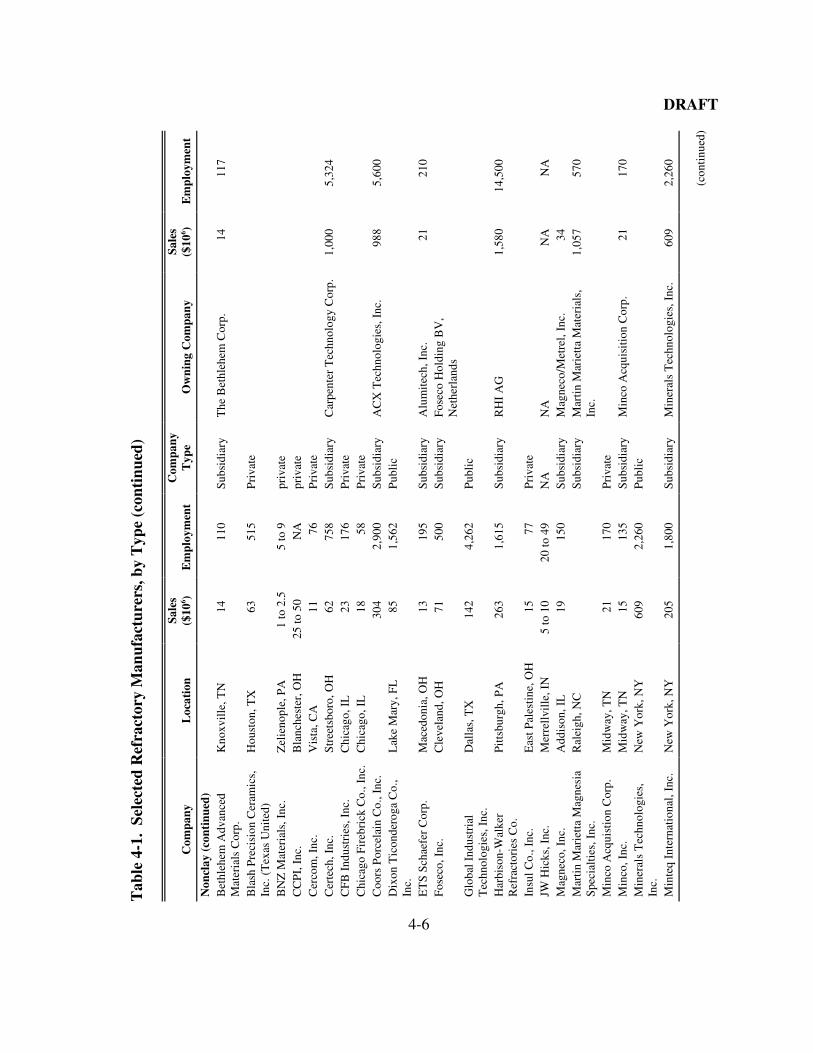
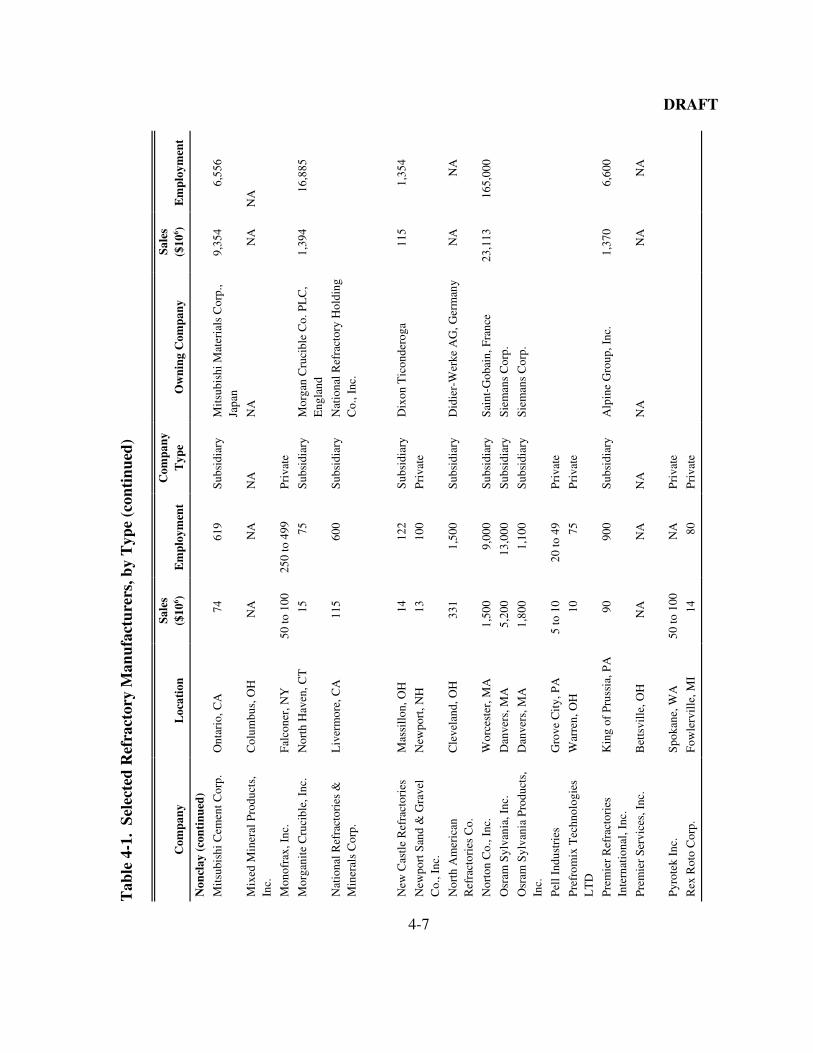
4-1 Selected Refractory Manufacturers, by Type . . . . . . . . . . . . . . . . . . . . . . . . . . . 4-24-2 Number of Refractory Manufacturing Facilities by State . . . . . . . . . . . . . . . . . 4-94-3 Full Production Capacity Utilization Rates for Clay and Nonclay
Refractories: Fourth Quarters 1993 through 1998 . . . . . . . . . . . . . . . . . . . . . 4-114-4 Market Concentration Measures for SIC 3255 Clay Refractory
Manufacturing and SIC 3297 Nonclay Refractory Manufacturing . . . . . . . . . 4-12
5-1 Production of Refractories: 1977–1998 ($106) . . . . . . . . . . . . . . . . . . . . . . . . . 5-25-2 Exports and Imports of Refractories: 1993–1999 ($106 1998) . . . . . . . . . . . . . 5-35-3 Average Price for Refractory Products . . . . . . . . . . . . . . . . . . . . . . . . . . . . . . . 5-3
DRAFT
1-1
SECTION 1
INTRODUCTION
The U.S. Environmental Protection Agency’s (EPA’s) Office of Air Quality Planning
and Standards (OAQPS) is compiling information on refractory manufacturing plants as part
of its responsibility to develop National Emission Standards for Hazardous Air Pollutants
(NESHAP) under Section 112 of the 1990 Clean Air Act. The NESHAP is scheduled to be
proposed in 2001. This industry profile of the refractory manufacturing industry provides
information to support the regulation.
A refractory is a material that retains its shape and chemical identity when subjected
to high temperatures and is used in applications that require extreme resistance to heat.
Specifically, refractories must be able to withstand temperatures above 538°C (1,000°F).
Refractories are mechanically strong and heat resistant to withstand rapid temperature
change and corrosion and erosion by molten metal, glass, slag, and hot gas. Refractories are
used in kilns, furnaces, boilers, incinerators, and other applications.
Refractory manufacturing falls under the North American Industry Code System
(NAICS) 327124 for clay refractories and NAICS 327125 for nonclay refractories.
According to the 1997 Census of Manufactures, 149 establishments owned by 115
companies manufactured clay refractories, and 124 establishments owned by 90 companies
manufactured nonclay refractories in 1997 (U.S. Department of Commerce, 1999b, 1999c).
In 1998, the refractory industry employed 13,709 people and shipped products valued at over
$2.6 billion (U.S. Department of Commerce, 2000).
The primary pollutants in the refractory industry are particulate matter (PM). These
emissions occur during the crushing, grinding, screening, calcining, and drying phases of
refractory manufacture. Other pollutants include sulfur dioxide (SO2), nitrogen oxide (NOx),
carbon monoxide (CO), carbon dioxide (CO2), hydrogen fluoride (HF) and volatile organic
compounds (VOCs). The NESHAP will most directly affect facilities that produce organic-
bonded products that include resins, pitch, and other organics in addition to refractory
materials. The pitch-impregnated refractory manufacturing process is expected to be
regulated for polycyclic organic matter (POM) during a thermal processing step.
DRAFT
1-2
This industry profile report is organized as follows. Section 2 provides a detailed
description of the production process for refractories, with discussion of individual refractory
products, inputs, and costs of production. Section 3 describes the characteristics, uses and
consumers of refractories, and substitution possibilities. Section 4 discusses the organization
of the industry and provides facility- and company-level data. In addition, small businesses
are reported separately for use in evaluating the impact on small business to meet the
requirements of the Small Business Regulatory Enforcement and Fairness Act (SBREFA).
Section 5 contains market-level data on prices and quantities and discusses trends and
projections for the industry.
DRAFT
2-1
SECTION 2
THE SUPPLY SIDE
Estimating the economic impacts associated with the options to regulate the
refractory manufacturing industry requires characterizing the industry. This section
describes the production process, inputs, and outputs of this process. In addition,
characterizing the supply side of the industry involves describing various types of refractory
products, by-products, and input substitution possibilities. This section describes costs of
production and economies of scale.
2.1 Production Process, Inputs, and Outputs
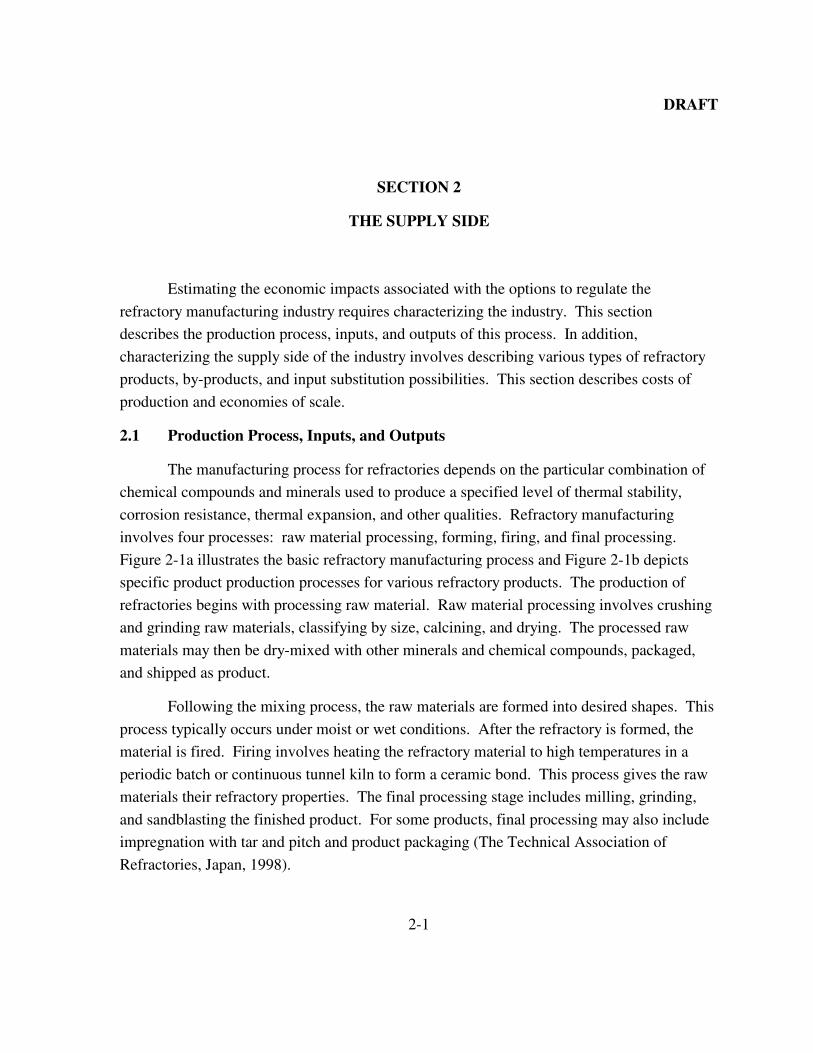
The manufacturing process for refractories depends on the particular combination of
chemical compounds and minerals used to produce a specified level of thermal stability,
corrosion resistance, thermal expansion, and other qualities. Refractory manufacturing
involves four processes: raw material processing, forming, firing, and final processing.
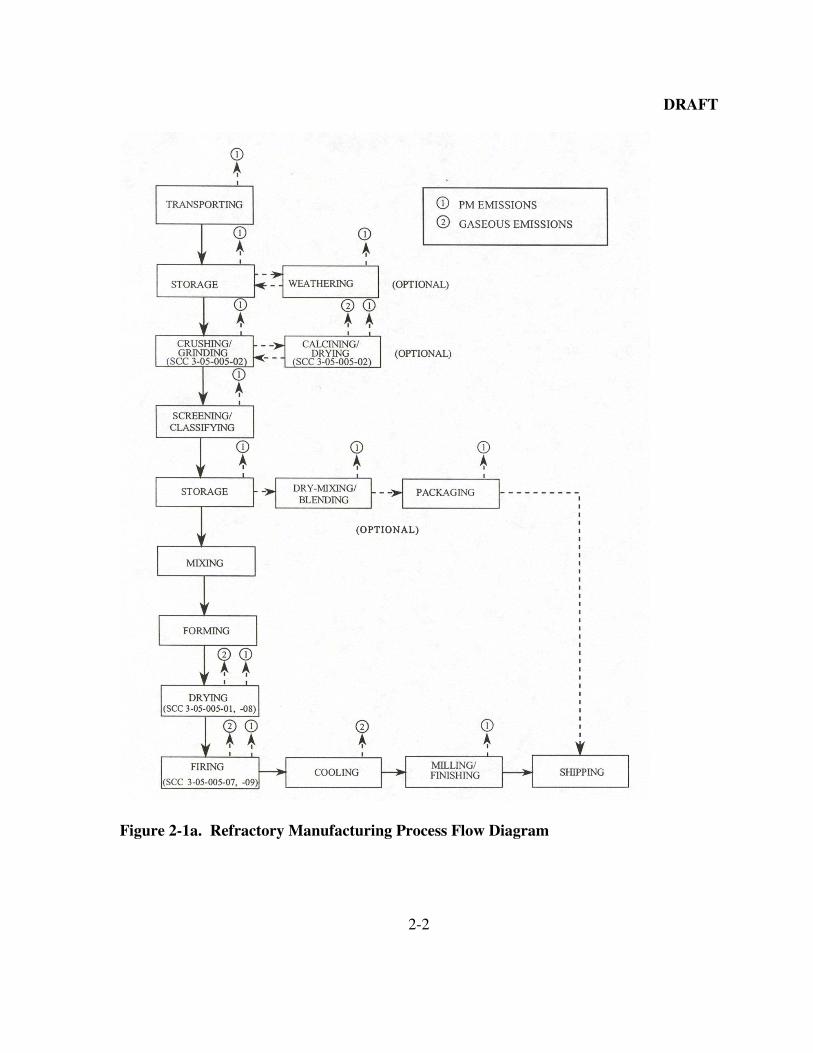
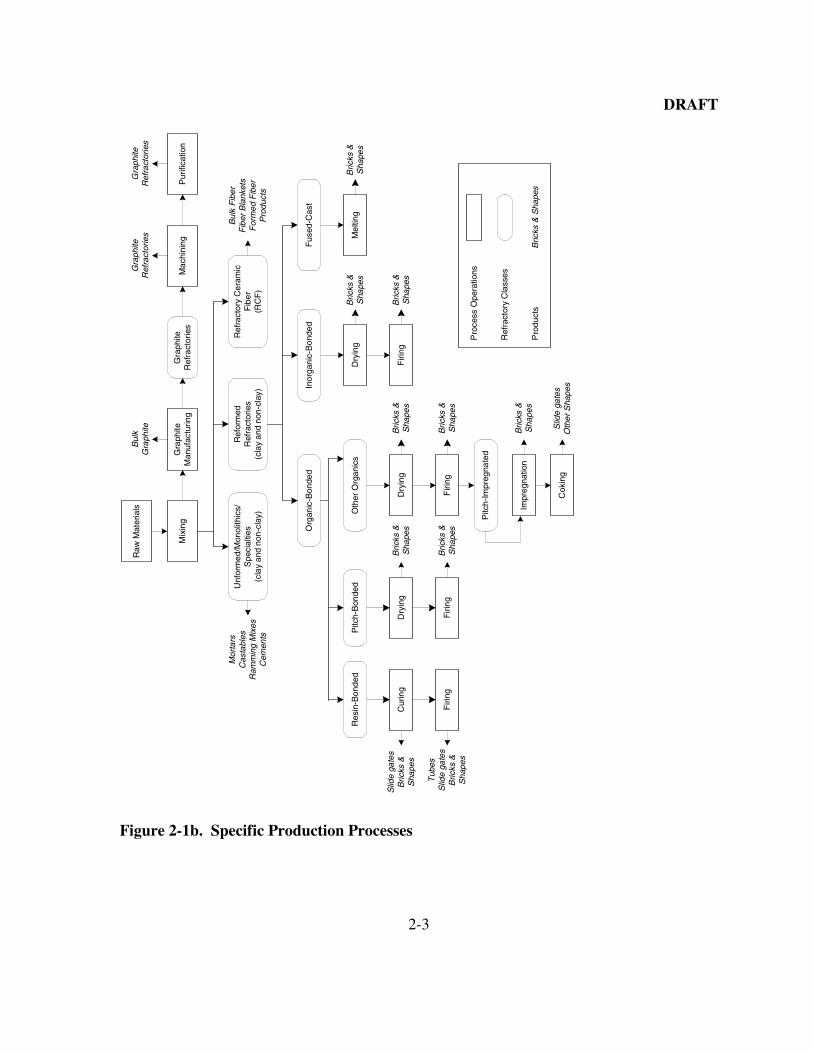
Figure 2-1a illustrates the basic refractory manufacturing process and Figure 2-1b depicts
specific product production processes for various refractory products. The production of
refractories begins with processing raw material. Raw material processing involves crushing
and grinding raw materials, classifying by size, calcining, and drying. The processed raw
materials may then be dry-mixed with other minerals and chemical compounds, packaged,
and shipped as product.
Following the mixing process, the raw materials are formed into desired shapes. This
process typically occurs under moist or wet conditions. After the refractory is formed, the
material is fired. Firing involves heating the refractory material to high temperatures in a
periodic batch or continuous tunnel kiln to form a ceramic bond. This process gives the raw
materials their refractory properties. The final processing stage includes milling, grinding,
and sandblasting the finished product. For some products, final processing may also include
impregnation with tar and pitch and product packaging (The Technical Association of
Refractories, Japan, 1998).
DRAFT
2-2
Figure 2-1a. Refractory Manufacturing Process Flow Diagram
DRAFT
2-3
Bul
kG
raph
iteR
aw M
ater
ials
Org
anic
-Bon
ded
Mix
ing
Gra
phite
Man
ufac
turin
gG
raph
iteR
efra
ctor
ies
Mac
hini
ngP
urifi
catio
n
Gra
phite
Ref
ract
orie
sG
raph
iteR
efra
ctor
ies
Mor
tars
Cas
tabl
esR
amm
ing
Mix
esC
emen
ts
Unf
orm
ed/M
onol
ithic
s/S
peci
altie
s(c
lay
and
non-
clay
)
Ref
orm
edR
efra
ctor
ies
(cla
y an
d no
n-cl
ay)
Ref
ract
ory
Cer
amic
Fib
er(R
CF
)
Bul
k F
iber
Fib
er B
lank
ets
For
med
Fib
erP
rodu
cts
Inor
gani
c-B
onde
dF
used
-Cas
t
Dry
ing
Firi
ng
Mel
ting
Bric
ks &
Sha
pes
Res
in-B
onde
dP
itch-
Bon
ded
Oth
er O
rgan
ics
Dry
ing
Firi
ng
Dry
ing
Firi
ng
Cur
ing
Firi
ng
Slid
e ga
tes
Bric
ks &
Sha
pes
Tub
esS
lide
gate
sB
ricks
&S
hape
s
Pitc
h-Im
preg
nate
d
Impr
egna
tion
Cok
ing
Slid
e ga
tes
Oth
er S
hape
s
Bric
ks &
Sha
pes
Bric
ks &
Sha
pes
Bric
ks &
Sha
pes
Bric
ks &
Sha
pes
Bric
ks &
Sha
pes
Bric
ks &
Sha
pes
Bric
ks &
Sha
pes
Bric
ks &
Sha
pes
Pro
cess
Ope
ratio
ns
Ref
ract
ory
Cla
sses
Pro
duct
s
Figure 2-1b. Specific Production Processes
DRAFT
2-4
2.1.1 Machines Used in the Production Process
Several types of machines are used to produce refractories: mixing/kneading
machines, presses, and kilns.
2.1.1.1 Mixing/Kneading Machines
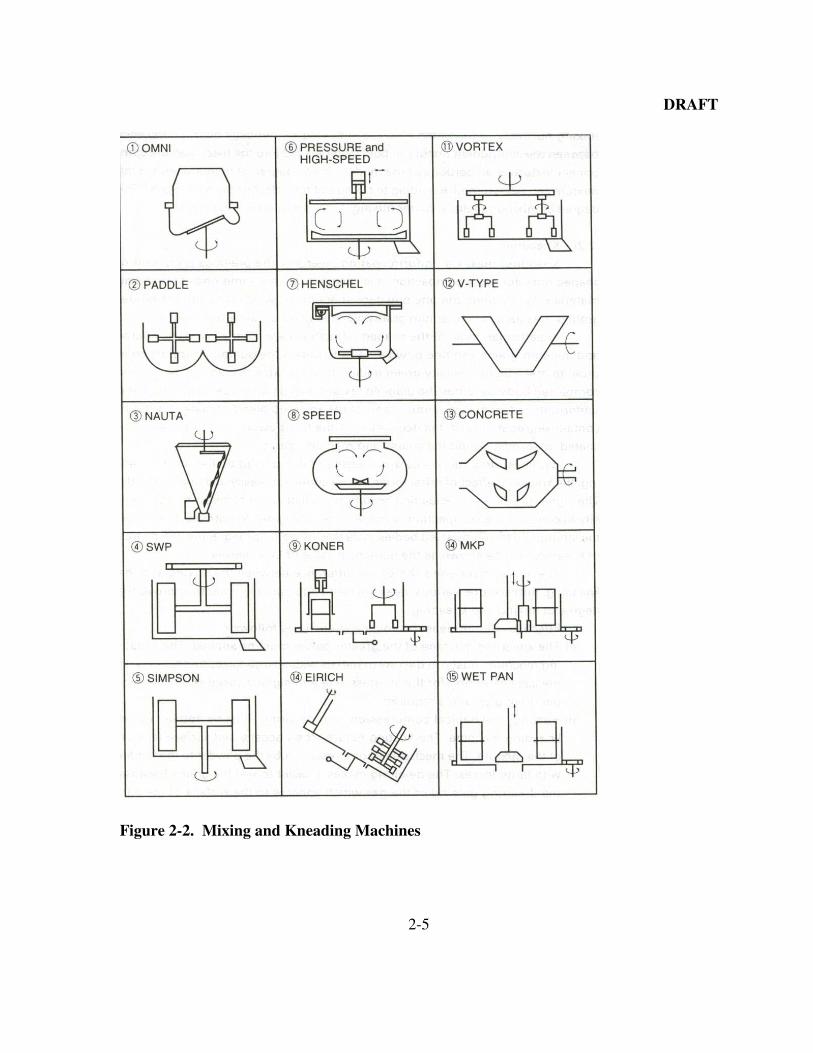
Figure 2-2 illustrates different machines used to mix or knead refractory products.
There are two types of mixing and kneading machines: fixed vessel and driven vessel.
Mixing homogenizes more than two types of bulk materials, and kneading machines make a
uniform coating layer. Mixing and kneading machines are equipped with mixing blades or
muller wheels. Heating, cooling, or de-airing equipment may also be applied to the vessel.
Mixing and kneading machines are used for manufacturing shaped and unshaped refractories.
Unshaped refractories, however, are not processed any further (The Technical Association of
Refractories, Japan, 1998).
2.1.1.2 Presses
Refractory pressing machines are broadly categorized into three groups: impact and
static, vibrating, and cold isostatic press. Choosing between the three groups of presses
largely depends on the type of raw materials used.
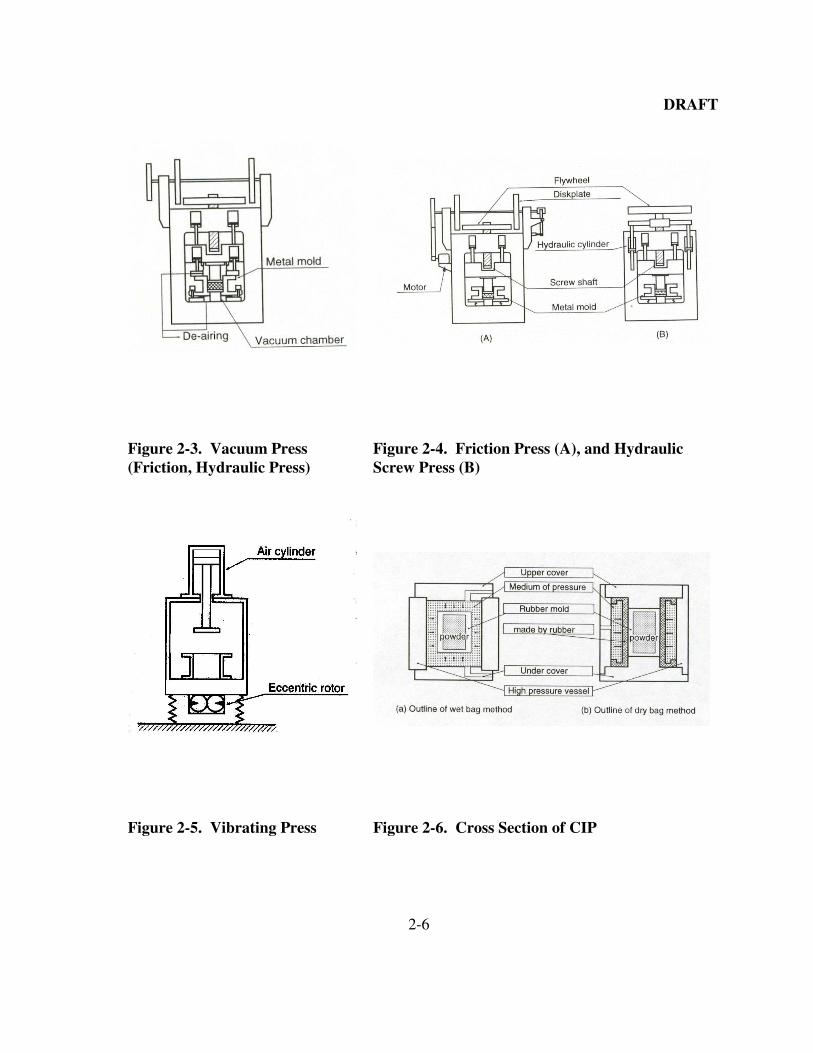
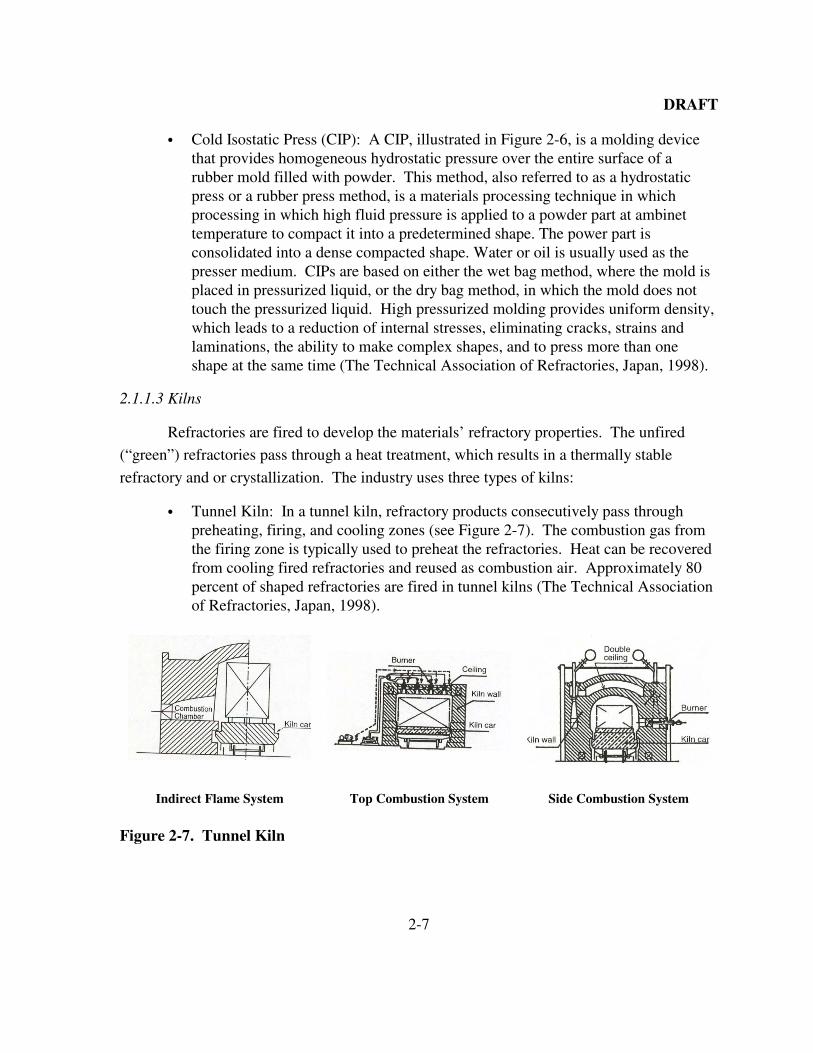
� Impact and Static Presses: Figure 2-3 illustrates a friction and a hydraulic screwpress, two types of impact presses. Figure 2-4 is a diagram of a hydraulic screwpress, a type of static press. Impact and static presses are typically equipped witha vacuum deaerator. Impact presses have a higher allowable maximumcompacting force than static presses. However, static presses are findingincreasing application in the production of sophisticated refractories such assubmerged nozzles and shrouds and in the production of industrial ceramics.Bricks formed with static presses are flat, uniform and, compact. (The TechnicalAssociation of Refractories, Japan, 1998).
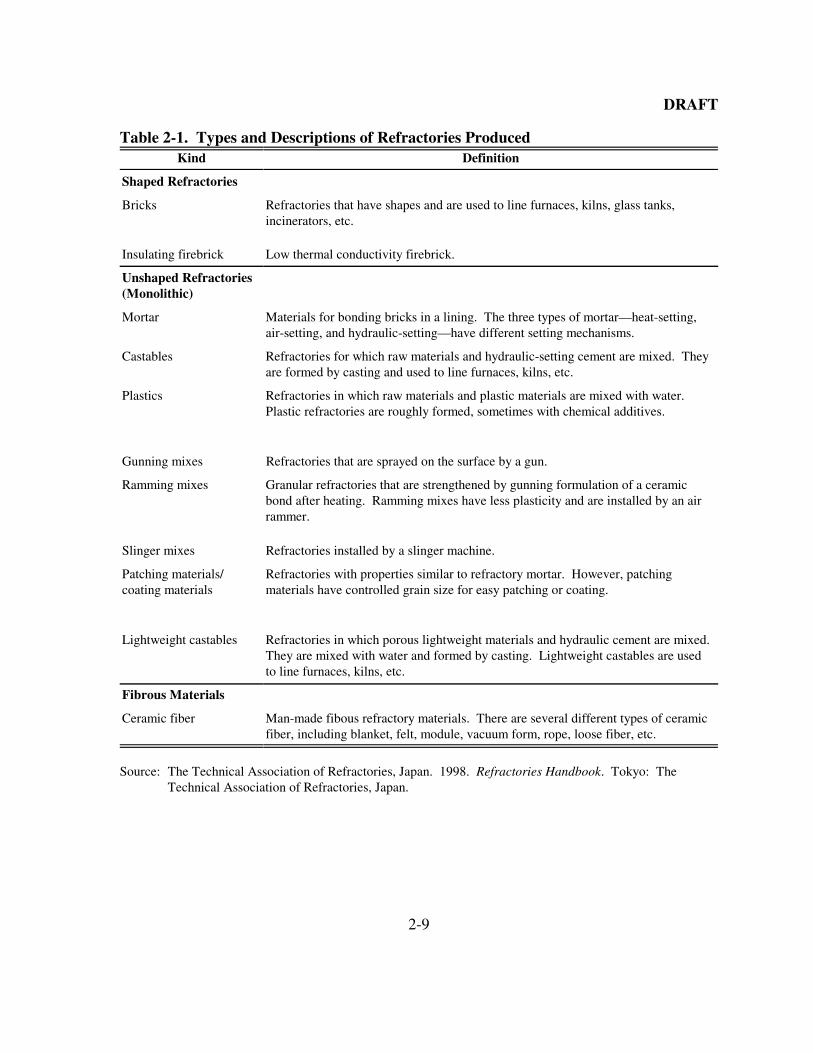
� Vibrating Press: Vibrating presses, shown in Figure 2-5, are classified into twotypes: air cylinder type and hydraulic cylinder. The vibrator in the air cylindertype is attached to the table, and the air cylinder compacts the material. Thehydraulic vibrating press is constructed with the hydraulic pulse generatorattached to the pressure block, and the hydraulic cylinder compacts the material. Vibrating presses are typically used for the compaction of complexly shapedrefractories (The Technical Association of Refractories, Japan, 1998).
DRAFT
2-5
Figure 2-2. Mixing and Kneading Machines
DRAFT
2-6
Figure 2-3. Vacuum Press(Friction, Hydraulic Press)
Figure 2-4. Friction Press (A), and HydraulicScrew Press (B)
Figure 2-5. Vibrating Press Figure 2-6. Cross Section of CIP
DRAFT
2-7
� Cold Isostatic Press (CIP): A CIP, illustrated in Figure 2-6, is a molding devicethat provides homogeneous hydrostatic pressure over the entire surface of arubber mold filled with powder. This method, also referred to as a hydrostaticpress or a rubber press method, is a materials processing technique in whichprocessing in which high fluid pressure is applied to a powder part at ambinettemperature to compact it into a predetermined shape. The power part isconsolidated into a dense compacted shape. Water or oil is usually used as thepresser medium. CIPs are based on either the wet bag method, where the mold isplaced in pressurized liquid, or the dry bag method, in which the mold does nottouch the pressurized liquid. High pressurized molding provides uniform density,which leads to a reduction of internal stresses, eliminating cracks, strains andlaminations, the ability to make complex shapes, and to press more than oneshape at the same time (The Technical Association of Refractories, Japan, 1998).
2.1.1.3 Kilns
Refractories are fired to develop the materials’ refractory properties. The unfired
(“green”) refractories pass through a heat treatment, which results in a thermally stable
refractory and or crystallization. The industry uses three types of kilns:
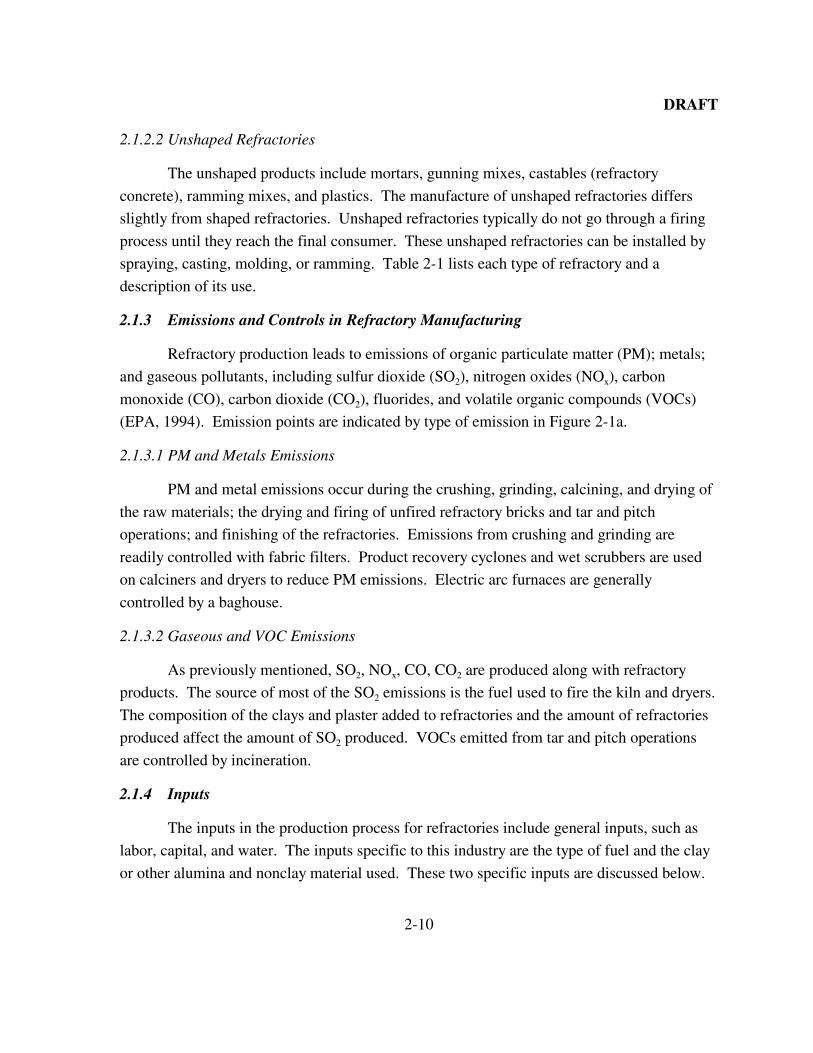
� Tunnel Kiln: In a tunnel kiln, refractory products consecutively pass throughpreheating, firing, and cooling zones (see Figure 2-7). The combustion gas fromthe firing zone is typically used to preheat the refractories. Heat can be recoveredfrom cooling fired refractories and reused as combustion air. Approximately 80percent of shaped refractories are fired in tunnel kilns (The Technical Associationof Refractories, Japan, 1998).
Indirect Flame System Top Combustion System Side Combustion System
Figure 2-7. Tunnel Kiln

DRAFT
2-8
� Round Periodic Kilns: Round periodic kilns are typically used to fire silicabricks. Figure 2-8 is a diagram of a round periodic kiln. These kilns can be usedto fire large refractory products that cannot be fired in a tunnel kiln and can easilyaccommodate changes in production (The Technical Association of Refractories,Japan, 1998).
� Shuttle Kilns: As illustrated in Figure 2-9, the design of a shuttle kiln resemblesthe firing zone of a tunnel kiln. Shuttle kilns effectively store heat and are used tofire fireclay and specialty bricks (The Technical Association of Refractories,Japan, 1998).
Figure 2-8. Round Kiln with DowndraftSystem
Figure 2-9. Shuttle Kiln
2.1.2 Final Commodities
Refractories are manufactured in two forms—shaped objects and unshaped, and
unshaped refractories come in granulated or plastic compositions. Briefly described here,
shaped and unshaped refractories are the two broad categories of refractories. Section 2.2
contains more information on the types of refractory products.
2.1.2.1 Shaped Refractories
Preshaped refractories include bricks, shapes, crucibles, and monolithics. Shaped
refractories are pre-fired to exhibit their ceramic characteristics. Table 2-1 lists each type of
shaped refractory and a description of its use.
DRAFT
2-9
Table 2-1. Types and Descriptions of Refractories ProducedKind Definition
Shaped Refractories
Bricks Refractories that have shapes and are used to line furnaces, kilns, glass tanks,incinerators, etc.
Insulating firebrick Low thermal conductivity firebrick.
Unshaped Refractories(Monolithic)
Mortar Materials for bonding bricks in a lining. The three types of mortar—heat-setting,air-setting, and hydraulic-setting—have different setting mechanisms.
Castables Refractories for which raw materials and hydraulic-setting cement are mixed. Theyare formed by casting and used to line furnaces, kilns, etc.
Plastics Refractories in which raw materials and plastic materials are mixed with water. Plastic refractories are roughly formed, sometimes with chemical additives.
Gunning mixes Refractories that are sprayed on the surface by a gun.
Ramming mixes Granular refractories that are strengthened by gunning formulation of a ceramicbond after heating. Ramming mixes have less plasticity and are installed by an airrammer.
Slinger mixes Refractories installed by a slinger machine.
Patching materials/coating materials
Refractories with properties similar to refractory mortar. However, patchingmaterials have controlled grain size for easy patching or coating.
Lightweight castables Refractories in which porous lightweight materials and hydraulic cement are mixed. They are mixed with water and formed by casting. Lightweight castables are usedto line furnaces, kilns, etc.
Fibrous Materials
Ceramic fiber Man-made fibous refractory materials. There are several different types of ceramicfiber, including blanket, felt, module, vacuum form, rope, loose fiber, etc.
Source: The Technical Association of Refractories, Japan. 1998. Refractories Handbook. Tokyo: TheTechnical Association of Refractories, Japan.
DRAFT
2-10
2.1.2.2 Unshaped Refractories
The unshaped products include mortars, gunning mixes, castables (refractory
concrete), ramming mixes, and plastics. The manufacture of unshaped refractories differs
slightly from shaped refractories. Unshaped refractories typically do not go through a firing
process until they reach the final consumer. These unshaped refractories can be installed by
spraying, casting, molding, or ramming. Table 2-1 lists each type of refractory and a
description of its use.
2.1.3 Emissions and Controls in Refractory Manufacturing
Refractory production leads to emissions of organic particulate matter (PM); metals;
and gaseous pollutants, including sulfur dioxide (SO2), nitrogen oxides (NOx), carbon
monoxide (CO), carbon dioxide (CO2), fluorides, and volatile organic compounds (VOCs)
(EPA, 1994). Emission points are indicated by type of emission in Figure 2-1a.
2.1.3.1 PM and Metals Emissions
PM and metal emissions occur during the crushing, grinding, calcining, and drying of
the raw materials; the drying and firing of unfired refractory bricks and tar and pitch
operations; and finishing of the refractories. Emissions from crushing and grinding are
readily controlled with fabric filters. Product recovery cyclones and wet scrubbers are used
on calciners and dryers to reduce PM emissions. Electric arc furnaces are generally
controlled by a baghouse.
2.1.3.2 Gaseous and VOC Emissions
As previously mentioned, SO2, NOx, CO, CO2 are produced along with refractory
products. The source of most of the SO2 emissions is the fuel used to fire the kiln and dryers.
The composition of the clays and plaster added to refractories and the amount of refractories
produced affect the amount of SO2 produced. VOCs emitted from tar and pitch operations
are controlled by incineration.
2.1.4 Inputs
The inputs in the production process for refractories include general inputs, such as
labor, capital, and water. The inputs specific to this industry are the type of fuel and the clay
or other alumina and nonclay material used. These two specific inputs are discussed below.

DRAFT
2-11
Table 2-2. Types and Characteristics of Raw Materials used in RefractoryManufacture Type
Type Characteristics
Clay Refractories
Fireclay Consists of kaolinite (Al2O32SiO22H2O) and minor amount of other claymaterials. Fireclay refractories can be low, medium, high, or super-duty basedon their resistance to high temperature or refractoriness. Fireclay refractories areused to produce bricks, insulating refractories, and two types of ladle brick.
High-alumina Composed of bauxite or other raw materials that contain 50 to 87.5 percent alumina. High-alumina refractories are generally multipurpose, offeringresistance to chipping and higher volume stability. High-alumina refractories areused to produce brick and insulating refractories.
Nonclay Refractories
Basic Produced from a composition of dead-burned magnesite, dolomite, chrome ore,and small amount of other minerals. Basic refractories can be further subdividedinto magnesia, dolomite, chrome, and combination bricks. Basic refractories aretypically used to make bricks.
Extra-high alumina Made predominately from bauxite or alumina (Al2O3), extra-high aluminarefractories contain from 87.5 to 100 percent alumina and offer good volumestability. They are typically poured into special shapes using a fused castingprocess.
Mullite Made from kyanite, sillimanite, andalusite, bauxite, or mixtures of aluminasilicate materials; mullite refractories are about 70% alumina. They maintain alow level of impurities and high resistance to loading in high temperatures.
Silica Containing silica, silica refractories are characterized by a high coefficient ofthermal expansion between room temperature and 500°C (930°F). Silica brick isavailable in three grades: super-duty (low alumina and alkali), regular, and cokeoven quality. Silica compositions can be used for hot patching, shrouds, andbricks.
Silicon carbide Produced by the reaction of sand and coke in an electric furnace, silicon carbiderefractories are used to make special shapes, such as kiln furniture, to supportceramicware as it is fired in kilns. It has high thermal conductivity, good loadbearing characteristics at high temperatures, and good resistance to changes intemperatures.
Zircon Containing siconium silicate (ZrO2SiO2), zircon refractories maintain goodvolume stability for extended periods or exposure to high temperatures. Zirconrefractories are widely used for glass tank construction.
DRAFT
1Bricks and shapes can be formed by a variety of methods, including hand molding, air ramming, pressing,
extruding, or casting.
2-12
2.1.4.1 Clays
Clay is composed mainly of fine particles of hydrous aluminum silicates and other
minerals that is plastic when moist but hard when fired. In 1998, approximately 3.09 Mt of
clays were used in the manufacture of refractories. Table 2-2 lists different clays used in
refractory products and their characteristics. Fireclay is the predominate clay used
infirebrick; bentonite, in foundry sand; common clay, in refractory mortar and cement; and
kaolin, in calcine, grog, high alumina brick, kiln furniture, and plug, tap, and wad (Virta,
1998).
2.1.4.2 Nonclays
Nonclay refractories are composed for alumina, mullite, chromite, magnesite, silica,
silicon carbide, zircon, and other nonclays. Table 2-2 lists various minerals used in the
production of nonclay refractories, the type of refractory produced, and characteristics of the
refractory.
2.2 Types of Products
Table 2-1 lists the different forms of refractories and describes them briefly.
Refractories are generally categorized as either clay or nonclay products. To further classify
the products, refractories are labeled as acidic or basic. Refractories are typically produced
as shaped refractories, unshaped refractories, and fibrous materials. Shaped refractories
include bricks, shapes, and crucibles. Bricks and shapes are formed by mixing raw materials
with water and/or other binders and pressing or molding the mixture into a desired shape.1
Crucibles are ceramic containers used for melting metal. Unshaped refractories, also called
monolithic, are unformed products that are dried to form a unified structure after application.
These refractories can be used as mortars, plastics, ramming mixes, castables, and gunning
mixes. Monolithic refractories are applied by either pouring, pumping, troweling, or
gunning (spraying).
DRAFT
2-13
2.3 Costs of Production
The costs incurred by refractory manufacturers are labor, materials, and capital. This
section provides data on these costs and discusses economies of scale.
2.3.1 Cost Data
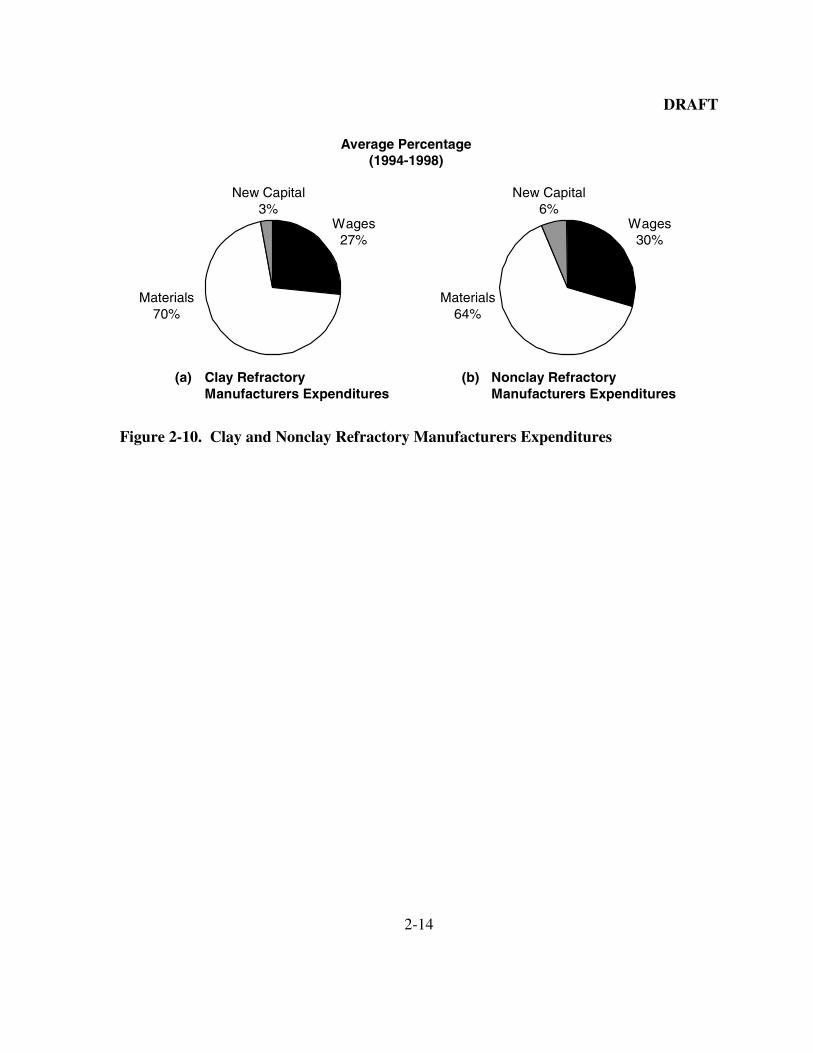
Between 1994 and 1998, clay refractory manufactures spent an average of more than
70 percent and nonclay refractory producers almost 64 percent of expenditures on input
materials. Figure 2-10 illustrates the percentage breakdown of refractory manufacturing
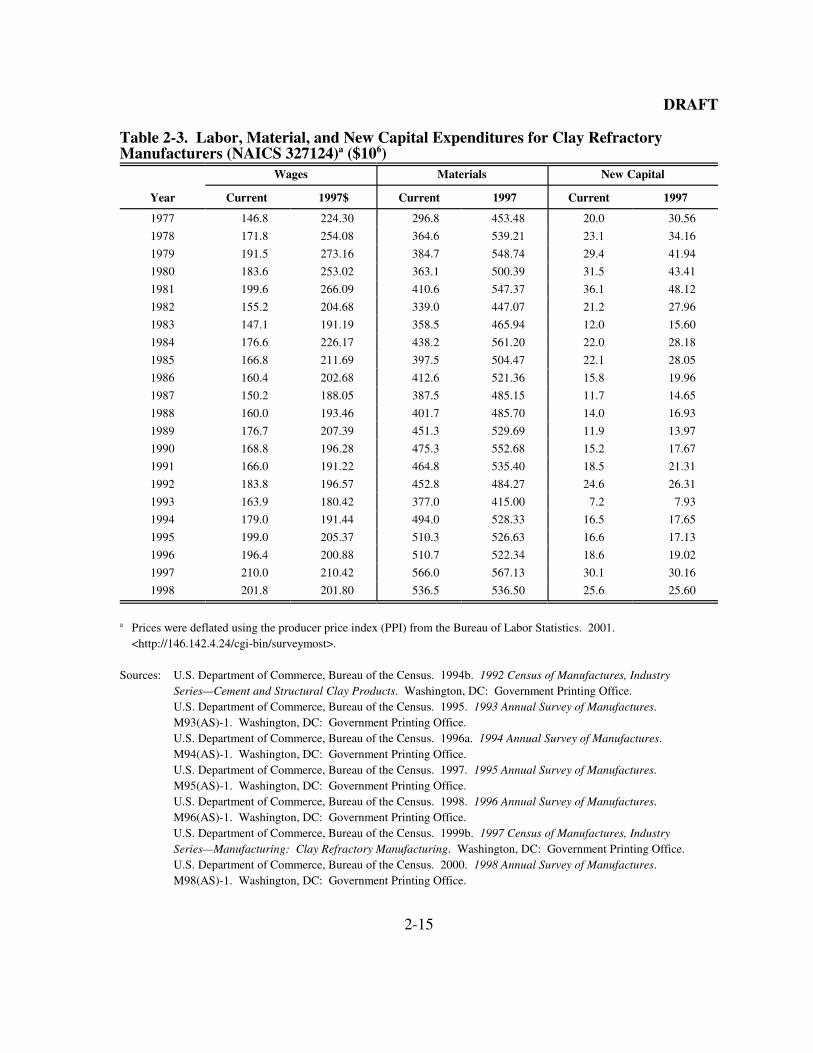
expenditures by refractory type. Tables 2-3 and 2-4 also provide expenditures in dollars for
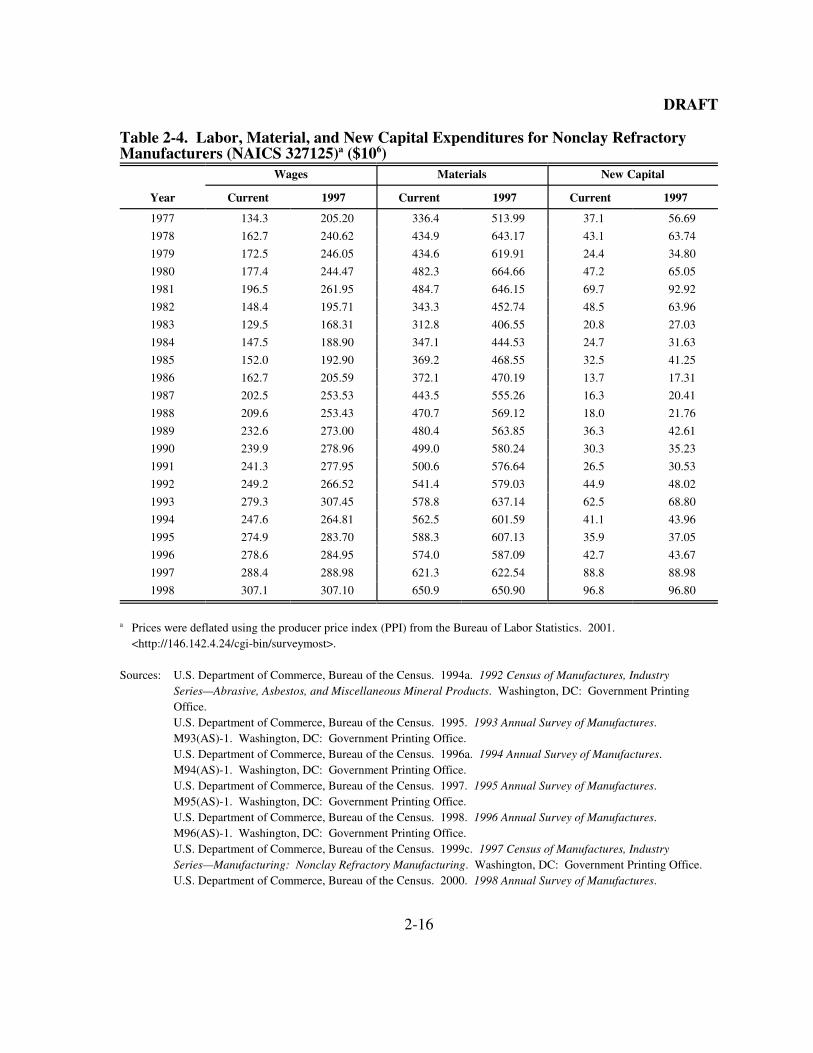
wages, materials, and new capital from 1977 to 1998 in both current and 1997 dollars. Costs
of materials include all raw materials, containers, scrap, and supplies used in production,
repair, or maintenance during the year, as well as the cost of all electricity and fuel
consumed. Costs are included for materials whether they are purchased from outside the
company or transferred from within the company. New capital expenditures include
permanent additions and alterations to facilities and machinery and equipment used for
expanding plant capacity or replacing existing machinery.
These tables show that the cost of materials is by far the greatest cost to refractory
producers. Refractory producers spend as much as two and a half times more on materials
than they do on labor. For 1998, the Annual Survey of Manufacturers reported that the clay
refractory industry spent $31.6 million and the nonclay refractory industry spent $52.7
million on energy, almost 6 and 8 percent, respectively, of the total materials cost for that
year. Energy costs for manufacturers of refractory bricks and shapes are generally greater
than energy costs for manufacturers of monolithic refractories because of the energy-
intensive nature of operations that require using forming equipment, dryers, and kilns.
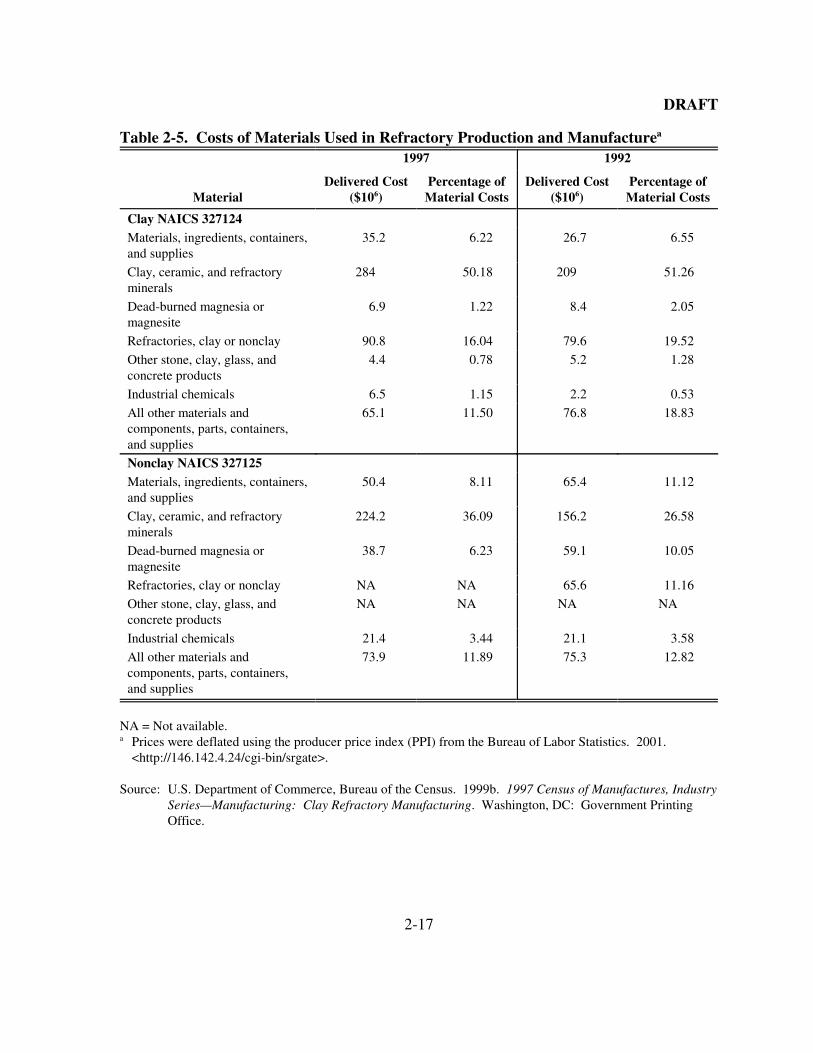
Table 2-5 contains a more detailed breakdown of the costs of materials used in producing
and manufacturing refractory materials.
DRAFT
2-14
(a) Clay RefractoryManufacturers Expenditures
Wages27%
Materials70%
New Capital3%
(b) Nonclay RefractoryManufacturers Expenditures
Wages30%
Materials64%
New Capital6%
Average Percentage(1994-1998)
Figure 2-10. Clay and Nonclay Refractory Manufacturers Expenditures
DRAFT
2-15
Table 2-3. Labor, Material, and New Capital Expenditures for Clay RefractoryManufacturers (NAICS 327124)a ($106)
Wages Materials New Capital
Year Current 1997$ Current 1997 Current 1997
1977 146.8 224.30 296.8 453.48 20.0 30.56
1978 171.8 254.08 364.6 539.21 23.1 34.16
1979 191.5 273.16 384.7 548.74 29.4 41.94
1980 183.6 253.02 363.1 500.39 31.5 43.41
1981 199.6 266.09 410.6 547.37 36.1 48.12
1982 155.2 204.68 339.0 447.07 21.2 27.96
1983 147.1 191.19 358.5 465.94 12.0 15.60
1984 176.6 226.17 438.2 561.20 22.0 28.18
1985 166.8 211.69 397.5 504.47 22.1 28.05
1986 160.4 202.68 412.6 521.36 15.8 19.96
1987 150.2 188.05 387.5 485.15 11.7 14.65
1988 160.0 193.46 401.7 485.70 14.0 16.93
1989 176.7 207.39 451.3 529.69 11.9 13.97
1990 168.8 196.28 475.3 552.68 15.2 17.67
1991 166.0 191.22 464.8 535.40 18.5 21.31
1992 183.8 196.57 452.8 484.27 24.6 26.31
1993 163.9 180.42 377.0 415.00 7.2 7.93
1994 179.0 191.44 494.0 528.33 16.5 17.65
1995 199.0 205.37 510.3 526.63 16.6 17.13
1996 196.4 200.88 510.7 522.34 18.6 19.02
1997 210.0 210.42 566.0 567.13 30.1 30.16
1998 201.8 201.80 536.5 536.50 25.6 25.60
a Prices were deflated using the producer price index (PPI) from the Bureau of Labor Statistics. 2001.<http://146.142.4.24/cgi-bin/surveymost>.
Sources: U.S. Department of Commerce, Bureau of the Census. 1994b. 1992 Census of Manufactures, IndustrySeries—Cement and Structural Clay Products. Washington, DC: Government Printing Office.U.S. Department of Commerce, Bureau of the Census. 1995. 1993 Annual Survey of Manufactures. M93(AS)-1. Washington, DC: Government Printing Office.U.S. Department of Commerce, Bureau of the Census. 1996a. 1994 Annual Survey of Manufactures. M94(AS)-1. Washington, DC: Government Printing Office.U.S. Department of Commerce, Bureau of the Census. 1997. 1995 Annual Survey of Manufactures. M95(AS)-1. Washington, DC: Government Printing Office.U.S. Department of Commerce, Bureau of the Census. 1998. 1996 Annual Survey of Manufactures. M96(AS)-1. Washington, DC: Government Printing Office.U.S. Department of Commerce, Bureau of the Census. 1999b. 1997 Census of Manufactures, IndustrySeries—Manufacturing: Clay Refractory Manufacturing. Washington, DC: Government Printing Office.U.S. Department of Commerce, Bureau of the Census. 2000. 1998 Annual Survey of Manufactures. M98(AS)-1. Washington, DC: Government Printing Office.
DRAFT
2-16
Table 2-4. Labor, Material, and New Capital Expenditures for Nonclay RefractoryManufacturers (NAICS 327125)a ($106)
Wages Materials New Capital
Year Current 1997 Current 1997 Current 1997
1977 134.3 205.20 336.4 513.99 37.1 56.69
1978 162.7 240.62 434.9 643.17 43.1 63.74
1979 172.5 246.05 434.6 619.91 24.4 34.80
1980 177.4 244.47 482.3 664.66 47.2 65.05
1981 196.5 261.95 484.7 646.15 69.7 92.92
1982 148.4 195.71 343.3 452.74 48.5 63.96
1983 129.5 168.31 312.8 406.55 20.8 27.03
1984 147.5 188.90 347.1 444.53 24.7 31.63
1985 152.0 192.90 369.2 468.55 32.5 41.25
1986 162.7 205.59 372.1 470.19 13.7 17.31
1987 202.5 253.53 443.5 555.26 16.3 20.41
1988 209.6 253.43 470.7 569.12 18.0 21.76
1989 232.6 273.00 480.4 563.85 36.3 42.61
1990 239.9 278.96 499.0 580.24 30.3 35.23
1991 241.3 277.95 500.6 576.64 26.5 30.53
1992 249.2 266.52 541.4 579.03 44.9 48.02
1993 279.3 307.45 578.8 637.14 62.5 68.80
1994 247.6 264.81 562.5 601.59 41.1 43.96
1995 274.9 283.70 588.3 607.13 35.9 37.05
1996 278.6 284.95 574.0 587.09 42.7 43.67
1997 288.4 288.98 621.3 622.54 88.8 88.98
1998 307.1 307.10 650.9 650.90 96.8 96.80
a Prices were deflated using the producer price index (PPI) from the Bureau of Labor Statistics. 2001.<http://146.142.4.24/cgi-bin/surveymost>.
Sources: U.S. Department of Commerce, Bureau of the Census. 1994a. 1992 Census of Manufactures, IndustrySeries—Abrasive, Asbestos, and Miscellaneous Mineral Products. Washington, DC: Government PrintingOffice.U.S. Department of Commerce, Bureau of the Census. 1995. 1993 Annual Survey of Manufactures. M93(AS)-1. Washington, DC: Government Printing Office.U.S. Department of Commerce, Bureau of the Census. 1996a. 1994 Annual Survey of Manufactures. M94(AS)-1. Washington, DC: Government Printing Office.U.S. Department of Commerce, Bureau of the Census. 1997. 1995 Annual Survey of Manufactures. M95(AS)-1. Washington, DC: Government Printing Office.U.S. Department of Commerce, Bureau of the Census. 1998. 1996 Annual Survey of Manufactures. M96(AS)-1. Washington, DC: Government Printing Office.U.S. Department of Commerce, Bureau of the Census. 1999c. 1997 Census of Manufactures, IndustrySeries—Manufacturing: Nonclay Refractory Manufacturing. Washington, DC: Government Printing Office.U.S. Department of Commerce, Bureau of the Census. 2000. 1998 Annual Survey of Manufactures.
DRAFT
2-17
Table 2-5. Costs of Materials Used in Refractory Production and Manufacturea
1997 1992
MaterialDelivered Cost
($106)Percentage of
Material CostsDelivered Cost
($106)Percentage of
Material Costs
Clay NAICS 327124Materials, ingredients, containers,and supplies
35.2 6.22 26.7 6.55
Clay, ceramic, and refractoryminerals
284 50.18 209 51.26
Dead-burned magnesia ormagnesite
6.9 1.22 8.4 2.05
Refractories, clay or nonclay 90.8 16.04 79.6 19.52
Other stone, clay, glass, andconcrete products
4.4 0.78 5.2 1.28
Industrial chemicals 6.5 1.15 2.2 0.53
All other materials andcomponents, parts, containers,and supplies
65.1 11.50 76.8 18.83
Nonclay NAICS 327125Materials, ingredients, containers,and supplies
50.4 8.11 65.4 11.12
Clay, ceramic, and refractoryminerals
224.2 36.09 156.2 26.58
Dead-burned magnesia ormagnesite
38.7 6.23 59.1 10.05
Refractories, clay or nonclay NA NA 65.6 11.16
Other stone, clay, glass, andconcrete products
NA NA NA NA
Industrial chemicals 21.4 3.44 21.1 3.58
All other materials andcomponents, parts, containers,and supplies
73.9 11.89 75.3 12.82
NA = Not available.a Prices were deflated using the producer price index (PPI) from the Bureau of Labor Statistics. 2001.
<http://146.142.4.24/cgi-bin/srgate>.
Source: U.S. Department of Commerce, Bureau of the Census. 1999b. 1997 Census of Manufactures, IndustrySeries—Manufacturing: Clay Refractory Manufacturing. Washington, DC: Government PrintingOffice.
DRAFT
3-1
SECTION 3
THE DEMAND SIDE
Estimating the economic impacts of the regulation on the refractory manufacturing
industry requires characterizing various aspects of the demand for refractory products. This
section describes the product characteristics decided by end users; the uses for refractories,
including use in the glass, metal, and electronics industries; and possible substitutes for
refractories.
3.1 Product Characteristics
Because the quality and characteristics of refractories vary considerably, consumers
often employ chemical and physical tests to ensure that the refractories purchased meet their
requirements. The American Society for Testing and Materials (ASTM) provides
specifications and tests for various kinds and uses of refractory products. Depending on the
intended end use, consumers may test refractories for thermal conductivity, resistance to
abrasion and corrosion, permeability, oxidation resistance, and other characteristics (ASM
International, 1987).
Most refractory products are sold as preformed shapes. However, they are also
available in special purpose clays; bonding mortars; and monolithic, plastic refractories;
ramming mixes; and gunning mixes. A variety of processed refractory grains and powders
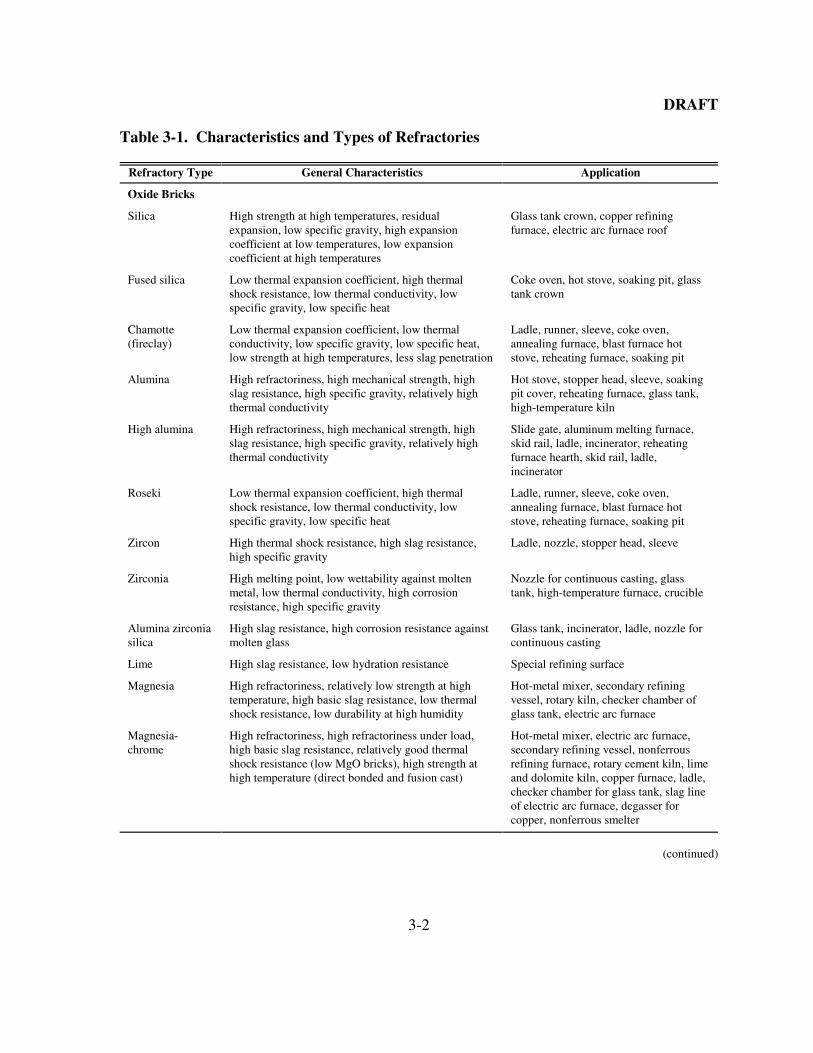
are also produced (DHAN, 1999). From the physical form, refractory products can be
further classified into oxide bricks, nonoxide bricks, and composites. Table 3-1 lists types of
oxide, nonoxide, and composite refractories; their characteristics; and their applications.
3.2 Uses and Consumers
Principle end-use markets for refractory products include iron and steel, cement, and
nonferrous metal industries. The steel industry consumes the largest percentage of
refractories, estimated between 50 and 80 percent of the refractory production (Semler,
DRAFT
3-2
Table 3-1. Characteristics and Types of Refractories
Refractory Type General Characteristics Application
Oxide Bricks
Silica High strength at high temperatures, residualexpansion, low specific gravity, high expansioncoefficient at low temperatures, low expansioncoefficient at high temperatures
Glass tank crown, copper refiningfurnace, electric arc furnace roof
Fused silica Low thermal expansion coefficient, high thermalshock resistance, low thermal conductivity, lowspecific gravity, low specific heat
Coke oven, hot stove, soaking pit, glasstank crown
Chamotte(fireclay)
Low thermal expansion coefficient, low thermalconductivity, low specific gravity, low specific heat,low strength at high temperatures, less slag penetration
Ladle, runner, sleeve, coke oven,annealing furnace, blast furnace hotstove, reheating furnace, soaking pit
Alumina High refractoriness, high mechanical strength, highslag resistance, high specific gravity, relatively highthermal conductivity
Hot stove, stopper head, sleeve, soakingpit cover, reheating furnace, glass tank,high-temperature kiln
High alumina High refractoriness, high mechanical strength, highslag resistance, high specific gravity, relatively highthermal conductivity
Slide gate, aluminum melting furnace,skid rail, ladle, incinerator, reheatingfurnace hearth, skid rail, ladle,incinerator
Roseki Low thermal expansion coefficient, high thermalshock resistance, low thermal conductivity, lowspecific gravity, low specific heat
Ladle, runner, sleeve, coke oven,annealing furnace, blast furnace hotstove, reheating furnace, soaking pit
Zircon High thermal shock resistance, high slag resistance,high specific gravity
Ladle, nozzle, stopper head, sleeve
Zirconia High melting point, low wettability against moltenmetal, low thermal conductivity, high corrosionresistance, high specific gravity
Nozzle for continuous casting, glasstank, high-temperature furnace, crucible
Alumina zirconiasilica
High slag resistance, high corrosion resistance againstmolten glass
Glass tank, incinerator, ladle, nozzle forcontinuous casting
Lime High slag resistance, low hydration resistance Special refining surface
Magnesia High refractoriness, relatively low strength at hightemperature, high basic slag resistance, low thermalshock resistance, low durability at high humidity
Hot-metal mixer, secondary refiningvessel, rotary kiln, checker chamber ofglass tank, electric arc furnace
Magnesia-chrome
High refractoriness, high refractoriness under load,high basic slag resistance, relatively good thermalshock resistance (low MgO bricks), high strength athigh temperature (direct bonded and fusion cast)
Hot-metal mixer, electric arc furnace,secondary refining vessel, nonferrousrefining furnace, rotary cement kiln, limeand dolomite kiln, copper furnace, ladle,checker chamber for glass tank, slag lineof electric arc furnace, degasser forcopper, nonferrous smelter
(continued)
DRAFT
1The U.S. International Trade Commission (USITC) estimated consumption of the steel industry at over 50
percent, and DHAN estimated it at 75 percent.
3-3
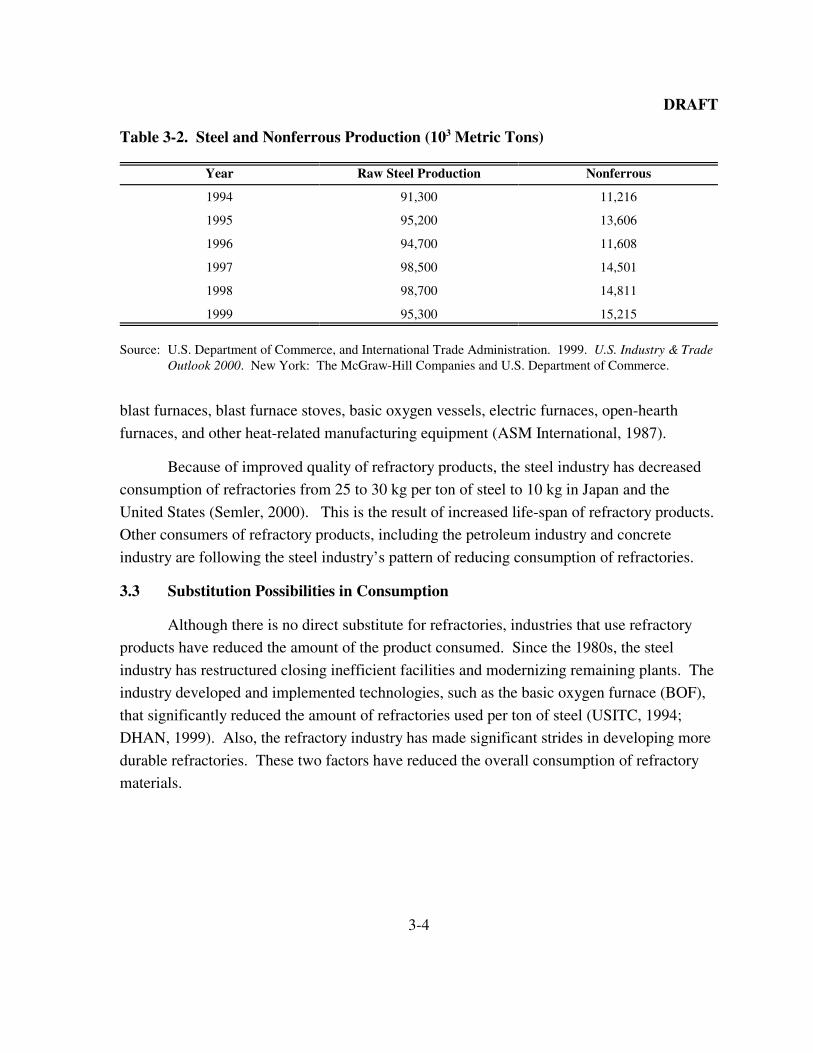
2000).1 Table 3-2 presents metric ton production of raw steel and nonferrous metals for the
period 1994 to 1999. Refractory products are used in the steel industry to line coke ovens,
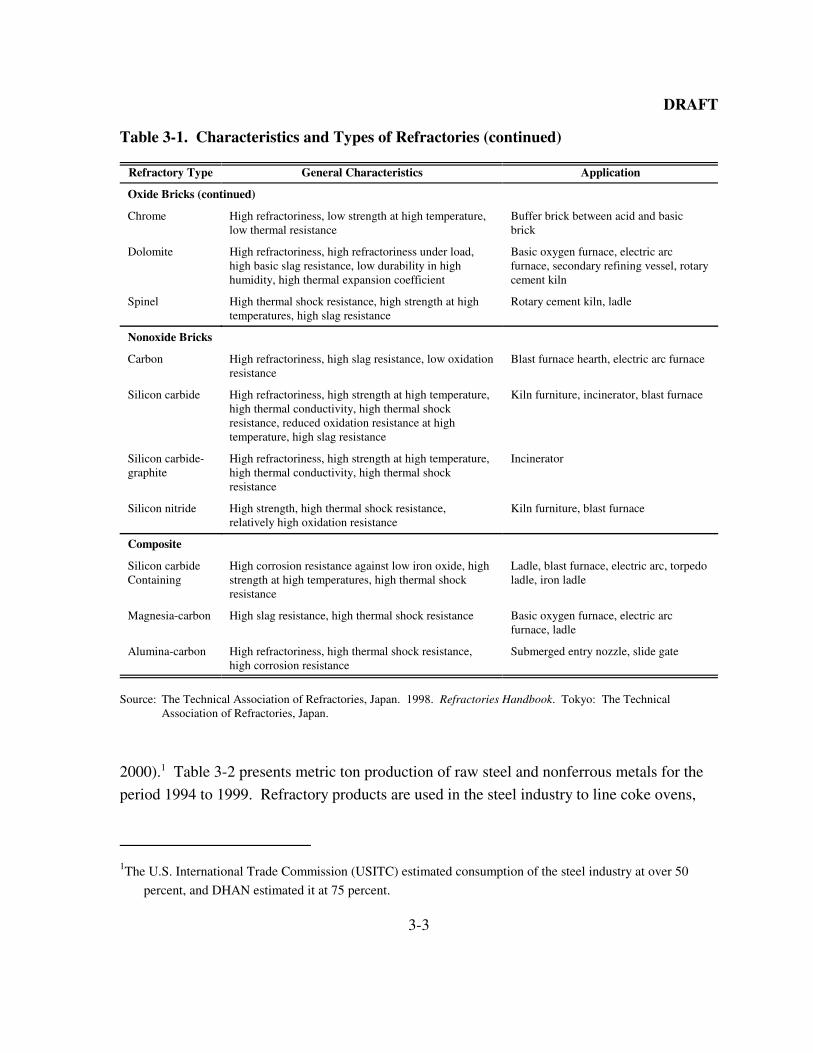
Table 3-1. Characteristics and Types of Refractories (continued)
Refractory Type General Characteristics Application
Oxide Bricks (continued)
Chrome High refractoriness, low strength at high temperature,low thermal resistance
Buffer brick between acid and basicbrick
Dolomite High refractoriness, high refractoriness under load,high basic slag resistance, low durability in highhumidity, high thermal expansion coefficient
Basic oxygen furnace, electric arcfurnace, secondary refining vessel, rotarycement kiln
Spinel High thermal shock resistance, high strength at hightemperatures, high slag resistance
Rotary cement kiln, ladle
Nonoxide Bricks
Carbon High refractoriness, high slag resistance, low oxidationresistance
Blast furnace hearth, electric arc furnace
Silicon carbide High refractoriness, high strength at high temperature,high thermal conductivity, high thermal shockresistance, reduced oxidation resistance at hightemperature, high slag resistance
Kiln furniture, incinerator, blast furnace
Silicon carbide-graphite
High refractoriness, high strength at high temperature,high thermal conductivity, high thermal shockresistance
Incinerator
Silicon nitride High strength, high thermal shock resistance,relatively high oxidation resistance
Kiln furniture, blast furnace
Composite
Silicon carbideContaining
High corrosion resistance against low iron oxide, highstrength at high temperatures, high thermal shockresistance
Ladle, blast furnace, electric arc, torpedoladle, iron ladle
Magnesia-carbon High slag resistance, high thermal shock resistance Basic oxygen furnace, electric arcfurnace, ladle
Alumina-carbon High refractoriness, high thermal shock resistance,high corrosion resistance
Submerged entry nozzle, slide gate
Source: The Technical Association of Refractories, Japan. 1998. Refractories Handbook. Tokyo: The TechnicalAssociation of Refractories, Japan.
DRAFT
3-4
blast furnaces, blast furnace stoves, basic oxygen vessels, electric furnaces, open-hearth
furnaces, and other heat-related manufacturing equipment (ASM International, 1987).
Because of improved quality of refractory products, the steel industry has decreased
consumption of refractories from 25 to 30 kg per ton of steel to 10 kg in Japan and the
United States (Semler, 2000). This is the result of increased life-span of refractory products.
Other consumers of refractory products, including the petroleum industry and concrete
industry are following the steel industry’s pattern of reducing consumption of refractories.
3.3 Substitution Possibilities in Consumption
Although there is no direct substitute for refractories, industries that use refractory
products have reduced the amount of the product consumed. Since the 1980s, the steel
industry has restructured closing inefficient facilities and modernizing remaining plants. The
industry developed and implemented technologies, such as the basic oxygen furnace (BOF),
that significantly reduced the amount of refractories used per ton of steel (USITC, 1994;
DHAN, 1999). Also, the refractory industry has made significant strides in developing more
durable refractories. These two factors have reduced the overall consumption of refractory
materials.
Table 3-2. Steel and Nonferrous Production (103 Metric Tons)
Year Raw Steel Production Nonferrous
1994 91,300 11,216
1995 95,200 13,606
1996 94,700 11,608
1997 98,500 14,501
1998 98,700 14,811
1999 95,300 15,215
Source: U.S. Department of Commerce, and International Trade Administration. 1999. U.S. Industry & TradeOutlook 2000. New York: The McGraw-Hill Companies and U.S. Department of Commerce.
DRAFT
4-1
SECTION 4
INDUSTRY ORGANIZATION
This section examines the organization of the U.S. refractory industry, including
plant location and production characteristics, commercial and captive producers, firm
characteristics, market structure, and degree of integration. Understanding the industry’s
organization helps determine how it will be affected by complying with the refractory
production NESHAP.
4.1 Refractory Manufacturing Plants
A facility is a site of land with a plant and equipment that combine inputs (clay, fuel
and labor) to produce an output (refratory products). Companies that own these facilities are
legal business entities that conduct transactions and make decisions that affect the facility.
The terms “facility,” “establishment,” and “plant” are synonymous in this study and refer to
the physical location where products are manufactured. Likewise, the terms “company” and
“firm” are used interghangeably to refer to the legal business entity that owns one or more
facilities. This section presents information on the companies that own refractory plants.
4.1.1 Refractories Database Facilities
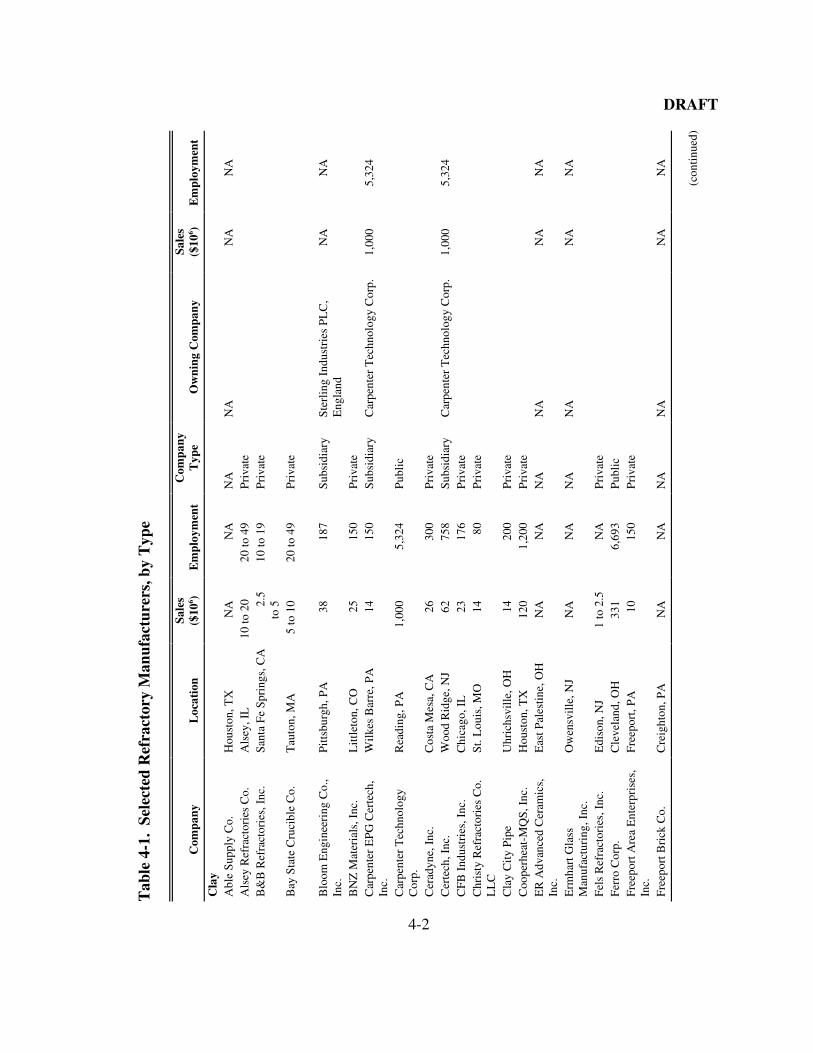
Table 4-1 presents detailed information on refractory companies, including the
location of the facility, its estimated sales volume in millions of dollars, and its employment.
4.1.2 Facility Location
Approximately 280 refractory manufacturing plants operate in the United States.
Refractory materials are produced in 37 states. Table 4-2 lists the number of refractory
facilities in the 50 states and Puerto Rico. The leading refractory-producing states are
Pennsylvania and Ohio. Figure 4-1 illustrates the distribution of the refractory producing
facilities in the United States.
DRAFT
4-2
Tab
le 4
-1.
Sele
cted
Ref
ract
ory
Man
ufac
ture
rs, b
y T
ype
Com
pany
Loc
atio
nSa
les
($10
6 )E
mpl
oym
ent
Com
pany
Typ
eO
wni
ng C
ompa
nySa
les
($10
6 )E
mpl
oym
ent
Cla
yA
ble
Sup
ply
Co.
Hou
ston
, TX
NA
NA
NA
NA
NA
NA
Als
ey R
efra
ctor
ies
Co.
Als
ey, I
L10
to 2
020
to 4
9P
riva
teB
&B
Ref
ract
orie
s, I
nc.
San
ta F
e S
prin
gs, C
A2.
5to
510
to 1
9P
riva
te
Bay
Sta
te C
ruci
ble
Co.
Tau
ton,
MA
5 to
10
20 to
49
Pri
vate
Blo
om E
ngin
eeri
ng C
o.,
Inc.
Pit
tsbu
rgh,
PA
3818
7S
ubsi
diar
yS
terl
ing
Indu
stri
es P
LC
,E
ngla
ndN
AN
A
BN
Z M
ater
ials
, Inc
.L
ittl
eton
, CO
2515
0P
riva
teC
arpe
nter
EPG
Cer
tech
,In
c.W
ilke
s B
arre
, PA
1415
0S
ubsi
diar
yC
arpe
nter
Tec
hnol
ogy
Cor
p.1,
000
5,32
4
Car
pent
er T
echn
olog
yC
orp.
Rea
ding
, PA
1,00
05,
324
Pub
lic
Cer
adyn
e, I
nc.
Cos
ta M
esa,
CA
2630
0P
riva
teC
erte
ch, I
nc.
Woo
d R
idge
, NJ
6275
8S
ubsi
diar
yC
arpe
nter
Tec
hnol
ogy
Cor
p.1,
000
5,32
4C
FB
Ind
ustr
ies,
Inc
.C
hica
go, I
L23
176
Pri
vate
Chr
isty
Ref
ract
orie
s C
o.L
LC
St.
Lou
is, M
O14
80P
riva
te
Cla
y C
ity
Pip
eU
hric
hsvi
lle,
OH
1420
0P
riva
teC
oope
rhea
t-M
QS
, Inc
.H
oust
on, T
X12
01,
200
Pri
vate
ER
Adv
ance
d C
eram
ics,
Inc.
Eas
t Pal
estin
e, O
HN
AN
AN
AN
AN
AN
A
Erm
hart
Gla
ssM
anuf
actu
ring
, Inc
.O
wen
svill
e, N
JN
AN
AN
AN
AN
AN
A
Fel
s R
efra
ctor
ies,
Inc
.E
diso
n, N
J1
to 2
.5N
AP
riva
teF
erro
Cor
p.C
leve
land
, OH
331
6,69
3P
ubli
cF
reep
ort A
rea
Ent
erpr
ises
,In
c.F
reep
ort,
PA
1015
0P
riva
te
Fre
epor
t Bri
ck C
o.C
reig
hton
, PA
NA
NA
NA
NA
NA
NA
(con
tinu
ed)
DRAFT
4-3
Tab
le 4
-1.
Sele
cted
Ref
ract
ory
Man
ufac
ture
rs, b
y T
ype
(con
tinu
ed)
Com
pany
Loc
atio
nSa
les
($10
6 )E
mpl
oym
ent
Com
pany
Typ
eO
wni
ng C
ompa
nySa
les
($10
6 )E
mpl
oym
ent
Cla
y (c
onti
nued
)
Glo
bal I
ndus
tria
lT
echn
olog
ies,
Inc
.D
alla
s, T
X14
24,
262
Pub
lic
Gre
en A
P R
efra
ctor
ies,
Inc
.M
exic
o, M
O25
300
Sub
sidi
ary
RH
I A
G1,
580
14,5
00
Har
biso
n-W
alke
rR
efra
ctor
ies
Co.
Pit
tsbu
rgh,
PA
263
1,61
5S
ubsi
diar
yR
HI
AG
1,58
014
,500
Hea
ter
Spe
cial
ists
, Inc
.T
ulsa
, OK
1716
0P
riva
te
Hol
land
Man
ufac
turi
ngC
orp.
Dol
ton,
IL
2.5
to 5
20 to
49
NA
NA
NA
NA
How
met
Cor
p.W
hite
hall
, MI
1,30
010
,350
Sub
sidi
ary
Cor
dant
Tec
hnol
ogie
s, I
nc.
2,51
317
,200
Indu
stri
al C
eram
icP
rodu
cts,
Inc
.C
olum
bus,
OH
NA
NA
NA
NA
NA
NA
Indu
stri
al P
rodu
ctIn
tern
atio
nal
Eng
lew
ood,
CO
1 to
2.5
5 to
9P
riva
te
Inla
nd E
nter
pris
e, I
nc.
Avo
n, O
H14
100
Pri
vate
Insu
l Co.
, Inc
.E
ast P
ales
tine
, OH
1577
Pri
vate
Inte
rnat
iona
l Chi
mne
yC
orp.
Wil
liam
svil
le, N
Y18
140
Pri
vate
Lou
sivi
lle
Fire
bric
k W
orks
Gra
hm, K
YN
AN
AN
AN
AN
AN
A
Mar
tin
Mar
iett
a M
agne
sia
Spe
cial
ties
, Inc
.R
alei
gh, N
CS
ubsi
diar
yM
arti
n M
arie
tta
Mat
eria
ls,
Inc.
1,05
757
0
Mar
ylan
d R
efra
ctor
ies
Co.
Iron
dale
, OH
1 to
2.5
NA
Pri
vate
Mon
o C
eram
ics,
Inc
.B
ento
n H
arbo
r, M
I11
45S
ubsi
diar
yM
onoc
on I
nter
nati
onal
Ref
ract
orie
s, E
ngla
ndN
AN
A
Mor
gani
te C
ruci
ble,
Inc
.N
orth
Hav
en, C
T15
75S
ubsi
diar
yM
orga
n C
ruci
ble
Co.
PL
C,
Eng
land
1,39
416
,885
Mt.
Sav
age
Fir
ebri
ck C
o.F
rost
burg
, MD
NA
NA
NA
NA
NA
NA
Nat
iona
l Ref
ract
orie
s &
Min
eral
s C
orp.
Liv
erm
ore,
CA
115
600
Sub
sidi
ary
Nat
iona
l Ref
ract
ory
Hol
ding
Co.
, Inc
.N
A81
0
New
Cas
tle
Ref
ract
orie
sM
assi
llon
, OH
1412
2S
ubsi
diar
yD
ixon
Tic
onde
roga
115
1,35
4
DRAFT
4-4
Tab
le 4
-1.
Sele
cted
Ref
ract
ory
Man
ufac
ture
rs, b
y T
ype
(con
tinu
ed)
Com
pany
Loc
atio
nSa
les
($10
6 )E
mpl
oym
ent
Com
pany
Typ
eO
wni
ng C
ompa
nySa
les
($10
6 )E
mpl
oym
ent
Cla
y (c
onti
nued
)N
orth
Am
eric
a R
efra
ctor
ies
Co.
Cle
vela
nd, O
H33
11,
500
Sub
sidi
ary
Did
ier-
Wer
ke A
G, G
erm
any
448.
5N
A
P-G
Ind
ustr
ies,
Inc
.P
uebl
o, C
O12
160
Pri
vate
Pli
bric
o C
o.O
ak H
ill,
OH
10 to
20
20 to
40
Pri
vate
Por
vair
Cor
p.H
ende
rson
vill
e, N
C18
200
Pri
vate
Pre
mie
r R
efra
ctor
ies,
Inc
.K
ing
of P
russ
ia, P
A64
778
Pri
vate
Pre
mie
r R
efra
ctor
ies
Inte
rnat
iona
l, In
c.K
ing
of P
russ
ia, P
A90
900
Sub
sidi
ary
Alp
ine
Gro
up, I
nc.
1,37
06,
600
Pry
otec
h, I
nc.
Spo
kane
, WA
4565
0P
riva
teR
efco
, Inc
.B
oyls
ton,
MA
3488
Sub
sidi
ary
Indu
stri
al D
istr
ibut
ion
Gro
up, I
nc.
273
1,20
0
Ref
ract
orie
s S
ales
and
Ser
vice
Co.
, Inc
.B
esse
mer
, AL
NA
NA
NA
NA
NA
NA
Ren
o R
efra
ctor
ies,
Inc
.M
orri
s, A
L16
85P
riva
teR
esco
Pro
duct
s, I
nc.
Nor
rist
own,
PA
5050
0P
riva
teR
HI
Ref
ract
orie
s A
mer
ica
NA
NA
NA
NA
NA
NA
Riv
ersi
de C
lay
Co.
, Inc
.P
ell C
ity,
AL
1510
0R
iver
side
Ref
ract
orie
s, I
nc.
Pel
l Cit
y, A
L14
100
Sub
sidi
ary
Riv
ersi
de C
lay
Co.
, Inc
.15
100
Rut
land
Pro
duct
sJa
ckso
nvil
le, F
LN
AN
AN
AN
AN
AN
AS
ervs
teel
, Inc
.M
orga
n, P
AS
GL
Car
bon
Cor
p.C
harl
otte
, NC
255
1,89
1S
ubsi
diar
yS
GL
Akt
ieng
esel
lsch
aft,
Ger
man
yS
hena
ngo
Ref
ract
orie
s, I
nc.
New
Cas
tle,
PA
5 to
10
20 to
49
Pri
vate
Ste
rlin
g In
dust
ries
of
Del
awar
e, I
nc.
Pit
tsbu
rgh,
PA
5731
2S
ubsi
diar
yS
terl
ing
Indu
stri
es P
LC
,E
ngla
ndT
he N
ock
and
Son
Co.
Oak
Hil
l, O
H2.
5to
510
to 1
9P
riva
te
(con
tinu
ed)
DRAFT
4-5
Tab
le 4
-1.
Sele
cted
Ref
ract
ory
Man
ufac
ture
rs, b
y T
ype
(con
tinu
ed)
Com
pany
Loc
atio
nSa
les (
$106 )
Em
ploy
men
t C
ompa
nyT
ype
Ow
ning
Com
pany
Sale
s($
106 )
Em
ploy
men
t
Cla
y (c
onti
nued
)
The
Whi
tacr
e-G
reer
Fir
eP
roof
ing
Co.
All
ianc
e, O
H5
to 1
0N
AP
riva
te
The
rmal
Cer
amic
s, I
nc.
Aug
usta
, GA
138
1,20
0S
ubsi
diar
yM
orga
n C
ruci
ble
Co.
PL
C,
Eng
land
1,39
416
,885
Tho
rley
Ref
ract
orie
s, I
nc.
Sou
thga
te, C
A5
to 1
020
to 4
9P
riva
te
Tra
nsit
Mix
Con
cret
e C
o.,
Inc.
Col
orad
o S
prin
gs,
CO
2521
0S
ubsi
diar
yC
onte
nent
al M
ater
ials
Cor
p.,
Del
awar
eN
AN
A
TY
K A
mer
ica,
Inc
.C
lair
ton,
PA
3712
2S
ubsi
diar
yT
YK
Cor
p., J
apan
133.
5N
A
Uni
frax
Cor
p.N
iaga
ra F
alls
, NY
85
285
Sub
sidi
ary
Kir
klan
d C
apit
al P
artn
ers
LP
9080
8
Uni
vers
al R
efra
ctor
ies,
Inc
.W
ampu
m, P
A24
130
Pri
vate
Uta
h R
efra
ctor
ies
Co.
Leh
i, U
TN
AN
AN
AN
AN
AN
A
Wah
l Ref
ract
orie
s, I
nc.
Fre
mon
t, O
H17
68S
ubsi
diar
yT
herm
atex
Cor
p.10
148
Zer
o R
efra
ctor
ies,
Inc
.T
aylo
r M
I0.
51
to 4
Pri
vate
Non
clay
Adv
ance
d C
eram
ics
Cor
p.C
leve
land
, OH
25 to
50
NA
Pri
vate
Adv
ance
d C
eram
ics
Inte
rnat
iona
l, In
c.C
leve
land
, OH
2117
5P
riva
te
All
ied
Min
eral
Pro
duct
s,In
c.C
olum
bus,
OH
5624
0P
riva
te
Alp
ine
Gro
up, I
nc.
New
Yor
k, N
Y1,
370
6,60
0P
ubli
c
Alu
min
um C
ompa
ny o
fA
mer
ica
(AL
CO
A)
Pit
tsbu
rgh,
PA
15,3
0010
3,50
0P
ubli
c
AM
PA
CA
mst
erda
m, N
Y13
100
Pri
vate
B S
C H
oldi
ng, I
nc.
Sha
wne
e M
issi
on,
KS
2315
Pri
vate
Bak
er H
oldi
ng C
o., I
nc.
Yor
k, P
A19
01,
300
Pub
lic
Bak
er J
E C
o.Y
ork,
PA
190
1,05
0S
ubsi
diar
yB
aker
Hol
ding
Co.
, Inc
.19
01,
300
Bar
tley
Cru
cibl
e &
Tre
nton
, NJ
NA
NA
NA
NA
NA
NA
DRAFT
4-6
Tab
le 4
-1.
Sele
cted
Ref
ract
ory
Man
ufac
ture
rs, b
y T
ype
(con
tinu
ed)
Com
pany
Loc
atio
nSa
les
($10
6 )E
mpl
oym
ent
Com
pany
Typ
eO
wni
ng C
ompa
nySa
les
($10
6 )E
mpl
oym
ent
Non
clay
(co
ntin
ued)
Bet
hleh
em A
dvan
ced
Mat
eria
ls C
orp.
Kno
xvil
le, T
N14
110
Sub
sidi
ary
The
Bet
hleh
em C
orp.
1411
7
Bla
sh P
reci
sion
Cer
amic
s,In
c. (
Tex
as U
nite
d)H
oust
on, T
X63
515
Pri
vate
BN
Z M
ater
ials
, Inc
.Z
elie
nopl
e, P
A1
to 2
.55
to 9
priv
ate
CC
PI,
Inc
.B
lanc
hest
er, O
H25
to 5
0N
Apr
ivat
eC
erco
m, I
nc.
Vis
ta, C
A11
76P
riva
teC
erte
ch, I
nc.
Str
eets
boro
, OH
6275
8S
ubsi
diar
yC
arpe
nter
Tec
hnol
ogy
Cor
p.1,
000
5,32
4C
FB
Ind
ustr
ies,
Inc
.C
hica
go, I
L23
176
Pri
vate
Chi
cago
Fir
ebri
ck C
o., I
nc.
Chi
cago
, IL
1858
Pri
vate
Coo
rs P
orce
lain
Co.
, Inc
.30
42,
900
Sub
sidi
ary
AC
X T
echn
olog
ies,
Inc
.98
85,
600
Dix
on T
icon
dero
ga C
o.,
Inc.
Lak
e M
ary,
FL
851,
562
Pub
lic
ET
S S
chae
fer
Cor
p.M
aced
onia
, OH
13
195
Sub
sidi
ary
Alu
mit
ech,
Inc
.21
210
Fos
eco,
Inc
.C
leve
land
, OH
7150
0S
ubsi
diar
yF
osec
o H
oldi
ng B
V,
Net
herl
ands
Glo
bal I
ndus
tria
lT
echn
olog
ies,
Inc
.D
alla
s, T
X14
24,
262
Pub
lic
Har
biso
n-W
alke
rR
efra
ctor
ies
Co.
Pit
tsbu
rgh,
PA
263
1,61
5S
ubsi
diar
yR
HI
AG
1,58
014
,500
Insu
l Co.
, Inc
.E
ast P
ales
tine
, OH
1577
Pri
vate
JW H
icks
, Inc
.M
erre
llvi
lle,
IN
5 to
10
20 to
49
NA
NA
NA
NA
Mag
neco
, Inc
.A
ddis
on, I
L19
150
Sub
sidi
ary
Mag
neco
/Met
rel,
Inc.
34M
arti
n M
arie
tta
Mag
nesi
aS
peci
alti
es, I
nc.
Ral
eigh
, NC
Sub
sidi
ary
Mar
tin
Mar
iett
a M
ater
ials
,In
c.1,
057
570
Min
co A
cqui
stio
n C
orp.
Mid
way
, TN
2117
0P
riva
teM
inco
, Inc
.M
idw
ay, T
N15
135
Sub
sidi
ary
Min
co A
cqui
siti
on C
orp.
2117
0M
iner
als
Tec
hnol
ogie
s,In
c.N
ew Y
ork,
NY
609
2,26
0P
ubli
c
Min
teq
Inte
rnat
iona
l, In
c.N
ew Y
ork,
NY
205
1,80
0S
ubsi
diar
yM
iner
als
Tec
hnol
ogie
s, I
nc.
609
2,26
0
(con
tinu
ed)
DRAFT
4-7
Tab
le 4
-1.
Sele
cted
Ref
ract
ory
Man
ufac
ture
rs, b
y T
ype
(con
tinu
ed)
Com
pany
Loc
atio
nSa
les
($10
6 )E
mpl
oym
ent
Com
pany
Typ
eO
wni
ng C
ompa
nySa
les
($10
6 )E
mpl
oym
ent
Non
clay
(co
ntin
ued)
Mit
subi
shi C
emen
t Cor
p.O
ntar
io, C
A74
619
Sub
sidi
ary
Mit
subi
shi M
ater
ials
Cor
p.,
Japa
n9,
354
6,55
6
Mix
ed M
iner
al P
rodu
cts,
Inc.
Col
umbu
s, O
HN
AN
AN
AN
AN
AN
A
Mon
ofra
x, I
nc.
Fal
cone
r, N
Y50
to 1
0025
0 to
499
Pri
vate
Mor
gani
te C
ruci
ble,
Inc
.N
orth
Hav
en, C
T15
75S
ubsi
diar
yM
orga
n C
ruci
ble
Co.
PL
C,
Eng
land
1,39
416
,885
Nat
iona
l Ref
ract
orie
s &
Min
eral
s C
orp.
Liv
erm
ore,
CA
115
600
Sub
sidi
ary
Nat
iona
l Ref
ract
ory
Hol
ding
Co.
, Inc
.
New
Cas
tle
Ref
ract
orie
sM
assi
llon
, OH
1412
2S
ubsi
diar
yD
ixon
Tic
onde
roga
115
1,35
4
New
port
San
d &
Gra
vel
Co.
, Inc
.N
ewpo
rt, N
H13
100
Pri
vate
Nor
th A
mer
ican
Ref
ract
orie
s C
o.C
leve
land
, OH
331
1,50
0S
ubsi
diar
yD
idie
r-W
erke
AG
, Ger
man
yN
AN
A
Nor
ton
Co.
, Inc
.W
orce
ster
, MA
1,50
09,
000
Sub
sidi
ary
Sai
nt-G
obai
n, F
ranc
e23
,113
165,
000
Osr
am S
ylva
nia,
Inc
.D
anve
rs, M
A5,
200
13,0
00S
ubsi
diar
yS
iem
ans
Cor
p.
Osr
am S
ylva
nia
Pro
duct
s,In
c.D
anve
rs, M
A1,
800
1,10
0S
ubsi
diar
yS
iem
ans
Cor
p.
Pel
l Ind
ustr
ies
Gro
ve C
ity,
PA
5 to
10
20 to
49
Pri
vate
Pre
from
ix T
echn
olog
ies
LT
DW
arre
n, O
H10
75P
riva
te
Pre
mie
r R
efra
ctor
ies
Inte
rnat
iona
l, In
c.K
ing
of P
russ
ia, P
A90
900
Sub
sidi
ary
Alp
ine
Gro
up, I
nc.
1,37
06,
600
Prem
ier
Serv
ices
, Inc
.B
etts
ville
, OH
NA
NA
NA
NA
NA
NA
Pyr
otek
Inc
.S
poka
ne, W
A50
to 1
00N
AP
riva
te
Rex
Rot
o C
orp.
Fow
lerv
ille
, MI
1480
Pri
vate

DRAFT
4-8
Tab
le 4
-1.
Sele
cted
Ref
ract
ory
Man
ufac
ture
rs, b
y T
ype
(con
tinu
ed)
Com
pany
Loc
atio
nSa
les
($10
6 )E
mpl
oym
ent
Com
pany
Typ
eO
wni
ng C
ompa
nySa
les
($10
6 )E
mpl
oym
ent
Non
clay
(co
ntin
ued)
Sai
nt-G
obai
n A
dvan
ced
Mat
eria
ls C
orp.
Lou
isvi
lle,
KY
533
3,30
0S
ubsi
diar
yN
orto
n C
o., I
nc.
Sel
ee C
orp.
Hen
ders
onvi
lle,
NC
519
0S
ubsi
diar
yP
orva
ir P
LC
, Eng
land
Sil
icon
Car
bide
Pro
duct
s,In
c.E
lmir
a, N
Y1
to 2
.55
to 9
Pri
vate
Spar
, Inc
.Ja
ckso
nvil
le, F
LN
AN
AN
AN
AN
AN
AT
herm
atex
Cor
p.(T
herm
alit
e)F
rem
ont,
OH
1014
8P
riva
te
TY
K A
mer
ica,
Inc
.C
lair
ton,
PA
3712
2S
ubsi
diar
yT
YK
Cor
p., J
apan
133.
5N
AU
CA
R C
arbo
n C
o.D
anbu
ry, C
T10
51,
506
Sub
sidi
ary
UC
AR
Int
erna
tion
al, I
nc.
947
4,95
2U
nive
rsal
Ref
ract
orie
s, I
nc.
Wam
pum
, PA
2413
0P
riva
teV
arsa
l Ins
trum
ents
, Inc
.W
arm
inst
er, P
A15
224
Priv
ate
Ves
uviu
s C
ruci
ble
Co.
Cha
mpa
ign,
IL
400
2,50
0S
ubsi
diar
yC
ooks
on G
roup
PL
C,
Eng
land
3,01
117
,101
Ves
uviu
s U
SA
Cor
p.C
ham
paig
n, I
L40
01,
600
Sub
sidi
ary
Coo
kson
Gro
up P
LC
,E
ngla
nd3,
011
17,1
01
Wul
frat
h R
efra
ctor
ies,
Inc
.T
aren
tum
, PA
2211
5P
riva
teZ
irca
r P
rodu
cts,
Inc
.F
lori
da, N
Y12
85P
riva
teZ
irco
a, I
nc.
Sol
on, O
H20
140
Sub
sidi
ary
Did
ier-
Wer
ke A
G, G
erm
any
448.
54,
717
NA
= N
ot a
vail
able
.
Sou
rce:
Dun
& B
rads
tree
t. 2
000.
D&
B M
illi
on D
olla
r D
irec
tory
. S
erie
s 20
00.
Bet
hleh
em, P
A:
Dun
& B
rads
tree
t, In
c.
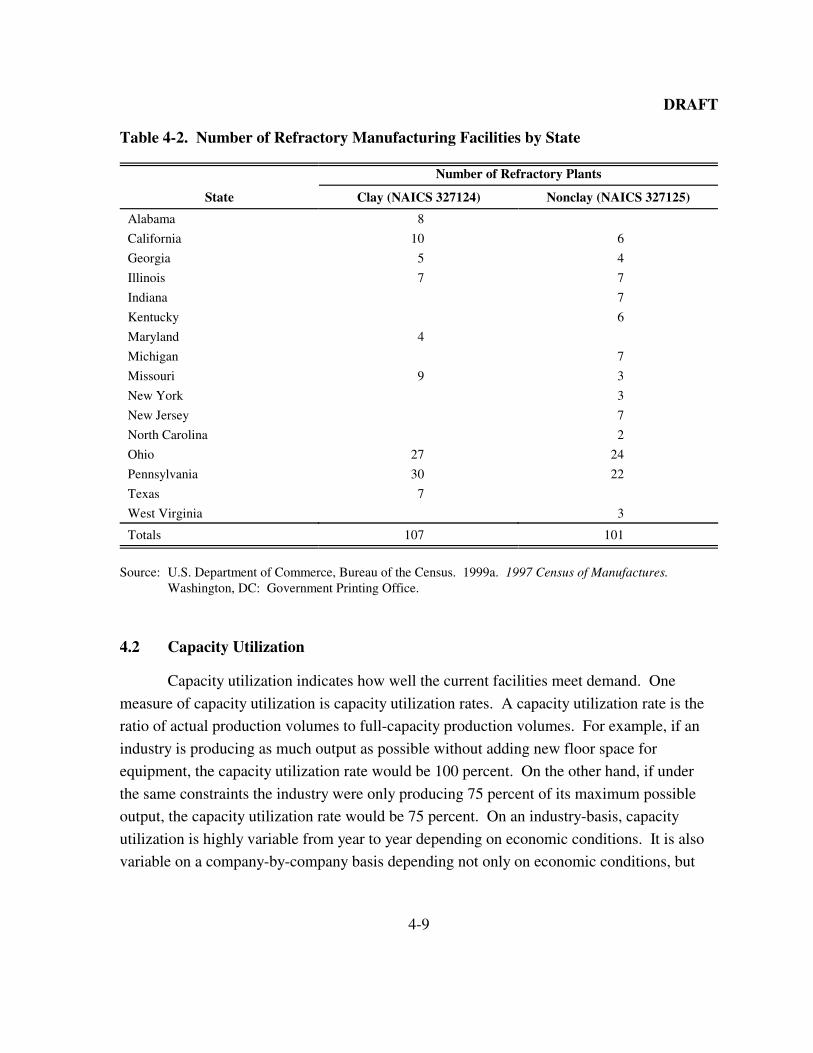
DRAFT
4-9
4.2 Capacity Utilization
Capacity utilization indicates how well the current facilities meet demand. One
measure of capacity utilization is capacity utilization rates. A capacity utilization rate is the
ratio of actual production volumes to full-capacity production volumes. For example, if an
industry is producing as much output as possible without adding new floor space for
equipment, the capacity utilization rate would be 100 percent. On the other hand, if under
the same constraints the industry were only producing 75 percent of its maximum possible
output, the capacity utilization rate would be 75 percent. On an industry-basis, capacity
utilization is highly variable from year to year depending on economic conditions. It is also
variable on a company-by-company basis depending not only on economic conditions, but
Table 4-2. Number of Refractory Manufacturing Facilities by State
Number of Refractory Plants
State Clay (NAICS 327124) Nonclay (NAICS 327125)
Alabama 8
California 10 6
Georgia 5 4
Illinois 7 7
Indiana 7
Kentucky 6
Maryland 4
Michigan 7
Missouri 9 3
New York 3
New Jersey 7
North Carolina 2
Ohio 27 24
Pennsylvania 30 22
Texas 7
West Virginia 3
Totals 107 101
Source: U.S. Department of Commerce, Bureau of the Census. 1999a. 1997 Census of Manufactures. Washington, DC: Government Printing Office.
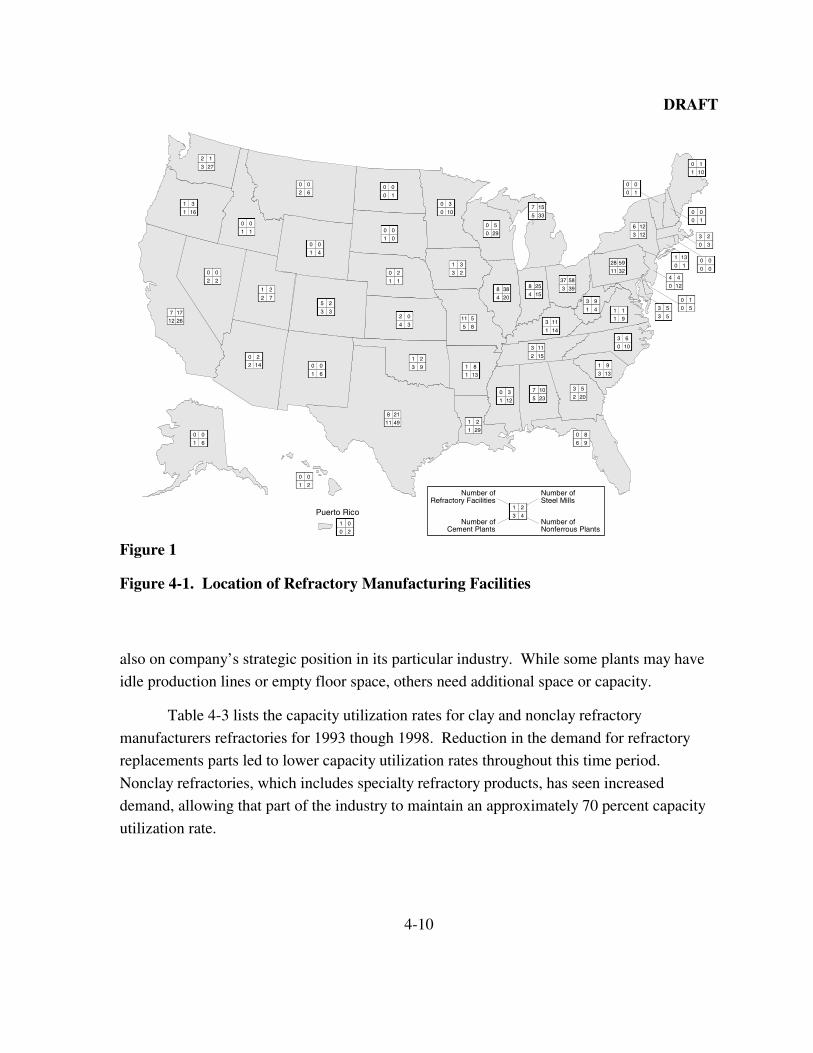
DRAFT
4-10
Puerto Rico
00
11
00
41
00
10
00
01
20
11
30
100
12
273
31
161
00
62
Number ofRefractory Facilities
Number ofCement Plants
Number ofSteel Mills
Number ofNonferrous Plants
21
43
31
23
25
3302
34511
85
50
290
157
335
388
204
258
154
5837
393
113
141
93
41
218
4911
21
93 81
131
21
291
30
121
107
235
53
202
00
61
21
72
00
22
177
2612
20
142
00
61
00
21
01
20
113
152
91
133
63
100
11
91
80
96
5928
3211
126
123
10
101
00
10
23
30
131
1000
00
53
53
44
120
10
50
00
10
Figure 1
Figure 4-1. Location of Refractory Manufacturing Facilities
also on company’s strategic position in its particular industry. While some plants may have
idle production lines or empty floor space, others need additional space or capacity.
Table 4-3 lists the capacity utilization rates for clay and nonclay refractory
manufacturers refractories for 1993 though 1998. Reduction in the demand for refractory
replacements parts led to lower capacity utilization rates throughout this time period.
Nonclay refractories, which includes specialty refractory products, has seen increased
demand, allowing that part of the industry to maintain an approximately 70 percent capacity
utilization rate.

DRAFT
4-11
4.3 Industry Concentration and Market Structure
Market structure, which characterizes the level and type of competition among
refractory producers, determines the behavior of producers and consumers in the industry,
including their power to influence market price. If an industry is perfectly competitive, then
the individual producers have little market power; they are not able to influence the price of
the outputs they sell or the inputs they purchase. Perfectly competitive industries have large
numbers of firms, the products sold are undifferentiated, and the entry and exit of firms are
unrestricted.
Conversely, imperfectly competitive industries or markets are characterized by a
smaller number of firms, differentiated products, and restricted entry or exit. Product
differentiation can occur both from differences in product attributes and quality and from
brand name recognition of products. Entry and exit of firms are restricted in industries when
government regulates entry (e.g., through licenses or permits), when one firm owns the entire
stock of critical input, or when a single firm is able to supply the entire market.
When compared across industries, firms in industries with fewer firms, more product
differentiation, and restricted entry are more likely to have the power to influence the price
they receive for a product by reducing output below perfectly competitive levels. At the
Table 4-3. Full Production Capacity Utilization Rates for Clay and NonclayRefractories: Fourth Quarters 1993 through 1998
Clay (NAICS 327125) Nonclay (NAICS 327125)
1993 75 71
1994 80 75
1995 63 81
1996 61 82
1997 49 78
1998 54 72
Source: U.S. Department of Commerce, Bureau of the Census. 1999d. 1998 Survey of Plant Capacity. Washington, DC: Government Printing Office.

DRAFT
4-12
extreme, a single monopolistic firm may supply the entire market and hence set the price of
the output. On the input market side, firms may be able to influence the price they pay for an
input if few firms, both from within and outside the industry, use that input.
4.3.1 Measures of Industry Concentration
To assess the competitiveness of an industry, economists often estimate four-firm
concentration ratios (CR4), eight-firm concentration ratios (CR8), and Herfindahl-
Hirschmann indexes (HHI) for the subject market or industry. The CR4s and CR8s measure
the percentage of sales accounted for by the top four and eight firms in the industry. The
HHIs are the sums of the squared market shares of firms in the industry. Table 4-4 provides
concentration ratios for the refractory industry.
Unfortunately, there is no objective criterion for determining market structure based
on the values of these concentration ratios. However, there are criteria for determining
market structure based on the HHIs for use in merger analyses, which are provided in the
1992 Department of Justice’s Horizontal Merger Guidelines (U.S. Department of Justice and
the Federal Trade Commission, 1992). According to these criteria, industries with HHIs
below 1,000 are considered unconcentrated (i.e., more competitive), those with HHIs
between 1,000 and 1,800 are considered moderately concentrated (i.e, moderately
Table 4-4. Market Concentration Measures for SIC 3255 Clay RefractoryManufacturing and SIC 3297 Nonclay Refractory Manufacturing
Value
Measure Clay Nonclay
Herfindahl-Hirschmann Index (HHI) 578 527
Four-firm concentration ratio (CR4) 40 36
Eight-firm concentration ratio (CR8) 62 58
Number of companies 95 102
Number of facilities 145 142
Value of shipments 886.8 1,203.8
Source: U.S. Department of Commerce, Bureau of the Census. 1996b. Concentration Ratios inManufacturing. MC92-S-2. Washington, DC: Government Printing Office. Available at<http://www.census.gov/mcd/mancen/download/mc92cr.sum>.
DRAFT
4-13
competitive). Firms in less-concentrated industries are more likely to be price takers, while
firms in more-concentrated industries are more likely to be able to influence market prices.
These measures of market concentration can be computed using four-digit SIC codes based
on U.S. Bureau of the Census data (U.S. Department of Commerce, 1993). Based on the
HHI criteria, the refractory industry is not concentrated, and, therefore, competitive in
structure. These indices are measures of concentration of the industry at the national level.
There is no reason to believe, however, that the markets for refractories may be regional
rather than national.
4.3.2 Market Structure
The refractories industry is characterized by having the majority of its products used
as inputs for the steel industry. Small numbers of buyers can result in the buyers maintaining
some measure of control over the input price (monopsony or oligopsony).
A monopsony occurs when a firm is the sole purchaser of an input. The monopsonist
has the market power in the input market and can reduce the price paid without losing all
input. An oligopsony is characterized by the presence of a few large buyers (even though
there may also be many small buyers of insignificant size). In oligopsony, large firms are
aware of their competitors for purchasing inputs and determine their purchasing price and
quantity based on their expectations of their competitors’ behavior. Because of multiple
steel manufacturers, refractory inputs are purchased by multiple buyers resulting in
oligopsonisonistic market.
4.3.3 Small Businesses that Own Lime Facilities
To determine the possible impacts on small businesses, both clay and nonclay
refractory manufacturers are categorized as small or large using the Small Business
Administration (SBA) general size definitions (SBA, 1998). For clay refractory
manufacturers, a small company has 500 or fewer employees. For nonclay refractory
manufacturers, small is defined as having 750 or fewer employees.
Table 4-5 lists the employment and sales data for the small companies that are
owners of refractory producing facilities. Data on employment and sales for many of these
companies is difficult to acquire, because they are privately held. Thirty-five companies
owning clay refractory plants and 26 nonclay refractory owning businesses are small, while 7
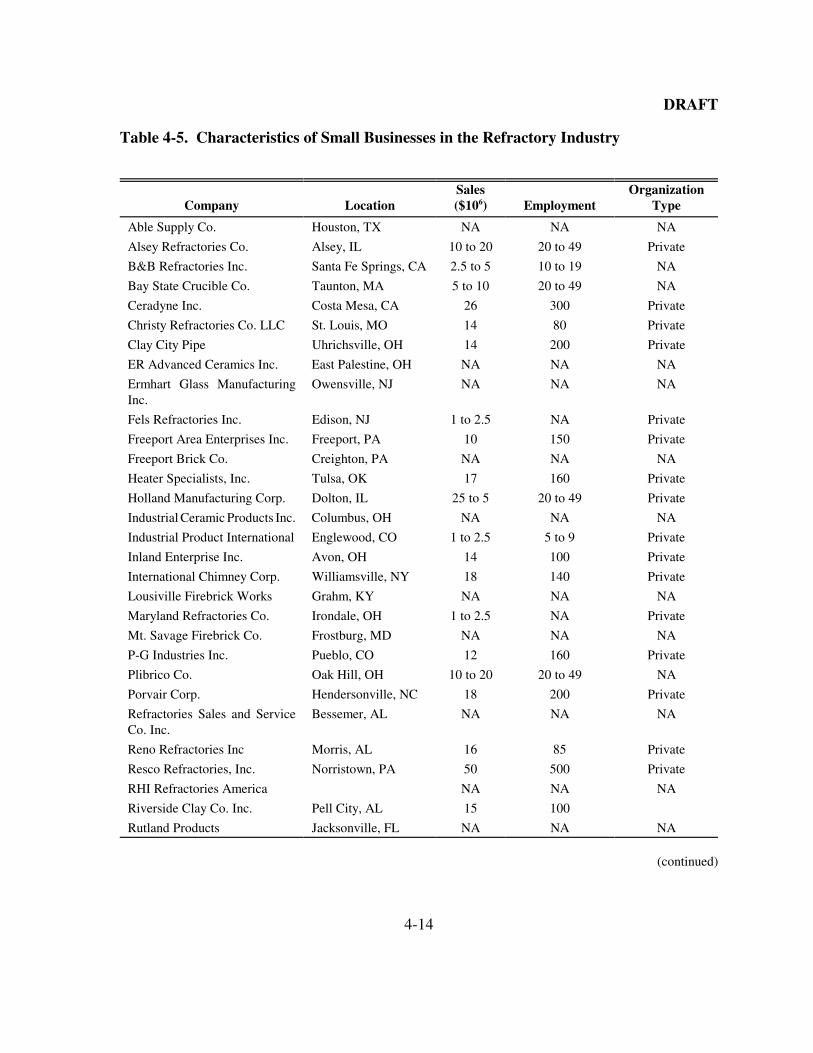
DRAFT
4-14
Table 4-5. Characteristics of Small Businesses in the Refractory Industry
Company LocationSales($106) Employment
OrganizationType
Able Supply Co. Houston, TX NA NA NA
Alsey Refractories Co. Alsey, IL 10 to 20 20 to 49 Private
B&B Refractories Inc. Santa Fe Springs, CA 2.5 to 5 10 to 19 NA
Bay State Crucible Co. Taunton, MA 5 to 10 20 to 49 NA
Ceradyne Inc. Costa Mesa, CA 26 300 Private
Christy Refractories Co. LLC St. Louis, MO 14 80 Private
Clay City Pipe Uhrichsville, OH 14 200 Private
ER Advanced Ceramics Inc. East Palestine, OH NA NA NA
Ermhart Glass ManufacturingInc.
Owensville, NJ NA NA NA
Fels Refractories Inc. Edison, NJ 1 to 2.5 NA Private
Freeport Area Enterprises Inc. Freeport, PA 10 150 Private
Freeport Brick Co. Creighton, PA NA NA NA
Heater Specialists, Inc. Tulsa, OK 17 160 Private
Holland Manufacturing Corp. Dolton, IL 25 to 5 20 to 49 Private
Industrial Ceramic Products Inc. Columbus, OH NA NA NA
Industrial Product International Englewood, CO 1 to 2.5 5 to 9 Private
Inland Enterprise Inc. Avon, OH 14 100 Private
International Chimney Corp. Williamsville, NY 18 140 Private
Lousiville Firebrick Works Grahm, KY NA NA NA
Maryland Refractories Co. Irondale, OH 1 to 2.5 NA Private
Mt. Savage Firebrick Co. Frostburg, MD NA NA NA
P-G Industries Inc. Pueblo, CO 12 160 Private
Plibrico Co. Oak Hill, OH 10 to 20 20 to 49 NA
Porvair Corp. Hendersonville, NC 18 200 Private
Refractories Sales and ServiceCo. Inc.
Bessemer, AL NA NA NA
Reno Refractories Inc Morris, AL 16 85 Private
Resco Refractories, Inc. Norristown, PA 50 500 Private
RHI Refractories America NA NA NA
Riverside Clay Co. Inc. Pell City, AL 15 100
Rutland Products Jacksonville, FL NA NA NA
(continued)
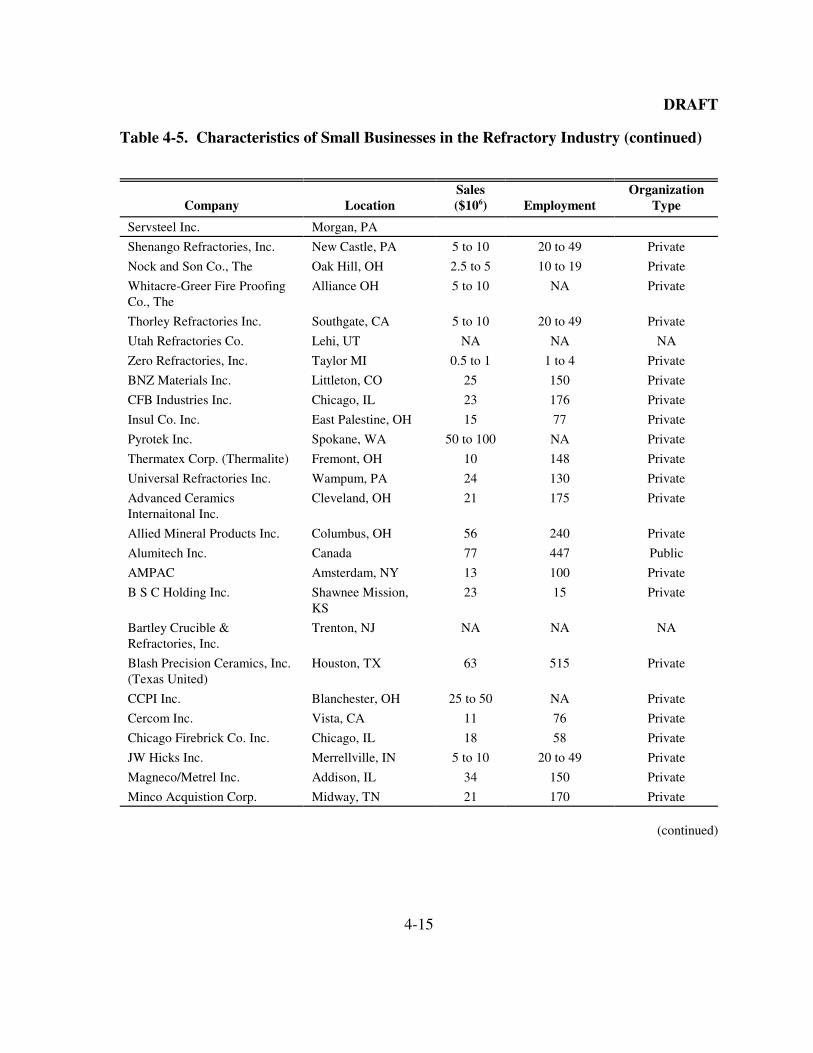
DRAFT
4-15
Table 4-5. Characteristics of Small Businesses in the Refractory Industry (continued)
Company LocationSales($106) Employment
OrganizationType
Servsteel Inc. Morgan, PA
Shenango Refractories, Inc. New Castle, PA 5 to 10 20 to 49 Private
Nock and Son Co., The Oak Hill, OH 2.5 to 5 10 to 19 Private
Whitacre-Greer Fire ProofingCo., The
Alliance OH 5 to 10 NA Private
Thorley Refractories Inc. Southgate, CA 5 to 10 20 to 49 Private
Utah Refractories Co. Lehi, UT NA NA NA
Zero Refractories, Inc. Taylor MI 0.5 to 1 1 to 4 Private
BNZ Materials Inc. Littleton, CO 25 150 Private
CFB Industries Inc. Chicago, IL 23 176 Private
Insul Co. Inc. East Palestine, OH 15 77 Private
Pyrotek Inc. Spokane, WA 50 to 100 NA Private
Thermatex Corp. (Thermalite) Fremont, OH 10 148 Private
Universal Refractories Inc. Wampum, PA 24 130 Private
Advanced CeramicsInternaitonal Inc.
Cleveland, OH 21 175 Private
Allied Mineral Products Inc. Columbus, OH 56 240 Private
Alumitech Inc. Canada 77 447 Public
AMPAC Amsterdam, NY 13 100 Private
B S C Holding Inc. Shawnee Mission,KS
23 15 Private
Bartley Crucible &Refractories, Inc.
Trenton, NJ NA NA NA
Blash Precision Ceramics, Inc.(Texas United)
Houston, TX 63 515 Private
CCPI Inc. Blanchester, OH 25 to 50 NA Private
Cercom Inc. Vista, CA 11 76 Private
Chicago Firebrick Co. Inc. Chicago, IL 18 58 Private
JW Hicks Inc. Merrellville, IN 5 to 10 20 to 49 Private
Magneco/Metrel Inc. Addison, IL 34 150 Private
Minco Acquistion Corp. Midway, TN 21 170 Private
(continued)
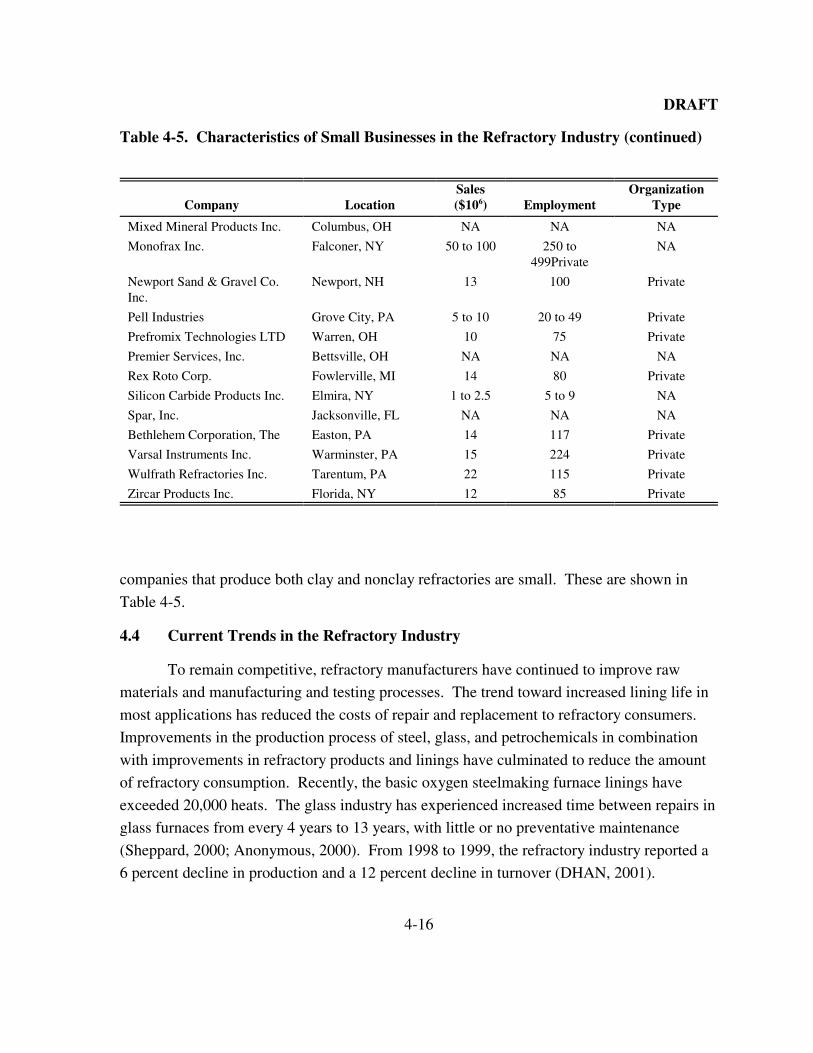
DRAFT
4-16
companies that produce both clay and nonclay refractories are small. These are shown in
Table 4-5.
4.4 Current Trends in the Refractory Industry
To remain competitive, refractory manufacturers have continued to improve raw
materials and manufacturing and testing processes. The trend toward increased lining life in
most applications has reduced the costs of repair and replacement to refractory consumers.
Improvements in the production process of steel, glass, and petrochemicals in combination
with improvements in refractory products and linings have culminated to reduce the amount
of refractory consumption. Recently, the basic oxygen steelmaking furnace linings have
exceeded 20,000 heats. The glass industry has experienced increased time between repairs in
glass furnaces from every 4 years to 13 years, with little or no preventative maintenance
(Sheppard, 2000; Anonymous, 2000). From 1998 to 1999, the refractory industry reported a
6 percent decline in production and a 12 percent decline in turnover (DHAN, 2001).
Table 4-5. Characteristics of Small Businesses in the Refractory Industry (continued)
Company LocationSales($106) Employment
OrganizationType
Mixed Mineral Products Inc. Columbus, OH NA NA NA
Monofrax Inc. Falconer, NY 50 to 100 250 to499Private
NA
Newport Sand & Gravel Co.Inc.
Newport, NH 13 100 Private
Pell Industries Grove City, PA 5 to 10 20 to 49 Private
Prefromix Technologies LTD Warren, OH 10 75 Private
Premier Services, Inc. Bettsville, OH NA NA NA
Rex Roto Corp. Fowlerville, MI 14 80 Private
Silicon Carbide Products Inc. Elmira, NY 1 to 2.5 5 to 9 NA
Spar, Inc. Jacksonville, FL NA NA NA
Bethlehem Corporation, The Easton, PA 14 117 Private
Varsal Instruments Inc. Warminster, PA 15 224 Private
Wulfrath Refractories Inc. Tarentum, PA 22 115 Private
Zircar Products Inc. Florida, NY 12 85 Private
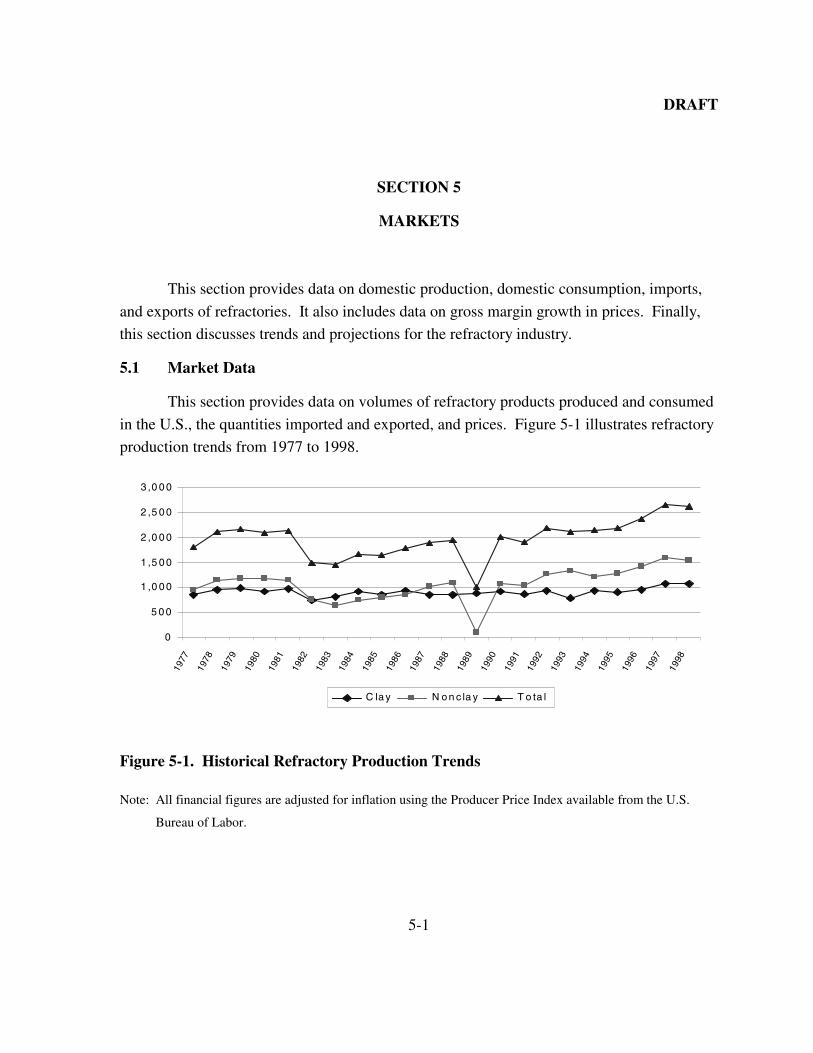
DRAFT
5-1
0
5 0 0
1 ,0 0 0
1 ,5 0 0
2 ,0 0 0
2 ,5 0 0
3 ,0 0 0
1977
1978
1979
1980
1981
1982
1983
1984
1985
1986
1987
1988
1989
1990
1991
1992
1993
1994
1995
1996
1997
1998
C la y N o n c la y T o ta l
Figure 5-1. Historical Refractory Production Trends
Note: All financial figures are adjusted for inflation using the Producer Price Index available from the U.S.
Bureau of Labor.
SECTION 5
MARKETS
This section provides data on domestic production, domestic consumption, imports,
and exports of refractories. It also includes data on gross margin growth in prices. Finally,
this section discusses trends and projections for the refractory industry.
5.1 Market Data
This section provides data on volumes of refractory products produced and consumed
in the U.S., the quantities imported and exported, and prices. Figure 5-1 illustrates refractory
production trends from 1977 to 1998.
DRAFT
5-2
5.1.1 Domestic Production
During the last two decades, the refractory industry has been affected by declining
demand for traditional refractory products, such as bricks and shapes, and customer
requirements for higher quality special refractories. Accounting for nearly 40 percent of all
shipments, bricks and shapes are the principal forms of refractory products produced in the
United States (USITC, 1993). Table 5-1 illustrates the values of domestically produced clay
and nonclay refractories from 1977 to 1998 in both current and 1998 dollars.
5.1.2 International Trade
As indicated in Table 5-2, international trade is not a major component of the U.S.
market for refractory products. In 1999, refractory exports accounted for a little over 16
percent of shipped refractory products. Nations with significant iron, steel, cement, and
nonferrous metal industries, including the United States, Europe, and Japan, are the major
world markets for refractory products. From 1988 to 1992, Canada was the leading importer
of U.S. refractory products, with over 38 percent of all exports, followed by Mexico.
Emerging foreign markets for the United States include India, China, and other countries in
Central and South America. Japan and Canada are the top suppliers of imports to the United
States (USITC, 1994).
5.2 Market Prices
Table 5-3 lists some average prices for refractory products for 1989, 1993 and 1998.
Most refractory products are typically used in kilns and ovens and are refractories engineered
for a particular use. Price is typically based on the consumer’s requirements.
5.3 Industry Trends
In the last decade, the refractory industry has experienced significant restructuring.
Two large conglomerates, RHI and Vesuvius, dominate refractories markets (Sheppard,
2000). In 1999, Alpine Group sold its Premier Refractories unit to Cookson Group of the
U.K., and Global Industrial Technologies (parent of Harbison-Walker Refractories) was
acquired by RHI AG (formerly Radex Heraklith Industriebeteiligungs) of Austria. Other
leading refractory producers are Allied Mineral Products, Baker Refractories, Minerals
Technologies (via MINTEQ), Morgan Crucible, National Refractories Holding Co., Resco
Products, and Compagnie de Saint-Gobain.
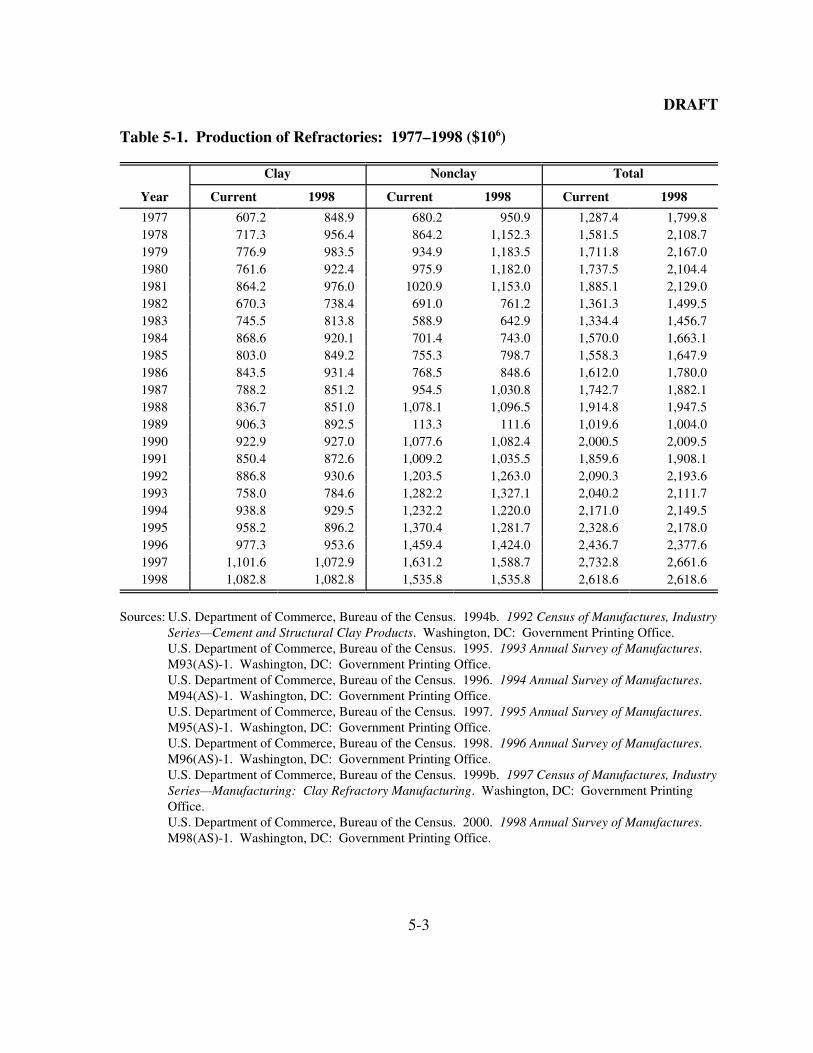
DRAFT
5-3
Table 5-1. Production of Refractories: 1977–1998 ($106)
Clay Nonclay Total
Year Current 1998 Current 1998 Current 1998
1977 607.2 848.9 680.2 950.9 1,287.4 1,799.81978 717.3 956.4 864.2 1,152.3 1,581.5 2,108.71979 776.9 983.5 934.9 1,183.5 1,711.8 2,167.01980 761.6 922.4 975.9 1,182.0 1,737.5 2,104.41981 864.2 976.0 1020.9 1,153.0 1,885.1 2,129.01982 670.3 738.4 691.0 761.2 1,361.3 1,499.51983 745.5 813.8 588.9 642.9 1,334.4 1,456.71984 868.6 920.1 701.4 743.0 1,570.0 1,663.11985 803.0 849.2 755.3 798.7 1,558.3 1,647.91986 843.5 931.4 768.5 848.6 1,612.0 1,780.01987 788.2 851.2 954.5 1,030.8 1,742.7 1,882.11988 836.7 851.0 1,078.1 1,096.5 1,914.8 1,947.51989 906.3 892.5 113.3 111.6 1,019.6 1,004.01990 922.9 927.0 1,077.6 1,082.4 2,000.5 2,009.51991 850.4 872.6 1,009.2 1,035.5 1,859.6 1,908.11992 886.8 930.6 1,203.5 1,263.0 2,090.3 2,193.61993 758.0 784.6 1,282.2 1,327.1 2,040.2 2,111.71994 938.8 929.5 1,232.2 1,220.0 2,171.0 2,149.51995 958.2 896.2 1,370.4 1,281.7 2,328.6 2,178.01996 977.3 953.6 1,459.4 1,424.0 2,436.7 2,377.61997 1,101.6 1,072.9 1,631.2 1,588.7 2,732.8 2,661.61998 1,082.8 1,082.8 1,535.8 1,535.8 2,618.6 2,618.6
Sources: U.S. Department of Commerce, Bureau of the Census. 1994b. 1992 Census of Manufactures, IndustrySeries—Cement and Structural Clay Products. Washington, DC: Government Printing Office.U.S. Department of Commerce, Bureau of the Census. 1995. 1993 Annual Survey of Manufactures. M93(AS)-1. Washington, DC: Government Printing Office.U.S. Department of Commerce, Bureau of the Census. 1996. 1994 Annual Survey of Manufactures. M94(AS)-1. Washington, DC: Government Printing Office.U.S. Department of Commerce, Bureau of the Census. 1997. 1995 Annual Survey of Manufactures. M95(AS)-1. Washington, DC: Government Printing Office.U.S. Department of Commerce, Bureau of the Census. 1998. 1996 Annual Survey of Manufactures. M96(AS)-1. Washington, DC: Government Printing Office.U.S. Department of Commerce, Bureau of the Census. 1999b. 1997 Census of Manufactures, IndustrySeries—Manufacturing: Clay Refractory Manufacturing. Washington, DC: Government PrintingOffice.U.S. Department of Commerce, Bureau of the Census. 2000. 1998 Annual Survey of Manufactures. M98(AS)-1. Washington, DC: Government Printing Office.
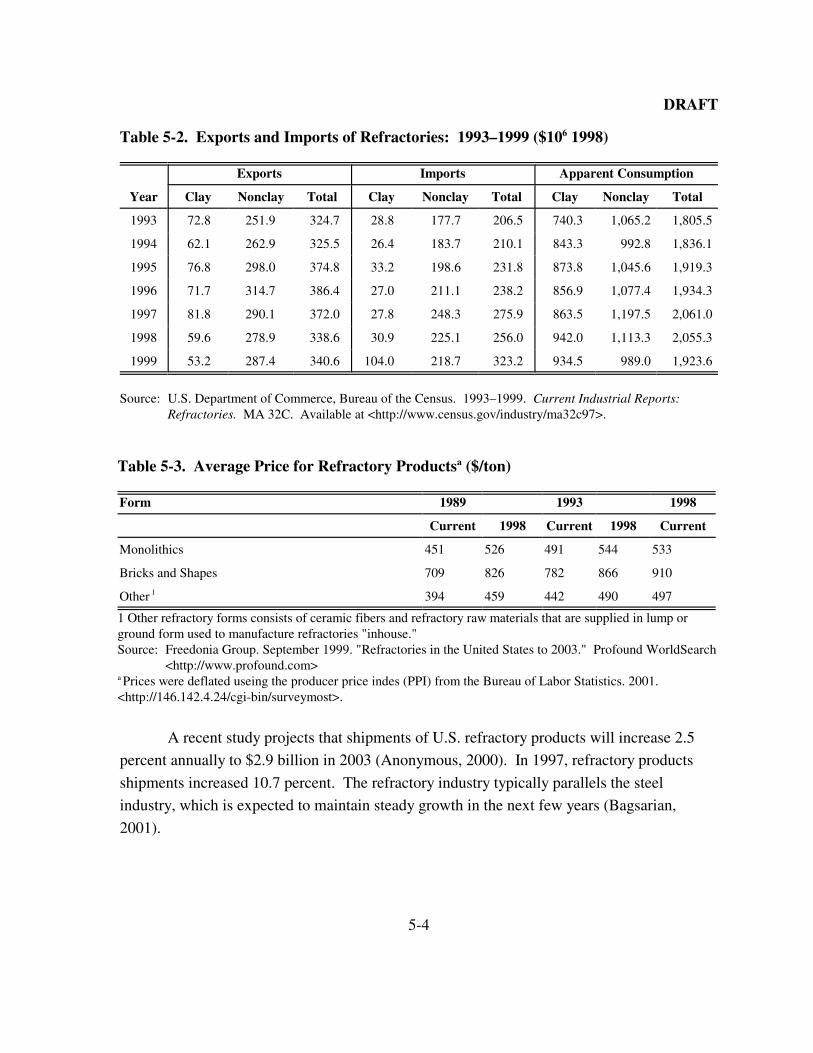
DRAFT
5-4
A recent study projects that shipments of U.S. refractory products will increase 2.5
percent annually to $2.9 billion in 2003 (Anonymous, 2000). In 1997, refractory products
shipments increased 10.7 percent. The refractory industry typically parallels the steel
industry, which is expected to maintain steady growth in the next few years (Bagsarian,
2001).
Table 5-2. Exports and Imports of Refractories: 1993–1999 ($106 1998)
Exports Imports Apparent Consumption
Year Clay Nonclay Total Clay Nonclay Total Clay Nonclay Total
1993 72.8 251.9 324.7 28.8 177.7 206.5 740.3 1,065.2 1,805.5
1994 62.1 262.9 325.5 26.4 183.7 210.1 843.3 992.8 1,836.1
1995 76.8 298.0 374.8 33.2 198.6 231.8 873.8 1,045.6 1,919.3
1996 71.7 314.7 386.4 27.0 211.1 238.2 856.9 1,077.4 1,934.3
1997 81.8 290.1 372.0 27.8 248.3 275.9 863.5 1,197.5 2,061.0
1998 59.6 278.9 338.6 30.9 225.1 256.0 942.0 1,113.3 2,055.3
1999 53.2 287.4 340.6 104.0 218.7 323.2 934.5 989.0 1,923.6
Source: U.S. Department of Commerce, Bureau of the Census. 1993–1999. Current Industrial Reports: Refractories. MA 32C. Available at <http://www.census.gov/industry/ma32c97>.
Table 5-3. Average Price for Refractory Productsa ($/ton)
Form 1989 1993 1998
Current 1998 Current 1998 Current
Monolithics 451 526 491 544 533
Bricks and Shapes 709 826 782 866 910
Other 1 394 459 442 490 497
1 Other refractory forms consists of ceramic fibers and refractory raw materials that are supplied in lump orground form used to manufacture refractories "inhouse."Source: Freedonia Group. September 1999. "Refractories in the United States to 2003." Profound WorldSearch
<http://www.profound.com>a Prices were deflated useing the producer price indes (PPI) from the Bureau of Labor Statistics. 2001.<http://146.142.4.24/cgi-bin/surveymost>.
DRAFT
R-1
REFERENCES
Anonymous. 2000. “U.S. Demand for Refractories to Reach $2.8 Billion through 2003.”
Ceramic Industry. Available at <http://www.ceramicindustry.com/ci/cda/
articleinformation/features/bnp_features_item/0,2710,8359,00.html>.
ASM International. 1987. Engineered Materials Handbook. Volume 4: Ceramics and
Glasses. Metals Park, OH: ASM International.
Bagsarian, Tom. January 2001. “Outlook 2001: Hitting Bottom in the First Quarter.” New
Steel Available at <http://www.newsteel.com/2001/0101f1.htm>.
DHAN. 1999. “Industry Report: Refractories Passing through Difficult Times.” Available
at <http://dhan.com/moneyline/991016-refract.html>.
Dun & Bradstreet. 2000. D&B Million Dollar Directory. Series 2000. Bethlehem, PA:
Dun & Bradstreet, Inc.
R.S. Means Company, Inc. 1997, 1998 Building Construction Cost Data. Kingston, MA:
R.S. Means Company, Inc.
Semler, Charles E. 2000. “More about Industry Changes.” Ceramic Industry. Available at
<http://proquest.umi.com/pdqweb?TS...Sid=1&Idx=21&Deli=1&RQT=
309&Dtp=1>.
Sheppard, Laural M.. 2000. “Trends in Refractories Technology: Highlights of the AcerS
Annual Meeting.” Refractories Applications.
The Technical Association of Refractories, Japan. 1998. Refractories Handbook. Tokyo:
The Technical Association of Refractories, Japan.
U.S. Department of Commerce, Bureau of Labor Statistics. 2001. Producer Price Index.
Available at <http://146.142.4.24/cgi-bin/surveymost>.
U.S. Department of Commerce, Bureau of the Census. 1993–1999. Current Industrial
Reports: Refractories. MA 32C. Available at <http://www.census.gov/
industry/ma32c97>.

DRAFT
R-2
U.S. Department of Commerce, Bureau of the Census. 1994a. 1992 Census of
Manufactures, Industry Series—Abrasive, Asbestos, and Miscellaneous Mineral
Products. Washington, DC: Government Printing Office.
U.S. Department of Commerce, Bureau of the Census. 1994b. 1992 Census of
Manufactures, Industry Series—Cement and Structural Clay Products. Washington,
DC: Government Printing Office.
U.S. Department of Commerce, Bureau of the Census. 1995. 1993 Annual Survey of
Manufactures. M93(AS)-1. Washington, DC: Government Printing Office.
U.S. Department of Commerce, Bureau of the Census. 1996a. 1994 Annual Survey of
Manufactures. M94(AS)-1. Washington, DC: Government Printing Office.
U.S. Department of Commerce, Bureau of the Census. 1996b. Concentration Ratios in
Manufacturing. MC92-S-2. Washington, DC: Government Printing Office.
Available at <http://www.census.gov/mcd/mancen/download/mc92cr.sum>.
U.S. Department of Commerce, Bureau of the Census. 1997. 1995 Annual Survey of
Manufactures. M95(AS)-1. Washington, DC: Government Printing Office.
U.S. Department of Commerce, Bureau of the Census. 1998. 1996 Annual Survey of
Manufactures. M96(AS)-1. Washington, DC: Government Printing Office.
U.S. Department of Commerce, Bureau of the Census. 1999a. 1997 Census of
Manufactures. Washington, DC: Government Printing Office.
U.S. Department of Commerce, Bureau of the Census. 1999b. 1997 Census of
Manufactures, Industry Series—Manufacturing: Clay Refractory Manufacturing.
Washington, DC: Government Printing Office.
U.S. Department of Commerce, Bureau of the Census. 1999c. 1997 Census of
Manufactures, Industry Series—Manufacturing: Nonclay Refractory Manufacturing.
Washington, DC: Government Printing Office.
U.S. Department of Commerce, Bureau of the Census. 1999d. 1998 Survey of Plant
Capacity. Washington, DC: Government Printing Office.
U.S. Department of Commerce, Bureau of the Census. 2000. 1998 Annual Survey of
Manufactures. M98(AS)-1. Washington, DC: Government Printing Office.
DRAFT
R-3
U.S. Department of Commerce, and International Trade Administration. 1999. U.S. Industry
& Trade Outlook 2000. New York: The McGraw-Hill Companies and U.S.
Department of Commerce.
U.S. Department of Justice and the Federal Trade Commission. Horizontal Merger
Guidelines. April 8, 1992. <http://www.ftc.gov/bc/docs/horizmer.htm>.
U.S. Environmental Protection Agency (EPA). 1994. AP-42, Fifth Edition, Volume I,
Chapter 11: Mineral Products Industry. Washington, DC: Government Printing
Office. Available at <http://www.epa.gov/ttn/chief/ap42/ch11>.
U.S. International Trade Commission (USITC). 1993. Industry & Trade Summary:
Refractory Ceramic Products. USITC Publication 2692. Washington, DC: U.S.
International Trade Commission.
U.S. International Trade Commission (USITC). 1994. Industry & Trade Summary:
Refractory Ceramic Products. USITC Publication 2692. Washington, DC: U.S.
International Trade Commission.
Virta, Robert L. 1998. Minerals Information: Clay and Shale. Reston, VA: U.S.
Department of the Interior, U.S. Geological Survey. Available at
<http://minerals.usgs.gov/minerals/pubs/commodity/clays>.
Top Related