


Languages
Pages
Legal

Dose enhancement in radiotherapy of small lung tumors1
using inline magnetic fields: A Monte Carlo based planning2
study3
B. M. Oborn1,2, Y. Ge3, N. Hardcastle4, P. E. Metcalfe2,5, P. J. Keall3,5.4
1Illawarra Cancer Care Centre (ICCC), Wollongong, NSW 2500, Australia.5
2Centre for Medical Radiation Physics (CMRP), University of Wollongong, Wollongong, NSW 2500, Australia.6
3Sydney Medical School, University of Sydney, NSW 2006, Australia.7
4Northern Sydney Cancer Centre, Royal North Shore Hospital, Sydney, NSW 2065, Australia.8
5Ingham Institute for Applied Medical Research, Liverpool, NSW, 2170, Australia.9
Abstract10
Purpose: To report on significant dose enhancement effects caused by magnetic fields aligned parallel to 6MV11
photon beam radiotherapy of small lung tumors. Findings are applicable to future inline MRI-guided radiotherapy12
systems.13
Methods: A total of 8 clinical lung tumor cases were recalculated using Monte Carlo methods, and external14
magnetic fields of 0.5 T, 1.0 T and 3 T were included to observe the impact on dose to the planning target volume15
(PTV) and gross tumor volume (GTV). Three plans were 6MV 3D-CRT plans while 6 were 6MV IMRT. The16
GTV’s ranged from 0.8 cc to 16 cc, while the PTV’s ranged from 1 cc to 59 cc. In addition, the dose changes in a17
30 cm diameter cylindrical water phantom were investigated for small beams. The central 20 cm of this phantom18
contained either water or lung density insert.19
Results: For single beams an inline magnetic field of 1 T has a small impact in lung dose distributions by20
reducing the lateral scatter of secondary electrons, resulting in a small dose increase along the beam. Superposition21
of multiple small beams leads to significant dose enhancements. Clinically, this process occurs in the lung tissue22
typically surrounding the GTV, resulting in increases to the D98% (PTV). Two isolated tumors with very small23
PTVs (3 cc and 6 cc) showed increases in D98% of 23% and 22%. Larger PTVs of 13 cc, 26 cc and 59 cc had24
increases of 9%, 6% and 4%, describing a natural fall-off in enhancement with increasing PTV size. However three25
PTVs bounded to the lung wall showed no significant increase, due to lack of dose enhancement in the denser PTV26
volume. In general, at 0.5 T the GTV mean dose enhancement is around 60% lower than that at 1 T, while at 327
T it is 5-60% higher than 1 T.28
Conclusions: Monte Carlo methods have described significant and predictable dose enhancement effects in29
small lung tumor plans for 6MV radiotherapy when an external inline magnetic field is included. Results of this30
study indicate that future clinical inline MRI-guided radiotherapy systems will be able to deliver a dosimetrically31
superior treatment to small (PTV < 15 cc), isolated lung tumors over non MRI-linac systems. This increased32
efficacy coincides with the reimbursement in the United States of lung CT screening and the likely rapid growth in33
the number of patients with small lung tumors to be treated with radiotherapy.34
I. INTRODUCTION35
With the reimbursement in the US for lung cancer screening, a large number of small lung tumors are likely to be36
detected that will need accurate, non-invasive treatment [1]. Due to the complexities of such treatments, patients would37
benefit from real-time MRI-guided radiotherapy. In recent times protoype MRI-linac systems have been developed for38
the intended purpose of providing real-time MRI-guided radiotherapy. These prototypes include the UMC Utrecht39
design[2] and the Alberta system[3]. Under construction is also the Australian based design[4]. These systems aim to40
offer unrivalled real-time image guidance with corresponding conformal radiotherapy treatment. The ultimate goal of41
this process is reduced dose to healthy tissue while better coverage of the tumor - in esssence a more efficient form of42
radiotherapy. The patient however will be exposed to the strong magnetic field of the MRI system and the radiotherapy43
1
treatment is subject to various dose perturbation effects. In a perpendicular magnetic field system, such as the 1.544
T UMC design, or the 0.56 T perpendicular orientation of the bi-directional Alberta design, the dose perturbation45
effects are primarily linked to the electron-return-effect (ERE)[5]. In particular these include interface, entry and exit46
dose changes[6, 7, 8, 9] and dose perturbation in breast treatments[10, 11, 12]. There have also been various effects47
studied in IMRT planning in the presence of perpendicular magnetic fields[13, 14, 15, 16]. For an inline MRI-linac48
system, such as the inline orientation of the 0.56 T Alberta system, or the inline orientation of the split-bore 1 T49
Australian design under construction, the dose perturbation effects are mostly limited to entry dose changes due to50
electron contamination being focused by the MRI field[17, 18, 19].51
In the 2010 work by Kirkby[20] however, it was first discussed that a potential increase in the dose to the PTV52
could be obtained in the inline orientation for lung radiotherapy plans. In this study one non-clinical lung plan was53
investigated, a 5-field 3D-CRT 6MV plan in which the PTV volume appeared to be approximately 60 cc. There was54
clear strong and local dose changes around the PTV, and around a 10% mean dose increase at 1.5 T (see fig 10(a)).55
To the best of our knowledge this is the only research focusing on a lung plan exposed to strong inline magnetic fields.56
It is therefore apparent that there is a clear void in the current literature regarding characterisation of the effects57
of inline magnetic fields on realistic clinical lung plans. We do note however a long history of studing the effects58
of magnetic fields on changing the dose distrubtions surrounding air-tissue interfaces. For example there has been59
many theoretically and experimental studies on this topic for both electron and photon beams over the period from60
1950-2006[21, 22, 23, 24, 25, 26, 27, 28, 29] [30, 31, 32, 33, 34] [35, 36, 37, 38, 39, 40] [41, 42, 43, 44, 45, 46]. In addition61
there are also patents on magnetic field devices to provide dose enhancement effects[47, 48, 49]. The success of this62
work is unclear, as to the best of our knowledge, no clinical system appear to utilize any magnetic field devices for63
dose enhancement at present.64
In this work we characterize, using Monte Carlo techniques, the dose enhancement effects of inline magnetic fields65
on a range of clinical lung plans. The key dose enhancement reported is the minimum dose to 98% of the PTV, i.e.66
D98%, as per the ICRU report 83[50]. We aim to show a connection to the size, location and composition of the PTV67
with respect to the dose enhancement effects. For this work, we define a small lung tumor as one with a PTV of <1568
cc in size. This equates to a sphere of diameter 3.06 cm. At these field sizes or smaller the effects of lateral electronic69
charged particle disequilibrium start to become significant, particularly in lower density lung. It is therefore natural70
to expect significant local dose changes to be induced by strong inline magnetic fields for these small lung tumors as71
they act to minimize lateral electron scatter.72
The results of this study will be directly related to the predicted performance inside an inline orientation MRI-73
linac system, where there is a uniform magnetic field surrounding the patient which is always aligned with the beam74
direction. It is further envisaged that the dose enhancement effects will be in addition to the inherent improvements75
offered by MRI guidance for small lung tumor such as improved tumor delineation and tracking over the course of76
radiotherapy.77
II. MATERIALS AND METHODS78
A. Dose to a generic cylindrical phantom79
A 30 cm diameter, 30 cm long cylindrical phantom was modelled to gauge the purest changes that occur between80
lung and water when exposed to inline magnetic fields. This 30 cm diameter cylinder was composed of water with a81
central 20 cm diameter insert, which was modelled as being either water (1 g/cc) or water at lung density (0.27 g/cc)82
(see figure 1). For this set of simulations, 6MV square beams were incident with an isocentre that corresponded to83
2
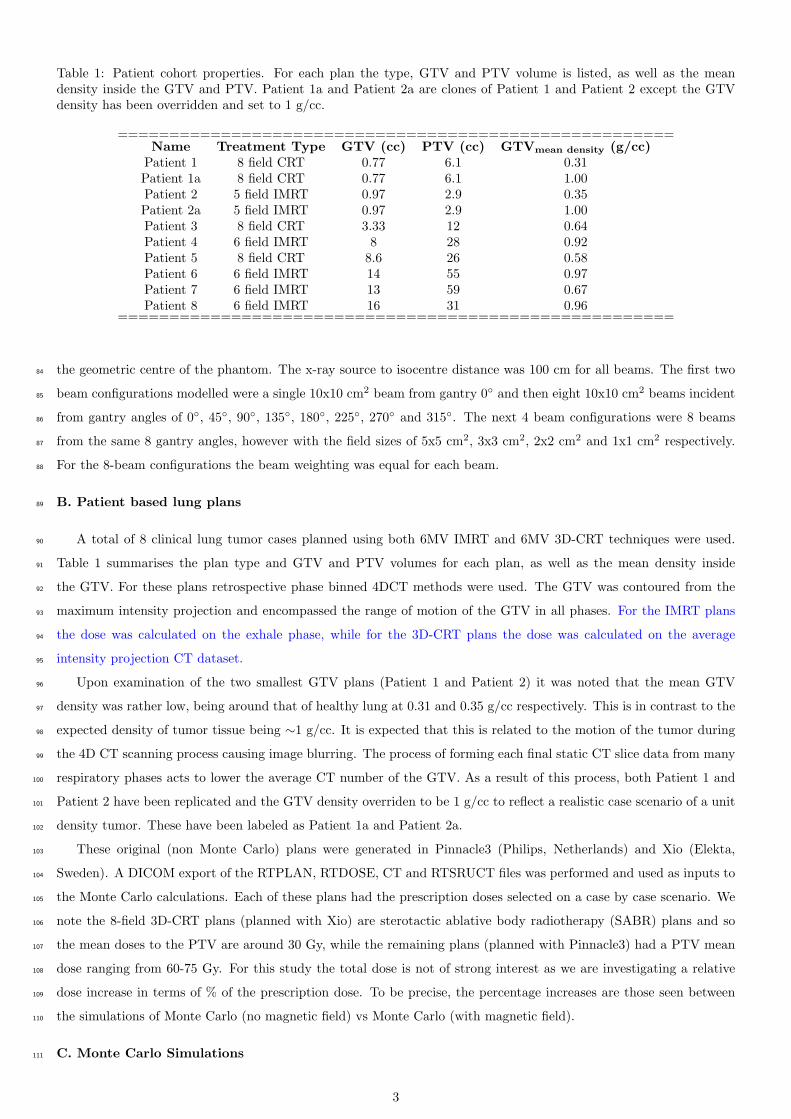
Table 1: Patient cohort properties. For each plan the type, GTV and PTV volume is listed, as well as the meandensity inside the GTV and PTV. Patient 1a and Patient 2a are clones of Patient 1 and Patient 2 except the GTVdensity has been overridden and set to 1 g/cc.
======================================================Name Treatment Type GTV (cc) PTV (cc) GTVmean density (g/cc)
Patient 1 8 field CRT 0.77 6.1 0.31Patient 1a 8 field CRT 0.77 6.1 1.00Patient 2 5 field IMRT 0.97 2.9 0.35Patient 2a 5 field IMRT 0.97 2.9 1.00Patient 3 8 field CRT 3.33 12 0.64Patient 4 6 field IMRT 8 28 0.92Patient 5 8 field CRT 8.6 26 0.58Patient 6 6 field IMRT 14 55 0.97Patient 7 6 field IMRT 13 59 0.67Patient 8 6 field IMRT 16 31 0.96
======================================================
the geometric centre of the phantom. The x-ray source to isocentre distance was 100 cm for all beams. The first two84
beam configurations modelled were a single 10x10 cm2 beam from gantry 0◦ and then eight 10x10 cm2 beams incident85
from gantry angles of 0◦, 45◦, 90◦, 135◦, 180◦, 225◦, 270◦ and 315◦. The next 4 beam configurations were 8 beams86
from the same 8 gantry angles, however with the field sizes of 5x5 cm2, 3x3 cm2, 2x2 cm2 and 1x1 cm2 respectively.87
For the 8-beam configurations the beam weighting was equal for each beam.88
B. Patient based lung plans89
A total of 8 clinical lung tumor cases planned using both 6MV IMRT and 6MV 3D-CRT techniques were used.90
Table 1 summarises the plan type and GTV and PTV volumes for each plan, as well as the mean density inside91
the GTV. For these plans retrospective phase binned 4DCT methods were used. The GTV was contoured from the92
maximum intensity projection and encompassed the range of motion of the GTV in all phases. For the IMRT plans93
the dose was calculated on the exhale phase, while for the 3D-CRT plans the dose was calculated on the average94
intensity projection CT dataset.95
Upon examination of the two smallest GTV plans (Patient 1 and Patient 2) it was noted that the mean GTV96
density was rather low, being around that of healthy lung at 0.31 and 0.35 g/cc respectively. This is in contrast to the97
expected density of tumor tissue being ∼1 g/cc. It is expected that this is related to the motion of the tumor during98
the 4D CT scanning process causing image blurring. The process of forming each final static CT slice data from many99
respiratory phases acts to lower the average CT number of the GTV. As a result of this process, both Patient 1 and100
Patient 2 have been replicated and the GTV density overriden to be 1 g/cc to reflect a realistic case scenario of a unit101
density tumor. These have been labeled as Patient 1a and Patient 2a.102
These original (non Monte Carlo) plans were generated in Pinnacle3 (Philips, Netherlands) and Xio (Elekta,103
Sweden). A DICOM export of the RTPLAN, RTDOSE, CT and RTSRUCT files was performed and used as inputs to104
the Monte Carlo calculations. Each of these plans had the prescription doses selected on a case by case scenario. We105
note the 8-field 3D-CRT plans (planned with Xio) are sterotactic ablative body radiotherapy (SABR) plans and so106
the mean doses to the PTV are around 30 Gy, while the remaining plans (planned with Pinnacle3) had a PTV mean107
dose ranging from 60-75 Gy. For this study the total dose is not of strong interest as we are investigating a relative108
dose increase in terms of % of the prescription dose. To be precise, the percentage increases are those seen between109
the simulations of Monte Carlo (no magnetic field) vs Monte Carlo (with magnetic field).110
C. Monte Carlo Simulations111
3
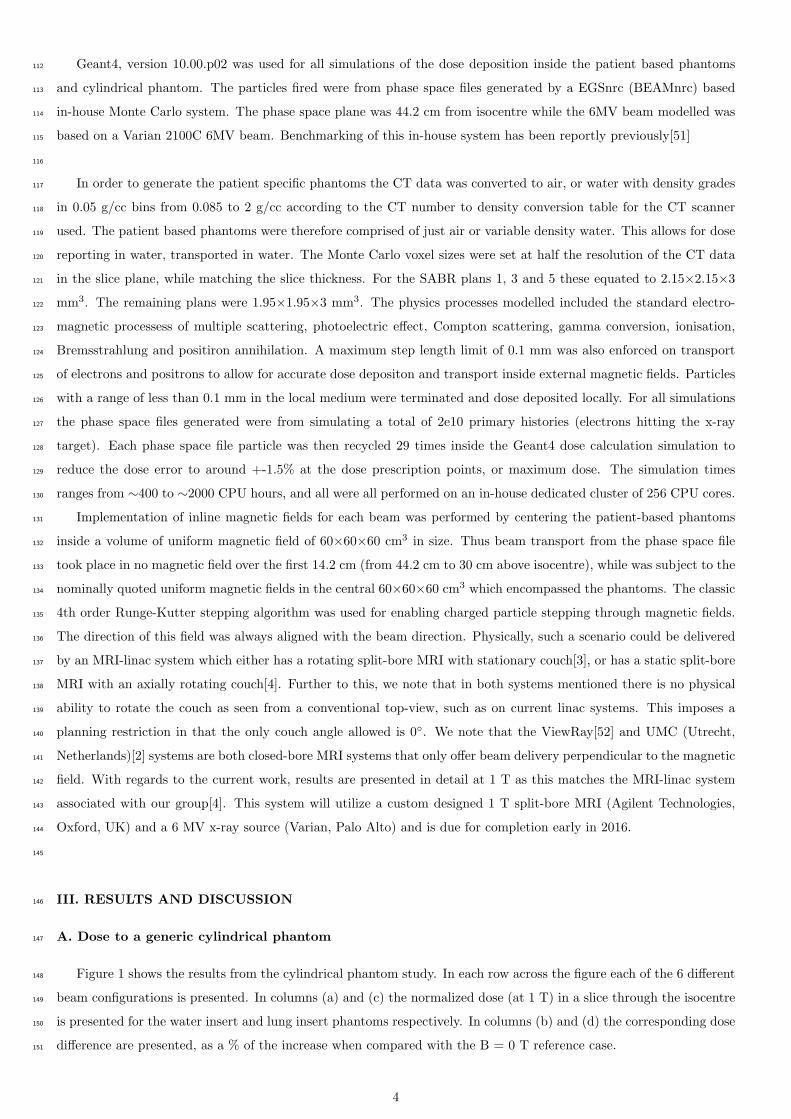
Geant4, version 10.00.p02 was used for all simulations of the dose deposition inside the patient based phantoms112
and cylindrical phantom. The particles fired were from phase space files generated by a EGSnrc (BEAMnrc) based113
in-house Monte Carlo system. The phase space plane was 44.2 cm from isocentre while the 6MV beam modelled was114
based on a Varian 2100C 6MV beam. Benchmarking of this in-house system has been reportly previously[51]115
116
In order to generate the patient specific phantoms the CT data was converted to air, or water with density grades117
in 0.05 g/cc bins from 0.085 to 2 g/cc according to the CT number to density conversion table for the CT scanner118
used. The patient based phantoms were therefore comprised of just air or variable density water. This allows for dose119
reporting in water, transported in water. The Monte Carlo voxel sizes were set at half the resolution of the CT data120
in the slice plane, while matching the slice thickness. For the SABR plans 1, 3 and 5 these equated to 2.15×2.15×3121
mm3. The remaining plans were 1.95×1.95×3 mm3. The physics processes modelled included the standard electro-122
magnetic processess of multiple scattering, photoelectric effect, Compton scattering, gamma conversion, ionisation,123
Bremsstrahlung and positiron annihilation. A maximum step length limit of 0.1 mm was also enforced on transport124
of electrons and positrons to allow for accurate dose depositon and transport inside external magnetic fields. Particles125
with a range of less than 0.1 mm in the local medium were terminated and dose deposited locally. For all simulations126
the phase space files generated were from simulating a total of 2e10 primary histories (electrons hitting the x-ray127
target). Each phase space file particle was then recycled 29 times inside the Geant4 dose calculation simulation to128
reduce the dose error to around +-1.5% at the dose prescription points, or maximum dose. The simulation times129
ranges from ∼400 to ∼2000 CPU hours, and all were all performed on an in-house dedicated cluster of 256 CPU cores.130
Implementation of inline magnetic fields for each beam was performed by centering the patient-based phantoms131
inside a volume of uniform magnetic field of 60×60×60 cm3 in size. Thus beam transport from the phase space file132
took place in no magnetic field over the first 14.2 cm (from 44.2 cm to 30 cm above isocentre), while was subject to the133
nominally quoted uniform magnetic fields in the central 60×60×60 cm3 which encompassed the phantoms. The classic134
4th order Runge-Kutter stepping algorithm was used for enabling charged particle stepping through magnetic fields.135
The direction of this field was always aligned with the beam direction. Physically, such a scenario could be delivered136
by an MRI-linac system which either has a rotating split-bore MRI with stationary couch[3], or has a static split-bore137
MRI with an axially rotating couch[4]. Further to this, we note that in both systems mentioned there is no physical138
ability to rotate the couch as seen from a conventional top-view, such as on current linac systems. This imposes a139
planning restriction in that the only couch angle allowed is 0◦. We note that the ViewRay[52] and UMC (Utrecht,140
Netherlands)[2] systems are both closed-bore MRI systems that only offer beam delivery perpendicular to the magnetic141
field. With regards to the current work, results are presented in detail at 1 T as this matches the MRI-linac system142
associated with our group[4]. This system will utilize a custom designed 1 T split-bore MRI (Agilent Technologies,143
Oxford, UK) and a 6 MV x-ray source (Varian, Palo Alto) and is due for completion early in 2016.144
145
III. RESULTS AND DISCUSSION146
A. Dose to a generic cylindrical phantom147
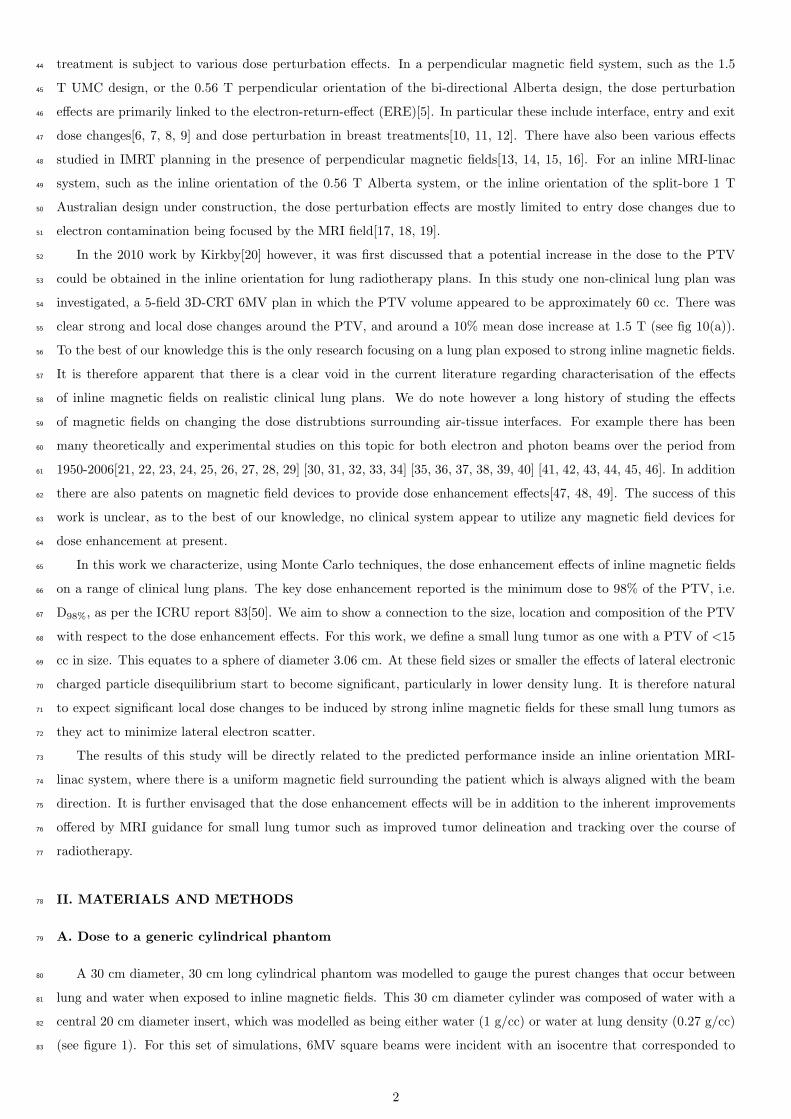
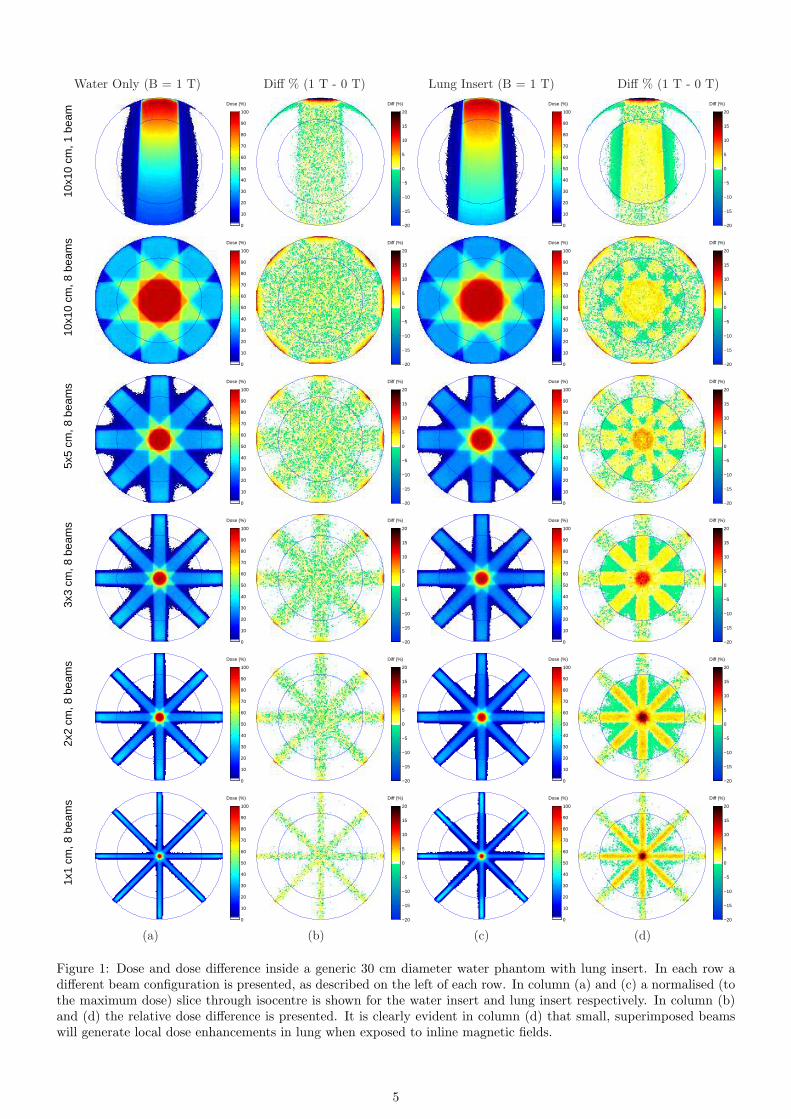
Figure 1 shows the results from the cylindrical phantom study. In each row across the figure each of the 6 different148
beam configurations is presented. In columns (a) and (c) the normalized dose (at 1 T) in a slice through the isocentre149
is presented for the water insert and lung insert phantoms respectively. In columns (b) and (d) the corresponding dose150
difference are presented, as a % of the increase when compared with the B = 0 T reference case.151
4
Water Only (B = 1 T) Diff % (1 T - 0 T) Lung Insert (B = 1 T) Diff % (1 T - 0 T)
10x1
0 cm
, 1 b
eam
Dose (%)
0
10
20
30
40
50
60
70
80
90
100
Diff (%)
−20
−15
−10
−5
0
5
10
15
20
Dose (%)
0
10
20
30
40
50
60
70
80
90
100
Diff (%)
−20
−15
−10
−5
0
5
10
15
20
10x1
0 cm
, 8 b
eam
s Dose (%)
0
10
20
30
40
50
60
70
80
90
100
Diff (%)
−20
−15
−10
−5
0
5
10
15
20
Dose (%)
0
10
20
30
40
50
60
70
80
90
100
Diff (%)
−20
−15
−10
−5
0
5
10
15
20
5x5
cm
, 8 b
eam
s Dose (%)
0
10
20
30
40
50
60
70
80
90
100
Diff (%)
−20
−15
−10
−5
0
5
10
15
20
Dose (%)
0
10
20
30
40
50
60
70
80
90
100
Diff (%)
−20
−15
−10
−5
0
5
10
15
20
3x3
cm
, 8 b
eam
s Dose (%)
0
10
20
30
40
50
60
70
80
90
100
Diff (%)
−20
−15
−10
−5
0
5
10
15
20
Dose (%)
0
10
20
30
40
50
60
70
80
90
100
Diff (%)
−20
−15
−10
−5
0
5
10
15
20
2x2
cm
, 8 b
eam
s Dose (%)
0
10
20
30
40
50
60
70
80
90
100
Diff (%)
−20
−15
−10
−5
0
5
10
15
20
Dose (%)
0
10
20
30
40
50
60
70
80
90
100
Diff (%)
−20
−15
−10
−5
0
5
10
15
20
1x1
cm
, 8 b
eam
s Dose (%)
0
10
20
30
40
50
60
70
80
90
100
Diff (%)
−20
−15
−10
−5
0
5
10
15
20
Dose (%)
0
10
20
30
40
50
60
70
80
90
100
Diff (%)
−20
−15
−10
−5
0
5
10
15
20
(a) (b) (c) (d)
Figure 1: Dose and dose difference inside a generic 30 cm diameter water phantom with lung insert. In each row adifferent beam configuration is presented, as described on the left of each row. In column (a) and (c) a normalised (tothe maximum dose) slice through isocentre is shown for the water insert and lung insert respectively. In column (b)and (d) the relative dose difference is presented. It is clearly evident in column (d) that small, superimposed beamswill generate local dose enhancements in lung when exposed to inline magnetic fields.
5
For the first case, a single 10x10 cm2 beam, there is no significant dose changes in the bulk of the water insert while152
the well documented changes occur within the lung insert. We do note however the mild increases in surface doses due153
to magnetic focusing of the electron contamination incident upon the phantom. This process is well documented in the154
literature[17, 18, 19], and final estimations of the increases expected will be machine specific. The core element of the155
changes throughout the bulk of the phantom with the lung insert is however caused by a condensing, and subsequent156
minor intensity increase, of the secondary electron kernel in the forward direction. For a broad, 10x10 cm2 beam this157
equates to a small local dose increase throughout the bulk of the beam volume, coupled with a reduced out-of-field158
dose. We note in the literature a 2.7% CAX dose increase in a 6MV pencil beam in lung at 1.5 T inline magnetic159
field [20](see fig2(c)). As we go to the second row, 8 equispaced beams at 10x10 cm2, we still see no significant change160
in the water insert, however in the lung case there is superpositon of the dose increase and dose decrease regions.161
Overall, the dose to the common volume that all 8-beams cross is somewhat further enhanced, however marginally162
stronger around the edges of this volume. As we go to 8 beams at 5x5 cm2, the trend continues and strengthens in the163
lung insert. A clear volume exists with around 5% local dose enhancement where all the beams cross. This process164
continues to strengthen as we reduce the field size even further to 3x3 cm2, 2x2 cm2 and 1x1 cm2, as shown in the165
remaining rows of fig 1. At 1x1 cm2 we see in excess of 30% local dose enhancement. In the water insert however166
there is still no significant dose enhancement even for the smallest field sizes. In essence it could be expected that167
any dose enhancement seen in real patient cases could follow the trend seen here with the lung insert phantom if the168
GTV being irradiated is close to lung density. In reality lung tumor treatment volumes, i.e. the GTV and PTV, will169
be comprised of some combination of dense GTV tissue and surrounding often lower density PTV (i.e. lung) medium.170
Hence, based on the results of this section of work, one could expect to see a broad range in dose enhancement to171
clinical lung tumors.172
B. Patient plans173
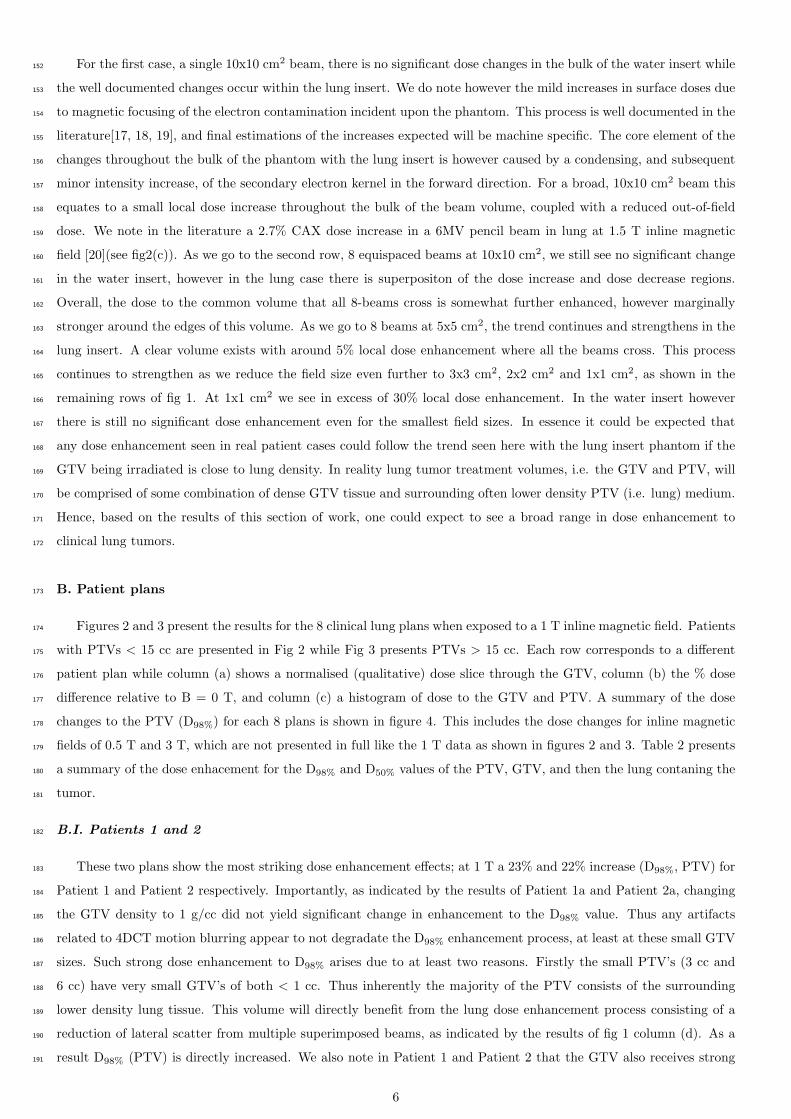
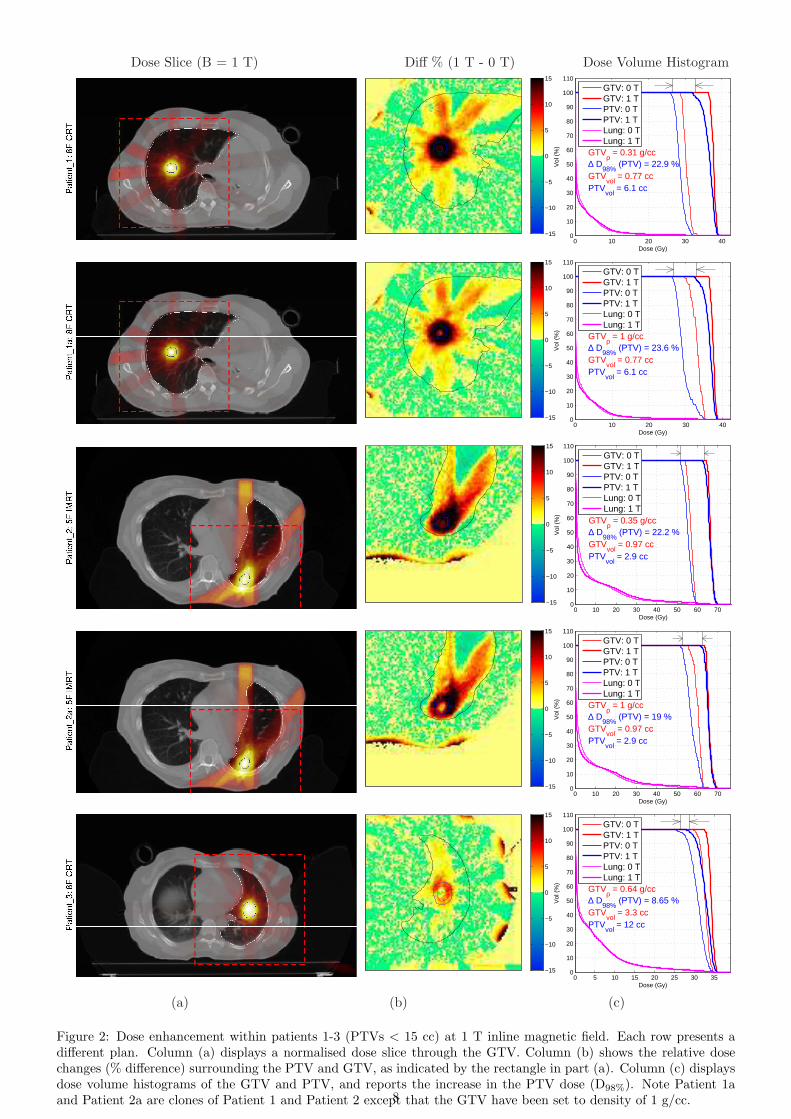
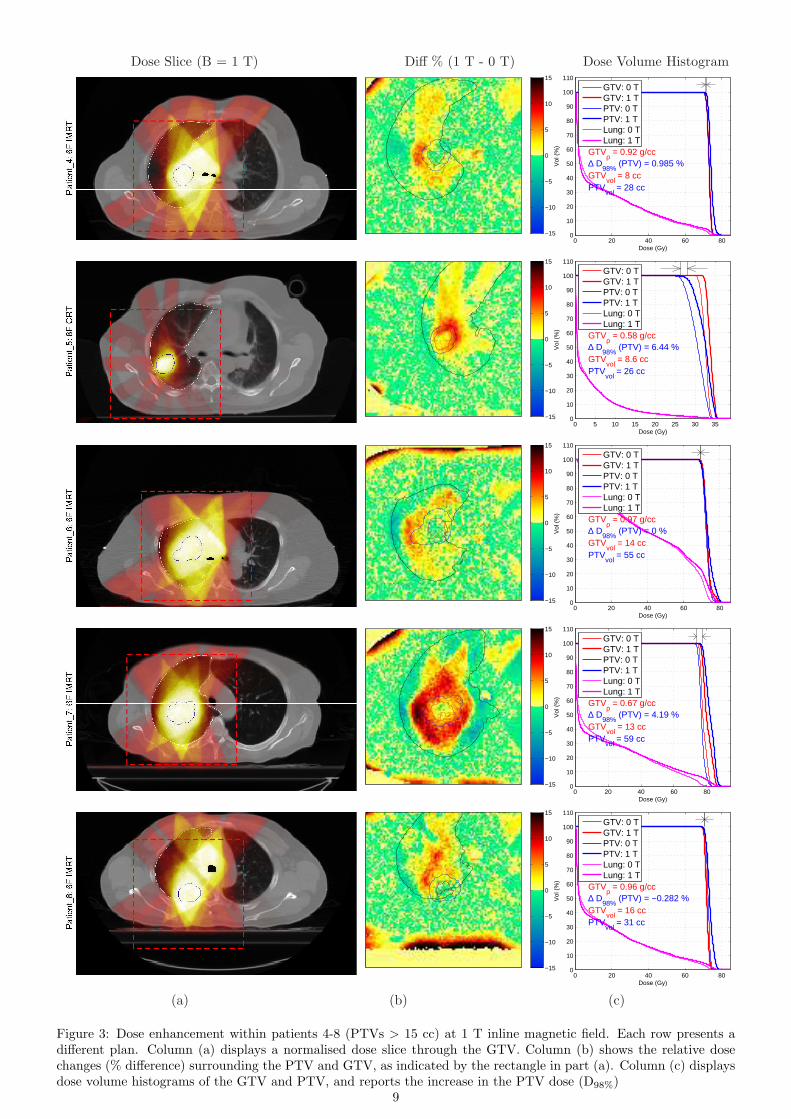
Figures 2 and 3 present the results for the 8 clinical lung plans when exposed to a 1 T inline magnetic field. Patients174
with PTVs < 15 cc are presented in Fig 2 while Fig 3 presents PTVs > 15 cc. Each row corresponds to a different175
patient plan while column (a) shows a normalised (qualitative) dose slice through the GTV, column (b) the % dose176
difference relative to B = 0 T, and column (c) a histogram of dose to the GTV and PTV. A summary of the dose177
changes to the PTV (D98%) for each 8 plans is shown in figure 4. This includes the dose changes for inline magnetic178
fields of 0.5 T and 3 T, which are not presented in full like the 1 T data as shown in figures 2 and 3. Table 2 presents179
a summary of the dose enhacement for the D98% and D50% values of the PTV, GTV, and then the lung contaning the180
tumor.181
B.I. Patients 1 and 2182
These two plans show the most striking dose enhancement effects; at 1 T a 23% and 22% increase (D98%, PTV) for183
Patient 1 and Patient 2 respectively. Importantly, as indicated by the results of Patient 1a and Patient 2a, changing184
the GTV density to 1 g/cc did not yield significant change in enhancement to the D98% value. Thus any artifacts185
related to 4DCT motion blurring appear to not degradate the D98% enhancement process, at least at these small GTV186
sizes. Such strong dose enhancement to D98% arises due to at least two reasons. Firstly the small PTV’s (3 cc and187
6 cc) have very small GTV’s of both < 1 cc. Thus inherently the majority of the PTV consists of the surrounding188
lower density lung tissue. This volume will directly benefit from the lung dose enhancement process consisting of a189
reduction of lateral scatter from multiple superimposed beams, as indicated by the results of fig 1 column (d). As a190
result D98% (PTV) is directly increased. We also note in Patient 1 and Patient 2 that the GTV also receives strong191
6
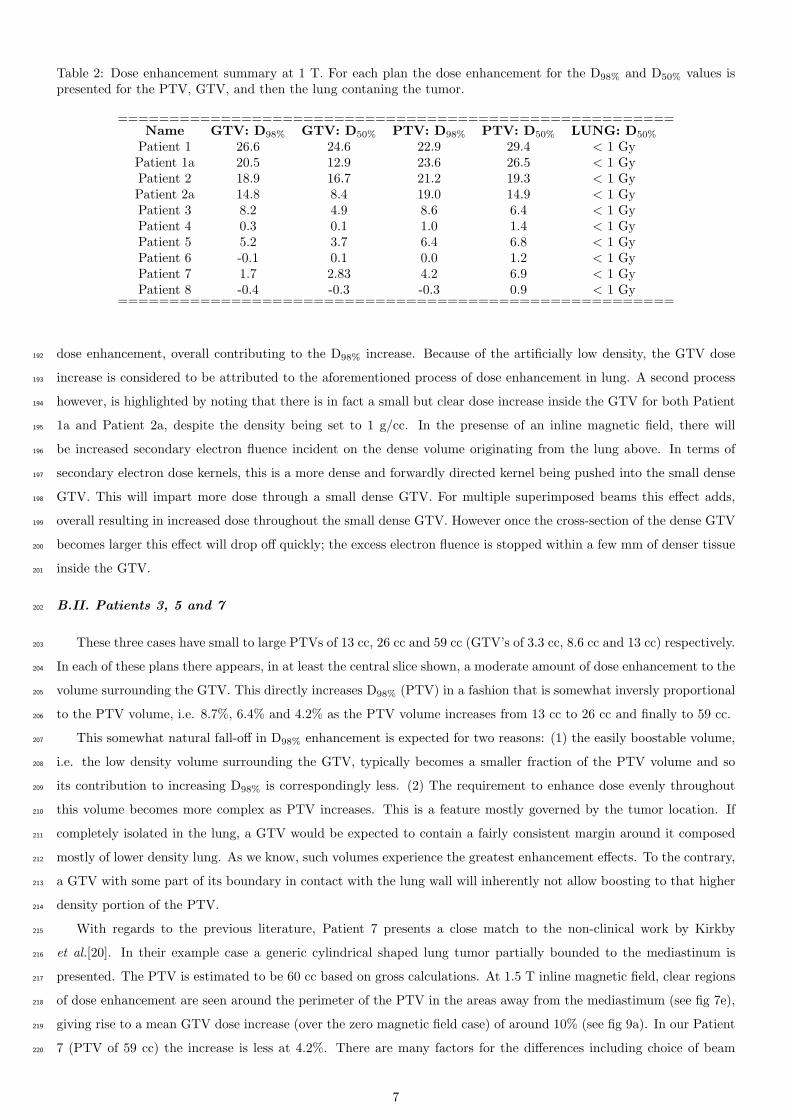
Table 2: Dose enhancement summary at 1 T. For each plan the dose enhancement for the D98% and D50% values ispresented for the PTV, GTV, and then the lung contaning the tumor.
======================================================Name GTV: D98% GTV: D50% PTV: D98% PTV: D50% LUNG: D50%
Patient 1 26.6 24.6 22.9 29.4 < 1 GyPatient 1a 20.5 12.9 23.6 26.5 < 1 GyPatient 2 18.9 16.7 21.2 19.3 < 1 GyPatient 2a 14.8 8.4 19.0 14.9 < 1 GyPatient 3 8.2 4.9 8.6 6.4 < 1 GyPatient 4 0.3 0.1 1.0 1.4 < 1 GyPatient 5 5.2 3.7 6.4 6.8 < 1 GyPatient 6 -0.1 0.1 0.0 1.2 < 1 GyPatient 7 1.7 2.83 4.2 6.9 < 1 GyPatient 8 -0.4 -0.3 -0.3 0.9 < 1 Gy
======================================================
dose enhancement, overall contributing to the D98% increase. Because of the artificially low density, the GTV dose192
increase is considered to be attributed to the aforementioned process of dose enhancement in lung. A second process193
however, is highlighted by noting that there is in fact a small but clear dose increase inside the GTV for both Patient194
1a and Patient 2a, despite the density being set to 1 g/cc. In the presense of an inline magnetic field, there will195
be increased secondary electron fluence incident on the dense volume originating from the lung above. In terms of196
secondary electron dose kernels, this is a more dense and forwardly directed kernel being pushed into the small dense197
GTV. This will impart more dose through a small dense GTV. For multiple superimposed beams this effect adds,198
overall resulting in increased dose throughout the small dense GTV. However once the cross-section of the dense GTV199
becomes larger this effect will drop off quickly; the excess electron fluence is stopped within a few mm of denser tissue200
inside the GTV.201
B.II. Patients 3, 5 and 7202
These three cases have small to large PTVs of 13 cc, 26 cc and 59 cc (GTV’s of 3.3 cc, 8.6 cc and 13 cc) respectively.203
In each of these plans there appears, in at least the central slice shown, a moderate amount of dose enhancement to the204
volume surrounding the GTV. This directly increases D98% (PTV) in a fashion that is somewhat inversly proportional205
to the PTV volume, i.e. 8.7%, 6.4% and 4.2% as the PTV volume increases from 13 cc to 26 cc and finally to 59 cc.206
This somewhat natural fall-off in D98% enhancement is expected for two reasons: (1) the easily boostable volume,207
i.e. the low density volume surrounding the GTV, typically becomes a smaller fraction of the PTV volume and so208
its contribution to increasing D98% is correspondingly less. (2) The requirement to enhance dose evenly throughout209
this volume becomes more complex as PTV increases. This is a feature mostly governed by the tumor location. If210
completely isolated in the lung, a GTV would be expected to contain a fairly consistent margin around it composed211
mostly of lower density lung. As we know, such volumes experience the greatest enhancement effects. To the contrary,212
a GTV with some part of its boundary in contact with the lung wall will inherently not allow boosting to that higher213
density portion of the PTV.214
With regards to the previous literature, Patient 7 presents a close match to the non-clinical work by Kirkby215
et al.[20]. In their example case a generic cylindrical shaped lung tumor partially bounded to the mediastinum is216
presented. The PTV is estimated to be 60 cc based on gross calculations. At 1.5 T inline magnetic field, clear regions217
of dose enhancement are seen around the perimeter of the PTV in the areas away from the mediastimum (see fig 7e),218
giving rise to a mean GTV dose increase (over the zero magnetic field case) of around 10% (see fig 9a). In our Patient219
7 (PTV of 59 cc) the increase is less at 4.2%. There are many factors for the differences including choice of beam220
7
Dose Slice (B = 1 T) Diff % (1 T - 0 T) Dose Volume Histogram
0 10 20 30 400
10
20
30
40
50
60
70
80
90
100
110
Dose (Gy)
Vol
(%
)
−15
−10
−5
0
5
10
15
GTV: 0 TGTV: 1 TPTV: 0 TPTV: 1 TLung: 0 TLung: 1 T
GTVρ = 0.31 g/cc∆ D
98% (PTV) = 22.9 %
GTVvol
= 0.77 ccPTV
vol = 6.1 cc
0 10 20 30 400
10
20
30
40
50
60
70
80
90
100
110
Dose (Gy)
Vol
(%
)
−15
−10
−5
0
5
10
15
GTV: 0 TGTV: 1 TPTV: 0 TPTV: 1 TLung: 0 TLung: 1 T
GTVρ = 1 g/cc∆ D
98% (PTV) = 23.6 %
GTVvol
= 0.77 ccPTV
vol = 6.1 cc
0 10 20 30 40 50 60 700
10
20
30
40
50
60
70
80
90
100
110
Dose (Gy)
Vol
(%
)
−15
−10
−5
0
5
10
15
GTV: 0 TGTV: 1 TPTV: 0 TPTV: 1 TLung: 0 TLung: 1 T
GTVρ = 0.35 g/cc∆ D
98% (PTV) = 22.2 %
GTVvol
= 0.97 ccPTV
vol = 2.9 cc
0 10 20 30 40 50 60 700
10
20
30
40
50
60
70
80
90
100
110
Dose (Gy)
Vol
(%
)
−15
−10
−5
0
5
10
15
GTV: 0 TGTV: 1 TPTV: 0 TPTV: 1 TLung: 0 TLung: 1 T
GTVρ = 1 g/cc∆ D
98% (PTV) = 19 %
GTVvol
= 0.97 ccPTV
vol = 2.9 cc
0 5 10 15 20 25 30 350
10
20
30
40
50
60
70
80
90
100
110
Dose (Gy)
Vol
(%
)
−15
−10
−5
0
5
10
15
GTV: 0 TGTV: 1 TPTV: 0 TPTV: 1 TLung: 0 TLung: 1 T
GTVρ = 0.64 g/cc∆ D
98% (PTV) = 8.65 %
GTVvol
= 3.3 ccPTV
vol = 12 cc
(a) (b) (c)
Figure 2: Dose enhancement within patients 1-3 (PTVs < 15 cc) at 1 T inline magnetic field. Each row presents adifferent plan. Column (a) displays a normalised dose slice through the GTV. Column (b) shows the relative dosechanges (% difference) surrounding the PTV and GTV, as indicated by the rectangle in part (a). Column (c) displaysdose volume histograms of the GTV and PTV, and reports the increase in the PTV dose (D98%). Note Patient 1aand Patient 2a are clones of Patient 1 and Patient 2 except that the GTV have been set to density of 1 g/cc.8
Dose Slice (B = 1 T) Diff % (1 T - 0 T) Dose Volume Histogram
0 20 40 60 800
10
20
30
40
50
60
70
80
90
100
110
Dose (Gy)
Vol
(%
)
−15
−10
−5
0
5
10
15
GTV: 0 TGTV: 1 TPTV: 0 TPTV: 1 TLung: 0 TLung: 1 T
GTVρ = 0.92 g/cc∆ D
98% (PTV) = 0.985 %
GTVvol
= 8 ccPTV
vol = 28 cc
0 5 10 15 20 25 30 350
10
20
30
40
50
60
70
80
90
100
110
Dose (Gy)
Vol
(%
)
−15
−10
−5
0
5
10
15
GTV: 0 TGTV: 1 TPTV: 0 TPTV: 1 TLung: 0 TLung: 1 T
GTVρ = 0.58 g/cc∆ D
98% (PTV) = 6.44 %
GTVvol
= 8.6 ccPTV
vol = 26 cc
0 20 40 60 800
10
20
30
40
50
60
70
80
90
100
110
Dose (Gy)
Vol
(%
)
−15
−10
−5
0
5
10
15
GTV: 0 TGTV: 1 TPTV: 0 TPTV: 1 TLung: 0 TLung: 1 T
GTVρ = 0.97 g/cc∆ D
98% (PTV) = 0 %
GTVvol
= 14 ccPTV
vol = 55 cc
0 20 40 60 800
10
20
30
40
50
60
70
80
90
100
110
Dose (Gy)
Vol
(%
)
−15
−10
−5
0
5
10
15
GTV: 0 TGTV: 1 TPTV: 0 TPTV: 1 TLung: 0 TLung: 1 T
GTVρ = 0.67 g/cc∆ D
98% (PTV) = 4.19 %
GTVvol
= 13 ccPTV
vol = 59 cc
0 20 40 60 800
10
20
30
40
50
60
70
80
90
100
110
Dose (Gy)
Vol
(%
)
−15
−10
−5
0
5
10
15
GTV: 0 TGTV: 1 TPTV: 0 TPTV: 1 TLung: 0 TLung: 1 T
GTVρ = 0.96 g/cc∆ D
98% (PTV) = −0.282 %
GTVvol
= 16 ccPTV
vol = 31 cc
(a) (b) (c)
Figure 3: Dose enhancement within patients 4-8 (PTVs > 15 cc) at 1 T inline magnetic field. Each row presents adifferent plan. Column (a) displays a normalised dose slice through the GTV. Column (b) shows the relative dosechanges (% difference) surrounding the PTV and GTV, as indicated by the rectangle in part (a). Column (c) displaysdose volume histograms of the GTV and PTV, and reports the increase in the PTV dose (D98%)
9
orientation and style, the stronger magnetic field and the generic advantageous (cylindrical) shape of the tumor in the221
Kirkby work (1.5 T). However, the key features are common between the two, enhancement effects in the non-bounded222
regions of the PTV and overall PTV mean dose increases.223
B.III. Patients 4, 6 and 8224
These three plans contain medium to large PTVs of 28 cc, 55 cc and 31 cc (GTVs of 8 cc, 14 cc and 16 cc). It is225
clear from the dose difference slices in figure 3 column (b) that minimal or inconsistent dose enhancement is present226
(in at least the central slice through the GTV) inside the volume surrounding the GTV. Thus minimal impact on227
D98% (PTV) is made. Upon closer inspection it is noted that these three tumors are all in contact with the chest228
wall or mediastinum. They therefore have a significant proportion of their volume surrounding the GTV being dense229
tissue, which will not recieve great dose enhancement unlike the previous cases. In essence these larger PTV, partially230
bounded tumors are not candidates for significant dose enhancement effects. This results supports the notion that the231
strong shift in D98% arrises from dose enhancement to the tissue immediately surrounding the GTV.232
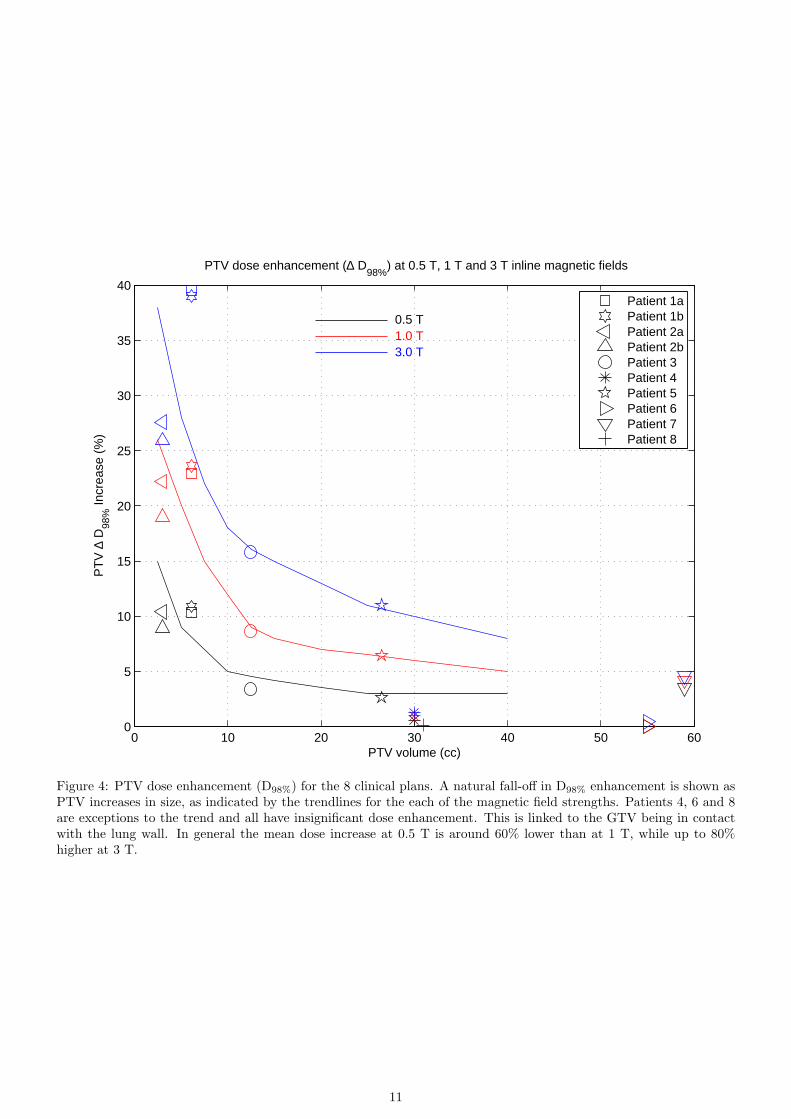
B.IV. Dose enhancement at 0.5 T and 3 T233
A summary of the mean dose enhancement effects in the GTV and PTV at 0.5 T and 3 T are presented in figure234
4. As one would expect, at 0.5 T the dose enhancement effects will be less than at 1 T, while stronger at 3 T than 1235
T. A general trend observed is that typically the GTV mean dose enhancement is around 60% lower than that at 1236
T, while at 3 T it is 5-60% higher than 1 T. There is no inherent linearity with these figures as the inline magnetic237
field increases. This is because the magnetic field induced secondary electron confinement in lung, or any tissue for238
that matter, is a 3D process. It is therefore dependent on the particular geometry in question. One can only really239
quote a general trend in how the dose enhancements change with respect to the inline magnetic field strength. It is of240
some interest to note however that at 3 T the mean dose improvements are at most 60% greater than at 1 T. Closer241
inspection of dose slices and DVH profiles at 3 T shows very strong but very local dose enhancement effects across the242
9 plans. The important message here is that replanning would be even more justified as inline magnetic field strength243
increases.244
B.V. Dose to non-target structures245
No significant changes in the mean doses to the non-target structures of interest for each of the clinical plans were246
reported. For the lung containing the GTVs an increase of < 1 Gy mean dose was seen across all plans, as noted247
in table 2. We note that this particular result holds for the specific plans selected in this study. One could expect248
that there is potential for some possible unfavorable dose enhancement if a lung tumor is located in close proximity249
to a critial structure, say for example the heart. In any case there would be scope for replanning to account for such250
effects.251
B.VI. Choice of beam energy252
As a final comment we note the use of 6MV based plans in this work. In the case of say 10MV or even 18MV plan253
the dose enhancement effects will be different, as beams of these energies have slighly narrower penumbral widths due254
to the longer, but more forwardly directed secondary electron range. An inline magnetic field will encourage these255
secondaries to travel parallel to the magnetic field, just like a 6MV beam, however the electron energies are higher and256
so will require greater magnetic fields to keep them from scattering laterally. A dedicated Monte Carlo based study257
would answer these questions.258
10
0 10 20 30 40 50 600
5
10
15
20
25
30
35
40
PTV volume (cc)
PT
V ∆
D98
% In
crea
se (
%)
PTV dose enhancement (∆ D98%
) at 0.5 T, 1 T and 3 T inline magnetic fields
Patient 1aPatient 1bPatient 2aPatient 2bPatient 3Patient 4Patient 5Patient 6Patient 7Patient 8
0.5 T1.0 T3.0 T
Figure 4: PTV dose enhancement (D98%) for the 8 clinical plans. A natural fall-off in D98% enhancement is shown asPTV increases in size, as indicated by the trendlines for the each of the magnetic field strengths. Patients 4, 6 and 8are exceptions to the trend and all have insignificant dose enhancement. This is linked to the GTV being in contactwith the lung wall. In general the mean dose increase at 0.5 T is around 60% lower than at 1 T, while up to 80%higher at 3 T.
11
IV. CONCLUSION259
A small but broad set of clinical lung plans have been recalculated using Monte Carlo methods and inline magnetic260
fields of 0.5 T, 1 T and 3 T applied. Significant dose enhancement in the form of increased D98% (PTV) have been261
observed at 1 T of up to 23% for very small GTVs of < 1 cc. A natural process of dose enhancement drop-off as262
the PTV increases is also shown, while GTVs bounded to the lung border show no significant dose enhancement.263
Typically the PTV dose enhancement (D98%) is around 60% lower at 0.5 T than that at 1 T, while at 3 T it is 25-80%264
higher than 1 T. The findings of this work can be directly related to the expected dose changes in future clinical inline265
MRI-linac systems. It is expected that such systems will be able to deliver both a dosimetrically superior and more266
conformal treatment to small (PTV < 15 cc) and isolated lung tumors over conventional x-ray beam radiotherapy267
systems. For larger isolated lung tumors (PTV > 15 cc) with mostly spherical shaped PTVs the enhancement effects268
with 0.5 T - 3 T inline magnetic fields applied will be irregular in distribution and quantity, primarily based around269
the PTV boundaries. For non-spherical tumor PTV shapes this enhancement becomes even less uniform throughout270
the PTV. The same effect holds for lung tumors with their PTVs bounded to some extent to the mediastimum or271
chest wall. We expect that these magnetically induced complex dose enhancement effects warrants the use of Monte272
Carlo based planning methods to ensure that adequate coverage and dosimetry of the PTV is achieved during inline273
real-time MRI guided radiotherapy.274
275
V. ACKNOWLEDGEMENTS276
The authors acknowledge funding from NHMRC Program Grant No. 1036078 and ARC Discovery Grant No.277
DP120100821.278
References279
[1] http://www.cms.gov/newsroom/mediareleasedatabase/press-releases/2015-press-releases-items/2015-02-05.html.280
[2] Jan J.W. Lagendijk, Bas W. Raaymakers, and Marco van Vulpen. The Magnetic Resonance Imaging-Linac System.281
Seminars in Radiation Oncology, 24(3):207 – 209, 2014.282
[3] Biagio Gino Fallone. The Rotating Biplanar Linac - Magnetic Resonance Imaging System. Seminars in Radiation Oncology,283
24(3):200 – 202, 2014.284
[4] Paul J. Keall, Michael Barton, and Stuart Crozier. The Australian Magnetic Resonance Imaging - Linac Program. Seminars285
in Radiation Oncology, 24(3):203 – 206, 2014.286
[5] A. J. E. Raaijmakers, B. W. Raaymakers, and J. J. W. Lagendijk. Integrating a MRI scanner with a 6 MV radiotherapy287
accelerator: dose increase at tissue-air interfaces in a lateral magnetic field due to returning electrons. Phys. Med. Biol.,288
50:1363–1376, 2005.289
[6] A. J. E. Raaijmakers, B. W. Raaymakers, S. van der Meer, and J. J. W. Lagendijk. Integrating a MRI scanner with a 6 MV290
radiotherapy accelerator: impact of the surface orientation on the entrance and exit dose due to the transverse magnetic291
field. Phys. Med. Biol., 52:929–939, 2007.292
[7] A J E Raaijmakers, B W Raaymakers, and J J W Lagendijk. Magnetic-field-induced dose effects in MR-guided radiotherapy293
systems: dependence on the magnetic field strength. Physics in Medicine and Biology, 53(4):909–923, 2008.294
[8] B. M. Oborn, P. E. Metcalfe, M. J. Butson, and A. B. Rosenfeld. High resolution entry and exit Monte Carlo dose295
calculations from a linear accelerator 6MV beam under influence of transverse magnetic fields. Med. Phys., 36(8):3549–296
3559, 2009.297
[9] B. M. Oborn, P. E. Metcalfe, M. J. Butson, and A. B. Rosenfeld. Monte Carlo characterization of skin doses in 6 MV298
transverse field MRI-linac systems: Effect of field size, surface orientation, magnetic field strength, and exit bolus. Medical299
Physics, 37(10):5208–5217, 2010.300
12
[10] Tristan C F van Heijst, Mariska D den Hartogh, Jan J W Lagendijk, H J G Desire van den Bongard, and Bram van301
Asselen. MR-guided breast radiotherapy: feasibility and magnetic-field impact on skin dose. Physics in Medicine and302
Biology, 58(17):5917–5930, 2013.303
[11] A. D. Esmaeeli, S. R. Mahdavi, M. Pouladian, A. S. Monfared, and S. Bagheri. Improvement of dose distribution in breast304
radiotherapy using a reversible transverse magnetic field linac-MR unit. Medical Physics, 41(1):–, 2014.305
[12] S. R. Mahdavi, A. D. Esmaeeli, M. Pouladian, A. S. Monfared, D. Sardari, and S. Bagheri. Breast dosimetry in transverse306
and longitudinal field MRI-Linac radiotherapy systems. Medical Physics, 42(2):925–936, 2015.307
[13] A. J. E. Raaijmakers, B. Hardemark, B. W. Raaymakers, C. P. J. Raaijmakers, and J. J. W. Lagendijk. Dose optimization308
for the MRI-accelerator: IMRT in the presence of a magnetic field. Phys. Med. Biol., 52:7045–7054, 2007.309
[14] G H Bol, S Hissoiny, J J W Lagendijk, and B W Raaymakers. Fast online Monte Carlo-based IMRT planning for the MRI310
linear accelerator. Physics in Medicine and Biology, 57(5):1375, 2012.311
[15] C Kontaxis, G H Bol, J J W Lagendijk, and B W Raaymakers. Towards adaptive IMRT sequencing for the MR-linac.312
Physics in Medicine and Biology, 60(6):2493, 2015.313
[16] G H Bol, J J W Lagendijk, and B W Raaymakers. Compensating for the impact of non-stationary spherical air cavities314
on IMRT dose delivery in transverse magnetic fields. Physics in Medicine and Biology, 60(2):755, 2015.315
[17] BM Oborn, PE Metcalfe, MJ Butson, AB Rosenfeld, and PJ Keall. Electron contamination modeling and skin dose in 6316
MV longitudinal field MRIgRT: Impact of the MRI and MRI fringe field. Medical physics, 39(2):874–890, 2012.317
[18] A Keyvanloo, B Burke, B Warkentin, T Tadic, S Rathee, C Kirkby, D. M Santos, and B. G. Fallone. Skin dose in318
longitudinal and transverse linac-MRIs using Monte Carlo and realistic 3D MRI models. Med. Phys., 39(10):6509–6521,319
2012.320
[19] B. M. Oborn, S. Kolling, P. E. Metcalfe, S. Crozier, D. W. Litzenberg, and P. J. Keall. Electron contamination modeling321
and reduction in a 1 T open bore inline MRI-linac system. Medical Physics, 41(5):051708 (15pp), 2014.322
[20] C. Kirkby, B. Murray, S. Rathee, and B. G. Fallone. Lung dosimetry in a linac-MRI radiotherapy unit with a longitudinal323
magnetic field. Medical Physics, 37(9):4722–4732, 2010.324
[21] W. H. Bostick. Possible techniques in direct-electron-beam tumor therapy. Phys. Rev., 77:564–565, 1950.325
[22] C. C. Shih. High energy electron radiotherapy in a magnetic field. Med. Phys., 2:9–13, 1975.326
[23] Daniel P. Whitmire, Davy L. Bernard, Mary D. Peterson, and James A. Purdy. Magnetic enhancement of electron dose327
distribution in a phantom. Medical Physics, 4(2):127–131, 1977.328
[24] Daniel P. Whitmire, Davy L. Bernard, and Mary D. Peterson. Magnetic modification of the electrondose distribution in329
tissue and lung phantoms. Medical Physics, 5(5):409–417, 1978.330
[25] B. R. Paliwal, A. L. Wiley Jr., B. W. Wessels, and M. C. Choi. Magnetic field modification of electron-beam dose331
distributions in inhomogenous media. Med. Phys., 5:404–408, 1978.332
[26] R. Nath and R. J. Schulz. Modification of electron-beam dose distributions by transverse magnetic fields. Med. Phys.,333
5:226–230, 1978.334
[27] M. S. Weinhous, R. Nath, and R. J. Schulz. Enhacement of electron beam dose distributions by longitudinal magnetic335
fields: Monte Carlo simulations and magnet system optimization. Med. Phys., 12:598–603, 1985.336
[28] A. F. Bielajew. The effect of strong longitudinal magnetic fields on dose deposition from electron and photon beams. Med.337
Phys., 20:1171–1179, 1993.338
[29] Eran Nardi and Gideon Barnea. Electron beam therapy with transverse magnetic fields. Medical Physics, 26(6):967–973,339
1999.340
[30] J.C.H. Chu, L. Reiffel, S. Naqvi, X.A. Li, S.-J. Ye, and A. Saxena. The use of magnetic fields to improve photon dose341
distributions for radiation therapy-a possible approach to poor man’s proton beam properties. 4:2737–2740 vol.4, 2000.342
[31] D. Jette. Magnetic fields with photon beams: dose calculation using electron multiple-scattering theory. Med. Phys.,343
27:1705–1716, 2000.344
[32] C. H. M. Lee and K. K. D. Chan. Electron contamination from the lead cutout used in kilovoltage radiotherapy. Phys.345
Med. Biol., 25:1–8, 2000.346
[33] L. Reiffel, A. Li, J. Chu, R. W. Wheatley, S. Naqvi, R. Pillsbury, and A. Saxena. Control of photon beam dose profiles by347
localized transverse magnetic fields. Phys. Med. Biol., 45:N177182, 2000.348
[34] D. Jette. Magnetic fields with photon beams: Monte Carlo calculations for a model magnetic field. Med. phys, 27:2726–2738,349
2000.350
13
[35] D. W. Litzenberg, B. A. Fraass, D. L. McShan, T. W. ODonnel, D. A. Roberts, F. D. Becchetti, A. F. Bielajew, and J. M.351
Moran. An apparatus for applying strong longitudinal magnetic fields to clinical photon and electron beams. Phys. Med.352
Biol., 46:N105115, 2001.353
[36] X. Allen Li, L. Reiffel, J. Chu, and S. Naqvi. Conformal photon-beam therapy with transverse magnetic fields: A monte354
carlo study. Medical Physics, 28(2):127–133, 2001.355
[37] Shahid A. Naqvi, X. Allen Li, Shada W. Ramahi, James C. Chu, and Sung-Joon Ye. Reducing loss in lateral charged-356
particle equilibrium due to air cavities present in x-ray irradiated media by using longitudinal magnetic fields. Medical357
Physics, 28(4):603–611, 2001.358
[38] Shada J. Wadi-Ramahi, Shahid A. Naqvi, and James C. H. Chu. Evaluating the effectiveness of a longitudinal magnetic359
field in reducing underdosing of the regions around upper respiratory cavities irradiated with photon beamsa monte carlo360
study. Medical Physics, 28(8):1711–1717, 2001.361
[39] David Jette. Magnetic fields with photon beams: Use of circular current loops. Medical Physics, 28(10):2129–2138, 2001.362
[40] Vadim Y. Kuperman. Electron beam transport in the presence of a strong, axial magnetic field. Medical Physics,363
28(12):2522–2526, 2001.364
[41] M. A. Earl and L. Ma. Depth dose enhancement of electron beams subject to external uniform longitudinal magnetic365
fields: A monte carlo study. Medical Physics, 29(4):484–491, 2002.366
[42] James C.H. Chu, Leonard Reiffel, Wen C. Hsi, and V.A. Saxena. Modulation of radiotherapy photon beam intensity using367
magnetic field. International Journal of Cancer, 96(S1):131–137, 2001.368
[43] David Jette. Magnetic fields with photon beams: Planar-current-induced magnetic fields. Medical Physics, 30(2):264–272,369
2003.370
[44] Shada J. Wadi-Ramahi, Damian Bernard, and James C. H. Chu. Effect of ethmoid sinus cavity on dose distribution at371
interface and how to correct for it: Magnetic field with photon beams. Medical Physics, 30(7):1556–1565, 2003.372
[45] Eran Nardi, Gideon Barnea, and Chang-Ming Ma. Electron beam therapy with coil-generated magnetic fields. Medical373
Physics, 31(6):1494–1503, 2004.374
[46] Yu Chen, Alex F. Bielajew, Dale W. Litzenberg, Jean M. Moran, and Frederick D. Becchetti. Magnetic confinement of375
electron and photon radiotherapy dose: A monte carlo simulation with a nonuniform longitudinal magnetic field. Medical376
Physics, 32(12):3810–3818, 2005.377
[47] L. Reiffel. Method and apparatus to control photon beam dose enhancements, US Patent Number 5,974,112. Oct. 26,378
1999.379
[48] L. Ma. Helical electron beam generating device and method of use, US patent number 6,878,951. Apr. 12, 2005.380
[49] L. Kaufman. Permanent magnet radiation dose delivery enhancement, Patent Number US 2006/0049902. Mar. 9, 2006.381
[50] ICRU Publication 83. Prescibing, Recording, and Reporting Photon-Beam Intensity-Modulated Radiotherapy (IMRT).382
Journal of the ICRU, 10(1), 2010.383
[51] B M Oborn, M Williams, M Bailey, and M G Carolan. IMRT treatment Monitor Unit verification using absolute calibrated384
BEAMnrc and Geant4 Monte Carlo simulations. Journal of Physics: Conference Series, 489(1):012020, 2014.385
[52] Sasa Mutic and James F. Dempsey. The ViewRay System: Magnetic Resonance - Guided and Controlled Radiotherapy.386
Seminars in Radiation Oncology, 24(3):196 – 199, 2014.387
14
Top Related