


Languages
Pages
Legal


ED 064 230
AUTHORTITLE
INSTITUTIONPUB DATENOTE
EDRS PRICEDESCRIPTORS
DOCUMENT RESUME
SP 005 683
Wotring, C. JarvisA Pilot Study to Evaluate Teachers Educated atCentral Michigan University.Central Michigan Univ., Mount Pleasant.Jan 7237p.
MF-$0.65 HC-$3.29*Course Evaluation, *Effective Teaching; *FacultyEvaluation; Teacher Education; *Teacher Evaluation;*Teacher Improvement
ABSTRACTThe main purposes of this pilot study were to obtain
school principals' evaluations of recent Central Michigan Universitygraduates and to letermine how the graduates felt about theirpreparation and the professors who had taught them. Seventy-nineprincipals evaluated 252 teachers in urban, suburban, and ruralschools in lower Michigan. The sample was representative of employingcommunities and proportionate to the total number of elementary,secondary and special education teachers graduated by CMU during thecalendar year 1968, 1969, 1970. Eleven criteria were used in theevaluation. A factor analysis yielded three factors in theevaluation: the skill factor, the human factor, and the academicfactor. The evaluation form had both content and construct validity.Three of the eight conclusions of the study indicated that teachersprepared at CMU are better than average in their third year teaching,teachers prepared by CMU were satisfied with their education, and theway teachers feel about their instructors affects their satisfactionwith their education. Further studies should be done using matchedpairs of teachers surveyed and principals evaluations of teachersbased on behavior criteria. Appendixes include evaluations, factorand chi-square analysis. (MJP0

CD
U.S. DEPARTMENT OF HEALTH.
teN
EDUCATION & WELFARE
(NI
OFFICE OF EDUCATIONTHIS DOCUMENT HAS SEEN REPRO.
.4"
DUCED EXACTLY AS RECEIVED FROM
THE PERSON OR ORGANIZATION ORIG.
INATING It POINTS OF VIEW OR OPIN-
C,
IONS STATED DO NOT NECESSARILY
REPRESENT OFFICIALOFFICE OF EDU-
CATION POSITION OR POLICY.
A PILOT STUDY TO EVALUATETEACHERS EDUCATED AT
CENTRAL MICHIGAN UNIVERSITY
Elementary and SecondaryGraduated in 1969Special Education
Graduated in 1968 and 1970
CENTRAL MICHIGAN UNIVERSITYMt. Pleasant, Michigan
January 29, 1972
bYDr. C. Jarvis Wotring
under the auspices of theBureau of School Servicis
Dr. A. R. Gaskill, Director

ABSTRACTOF
A PILOT STUDY TO EVALUATE TEACHERSEDUCATED AT CENTRAL MICHIGAN UNIVERSITY
byDr. C. Jarvis Wotring
January 29, 1972
INTRODUCTION
The main purpose of the pilot study was to ask principals who had recentCentral Michigan University graduates on their staff to evaluate them in their roleas teachers. The same teachers were asked how they felt about their preparationand professors who taught them. Of further interest were the hypotheses thatteachers and principals would tend to agree on their evaluations, that importantfactors If teacher evaluations could be identified, and the grade point averagesand American College Test scores predict success in teaching.
Two hundred fifty-two teachers were evaluated by seventy-nine principalsin urban, suburban, and rural schools in lower Michigan except for the southeastcorner which is served by other colleges and universities.
The sample was representative by communities and by the proportions ofelementary, secondary, and special education teachers graduated by Central Michi-gan University during the calendar years of 1968, 1969, and 1970. Of the ninety-four and six-tenths percent returns, eighty-nine percent were used. The five and
six-tenths percent were too late to be used in the study.
The instrument provided for evaluation on eleven criteria:
1. Planning and Organization2. Methods and Materials
3. Motivation4. Evaluation5. Management6. Overall Classroom Effectiveness7. Professionalism8. Community Skills9. Academic Preparation
10, Personal Qualities11. Human Relations

-2-
Content validity of the evaluation form was determined by a group of aboutfifteen teachers in the Thumb Area of Michigan, by eighteen teachers in the Mt.Pleasant, Michigan area, and approved by the Central Michigan University Depart-ments of Elementary and Secondary Education. A factor analysis of the form showedthree factors in the evaluation: the skill factor, the human factor, and the academicfactor. The evaluation form had both content and construct validity.
Use of the form by principals appeared to be reliable as far as could be de-termined by applying the "t" test to compare the mean of the self-evaluations ofone hundred forty-four of the two hundred fifty-two teachers studied with the meanof the two hundred fifty-two teachers evaluated. The means were significantlyalike at the .005 level of confidence.
Principals were asked to evaluate teachers on the eleven Items by means ofthe rating scale below.
1. Unacceptable teaching behavior2. Needs much improvement3. Needs some improvement4. and .5. Degrees of acceptable teaching behavior6. Better than acceptable teaching behavior7. Outstanding teacher behavior
Raters were forced to make a choice between four and five based on the assumptionthat a better distinction could be made to determine the areas of strength or weak-ness.
RESULTS AND CONCLUSIONS
Teachers prepared at Central Michigan University are better than average intheir third year of teaching. Seventy-six and four-tenths percent received ratingsof five, six, and seven. The mean was 5.2665 with a standard deviation of 1.14.
-3-
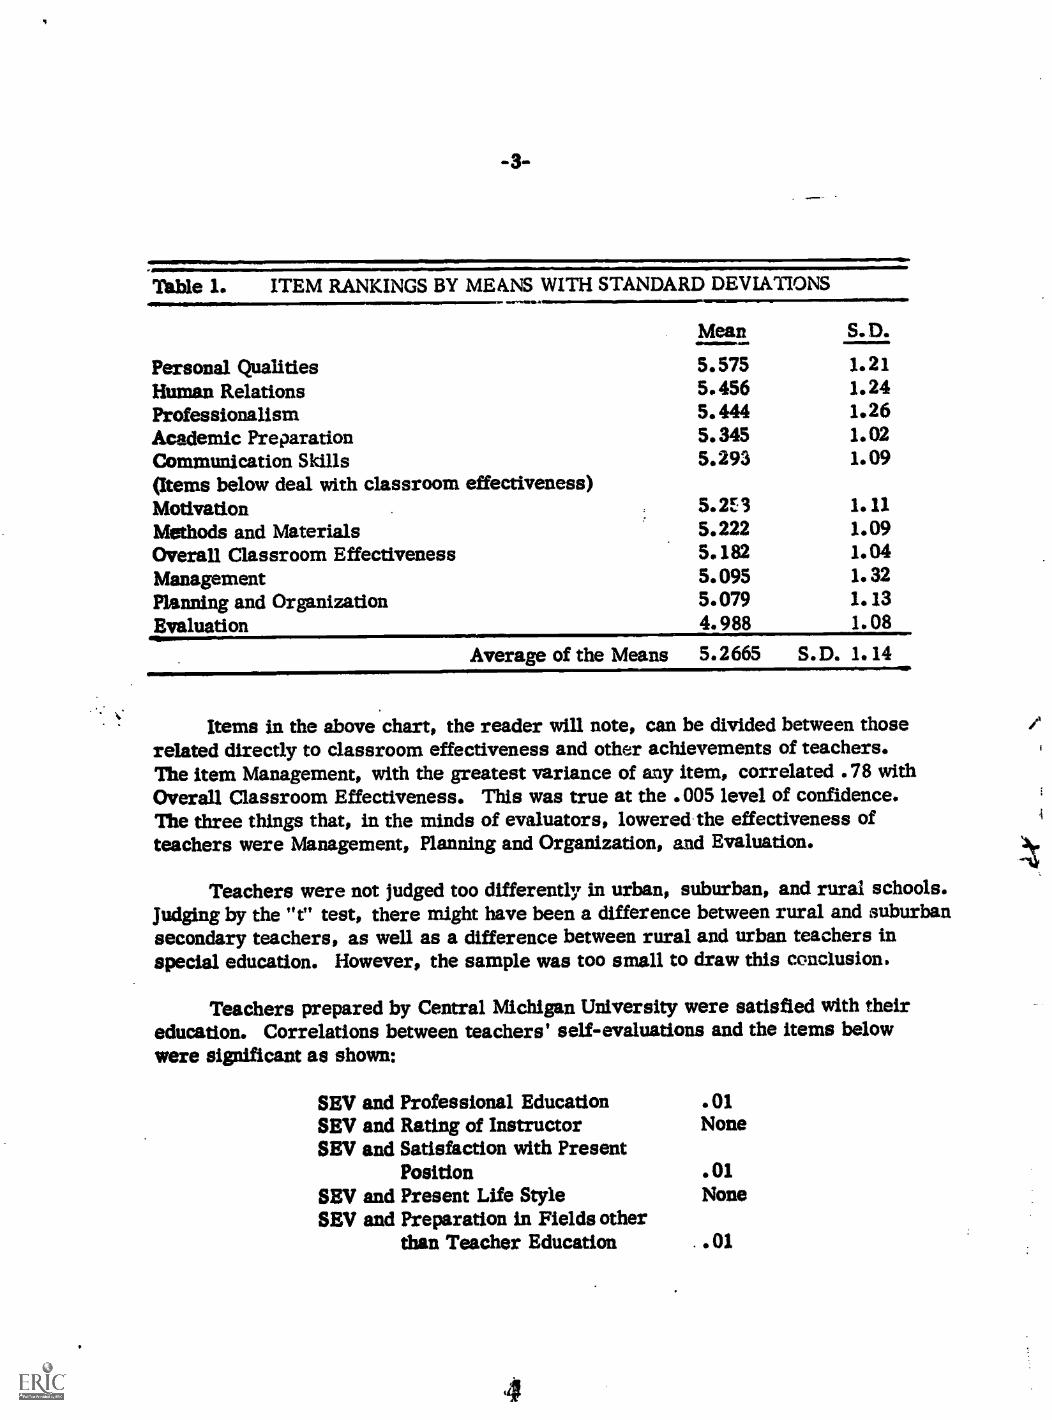
Table 1. ITEM RANKINGS BY MEANS WITH STANDARD DEVIATIONS
Personal QualitiesHuman RelationsProfessionalismAcademic Preparation
Mean S. D.
5.5755. 4565. 4445. 345
1.211.241.261.02
Communication Skills 5.293 1. 09(Items below deal with classroom effectiveness)Motivation 5. 2E 3 1.11Methods and Materials 5. 222 1.09Overall Classroom Effectiveness 5.182 1.04Management 5. 095 1. 32
Planning and Organization 5. 079 1.13Evaluation 4. 988 1. 08
Average of the Means 5. 2665 S.D. 1.14
Items in the above chart, the reader will note, can be divided between thoserelated directly to classroom effectiveness and other achievements of teachers.The item Management, with the greatest variance of any item, correlated .78 withOverall Classroom Effectiveness. This was true at the .005 level of confidence.The three things that, in the minds of evaluators, lowered the effectiveness ofteachers were Management, Planning and Organization, and Evaluation.
Teachers were not Judged too differently in urban, suburban, and rural schools.Judging by the "t" test, there might have been a difference between rural and suburbansecondary teachers, as well as a difference between rural and urban teachers inspecial education. However, the sample was too small to draw this conclusion.
Teachers prepared by Central Michigan University were satisfied with theireducation. Correlations between teachers' self-evaluations and the items belowwere significant as shown:
SEV and Professional Education .01SEV and Rating of Instructor NoneSEV and Satisfaction with Present
Position .01SEV and Present Life Style NoneSEV and Preparation in Fields other
than Teacher Education . .01

-4-
The correlation between Ratings of Instructors and their Professional Education wasalso significant at the .01 level.
Table 2. RATINGS OF INSTRUCTORS AND SATISFACTION WITHPROFESSIONAL EDUCATION
Groups N r d. f.Level of significance
.05 .01Elementary 35 . 675 33
=.1411~M/INIM.
.430Secondary 64 .335 62 .320Special Education 42 .464 40 .393Total N 141 .467 139 .219
111110=MPF101PIIPW
Dr. Gaskill's follow-up study (August, 1971) showed that eighty-two percentof the elementary teachers, eighty-six percent of the secondary teachers, andeighty-eight percent of the special education teachers felt their professional edu-cation to be adequate or very good.
Grade point averages correlated low but significantly at the .05 level withthe following:
Pearson rOverall Classroom Effectiveness .1764Professionalism . 1655Communication Skills .2105Academic Preparation .1360
ACT scores correlated .1524 significant at .05 with principals' observations ofAcademic Achievement. Seven correlations were negative, four were positive, andonly the one mentioned was significant.
GPA's and ACT's did not predict teaching success according to principals' Judgmentsof teaching success in this study. GPA's did the better job than ACT's, and then onlyon four items. The fact that there was little relationship was shown by a Chi-squareanalysis.
There are eight important conclusions:
1. Teachers prepared by Central Michigan University areaverage or better than average .
2. GPA's andACT's do not predict success in teaching.
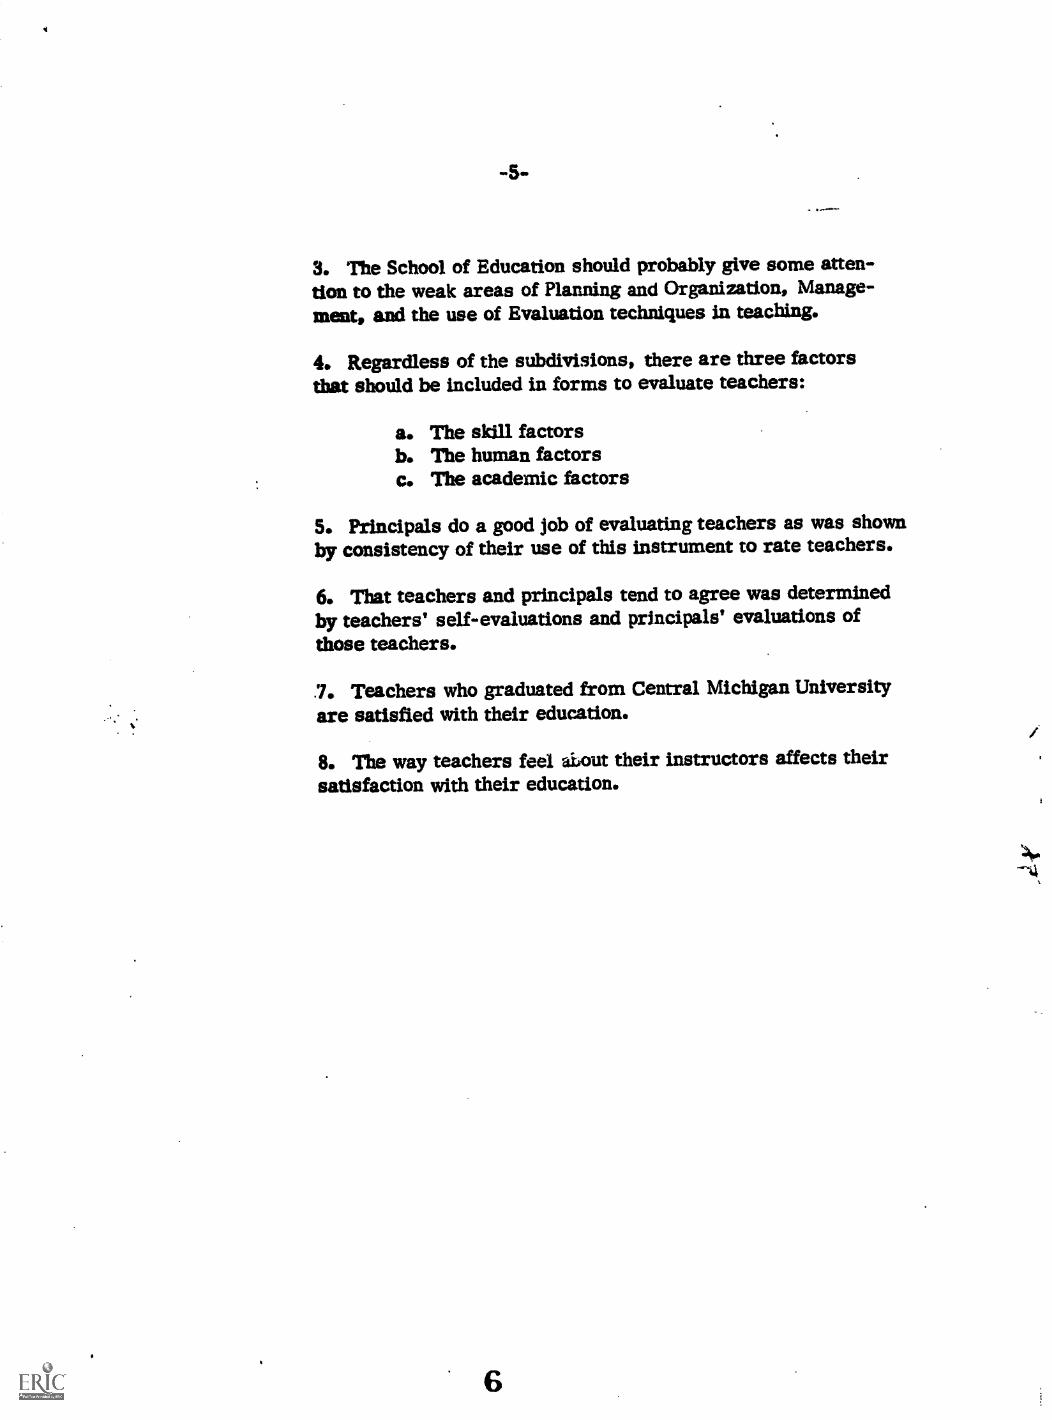
3. The School of Education should probably give some atten-tion to the weak areas of Planning and Organization, Manage-ment, and the use of Evaluation techniques in teaching.
4. Regardless of the subdivisions, there are three factorsthat should be included in forms to evaluate teachers:
a. The skill factorsb. The human factorsc. The academic factors
5. Principals do a good job of evaluating teachers as was shownby consistency of their use of this instrument to rate teachers.
6. That teachers and principals tend to agree was determinedby teachers' self-evaluations and principals' evaluations ofthose teachers.
.7. Teachers who graduated from Central Michigan Universityare satisfied with their education.
8. The way teachers feel aiiout their instructors affects theirsatisfaction with their education.
A PILOT STUDY TO EVALUATE TEACHERSEDUCATED AT CENTRAL MICHIGAN UNIVERSITY
Elementary and Secondary Graduated in 1969Special Education Graduated in 1968 and 1970
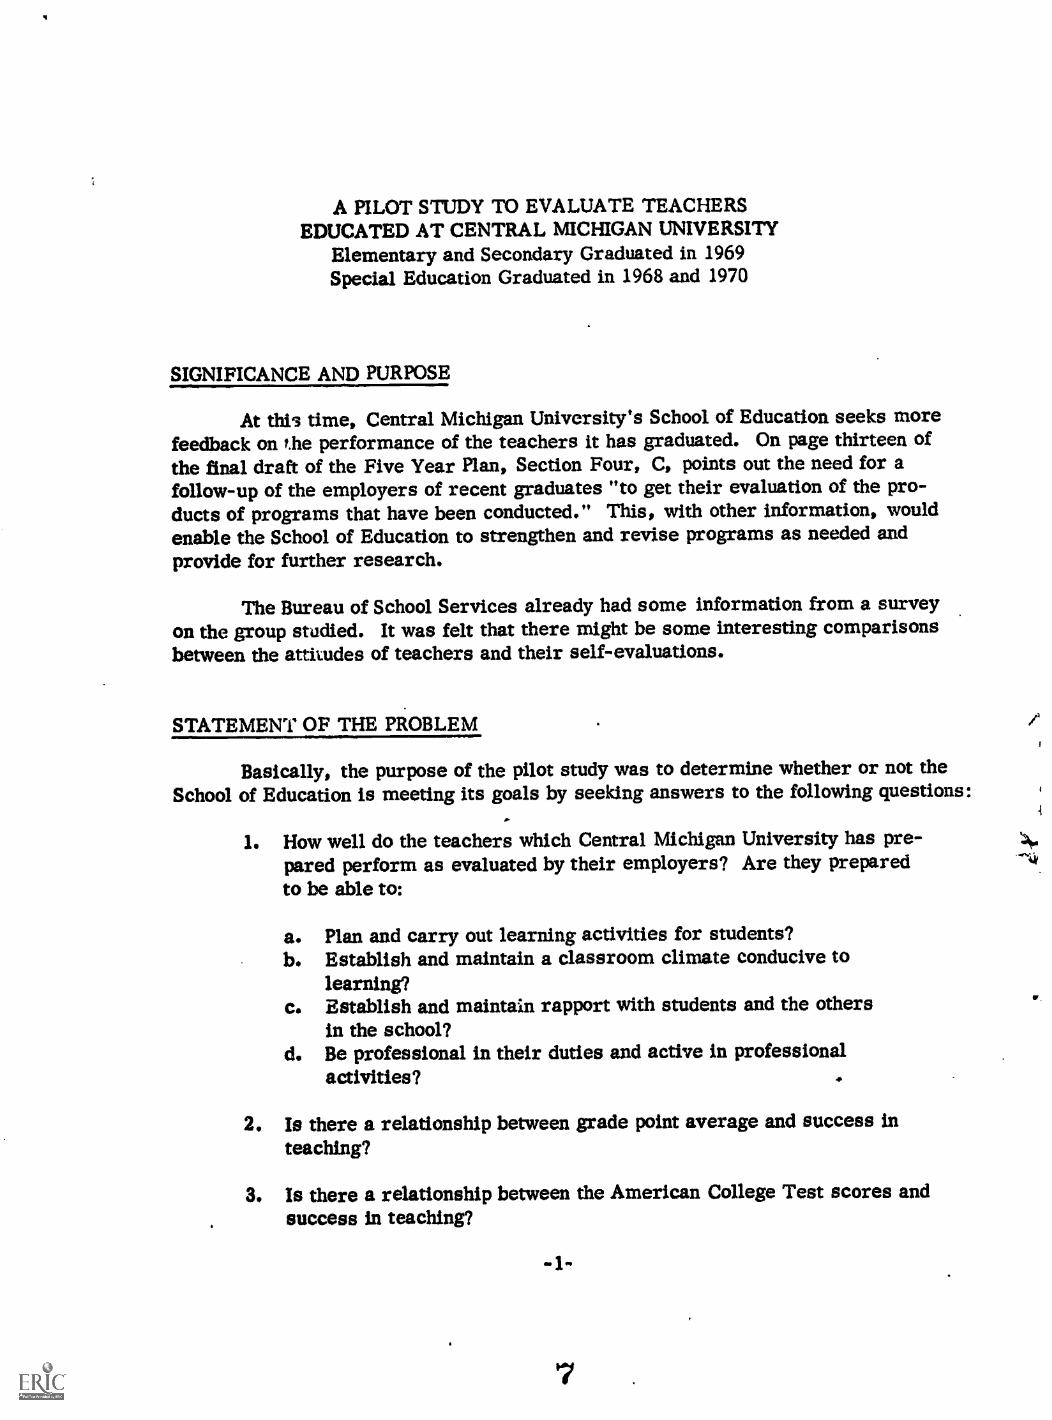
SIGNIFICANCE AND PURPOSE
At thig time, Central Michigan University's School of Education seeks morefeedback on the performance of the teachers it has graduated. On page thirteen ofthe final draft of the Five Year Plan, Section Four, C, points out the need for afollow-up of the employers of recent graduates "to get their evaluation of the pro-ducts of programs that have been conducted." This, with other information, wouldenable the School of Education to strengthen and revise programs as needed andprovide for further research.
The Bureau of School Services already had some information from a surveyon the group studied. It was felt that there might be some interesting comparisonsbetween the attitudes of teachers and their self-evaluations.
STATEMENT OF THE PROBLEM
Basically, the purpose of the pilot study was to determine whether or not theSchool of Education is meeting its goals by seeking answers to the following questions:
1. How well do the teachers which Central Michigan University has pre-pared perform as evaluated by their employers? Are they preparedto be able to:
a. Plan and carry out learning activities for students?b. Establish and maintain a classroom climate conducive to
learning?c. Establish and maintain rapport with students and the others
in the school?d. Be professional in their duties and active in professional
activities?
2. Is there a relationship between grade point average and success inteaching?
3. Is there a relationship between the American College Test scores andsuccess in teaching?
4

-2-
4. Are there any indications of relationship between students' attitudestoward their education and their success in teaching?
5. How can these findings be used to improve the work being done in theSchool of Education?
DEFINITIONS
Rural school systems were those described as being primarily in ruralagricultural towns under five thousand in population.
Suburban school systems were those in cities within ten miles of industrial-business centers and urban communities; citizens were primarily commuters tolarger cities.
Urban school systems were those in cities which were business- and indus-trial-centered. These cities had a population of ten thousand or more.
An elementary teacher is certified to teach grades K to eight.A secondary teacher is certified to teach grades seven to twelve.A special education teacher is certified for teaching special education
students at the elementary or secondary levels. The preponderance of specialeducation teachers participating in this study.are certified as elementary.
Behavioral criteria are descriptions of teacher acts which can be quantifiedby experienced supervisors, in this case, principals.
ASSUMPTION
It was assumed that:
1. The criteria for liood teacher can be identified.2. Such criteria are observable and can be scaled.3. Experienced practitioners (school principals) can make
valid judgments in evaluating teaching acts against thebehavioral criteria.
4. Teacher self-evaluations have validity.5. There is a relationship between teacher behavior and
student learning.
INSTRUMENTATION
The evaluation form contained eleven items as follows:1
1. See Appendix A for the evaluation form.
-3-
Planning and OrganizationMethods and MaterialsMotivationEvaluationManagementOverall Classroom EffectivenessProfessionalismCommunication SkillsAcademic PreparationPersonal QualitiesHuman Relations
These items were selected because they most commonly appear in evalu-ation forms. The behavioral objectives used as the criteria were descriptions ofoptimum teacher behavior expected. Further, the items were determined bytwenty supervising teachers from the Thumb Area and verified by eighteen super-vising teachers in the Mt. Pleasant Area. The behavio/ al objectives were acceptedby the Departments of Elementary and Secondary Education.
The scale to evaluate achievement of the objectives ranged from one toseven. Number one was used as an indicator of unacceptable teaching behavior.Number seven was used to indicate full achievement of the described behavior.Purposely, raters were forced to choose between numbers four and five to indicatewhether the teacher tended to be better or poorer than average. It was assumedthat the intervals between the numbers were equal.
VALIDITY
Because the instrument was subjected to the scrutiny of two separate groupsof supervising teachers and the criteria were found acceptable behavioral objec-tives by the Departments of Elementary and Secondary Education, it has contentvalidity.
A factor analysis2 of the eleven items of the evaluation instrument showedthe top six items on the chart above to be the first factor. In this case, they wereclearly all related to classroom effectiveness.
Personal qualities, Human Relations, and Professionalism, weighted in thatorder, came out a second factor.
Two items, Communication Skills and Academic Preparation, were a thirdfactor.
Significance of the factors can be seen if they are labeled:
2. See Appendix B.
4
-;
-4-
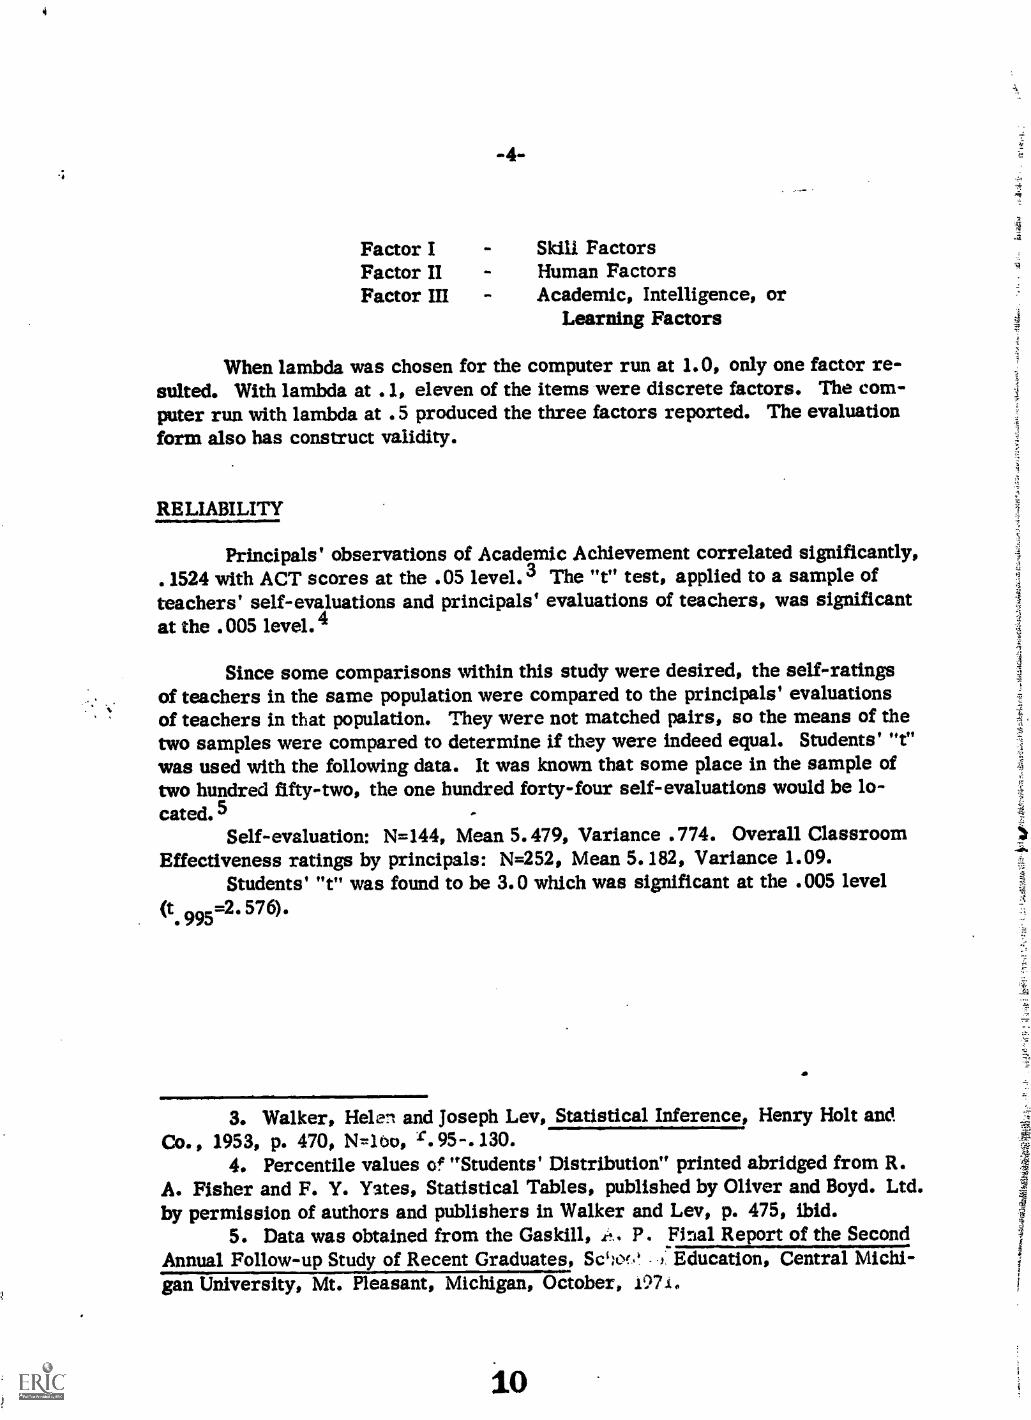
Factor I Skill FactorsFactor II - Human FactorsFactor III - Academic, Intelligence, or
Learning Factors
When lambda was chosen for the computer run at 1.0, only one factor re-sulted. With lambda at .1, eleven of the items were discrete factors. The com-puter run with lambda at .5 produced the three factors reported. The evaluationform also has construct validity.
RELIABILITY
Principals' observations of Academic Achievement correlated significantly,.1524 with ACT scores at the .05 level.3 The "t" test, applied to a sample ofteachers' self-evaluations and principals' evaluations of teachers, was significantat the .005 level.4
Since some comparisons within this study were desired, the self-ratingsof teachers in the same population were compared to the principals' evaluationsof teachers in that population. They were not matched pairs, so the means of thetwo samples were compared to determine if they were indeed equal. Students' "t"was used with the following data. It was known that some place in the sample oftwo hundred fifty-two, the one hundred forty-four self-evaluations would be lo-cated. 5
Self-evaluation: N=144, Mean 5.479, Variance .774. Overall ClassroomEffectiveness ratings by principals: N=252, Mean 5.182, Variance 1.09.
Students' "t" was found to be 3.0 which was significant at the .005 level(t. 995=2.576).
a
3. Walker, Helen and Joseph Lev, Statistical Inference Henry Holt andCo., 1953, p. 470, N=loo, r.95-.130.
4. Percentile values of "Students' Distribution" printed abridged from R.A. Fisher and F. Y. Yates, Statistical Tables, published by Oliver and Boyd. Ltd.by permission of authors and publishers in Walker and Lev, p. 475, ibid.
5. Data was obtained from the Gaskill, P. Final Report of the SecondAnnual Follow-up Study of Recent Graduates, Sc'A.Y.' 1 Education, Central Michi-gan University, Mt. Pleasant, Michigan, October, 1971.
10

S. -
-5-
Table 1. COMPUTATIONS FOR qTUDEN'TS' "T'
Ho: The means of the teachers' self-evaluations is not significantly different fromthe means of the principals' evaluations of teachers on the item Overall ClassroomEffectiveness.011=11111..1111MIIINIIMINIMII
SEVPET
t=
t=
t=
t=
t=
df a.- 394
t .955 ar.
Mean = 5.479Mean = 5.182
5.479 - 5.1827 + 1.09
144 252
. 297
.00535 + .00432
. i97
.00967
. 297.-009
3.0
2.576
S2 = .785 N = 144S2 = .10899 N = 252
The means are significantly alike.
Though not conclusive, this is evidence that principals will use the formin the same consistent ways to evaluate. The correlation of items one through five
-6-
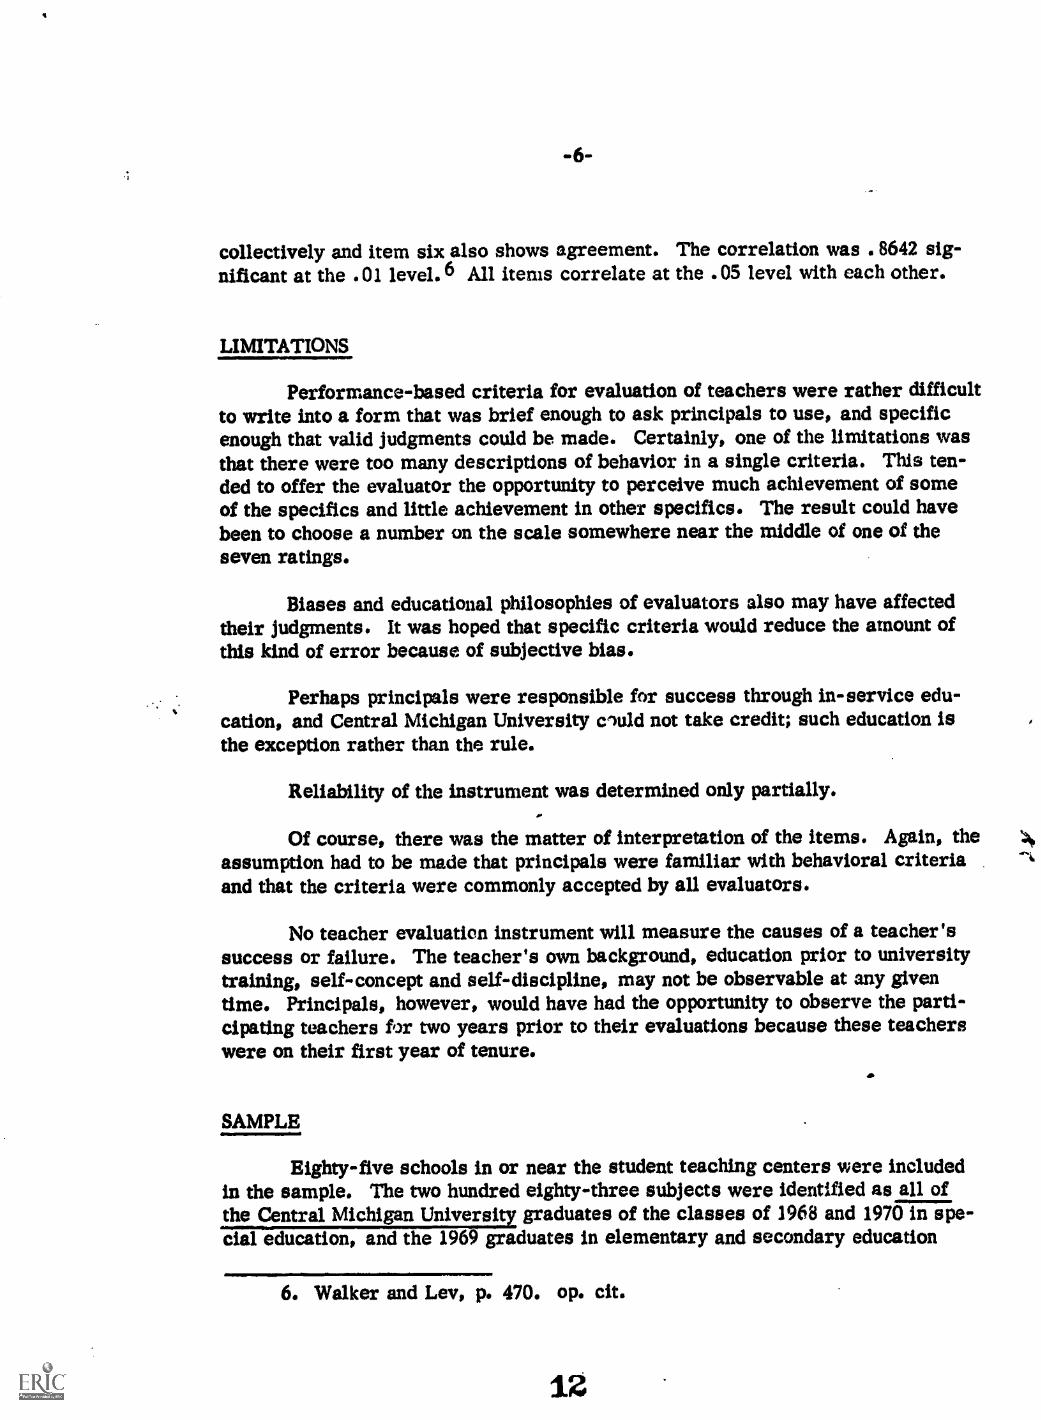
collectively and item six also shows agreement. The correlation was .8642 sig-nificant at the .01 level. 6 All items correlate at the .05 level with each other.
LIMITATIONS
Performance-based criteria for evaluation of teachers were rather difficultto write into a form that was brief enough to ask principals to use, and specificenough that valid judgments could be made. Certainly, one of the limitations wasthat there were too many descriptions of behavior in a single criteria. This ten-ded to offer the evaluator the opportunity to perceive much achievement of someof the specifics and little achievement in other specifics. The result could havebeen to choose a number on the scale somewhere near the middle of one of theseven ratings.
Biases and educational philosophies of evaluators also may have affectedtheir judgments. It was hoped that specific criteria would reduce the amount ofthis kind of error because of subjective bias.
Perhaps principals were responsible for success through in-service edu-cation, and Central Michigan University ciuld not take credit; such education isthe exception rather than the rule.
Reliability of the instrument was determined only partially.
Of course, there was the matter of interpretation of the items. Again, theassumption had to be made that principals were familiar with behavioral criteriaand that the criteria were commonly accepted by all evaluators.
No teacher evaluation instrument will measure the causes of a teacher'ssuccess or failure. The teacher's own background, education prior to universitytraining, self-concept and self-discipline, may not be observable at any giventime. Principals, however, would have had the opportunity to observe the parti-cipating teachers for two years prior to their evaluations because these teacherswere on their first year of tenure.
SAMPLE
Eighty-five schools in or near the student teaching centers were includedin the sample. The two hundred eighty-three subjects were identified as all ofthe Central Michigan University graduates of the classes of 1968 and 1970 in spe-cial education, and the 1969 graduates in elementary and secondary education
6. Walker and Lev, p. 470. op. cit.
12

-7-
teachers in a stratified sample of Michigan schools.
Two hundred fifty-two were returned in time for the study. This figure con-stituted eighty-nine percent of those sent. Another fifteen responses arrived late,bringing the returns to 94.6%, which indicated exceptional cooperation.
Rather than attempt a random sample and fewer numbers, all teachers whocould be identified as indicated constituted the stratified sample.
Schools to be contacted were in or close to the student teaching centers tofoster communication between the coordinator of the study and the public schools.Since the school systems were of different sizes and in rural, suburban, and urbanareas, it was expected that there would be a satisfactory stratified sample.
Student teaching centers were located in areas from whfch Central MichiganUniversity students are drawn. This area is described as sixty miles on both sidesof a line drawn from Mt. Pleasant to Detroit. Included also were the Thumb Area,Grand Rapids, and a few schools in Northern Lower Michigan between Mt. Pleasantand Traverse City. Southwestern Michigan schools were not surveyed because theyare served by other universities, and contacts, if needed, by university supervisorsto the schools were not feasible. An added well-knowr fact is that teachers tend toreturn to home areas to teach. Concidentally, Central Michigan University studentteaching centers are in those areas from which students are drawn.
The charts below indicate that the extent to which the sample was represen-tative. The sample splits nearly fifty-fifty between elementary and secondary. Bycommunities, forty-one percent were rural, thirty-seven percent were suburban,and twenty-two percent were urban.
=MM.
Table 2. ELEMENTARY, SECONDARY, AND SPECIAL EDUCATION STUDENTSIN RURAL, SUBURBAN, AND URBAN SCHOOLS
Rural Suburban Urban TotalNumber Percent Number Percent Number Percent Number Percent
Elementary 37 15 30 12 21 8 88 35
Secondary 53 21 56 22 18 7 127 50Special Ed. 12 5 8 3 17 ", 37 15
MIMI=
102 41 94 37 56 22 252 100
An analysis of the declared majors of the class of 1969 showed nearly twice asmany persons who had earned secondary certificates as compared to those who had

-8-
earned elementary certificates. Two other points may be noted in the charts below:Of the declared majors, only 3.9 percent were elementary-special education, and .5percent were secondary-special education. Thus, as would be expected, the samplewas more heavily weighted with elementary-special education teachers.
Table 3. *DECLARED MAJORS - CLASS OF 1969 - SCHOOL OF EDUCATION
ElementaryRegularSpecial Education
SecondaryRegularSpecial Education
Number Percent Total Percent........
376 22. 5664 3. 90 434 36. 46
1198 73. 048 .50 1206 73. 54
1640 TM 1640 100. 00
*Source: Director of the Bureau of School Services, Dr. A. R. Gaskill's lists ofstudents from which a random sample was taken for the survey of the class of 1969and Special Education students from the classes of 1968 and 1970.
it .,Table 4. SAMPLE COMPARED TO DECLARED MAJORS
The Sample
Elementary
Number
Regular 88Special Education 35
SecondaryRegular 127
Special Education 2252
Class of 1969Declared Majors
Percent Percent
35. 0 22. 561 4.0 3. 90
5 0.3.7
100. 0
73. 04.50
100. 00
Also to be noted in the above charts is the fact that the number of secondary-special education teachers in the sample was about equal to the number which mightbe expected in any one class. The sample can be said to be representative.
14

-9-
ANALYSIS OF DATA
Before approaching the analysis, several things must be noted relative tomeans, standard deviation, correlation, upper and lower quartile of grade pointaverages, and American College Test scores.
For the major emphasis of this study, the means and standard deviations ofthe items made it possible to rank the items. This showed strong areas and weakareas of the teachers' evaluations collectively. Correlations would show relation-ship among the items, consistency or lack of it in the principals' ratings, and re-lationship of GPA's and ACT's to the items of the evaluation.
Upper and lower quartiles of ACT scores were discovered from the scoresthemselves wherein there was a percentile based on national norms given. A scoreof between twenty-four and twenty-five appeared to be the seventy-fifth percentile.A score of seventeen or eighteen appeared to be at the twenty-fifth percentile. Anydifferences were attributed to the date on which the tests were administered to aparticular group. Arbitrarily, the scores of twenty-four and above were selectedas the upper quartile, and scores of eighteen and below were selected as the lowerquartile. This also provided an adequate sample, which was more important for theCM-square testing procedure.
The upper and lower quartiles of the GPA's were determined from the sampleitself. From the data, were were one hundred ninety-one available GPA's. From2.29 down there was 22.5% of the sample, From GPA 2.84 above there was twesity-four percent of the sample. To obtain about twenty-five percent of the sample,therefore, the point 2.34 and down included at least twenty-five percent. Actually,it amounted to twenty-eight percent of the sample. GPA'k3 of 2.75 and above includedtwenty-seven percent of the sample.
After computer analysis which selected cases from 2.34 down and 2.75 andabove, a check by hand computation of 25.6 percent in the high group and 25.6 per-cent in the low group was done. The results were about the same.
How well do Central Michigan University graduates perform as teachers?This was the central question asked in the study. To answer the question, the meansand standard deviations for each item of the evaluation were obtained. Reference tothe evaluation form in the Appendix will show that on a seven point scale, with theassumption that the intervals are equal, the numbers four and five would reflectacceptable teaching behavior.
The best indicator of the answer to the question above appears to be the
7See Appendices C and D.

-10-
category of "Overall Classroom Effectiveness: Achievement of his students is atthe level of expectation of his own and the school's objectives." The mean ratingwas 5.182 with a standard deviation of 1.044, indication that on a curve approach-ing normal most of the evaluations would be from 4.138 to 6.226. The average ofthe eleven means is 5.2665 with SD=1.143.
For the purpose of clarifying the points to which means of rating were com-pared, it was necessary to review the rationale for the rating scale. Directions tothe raters instructed them to rank as follows:
1. unacceptable teaching behavior2. needs much improvement3. needs some improvement4. & 5. degrees of acceptable teaching behavior6. better than acceptable teaching behavior7. outstanding teaching behavior
Raters were forced to make u choice between four (low average) and five(high average). More often, the principals selected ratings of five and above pre-sumably because they had no "average" rating.
Table 5. ITEM RANKINGS BY MEANS WITH STANDARD DEVIATIONS
.Personal Qualities
Mean S.D.5.575 1.21
Human Relations 5.456 1.24Professionalism 5.444 1.26Academic Preparation 5.345 1.02Communication Skills 5.293 1.09(Items below deal with classroom effectiveness)Motivation 5.253 1.11Methods and Materials 5.222 1.09Overall Classroom Effectiveness 5.182 1.04Management 5.095 1.32Planning and Organization 5.079 1.13Evaluation 4.988 . 1.08
Average of the Means 5.2665 S.D. 1.14
Items in the above chart, the reader will note, can be divided between thoserelated directly to classroom effectiveness and other achievements of teachers.The item Management, with the greatest variance of any item, correlated .78 withOverall Classroom Effectiveness. This was true at the .005 level of confidence. 8
8. Walker and Lev, op. cit. , p. 470.

The three things that, in the minds of the evaluators, lowered the effectiveness ofteachers were Management, Planning and Organization, and Evaluation.
Does this mean that Central Michigan University should give more attentionto this area of teacher education? Or, does it mean that principals are biased inthis direction? More on this later.
Three items that raised the average rating were Personal Qualities, HumanRelations, and Professionalism.
The first question related to the general question concerning classroom ef-fectiveness was: Are the teachers prepared by Central Michigan University able toplan and carry out learning activities for students? Principals gave them an averagerating.
The second related question was: Are they able to establish and maintain a .
classroom climate conducive to learning7 Teachers were rated average, but manyindividuals rated low.
Are these teachers able to establish rapport with students and others? wasthe third question. Personal Qualities and Human Relations of teachers rankedfirst and second highest. Respective means of 5.565 and 5.456 are well above themean.
Third-ranking Professionaksm, mean 5.444, was above the mean as wasthe fourth highest, Academic Preparation, with a mean of 5.345.
Giving attention to the first question, the chart below reveals that elemen-tary teachers, secondary teachers, and special education teachers were rated withthe same degree of objectivity by their principals.
Table 6.*PERCENT RECEIVING OVERALL CLASSROOM EFFECTIVENESS RATINGS
Scale 1 2
Elementary
Secondary
Special Ed.
%
370-
4 1.6
9 3.6
0
4%
15 6.0
24 9.6
5 2 0
5%
35 14.1
43 17.3
8 5.2 17 613 5.3
36 6
6%
26 10.5
40 16.1
13 5 231.8
7 Total %%
7 2.8 35
8 3.2 50.6
5 2 0 14.48.0 100.0
*Based on returns 11/30/71 N449
17
-12-
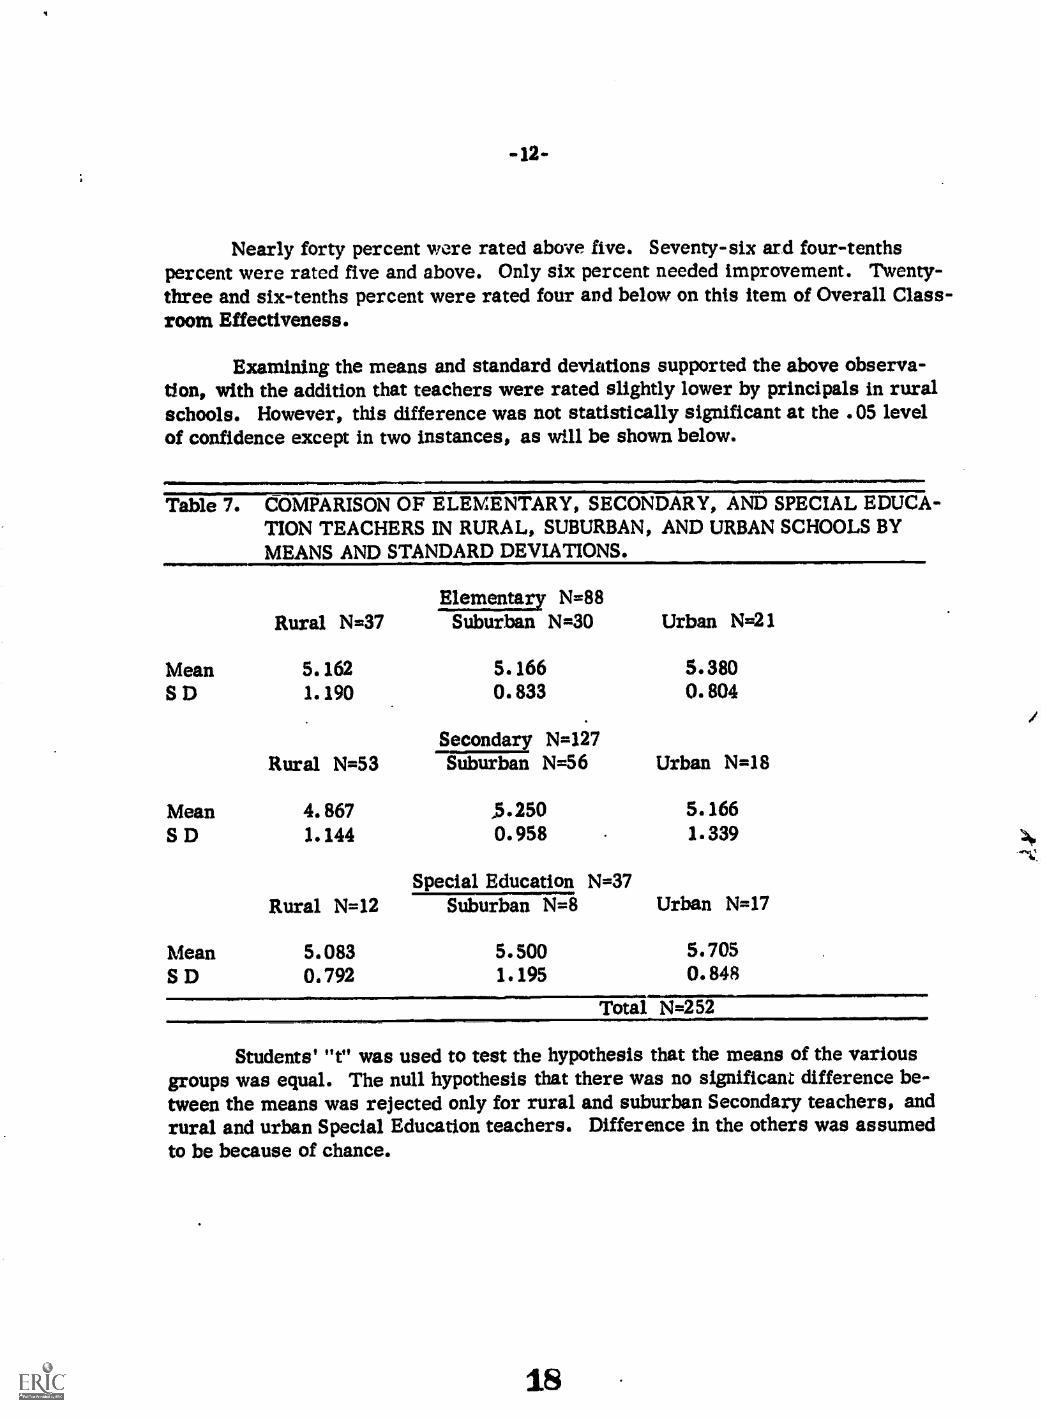
Nearly forty percent were rated above five. Seventy-six ard four-tenthspercent were rated five and above. Only six percent needed improvement. Twenty-three and six-tenths percent were rated four and below on this item of Overall Class-room Effectiveness.
Examining the means and standard deviations supported the above observa-tion, with the addition that teachers were rated slightly lower by principals in ruralschools. However, this difference was not statistically significant at the .05 levelof confidence except in two instances, as will be shown below.
Table 7. COMPARISON OF ELEMENTARY, SECONDARY, AND SPECIAL EDUCA-TION TEACHERS IN RURAL, SUBURBAN, AND URBAN SCHOOLS BYMEANS AND STANDARD DEVIATIONS.
Rural N=37Elementary N=88
Suburban N=30 Urban N=21
Mean 5. 162 5. 166 5. 380S D 1. 190 0. 833 0. 804
Secondary N=127Rural N=53 Suburban N=56 Urban N=18
Mean 4. 867 3.250 5. 166S D 1.144 0.958 1.339
Rural N=12Special Education N=37
Suburban N=8 Urban N=17
Mean 5.083 5.500 5.705S D 0.792 1.195 0.848
Total N=252
Students' "t" was used to test the hypothesis that the means of the variousgroups was equal. The null hypothesis that there was no significant difference be-tween the means was rejected only for rural and suburban Secondary teachers, andrural and urban Special Education teachers. Difference in the others was assumedto be because of chance.
18
-13-
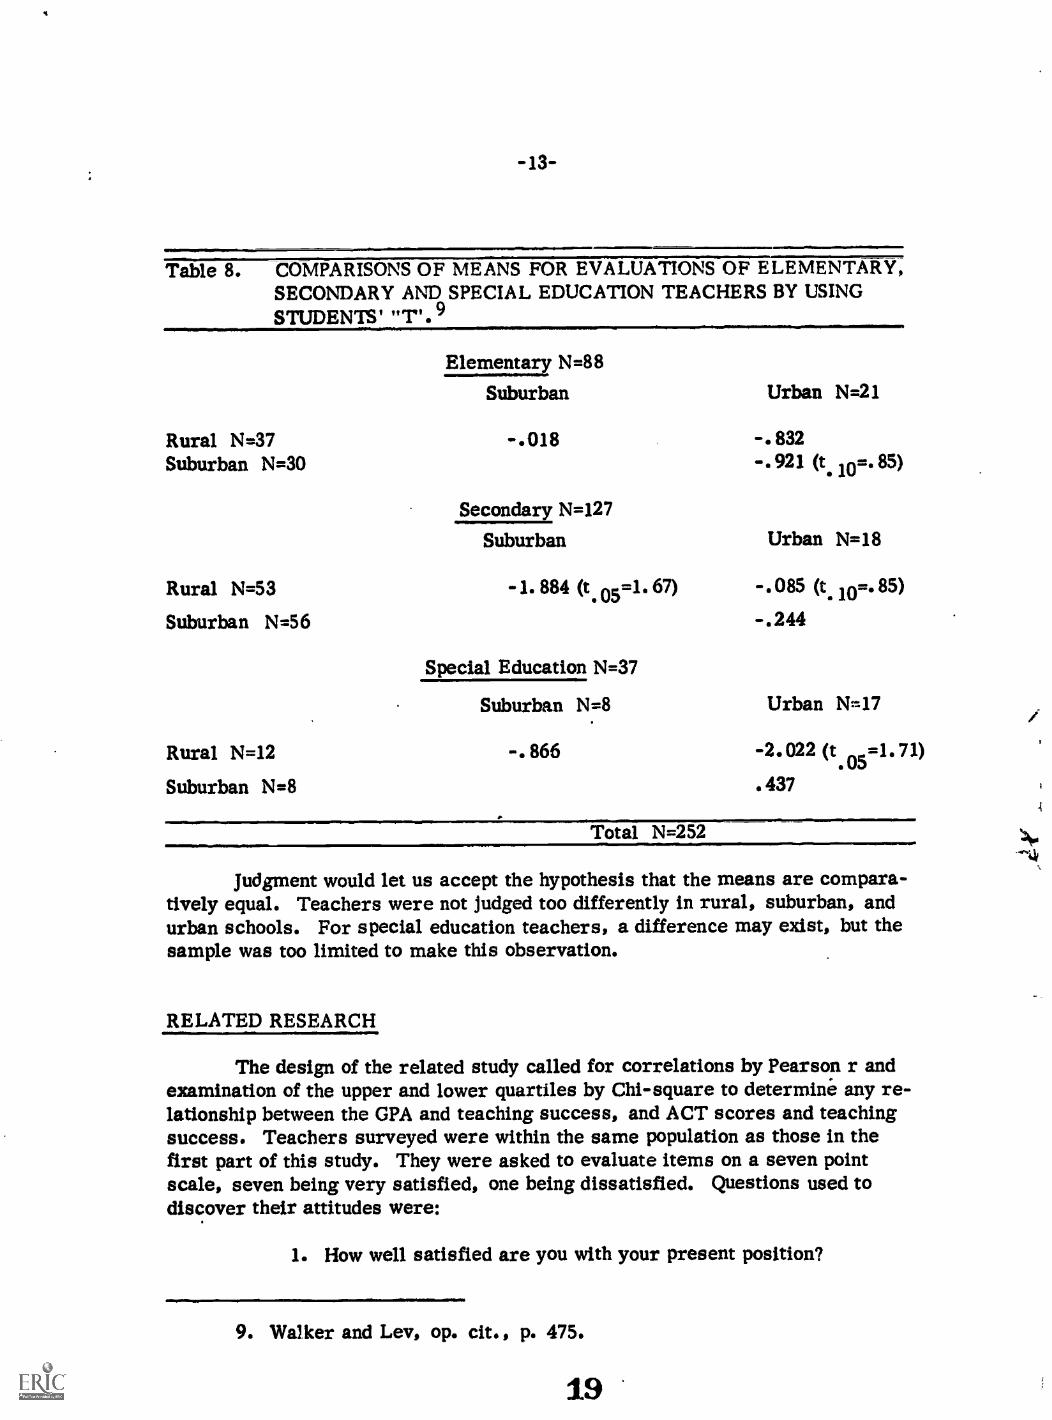
Table 8. COMPARISONS OF MEANS FOR EVALUATIONS OF ELEMENTARY,SECONDARY AND SPECIAL EDUCATION TEACHERS BY USINGSTUDENTS'
Rural N=37Suburban N=30
Rural N=53
Suburban N=56
Rural N=12
Suburban N=8
Elementary N=88Suburban
-.018
Secondary N=127
Suburban
-1. 884 (t. 05=1. 67)
Special Education N=37
Suburban N=8
-.866
Urban N=21
-. 832
' 921 (t. 10=685)
Urban N=18
-. 085 (t. 10=. 85)
-.244
Urban N=17
-2.022 (t.05=1.71)
.437
Total N=252
Judgment would let us accept the hypothesis that the means are compara-tively equal. Teachers were not judged too differently in rural, suburban, andurban schools. For special education teachers, a difference may exist, but thesample was too limited to make this observation.
RELATED RESEARCH
The design of the related study called for correlations by Pearson r andexamination of the upper and lower quartiles by Chi-square to determine any re-lationship between the GPA and teaching success, and ACT scores and teachingsuccess. Teachers surveyed were within the same population as those in thefirst part of this study. They were asked to evaluate items on a seven pointscale, seven being very satisfied, one being dissatisfied. Questions used todiscover their attitudes were:
1. How well satisfied are you with your present position?
9. Walker and Lev, op. cit., p. 475.

-14-
2. How well does the community in which you live fit yourlife style?
3. How would you rate your preparation for teaching in worktaken in other fields?
4. How would you rate your professional education overall?
5. How would you rate yourself as a teacher, comparing your-self with others having the same amount of training andexperience?
6. In general, instructors in professional education courseswere: Use scale below. (Circle one number only.)Excellent 7 6 5 4 3 2 1 Poor.
To discover relationships, the teachers' responses were paired as follows:
Self-EvaluationSelf-EvaluationSelf-EvaluationSelf-EvaluationSelf-Evaluation
Ratings of Instructors
Analyzing the data was the next step.
Professional EducationRating of InstructorPresent PositionPresent Life StyleEducation in Fields Other Than
Teacher EducationProfessional Education
ANALYZING THE DATA OF RELATED RESEARCH
In this section, tables of correlation obtained for elementary, secondary,and special education teachers responding to the questions are presented. Corre-lations, degrees of freedom and level of significance reached are reported in orderto form the basis for discussion. Fisher and Yates tables provided levels of sig-nificance.
Table 9. SELF-EVALUATION - PROFESSIONAL EDUCATION
Level of significanceGroups N r d. f. .05 .01
Elementar y 36 .300 34Secondary 63 .313 61 .248 .323Special Ed. 46 .290 44 .291Total N 145 .302 143 Inib .214
20

-15-
The overall correlation was significant at the .01 level. Teachers whothought of themselves as effective also believed their professional education tohave been sufficient. However, this observation did not appear to be true forelementary teachers. It must be noted that correlations were low.
Even though there was a correlation between self-evaluations and feelingsaout professional education, none was apparent between self-evaluations and in-structors.
Table 10. SELF-EVALUATION - RATING OF INSTRUCTORIMMINMWOMMEM.11
Level of significanc.)Groups N r d. f. .05 .01
Elementary 34 .117 32 ---Secondary 62 .037 60 - ON MD IIM 401 IIM
Special Education 42 182 40Total N 138 .064 136 4. 0. IM
Not for any group was there a significant correlation between the teachers'self-evaluations and the rating of their instructors.
Table 11. SELF-EVALUATION - SATISFACTION WITH PRESENT POSITION
Groups N r d. f.Level of significance
.05 .01Elementary 36 .177 34 ___ .....Secondary 57 .152 55 _II me 00 .I
Special Education 45 .230 43 OP
Total 138 .188 136 .167 .219
It appeared that throughout the entire sample there was a small correlationsignificant at the .05 level between the teachers' feelings of success as an educa-
.tor and satisfaction with their jobs.
Table 12. SELF-EVALUATION - SATISFACTION WITH PRESENT LIFE STYLE
groups N r d. f.Level of significance
.05 .01ElementarySecondarySpecial EducationTotal N
365846
.107
.025
.026.002
345644
138
-- IM
-WO*
M m. No
m.140
21

-16-
There was no correlation between the way a teacher feels about his job ascompared to the way that life in the community affects him.
Table 13. SELF-EVALUATION - SATISFACTION WITH PREPARATION INFIELDS OTHER THAN TEACHER EDUCATION
Groups d. f.
Level of significance.05 .01
ElementarySecondarySpecial EducationTotal N
346044
.343
.221
.250
.260
325842
136
fin MI 4n MP
.225
.298
.33544. OP ea a.
.219138
Elementary teachers' and all teachers' self-evaluations correlated withtheir positive and negative feelings about their preparation at the .01 level. Therelationship for secondary and special education teachers reached the .05 level ofsignificance.
Table 14. RATINGS OF INSTRUCTORS AND SATISFACTION WITHPROFESSIONAL EDUCATION
Groups N r d. f.
Level of significance
.05 .01.430.320.393.219
ElementarySecondarySpecial EducationTotal N
356442
. 675
.335
.464
.467
336240
139141
nmeanomnnialinmw44.4nm.4nnwillnlINImoMnom
Facts presented here are easily assumed, ordinarily. Correlatious werehigher and more significant for this set of relationships than any other set.
There were significant correlations between the teachers' self-evaluationsand satisfaction with their education. Dr. Gaskill's study, referred to earlier,pointed out that eighty-eight percent of the teachers surveyed rated non-profes-sional courses adequate or better, and eighty-five percent rated professionaleducation courses adequate or better. Earlier, it was noted that the mean ofteacher self-evaluations was 5.182 -S.D. 1.04 for principals' ratings on OverallClassroom Effectiveness. It is possible that the teachers who returned question-naires to Dr. Gaskill were among the more confident of the larger group on whom
Dr. Wotring collected data.
22

-17-
In the final analysis, there appeared to be a significant correlation between
the teachers' self-images and their successes in college for this stratified sam-
pling of teachers.
Does the Grade Point Average predict success in teaching? It is a moreaccurate indication of teaching success than is the ACT score. There was a low
correlation between four of the items and the CPA. They were significant at .95,according to tables of Fisher and Yates in which significance at that level is reachedwith a correlation of .120 or better when N=191.
Table 15. SIGNIFICANT CORRELATIONS BETWEEN GPA ANDFOUR ITEMS OF EVALUATION
CPA and Item: Pearson_r
Overall Classroom Effectiveness 1764Professionalism .1655Communication Skills .2105Academic Preparation .1360
The highest of the four significant correlations between GPA's and each of
the eleven items was the correlation of the GPA's and Communication Skills.
However, a Chi-square analysis of the GPA's as predictors of teaching
success shows no relationship that can be verified statistically in this study.:4
...1.,,amMaNNOMMO
Tabk 16. CHI-SQUARE FOR CPA'S AND PRINCIPALS' EVALUATIONS OFTEACHERS (OVERALL CLASSROOM EFFECTIVENESS), ITEM SIX
Rating Scale 1 2 3 4 5 6 7
Upper 25th percentileLower 25th percentile
00
01
44
89
1620
2015
35
Chi-square = 2. 6339Chi-square .10 = 2.2Chi-square .25 = 3.5
.
It can only be said that any difference could be ascribed to chance.
The null hypothesis that there would be no significant difference between theupper quartile of GPA's and the lower quartile of GPA's as related to principals'
2 3

.;
-18-
evaluations of teachers on Overall Classroom Effectiveness could not be rejectedat the .05 level of significance.
Is one's American College Test score a predictor of teaching success? Theanswer was NO, according to the data in this study.
Statistics were used to approach the ,tiestion from two angles. With one hun-dred sixty-six degrees of freedom and interpoiotion of the Fisher and Yates tables,Pearson r at .95 reaches significance at .130. Seven of eleven items had negativecorrelations, and four were positive. The only item that ACT predicted was Aca-demic Preparation as observed by principals. The correlation was .15. The cor-relations of ACT's and the eleven items were:
Human Relations -.0016Planning and Organization -.0155Overall Classroom Effectiveness -.0191Management -.0352Motivation -.0443Methods and Materials -.0571Profes sionalism -.0613Evaluation .0314Communication Skills .0374Personal Qualities .1230Academic Preparation .1524
However, when the lowest quartile of ACT scores and the highest quartile of ACTscores for ninety-six of one hundred sixty-six teachers on whom we gathered datawere compared by CM-square with the principals' ratings of Overall ClassroomEffectiveness, it appeared that, to some extent, ACT might predict .hing effec-tiveness. This becomes apparent from the Chi-square table below.
Table 17.CHI-SQUARE FOR ACT SCORES AND OVERALL TEACHING EFFECTIVENESS
Rating Scale2 3 4 5 6 7 Totals
75%ile and above 0 0 4 8 11 18 4 47
25%ile and below 0 0 2 6 22 14 5 49
Totals 0- 0 6 14 33 32 9 96
CM-square for ACT = 8.5419CM-square .25 = 7.8 and .90 = 10.6

-19-
The null hypothesis that there will be no difference could not be rejected atthe .05 level. Any difference was attributed to chance. Observation of the factthat eighteen teachers who had ACT's above the 75%ile were rated six as comparedto the twenty-two teachers with ACT's below the 25%ile who were rated five seemedto indicate some slight trend toward acceptance of the idea that ACT scores mightpredict teaching success.
The conclusion is that the apparent relationship of grades and ACT's tosuccess in teaching can only be statistically attributed to chance, if determinedat the .05 level of significance. The relationship was only acceptable at the .25level, as was also true of the GPA's and teaching success.
So, the raw data for ACT scores and all eleven items was examined. Allratings of two or three (needs improvement) for one hundred sixty-six personswhose ACT's were available were tabulated. The list below shows that the areasof most problems were clearly indicated in items five, one, and four. The fewestproblems were in areas indicated in items eight, ten, seven, and nine.
.98% Ability to Manage a Classroom (5)
.78% Planning and Organization (1). 65% Ability to Evaluate pupils' progress and use
evaluations for future planning (4). 49% Motivation (3).49% Human Relations (11).38% Methods and Materials (2). 38% Overall Classroom Effectiveness (6). 32% Communication Skills (8). 32% Personal Qualities (10).27% Professionalism (7). 10% Academic Preparation
Table. 18 RAW DATA TABULATIONS OF PROBLEM AREAS BY ACT SCORES
Eleven Items 10
ProblemsTotals
11
ACT 24 and above 7 2 3 6 7 4 1 3 1 3 4 41 2.24ACT 19 to 23 5 4 2 4 6 1 2 2 1 1 3 31 1.69ACT 18 and below 2 1 4 2 5 2 2 1 0 2 2 23 1.25Problem Totals 14 7 9 12 18 7 5 6 2 6 9 95
% of Problem Totals .78 . 38 .49 .65 .98 .38 .27 .32 . 10 .32 .49 5. 18
N = 166 x 11 = 1826 Total number of problems
720-
Persons with ACT scores above twenty-four had almost twice as manyproblems as did those with ACT scores of eighteen and below. Their problemslay in three areas: Planning and Organization (item 1), Ability to Evaluate(item 4), and Classroom Management (item 5). However, it cannot be supportedstatistically that this is more than a chance arrangement. All three groups hadproblems in these areas, as did teachers in the entire sample.
Of the two hundred fifty-two teachers evaluated, approximately 5.2%were having serious problems during their third year of teaching. This meansthat only thirteen teachers were having problems.
CONCLUSIONS
Cooperation from the public school administrators was outstanding.Superintendents or their assistants responded with the names of teachers to beevaluated in their schools. Ninety-four and six-tenths percent of the principalsevaluated the teachers specified, and eighty-nine percent were usable in thestudy. About six percent of the evaluations arrived too late to be used.
Teachers prepared by Central Michigan University performed well intheir third year of teaching. The question "why?" could not be conclusivelyanswered in this study because of the limitations suggested in the early part.Some findings seemed only to indicate a few possible reasons.
The teachers sampled felt that they had an adequate education, which cor-related significantly with their feelings of success. Central Michigan Universitycannot, or course, claim all the credit. It must be recognized that C. M. U.attracts students from the lower-middle and middle class with all of their atten-dant values. Such teachers seem to be desired by school systems. No one knowswhether or not C. M.U. alters that value system, or even if it is desirable to doso.
For all teachers in the sample, the average mean was 5.266 which indi-cated slightly above overall performance when compared to a rating of five ashigh average. Very few teachers in any category were rated "unsatisfactory" or"needs improvement". This was not surprising when one considered that thesample was drawn from third-year teachers with a small exception. Only fivepercent were having serious problems. This amounted to thirteen of two hundredfifty-two teachers.
Teachers were not Judged much differently in rural, suburban, and urbanschools. For special education teachers there might be a difference, but thesample was too small to be able to make this observation.
26

-21-
Teachers were rated more highly on Peisonal Qualities, Human Relations,Professionalism, Academic Preparation, and Communication Skills than on teach-ing skills. This probably can be explained by what they brought to their teachingexperiences and any biases that the principals may have had in rating teachers.
Principals' biases may have been apparent in the low ratings given toEvaluation of Pupil Progress, Planning and Organization, and Classroom Manage-ment. Other skill factors of Motivation and use of Methods and Materials werecertainly related, but were not rated as low.
Should the School of Education give more attention to the low-rated areas,or treat them differently? Probably, they should be treated differently than isnow done.
Proof that principals can evaluate their teachers was evident. Meanscores of the item Overall Classroom Effectiveness, when rated by principals,agreed significantly with the way a sample of those teachers rated themselves.Principals' use of the evaluation instrument appeared to be highly consistent.
There seemed, then, to be ample proof that teachers prepared by CentralMichigan University did satisfactorily or better than average in their third yearof teaching, even though there was reason to believe that further attention mightbe given to the skill areas of Planning and Organization, Evaluation, and Class-room Management.
a.
On the item Overall Classroom Effectiveness, which proved to be a satis-factory indicator, nearly forty percent were rated six or seven, the highestevaluations. Seventy-six and four-tenths percent were rated five, six, andseven, indicating average and above performance. Twenty-three and six-tenthspercent were rated four and below, and only six percent showed need for improve-ment.
CONCLUSION FOR AREAS RELATED TO THE BASIC STUDY
Two related areas to the basic question of success in teaching as evalu-ated by principals of third-year teachers were given attention:
1. How do teachers feel about their teaching ability andtheir education?
2. Are the American College Test scores and the GradePoint Average predictors of teaching success?
27

-22-
How do the teachers sampled feel about their success in teaching as relatedto their education? There is a significant correlation between the self-evaluationsand both the preparation in fields other than teaching and in teacher education.Correlation is highest between instructors and professional education courses,but there is no significant correlation between self-evaluations and ratings of in-structors. Perhaps this is similar to saying that third-year teachers who wereprepared at Central Michigan University attribute their success in teaching totheir own efforts. How many of these teachers improved because of in-serviceeducation, help from principals, department heads, and colleagues is not known.
American College Test scores and Grade Point Averages did not predictteaching success. However, there was some indication in this study that somesmall relationship might exist. One might speculate that diligence is a biggerfactor and, in itself, affects both the ACT and GPA.
A tabulation of raw data was of interest. This analysis showed that peoplewith high ACT scores had twice as many problems as those with low ACT scores.Again, we can only speculate that those with low scores found it necessary to do abetter Job of Planning and Organization, Evaluation, and Management. It must alsobe admitted that these areas were viewed by principals as the weakest for allteachers studied.
Grade Point Averages predicted more areas of success than did ACT scores.GPA correlated significantly with Overall Classroom Effectiveness, Professionalism,Communication Skills and Academic.Preparation, and ACT correlated significantlyonly with Academic Preparation. A Chi-square analysis showed, however, that anysignificant differences between the upper and lower quartiles was probably becauseof chance.
IMPLICATIONS
It seems obvious that some different kind of education in the areas of Planningand Organization, Evaluation, and Management may be in order if the possibility ofthe principals' biases are ruled out. Could more attention be given to simulationtactics in attacking this problem? Should instructors of supervising teachers placegreater emphasis upon such tactics in their courses for those teachers? These arepossibilities .
Readings from John Holt, Charles Silberman, and a host of other writers inthe field of education would indicate that there are problems nationwide in classroommanagement. If this is indeed one of the weaknesses in preparation at Central Michi-gan University, further consideration should be given to the problem. Again, withthe current staff at C. M.U. , simulation would seem to be the method through whichto approach the problem.

-23-
In all fairness, teachers surveyed in this study rated highest in PersonalQualities, Human Relations, and Professionalism. There may be less need toattend to these areas. The teacher's self-concept is not the only factor relatedto classroom management. Such factors as consistency in teacher behavior andthe abilities to motivate, plan, organize, and evaluate are all important to themanagement of a classroom. Some attention should probably be given to what isactually done by college professors in teaching these spec!fied skills.
FOR FURTHER STUDY
Before some of the problems can actually be attacked, much has to be known.Further study will be needed to uncover what these areas are.
Questions to be answered certainly include:
I. Who drops out of teaching'? When and Why?2. What are the criteria for a good teacher?3. How can success in teaching be predicted?4. What should the emphasis be in teacher education:
personality development or teaching skills?5. What teaching skills should be taught in the School of
Education as opposed to those which should be taughtin other schools of the University?
6. How do problems differ for first-year, second-year,and third-year teachers?
7. What is the University's responsthility for packagingin-service education programs for improvement ofteaching during the first year?
Opportunities for research are numerous.
In this study, there was little solid evidence that GPA's and ACT scores arerelated to teaching success or lack of it. If, indeed, people with high ACT scoresfeel that they can rely on their intelligence more than on careful planning to teach,this should be proven. Does careful planning help the learner to compensate anddo a satisfactory job of teaching? Very simple reasoning and a little educator biaswould say yin. Perhaps college instructors must be more candid in pointing outthe possibility to classes and to individuals. The game the more intelligent areable to play in college is either promoted by instructors through their attitudestoward scholarship and grades, or is a reaction to students who challenge them.It might also be that instructors or colleges have never really decided what thebalance should be between the acquisition of knowledge and the development of skills.

-24-
In this era, it would seem that they are equally important, and some attentionshould be given to them as a problem facing educators. This could mean clas-sification of the goals of the School of Education to make this as specific as be-havioral criteria for teachers.
Secondly, the skills of planning, evaluating, and managing learning activitiesfor students must be given consideration. Since the discussion is on nirther re-search, what is the possibility of building courses around these problems in sucha way that college students are involved in the process. Behavioral criteria couldbe written for the courses and subjected to use in a control group of "traditional"supervising teachers and an experimental group of supervising teachers who wouldagree to specified ways in which students were involved. It would be an experimentbetween emphasis on cognitive development and total behavior development, withthe newly certified teachers followed-up during the first year.
One aspect of this second problem might well be the extension of the experi-ment to the new full-semester programs. The questions to be dealt with are: Areplanning, evaluating, and managing learned better during student teaching than inthe college classroom? Should the School of Education's regular classes deal onlywith the cognitive aspects? How are supervising teachers involved, and to whatextent should they be involved in helping student teachers learn these skills? Inthe present educational system, student teachers are expected to bring someexpertise to the classrooms where they are learning these skills.
The final aspect deals with simulation. To what extent is it effective? Tothe behaviorist, this is not a question. It is more effective than a pure cognitiveapproach. Perhaps more planned study should be initiated by the School of Educa-tion to involve instructors in developing or purchasing simulated materials andprojects.
According to this study, it seems that evaluation by the first six of the be-havioral criteria could be used to accurately examine the skills of teaching. If anyform of this type is to be used in further study, the six items should be subdividedinto fifteen specific items for the first five, and the sixth left to check for consistency.
In the final analysis, it would appear that changes in the teaching of theSchool of Education should be based on research which affects Central MichiganUniversity students, teachers who are certified, and college instructors. Furtherstudies should be done by matched pairs of teachers surveyed and principals' evalu-ations of teachers based on behavioral criteria such as were used in this study.
30

APPENDIX A
CENTRAL MICHIGAN UNIVERSITYEVALUATION OF TEACHERS CERTIFIED
IN 1968, 1969 AND 1970
The School of Education is attempting through this study to evaluate some ofits graduates in teacher education for the years 1963, 1969 and 1970 and toset the stage for further evaluation studies.
As an administrator, you fully understand the importance of evaluation tocontinuing improvement of the teaching-learning process. We believe theprocess should be mutually beneficial: if we can find ways to produce betterteachers, the children of your communities benefit.
Our part is to try to produce the best teachers. To do this we must evaluateour product. Since it is almost impossible for us to visit all of our graduatesin any one year, we greatly appreciate your evaluation of our product.
The items selected for evaluation were determined by 20 supervising teachersfrom the Thumb Area and verified for their content validity by 18 other super-vising teachers from the Mount Pleasant Area. Also, the items are thosemost often found on teacher evaluation forms.
Observers will note that the criteria are described in behavioral terms, i.e.,the descriptions are of observable behavior of teachers. It should be possiblefor the observer to evaluate on the basis of what he sees the teacher doing.
Instead of a teacher's name each evaluation will bear a number, but it will have
a name clipped to it. Therefore, you will be able to explain to the teacher thathe will not be identified. Our purpose is not to judge an individual, but to obtaina composite picture of areas in which we succeed and fail in education of teachers.Anonymity of observers and teachers will be protected. When you have com-pleted the evaluation form, please remove the name clipped to it and mail in theenclosed envelope.

TEACHER OBSERVED 0670number only
Grade level or subject and grade level
Directions: Below are descriptions of optimum teacher behavior to be considered in your eval-uation of each item. Circle the number at the right which indicates the degree of accomplish-ment. The following numbers mean:
1. unacceptable teacher behavior2. needs much improvement3. needs some improvement4 and5. degrees of acceptable teacher behavior6. better than acceptable teacher behavior7. outstanding teacher behavior
CLASSROOM EFFECTIVENESSPlanning and organization: He consistently uses and implements both longand short range plans. He incorporates the use of behavioral objectivesreflecting the ability and needs of pupils. He involves pupils in planning.He is flexible in using plans, being willing and able to deviate. The timingand sequence of activities reflect his concern for the use of class time.
Methods and materials: He selects a variety of methods and materialswhich are appropriate and relevant to pupil levels and current societal needs.He accepts and uies pupil ideas in classroom interaction.
Motivation: He considers the individual needs of pupils in selecting learningactivities and materials. He uses clear illustrations, practical applications,challenging questions and problems. He is personally -interested and enthu-siastic in his teaching. He establishes high expectancy levels with alllearners. He applies basic principles of learning theory.
Evaluation: He uses oral, written and student self-evaluation for measuringthe achievement of stated objectives. He uses evaluative data for planningfuture learning activities and as positive assessment of pupil needs. He main-tains accurate documentation of evaluative data. Pupils feel that he is fairand consistent in evaluation.
Management: His students appear to be most self-directed. There is a cli-mate of cooperation in which learning occurs and few disciplinary problemsexist. Students feel that he is tactful and fair with both individuals and groups.His classroom practices are consistent with school policy. He displayscommon sense awareness of good human relations.
1234567
1234567
_14
1234567
1234567
1234567
Overall classroom effectiveness: Achievement of his students is at the levelof expectation of his own and the school's objectives. 1234567
-2-

PROFESSIONALISMHe knows and behaves in compliance with the teacher code of ethics. He par-ticipates in professional meetings and demonstrates interest in professionalgrowth as evidenced by continued reading and study. He is alert to the needfor school policies as evidenced by being able to interpret school pollcies ac-curately to others. He has a cooperative attitude toward implementing pol-icies and turning in reports on time. He is knowledgeable regarding the or-ganization, the structure, and the function of the professional association,and the school as a social institution.
COMMUNICATION SKILLSOral: His voice is clear and pleasant as evidenced by varied inflection,good modulation, and rate. He is effective in giving clear direction as evi-denced by pupils not needing to ask for more direction. Presentations areinteresting as evidenced by pupil attention and participation. He practicesgood grammatical skills, speaks without serious impairment, and his lan-guage level is appropriate to the level of pupils' understanding as evidencedby their enthusiastic participation.Written: His written material is accurate in spelling, legible, grammaticallycorrect, clear and concise in meaning, and appropriate to the level of pupils'or adults' understanding as required.Graphic: He supplements oral and written communication with visualreinforcements such as: illustrations, charts, and audio-visual aids.
ACADEMIC PREPARATIONGeneral knowledge: He is well read and knowledgeable as evidenced by hisbeing interested in and conversant about a wide range of subjects.Subject matter: He is well prepared, displaying an in-depth knowledge andunderstanding of his teaching field as shown by his ease in discussing andusing content in organizing instructional materials. He utilizes contempo-rary subject material. He is competent in locating necessary and appropriateinstructional materials.
PERSONAL QUALITIESSelf concept/mental health: These are demonstrated by his practicing con-structive self criticism, by his accepting criticism, showing initiative anddependability by taking up problems and completing tasks independently. Heis punctual. He accepts students' values and feelings. He has the ability tolaugh at himself and encourages wit not sarcasm.Appearance: His grooming and attire are appropriate to the occasion.Health: His physical health permits him to comply with the leave days allowedin the master contract.
HUMAN RELATIONSHe has mutually satisfying relationships as evidenced by his being acceptedby students, teachers, administration, staff and community. He gainsgroup confidence as demonstrated by his accepting students and others withdifferent abilities, attitudes, feelings and needs. He uses positive state-ments in his interaction with students and others.
-3- 33
1234567
1234567
123456';
1234567
1234567

Dear Observer:
Having served as administrators, we do understand ho* busyyou are. We also know how concerned you are for havingthe best teachers to teach the children in your community.We trust that the results of this study, which is encouragedby the Dean of the School of Education, Dr. Curtis E. Nash,and done under the auspices of the Bureau of School Servicesheaded by Dr. A. R. Gaskill, will prove mutually beneficial.as we try to improve our programs of teacher education.
We do greatly appreciate your helping us with this study.
Sincerely,
Dr. C. Jarvis WotringCoordinator of the Study

APPENDIX B FACTOR ANALYSIS
Matrix (Three Factors)Rotated Factor
Variable 1 .73289 .35690 .29418
Variable 2 .72156 .29674 . 33367
Variable 3 .77471 .30197 .25785
Variable 4 .74218 .18194 .31394
Variable 5 .70391 .41587 . 18882
Variable 6 .79075 . 34496 .28786
Variable 7 .34916 .77962 . 16618
Variable 8 .36733 .29074 .78232
Variable 9 .37673 .30292 .77079
Variable 10 .26844 . 82557 .29562
Variable 11 .35276 .78761 .28651
(The cut-off point for inclusion in each factor was .70.)
Factor IVariable
1
23456
Factor IIVariable
71011
Factor IIIVariable
89
Skills Fattors
Planning and OrganizationMethods and OrganizationMotivationEvaluationManagementOverall Classroom Effectiveness
Personal Factors
ProfessionalismPersonal QualitiesHuman Relations
Academic Factors
Communication SkillsAcademic Preparation

APPENDIX C CHI-SQUARE ANALYSIS
1,Ho: There will be no significant difference between the principals' evaluations ofteachers in the upper quartile of GPA's and principals' evaluations of teachers inthe lower quartile of GPA's.
1 2 3 4 5 6 7
Below 2.34 0 1 3 9 19 13 4 49Above 2.75 0 0 4 7 16 19 3 49
0 1 7 16 35 32 7 98
(0-E)2Below 0 E O-E (0-E)2
1 0 0 0 02 1 .5 .5 .25 .50003 3 3.5 .5 .25 .71424 9 8.0 1.0 1.0 .12505 19 17.5 1.5 2.25 .12856 13 16.0 3.0 9.00 .56257 4 3.5 .5 .25 .7142
2.7444
Above ..
1 0 0 0 0 .00002 0 0 0 0 .00003 4 3.5 .5 .25 .71424 7 8.0 1.0 1.0 .12505 16 17.5 1.5 2.25 .12856 19 16.0 3.0 9.00 .56257 3 3.5 .5 .25 .7142
2.24444.9888
d. f. (R-1) (C-1) = 1 x 6 = 6
CM-square .50 = 5.35 and .70 = 3.83Ho accepted.
36
41.
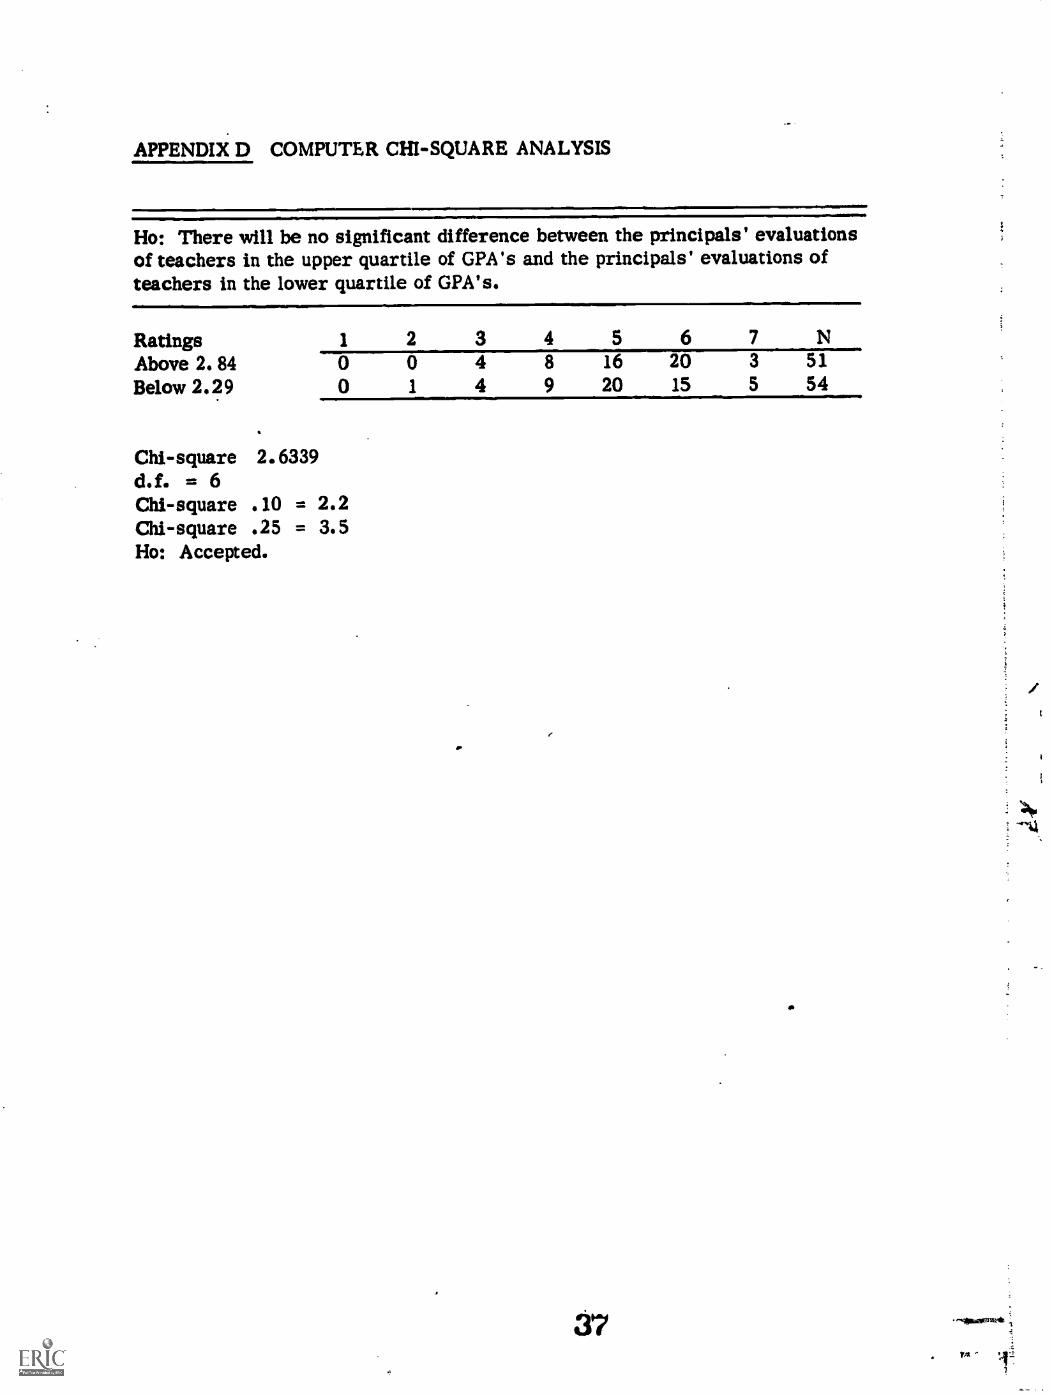
APPENDIX D COMPUTER CHI-SQUARE ANALYSIS
Ho: There will be no significant difference between the principals' evaluationsof teachers in the upper quartile of CPA's and the principals' evaluations ofteachers in the lower quartile of GPA's.
RatingsAbove 2.84Below 2. 29
Chi-squared.f. = 6Chi-squareChi-square
1 3 4 5 6 7 N00 1
44
89
1620
2015
3
5
5154
2.6339
.10 = 2.2
.25 = 3.5Ho: Accepted.