


Languages
Pages
Legal

DOI: 10.1161/CIRCGENETICS.114.000804
1
DNA Methylation of Lipid-Related Genes Affects Blood Lipid Levels
Running title: Pfeiffer et al.; genome-wide DNA methylation and blood lipid levels
Liliane Pfeifferm, MSc1,2; Simone Wahl, MSc1-3; Luke C. Pilling, MSc4; Eva Reischl, PhD1,2; Johanna K. Sandling, PhD5,6; Sonja Kunze, PhD1,2; Lesca M. Holdt, MD, PhD7; Anja
Kretschmer, PhD1,2,8; Katharina Schramm, PhD9,10; Jerzy Adamski, PhD11; Norman Klopp, PhD12; Thomas Illig, PhD12; Åsa K. Hedman, PhD13,14; Michael Roden, MD, PhD15-17; Dena G. Hernandez, MSc18; Andrew B. Singleton, PhD18; Wolfgang E. Thasler, MD19; Harald Grallert,
PhD1-3; Christian Gieger, PhD20; Christian Herder, PhD15,16; Daniel Teupser, MD7; Christa Meisinger, MD2; Timothy D. Spector, MD, FRCP21; Florian Kronenberg, MD22; Holger
Prokisch, PhD9,10; David Melzer, MBBCh, PhD4; Annette Peters PhD1,2,23; Panos Deloukas, PhD5,24,25; Luigi Ferrucci, MD, PhD26; Melanie Waldenberger, PhD1,2
1Rsrch Unit of Molecular Epidemiology, 2Inst of Epidemiology II, 9Inst of Human Genetics, 11Genome Analysis Ctr, Inst of Experimental Genetics, 20Inst of Genetic Epidemiology, Helmholtz Zentrum München, German Rsrch Ctr for Environmental Health; 3German Ctr for Diabetes Rsrch (DZD), Neuherberg, Germany; 4Epidemiology & Public Health Group, Univ of Exeter Medical School, Exeter; 5Wellcome Trust Sanger Inst, Wellcome Trust Genome Campus, Hinxton, UK; 6Present: Dept of Medical Sciences, Molecular Medicine & Science for Life Laboratory,
14Present: Dept of Medical Sciences, Molecular Epidemiology & Science for Life Laboratory, Uppsala Univ, Uppsala, Sweden; 7Inst of Laboratory Medicine, Univ Hospital Munich & Ludwig Maximilians Univ Munich, Munich; 8Dept of Dermatology, Venereology & Allergy,
Christian Albrechts Univ Kiel, Kiel; 10Inst of Human Genetics, Technical Univ Munich, Munich; 12Hannover Unified Biobank, Hannover Medical School, Hannover, Germany; 13Wellcome Trust Ctr for Human Genetics, Univ of Oxford, Oxford, UK; 15German Ctr for Diabetes Rsrch (DZD); 16Inst for Clinical Diabetology, German Diabetes Ctr, Leibniz Ctr for Diabetes Rsrch at Heinrich Heine Univ; 17Dept of Endocrinology &
Diabetology, Univ Hospital, Düsseldorf, Germany; 18Laboratory of Neurogenetics, Nat Inst on Aging, NIH, Bethesda, MD; 19Biobank under Administration of HTCR, Dept of General, Visceral, Transplantation, Vascular & Thoracic Surgery, Hospital of the Univ of Munich, Munich, Germany; 21Dept of Twin Rsrch & Genetic Epidemiology, King’s College London, London, UK; 22Division of Genetic Epidemiology, Dept of
Medical Genetics, Molecular & Clinical Pharmacology, Medical Univ of Innsbruck, Innsbruck, Austria; 23German Rsrch Ctr for Cardiovascular Disease (DZHK), Partner-site Munich, Germany; 24William Harvey Rsrch Inst, Barts & The London School of Medicine & Dentistry, Queen
Mary Univ of London, London, UK; 25Princess Al-Jawhara Al-Brahim Ctr of Excellence in Rsrch of Hereditary Disorders (PACER-HD), King Abdulaziz Univ, Jeddah, Saudi Arabia; 26Clinical Rsrch Branch, Nat Inst on Aging, Baltimore, MD
Correspondence:
Melanie Waldenberger PhD
Research Unit of Molecular Epidemiology & Institute of Epidemiology II
Helmholtz Zentrum München, Ingolstaedter Landstraße 1
D-85764 Neuherberg, Germany
Tel: +49-89-3187-1270
Fax: +49-89-3187-4567
E-mail: [email protected]
Journal Subject Codes: [135] Risk factors, [142] Gene expression, [90] Lipid and lipoprotein metabolism, [8] Epidemiology
hDDDD1,2,23;;; Paaaanonnn s DeDeDeDelolololouuukubebbb rgerererer, , , , PhPhPhPhDDDD11,1,1 2222
of Molecular Epidemiology, Inst of Epidemiology II Inst of Human Genetics Genome Analysis Ctr Inst of ExperimoN s
bD ne Ab n
er iU kn Mpc gy o
of Molecuuculalaar r r Eppppididi emmioioology, Inst of Epidemiology II, Inst of HHuman Genetics, Genomememe Analysis Ctr, Inst of Experimof GGGGenenenetetiiic Epipipidedd mmmiololologogogy, Helmholtz Zentrum München, Germamman Rsrch Ctr for EnEnvironmnmmental Health; 3German Ctr for Neuuuheeeerberg, Gerrmmmmanyyy;;;; 4Epidememememioioiololl gy & & && PuPPP blic Health Groupp, UUniv ofoffof EEEExexxx ter MeMeMeM dical ScSccSchool, ExExExExetetetere ; 5Wellllllcocc mememee Trus
TTrussst Genome Camppusss, HiHinxxxtotton,n UUUKKKK; 66Prrrresene tttt: DDept oof f Meddical Sccieenceees, Mooleccular MeeMediciinenene & ScSccieieiencee e fooorr r LiLiifefefe LabDepppt ooofo Medical Sciennceees, MMollleculaaara EEEpidemiolooogyy & SSSciiencee fofor Lifefee LLLLabababa ooratoooryy, Upppsaaala UnUnUnniv, Upppppsaala a, Swwwedeeen;; 7Inedicicicinnnne,ee Univ Hoospss itaal MMMunichhh & LLuLuLudwdwdwig MMMaxa immmiiliansss UUniv MuMuMunichchchc ,, Muunich; 88DDDept off DDDermmatttology,,, VVeVV neeereeeologggy & Abrechthththtssss UnUnUnnivivviv KiKiKiKielelele , KiKiKiel;;;; 10InInInst ofofoof Humumumumannn GGGGeene eticicccs, TTTTecececechnnnicicicalalalal Uninininivv MuMuMuMuninininichchchc , MuMuMuM ninn chchchch;;;; 12HaHaHaH nnnnnnnnovvvverererer UUUUnininiififififieed BBBBiobababbanknknkk, HaHaHanHannover, Germany; 13WeWW llcome Trust Ctr for Human Genetics, Univ off OOxford, Oxford,,,, UK; 15German Ctr for Diabe
r Clinical Diabetologyyyy, GeGeGermrmrmmananana DDDiaiaiaiabebbeteteessss CCCCttttr,r,r,r, LLLLeieieieibnbnbniziziziz CCCCtttr rr fofoforrr DiDiDiababababetetete esee RRRRssssrccch h h atatatat HHHeieieiinrnrnrnricicici hh h HeHeHeH innne eee UnUnUnUniv; 17Dept of EndocriUniv Hospital, Düsselldodododorfrfrfr , GeGeGeGermrmmananananyyy;;; 18888LaLaLaLaboboborararaatotototoryryry oooofff NeNeNeN urururrogogogenenneteteteticicicicss, Naaaattt InInInstststst onononon AAAgigigigingngngn , NNNNIHIHIHH, , BeBeBeBethththt esda, MD; 19Biobankn ooofff HTHTHTCRCRCR,,, DeDeDepppttt ofofof GGGenenenerereralalal,,, ViViViscscscerereralalal,,, TrTrTranananspspsplalalantntntatatatioioion,n,n, VVVasasascucuculalalarrr &&& ThThThorororacacacicicic SSSurururgegegeryryry,,, HoHoHospspspitititalalal ooofff thththeee UnUnUniviviv ofofof MMMunununicicich,h,h, Mpppt of Twin Rsrcch hh h & &&& GeGeeGenenenenetititic c c c EpEEpE idddememememioiioiololoologygygygy, KiKK ngngngng’sss CCCColololollelelegegeege LLLLononondodododon,, LLLLonononondododon,n,n, UUUUKKK;;; 22222 DiDDiDiviviviisisisisiononnon ooof f ff GeGeGGeneneneetitititic c c c EpEE idemiology,csccs,, MoMolelelecuculalalarr && ClClClinininicicicalalal PPhahaharmrmacacololologogy,y, MMedededicicicalalal UUnininivv ofofof IInnnnsbsbsbruruckckck,, InInnsnsbrbrbrucuck,k,k, AAusustrtriaiaia;; 23232323GeGermrmanan RRssrcrchhh CCtttrr fofoforr CaCardrdrdioioio

DOI: 10.1161/CIRCGENETICS.114.000804
2
Abstract:
Background - Epigenetic mechanisms might be involved in the regulation of inter-individual
lipid level variability and thus may contribute to the cardiovascular risk profile. The aim of this
study was to investigate the association between genome-wide DNA methylation and blood lipid
levels HDL-C, LDL-C, triglycerides (TG) and total cholesterol (TC). Observed DNA
methylation changes were further analyzed to also examine their relationship with previous
hospitalized myocardial infarction.
Methods and Results - Genome-wide DNA methylation patterns were determined in whole
blood samples of 1776 subjects of the KORA F4 cohort using the Infinium
HumanMethylation450 BeadChip (Illumina). Ten novel lipid-related CpG sites (CpGs)
annotated to various genes including ABCG1, MIR33B/SREBF1 and TNIP1 were identified. CpG
cg06500161, located in ABCG1, was associated in opposite directions with both HDL-C
coefficient=-0.049, p=8.26E- =0.070, p=1.21E-27). Eight associations
were confirmed by replication in KORA F3 (N=499) and InCHIANTI (N=472). Associations
between TG levels and SREBF1 and ABCG1 were also found in adipose tissue of the MuTHER
cohort (N=634). Expression analysis revealed an association between ABCG1 methylation and
lipid levels that might be partly mediated by ABCG1 expression. DNA methylation of ABCG1
might also play a role in previous hospitalized myocardial infarction (odds ratio 1.15,
95%CI=1.06-1.25).
Conclusions - Epigenetic modifications of the newly identified loci might regulate disturbed
blood lipid levels and thus contribute to the development of complex lipid-related diseases.
Key words: epidemiology, epigenetics, gene expression, genetic epidemiology, lipids and lipoproteins, Illumina 450K, ABCG1, expression, EWAS, myocardial infarction
CpCpCpCpGGG G sisisisitetetetessss (C(C(C(CpGpGpGpGsss)s)
TNIP111 wewewewerererere iiiidedededentntntntififififieieii d
e n
r o
G H
6
that might p y y p y C
1, lolololocacacatteteted dd inininin ABABABABCG1, was associated in oopoppposite directions s wiwww th both HDL-C
ennnt===-0.049, p==8.8 2666E-E-EE- ===0.000707070, pp=1.111 212121EEE-2227).).). EiEEiE ghghghhttt asasassosoociciciiatatation
rmmmedededed by replplplpliccatttionn iiin KOKOKOK RARARA FFF3333 (N(N(N=4==499) annndd d InCHCC IAIAIANTTI (NNN=4=4=4=472).).).). AAsssssociaiiatio
G levels and SRRREBEEBF1 aaandndnd ABCGGG1 wweree e alaalsoso fouo ndndn in adadippppososse e e tissssssueu of the MuTH
634)). Exprpp ession analyly iisis reveallll dedd an asso iiciiation bbeb tween ABABABA CGCGCGCG1 methyly ation
tthahahatt mimimighghghtt bebebeb pparartltltllyy memedididiatattededed bbbbyy ABABABA CGCGCGG1111 exexprpresessisisionon.. DNDNDNNA AAA memeththththylylylatattioioioi nn ofofof ABABABCCC
DOI: 10.1161/CIRCGENETICS.114.000804
3
Introduction
Coronary artery disease (CAD) is a major cause of death in industrialized countries1. Blood lipid
levels, including high-density lipoprotein cholesterol (HDL-C), low-density lipoprotein
cholesterol (LDL-C), triglycerides (TG) and total cholesterol (TC) levels, are considered
heritable, modifiable risk factors for this disease2.
Lipid levels can be influenced by drug therapy or lifestyle factors such as diet, physical
activity, alcohol consumption and smoking3. Several studies have also revealed a genetic impact
on disturbed blood lipid levels. Genome-wide association studies identified a total of 157 genetic
loci associated with lipid levels, explaining up to 12% of trait variance4. Beyond this there is
evidence that epigenetic mechanisms are also involved in inter-individual lipid level variability
and thus may contribute to the cardiovascular risk profile. One epigenome-wide analysis in
patients with familial hypercholesterolemia identified TNNT1 DNA methylation levels to be
associated with HDL-C levels5. Another epigenome-wide analysis in a non-population-based
cohort observed an association between CPT1A DNA methylation levels and very low density
lipoprotein cholesterol (VLDL-C) as well as TG levels6.
The aim of this study was to systematically investigate the association between main
blood lipid levels (HDL-C, LDL-C, TG, TC) and genome-wide DNA methylation in whole
blood of a large population-based cohort as well as in adipose tissue and skin samples. The
identified associations were further explored through expression and functional studies and by
investigation of genetic confounding. Finally, the relationship between observed DNA
methylation changes and previous hospitalized myocardial infarction (MI) was explored.
Methods
The KORA study (Cooperative health research in the Region of Augsburg) consists of
tified a total of 15757577 g
e4. Beyoyy ddndd tttthihihihis thhhherererereee
h b
a n
t b
w e
er ed an association bet een CPT1A DNA meth lation le els and er lo dens
hat epepepigigiggenenenetetteticiii mmmechanisms are also invollllvvved in inter-individididduuual lipid level variab
ayyyy ccccontribute totoo thee cccardididid ovasssccullaar riiiskk prorofileee. OnOnOO ee eeepigenonoomemem ---widededede aaanananalllyl siiiis in
th famiimimililililialalal hypypererchchh llololese terororolelelelemia idididenenenentititififififiededd TNTNTNT NTNTNTNT111 DNDDNDNAAAA memeththththyllllatatatatioioion lelel vevelslsl tttoo b
with HDL-C levelsll 5555. AnAA othehhh r epppigigi enome-wiiiideddd analyly iisis in a non-pppopppulation-base
dd iia iti bbet CPCPT1T1AA DDNANA ethh lla iti ll lel dd ll dd
DOI: 10.1161/CIRCGENETICS.114.000804
4
independent population-based samples from the general population living in the region of
Augsburg, Southern Germany. The study has been conducted according to the principles
expressed in the Declaration of Helsinki. Written informed consent has been given by each
participant. The study was reviewed and approved by the local ethical committee (Bayerische
Landesärztekammer). For the analysis, whole blood samples of the KORA F4 study were used
(N=1776). The replication was done in whole blood samples of KORA F3 (N=499) and
InCHIANTI (N=472), as well as in human adipose (N=634) and skin (N=395) samples of the
Multiple Tissue Human Expression Resource (MuTHER) study. In the discovery and in the
replication cohorts genome-wide DNA methylation patterns were analyzed using the Infinium
HumanMethylation450 BeadChip Array (Illumina). In KORA F4 and InCHIANTI the analysis
was performed using whole blood DNA of fasting participants; in KORA F3 non-fasting
participants were also included. In KORA blood was drawn in the morning (8 – 10.30 am) and
stored at -80°C until analysis. Beta-mixture quantile normalization (BMIQ)7 was applied to the
DNA methylation data using the R package wateRmelon, version 1.0.38. Suppl. Table 1 provides
a summary of normalized beta values of the identified lipid related CpGs in KORA F4. KORA
F4/F3 samples were processed on 20/7 96-well plates in 9/4 batches; plate and batch effects were
investigated using principle component analysis and eigenR2 analysis9. The plate variable
explained 4.8% (F4), 6.3% (F3) and 8.1% (InCHIANTI) of variance in the DNA methylation
data. Consequently, plate was included as a random effect in the analyses.
Lipid levels were determined in fasting fresh blood samples at most six hours after
collection, except for KORA F3 which also includes non-fasting samples. In KORA F3 and F4
TC was measured using the cholesterol-esterase method (CHOL Flex, Dade-Behring, Germany).
HDL-C and TG levels were determined using the TGL Flex and AHDL Flex methods (Dade-
e discoveryy and in nn n ththththe
lyzedddd u isiiing tttthhhhe Infnfnfnfininininid
t l
m
s
o
lation data sing the R package ateRmelon ersion 1 0 38 S ppl Table 1 pro
thyyyylalalalatititiononon4545450 000 BeBeBeadChip Array (Illumina).))) InInIIn KORA F4 anddd IIIInCHIANTI the anal
mmmem ddd using whololole blooood d DNDDD AAAA ofof fafafastiiingg parrticccipipipanananantss; ininn KORORORA AA FFF3F noooonnn-fffasstinnngg
s wererere aaaalslslsl o innclcll dududededd. InII KKKORORORORA blblblb ooooood ddd wawass ddrdrd awawawwnnnn ininin thehehe mmoror iinining ((((888 – 1000 333.30 00 amam)
0°C until analysyy iisii . BBBeta-miiiixture quqq antiiiillle normaliiiiza iitiion ((((BMBMMIQIQIQIQ))))777 was apppppplied to
llatiio ddata iin hth RR kck teRR llo isi 11 00 3388 SS ll TT bablle 11

DOI: 10.1161/CIRCGENETICS.114.000804
5
Behring, Germany), respectively, and LDL-C was measured by a direct method (ALDL, Dade-
Behring, Germany). In KORA F4/F3 the intra-assay coefficient of variation (CV) for repeated
measurements was 1.85%/1.61% (TC), 2.75%/2.65% (TG), 3.25%/2.89% (HDL-C) and
2.7%/3.02% (LDL-C). In InCHIANTI TC was determined by the cholesterol-esterase method,
HDL-C was measured with the Liquid Homogeneous HDL-C assay (Alifax S.p.A., Padova,
Italy), and TG through an enzymatic colorimetric test using lipoprotein lipase, glycerokinase,
glycerol phosphate oxidase and peroxidase. All three lipids were determined using the analyzer
Modular P800 Hitachi (Roche Diagnostics, Mannheim, Germany). The intra-assay CV was 0.8%
(TC), 1.5% (TG) and 0.8% (HDL-C). The level of LDL-C was calculated using the Friedewald
formula (LDL-C=TC-[HDL-C+(TG/5)]).
Detailed information about the cohorts, the process of DNA methylation analysis as well
as data preprocessing, quality assessment and further methods such as genotyping and gene
expression are provided in the supplemental material.
Statistical analysis
Discovery step
In the KORA F4 cohort, 26 of 1802 individuals were excluded from the analysis due to missing
information in covariates or due to non-fasting status at the time point of blood collection,
resulting in a final sample size of 1776 F4 subjects. Associations between DNA methylation beta
values and lipid levels were analyzed using linear mixed effects models implemented with the
nlme package in R with lipid levels as response. To normalize lipid levels, square root (TC and
LDL-C) and logarithmic (HDL-C and TG) transformations were applied, followed by
standardization to a mean of zero and a standard deviation of one. The following potential
confounders were included as covariates: age, sex, body mass index, smoking, alcohol
e intra-assay CV wwwwasaaa
ated u iisiing ththththe FFrFF ieieieiededededew
D
ailed information about the cohorts, the process of DNA met lation ana sis as
processing, quality assessment and further methods such as genotyping and gene
l i
DL---C=C=C=C TCTCTCT -[H[[ DLDDD -C+(TG/5)]).
aiili eeed informattiooon aabbobob utttt ttthheh cccooho oroorts, thtthe pproocesess ofofof DNANN mmeeethyhyylllal tionnnn anananalllyl siiiis as
proceesssssssinininingg, qquaualilililitytyty aassssessmmmmeeeent annnddd fufufufu trtrthehehh rr memethththhodododsss suuchhchch aass gegegenotytytytypipipiingg aa dndnd ggenene
are ppprovided in thheh suppppllplementall l mate iirialll.
ll ii
DOI: 10.1161/CIRCGENETICS.114.000804
6
consumption, intake of lipid-lowering drugs, physical activity, history of myocardial infarction,
current hypertension, HbA1c levels, C-reactive protein levels and white blood cell count.
Experimental plate was included as a random effect. To correct for multiple comparisons, a
genome-wide significance level of 1.1E-07 was used, determined according to the Bonferroni
procedure. Since whole blood DNA samples were used, cell heterogeneity had to be considered
as a confounder. As no measured cell count information was available for any cohort, sample-
specific estimates of the proportion of the major white blood cell types were obtained using a
statistical method described by Houseman et al.10. The significant associations of the first model
were recalculated, additionally adjusting for the estimated white blood cell proportions (CD8 T-
cells, CD4 T-cells, natural killer cells, B-lymphocytes, monocytes and granulocytes). To get a
measure of the variance in the lipid levels explained by methylation levels, R2 statistics were
calculated according to Edwards et al.11, using the R package pbkrtest, version 0.3-7.
Replication step
Identified loci were replicated using the same statistical model in KORA F3 (N=499) as well as
in InCHIANTI (N=472). In KORA F3 an adjustment for C-reactive protein was not possible
since this variable was not available for this cohort. A fixed-effects meta-analysis of KORA F3
and InCHIANTI results was conducted with the R package metafor, version 1.9-2. Results were
corrected according to the Bonferroni procedure (level of significance=4.5E-03).
For the MuTHER cohort the Infinium HumanMethylation450 BeadChip Array signal
intensities were quantile normalized and methylation beta values were calculated using R 2.12 as
previously described12. For cg06500161 no DNA methylation data were available as it did not
pass the quality control filters. Data for N=634 adipose and N=395 skin samples were available
for the final analysis. A linear mixed effects model was fitted for blood lipid values using the
ociations of the firsrsrsst t t t m
d cell lll prpp oportitititions (C(C(C(CD
T e
e
a
n
oci ere replicated sing the same statistical model in KORA F3 (N 499) as e
T-cececellllllsss, nnnatattatuuuralalalal killer cells, B-lymphocyyytetetess, monocytes anddd granulocytes). To ge
ththhheee e variance in thee llilipiiddd d llel veeelslsls eeexxplaaainned bby memeeethththyylatttioon leevvvelslsls,,, R2 stttatiisssticsss wwe
accorrdiididingngngng to EdEdEdwawa ddrdrdss et aalll.1111111, usininini ggg ththththe R RRR papackckckaagagage ee pppbkrkrkrteteteteststt, vversioioioionnn 0.3-33 7777.
n steppp
ii lili tedd iin hth ta itistiic lal dod lel ii KOKORARA FF33 (N(N 449999)) e
DOI: 10.1161/CIRCGENETICS.114.000804
7
lme4 package in R. The model was adjusted for age, BMI, smoking, statins, technical covariates
(fixed effects) and family relationship and zygosity (random effects). A likelihood ratio test was
used to assess significance, and the p-value was calculated from the Chi2 distribution with 1df
using -2log (likelihood ratio) as the test statistic. Results were corrected according to the
Bonferroni procedure (level of significance=7.14E-03).
SNP analysis
Investigation of genetic confounding was carried out to identify whether the observed
associations between lipid and methylation levels in KORA F4 were due to single nucleotide
polymorphisms (SNPs) being associated with both lipid levels and DNA methylation. 157 lipid-
associated SNPs identified by the Global Lipids Genetics Consortium were included in the
analysis4. SNP rs9411489 was excluded because genotype data were not available for the KORA
F4 dataset. Genotype data of 156 lipid-associated SNPs as well as DNA methylation data were
available for 1710 KORA F4 participants. A pre-selection was done to reveal the lipid-associated
SNPs which were at the same time nominally associated (p<0.05) with differentially methylated
lipid-related CpG sites (CpGs; Suppl. Table 2). Next, models for each significant CpG–lipid pair
were recalculated with additional adjustment for the respective pre-selected SNPs to see if the
association was based on genetic confounding. Discovery, replication step and SNP analysis
were analyzed using the statistical package R, version 2.15.3.
Gene expression analysis
For the gene expression analysis, 724 KORA F4 subjects were included, as for these participants
both DNA methylation data and expression data were available. We tried to disentangle the
relationships between methylation at the CpGs, expression of the corresponding annotated gene
and lipid levels in an ad hoc approach based on a sequence of regression models with and
due to singlg e nucleoeoeoeotittt d
NA metttthhyhh lalll tititition. 151515157777 l
S
SNP rs9411489 was excluded because genotype data were not available for the K
w
o o
h ere at the same time nominall associated (p<0 05) ith differentiall meth
SNPsPsPs iiiidedededentntnttifiii ieeed ddd by the Global Lipids Genenenete ics Consortiumm wwwere included in the
SNNNPPP rs941148999 wwwass eex lclclluduu edddd bbbeeecaausee gennootyppee ddad tta wwwere nonoot avavvailaaaablblblble fooor ththhhee K
Genototottypypypypee daatatat fofof 1115655656 lipipipidididd-associciciattatatededede SNSNSNSNPPsPsP asasas wellelelllll asasas DDDDNANANAA metetetethyhyhyhyllllatiiionon dddatattaa w
or 1710 KORA F4F4F4F pppartiiii iicipapp nts. AAAA prp e-selelll ctiiioi n was ddod ne to reveal the lipip d-asso
hhh at thhe iti imi llll iciat ded ((p 0<0 005)5) ii hth didiffff iti lalll ethh
DOI: 10.1161/CIRCGENETICS.114.000804
8
without adjusting for the third of the three components. For each significant lipid-methylation
pair, the association between lipid level and DNA methylation was recalculated for KORA F4
(N=724). Afterwards we repeated the analysis, adjusting for the expression levels of the
annotated gene (except for cg07504977 which has no annotation to a gene according to the
UCSC genome Browser) (Suppl. Table 3). A p-value for the association was determined through
a likelihood ratio test. Similarly, the association between DNA methylation and transcript levels,
and between lipid levels and transcript levels, were determined. All models were also adjusted
for age, sex, body mass index, smoking, alcohol consumption, intake of lipid lowering drugs,
physical activity, history of myocardial infarction, current hypertension, HbA1c levels and C-
reactive protein levels, as well as for white blood cell count and estimated white blood cell
proportions. Models including expression data were additionally adjusted for the technical
variables RNA Integrity Number (RIN), sample storage time and RNA amplification batch13.
The level of significance was set to 8.3E-04.
Association of DNA methylation with prevalent myocardial infarction
To assess the association of the observed lipid-related CpGs with previous hospitalized MI in
KORA F4, generalized linear mixed effects models were fitted with adaptive Gauss-Hermite
quadrature using the R package lme4, version 1.0-4. Three models were analyzed. The first
model was adjusted for age, sex and estimated white blood cell proportions. In the second model
we additionally included body mass index, smoking, alcohol consumption, physical activity,
current hypertension, HbA1c levels, C-reactive protein levels and white blood cell count as
covariates, and in the third model the lipid variables (HDL-C, LDL-C, TG, TC) were also
included. The Bonferroni correction was used with a significance level of 6.3E-03. The same
analyses were done for KORA F3 and InCHIANTI. This statistical analysis and the gene
of lipid lowering ddddrurururug
n, HHHbAbAbAbA1111c llllev lllels anananandddd
o
s
RN h
f DNA th l ti ith l t di l i f ti
oteinininin lllevevevelelele s,s,s, as s wwwell as for white blood ceceellllll count and estimmmaaated white blood cell
s. MMModels includududingg eeexprprprpreese sionoon dddaata wewwere aadddditititioioionanann llyyy aadjuusttteddd ffffor thehehehe tececechhhnh icicici al
RNA A InnInIntetetetegggrity NuNuN mbmbberer (((RIRIRIN)N)N)N), sampmpmplelelele stooraragege tttimmimime ee aaand dd RNRNRNRNA AA aamplplplplifififiiiicatttioioi nn bababb ttctch
f siggnificance was set to 888.3333E-E 04040404.
ff DDNANA thh ll iti iithh ll t didi ll ii ff tii

DOI: 10.1161/CIRCGENETICS.114.000804
9
expression analysis were performed using the statistical package R, version 3.0.2.
Results
Associations between genome-wide DNA methylation and blood lipid levels
Characteristics of the discovery cohort (KORA F4) as well as the replication cohorts (KORA F3,
InCHIANTI, MuTHER cohort) are shown in Table 1.
In KORA F4, DNA methylation levels at one, 68, 17 and 80 CpGs were associated with
HDL-C, TG, LDL-C and TC levels, respectively. When white blood cell proportions were
included as covariates, the number of significant associations (p<1.1E-07) decreased, indicating
the presence of blood cell confounding. The association of methylation level at one CpG with
HDL-C and LDL-C remained significant, as well as the association of 10 CpGs with TG levels.
There were no longer any associations with TC. P-values ranged from 1.21E-27 to 9.66E-08 with
percentage of explained lipid level variance ranging from 1.6% to 6.5% (Table 2). CpG
cg06500161, located in ABCG1, was associated in opposite directions with HDL-C ( =-0.049,
p=8.26E-17) and TG levels ( =0.070, p=1.21E-27). TG levels were associated with nine
additional CpGs located in genes including ABCG1, MIR33B, SREBF1 and CPT1A. LDL-C
showed a positive association with methylation status of one CpG located in TNIP1 ( =0.040,
p=4.27E-09).
The lipid-related CpGs were carried forward to replication in a meta-analysis of the
KORA F3 and InCHIANTI cohorts. Nine of the twelve associations were confirmed (p-values
from 9.00E-11 to 3.78E-03; Table 2).
Tissue expression of candidate genes and replication in an adipose tissue cohort
To address cell- and tissue-specificity of ABCG1, CPT1A and SREBF1 expression, we quantified
their expression in human blood cell types (peripheral blood mononuclear cells (PBMC), CD14-,
p p
-07) ddddececececrererereasasasasedededed,,,, inininindidididicccc
e of blood cell confounding. The association of methylation level at one CpG w
d LDL-C remained si ificant, as well as the association of 10 CpGs with TG le
0
1, located in , pp ( =-0.0
e of blblooooood cecc lll cconfounding. The associatioion of methylationonn level at one CpG w
d LLLDDDLD -C remmaaainenned dd sisisisignngnifififificicicananant,tt aaas weeelll as thhe asassoooccic atatatioon ofofofo 10 CpCpCpCpGsGsGsGs wwwitititi h h h h TGTGTGTG le
noooo lololol ngngngngererer aaaanynyny asasasa sososocicicic ata ioioioonsnsnss wwwwiith hhh TCTCTCC... PPP---vavavav lululuuesesese rrrranananangegegeed d d frfrfrfromomomo 1111.2.2. 1E1E1E1E-2-2-227777 tooo 9999.6.6.66E6E6E6 -0
of explained liiiipipipipid dd leleleleveveeel lll vavavaririririananana cececece rrranananangigigig ngngngn fffrorororom mm 1.1 6%6%6%6% tttto o 6.6.6.6 5%5%5%% (((TaTaTaTabbblb e 2). ffffff CpG
111,, lolocacatetedd inini ABABABA CGCGCGCG1111,, wawass asassosociiciatatededd iniin oopppposositittee didirerectctioionsns wwitithhh HDHDHDHDLLLL-C C (( =-0.0.0.000
DOI: 10.1161/CIRCGENETICS.114.000804
10
CD19-, CD3-, CD4-, CD8-positive cells, and regulatory T-cells) and human tissues (brain, heart,
lung, kidney, small intestine, adipose tissue, skeletal muscle) (Suppl. Figure 1). All genes were
expressed not only in blood cells but also adipose tissue. Five of the replicated associations were
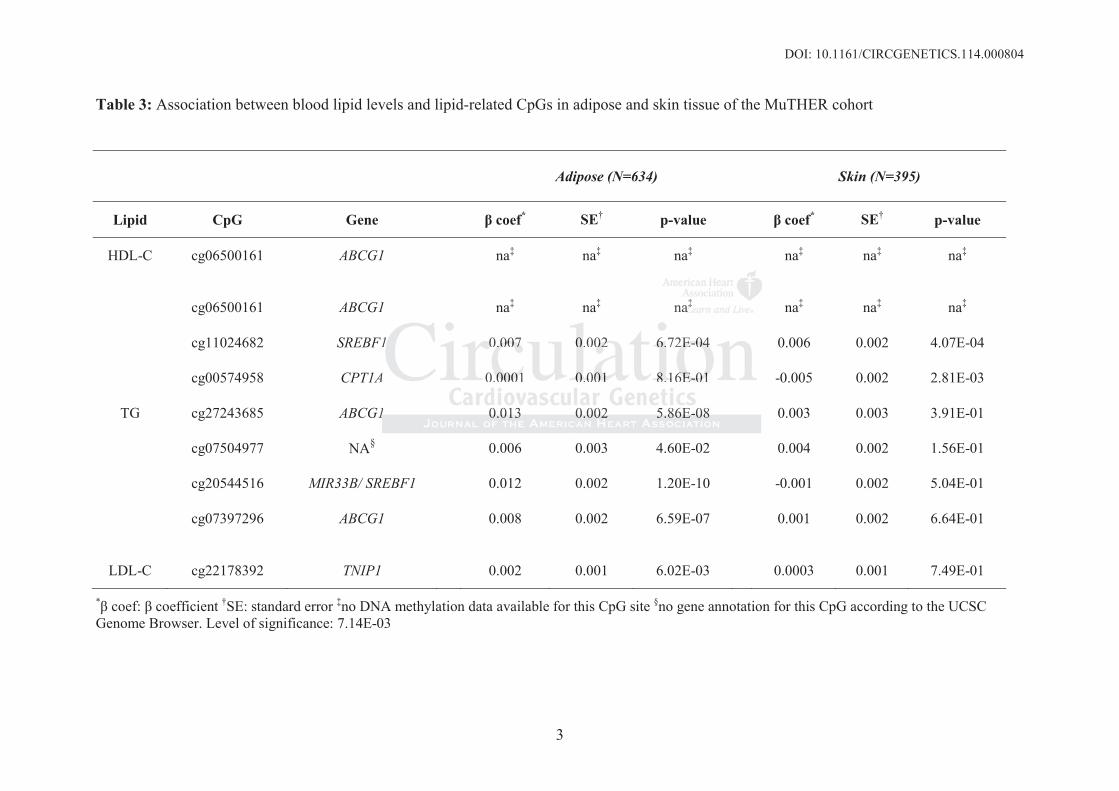
also significant in adipose tissue of the MuTHER cohort (Table 3). Here, the CpG cg20544516
(MIR33B/SREBF1) showed the strongest association with TG levels ( =0.012, p=1.20E-10),
followed by CpGs located in ABCG1 (cg27243685, cg07397296; =0.013, p=5.86E-08 and
=0.008, 6.59E-07, respectively) and SREBF1 (cg11024682, =0.007, p=6.72E-04). The
association between LDL-C and cg22178392 (TNIP1) was also found to be significant in adipose
tissue ( =0.002, p=6.02E-03). In skin tissue no associations could be determined except for TG
levels and cg11024682 (SREBF1) and cg00574958 (CPT1A) ( =0.006, p=4.07E-04 and =-
0.005, p=2.81E-03, respectively). These results are in line with the strong expression of
MIR33B/SREBF1 in adipose tissue observed in our tissue panel (Suppl. Figure 1).
Investigation of genetic confounding
Known lipid-related SNPs which were nominally associated with DNA methylation at the
identified lipid-related CpGs and thus acting as potential confounders, are shown in Suppl. Table
2. P-values ranged between 4.99E-02 and 3.42E-05, except for one SNP (rs964184), which was
highly significantly associated with DNA methylation of cg12556569 (APOA5, p=3.75E-289).
After recalculation of the models for each CpG-lipid pair with additional adjustment for the
respective pre-selected SNP, only the association between methylation of APOA5 and TG was
considerably genetically confounded (Suppl. Table 4). Further analyses showed that rs964184,
from the pre-selected SNPs for APOA5, caused the genetic confounding (data not shown).
Gene expression analysis
Gene expression analysis revealed a negative association between methylation at ABCG1 and
to be significant inininin a
determiiiined ddd exceptptptpt ffffor
c =
R
d related SNPs hich ere nominall associated ith DNA meth lation at the
cg1101010242424246868682 222 (SRSRSSREBF1) and cg0057495888 ((((CPCC T1A) ( =0.00606066,, p=4.07E-04 and =
88881EEEE-03, respeectttiveelyyyy). TTTThheh seee resssuults aare iin linnnee wwiw ttht ttthhe strrooongg g eeexpresesese siononon offf f
REBFBFBFF1111 iiiinnn n adipipi ososee tititissssue oobsbssbserved ddd ininin oooourr tttiisisssue ee papppanenenelll (S(S(Supuupupplpll. FiFFF gugugugurerere 1).
on of gggenetic conffof un ididinggg
dd llatedd SNSNPPs hihi hch imi llll iciat ded iithh DNDNAA hth llatiio at thhe
DOI: 10.1161/CIRCGENETICS.114.000804
11
mRNA levels of the six ABCG1 transcripts (cg06500161: p=5.42E-14, cg27243685: p=1.86E-
07). Here, transcript ILMN_2329927 showed the highest association (cg06500161: =-0.151,
p=5.22E-15, cg27243685: =-0.185, p=4.34E-06) of the six ABCG1 transcripts. Adjusted for
lipids the association became less significant. Detailed results of the analyses are shown in
Suppl. Table 5.
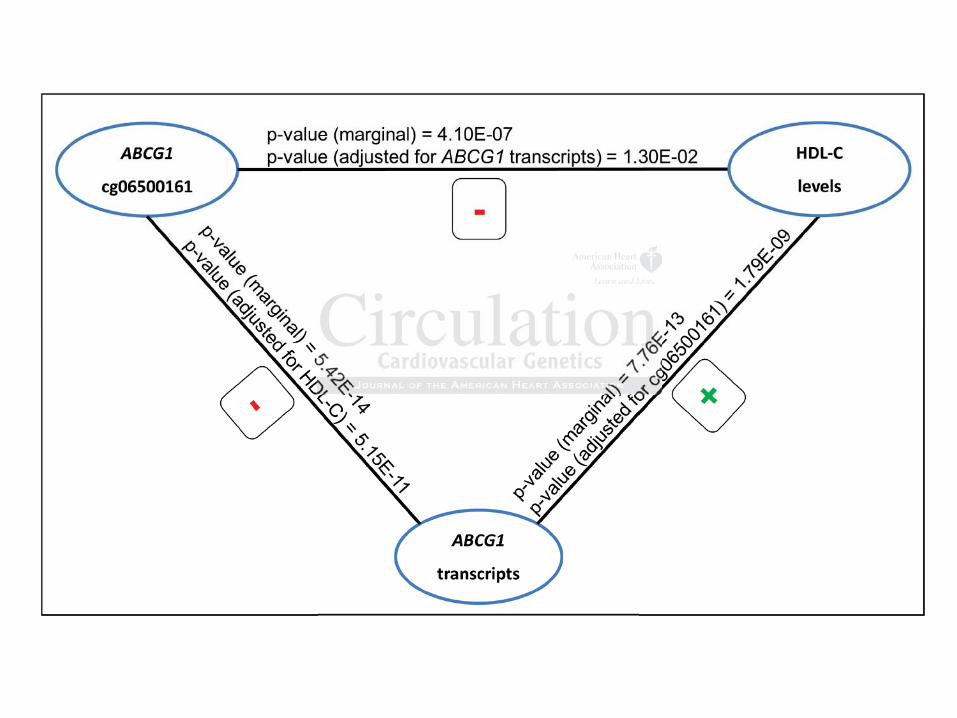
The association between cg06500161 and HDL-C (p=4.10E-07) weakened (p=1.30E- 02)
after adjusting for ABCG1 transcripts. Similar results were observed for the association between
cg06500161 and TG levels, and between cg27243685 and TG levels.
ABCG1 transcript levels showed a strong positive association with HDL-C (p=7.76E-13)
and a negative association with TG levels (p=1.25E-33). Significance was reduced when
adjusting for ABCG1 DNA methylation (see also Figure 1 and Suppl. Figure 2).
Functional analysis of cg06500161 (ABCG1) and cg20544516 (MIR33B/SREBF1)
To assess the biological relevance of the DNA methylation status of CpGs found to be associated
with lipid levels, electrophoretic mobility shift assays (EMSAs) were carried out for cg06500161
(ABCG1). This CpG was chosen as it showed the strongest association with both HDL-C and
TG. cg20544516 was also included in the analysis because of its functionally interesting location
in SREBF1 in a region coding for a microRNA (MIR33b).
The EMSA for cg06500161 identified a higher binding affinity of a protein complex for
the unmethylated status of cg06500161 compared to the methylated status. For cg20544516 a
strong protein binding affinity was detected in the methylated status, which was not detectable in
the unmethylated status (Suppl. Figure 3).
DNA methylation and prevalent myocardial infarction
The CpGs associated with lipid levels were tested for an association with previous hospitalized
with HDHDHDHDLLLL-CCCC (p(p(p(p=777=7 77.776666E
t
o
l
he biological relevance of the DNA methylation status of CpGs found to be asso
e els electrophoretic mobilit shift assa s (EMSAs) ere carried o t for cg065
tiveee aaassssssococociaiaiaatittt onnon with TG levels (p=1.25EEE-3-3-33). Significance e wwwas reduced when
orrr AAABA CG1 DNNAAA mmetttht yllylatatationnn (((seeee alssso Figguure 111 anananandd d SuSSupppl. FFFigggururure 2)))).
l analylylyysisisisiss of cg0g0g00656565000000016111 (AA(A(ABBCB G1G1G1G1))) ) aaaand ddd cg202020545454544545451616161 (((MIMIMIM R3R3R3R33BBBB/S/S/S/SRERRR BFBFBF1)1)1)
he biologggical rellllevance off f thhhhe DNDNDNAA A me hhthhylyllatiioi n status of fff CpCpC GsGGG ffffound to be asso
lel lel tr hho iti bibililit hihifft (E(EMSMSAAs)) iiedd t ffo 060655

DOI: 10.1161/CIRCGENETICS.114.000804
12
MI in the discovery cohort KORA F4 (N=1776 with N=60 cases). Three models were analyzed
and CpG cg06500161, located in the ABCG1 gene, showed an association with MI independent
of lipid levels in all three models (e.g., model 3: =0.141, p=1.30E-03) (Suppl. Table 6). The
results could not be replicated in KORA F3 and InCHIANTI, possibly due to the low number of
MI cases (N=8 in KORA F3, N=36 in InCHIANTI).
Discussion
DNA methylation of genes involved in lipid metabolism is associated with HDL-C, TG and
LDL-C levels
Our results indicated that DNA methylation of cg06500161 in ABCG1 was associated in
opposite directions with HDL-C and TG levels. Integrating gene expression data revealed an
association between cg06500161 methylation and lipid levels which might be partly mediated by
ABCG1 expression. DNA methylation at this CpG was also elevated in cases of MIs compared to
healthy individuals.
One challenge of genome-wide DNA methylation analyses in blood samples is the
difference in methylation patterns between different blood cell types10, 14. In our blood cell
expression panel of ABCG1, CPT1A and SREBF1 varying expression patterns were also
detectable (Suppl. Figure 1) which underlines the issue of cell heterogeneity. After adjustment
for estimated blood cell proportions using the method proposed by Houseman et al.10, the
number of significant CpGs decreased from 166 to 12. Therefore, in all further analyses cell
proportions were included as covariates to correct for cell heterogeneity.
We identified seven new lipid-related CpGs located in ABCG1 (HDL-C, TG),
MIR33B/SREBF1, in an intergenic region (TG) and in TNIP1 (LDL-C). In addition, we
replicated one CpG (cg00574958 in CPT1A) which was found to be associated with TG levels in
,
indicated that DNA methylation of cg06500161 in ABCG1 was associated in
r a
a
p a
ividuals.
indicaacateteted thththatt DDDNA methylation of cg0650500161 in ABCG111 was associated in
reectttit ons withhh HHHDLDLDL-C-C-CC aaandndndnd TTTG G G G leveveveels. Integrratinining geggeneee eexppprer ssssiooonnn dadadaatatatta rreveveveaeaealeleleled d a
beeetwtwtwtweeeeeeeennn n cgcgcgcg060606505050500101016161616 memememeththhhylylyly atioioioon nn anananand d d lilililipipipip d ddd lelelel vevevevellsll whwhwhw icicicch h h h mimimimighghghg ttt t bebebeb papapapartrtrtlylylyly mmmmededede iaii
pression. DNA AAA memmemeththththylylylatatatatioioion nnn atatata tttthihihih s ss CpCpCpCpG GGG wawawassss alaa soooo eeeleleeevavvvateteed ddd inininn cccasasasseseseses of MIs compa
iiivividudualals.s.
DOI: 10.1161/CIRCGENETICS.114.000804
13
CD4+ T-cells in the GOLDN study (N=991)6. Five of the associations were also found in
adipose tissue, of which the strongest associations were observed between TG levels and
MIR33B/SREBF1 as well as ABCG1 DNA methylation. Both genes are highly expressed in
adipose tissue (> 1.0E07 copies/μg RNA, Suppl. Figure 1). In skin TG levels were associated
with SREBF1 and CPT1A DNA methylation but there was no significant association with
ABCG1 methylation. These results indicate a tissue-specific association between TG levels and
MIR33B/SREBF1 and ABCG1 DNA methylation.
Additionally, we examined whether the observed associations between lipid and
methylation levels in KORA F4 were based on confounding by lipid-associated SNPs. Most
associations remained significant after additional adjustment for SNPs which were nominally
associated with DNA methylation at the respective CpG site. Only one CpG-lipid association
was found to be confounded. The association between DNA methylation of cg12556569 (located
in the promoter region of APOA5) and TG levels was confounded by rs964184, which is known
to primarily affect TG levels4. One study had previously identified this SNP as an mQTL
(cytosine modification quantitative trait loci)15. Our results indicate that the nominal associations
between trait-associated SNPs and DNA methylation of lipid-related CpCs were dependent on
lipids and that the identified lipid–DNA methylation associations were not due to genetic
confounding.
Interaction of genes of lipid-associated CpGs
Interestingly, three of the genes where the lipid-related CpGs are localized - ABCG1,
MIR33B/SREBF1 and CPT1A - and their gene products interact with one another (Figure 2).
SREBF1 and SREBF2 (sterol regulatory element-binding transcription factor 1 and 2) code for
the membrane-bound transcription factors SREBP1 and SREBP2, which activate the synthesis of
between lipip d and dd
associii tttat ddded SSSSNPNPNPNPs. MoMoMoMos
s l
w o
to be confounded. The association between DNA methylation of cg12556569 (lo
m n
affect TG le els4 One st d had pre io sl identified this SNP as an mQTL
s remememaiaiaiainenened d d d signgngnificant after additional aaadjdjdjdjuustment for SNPsPsPs which were nominal
wwwwithhh DNA methththylaatiiioi n atatata theeee rresssppectttivve CpCpG GG ssis tetetete. OnOnOnlyy onne CCpGpGpGG-lipipipipid ddd asasassoccciaatio
to be cocococonfnfnfn oundndd ddeded. ThhThThe e assososoociciciciationnn bebebebettwtweeeenn DNDNDNNAAAA mmmethththylylylylatattiioionn ofofoff ccccg1g1g11255556656565656656999 (l(( o
moter regig on of APAPAPAPOAOAOA5)))) and ddd TGTGTGG llllevelllls was confoundeddd d dd bybbyb r 99s99646464411811 4,, which is kn
ffff t TGTG ll lel 44 OOn st dd hhadd iio ll idid itififi ded thihi SNSNPP QmQTLTL
DOI: 10.1161/CIRCGENETICS.114.000804
14
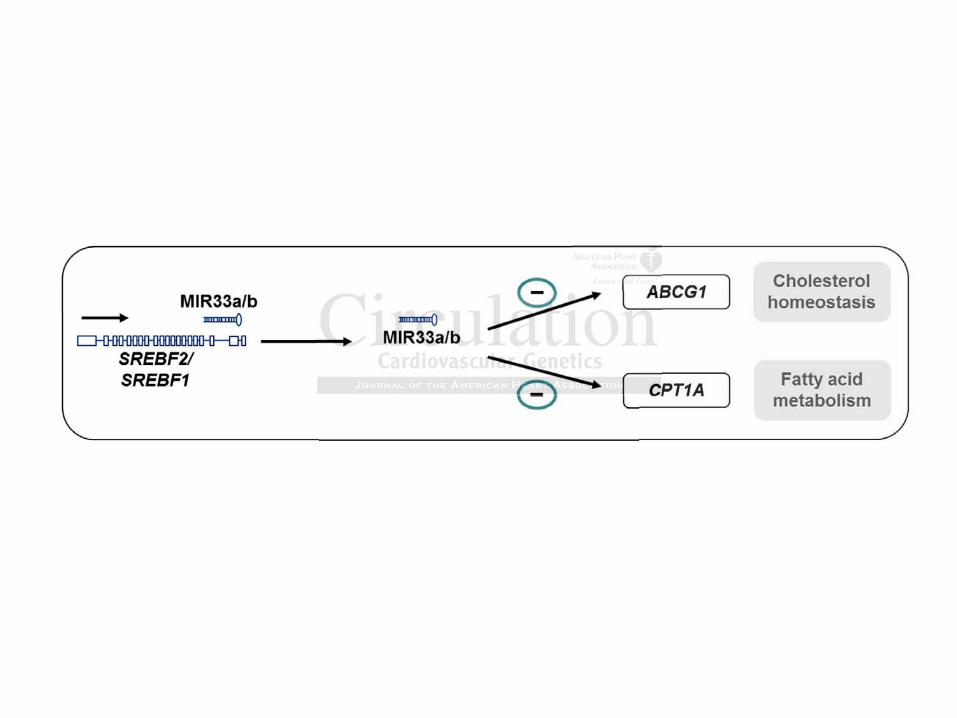
fatty acid and the synthesis and uptake of cholesterol16, 17. The intronic microRNAs 33a and 33b
(MIR33a/b) are located within SREBF2 and SREBF1, respectively. Coincident with transcription
of SREBF2/1, the embedded MIR33a/b is co-transcribed18. MIR33a/b act as negative regulators,
repressing a number of genes involved in fatty acid oxidation and cholesterol transport18-23 such
as carnitine palmitoyltransferase 1A (CPT1A), which is important for the transport of fatty acids
into the mitochondria for their oxidation24. Studies also identified a role for MIR33a/b in the
repression of the ABC transporters ABCA1 and ABCG120, 25. ABCG1 encodes the ABC-
transporter G1, a cholesterol transporter which plays a role in cellular lipid homeostasis. It has
been shown that ABCG1 functions cooperatively with ABCA126. ABCA1 transports
phospholipids and cholesterol to lipid-poor HDL subclasses such as apoA-I, whereas ABCG1
has more mature HDL particles as its acceptor27, 28.
In the present study the methylation levels of these genes, MIR33B/SREBF1, ABCG1 and
CPT1A, are associated with blood TG levels, suggesting an epigenetic modulation of lipid and
fatty acid metabolism. Here, ABCG1 might play a key role since one CpG (cg06500161) located
in this gene is associated with both HDL-C and TG levels. The function of ABCG1 in HDL-C
metabolism has been recorded in several studies and reviews29-31; however no report yet exists
about a direct role of ABCG1 in connection with TG levels. One study showed that genetic
variants in the ABCG1 promoter were associated with ABCG1 expression which showed an
influence on the bioavailability of lipoprotein lipase (LPL). Accordingly, ABCG1 regulates the
bioavailability of macrophage-secreted LPL, thereby promoting lipid accumulation, primarily in
the form of TG, in primary human macrophages32.
TNIP1, the methylation of which was associated with LDL-C levels in this study,
encodes the TNF -induced protein 3 (TNFAIP3)-interacting protein 1. This protein appears to be
lipid homeostasis.... ItItII
CA1 trttt ansportttst
ids and cholesterol to lipid-poor HDL subclasses such as apoA-I, whereas ABCG
m
h G
e
metabolism Here ABCG1 might pla a ke role since one CpG (cg06500161) lo
ids ananand ddd chchchc ololololessteteterol to lipid-poor HDL suuubcbcbb lasses such as aappopoA-I, whereas ABCG
maata uuuru e HDL paarttticleesss as iiiittst accccceppptoor2777, 2228.
he prereresesesesentntntn stuudydydy tttheheh mmethyhyhylalalalatttion lllevevevelelele s ofofff ttthehehh sesesee genenenes, MIMIMIMIR3R3R333B333 /S/S/S/SREREREREBFFF111, ABABABABCCGC
e associated with hhh blblbllood ddd TGTGTG llllevelllls,,, suggggegg stiiing gg an epipiiigegg netiiic modddud lation of lipip d
et bab loliis HH ABABCGCG11 imi hght lpl kk lol isi CCpGG ((c 0g06565000016161)1) ll
DOI: 10.1161/CIRCGENETICS.114.000804
15
important in regulating multiple receptor-mediated transcriptional activity of peroxisome
proliferator activated receptors (PPAR)33 and retinoic acid receptors (RAR)34. Interestingly,
ligand activated RAR increases ABCA1 and ABCG1 expression in human macrophages
modulating ABCG1 promoter activity via LXR responsive elements-dependent mechanisms35.
Additionally, studies revealed that PPAR / -activators induce ABCA1 expression in
macrophages36 and PPAR induce ABCG1 expression37. Therefore TNIP1 might have an indirect
impact on the expression of ABCA1/G1.
Methylation of ABCG1 is associated with ABCG1 transcripts
The identified negative association between ABCG1 methylation (cg06500161, cg27243685) and
ABCG1 mRNA levels is possibly mediated by methylation-dependent transcription factor
binding, as observed in the EMSA experiments. ABCG1 mRNA levels were additionally
associated with HDL-C and TG levels in opposite directions. The negative association between
ABCG1 methylation (cg06500161) and HDL-C might be partly mediated by the expression of
ABCG1. These results demonstrate the complexity of the relationship between DNA methylation
and gene expression.
Our findings could provide the missing link between disturbed blood lipid levels and
changed expression patterns of ABCG1. Studies have shown that in patients with type 2 diabetes
mellitus the ABCG1 expression in macrophages is reduced, leading to decreased cholesterol
efflux to HDL38. Interestingly, a recent study shows an association between the methylation
status of cg06500161 (ABCG1) and fasting insulin as well as with HOMA-IR (homeostatic
model assessment), a surrogate marker of insulin resistance39. All results indicate a key role of
DNA methylation of ABCG1 in the development of complex lipid-related diseases.
6500101010161616161, cg27272727242424436363636888
R
w w
e n
hese res lts demonstrate the comple it of the relationship bet een DNA meth
RNA A A leleleevevevelslslss is popopossibly mediated by methyhyhyhylal tion-dependenttnt ttttranscription factor ff
oobssses rved in thhheee EMMMMSASASAS eeexperererimimimennts... AABCGCG1 mRmRmRNANANA leevellls wewewerrre adddddddditiii iooonnnalllllyy
withhhh HHHHDLDLDLD -C aa ddndnd TTTGGGG lell velslsls iiiin oppopoposisisisittete ddddiirirecectititionnonons. TTTThehee nnnnegeg ttatativiii e asaasassssociatattiioion n bbebetwtt
ethyylation ((cggg06665050505 01010101616161) )) anddd d HDHDDLL-CCCC iimighhght bbbeb papp rtlyly m ddeddiiai teddd d bybbyb the expppression
hhh llt dde trat hth lle iit ff hth lla iti hshiip bbet DDNANA ethh

DOI: 10.1161/CIRCGENETICS.114.000804
16
ABCG1 – an epigenetic link between blood lipid levels and myocardial infarction?
DNA methylation has been linked to biological processes of cardiovascular disease such as
atherosclerosis40. An association between ABCA1 methylation and HDL-C levels as well as CAD
in patients with familial hypercholesterolemia has been reported41.
We identified a positive association between cg06500161 (ABCG1) and MI in the KORA
F4 cohort: DNA methylation levels of cg06500161 are higher in subjects with previous
hospitalized MI compared to healthy people. Since the number of subjects with self-reported
hospitalized MI was low in KORA F3 and InCHIANTI, no replication was achieved. These
results need further confirmation by prospective genome-wide DNA methylation studies.
Genetic variants in ABCG1 were shown to be associated with CAD42, 43. However,
nothing is yet known about an epigenetic impact of ABCG1 on the development of MI. A human
cell culture study showed a reduction of macrophage ABCG1 expression when higher TG levels
were present in the culture media. The author suggests that hypertriglyceridemia may increase
the risk of CAD via direct actions on macrophages favoring foam cell formation, thus leading to
the development of atherosclerotic plaque44. Changes in ABCG1 DNA methylation might
mediate the development of atherosclerotic plaques in response to high TG levels. Thus, with
this study we found hints for a new perspective on the molecular background of CAD.
Conclusions
We found associations between DNA methylation and lipid levels for genes contributing to the
modulation of cholesterol and fatty acid metabolism. Epigenetic modification of ABCG1 and its
regulatory network could play a key role on the path from disturbed blood lipid levels to the
development of complex lipid-related diseases. These results indicate an epigenetic impact on
metabolic regulation in humans and give new insights into the complex picture of lipid-related
n was achieved. Theheheheses
methylyllylattttiiiion tttstuddddieeessss.
n 42 43
y h
n e
CAD ia direct actions on macrophages fa oring foam cell formation th s leadi
neticcc vavavaririririananantttts iiin n n ABCG1 were shown to bebebebe associated with CCCCAD42, 43. However,
yeete kkknown aboouttt ann eeepiggiggeene eticicici impmmpaccct of ABABCGCG1111 onn tthhee deeveeelooopppmp ennnnt offf MMMMI. AAAA h
studydyddy sssshohohoh weed dd aa reredduductc ion nn ofofofof macccrororophpphphagggee ABABABA CGCGCGCG111 eeexprprpreseesessisiionon whehehehennn highghherer TTTTGGG l
nt in the culture medididid a. ThThThe authhhhor suggggegg stsr thhhhat hhhhypypypertriigigi lylyl ceriiiddded mia may yy incre
CACCADD ii didi ct ctiio hha ffa iri ff llll ff iti hth ll ddi

DOI: 10.1161/CIRCGENETICS.114.000804
17
complex diseases.
Acknowledgments: The authors thank Nadine Lindemann, Viola Maag and Franziska Scharl for technical support and acknowledge the support of the nonprofit foundation HTCR, which holds human tissue on trust, making it broadly available for research on an ethical and legal basis.
Funding Sources: The KORA study was initiated and financed by the Helmholtz Zentrum München – German Research Center for Environmental Health, which is funded by the German Federal Ministry of Education and Research (BMBF) and by the State of Bavaria. This project has received funding from the European Union Seventh Framework Programme (FP7/2007-2013) under grant agreement n° 261433 (Biobank Standardisation and Harmonisation for Research Excellence in the European Union - BioSHaRE-EU) and under grant agreement: 603288. The German Diabetes Center is funded by the German Federal Ministry of Health (Berlin, Germany) and the Ministry of Innovation, Science and Research of the State of North Rhine-Westphalia (Düsseldorf, Germany). This study was supported in part by a grant from the German Federal Ministry of Education and Research (BMBF) to the German Center for Diabetes Research (DZD e.V.). The MuTHER Study was funded by the WT (081917/Z/07/Z) and core funding for the Wellcome Trust Centre for Human Genetics (090532). TwinsUK was funded by the Wellcome Trust; European Community’s Seventh Framework Programme (FP7/2007-2013). The study also receives support from the National Institute for Health Research (NIHR)-funded BioResource, Clinical Research Facility and Biomedical Research Centre based at Guy's and St Thomas' NHS Foundation Trust in partnership with King's College London. SNP genotyping was performed by The Wellcome Trust Sanger Institute and National Eye Institute via NIH/CIDR. PD’s work forms part of the research themes contributing to the translational research portfolio of Barts Cardiovascular Biomedical Research Unit, supported and funded by the National Institute for Health Research.
Conflict of Interest Disclosures: None
References:
1. Andrawes WF, Bussy C, Belmin J. Prevention of cardiovascular events in elderly people. Drugs Aging. 2005;22:859-876.
2. Elder SJ, Lichtenstein AH, Pittas AG, Roberts SB, Fuss PJ, Greenberg AS, et al. Genetic and environmental influences on factors associated with cardiovascular disease and the metabolic syndrome. J Lipid Res. 2009;50:1917-1926.
dddderererer ggggrarararantntntnt aaaagrgrgrgreeeeeeeemememementntntnt::::al Mininininisisisistrtrtrtryyy y ofofofof HHHHeaeaeaealtltltlthhh h rch offff tttthehehehe SSSStatatatatetetete ooooffff NoNNN
tphalia (Düsseldorf, Germany). This study was s rted in rt b a ant fromderal Ministry of Education and Research (BMBF) to the German Center for DiD or the Wellcome Trust Centre for Human Genetics 090532 TwinsUK was fundeme Trust; European Community’s Seventh Framework Programme (FP7/2007-2a nce, Clinical Research Facility and Biomedical Research Centre based at Guy's anHS F d ti T t i t hi ith Ki ' C ll L d SNP t i
tphhhhalalala iaiaiaa ((((DüDüDüüsseleleldoddd rf, Germany). This stuuudydydd was supported iinnnn part by a grant fromdeeeraaala Minisssstrttrt y yy ofooo EEEEdududducacacaatiiiononnon aaaanddndd RRReseseseseaeaearchh (BMBMBBMBF)FFF) ttttooo o thththe e GeGGG rmmmmanananan CCCCennteteeter rrr fofofoorrr r DiDZDZZZDDD D e.V.). Thhe MuTuTTHEEEERRR R Studyyy wwasss ffundeed bbby y y y thththt ee WTWWT (0088199917/Z/0/0/00777/Z)Z)Z) andnnd cor thhhhe e e e WeWeWelllcococoomememe TTTruuustttt Cenenenntrtrrreeee fofofor HuHuHumamamam n nn GeGeG neneeetiiicscscscs (0909090505050 32323232)). Twiwiwiinnsnsn UKUKUKUK wwwwaasasa ffffunununu deme Trust; Eurooopepepep anann CCComomommumumunininitytytyy’s SSSeveevenenenththth FFFraramememewowoorkrkrk Proror grgrgrg amamammemm (FP7/2007-2also receives suuuupppppopopoportrtrtr fffrororomm m ththththeee NaNaNaNatititiononononalalal IIIInsnsnstititititttuute fofofof rr HeHeHeH alalalalthththt RRRReseseseaeaeaearrrch (NIHR)-funccce, Clinicaaal l ll ReReRReseseseseararara chchchch FFFFacacacacilililitititity yy y annanand ddd BiBiBiBiomomomomedededediciccicalalaa RRRReseeseseaeaaearcrrcrch hhh CeCCeCentntntntrererre bbbbasasaasedededd aaat tt Guy's annHHHSS FF dd iti TT t ii t hihi ii hth KKii '' CC llll LL dd SNSNPP t ii

DOI: 10.1161/CIRCGENETICS.114.000804
18
3. American Heart Association Nutrition C, Lichtenstein AH, Appel LJ, Brands M, Carnethon M, Daniels S, et al. Diet and lifestyle recommendations revision 2006: A scientific statement from the american heart association nutrition committee. Circulation. 2006;114:82-96.
4. Global Lipids Genetics C, Willer CJ, Schmidt EM, Sengupta S, Peloso GM, Gustafsson S, et al. Discovery and refinement of loci associated with lipid levels. Nat Genet. 2013;45:1274-1283.
5. Guay SP, Voisin G, Brisson D, Munger J, Lamarche B, Gaudet D, et al. Epigenome-wide analysis in familial hypercholesterolemia identified new loci associated with high-density lipoprotein cholesterol concentration. Epigenomics. 2012;4:623-639.
6. Irvin MR, Zhi D, Joehanes R, Mendelson M, Aslibekyan S, Claas SA, et al. Epigenome-wide association study of fasting blood lipids in the genetics of lipid lowering drugs and diet network study. Circulation. 2014;130:565-572.
7. Teschendorff AE, Marabita F, Lechner M, Bartlett T, Tegner J, Gomez-Cabrero D, et al. Abeta-mixture quantile normalization method for correcting probe design bias in illumina infinium 450 k DNA methylation data. Bioinformatics. 2013;29:189-196.
8. Pidsley R, CC YW, Volta M, Lunnon K, Mill J, Schalkwyk LC. A data-driven approach to preprocessing illumina 450k methylation array data. BMC Genomics. 2013;14:293.
9. Chen LS, Storey JD. Eigen-r2 for dissecting variation in high-dimensional studies. Bioinformatics. 2008;24:2260-2262.
10. Houseman EA, Accomando WP, Koestler DC, Christensen BC, Marsit CJ, Nelson HH, et al. DNA methylation arrays as surrogate measures of cell mixture distribution. BMC Bioinformatics.2012;13:86.
11. Edwards LJ, Muller KE, Wolfinger RD, Qaqish BF, Schabenberger O. An r2 statistic for fixed effects in the linear mixed model. Stat Med. 2008;27:6137-6157.
12. Grundberg E, Meduri E, Sandling JK, Hedman AK, Keildson S, Buil A, et al. Global analysis of DNA methylation variation in adipose tissue from twins reveals links to disease-associated variants in distal regulatory elements. Am J Hum Genet. 2013;93:876-890.
13. Schurmann C, Heim K, Schillert A, Blankenberg S, Carstensen M, Dorr M, et al. Analyzing illumina gene expression microarray data from different tissues: Methodological aspects of data analysis in the metaxpress consortium. PLoS One. 2012;7:e50938.
14. Reinius LE, Acevedo N, Joerink M, Pershagen G, Dahlen SE, Greco D, et al. Differential DNA methylation in purified human blood cells: Implications for cell lineage and studies on disease susceptibility. PLoS One. 2012;7:e41361.
mmmmezezezez--CaCaCaCabrbrbrbrerererero o o o DD,DD et tt aala ....gn biias iiiin ililililllllu iminaaaa iiiinf
R, CC YW, Volta M, Lunnon K, Mill J, Schalkwyk LC. A data-driven approachi
a
man EA, Accomando WP, Koestler DC, Christensen BC, Marsit CJ, Nelson HH,lation arra s as s rrogate meas res of cell mi t re distrib tion BMC Bi i f
R,,, CCCCCC YW, VVVololololtattt MMMM, ,, LuLuLuLunnnnnnonononon KKKK,,, MiMiMiilllllll JJJ, SSchalkkkwywywywyk kk LCLCLCL . AAA daddd ta-d-dd-dririrriveveveven apapapapprprproaoaoaoachinnng illumina 4505050k memmethhylylyly atioooonnn arrrrray daddata. BMBMBMCC GeGeGG noommics. 2220131313;14::2929292 3.
, Stororreyeyeyey JJJDDD. EEEigigigenen r-r2222 for dididiisssssectitititingngng vvvvariaiaii tititioon iiinnnn hihhihighhghgh-dddimimimimenen iisisionalalalal sssttttudididieses. atics. 2008;24:222222226060600-2-2-2-226262662.22.
mmman EA, AAAccccccccomommomanaanandodododo WWWWP,PPP KKKKoeoeooesttststleleller r r DCDDCDC, , ChChChChriririristststenennensessesen n nn BCCBCBC,,, MaMaMaMarsrsrrsitittit CCCCJ,JJ, NNNNelee son HHH,llatiio s te fof lelll imi t didist iribb iti BMBMCC BiBi ii ff
DOI: 10.1161/CIRCGENETICS.114.000804
19
15. Moen EL, Zhang X, Mu W, Delaney SM, Wing C, McQuade J, et al. Genome-wide variation of cytosine modifications between european and african populations and the implications for complex traits. Genetics. 2013;194:987-996.
16. Edwards PA, Tabor D, Kast HR, Venkateswaran A. Regulation of gene expression by srebp and scap. Biochim Biophys Acta. 2000;1529:103-113.
17. Horton JD. Sterol regulatory element-binding proteins: Transcriptional activators of lipid synthesis. Biochem Soc Trans. 2002;30:1091-1095.
18. Marquart TJ, Allen RM, Ory DS, Baldan A. Mir-33 links srebp-2 induction to repression of sterol transporters. Proc Natl Acad Sci U S A. 2010;107:12228-12232.
19. Najafi-Shoushtari SH, Kristo F, Li Y, Shioda T, Cohen DE, Gerszten RE, et al. Microrna-33 and the srebp host genes cooperate to control cholesterol homeostasis. Science. 2010;328:1566-1569.
20. Rayner KJ, Suarez Y, Davalos A, Parathath S, Fitzgerald ML, Tamehiro N, et al. Mir-33 contributes to the regulation of cholesterol homeostasis. Science. 2010;328:1570-1573.
21. Davalos A, Goedeke L, Smibert P, Ramirez CM, Warrier NP, Andreo U, et al. Mir-33a/b contribute to the regulation of fatty acid metabolism and insulin signaling. Proc Natl Acad Sci U S A. 2011;108:9232-9237.
22. Gerin I, Clerbaux LA, Haumont O, Lanthier N, Das AK, Burant CF, et al. Expression of mir-33 from an srebp2 intron inhibits cholesterol export and fatty acid oxidation. J Biol Chem.2010;285:33652-33661.
23. Horie T, Ono K, Horiguchi M, Nishi H, Nakamura T, Nagao K, et al. Microrna-33 encoded by an intron of sterol regulatory element-binding protein 2 (srebp2) regulates hdl in vivo. Proc Natl Acad Sci U S A. 2010;107:17321-17326.
24. McGarry JD, Brown NF. The mitochondrial carnitine palmitoyltransferase system. From concept to molecular analysis. Eur J Biochem. 1997;244:1-14.
25. Rotllan N, Fernandez-Hernando C. Microrna regulation of cholesterol metabolism. Cholesterol. 2012;2012:847849.
26. Gelissen IC, Harris M, Rye KA, Quinn C, Brown AJ, Kockx M, et al. Abca1 and abcg1 synergize to mediate cholesterol export to apoa-i. Arterioscler Thromb Vasc Biol. 2006;26:534-540.
27. Wang N, Lan D, Chen W, Matsuura F, Tall AR. Atp-binding cassette transporters g1 and g4 mediate cellular cholesterol efflux to high-density lipoproteins. Proc Natl Acad Sci U S A.2004;101:9774-9779.
Science. 2010;32828288:1:::
mehiroooo NNNN etetetet aaaallll MMMMiriririr 3
s at1
, Clerbaux LA, Haumont O, Lanthier N, Das AK, Burant CF, et al. Expression o
3652 33661
to tttheheheh rrregegegululululatttioioioon of cholesterol homeostststaaasis. Science. 2010000;3;; 28:1570-1573.
s A,A,, Goedeke L,LL Smimimimibertrtrtr P, RaRaRaR mimmirez CCM, WaWaarrrieieier NPNPNP, Andrdrdreooo UUUU, etttt aaal. MMMMir-3-3-333ato thhththe ee regulalalationonn off fffatty y y acacid mmeeetaaboooliismm aand d d ininsuullin siigngg aaliiing.g. PrPP occc NNNatatatl Acccaad108:999923232332-222 9929 373737.
, Clerbaux LA,,, HaHH umont O,O,OO LLan hthhiiei r N,N,N, DDas AAAK,K,K, BBurant CFCFCFF,,, et all.l Expppression osrebp2 inntrtrrtronoonon iiinhnhnhnhibibbibititiitsss chchchcholollolesesesesteteteroororol ll exexexexppopoportrtrtrt aaandndndnd fffatatatattyttyty aaaaciccicid d oxoxoxoxidididdatatatatioioion.n.nn. J JJ J BiBBiBioloo Chem.36365252 3336366161

DOI: 10.1161/CIRCGENETICS.114.000804
20
28. Kennedy MA, Barrera GC, Nakamura K, Baldan A, Tarr P, Fishbein MC, et al. Abcg1 has a critical role in mediating cholesterol efflux to hdl and preventing cellular lipid accumulation. Cell Metab. 2005;1:121-131.
29. Tarling EJ, Edwards PA. Atp binding cassette transporter g1 (abcg1) is an intracellular sterol transporter. Proc Natl Acad Sci U S A. 2011;108:19719-19724.
30. Tarling EJ, Edwards PA. Dancing with the sterols: Critical roles for abcg1, abca1, mirnas, and nuclear and cell surface receptors in controlling cellular sterol homeostasis. Biochim Biophys Acta. 2012;1821:386-395.
31. Ramasamy I. Recent advances in physiological lipoprotein metabolism. Clin Chem Lab Med.2013:1-33.
32. Olivier M, Tanck MW, Out R, Villard EF, Lammers B, Bouchareychas L, et al. Human atp-binding cassette g1 controls macrophage lipoprotein lipase bioavailability and promotes foam cell formation. Arterioscler Thromb Vasc Biol. 2012;32:2223-2231.
33. Flores AM, Gurevich I, Zhang C, Ramirez VP, Devens TR, Aneskievich BJ. Tnip1 is a corepressor of agonist-bound ppars. Arch Biochem Biophys. 2011;516:58-66.
34. Gurevich I, Aneskievich BJ. Liganded raralpha and rargamma interact with but are repressed by tnip1. Biochem Biophys Res Commun. 2009;389:409-414.
35. Ayaori M, Yakushiji E, Ogura M, Nakaya K, Hisada T, Uto-Kondo H, et al. Retinoic acid receptor agonists regulate expression of atp-binding cassette transporter g1 in macrophages. Biochim Biophys Acta. 2012;1821:561-572.
36. Chinetti G, Lestavel S, Bocher V, Remaley AT, Neve B, Torra IP, et al. Ppar-alpha and ppar-gamma activators induce cholesterol removal from human macrophage foam cells through stimulation of the abca1 pathway. Nat Med. 2001;7:53-58.
37. Li AC, Binder CJ, Gutierrez A, Brown KK, Plotkin CR, Pattison JW, et al. Differential inhibition of macrophage foam-cell formation and atherosclerosis in mice by pparalpha, beta/delta, and gamma. J Clin Invest. 2004;114:1564-1576.
38. Mauldin JP, Nagelin MH, Wojcik AJ, Srinivasan S, Skaflen MD, Ayers CR, et al. Reduced expression of atp-binding cassette transporter g1 increases cholesterol accumulation in macrophages of patients with type 2 diabetes mellitus. Circulation. 2008;117:2785-2792.
39. Hidalgo B, Irvin MR, Sha J, Zhi D, Aslibekyan S, Absher D, et al. Epigenome-wide association study of fasting measures of glucose, insulin, and homa-ir in the genetics of lipid lowering drugs and diet network study. Diabetes. 2014;63:801-807.
40. Wierda RJ, Geutskens SB, Jukema JW, Quax PH, van den Elsen PJ. Epigenetics in atherosclerosis and inflammation. J Cell Mol Med. 2010;14:1225-1240.
ychas L, et al. Humamamamaniiililililitytytyty aaaandndndnd pppprorororomomomomottttes ffofof aaaa
AM, Gurevich I, Zhang C, Ramirez VP, Devens TR, Aneskievich BJ. Tnip1 is ar
ch I, Aneskievich BJ. Liganded raralpha and rargamma interact with but are repri
M, Yakushiji E, Ogura M, Nakaya K, Hisada T, Uto-Kondo H, et al. Retinoic aco s
h A t 2012;1821:561 572
AM,M,M, GGGururureveveviciii h hh I,III Zhang C, Ramirez VP, DeDeDevens TR, Aneskkkkieiii vich BJ. Tnip1 is ar ofofof agonistttt---b- ououuoundnd pppppapapparsrrr . ArArrArchchchc BBBBioioiochchchchememem BBiophhhysysysys. .. 20202 1111111 ;5;5;516616:5::: 8-66666666...
chhhh II, AnA eskikikievviccch BJBJJ. Liiigagagg ndeded rrraarallphphpha anand rarar rggggamammamma intererracct t wwiw thhh bbbuttt aaare reepriochehehh mmm m BiBiBiB ophyhh s ReRR s CoCC mmmmmuuuun. 200000909099;33338989899:4:440909090 -44414141414.
M, ,, Yakushijji E,E,E, OOOgugg ra MMM,,, NNNakakkk yayy KKK, ,, HiHiHiisadddad T, ,, UtUU o-KoK ndddo H,H,H, et al. Retinoic acooonists reguguuulalalalatetete eeeexpxpxpxprerereressssioioioion nn ofofofof aaatpppp-b-b-bbinininindiddidingngngng cccasasasasseseetttttttte eee trtrtranaananspppporoororteteteer rr r g1g1g1 iiiin n n mamamamacrcc ophagess
hh AA t 20201212 1;1828211:565611 575722

DOI: 10.1161/CIRCGENETICS.114.000804
21
41. Guay SP, Brisson D, Munger J, Lamarche B, Gaudet D, Bouchard L. Abca1 gene promoter DNA methylation is associated with hdl particle profile and coronary artery disease in familial hypercholesterolemia. Epigenetics. 2012;7:464-472.
42. Xu Y, Wang W, Zhang L, Qi LP, Li LY, Chen LF, et al. A polymorphism in the abcg1 promoter is functionally associated with coronary artery disease in a chinese han population. Atherosclerosis. 2011;219:648-654.
43. Schou J, Frikke-Schmidt R, Kardassis D, Thymiakou E, Nordestgaard BG, Jensen G, et al. Genetic variation in abcg1 and risk of myocardial infarction and ischemic heart disease. Arterioscler Thromb Vasc Biol. 2012;32:506-515.
44. Wong BX, Kyle RA, Croft KD, Quinn CM, Jessup W, Yeap BB. Modulation of macrophage fatty acid content and composition by exposure to dyslipidemic serum in vitro. Lipids.2011;46:371-380.
in vitro. Lipids.

DOI: 10.1161/CIRCGENETICS.114.000804
1
Table 1: Characteristics of subjects of the discovery cohort and the replication cohorts
Characteristic KORA F4(N=1776)
KORA F3(N=499)
InCHIANTI(N=472)
MuTHER cohort (N=856)
Age [years] 60.8 (8.9) 52.9 (9.6) 71.2 (16.0) 59.4 (9.0)Sex=male 867 (48.8%) 259 (51.9%) 215 (45.6%) 0 (0.0%)BMI* [kg/m2] 28.2 (4.8) 27.2 (4.5) 27.0 (4.3) 26.6 (4.9)Current smoker 258 (14.5%) 249 (49.9%) 206 (43.7%) 84 (9.8%)Physically active 1021 (57.5%) 249 (49.9%) 238 (50.5%) NA†
Alcohol consumption [g/day] 15.5 (20.4) 16.1 (19.6) 12.6 (15.1) NA†
HDL-C [mg/dl] 56.5 (14.6) 58.2 (17.8) 56.8 (14.8) 71.5 (18.2)LDL-C [mg/dl] 140.0 (35.1) 131.0 (33.2) 124.5 (32.4) 124.5 (37.9)Triglyceride [mg/dl] 133.1 (94.7) 164.6 (121.9) 119.7 (57.9) 99.2 (49.6)Cholesterol [mg/dl] 221.9 (39.3) 220.5 (38.2) 205.2 (37.9) 218.9 (38.7)C-reactive protein [mg/l] 2.5 (5.1) NA† 4.0 (8.0) NA†
Leukocytes count [/nl] 5.9 (1.6) 7.3 (2.1) 6.3 (1.6) 6.5 (1.8)HbA1c‡ [%] 5.6 (0.6) 5.3 (0.5) 4.9 (0.8)§ NA†
Self-reported history:Hypertension|| 811 (45.7%) 211 (42.3%) 124 (26.3%) 172 (20.1%)Hospitalized myocardial infarction 60 (3.4%) 8 (1.6%) 36 (7.6%) NA†
Intake of lipid-lowering drugs (excl. herbal substances) 290 (16.3%) 31 (6.2%) 61 (13.0%) 69 (8.1%)Fasting at time of blood collection# 1776 (100.0%) 47 (9.4%) 472 (100.0%) 844 (98.5%)
Continuous and categorical characteristics are given as mean (sd) or absolute numbers and relative proportions, respectively. *BMI: body mass index †NA: variable not available ‡HbA1c: hemoglobin A1c §in InCHIANTI, HbA1c levels were calculated using the formula (46.7+glucose level)/28.7, in KORA F3/F4 they were analyzed using the HPLC method ||>140/90 mmHg or medically controlled #overnight fast of at least 8 hours
.9%)))) 200006666 (
.9%9%%%)))) 232323238888 ((((9.6) 12121212.6..
572
56.5 (14.6) 58.222 (17171717.8) 56.8141414140.0.0.0 0000 (3(3(3(35.5 1)1)1)) 131313131...000 (3(3(3(33.2)2)2)2) 121212124.444 5133333.33 1 (9(9(9( 44.7)))) 1164.6 (1(121111.9.99.9) 1199.72222221.11.1.999 (39.999 3)3)3) 2222 0.00 55 (3(3(3888.8 2)2))) 202205.222.22 555 (5(5(5(5 11.11)))) NANANANA†† 4.0 (5.5.55.9999 (1(1(1(1.6.6.66)))) 7.7.7.7.3333 (2(2(2(2.1.1.11)))) 6.3 ((

DOI: 10.1161/CIRCGENETICS.114.000804
2
Table 2: Associations between genome-wide DNA methylation and lipid levels
# KORA F4 KORA F3 InCHIANTI meta-analysis**
Lipid CpG Chr† Gene ‡ SE§ p-value exp var (%)|| coef SE p-value coef SE p-value p-value
HDL-C cg06500161 21 ABCG1 -0.049 0.006 8.26E-17 3.9 -0.065 0.014 2.97E-06 -0.071 0.016 1.13E-05 9.00E-11#
TG
cg06500161 21 ABCG1 0.070 0.006 1.21E-27 6.5 0.072 0.015 1.89E-06 0.063 0.016 1.03E-04 5.56E-10#
cg19693031 1 TXNIP -0.030 0.003 1.89E-17 4.1 -0.014 0.007 5.65E-02 -0.023 0.011 3.54E-02 5.67E-03
cg11024682 17 SREBF1 0.059 0.008 5.54E-14 3.2 0.031 0.014 2.89E-02 0.030 0.013 2.36E-02 1.60E-03#
cg00574958 11 CPT1A -0.118 0.016 3.15E-13 3.2 -0.103 0.028 2.42E-04 -0.058 0.020 4.86E-03 7.88E-06#
cg27243685 21 ABCG1 0.064 0.009 3.24E-13 3.0 0.050 0.014 5.87E-04 0.054 0.022 1.63E-02 2.49E-05#
cg07504977 10 NA** 0.026 0.004 3.93E-12 2.7 0.026 0.008 1.87E-03 0.027 0.009 3.74E-03 1.91E-05#
cg20544516 17 MIR33B/ SREBF1 0.043 0.007 2.84E-09 2.7 0.032 0.013 1.39E-02 0.032 0.018 7.16E-02 2.22E-03#
cg12556569 11 APOA5 0.005 0.001 6.43E-09 1.9 0.002 0.002 2.56E-01 0.004 0.002 1.25E-02 1.20E-02
cg07397296 21 ABCG1 0.027 0.005 9.48E-08 2.1 0.034 0.010 1.03E-03 0.008 0.011 4.63E-01 3.78E-03#
cg07815238 15 NA** 0.048 0.009 9.66E-08 1.6 0.015 0.017 3.69E-01 0.003 0.014 8.41E-01 4.61E-01
LDL-C cg22178392 5 TNIP1 0.040 0.007 4.27E-09 2.1 0.049 0.015 1.11E-03 0.020 0.014 1.45E-01 1.04E-03#
*meta-analysis of results of replication in KORA F3 and InCHIANTI †Chr: chromosome ‡ §SE: standard error ||exp var: explained variance #CpG with association confirmed by replication meta-analysis; level of significance: 1.1E-07 (discovery cohort), 4.5E-03 (replication meta-analysis) **no gene annotation for this CpG according to the UCSC Genome Browser
0.015 1.89E 060666
00.000000007777 5.5.5.5.65656565EEEE-02020202
0 000014141414 2222 89898989EEEE 00002
-0.118888 0.0111666 3.33.15E-13 33.2 -0.0.0.0 103 0.0222888 2.4244 EEE-04
0.064 0.00009 3.24EE--13 33.0 00.0050 000.0010 4 5...887E-0004
00.00 0202020 6 0.00.0 000044 33.33 93E-1112 22.7 0.0202020 666 0.0000000888 1.11 887E-0303
000.0404043333 000.000000777 222.848484EEE-090909 222.777 000.030303222 000.010101333 111.393939EEE-020202
DOI: 10.1161/CIRCGENETICS.114.000804
3
Table 3: Association between blood lipid levels and lipid-related CpGs in adipose and skin tissue of the MuTHER cohort
Adipose (N=634) Skin (N=395)
Lipid CpG Gene * SE† p-value * SE† p-value
HDL-C cg06500161 ABCG1 na‡ na‡ na‡ na‡ na‡ na‡
TG
cg06500161 ABCG1 na‡ na‡ na‡ na‡ na‡ na‡
cg11024682 SREBF1 0.007 0.002 6.72E-04 0.006 0.002 4.07E-04
cg00574958 CPT1A 0.0001 0.001 8.16E-01 -0.005 0.002 2.81E-03
cg27243685 ABCG1 0.013 0.002 5.86E-08 0.003 0.003 3.91E-01
cg07504977 NA§ 0.006 0.003 4.60E-02 0.004 0.002 1.56E-01
cg20544516 MIR33B/ SREBF1 0.012 0.002 1.20E-10 -0.001 0.002 5.04E-01
cg07397296 ABCG1 0.008 0.002 6.59E-07 0.001 0.002 6.64E-01
LDL-C cg22178392 TNIP1 0.002 0.001 6.02E-03 0.0003 0.001 7.49E-01
* coef: coefficient †SE: standard error ‡no DNA methylation data available for this CpG site §no gene annotation for this CpG according to the UCSC Genome Browser. Level of significance: 7.14E-03
naaaa‡‡‡‡
F
A
1
F111 0.0.0..000000007777 0.0 000002222 6.6.6.6 72222E-E-E-E-04040404
A 0.0000000001010101 0.00 0000000111 8.888 16161616E-E-E-E-01010101
111 000.010101333 000.000000222 555.868686E-E-E-080808
DOI: 10.1161/CIRCGENETICS.114.000804
4
Figure Legends:
Figure 1: Results of expression analysis between cg06500161 (ABCG1) and HDL-C levels.
ABCG1 methylation (cg06500161) was negatively associated with ABCG1 mRNA levels.
ABCG1 mRNA levels were positively associated with HDL-C levels. Adjustment analysis
indicated that the association between ABCG1 methylation and HDL-C might be partly mediated
by the expression of ABCG1. Detailed association results can be found in Suppl. Table 5. N=724,
level of significance=8.3E-04
Figure 2: Interrelation of genes whose DNA methylation level is associated with lipid levels.
When SREBF1/2 is transcriptionally activated, MIR33a/b are co-transcribed, which play a role in
repression of ABCG1 and CPT1A.
n e
B
o
nterrrrrrelelel tatatatioioion n n offf gggenes whose DNA methyyyylalall tit on level is assoociccc ated with lipid leve
BBBF1F1F1/2 is transcrcrriptiiiooonalallylylyl actttivivivaaateed, MIMM RR333a/b/b/b aaaarrerr cooo-ttransscccribbbeeede , whwhwhwhici hhh plaaay a
of ABABBBCGCGCGCG111 annd dd CPCPCPC T1T1T11AAA.
Top Related