


Languages
Pages
Legal


DISCOUNTED CASH FLOW VALUATIONDIFFERENT ASPECTS OF VALUATION OF EQUITY SHARES USING DCF METHOD
CHARTERED ACCOUNTANTS’ ASSOCIATION, AHMEDABAD
CA SUJAL SHAH
JANUARY 20,2017

DISCOUNTED CASH FLOW

DISCOUNTED CASH FLOW (DCF)
Values a business based on the expected cash flows over a given period of time
Considers Cash Flow and Not Accounting Profits
Value of business is aggregate of discounted value of cash flows for the explicit period and perpetuity
Involves determination of
• Discount Factor - Weighted Average Cost of Capital (‘WACC’)
• Growth rate for perpetuity

DCF - PARAMETERS
• Projections
• FCF to Firm or FCF to Equity
• Horizon (Explicit) period
• Growth rate for perpetuity
Cash Flows
• Cost of Equity
• Cost of Debt
• Debt Equity ratio
Discounting Rate

FCFE V/S FCFF
• Discount cash flows to equity• Cash flows after considering
all expenses, tax, interest and debt additions/re-payments
• Discount rate: Cost of Equity
• Discount cash flows to firm• Cash flows after considering
all expenses and taxes, but prior to interest and debt additions/re-payments
• Discount rate: WACC
Free Cash Flow to Equity Free Cash Flow to Firm

CASH FLOWS
BusinessPlan
Business Cycle
Working Capital
Capital Expenditure
Depreciation Amortization
Tax

CASH FLOWS
Gross operational cash
flows (EBIDTA)
Less: Tax
Less: Working capital
requirements
Less: Capex requirements
Less: Interest payment & additions/
repayment for loans
FCFF
FCFE
Enterprise
Value
Equity
Value

DCF - PROJECTIONS
Factors to be considered for reviewing projections:
• Appraisal by institutions and understanding of the Business
• Existing policy/ legal framework
• Industry/Company Analysis
• Dependence on single customer/ supplier
• Installed capacity
• Capital expenditure – increasing capacities
• Working capital requirements
• Alternate scenarios / sensitivities

DCF – HORIZON PERIOD
Horizon period and Residual value
Horizon period at least for about 3-5 years
For cyclical businesses – cover at least one full business cycle
Basic criteria – achieve stage of stable growth
• If industry is passing through rough phase – horizon period should cover a period till rationalization is reached
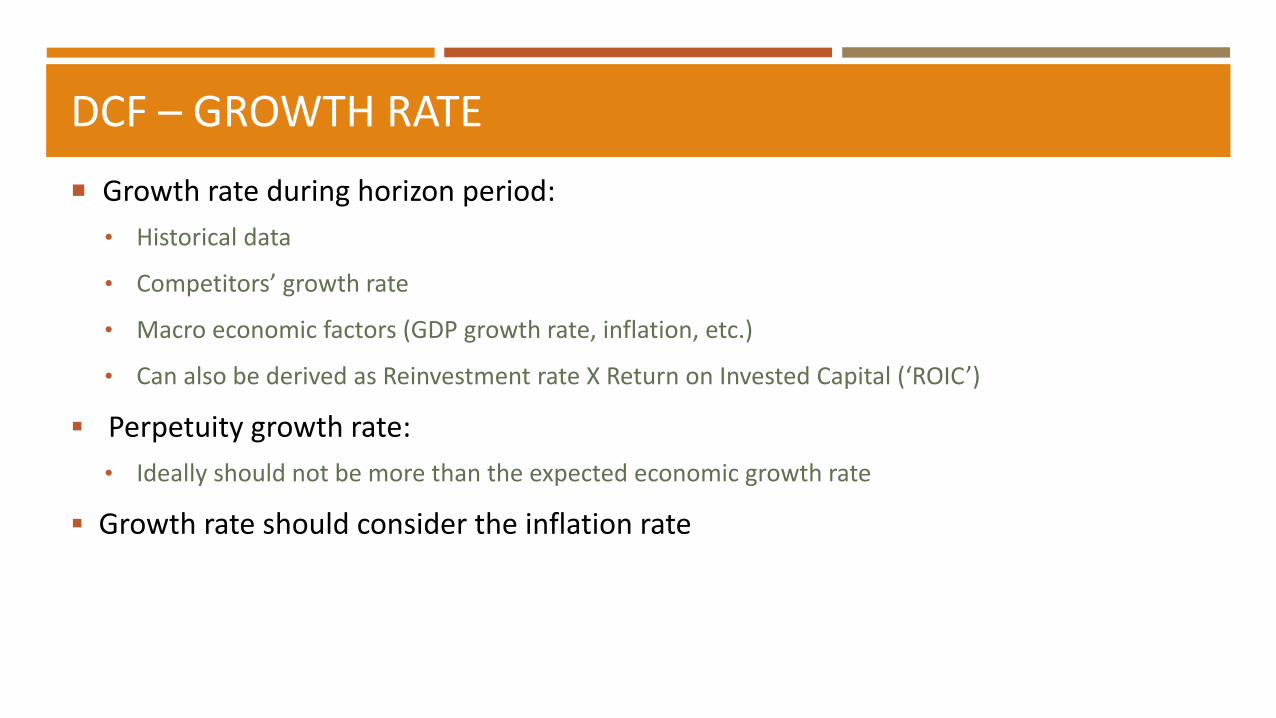
DCF – GROWTH RATE
Growth rate during horizon period:
• Historical data
• Competitors’ growth rate
• Macro economic factors (GDP growth rate, inflation, etc.)
• Can also be derived as Reinvestment rate X Return on Invested Capital (‘ROIC’)
Perpetuity growth rate:
• Ideally should not be more than the expected economic growth rate
Growth rate should consider the inflation rate
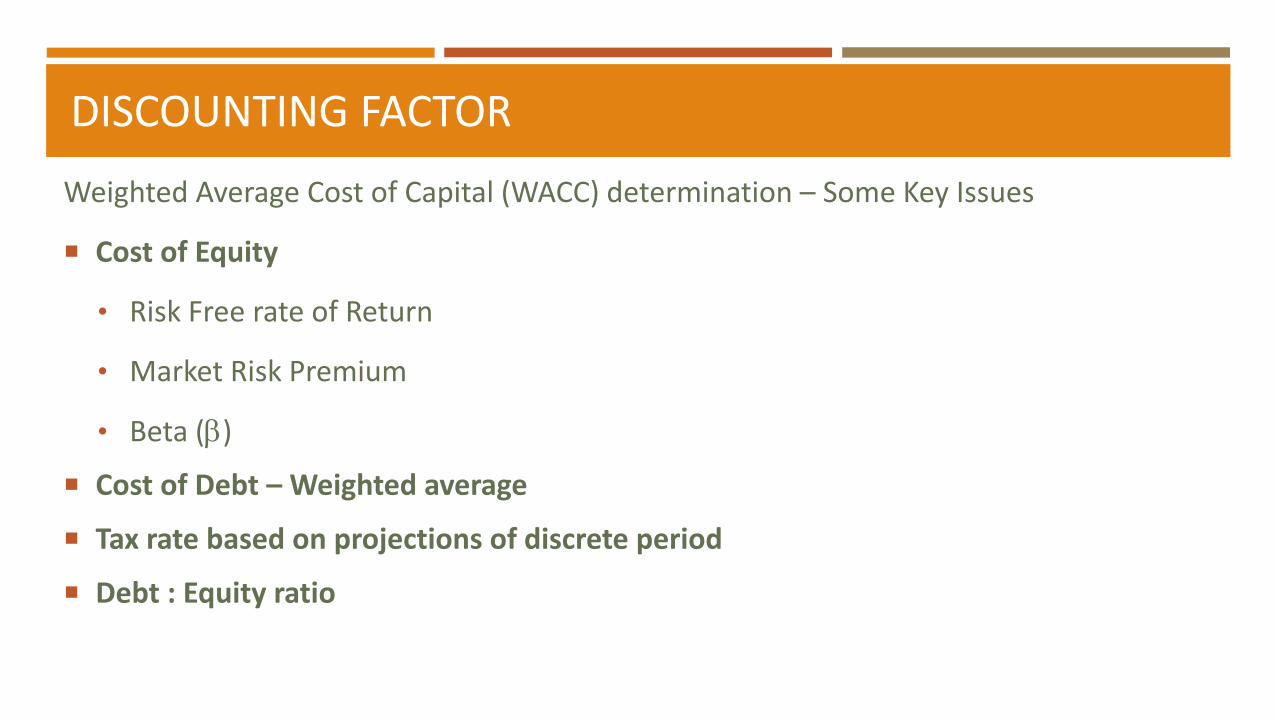
DISCOUNTING FACTOR
Weighted Average Cost of Capital (WACC) determination – Some Key Issues
Cost of Equity
• Risk Free rate of Return
• Market Risk Premium
• Beta ()
Cost of Debt – Weighted average
Tax rate based on projections of discrete period
Debt : Equity ratio

DISCOUNTING FACTOR
Weighted Average Cost of Capital (WACC) =
D = Debt
E = Equity
Kd = Post tax cost of debt
Ke = Cost of equity
D E
(D + E) (D + E)Kex Kd + x

COST OF EQUITY
In CAPM Method, all the market risk is captured in the beta, measured relative to a market portfolio, which atleast in theory should include all traded assets in the market place held in proportion to their market value
Ke = (Rf + (β x Erp))
Where,
Ke = Cost of Equity
Rf = Risk free return
Erp = Equity risk premium
β = Beta

RISK FREE RATE AND EQUITY RISK PREMIUM
Risk Free Rate
Expected rate of return on a risk free asset
For an investment return to be risk free, two conditions have to be met:
a) No default risk
b) No uncertainty about reinvestment rates
For e.g. Government Securities
Equity Risk Premium
It measures the extra return that would be demanded by investors for shifting their money from a riskless investment to a risk bearing investment
There are 2 ways of estimating risk premium in CAPM
a) Large investors can be surveyed about their expectations for the future
b) The actual premiums earned over a past period can be obtained from historical data

BETA
Beta: A measure of the volatility, or systematic risk, of a security or a portfolio in comparison to the market as a whole
In CAPM, the beta of the asset has to be estimated relative to the market portfolio
There are 3 approaches available for estimating these parameters:
a) Historic Market Beta
b) Fundamental Beta
c) Accounting Beta

BETA
This is the conventional approachfor estimating beta
Beta of an asset = Covariance ofasset with market portfolio /Variance of the market Portfolio(Regression analysis)
• The beta for a firm may beestimated from a regression but itis determined by fundamentaldecisions that the firm has madeon
a) What business to be in?b) How much operating leverage to
use in business?c) The degree to which the firm uses
financial leverage
• It estimates the market riskparameters from accountingearnings rather than from tradedprices
• Thus, changes in earnings of adivision or a firm, on a quarterly oran annual basis, can be regressedagainst changes in earnings for themarket, in the same periods, toarrive at an estimate of a marketbeta to use in the CAPM
Historical Market Beta Fundamental Beta Accounting Beta

UNLEVERED BETA
A type of metric that compares the risk of an unlevered Company to the risk of the market. The unlevered beta is the beta of a company without any debt
Unlevering a beta removes the financial effects from leverage
The formula to calculate a company's unlevered beta is:
BL [1+( 1-Tc ) X (D/E)]
Where:BL is the firm's beta with leverage.Tc is the corporate tax rate.D/E is the company's debt/equity ratio
BU=

ILLUSTRATION
Relevered Beta = Unlevered Beta X 1+(1-Tax Rate) X Debt/Equity Ratio
Calculation of Relevered Beta of Comparable Companies of Co. X Ltd.
(INR crores)
Reported BetaMarket Value
of DebtMarket Equity
D/E Ratio
(A/B)Effective Tax Rate Unlevered Beta
A B C B/C D A/[1+(1-D)*(B/C)]
Co. P Ltd. 0.72 1,100.00 5,500.00 0.20 34.61% 0.64
Co. Q Ltd. 0.88 400.00 1,400.00 0.29 34.61% 0.78
Co. R Ltd. 0.49 - 500.00 - 34.61% 0.49
Average Reported Beta 0.70 Average Unlevered Beta 0.64
Relevered Beta Co. X Ltd.
Unlevered Beta 0.64
Debt 0.25
Equity 0.75
Debt / Equity Ratio 0.33
Tax Rate 34.61%
Relevered Beta 0.77
Name of Company

COST OF DEBT
The cost of debt is the rate at which a firm can borrow money today and will depend on the default risk embedded in the firm
• Default risk can be measured using a bond rating or by looking at financial ratios
Possible sources of information:
• Cost of debt currently incurred
• Current market cost of borrowing incurred by comparable companies that have similar credit worthiness
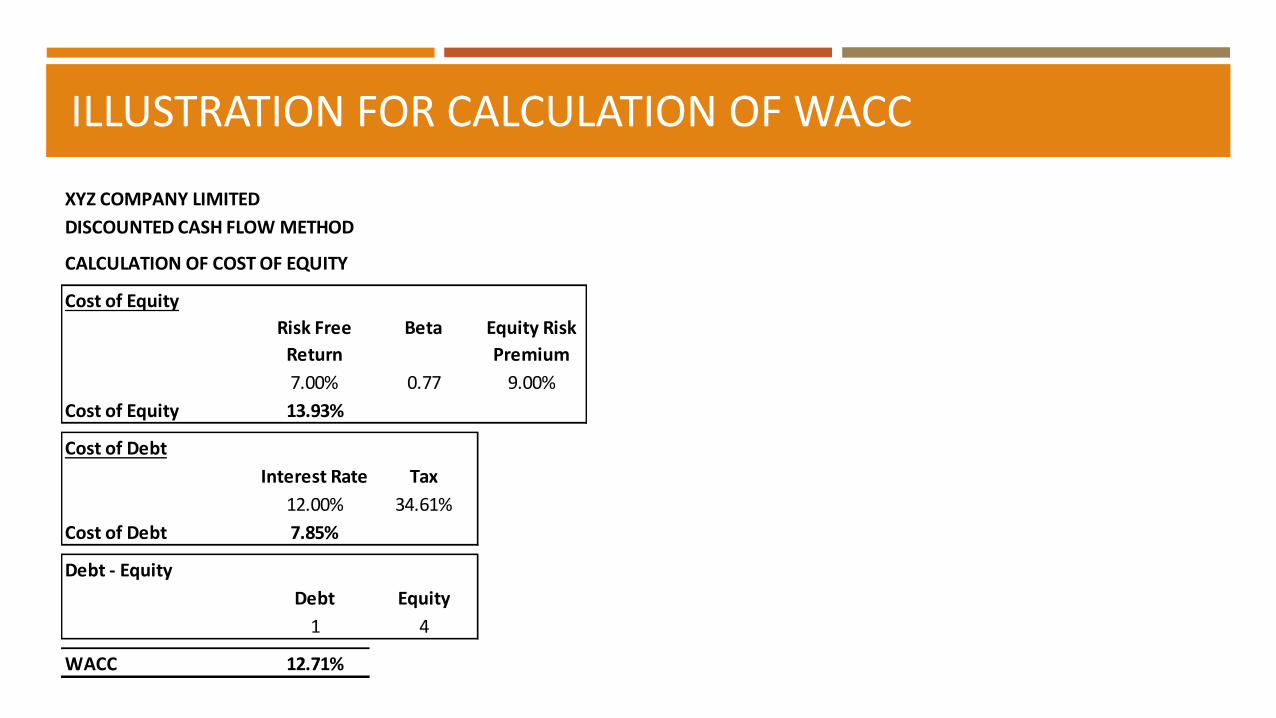
ILLUSTRATION FOR CALCULATION OF WACC
XYZ COMPANY LIMITED
DISCOUNTED CASH FLOW METHOD
CALCULATION OF COST OF EQUITY
Cost of Equity
Risk Free
Return
Beta Equity Risk
Premium
7.00% 0.77 9.00%
Cost of Equity 13.93%
Cost of Debt
Interest Rate Tax
12.00% 34.61%
Cost of Debt 7.85%
Debt - Equity
Debt Equity
1 4
WACC 12.71%

TERMINAL VALUE
Terminal Value is the residual value of business at the end of projection period used in discounted cash flow method
Terminal Value
Liquidation Approach
Multiple Approach
Stable Growth Approach

TERMINAL VALUE
It is assumed that the firm willcease operations at a point of timein future and sell the assets it hasaccumulated
Value based on book value Value based on earning power of
asset
• The value of firm in a future year isestimated by applying a multiple tothe firm’s earning or revenue in thatyear
• For instance, a firm with expectedrevenues of Rs.6 billion ten yearsfrom now will have an estimatedterminal value in that year of Rs.12billion if a value to sales multiple of 2is used. If FCFE model, use equitymultiples such as price earningsratios to arrive at the terminal value
• It is assumed that firm has a finitelife with constant growth rate
Terminal Value = Cash flow t + 1(r – g stable)
Liquidation Approach Multiple Approach Stable Growth Approach

DCF VALUE
Enterprise Value
Future cash flows during explicit
period
Cash flows for perpetuity
Present value
Present value

ADJUSTMENTS
Market value of the investments
Other non-operating surplus assets
Surplus cash
Contingent liabilities / assets
Loan Funds
Preference Share Capital

WHEN TO USE ?
1. • Most appropriate for valuing firms
2. • Limited life projects
3. • Large initial investments and predictable cash flows
4. • Regulated business
5. • Start-up companies

EXAMPLE – FREE CASH FLOW TO FIRM
(INR Million)
Particulars 2018-19 2019-20 2020-21 2021-22 2022-23 Perpetuity
EBITDA 556 642 728 755 792
Less: Outflows
Capital Expenditure 45 45 45 45 45
Incremental Working Capital 20 30 25 33 40
Tax 158 182 182 204 214
Total Outflow 223 257 252 282 299
Free Cash Flow (FCF) 333 385 476 473 493
Cash Flow for 2022-23 493
Growth Rate 3%
Capitalised Value for Perpetuity 5,116
Discounting Factor 12.93% 0.89 0.78 0.69 0.61 0.54 0.54
Net Present Value of Cash Flows 295 302 331 291 269 2,785
Enterprise Value 4,272
Less: Loan Funds (930)
Add: Surplus Cash 150
Add: Value of Investments 850
Adjusted Value For Equity Shareholders 4,342
No. of Equity Shares 9,00,000
Value per share (INR) (FV INR 10) 4,824

EXAMPLE – FREE CASH FLOW TO EQUITY
(INR Million)
Particulars 2018-19 2019-20 2020-21 2021-22 2022-23 Perpetuity
EBTDA 500 598 682 709 746
Less: Outflows
Add/Less: (Loan taken)/Repaid 37 37 37 37 37
Capital Expenditure 45 45 45 45 45
Incremental Working Capital 20 30 25 33 40
Tax 158 182 182 203 214
Total Outflow 260 294 289 319 336
Free Cash Flow (FCF) 240 304 393 390 410
Cash Flow for 2022-23 410
Growth Rate 3%
Capitalised Value for Perpetuity 3,770
Discounting Factor 14.20% 0.88 0.77 0.67 0.59 0.51 0.51
Net Present Value of Cash Flows 210 233 264 230 211 1,941
Enterprise Value 3,088
Add: Surplus Cash 150
Add: Value of Investments 850
Adjusted Value For Equity Shareholders 4,088
No. of Equity Shares 9,00,000
Value per share (INR) (FV INR 10) 4,543

ISSUES IN DCF VALUATION

ISSUES IN DCF VALUATION
Projections are highly subjective hence could be inaccurate
Inapplicable where projections cannot be made for the horizon period
Difficulties in measuring risks
Loss making companies
Start-up companies
Assumptions about cash flows and discount rates to be internally consistent (e.g. pre-tax/post-tax discount rate)
Discount rates to be consistent with underlying currency in which cash flows are made

JUDICIAL PRONOUNCEMENTS
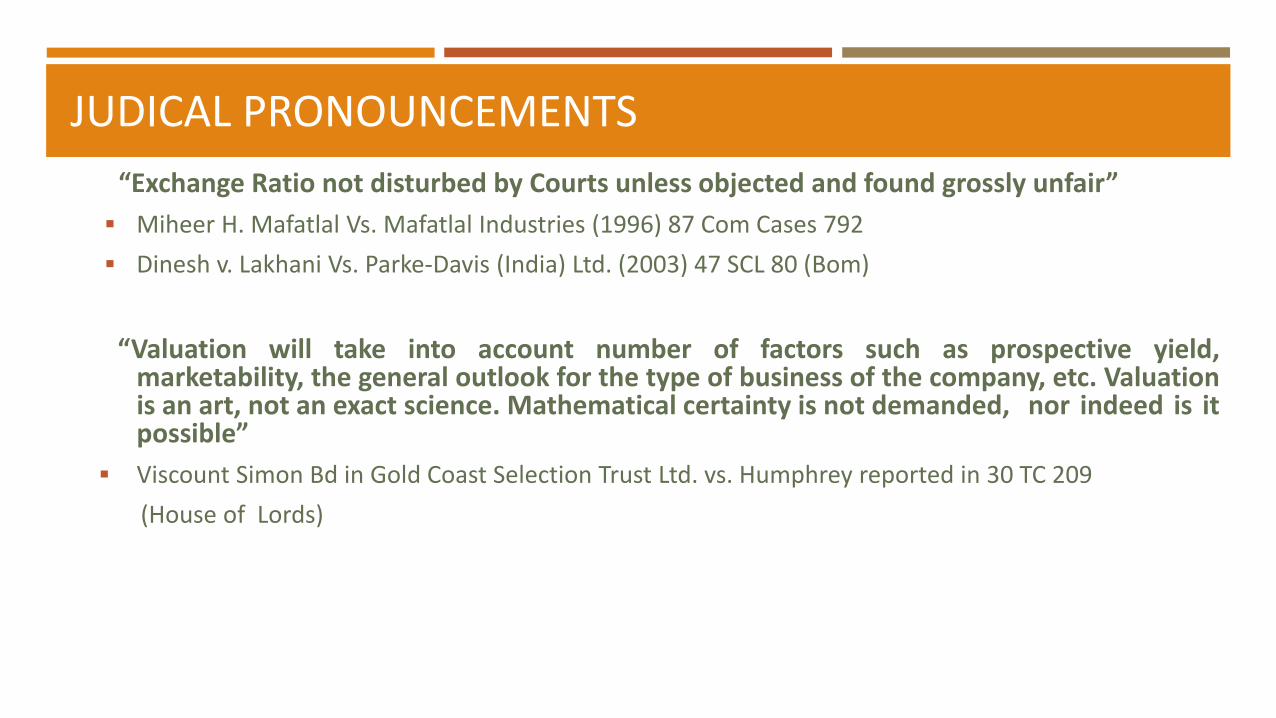
JUDICAL PRONOUNCEMENTS
“Exchange Ratio not disturbed by Courts unless objected and found grossly unfair”
Miheer H. Mafatlal Vs. Mafatlal Industries (1996) 87 Com Cases 792
Dinesh v. Lakhani Vs. Parke-Davis (India) Ltd. (2003) 47 SCL 80 (Bom)
“Valuation will take into account number of factors such as prospective yield,marketability, the general outlook for the type of business of the company, etc. Valuationis an art, not an exact science. Mathematical certainty is not demanded, nor indeed is itpossible”
Viscount Simon Bd in Gold Coast Selection Trust Ltd. vs. Humphrey reported in 30 TC 209
(House of Lords)

JUDICAL PRONOUNCEMENTS
“It is fair to use combination of three well known methods - asset value, yield value & market value”
Hindustan Lever Employees ‘ Union Vs. HLL (1995) 83 Com. Case 30 SC
“No valuation is to be disregarded merely because it has used one or the other of variousmethods. It must be shown that the chosen method of valuation is such as has resulted inan artificially depressed or contrived valuation well below what a fair-minded person mayconsider reasonable.”
Cadbury India Limited Vs. Mrs Malati Samant and Mr Alok C. Churiwala (Samant Group and Churiwala Group) (2014) (Bom HC)

Top Related