


Languages
Pages
Legal

Optimization for Centrifuge DewateringWEFTEC New Orleans, Louisiana
Rashi Gupta, P.E.
Steve Walker, CWPCarollo Engineers
September 28, 2016
File
nam
e.pp
t/2
Questions to Answer Today…
• Why is optimization important?
• What should I consider within my dewatering process?
• How do I systematically optimize the process?
File
nam
e.pp
t/3
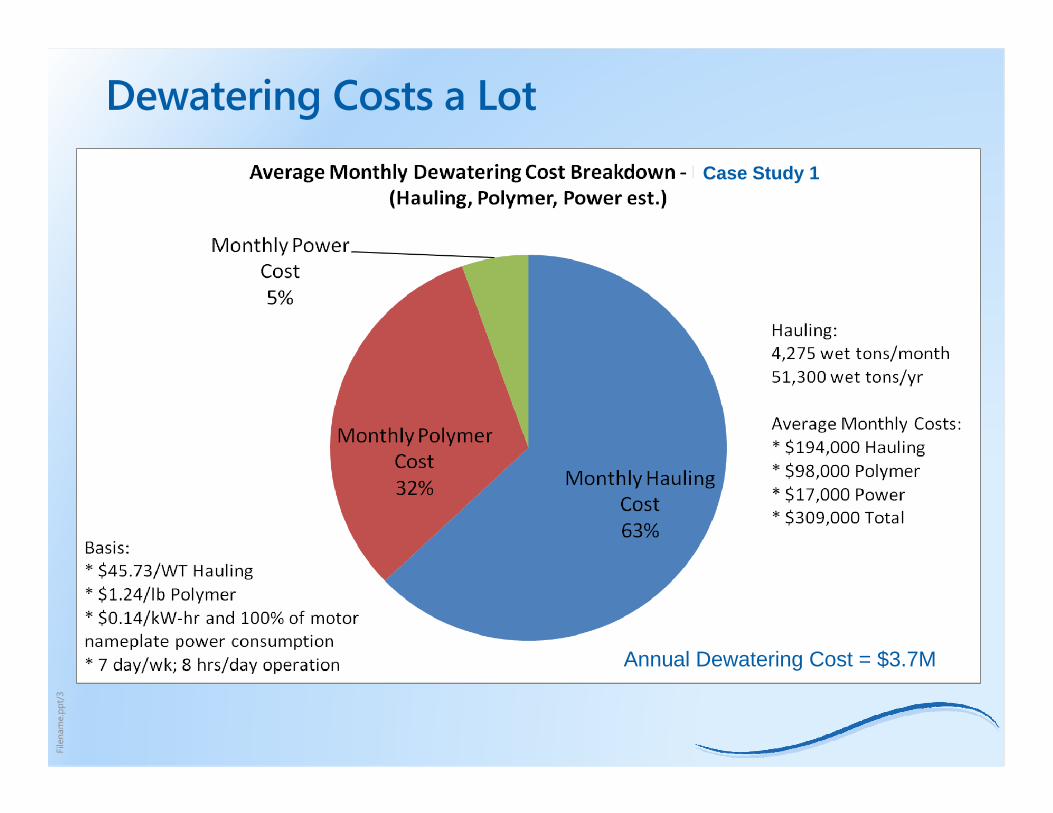
Dewatering Costs a Lot
Annual Dewatering Cost = $3.7M
Case Study 1
File
nam
e.pp
t/4
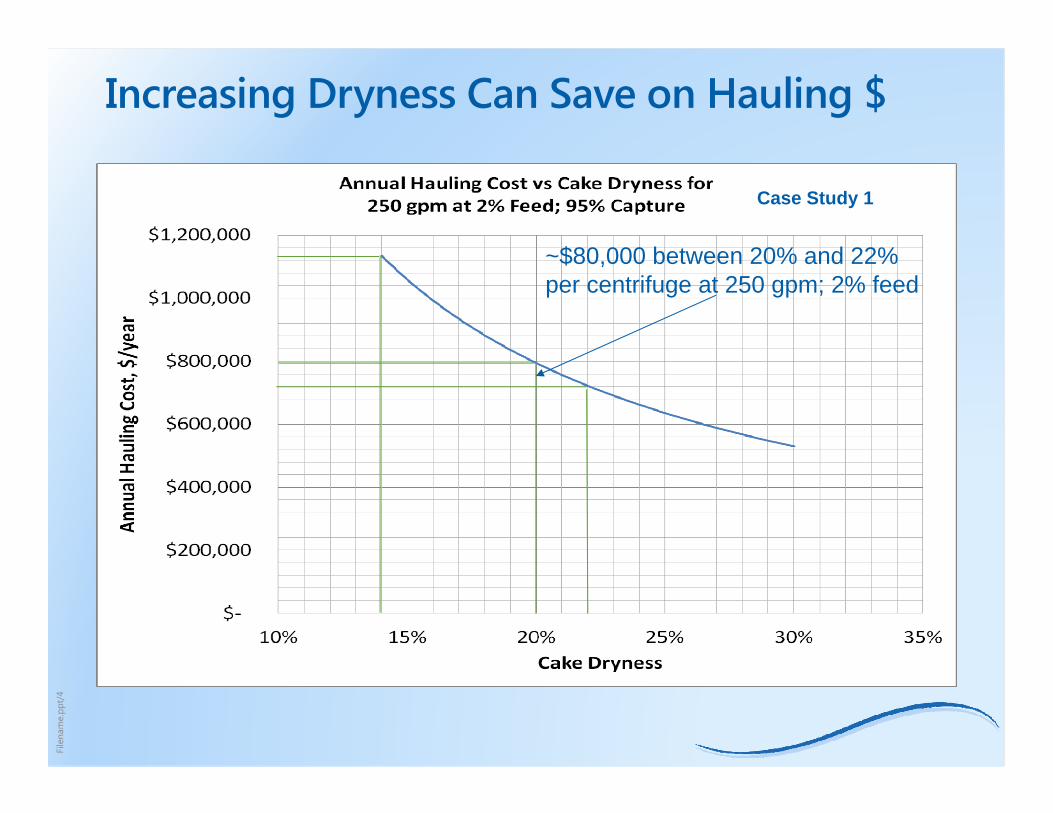
Increasing Dryness Can Save on Hauling $
~$80,000 between 20% and 22% per centrifuge at 250 gpm; 2% feed
Case Study 1
File
nam
e.pp
t/5
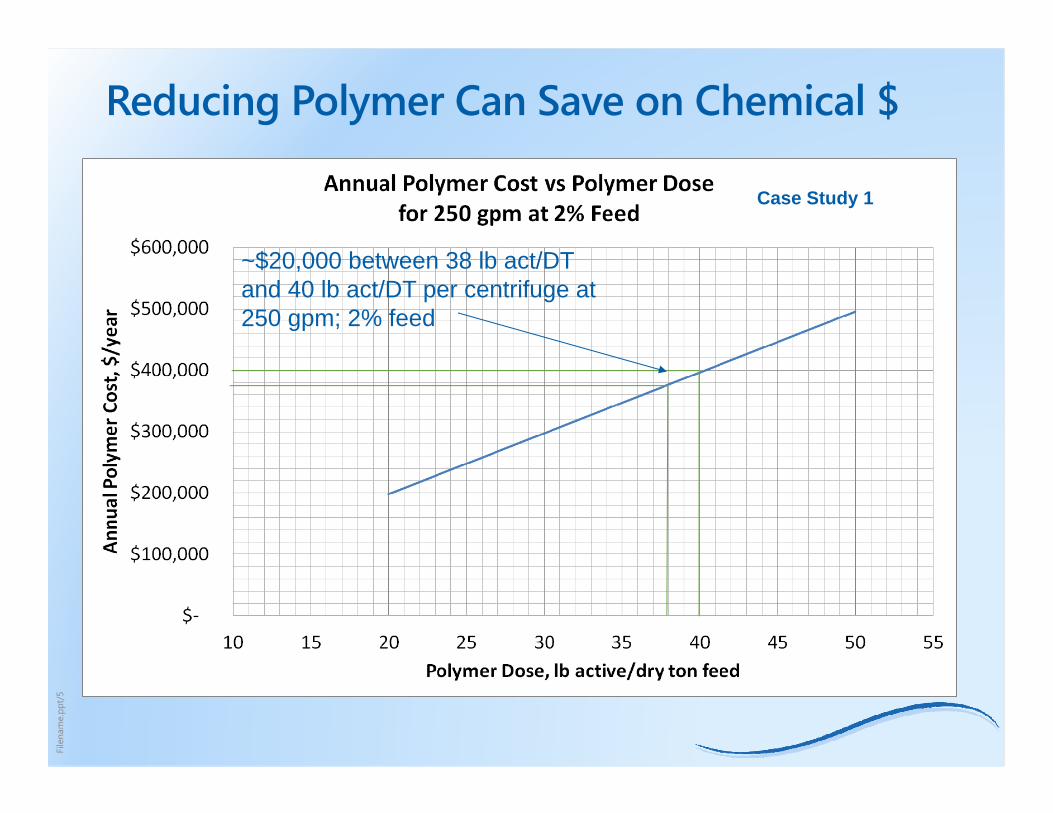
Reducing Polymer Can Save on Chemical $
~$20,000 between 38 lb act/DT and 40 lb act/DT per centrifuge at 250 gpm; 2% feed
Case Study 1
File
nam
e.pp
t/6
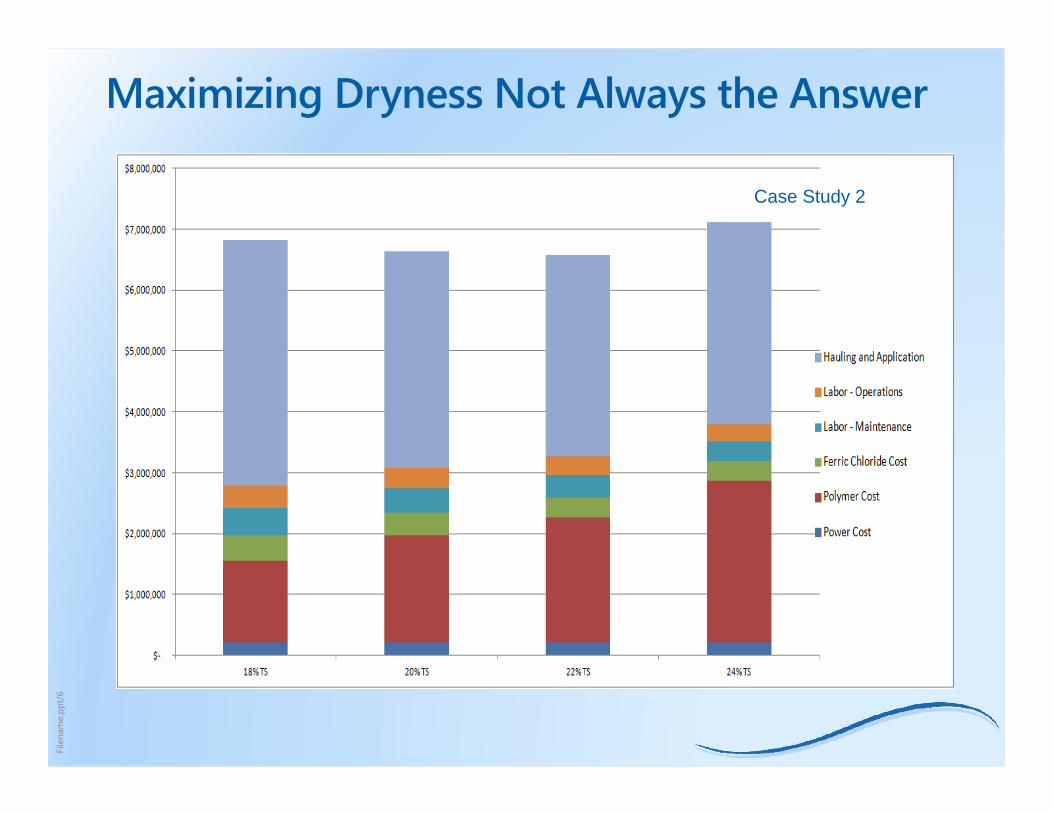
Maximizing Dryness Not Always the Answer
Case Study 2
File
nam
e.pp
t/7
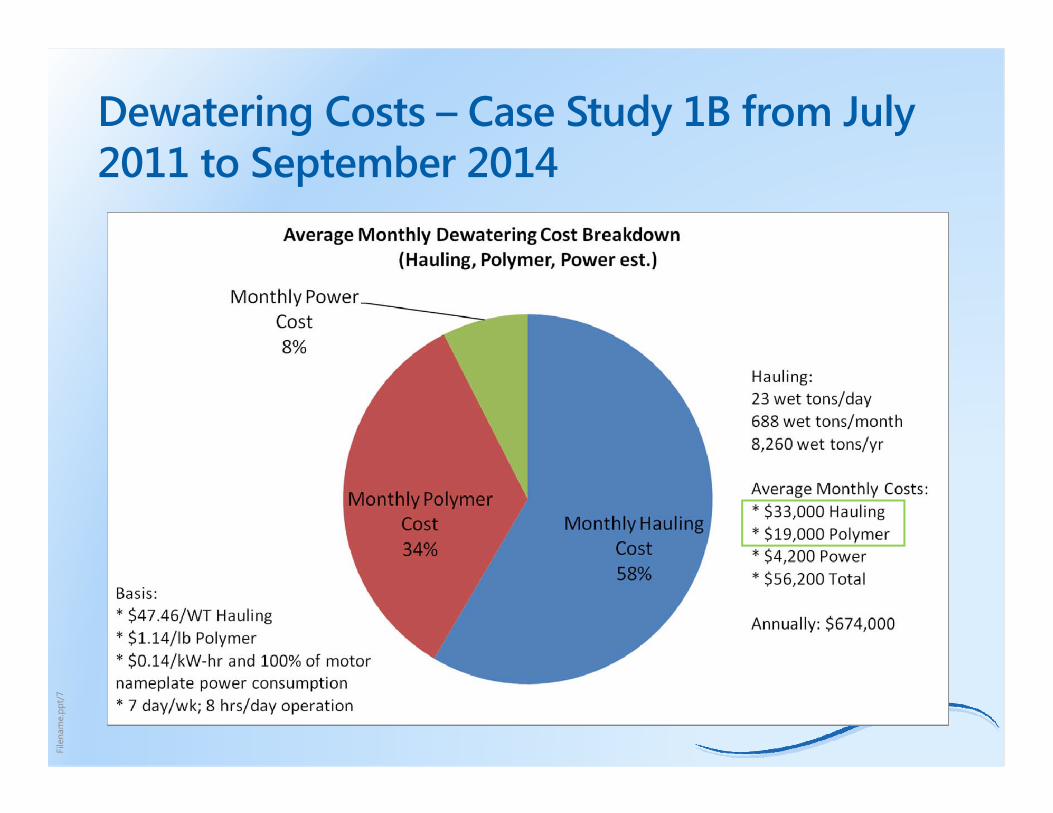
Dewatering Costs – Case Study 1B from July 2011 to September 2014
File
nam
e.pp
t/8
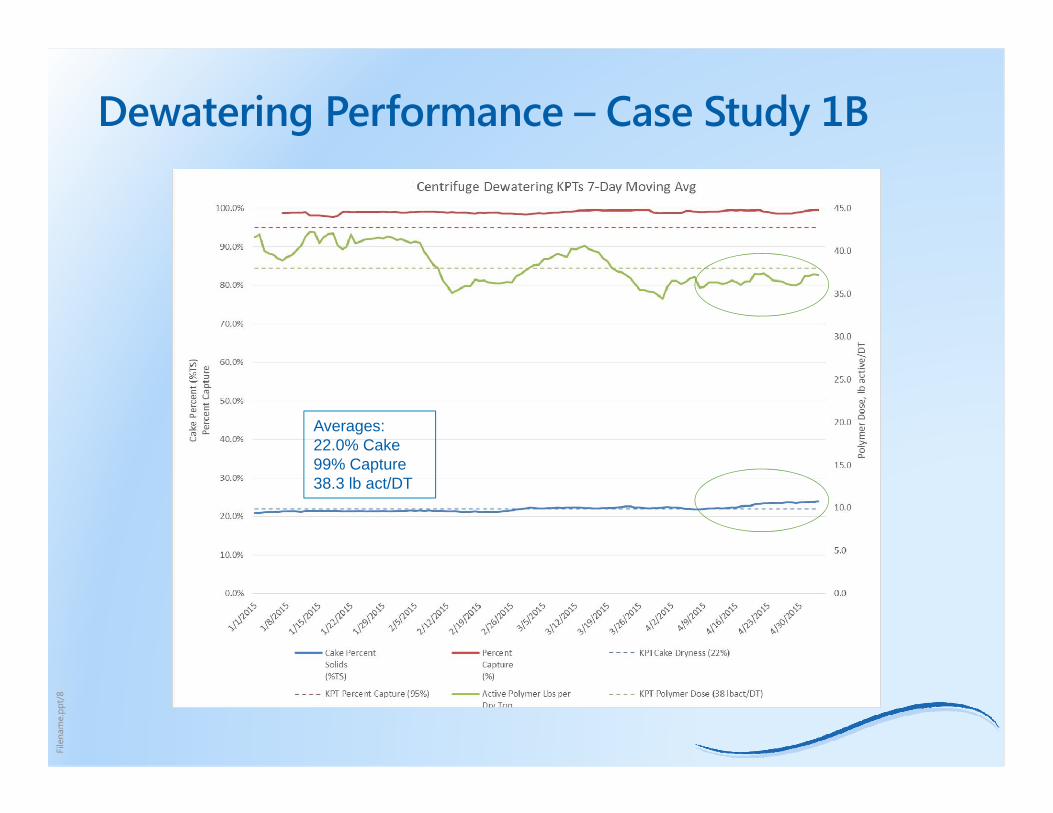
Dewatering Performance – Case Study 1B
Averages:22.0% Cake99% Capture38.3 lb act/DT

File
nam
e.pp
t/9
Case Study 1B Dewatering Costs – Before and After
• 2011-2014 Monthly Costs − $33,000 Hauling
− $19,000 Polymer
− $52,000 Total
• 2015 Monthly Costs− $29,500 Hauling
− $15,600 Polymer
− $45,100 Total

File
nam
e.pp
t/10
DEWATERING SYSTEM CONSIDERATIONS
File
nam
e.pp
t/11
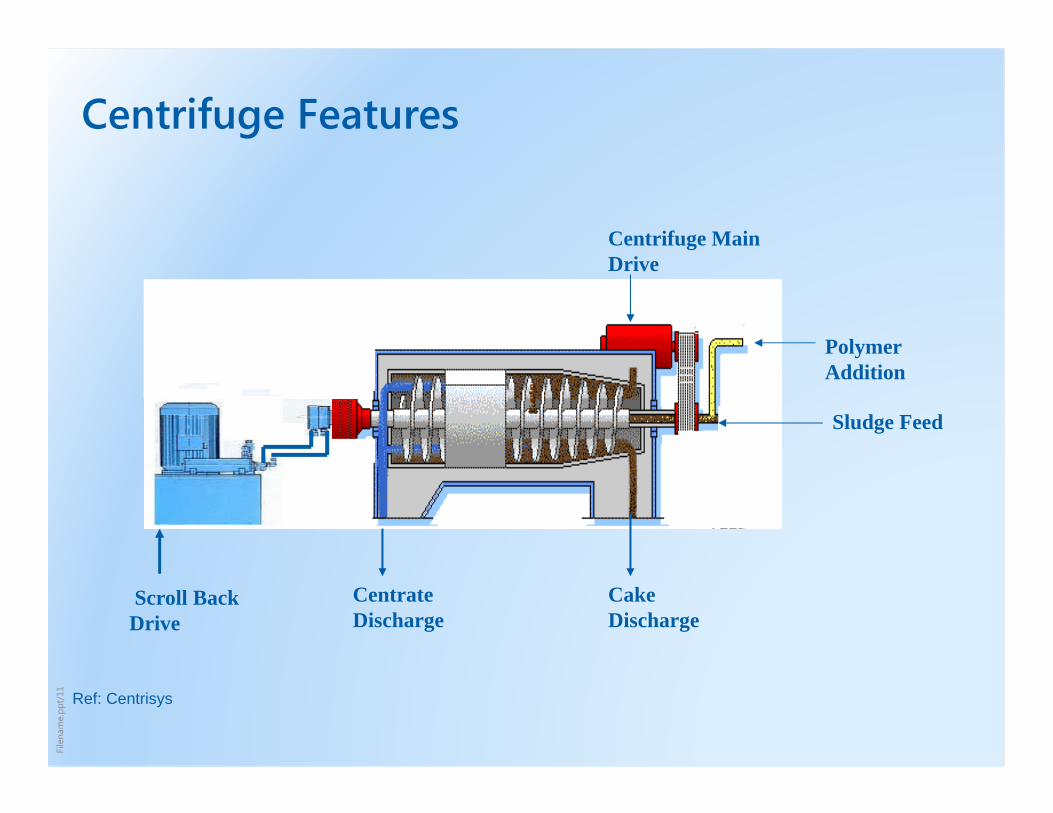
Centrifuge Features
Polymer Addition
Sludge Feed
Cake Discharge
Centrate Discharge
Centrifuge Main Drive
Scroll Back Drive
Ref: Centrisys
File
nam
e.pp
t/12
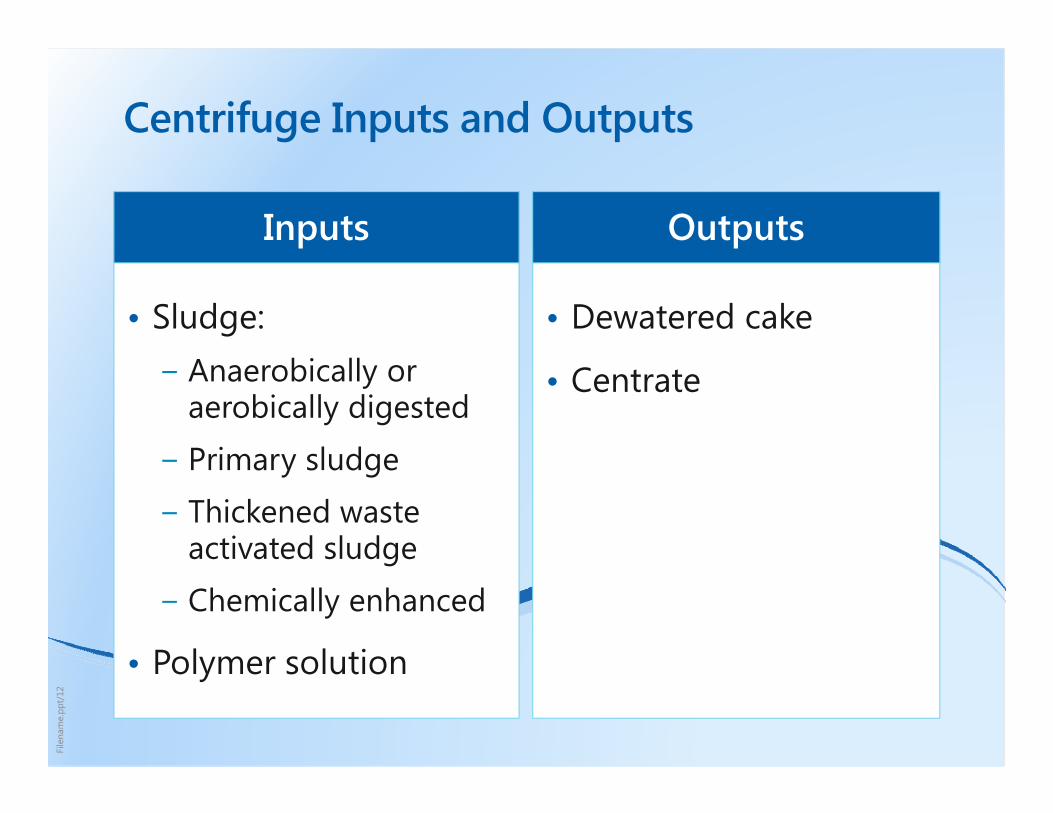
• Dewatered cake
• Centrate
• Sludge: − Anaerobically or
aerobically digested
− Primary sludge
− Thickened waste activated sludge
− Chemically enhanced
• Polymer solution
Centrifuge Inputs and Outputs
Inputs Outputs
File
nam
e.pp
t/13
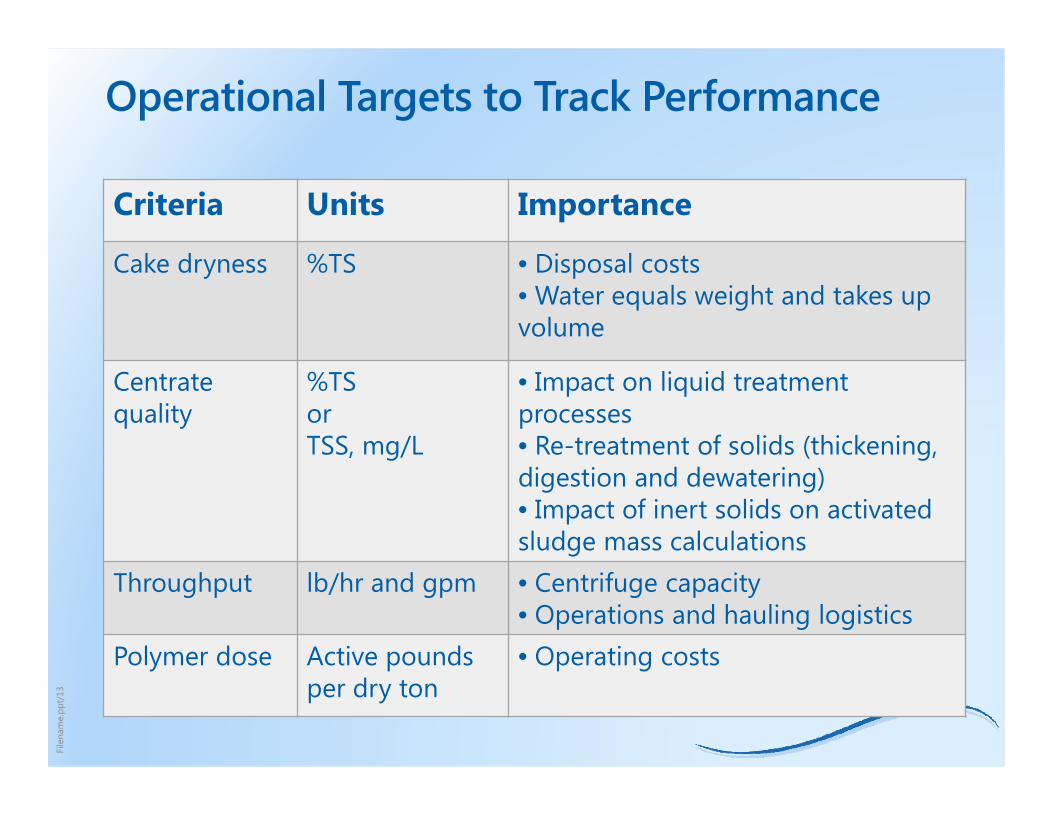
Operational Targets to Track Performance
Criteria Units Importance
Cake dryness %TS • Disposal costs • Water equals weight and takes up volume
Centrate quality
%TS or TSS, mg/L
• Impact on liquid treatment processes• Re-treatment of solids (thickening, digestion and dewatering) • Impact of inert solids on activated sludge mass calculations
Throughput lb/hr and gpm • Centrifuge capacity• Operations and hauling logistics
Polymer dose Active pounds per dry ton
• Operating costs
File
nam
e.pp
t/14
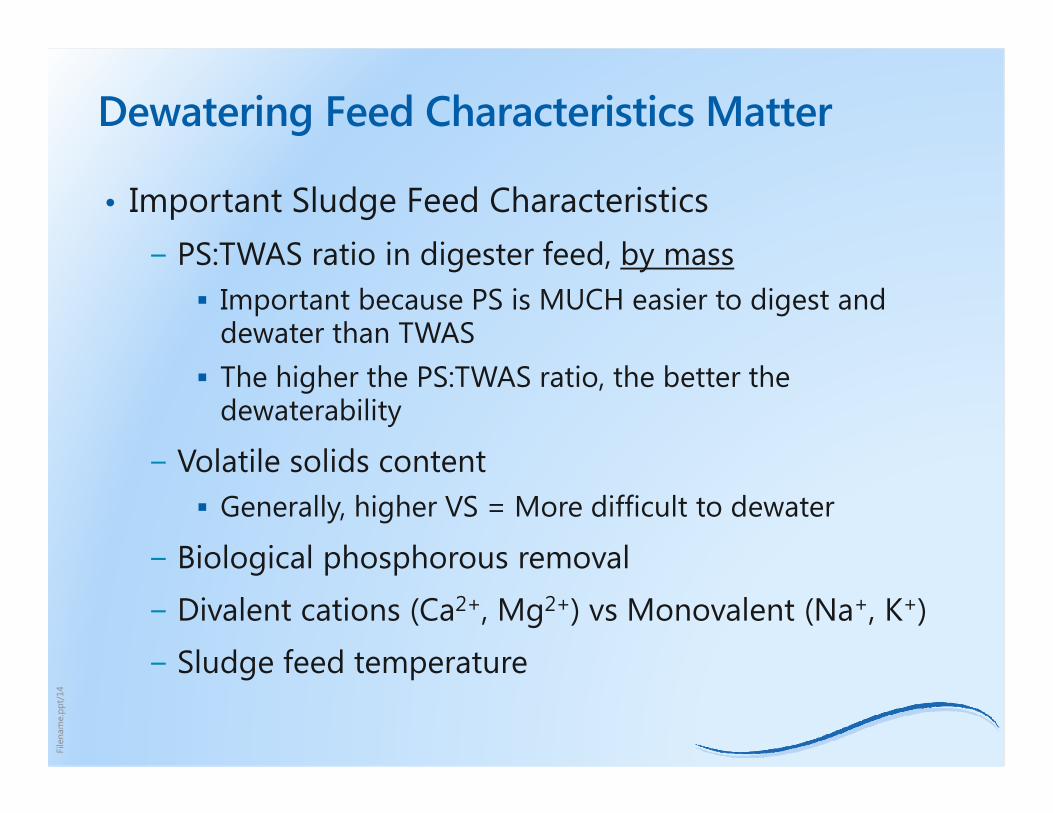
Dewatering Feed Characteristics Matter
• Important Sludge Feed Characteristics− PS:TWAS ratio in digester feed, by mass
Important because PS is MUCH easier to digest and dewater than TWAS
The higher the PS:TWAS ratio, the better the dewaterability
− Volatile solids content Generally, higher VS = More difficult to dewater
− Biological phosphorous removal
− Divalent cations (Ca2+, Mg2+) vs Monovalent (Na+, K+)
− Sludge feed temperature
File
nam
e.pp
t/15
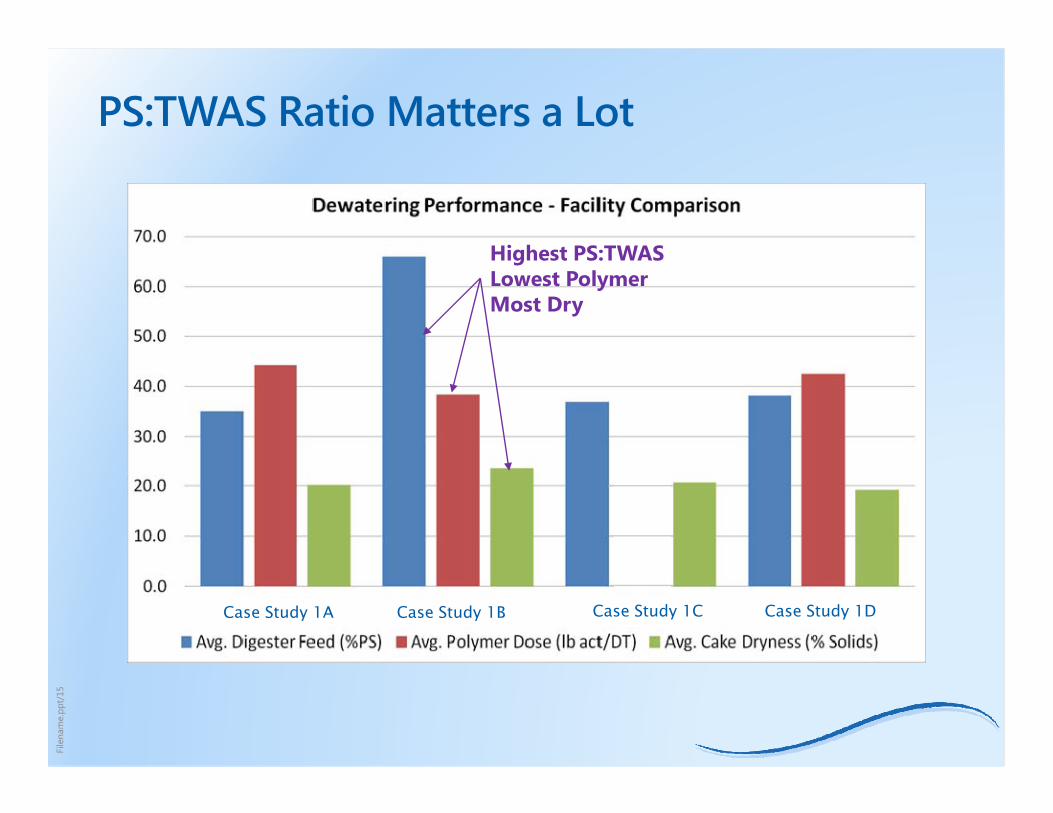
PS:TWAS Ratio Matters a Lot
Case Study 1A Case Study 1B Case Study 1C Case Study 1D
Highest PS:TWASLowest PolymerMost Dry
File
nam
e.pp
t/16
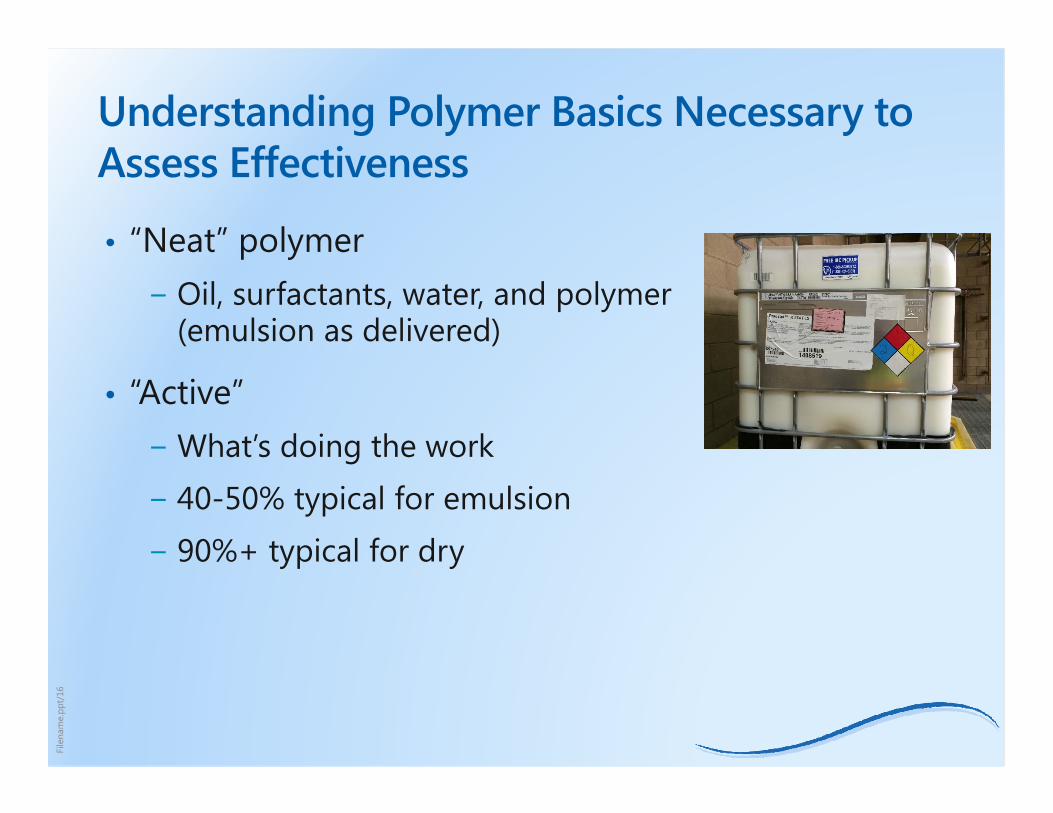
Understanding Polymer Basics Necessary to Assess Effectiveness
• “Neat” polymer − Oil, surfactants, water, and polymer
(emulsion as delivered)
• “Active” − What’s doing the work
− 40-50% typical for emulsion
− 90%+ typical for dry
File
nam
e.pp
t/17
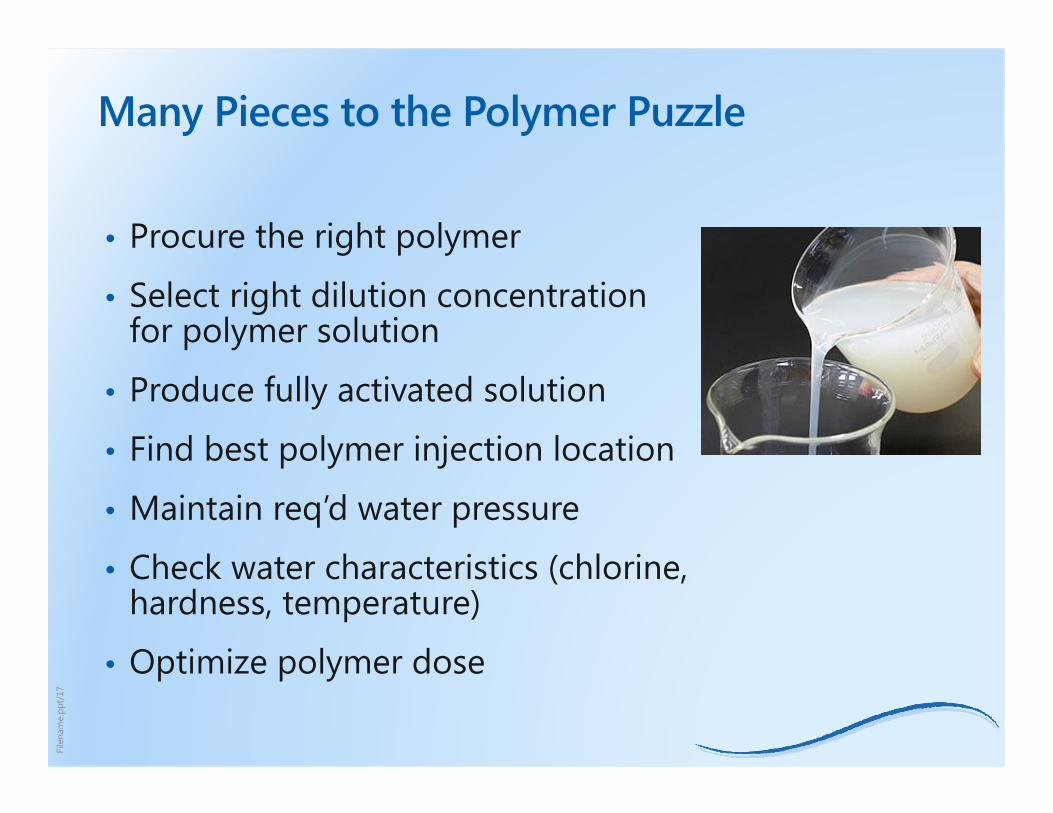
Many Pieces to the Polymer Puzzle
• Procure the right polymer
• Select right dilution concentration for polymer solution
• Produce fully activated solution
• Find best polymer injection location
• Maintain req’d water pressure
• Check water characteristics (chlorine, hardness, temperature)
• Optimize polymer dose
File
nam
e.pp
t/18
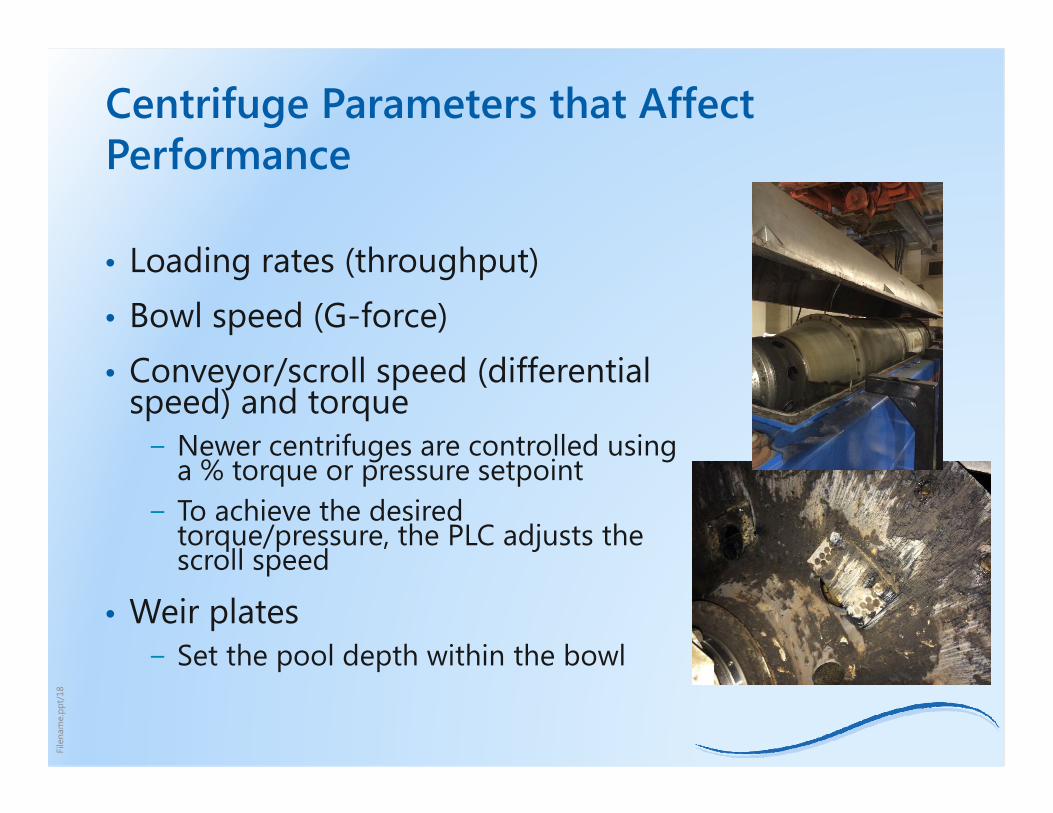
• Loading rates (throughput)• Bowl speed (G-force)• Conveyor/scroll speed (differential
speed) and torque− Newer centrifuges are controlled using
a % torque or pressure setpoint − To achieve the desired
torque/pressure, the PLC adjusts the scroll speed
• Weir plates− Set the pool depth within the bowl
Centrifuge Parameters that Affect Performance
File
nam
e.pp
t/19
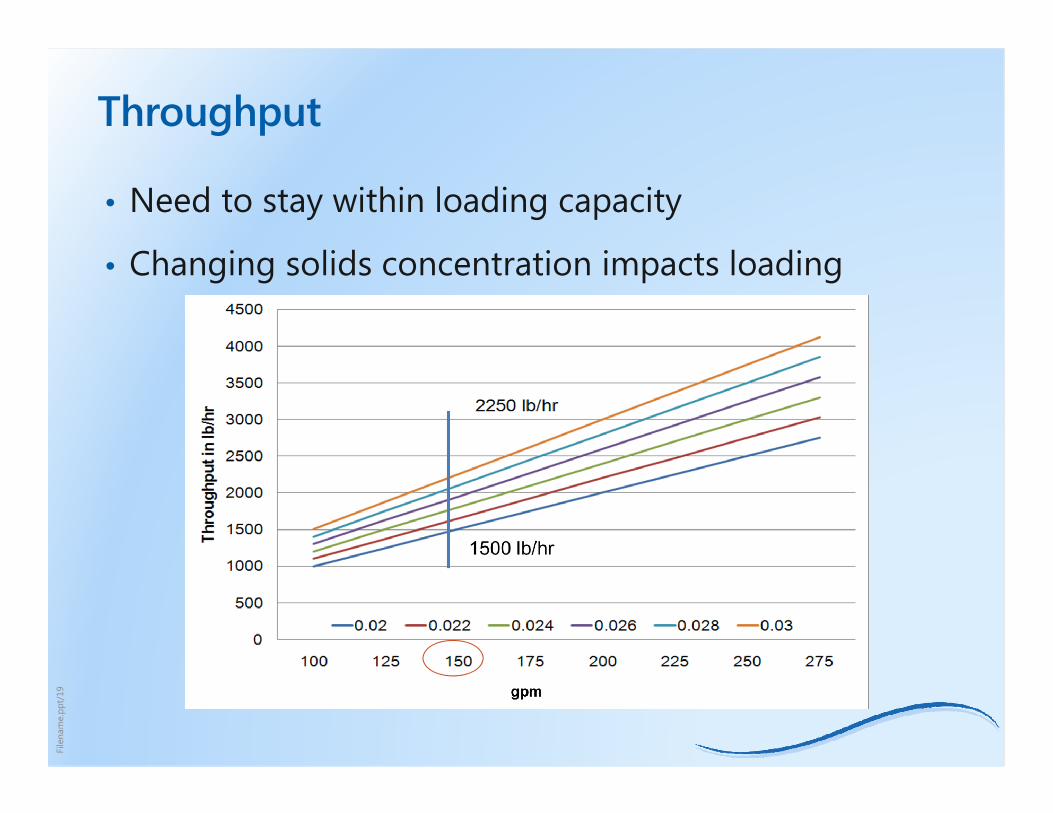
Throughput
• Need to stay within loading capacity
• Changing solids concentration impacts loading

File
nam
e.pp
t/20
Throughput
Case Study 1A: Data from January 2015 – April 2015
File
nam
e.pp
t/21
OPTIMIZATION APPROACH
File
nam
e.pp
t/22
Process Optimization
• Achieve: − Desired cake dryness and
centrate quality
− Lowest polymer cost
− Maximum throughput and efficiency
• Balancing act: Maximize one or more of the process parameters, while keeping all others within their constraints
File
nam
e.pp
t/23
Parameters used for Optimization
• Type of polymer
• Polymer dose
• Polymer dilution/solution concentration
• Polymer injection point
• Centrifuge torque/pressure
• Centrifuge pond depth
• Centrifuge bowl speed
• Sludge feed (throughput)
• Sludge characteristics

File
nam
e.pp
t/24
Process Optimization – Polymer Selection
• Selecting the right polymer:− Site specific jar testing by different
suppliers High molecular weight for
centrifuge dewatering High charge density helps with
dewatering of secondary sludges Cationic
− Site specific full scale tests with promising polymers
• Full scale tests can identify more effective polymers
• Polymer effectiveness can be gauged through viscosity
File
nam
e.pp
t/25
Polymer Contract Flexibility
• Establish Primary and Alternate supplies− Use two different suppliers rather than two different
products from the same supplier
• Determine if seasonal constraints support alternatives. For example:− An emulsion polymer may be more cost effective in
winter months
− A dry polymer may be more cost effective in the other months
File
nam
e.pp
t/26
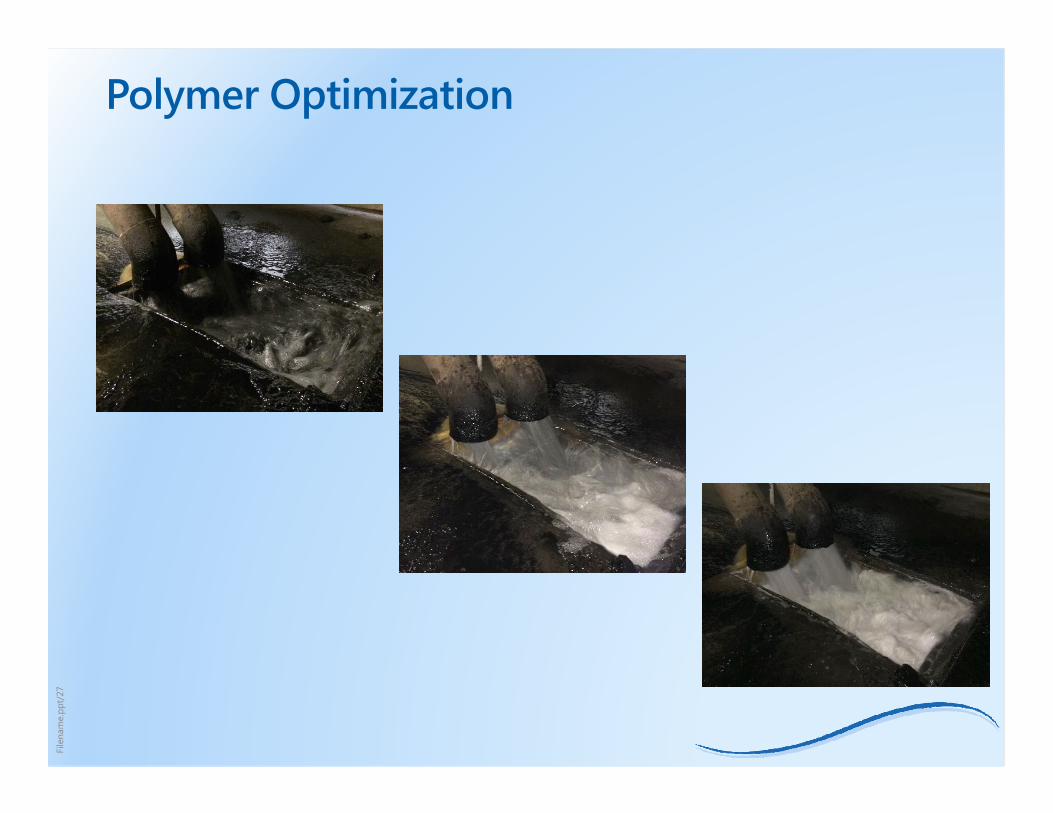
Test Methodology – Phase 1 (Polymer Dose)• Batch polymer at preferred solution strength
• Set sludge feed rate
• Enter typical torque setpoint and bowl speed
• Set lowest polymer feed rate
• Run for a standard time (i.e., 45 minutes)
• Sample feed, centrate and cake for TS/TSS. − Feed solids concentration used to calculate throughput
• Run through sequence for at least 5 polymer feed rates
• Calculate associated dose and plot results
File
nam
e.pp
t/27
Polymer Optimization
File
nam
e.pp
t/28
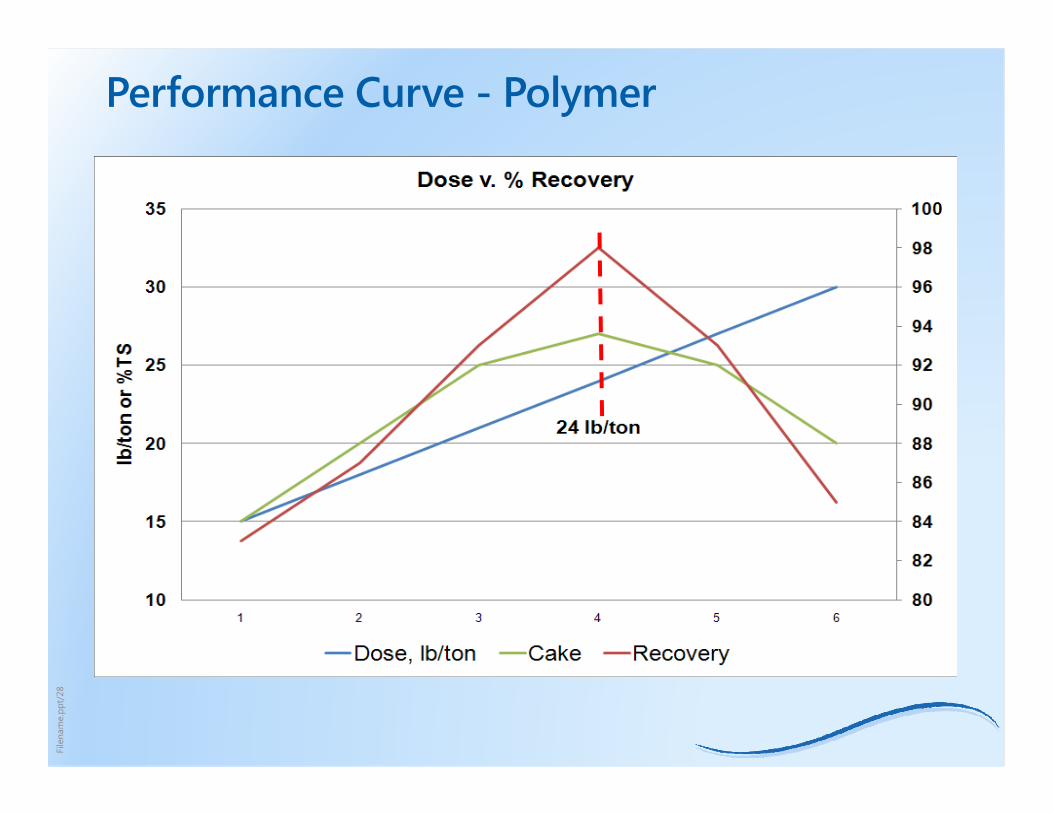
Performance Curve - Polymer
80
82
84
86
88
90
92
94
96
98
100
10
15
20
25
30
35
1 2 3 4 5 6
lb/t
on o
r %
TS
Dose v. % Recovery
Dose, lb/ton Cake Recovery
24
File
nam
e.pp
t/29
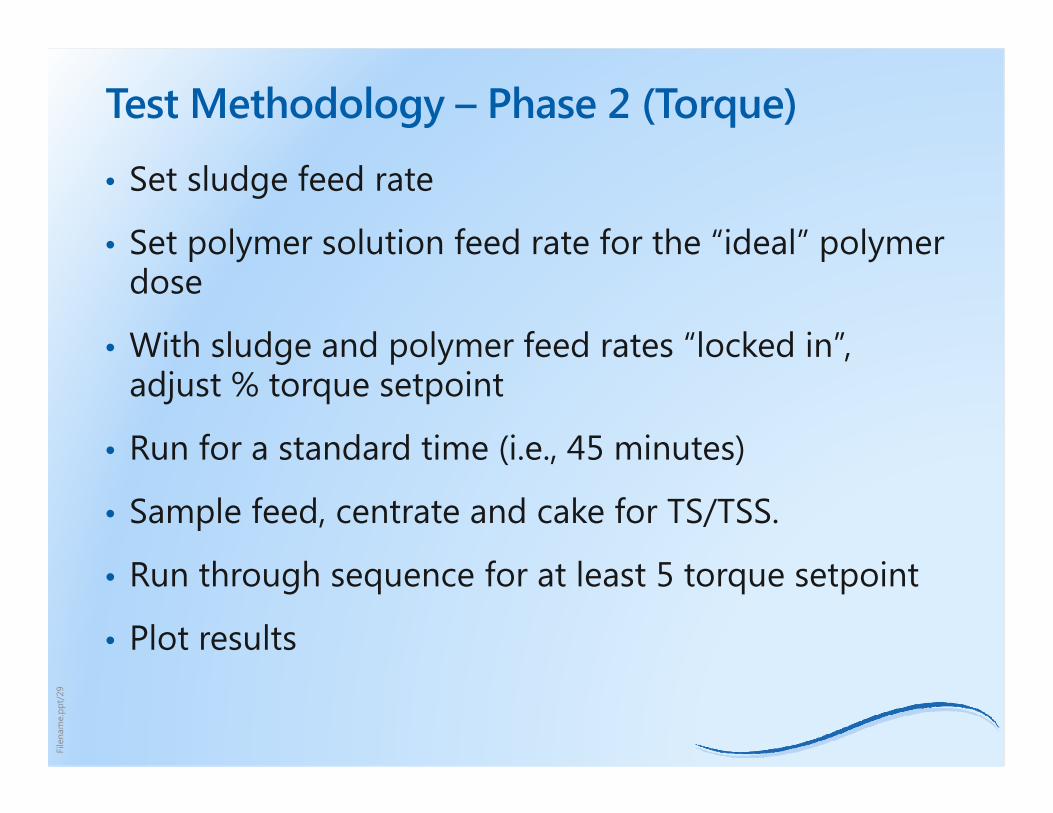
Test Methodology – Phase 2 (Torque)
• Set sludge feed rate
• Set polymer solution feed rate for the “ideal” polymer dose
• With sludge and polymer feed rates “locked in”, adjust % torque setpoint
• Run for a standard time (i.e., 45 minutes)
• Sample feed, centrate and cake for TS/TSS.
• Run through sequence for at least 5 torque setpoint
• Plot results
File
nam
e.pp
t/30
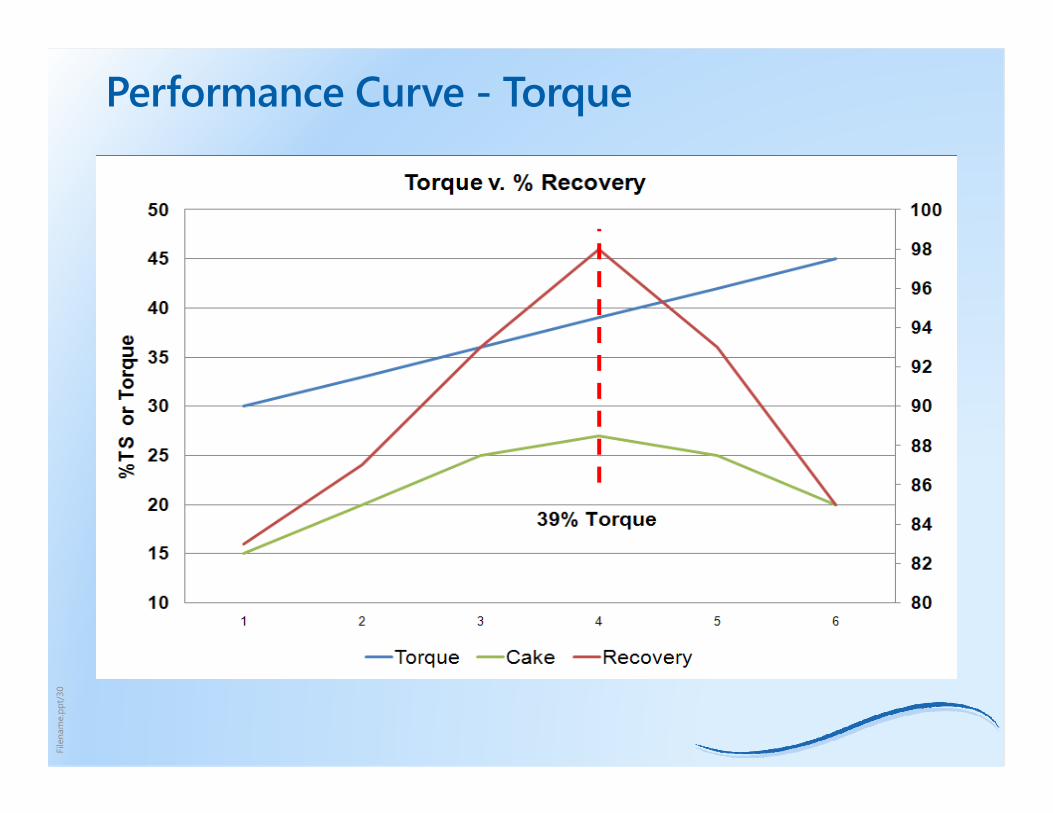
Performance Curve - Torque
80
82
84
86
88
90
92
94
96
98
100
10
15
20
25
30
35
40
45
50
1 2 3 4 5 6
%TS
or
Torq
ue
Torque v. % Recovery
Torque Cake Recovery
39% Torque

File
nam
e.pp
t/31
Further Optimization
• Choose variable to test− Polymer solution concentration or injection point− Throughput− Centrate weir location− Etc.
• Run through same process as above, holding other parameters constant
• Run through sequence with incremental changes to variable
• Plot results

File
nam
e.pp
t/32
Optimize Upstream Processes
• PS:TWAS ratio− If possible, modify upstream
operations to favor PS in the digester feed
• Dewatering feed temperature − Try minimizing storage or
feeding from digesters
• Track VS in dewatering feed
• Plot these parameters and compare to performance
Case Study 1A Case Study 1B Case Study 1C Case Study 1D
File
nam
e.pp
t/33
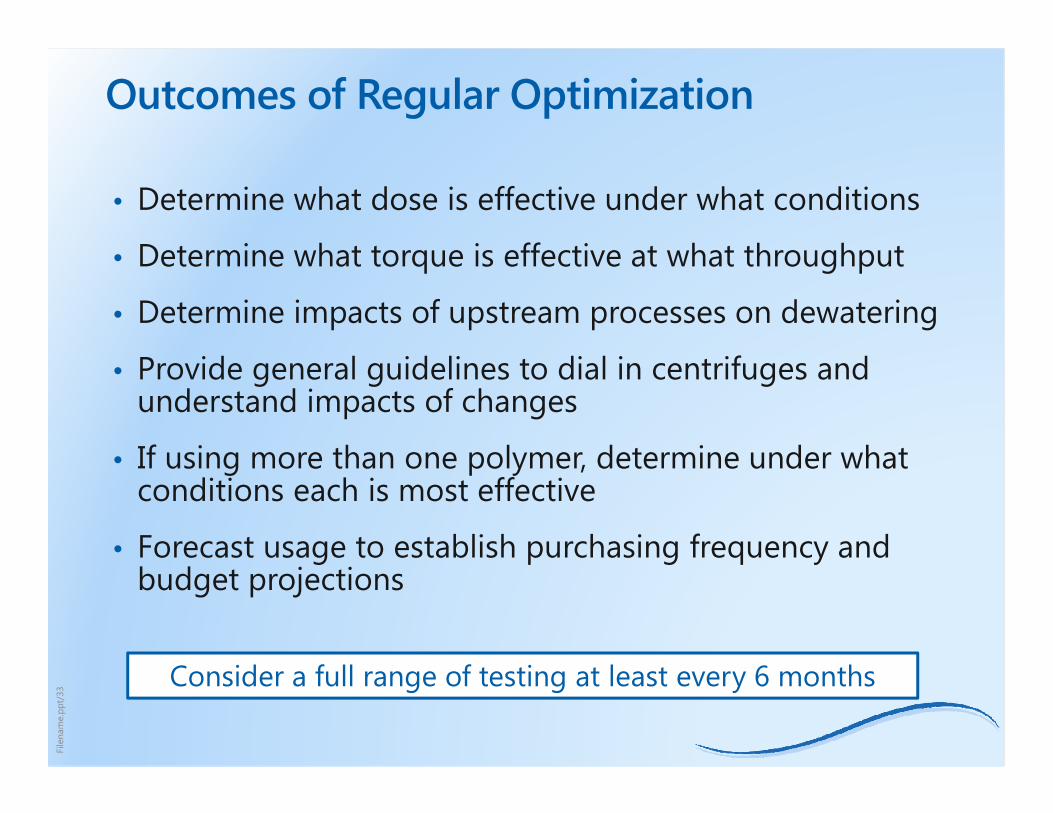
Outcomes of Regular Optimization
• Determine what dose is effective under what conditions
• Determine what torque is effective at what throughput
• Determine impacts of upstream processes on dewatering
• Provide general guidelines to dial in centrifuges and understand impacts of changes
• If using more than one polymer, determine under what conditions each is most effective
• Forecast usage to establish purchasing frequency and budget projections
Consider a full range of testing at least every 6 months
File
nam
e.pp
t/34
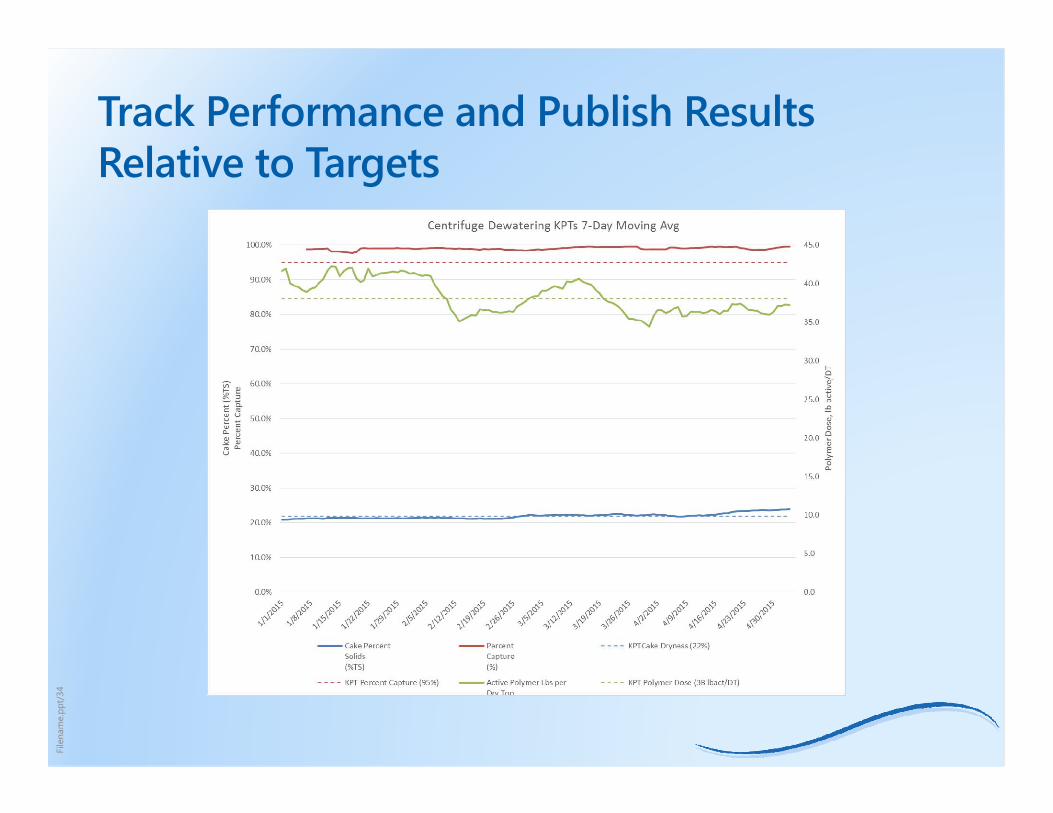
Track Performance and Publish Results Relative to Targets
File
nam
e.pp
t/35
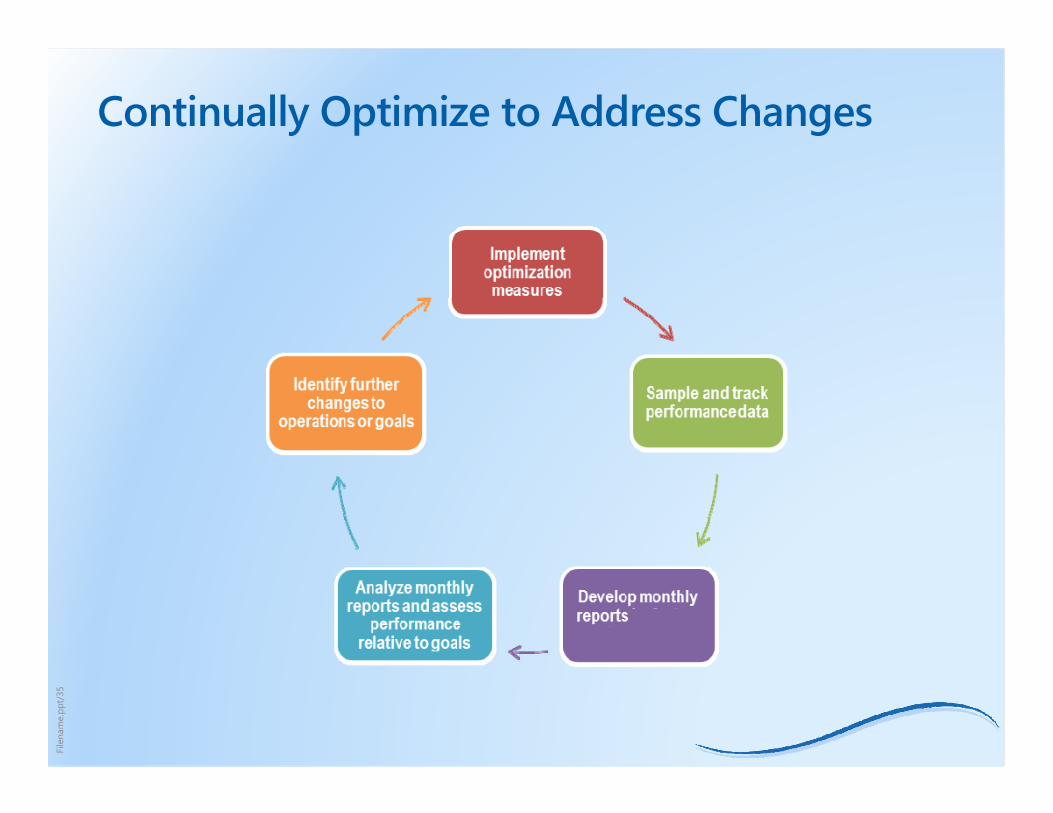
Continually Optimize to Address Changes
File
nam
e.pp
t/36
Optimization for Centrifuge Dewatering
Thank you for being a wastewater treatment professional.
Steve Walker [email protected] 303-635-1220Rashi Gupta [email protected] 714-593-5100
Top Related